UNITED STATES
SECURITIES AND EXCHANGE COMMISSION
WASHINGTON, D.C. 20549
FORM N-CSR
CERTIFIED SHAREHOLDER REPORT OF REGISTERED
MANAGEMENT INVESTMENT COMPANIES
811-08411
(Investment Company Act file number)
The James Advantage Funds
(Exact name of registrant as specified in charter)
1349 Fairground Road
Xenia, Ohio 45385
(Address of principal executive offices) (Zip code)
Barry R. James
P.O. Box 8
Alpha, Ohio 45301
(Name and address of agent for service)
Registrant’s telephone number, including area code: (937) 426-7640
Date of fiscal year end: June 30
Date of reporting period: July 1, 2017 – December 31, 2017
Item 1. Reports to Stockholders.

TABLE OF CONTENTS
| Shareholder Letter | 1 |
| Growth of $10,000 or $50,000 Charts | 4 |
| Representation of Schedules of Investments | 8 |
| Disclosure of Fund Expenses | 9 |
| Schedule of Investments | |
| James Balanced: Golden Rainbow Fund | 10 |
| James Small Cap Fund | 24 |
| James Mid Cap Fund | 27 |
| James Micro Cap Fund | 30 |
| James Aggressive Allocation Fund | 32 |
| James Long-Short Fund | 36 |
| Statements of Assets and Liabilities | 39 |
| Statements of Operations | 41 |
| Statements of Changes in Net Assets | 42 |
| Financial Highlights | |
| James Balanced: Golden Rainbow Fund - Retail Class | 49 |
| James Balanced: Golden Rainbow Fund - Institutional Class | 50 |
| James Small Cap Fund | 51 |
| James Mid Cap Fund | 52 |
| James Micro Cap Fund | 53 |
| James Aggressive Allocation Fund | 54 |
| James Long-Short Fund | 55 |
| Notes to Financial Statements | 56 |
| Additional Information | 64 |
| Privacy Policy | 65 |
| James Advantage Funds | Shareholder Letter |
December 31, 2017 (Unaudited)
LETTER TO THE SHAREHOLDERS OF THE JAMES ADVANTAGE FUNDS
The powerful effects of fewer regulations and lower taxes were very clear in the stock markets in 2017. Major economic think tanks such as the International Monetary Fund, the Organization for Economic Co-Operation and Development, and the World Bank forecast stronger global Gross Domestic Product (GDP) growth in 2018. The engine behind this optimism is the U.S. economy, which is now growing around 3%.
The Markets Over the Past Six Months
Strong returns were realized across almost all stock market categories in the second half of 2017. The S&P 500® Index returned 11.42%, the NASDAQ Composite Index returned 13.04%, the Small Cap Russell 2000® Index returned 9.20% and the S&P MidCap 400® Value Index returned 8.80%. Bonds did not fare as well. The Barclays U.S. Aggregate Government/Credit Bond Index returned 1.30% and the Barclays Capital U.S. Intermediate Government/Credit Bond Index had a total return of only 0.40%.
Investment Goals and Objectives
The Balanced: Golden Rainbow Fund seeks to provide total return through a combination of growth and income and preservation of capital in declining markets. The Balanced: Golden Rainbow Fund will generally hold positions in common stocks that in the aggregate constitute between 35 percent and 55 percent of the net assets. Bonds held in the portfolio must be rated Baa2 by Moody’s/BBB by S&P or higher at the time of purchase. The Balanced: Golden Rainbow Fund may hold municipal bonds, but generally buys them when they are attractively priced compared with taxable bonds.
The Balanced: Golden Rainbow Fund’s benchmark that we follow most closely is a blend of 25% S&P 500® Index, 25% Russell 2000® Index and 50% Barclays Capital U.S. Intermediate Government /Credit Bond Index. The benchmark is the same for all share classes of the Balanced: Golden Rainbow Fund. The Aggressive Allocation Fund seeks to provide total return through a combination of growth and income, but preservation of capital in declining markets is a secondary objective. Potential investors should be aware that this Fund will likely have a higher level of volatility than the Balanced: Golden Rainbow Fund. The Aggressive Allocation Fund’s benchmark that we follow most closely is a blend of 65% Russell 3000® Index and 35% Barclays U.S. Aggregate Government/Credit Bond Index.
The Small Cap Fund, Mid Cap Fund, Long-Short Fund and Micro Cap Fund each seek to provide long-term capital appreciation. These Funds hold only equity securities and cash/cash equivalents, under most circumstances. The prospectus identifies the following benchmarks: the Russell 2000® Index for the Small Cap Fund, the S&P MidCap 400® Value Index for the Mid Cap Fund, the Russell Microcap® Index for the Micro Cap Fund and the S&P 500® Index for the Long-Short Fund.
Investment Philosophy
James Investment Research, Inc., the James Advantage Funds’ Adviser, (the “Adviser”) commenced operations in 1972 and became known as a bargain manager, identifying stocks with good relative valuations, profitability and price momentum. The Adviser’s research, along with much academic research, supports the view that bargain investing tends to outperform growth investing over the longer-run. While some growth stocks may have astronomical returns, many eventually succumb to too much optimism and speculative investing and produce sharply inferior results. The dot-com stocks in 2000 and real estate stocks in 2008 bear this out. James Investment Research, Inc. ranks stocks based on their value characteristics and chooses those ranked highly for inclusion in the James Advantage Funds’ portfolios. The short selection works in reverse manner, seeking to short securities that are ranked as expensive and show relatively poor earnings.
The Adviser has no soft-dollar arrangements, and therefore does not purchase research from any broker/dealers.
The James Advantage Funds offer several different styles, but they all use the firm’s “bargain” or value approach to stock selection. The Aggressive Allocation Fund generally takes on greater risk than the Balanced: Golden Rainbow Fund in terms of allocation to stocks, but still can seek to reduce that risk in anticipation of a major decline in stock prices. Due to potentially higher equity levels, investors in the Aggressive Allocation Fund should generally have higher risk appetites for their mutual fund investments than those in the Balanced: Golden Rainbow Fund.
The Long-Short Fund may vary its portfolio holdings significantly, including by being 100% long in stocks with no short positions nor bond positions. It may use bonds to diversify the portfolio, but it primarily uses short positions in stocks the Adviser believes to be over-valued. To that extent, it may hold short positions even when the Adviser is positive on the broader stock market.
| Semi-Annual Report | December 31, 2017 | 1 |
| Shareholder Letter | James Advantage Funds |
December 31, 2017 (Unaudited)
The Micro Cap Fund and the Small Cap Fund invest in smaller capitalization companies, which have greater volatility and which most data show to have higher standard deviations in annual returns. The Mid Cap, Small Cap and Micro Cap Funds are niche products designed to meet the objectives of investors who want to establish diversified positions in these areas. As these funds are all-equity products, they are intrinsically riskier than other products that hold bonds and investors should expect relatively greater volatility in Net Asset Value (NAV) prices and a higher standard deviation of returns. Still, these portfolios hold stocks that are ranked highly by the Adviser’s models and pass a thorough review by the Adviser’s researchers and portfolio managers.
Strategy for Meeting Fund Objectives
The stock market is a risky place. The Adviser has always held to the belief that preservation of capital in down markets is the key to long-term investment success. Hence, the Balanced: Golden Rainbow Fund seeks to preserve capital by constructing a portfolio of both bonds and stocks. Bonds, in general, are uncorrelated with stocks, thus providing asset class diversification as well an income stream. In times when the stock market is strong, some investors may forget these positive characteristics of bonds, but the Balanced: Golden Rainbow Fund has always held a significant position in bonds.
The Small Cap Fund, the Mid Cap Fund, the Long-Short Fund, and the Micro Cap Fund look for stocks the Adviser believes to be undervalued, using its proprietary research to screen a database of over 8,500 stocks. Deterioration in a stock’s fundamental value characteristics can lead the Adviser to trim or sell that position.
Fund Performance
Rising bond yields mean falling bond prices, so a balanced portfolio could see returns hurt when the Federal Reserve is raising interest rates. The Balanced: Golden Rainbow Fund and the Aggressive Allocation Fund both hold significant bond positions. While it is unusual for portfolios of high quality bonds to actually lose money, they should be expected to post low returns in a rising rate environment. Over the six month period ended December 31, 2017, the retail shares of the Balanced: Golden Rainbow Fund returned 4.62% and the institutional share class returned 4.72%. The Balanced: Golden Rainbow Fund’s benchmark returned 5.30%. The Balanced: Golden Rainbow Fund paid out a regular dividend every quarter. The Fund’s retail class shares paid 9.789 cents/share in September and 4.109 cents/share in December. The institutional class shares paid 11.431 cents/share in September and 5.671 cents/share in December. In addition, the Balanced: Golden Rainbow Fund paid all shareholders a long-term capital gains distribution of $1.608 per share in December.
Over the six months ended December 31, 2017, the Small Cap Fund had a total return of 11.78% while its benchmark, the Russell 2000® Index, returned 9.20%. The Small Cap Fund’s total return was strongly influenced by an annual long-term capital gain payout in December of $6.496 per share, a short term capital gain payout of $0.867 per share and an ordinary dividend of $0.1896 per share. The Small Cap Fund did not pay an ordinary dividend in September.
In December, the Mid Cap Fund paid an ordinary dividend of 3.876 cents/share, a short-term capital gain of 41.525 cents per share and a long-term capital gain of $2.713 per share. The total return to shareholders who held the Mid Cap Fund for the full six months of the year was 10.58%. The Mid Cap Fund’s benchmark, the S&P MidCap 400® Value Index, returned 8.80%
The Micro Cap Fund returned 7.57% for the six months ended December 31, 2017. Its benchmark, the Russell Microcap® Index returned 8.57%. The Micro Cap Fund paid a long-term capital gain dividend in December of $1.288/share and an ordinary dividend of 5.611 cents per share in December.
The Long-Short Fund may employ a short-selling strategy, but it may also run a 130/30 position. This means that it may maintain 100% net long exposure by investing 130% of its net assets in long positions and 30% of its net assets in short positions. The Long-Short Fund will only use this strategy when its risk indicators favor doing so. At any one time, the Long-Short Fund can have up to 100% of its total assets (including any borrowings) invested in long positions or short positions. The Long-Short Fund returned 7.30% over the six months ended December 31, 2017 compared to 11.42% on the S&P 500® Index. Included in the Fund’s total six month return is an ordinary dividend of 4.559 cents per share. The Long-Short Fund did not pay a capital gain distribution in 2017
The Aggressive Allocation Fund is similar to the Balanced: Golden Rainbow Fund in that its strategy requires it to hold both stocks and bonds. However, it is a much more aggressive fund and generally will hold a higher allocation to stocks than the Balanced: Golden Rainbow Fund. Its benchmark that we follow most closely is a blend of 65% Russell 3000® Index and 35% Barclays U.S. Aggregate Government/Credit Bond Index. The Aggressive Allocation Fund paid an ordinary dividend of 7.793 cents per share in December. No capital gain distribution was paid. For the six months ended December 31, 2017, the Aggressive Allocation Fund had a total return of 9.78% while its benchmark blend earned 7.66%.
| 2 | www.jamesfunds.com |
| James Advantage Funds | Shareholder Letter |
December 31, 2017 (Unaudited)
Expectations for the Future
President Trump’s Administration campaigned on lower taxes and less regulation and it delivered in 2017. More than 30,000 pages were cut from the Federal Registrar of Regulations. The result was a sharp increase in corporate profits, which helped to drive the stock market higher. The Trump Administration is now looking toward infrastructure building. If it is as successful in that area as in cutting taxes and regulations, the stock market rally could continue. However, politics may interfere with sound economic decision making. The possibility of trade wars and the likelihood of rising interest rates could put a damper on the rally, which is already very long-lived. With Price/Earnings ratios already high, the market is vulnerable to a setback. It is not uncommon for the stock market to correct after such a long run, especially when expectations are already so high. However, we believe the fixes to the economy already achieved by the Trump Administration should provide solid footing for the economy and the stock markets over the long run.
Thomas L. Mangan
Chief Financial Officer
Thomas Mangan is a registered representative of ALPS Distributors, Inc.
The statements and opinions expressed are those of the author, are as of the date of this report, are subject to change, and may not reflect the writer’s current views. All information is historical and not indicative of future results and subject to change. It should not be assumed that an investment in the securities mentioned will be profitable in the future. This information is not a recommendation to buy or sell.
You should carefully consider the investment objectives, potential risks, management fees, and charges and expenses of the Fund before investing. The Fund’s prospectus contains this and other information about the Fund, and should be read carefully before investing. You may obtain a current copy of the Fund’s prospectus by calling 1-800-995-2637.
Past performance is no guarantee of future results. The investment return and principal value of an investment in the Fund will fluctuate so that an investor’s shares, when redeemed, may be worth more or less than their original cost. Investors may obtain performance information current to the last month-end at www.jamesfunds.com.
Price/Earnings ratio is a valuation of a company’s current share price compared to its per-share earnings.
Standard deviation is a measure of the dispersion of a set of data from its mean and is one of the key fundamental risk measures used in the financial services industry.
Credit ratings apply the underlying holdings of the Fund, and not to the Fund itself. Moody’s studies the financial condition of an entity to ascertain its creditworthiness. The credit ratings reflect the rating agency's opinion of the holdings financial condition and histories. The ratings shown are all considered investment grade and are listed by highest to lowest in percentage of what the Fund holds.
Soft dollar arrangements involve using client brokerage commissions to purchase research intended to help managers make investment decisions.
Diversification does not eliminate the risk of experiencing investment loss.
ALPS Distributors, Inc. 1290 Broadway, Ste. 1100, Denver, CO 80203 (Member FINRA). ALPS is not affiliated with James Investment Research, Inc.
The NASDAQ Composite Index is the market capitalization-weighted index of approximately 3,000 common equities listed on the NASDAQ stock exchange. The types of securities in the index include American depositary receipts, common stocks, real estate investment trusts (REITs) and tracking stocks, as well as limited partnership interests. The index includes all NASDAQ-listed stocks that are not derivatives, preferred shares, funds, exchange-traded funds (ETFs) or debenture securities. The Index returns do not reflect the deduction of expenses, which have been deducted from a Fund’s returns. The Index returns assume reinvestment of all distributions and do not reflect the deduction of taxes and fees. Individuals cannot invest directly in any Index; however, an individual can invest in exchange traded funds or other investment vehicles that attempt to track the performance of a benchmark index.
| Semi-Annual Report | December 31, 2017 | 1 |
| Growth of $10,000 or $50,000 Charts | James Advantage Funds |
December 31, 2017 (Unaudited)
Comparison of the Change in Value of a $10,000 Investment in the James Balanced: Golden Rainbow Fund – Retail Class
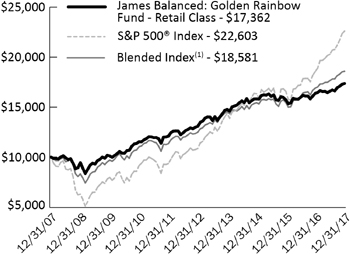
James Balanced: Golden Rainbow Fund – Retail Class Average Annual Total Returns
| 1 Year | 5 Years | 10 Years | Since Inception(2) | |
| James Balanced: Golden Rainbow – Retail Class | 6.04% | 5.83% | 5.67% | 7.78% |
| S&P 500® Index | 21.83% | 15.79% | 8.50% | 9.89% |
| Blended Index(1) | 9.97% | 8.26% | 6.39% | 8.09% |
| Russell 2000® Index | 14.65% | 14.12% | 8.71% | 10.22% |
| Barclays Capital U.S. Intermediate Government/Credit Bond Index | 2.14% | 1.50% | 3.32% | 5.32% |
| (1) | The Blended Index is comprised of a 25% weighting in the S&P 500® Index, a 25% weighting in the Russell 2000® Index and a 50% weighting in the Barclays Capital U.S. Intermediate Government/Credit Bond Index. |
| (2) | Inception was July 1, 1991. |
| The total annual operating expense ratio as stated in the fee table of the most recent prospectus, dated November 1, 2017, was 0.97%. |
Comparison of the Change in Value of a $50,000 Investment in the James Balanced: Golden Rainbow Fund – Institutional Class
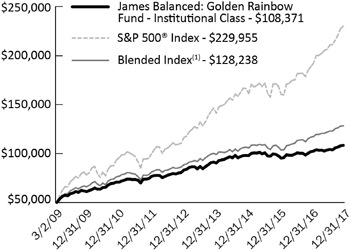
James Balanced: Golden Rainbow Fund – Institutional Class Average Annual Total Returns
| 1 Year | 5 Years | Since Inception(2) | |
| James Balanced: Golden Rainbow –Institutional Class | 6.30% | 6.09% | 9.15% |
| S&P 500® Index | 21.83% | 15.79% | 18.86% |
| Blended Index(1) | 9.97% | 8.26% | 11.25% |
| Russell 2000® Index | 14.65% | 14.12% | 19.20% |
| Barclays Capital U.S. Intermediate Government/Credit Bond Index | 2.14% | 1.50% | 3.26% |
| (1) | The Blended Index is comprised of a 25% weighting in the S&P 500® Index, a 25% weighting in the Russell 2000® Index and a 50% weighting in the Barclays Capital U.S. Intermediate Government/Credit Bond Index. |
| (2) | Inception was March 2, 2009. |
| The total annual operating expense ratio as stated in the fee table of the most recent prospectus, dated November 1, 2017, was 0.72%. |
Past performance does not guarantee future results. The performance data quoted represents past performance and current returns may be lower or higher. The investment return and principal value will fluctuate so that an investor’s shares, when redeemed, may be worth more or less than the original cost. These performance figures do not reflect the deduction of taxes that a shareholder would pay on Fund distributions or the redemption of Fund shares. Please call 1-800-995-2637 for most recent month-end performance information.
The S&P 500® Index is an unmanaged index of 500 common stocks chosen for market size, liquidity and industry group representation.
The Russell 2000® Index is a widely recognized, unmanaged index comprised of the 2,000 smallest U.S. domiciled publicly-traded common stocks of the Russell 3000® Index, which represents approximately 8% of the total market capitalization of the Russell 3000® Index, an unmanaged index of the 3,000 largest U.S. domiciled publicly-traded common stocks by market capitalization.
The Barclays Capital U.S. Intermediate Government/Credit Bond Index measures the performance of U.S. Dollar denominated U.S. Treasuries, government-related and investment grade U.S. corporate securities that have a remaining maturity of greater than one year and less than ten years.
The S&P 500® Index, Russell 2000® Index, Barclays Capital U.S. Intermediate Government/Credit Bond Index and Blended Index are widely recognized unmanaged indices of security prices and are representative of a broader market and range of securities than is found in the Fund’s portfolio. The Index returns do not reflect the deduction of expenses, which have been deducted from a Fund’s returns. The Index returns assume reinvestment of all distributions and do not reflect the deduction of taxes and fees. Individuals cannot invest directly in any Index; however, an individual can invest in exchange traded funds or other investment vehicles that attempt to track the performance of a benchmark index.
| 4 | www.jamesfunds.com |
| James Advantage Funds | Growth of $10,000 or $50,000 Charts |
December 31, 2017 (Unaudited)
Comparison of the Change in Value of a $10,000 Investment in the James Small Cap Fund
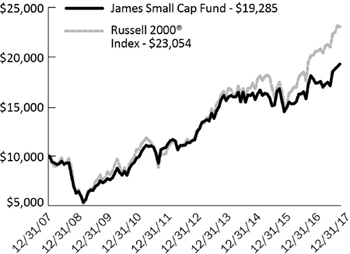
James Small Cap Fund
Average Annual Total Returns
| 1 Year | 5 Years | 10 Years | Since Inception(1) | |
| James Small Cap Fund | 6.57% | 10.62% | 6.79% | 8.31% |
| Russell 2000® Index | 14.65% | 14.12% | 8.71% | 9.43% |
| (1) | Fund inception was October 2, 1998. |
| The total annual operating expense ratio as stated in the fee table of the most recent prospectus, dated November 1, 2017, was 1.52%. |
Comparison of the Change in Value of a $10,000 Investment in the James Mid Cap Fund
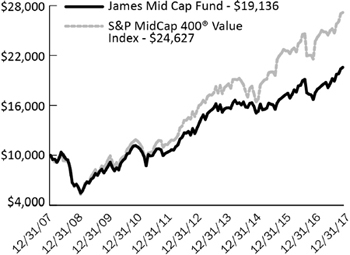
James Mid Cap Fund
Average Annual Total Returns
| 1 Year | 5 Years | 10 Years | Since Inception(1) | |
| James Mid Cap Fund | 14.66% | 11.24% | 6.71% | 6.47% |
| S&P MidCap 400® Value Index | 12.32% | 14.83% | 9.46% | 9.08% |
| (1) | Fund inception was June 30, 2006. |
| The total annual operating expense ratio as stated in the fee table of the most recent prospectus, dated November 1, 2017, was 1.52%. |
Past performance does not guarantee future results. The performance data quoted represents past performance and current returns may be lower or higher. The investment return and principal value will fluctuate so that an investor’s shares, when redeemed, may be worth more or less than the original cost. These performance figures do not reflect the deduction of taxes that a shareholder would pay on Fund distributions or the redemption of Fund shares. Please call 1-800-995-2637 for most recent month-end performance information.
Mid, Small and Micro Cap investing involve greater risk not associated with investing in more established companies, such as greater price volatility, business risk, less liquidity and increased competitive threat.
The Mid Cap Fund invests in stocks of mid-cap companies which tend to be more volatile and can be less liquid than stocks of large-cap companies. Diversification does not guarantee a profit or protect against loss. Current and future portfolio holdings are subject to risk.
The Russell 2000® Index is a widely recognized, unmanaged index comprised of the 2,000 smallest U.S. domiciled publicly-traded common stocks of the Russell 3000® Index, which represents approximately 8% of the total market capitalization of the Russell 3000® Index, an unmanaged index of the 3,000 largest U.S. domiciled publicly-traded common stocks by market capitalization.
The S&P MidCap 400® Value Index is a recognized, unmanaged index of mid cap stocks considered to be value stocks using Standard and Poor’s methodology.
The Russell 2000® Index and S&P MidCap Value 400® Index are widely recognized unmanaged indices of security prices and are representative of a broader market and range of securities than is found in the Fund’s portfolio. The Index returns do not reflect the deduction of expenses, which have been deducted from a Fund’s returns. The Index returns assume reinvestment of all distributions and do not reflect the deduction of taxes and fees. Individuals cannot invest directly in any Index; however, an individual can invest in exchange traded funds or other investment vehicles that attempt to track the performance of a benchmark index.
| Semi-Annual Report | December 31, 2017 | 5 |
| Growth of $10,000 or $50,000 Charts | James Advantage Funds |
December 31, 2017 (Unaudited)
Comparison of the Change in Value of a $10,000 Investment in the James Micro Cap Fund
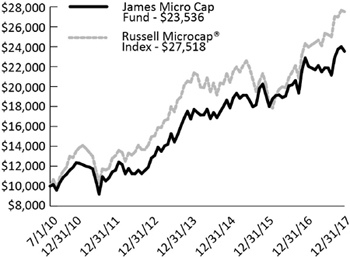
James Micro Cap Fund
Average Annual Total Returns
| 1 Year | 5 Year | Since Inception(1) | |
| James Micro Cap Fund | 2.92% | 14.63% | 12.09% |
| Russell Microcap® Index | 13.17% | 14.29% | 14.45% |
| (1) | Fund inception was July 1, 2010. |
| The total annual operating expense ratio as stated in the fee table of the most recent prospectus, dated November 1, 2017, was 1.52%. |
Comparison of the Change in Value of a $10,000 Investment in the James Aggressive Allocation Fund
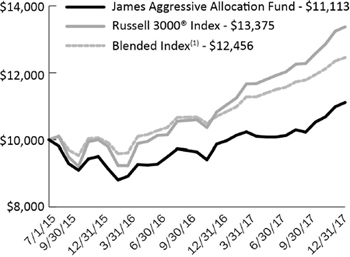
James Aggressive Allocation Fund
Average Annual Total Returns
| 1 Year | Since Inception(2) | |
| James Aggressive Allocation Fund | 11.45% | 4.31% |
| Russell 3000® Index | 21.13% | 12.33% |
| Blended Index(1) | 14.88% | 9.18% |
| (1) | The Blended Index is comprised of a 35% weighting in the Barclays U.S. Aggregate Government/Credit Bond Index and a 65% weighting in the Russell 3000® Index. |
| (2) | Fund inception was July 1, 2015. |
| The total annual operating expense ratio as stated in the fee table of the most recent prospectus, dated November 1, 2017, was 1.01%. |
Past performance does not guarantee future results. The performance data quoted represents past performance and current returns may be lower or higher. The investment return and principal value will fluctuate so that an investor’s shares, when redeemed, may be worth more or less than the original cost. These performance figures do not reflect the deduction of taxes that a shareholder would pay on Fund distributions or the redemption of Fund shares. Please call 1-800-995-2637 for most recent month-end performance information.
Mid, Small and Micro Cap investing involve greater risk not associated with investing in more established companies, such as greater price volatility, business risk, less liquidity and increased competitive threat.
The Russell Microcap® Index measures the performance of the microcap segment of the U.S. equity market. It makes up less than 3% of the U.S. equity market. It includes 1,000 of the smallest securities in the small cap Russell 2000® Index, plus the next smallest eligible securities by market cap.
The Russell 3000® Index is a stock market index of U.S. stocks. The index measures the performance of 3,000 publicly held U.S. companies based on total market capitalization, which represents approximately 98% of the investable U.S. equity market.
The Barclays U.S. Aggregate Government/Credit Bond Index (an unmanaged index generally representative of dollar denominated U.S. Treasuries, government related and investment grade U.S. corporate securities that have a remaining maturity greater than one year).
The Russell Microcap® Index and the Blended Index are widely recognized unmanaged indices of security prices and are representative of a broader market and range of securities than is found in the Fund’s portfolio. The Index returns do not reflect the deduction of expenses, which have been deducted from a Fund’s returns. The Index returns assume reinvestment of all distributions and do not reflect the deduction of taxes and fees. Individuals cannot invest directly in any Index; however, an individual can invest in exchange traded funds or other investment vehicles that attempt to track the performance of a benchmark index.
| 6 | www.jamesfunds.com |
| James Advantage Funds | Growth of $10,000 or $50,000 Charts |
December 31, 2017 (Unaudited)
Comparison of the Change in Value of a $10,000 Investment in the James Long-Short Fund
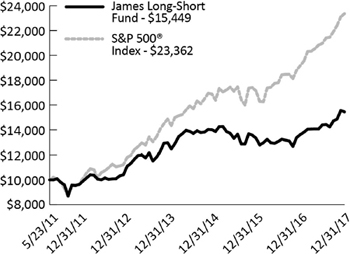
James Long-Short Fund
Average Annual Total Returns
| 1 Year | 5 Years | Since Inception(1) | |
| James Long -Short Fund | 13.48% | 8.22% | 6.80% |
| S&P 500® Index | 21.83% | 15.79% | 13.70% |
| (1) | Fund inception was May 23, 2011. |
| The total annual operating expense ratio as stated in the fee table of the most recent prospectus, dated November 1, 2017, was 1.58%. |
Past performance does not guarantee future results. The performance data quoted represents past performance and current returns may be lower or higher. The investment return and principal value will fluctuate so that an investor’s shares, when redeemed, may be worth more or less than the original cost. These performance figures do not reflect the deduction of taxes that a shareholder would pay on Fund distributions or the redemption of Fund shares. Please call 1-800-995-2637 for most recent month-end performance information.
Short selling incurs significant additional risk; theoretically, stocks sold short have unlimited upside risk potential. In addition, this strategy depends on the Adviser’s ability to correctly identify undervalued and overvalued stocks, and that the stock markets are reasonable and efficient. Periods of extreme volatility may harm the performance of this product. The Long-Short Fund may have a high portfolio turnover rate. A high portfolio turnover rate can result in increased brokerage commission costs and may expose taxable shareholders to potentially larger current tax liability.
The S&P 500® Index is an unmanaged index of 500 common stocks chosen for market size, liquidity and industry group representation.
The S&P 500® Index is a widely recognized unmanaged index of security prices and are representative of a broader market and range of securities than is found in the Fund’s portfolio. The Index return does not reflect the deduction of expenses, which have been deducted from a Fund’s returns. The Index return assumes reinvestment of all distributions and does not reflect the deduction of taxes and fees. Individuals cannot invest directly in any Index; however, an individual can invest in exchange traded funds or other investment vehicles that attempt to track the performance of a benchmark index.
| Semi-Annual Report | December 31, 2017 | 7 |
| Representation of Schedules of Investments | James Advantage Funds |
December 31, 2017 (Unaudited)
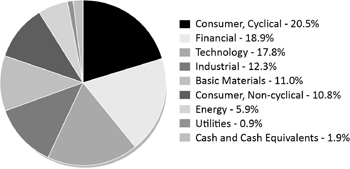
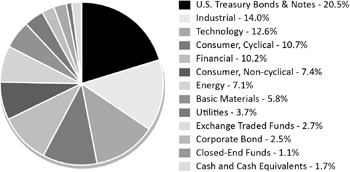
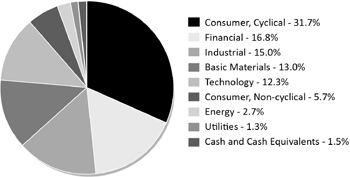
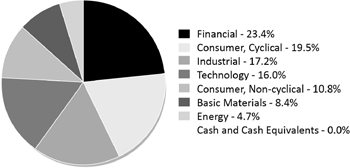
The illustrations below provide the industry sectors for the James Balanced: Golden Rainbow Fund, James Small Cap Fund, James Mid Cap Fund, James Micro Cap Fund, James Aggressive Allocation Fund and James Long-Short Fund.
James Balanced: Golden Rainbow Fund - Industry Sector Allocation (% of Net Assets)*

James Mid Cap Fund - Industry Sector Allocation (% of Net Assets)*
James Aggressive Allocation Fund - Industry Sector Allocation (% of Net Assets)*
James Small Cap Fund - Industry Sector Allocation (% of Net Assets)*
James Micro Cap Fund - Industry Sector Allocation (% of Net Assets)*
James Long-Short Fund - Industry Sector Allocation (% of Net Assets)*
(Cash and Cash Equivalents and Other Assets in Excess of Liabilities not included)
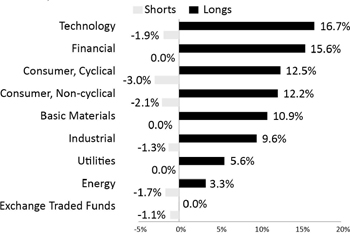
| * | Holdings are subject to change, and may not reflect the current or future position of the portfolio. |
| 8 | www.jamesfunds.com |
| James Advantage Funds | Disclosure of Fund Expenses |
December 31, 2017 (Unaudited)
Example. As a shareholder of a Fund, you incur two types of costs: (1) transaction costs, including reinvested dividends or other distributions, and redemption fees; and (2) ongoing costs, including management fees, distribution (12b-1) fees and other Fund expenses. This example is intended to help you understand your ongoing costs (in dollars) of investing in the Funds and to compare these costs with the ongoing costs of investing in other mutual funds.
The example is based on an investment of $1,000 invested at the beginning of the period and held for the entire period July 1, 2017 through December 31, 2017.
Actual Expenses. The first line of the table below provides information about actual account values and actual expenses. You may use the information in this line, together with the amount you invested, to estimate the expenses that you paid over the period. Simply divide your account value by $1,000 (for example, an $8,600 account value divided by $1,000 = 8.6), then multiply the result by the number in the first line under the heading “Expense Paid During Period” to estimate the expenses you paid on your account during this period.
Hypothetical Example for Comparison Purposes. The second line of the table below provides information about hypothetical account values and hypothetical expenses based on a Fund’s actual expense ratio and an assumed rate of return of 5% per year before expenses, which is not the Fund’s actual returns. The hypothetical account values and expenses may not be used to estimate the actual ending account balance or expenses you paid for the period. You may use this information to compare the ongoing costs of investing in a Fund and other mutual funds. To do so, compare this 5% hypothetical example with the 5% hypothetical examples that appear in the shareholder reports of the other funds.
Please note that expenses shown in the table are meant to highlight and help you compare ongoing costs only. The calculations assume no shares were bought or sold during the period. Your actual costs may have been higher or lower, depending on the amount of your investment and the timing of any purchases or redemptions.
| Net Expense Ratio Annualized December 31, 2017(a) | Beginning Account Value July 1, 2017 | Ending Account Value December 31, 2017 | Expense Paid During Period(b) | |
| James Balanced: Golden Rainbow Fund | ||||
| Retail Class Actual | 0.99% | $1,000.00 | $1,046.20 | $5.11 |
| Retail Class Hypothetical (5% return before expenses) | 0.99% | $1,000.00 | $1,020.21 | $5.04 |
| Institutional Class Actual | 0.74% | $1,000.00 | $1,047.60 | $3.82 |
| Institutional Class Hypothetical (5% return before expenses) | 0.74% | $1,000.00 | $1,021.48 | $3.77 |
| James Small Cap Fund | ||||
| Actual | 1.50% | $1,000.00 | $1,117.80 | $8.01 |
| Hypothetical (5% return before expenses) | 1.50% | $1,000.00 | $1,017.64 | $7.63 |
| James Mid Cap Fund | ||||
| Actual | 1.50% | $1,000.00 | $1,105.80 | $7.96 |
| Hypothetical (5% return before expenses) | 1.50% | $1,000.00 | $1,017.64 | $7.63 |
| James Micro Cap Fund | ||||
| Actual | 1.50% | $1,000.00 | $1,075.70 | $7.85 |
| Hypothetical (5% return before expenses) | 1.50% | $1,000.00 | $1,017.64 | $7.63 |
| James Aggressive Allocation Fund | ||||
| Actual | 0.98% | $1,000.00 | $1,097.80 | $5.18 |
| Hypothetical (5% return before expenses) | 0.98% | $1,000.00 | $1,020.27 | $4.99 |
| James Long-Short Fund | ||||
| Actual | 1.59%(c) | $1,000.00 | $1,073.00 | $8.31 |
| Hypothetical (5% return before expenses) | 1.59%(c) | $1,000.00 | $1,017.19 | $8.08 |
| (a) | Annualized, based on the Fund's most recent fiscal half year expenses. |
| (b) | Expenses are equal to the Fund's annualized expense ratio multiplied by the average account value over the period, multiplied by the number of days in the most recent fiscal half year (184), divided by 365. |
| (c) | Dividend and interest expense on securities sold short totaled 0.09% (annualized) of average net assets for the six months ended December 31, 2017. Total annual operating expense of 1.59% includes the 0.09% of dividend and interest expense. |
| Semi-Annual Report | December 31, 2017 | 9 |
| Schedule of Investments | James Balanced: Golden Rainbow Fund |
| December 31, 2017 (Unaudited) |
| Shares or Principal Amount | Value | |||||||
| COMMON STOCKS-43.25% | ||||||||
| Basic Materials-4.63% | ||||||||
| 264,470 | Avery Dennison Corp. | $ | 30,377,024 | |||||
| 46,200 | Boise Cascade Co. | 1,843,380 | ||||||
| 34,500 | Carpenter Technology Corp. | 1,759,155 | ||||||
| 418,265 | Celanese Corp., Series A | 44,787,816 | ||||||
| 273,000 | Cleveland-Cliffs, Inc.* | 1,968,330 | ||||||
| 274,350 | Cooper Tire & Rubber Co. | 9,698,272 | ||||||
| 90,000 | DowDuPont, Inc. | 6,409,800 | ||||||
| 18,600 | Eastman Chemical Co. | 1,723,104 | ||||||
| 70,095 | Ferro Corp.* | 1,653,541 | ||||||
| 173,050 | Fortuna Silver Mines, Inc.* | 903,321 | ||||||
| 116,000 | Freeport-McMoRan, Inc.* | 2,199,360 | ||||||
| 930,620 | Golden Star Resources, Ltd.* | 828,252 | ||||||
| 81,500 | Harsco Corp.* | 1,519,975 | ||||||
| 212,200 | Hudbay Minerals, Inc. | 1,867,360 | ||||||
| 53,305 | Huntsman Corp. | 1,774,523 | ||||||
| 23,000 | Ingevity Corp.* | 1,620,810 | ||||||
| 198,100 | Intrepid Potash, Inc.* | 942,956 | ||||||
| 37,100 | Kennametal, Inc. | 1,796,011 | ||||||
| 18,870 | KMG Chemicals, Inc. | 1,246,930 | ||||||
| 30,130 | Koppers Holdings, Inc.* | 1,533,617 | ||||||
| 34,300 | Kraton Corp.* | 1,652,231 | ||||||
| 63,060 | Louisiana-Pacific Corp.* | 1,655,956 | ||||||
| 16,015 | LyondellBasell Industries NV, Class A | 1,766,775 | ||||||
| 33,500 | Materion Corp. | 1,628,100 | ||||||
| 52,740 | Mercer International, Inc. | 754,182 | ||||||
| 74,800 | Mosaic Co. | 1,919,368 | ||||||
| 56,210 | NL Industries, Inc.* | 800,993 | ||||||
| 47,200 | Norbord, Inc. | 1,595,832 | ||||||
| 21,580 | Schnitzer Steel Industries, Inc., Class A | 722,930 | ||||||
| 174,900 | SSR Mining, Inc.* | 1,537,371 | ||||||
| 23,700 | Trinseo SA | 1,720,620 | ||||||
| 62,600 | United States Steel Corp. | 2,202,894 | ||||||
| 45,000 | Universal Forest Products, Inc. | 1,692,900 | ||||||
| 136,103,689 | ||||||||
| Consumer, Cyclical-7.36% | ||||||||
| 34,100 | AMC Networks, Inc., Class A* | 1,844,128 | ||||||
| 132,100 | American Eagle Outfitters, Inc. | 2,483,480 | ||||||
| 30,150 | Atlas Air Worldwide Holdings, Inc.* | 1,768,297 | ||||||
| 31,800 | AutoNation, Inc.* | 1,632,294 | ||||||
| 183,060 | Avianca Holdings SA, Sponsored ADR | 1,449,835 | ||||||
| 531,610 | Best Buy Co., Inc. | 36,399,337 | ||||||
| 262,195 | Big Lots, Inc. | 14,722,249 | ||||||
| 96,695 | Builders FirstSource, Inc.* | 2,106,984 | ||||||
| 17,300 | Burlington Stores, Inc.* | 2,128,419 | ||||||
| 39,900 | Camping World Holdings, Inc., Class A | 1,784,727 | ||||||
| 73,030 | Century Communities, Inc.* | 2,271,233 | ||||||
| 15,315 | Children's Place, Inc. | 2,226,035 | ||||||
| 60,060 | China Yuchai International, Ltd. | 1,441,440 | ||||||
| 26,200 | Deckers Outdoor Corp.* | 2,102,550 | ||||||
| 37,525 | DR Horton, Inc. | 1,916,402 | ||||||
| 90,700 | DSW, Inc., Class A | 1,941,887 | ||||||
| 94,440 | Fiat Chrysler Automobiles NV | 1,684,810 | ||||||
| See Notes to Financial Statements. |
| 10 | www.jamesfunds.com |
| James Balanced: Golden Rainbow Fund | Schedule of Investments |
| December 31, 2017 (Unaudited) |
| Shares or Principal Amount | Value | |||||||
| Consumer, Cyclical (continued) | ||||||||
| 42,520 | Flexsteel Industries, Inc. | $ | 1,989,086 | |||||
| 746,470 | Ford Motor Co. | 9,323,410 | ||||||
| 65,600 | Gap, Inc. | 2,234,336 | ||||||
| 40,460 | General Motors Co. | 1,658,455 | ||||||
| 111,800 | Gray Television, Inc.* | 1,872,650 | ||||||
| 21,400 | Group 1 Automotive, Inc. | 1,518,758 | ||||||
| 30,060 | Hamilton Beach Brands Holding Co., Class A | 772,241 | ||||||
| 44,930 | Haverty Furniture Cos., Inc. | 1,017,664 | ||||||
| 230,310 | Hawaiian Holdings, Inc. | 9,177,853 | ||||||
| 38,240 | Insight Enterprises, Inc.* | 1,464,210 | ||||||
| 74,000 | Interface, Inc. | 1,861,100 | ||||||
| 43,300 | International Speedway Corp., Class A | 1,725,505 | ||||||
| 9,960 | Johnson Outdoors, Inc., Class A | 618,416 | ||||||
| 34,400 | KAR Auction Services, Inc. | 1,737,544 | ||||||
| 59,410 | KB Home | 1,898,149 | ||||||
| 62,710 | Kimball International, Inc., Class B | 1,170,796 | ||||||
| 41,400 | Kohl's Corp. | 2,245,122 | ||||||
| 61,880 | M/I Homes, Inc.* | 2,128,672 | ||||||
| 96,200 | Macy's, Inc. | 2,423,278 | ||||||
| 56,268 | MDC Holdings, Inc. | 1,793,824 | ||||||
| 32,475 | Meredith Corp. | 2,144,974 | ||||||
| 158,090 | Meritage Homes Corp.* | 8,094,208 | ||||||
| 30,900 | Michael Kors Holdings, Ltd.* | 1,945,155 | ||||||
| 92,600 | Michaels Cos., Inc.* | 2,239,994 | ||||||
| 99,470 | MSG Networks, Inc., Class A* | 2,014,267 | ||||||
| 98,700 | New York Times Co., Class A | 1,825,950 | ||||||
| 500 | NVR, Inc.* | 1,754,110 | ||||||
| 545,950 | Office Depot, Inc. | 1,932,663 | ||||||
| 28,500 | Patrick Industries, Inc.* | 1,979,325 | ||||||
| 63,300 | Penn National Gaming, Inc.* | 1,983,189 | ||||||
| 36,300 | Penske Automotive Group, Inc. | 1,736,955 | ||||||
| 139,440 | Pier 1 Imports, Inc. | 577,282 | ||||||
| 14,700 | Polaris Industries, Inc. | 1,822,653 | ||||||
| 55,500 | PulteGroup, Inc. | 1,845,375 | ||||||
| 19,900 | Ralph Lauren Corp. | 2,063,431 | ||||||
| 33,500 | Rush Enterprises, Inc., Class A* | 1,702,135 | ||||||
| 98,900 | Sally Beauty Holdings, Inc.* | 1,855,364 | ||||||
| 21,100 | Scripps Networks Interactive, Inc., Class A | 1,801,518 | ||||||
| 35,100 | Sensata Technologies Holding NV* | 1,793,961 | ||||||
| 25,300 | Signet Jewelers, Ltd. | 1,430,715 | ||||||
| 54,100 | Skechers U.S.A., Inc., Class A* | 2,047,144 | ||||||
| 36,290 | SkyWest, Inc. | 1,926,999 | ||||||
| 26,600 | SodaStream International, Ltd.* | 1,871,044 | ||||||
| 54,600 | SPX Corp.* | 1,713,894 | ||||||
| 44,463 | Systemax, Inc. | 1,479,284 | ||||||
| 29,100 | Target Corp. | 1,898,775 | ||||||
| 142,800 | TEGNA, Inc. | 2,010,624 | ||||||
| 13,135 | Thor Industries, Inc. | 1,979,707 | ||||||
| 115,150 | Tilly's, Inc., Class A | 1,699,614 | ||||||
| 50,000 | Time Warner, Inc. | 4,573,500 | ||||||
| 37,100 | Toll Brothers, Inc. | 1,781,542 | ||||||
| 96,400 | TRI Pointe Group, Inc.* | 1,727,488 | ||||||
| 28,725 | United Continental Holdings, Inc.* | 1,936,065 | ||||||
| 149,005 | Wal-Mart Stores, Inc. | 14,714,244 | ||||||
| See Notes to Financial Statements. |
| Semi-Annual Report | December 31, 2017 | 11 |
| Schedule of Investments | James Balanced: Golden Rainbow Fund |
| December 31, 2017 (Unaudited) |
| Shares or Principal Amount | Value | |||||||
| Consumer, Cyclical (continued) | ||||||||
| 35,600 | Winnebago Industries, Inc. | $ | 1,979,360 | |||||
| 63,800 | Wolverine World Wide, Inc. | 2,033,944 | ||||||
| 216,451,628 | ||||||||
| Consumer, Non-cyclical-4.83% | ||||||||
| 18,000 | AbbVie, Inc. | 1,740,780 | ||||||
| 40,200 | Amn Healthcare Services Inc* | 1,979,850 | ||||||
| 79,625 | Anthem, Inc. | 17,916,421 | ||||||
| 9,700 | Boston Beer Co., Inc., Class A* | 1,853,670 | ||||||
| 17,800 | Centene Corp.* | 1,795,664 | ||||||
| 68,200 | Convergys Corp. | 1,602,700 | ||||||
| 14,800 | Dun & Bradstreet Corp. | 1,752,468 | ||||||
| 40,300 | Energizer Holdings, Inc. | 1,933,594 | ||||||
| 27,835 | Express Scripts Holding Co.* | 2,077,604 | ||||||
| 41,000 | FTI Consulting, Inc.* | 1,761,360 | ||||||
| 174,100 | Gannett Co., Inc. | 2,017,819 | ||||||
| 97,150 | Grand Canyon Education, Inc.* | 8,697,839 | ||||||
| 36,900 | Halyard Health, Inc.* | 1,704,042 | ||||||
| 30,030 | Heidrick & Struggles International, Inc. | 737,236 | ||||||
| 19,500 | Helen of Troy, Ltd.* | 1,878,825 | ||||||
| 120,500 | Horizon Pharma PLC* | 1,759,300 | ||||||
| 20,895 | John B Sanfilippo & Son, Inc. | 1,321,609 | ||||||
| 45,010 | K12, Inc.* | 715,659 | ||||||
| 27,700 | Kellogg Co. | 1,883,046 | ||||||
| 110,690 | Kelly Services, Inc., Class A | 3,018,516 | ||||||
| 40,700 | Korn/Ferry International | 1,684,166 | ||||||
| 66,070 | Lantheus Holdings, Inc.* | 1,351,131 | ||||||
| 20,400 | Magellan Health, Inc.* | 1,969,620 | ||||||
| 143,758 | ManpowerGroup, Inc. | 18,129,321 | ||||||
| 20,560 | Medifast, Inc. | 1,435,294 | ||||||
| 28,000 | On Assignment, Inc.* | 1,799,560 | ||||||
| 700,000 | Pfizer, Inc. | 25,354,000 | ||||||
| 55,400 | Pilgrim's Pride Corp.* | 1,720,724 | ||||||
| 56,380 | RPX Corp. | 757,747 | ||||||
| 112,969 | Sanderson Farms, Inc. | 15,677,838 | ||||||
| 38,700 | Schweitzer-Mauduit International, Inc. | 1,755,432 | ||||||
| 380 | Seaboard Corp. | 1,675,800 | ||||||
| 52,200 | Tivity Health, Inc.* | 1,907,910 | ||||||
| 41,200 | TriNet Group, Inc.* | 1,826,808 | ||||||
| 61,800 | TrueBlue, Inc.* | 1,699,500 | ||||||
| 29,200 | Tupperware Brands Corp. | 1,830,840 | ||||||
| 28,400 | Universal Corp. | 1,491,000 | ||||||
| 10,848 | Valhi, Inc. | 66,932 | ||||||
| 8,300 | WellCare Health Plans, Inc.* | 1,669,213 | ||||||
| 141,950,838 | ||||||||
| Energy-1.41% | ||||||||
| 89,950 | Andeavor | 10,284,883 | ||||||
| 86,600 | Carrizo Oil & Gas, Inc.* | 1,842,848 | ||||||
| 150,500 | Cenovus Energy, Inc. | 1,374,065 | ||||||
| 403,605 | Chesapeake Energy Corp.* | 1,598,276 | ||||||
| 14,300 | Chevron Corp. | 1,790,217 | ||||||
| 53,700 | CVR Energy, Inc. | 1,999,788 | ||||||
| 40,900 | Devon Energy Corp. | 1,693,260 | ||||||
| See Notes to Financial Statements. |
| 12 | www.jamesfunds.com |
| James Balanced: Golden Rainbow Fund | Schedule of Investments |
| December 31, 2017 (Unaudited) |
| Shares or Principal Amount | Value | |||||||
| Energy (continued) | ||||||||
| 100,900 | Diamond Offshore Drilling, Inc.* | $ | 1,875,731 | |||||
| 54,100 | Exterran Corp.* | 1,700,904 | ||||||
| 92,540 | FutureFuel Corp. | 1,303,889 | ||||||
| 39,800 | HollyFrontier Corp. | 2,038,556 | ||||||
| 26,700 | Marathon Petroleum Corp. | 1,761,666 | ||||||
| 226,100 | McDermott International, Inc.* | 1,487,738 | ||||||
| 57,700 | Murphy Oil Corp. | 1,791,585 | ||||||
| 23,400 | Murphy USA, Inc.* | 1,880,424 | ||||||
| 187,000 | SRC Energy, Inc.* | 1,595,110 | ||||||
| 88,890 | Star Group LP | 955,568 | ||||||
| 231,400 | Transocean, Ltd.* | 2,471,352 | ||||||
| 20,700 | Valero Energy Corp. | 1,902,537 | ||||||
| 41,348,397 | ||||||||
| Financial-9.22% | ||||||||
| 32,290 | AerCap Holdings NV* | 1,698,777 | ||||||
| 20,200 | Aflac, Inc. | 1,773,156 | ||||||
| 39,100 | Air Lease Corp. | 1,880,319 | ||||||
| 17,000 | Allstate Corp. | 1,780,070 | ||||||
| 63,755 | Ally Financial, Inc. | 1,859,096 | ||||||
| 57,200 | American Equity Investment Life Holding Co. | 1,757,756 | ||||||
| 96,293 | American Financial Group, Inc. | 10,451,642 | ||||||
| 10,600 | Ameriprise Financial, Inc. | 1,796,382 | ||||||
| 180,920 | Ashford Hospitality Trust, Inc., REIT | 1,217,592 | ||||||
| 69,700 | Associated Banc-Corp | 1,770,380 | ||||||
| 46,580 | Assured Guaranty, Ltd. | 1,577,665 | ||||||
| 72,140 | B. Riley Financial, Inc. | 1,305,734 | ||||||
| 62,080 | Bank of America Corp. | 1,832,602 | ||||||
| 79,000 | Bank of Montreal | 6,321,580 | ||||||
| 110,700 | BGC Partners, Inc., Class A | 1,672,677 | ||||||
| 18,700 | Capital One Financial Corp. | 1,862,146 | ||||||
| 41,225 | CBRE Group, Inc., Class A* | 1,785,455 | ||||||
| 8,200 | Cigna Corp. | 1,665,338 | ||||||
| 37,300 | CIT Group, Inc. | 1,836,279 | ||||||
| 23,200 | Citigroup, Inc. | 1,726,312 | ||||||
| 44,800 | Citizens Financial Group, Inc. | 1,880,704 | ||||||
| 70,600 | CNO Financial Group, Inc. | 1,743,114 | ||||||
| 21,800 | Comerica, Inc. | 1,892,458 | ||||||
| 67,500 | CoreCivic, Inc., REIT | 1,518,750 | ||||||
| 39,230 | CorEnergy Infrastructure Trust, Inc., REIT | 1,498,586 | ||||||
| 6,020 | Credit Acceptance Corp.* | 1,947,350 | ||||||
| 213,310 | CYS Investments, Inc., REIT | 1,712,879 | ||||||
| 25,400 | Discover Financial Services | 1,953,768 | ||||||
| 35,300 | Employers Holdings, Inc. | 1,567,320 | ||||||
| 35,200 | Encore Capital Group, Inc.* | 1,481,920 | ||||||
| 80,320 | Enova International, Inc.* | 1,220,864 | ||||||
| 40,705 | Essent Group, Ltd.* | 1,767,411 | ||||||
| 21,785 | Evercore Partners, Inc., Class A | 1,960,650 | ||||||
| 123,300 | EZCORP, Inc., Class A* | 1,504,260 | ||||||
| 54,600 | Federated Investors, Inc., Class B | 1,969,968 | ||||||
| 30,500 | First American Financial Corp. | 1,709,220 | ||||||
| 338,065 | First BanCorp* | 1,724,131 | ||||||
| 96,700 | Forestar Group, Inc.* | 2,127,400 | ||||||
| 115,750 | Franklin Resources, Inc. | 5,015,447 | ||||||
| See Notes to Financial Statements. |
| Semi-Annual Report | December 31, 2017 | 13 |
| Schedule of Investments | James Balanced: Golden Rainbow Fund |
| December 31, 2017 (Unaudited) |
| Shares or Principal Amount | Value | |||||||
| Financial (continued) | ||||||||
| 63,500 | GEO Group, Inc., REIT | $ | 1,498,600 | |||||
| 7,070 | Goldman Sachs Group, Inc. | 1,801,153 | ||||||
| 30,400 | Green Dot Corp., Class A* | 1,831,904 | ||||||
| 41,190 | Houlihan Lokey, Inc. | 1,871,262 | ||||||
| 47,600 | Invesco, Ltd. | 1,739,304 | ||||||
| 48,800 | Janus Henderson Group PLC | 1,867,088 | ||||||
| 421,525 | JPMorgan Chase & Co. | 45,077,883 | ||||||
| 124,800 | Ladder Capital Corp., REIT | 1,701,024 | ||||||
| 44,100 | Legg Mason, Inc. | 1,851,318 | ||||||
| 62,600 | LGI Homes, Inc.* | 4,696,878 | ||||||
| 22,460 | Lincoln National Corp. | 1,726,500 | ||||||
| 59,070 | Maui Land & Pineapple Co., Inc.* | 1,021,911 | ||||||
| 36,200 | McGrath RentCorp | 1,700,676 | ||||||
| 126,555 | MGIC Investment Corp.* | 1,785,691 | ||||||
| 40,300 | Moelis & Co., Class A | 1,954,550 | ||||||
| 34,155 | Morgan Stanley | 1,792,113 | ||||||
| 15,310 | MutualFirst Financial, Inc. | 590,201 | ||||||
| 93,655 | Nationstar Mortgage Holdings, Inc.* | 1,732,618 | ||||||
| 377,630 | Nelnet, Inc., Class A | 20,686,571 | ||||||
| 96,145 | New Residential Investment Corp., REIT | 1,719,073 | ||||||
| 109,100 | OM Asset Management PLC | 1,827,425 | ||||||
| 35,920 | People's Utah Bancorp | 1,088,376 | ||||||
| 17,880 | Piper Jaffray Cos. | 1,542,150 | ||||||
| 32,500 | Potlatch Corp., REIT | 1,621,750 | ||||||
| 115,000 | Principal Financial Group, Inc. | 8,114,400 | ||||||
| 15,000 | Prudential Financial, Inc. | 1,724,700 | ||||||
| 84,255 | Radian Group, Inc. | 1,736,496 | ||||||
| 11,200 | Reinsurance Group of America, Inc. | 1,746,416 | ||||||
| 101,500 | Santander Consumer U.S.A. Holdings, Inc. | 1,889,930 | ||||||
| 18,700 | State Street Corp. | 1,825,307 | ||||||
| 32,300 | Stifel Financial Corp. | 1,923,788 | ||||||
| 52,100 | Synchrony Financial | 2,011,581 | ||||||
| 18,000 | T Rowe Price Group, Inc. | 1,888,740 | ||||||
| 100,700 | Third Point Reinsurance, Ltd.* | 1,475,255 | ||||||
| 203,170 | Torchmark Corp. | 18,429,551 | ||||||
| 83,420 | TPG Specialty Lending, Inc. | 1,651,716 | ||||||
| 12,500 | Travelers Cos., Inc. | 1,695,500 | ||||||
| 109,900 | Two Harbors Investment Corp., REIT | 1,786,974 | ||||||
| 506,960 | Unum Group | 27,827,034 | ||||||
| 87,400 | Waddell & Reed Financial, Inc., Class A | 1,952,516 | ||||||
| 31,010 | Walker & Dunlop, Inc.* | 1,472,975 | ||||||
| 88,100 | Western Union Co. | 1,674,781 | ||||||
| 3,531 | World Acceptance Corp.* | 285,022 | ||||||
| 79,500 | Xenia Hotels & Resources, Inc., REIT | 1,716,405 | ||||||
| 271,322,264 | ||||||||
| Industrial-6.05% | ||||||||
| 110,560 | Advanced Emissions Solutions, Inc. | 1,068,010 | ||||||
| 38,500 | Allison Transmission Holdings, Inc. | 1,658,195 | ||||||
| 434,490 | American Axle & Manufacturing Holdings, Inc.* | 7,399,365 | ||||||
| 27,300 | Applied Industrial Technologies, Inc. | 1,859,130 | ||||||
| 17,395 | Aptiv PLC | 1,475,618 | ||||||
| 19,160 | ArcBest Corp. | 684,970 | ||||||
| 24,970 | Argan, Inc. | 1,123,650 | ||||||
| See Notes to Financial Statements. |
| 14 | www.jamesfunds.com |
| James Balanced: Golden Rainbow Fund | Schedule of Investments |
| December 31, 2017 (Unaudited) |
| Shares or Principal Amount | Value | |||||||
| Industrial (continued) | ||||||||
| 33,000 | Armstrong World Industries, Inc.* | $ | 1,998,150 | |||||
| 13,400 | Autoliv, Inc. | 1,702,872 | ||||||
| 20,700 | Belden, Inc. | 1,597,419 | ||||||
| 32,200 | BorgWarner, Inc. | 1,645,098 | ||||||
| 69,300 | Briggs & Stratton Corp. | 1,758,141 | ||||||
| 53,560 | CAI International, Inc.* | 1,516,819 | ||||||
| 72,130 | Casella Waste Systems, Inc., Class A* | 1,660,433 | ||||||
| 12,100 | Caterpillar, Inc. | 1,906,718 | ||||||
| 130,700 | CNH Industrial NV | 1,751,380 | ||||||
| 18,800 | Columbus McKinnon Corp. | 751,624 | ||||||
| 9,765 | Cummins, Inc. | 1,724,890 | ||||||
| 54,755 | Dana, Inc. | 1,752,708 | ||||||
| 22,500 | Deere & Co. | 3,521,475 | ||||||
| 5,798 | Delphi Automotive PLC* | 304,239 | ||||||
| 233,835 | DHT Holdings, Inc. | 839,468 | ||||||
| 20,800 | EMCOR Group, Inc. | 1,700,400 | ||||||
| 15,130 | Encore Wire Corp. | 736,074 | ||||||
| 29,140 | GATX Corp. | 1,811,342 | ||||||
| 34,200 | Generac Holdings, Inc.* | 1,693,584 | ||||||
| 67,000 | Global Brass & Copper Holdings, Inc. | 2,217,700 | ||||||
| 33,480 | Greenbrier Cos., Inc. | 1,784,484 | ||||||
| 49,700 | H&E Equipment Services, Inc. | 2,020,305 | ||||||
| 32,700 | ITT, Inc. | 1,745,199 | ||||||
| 16,200 | Kadant, Inc. | 1,626,480 | ||||||
| 34,950 | Kimball Electronics, Inc.* | 637,837 | ||||||
| 9,600 | Lear Corp. | 1,695,936 | ||||||
| 690,890 | Magna International, Inc. | 39,152,736 | ||||||
| 38,730 | MasTec, Inc.* | 1,895,834 | ||||||
| 59,200 | Matson, Inc. | 1,766,528 | ||||||
| 64,155 | Meritor, Inc.* | 1,505,076 | ||||||
| 37,100 | Methode Electronics, Inc. | 1,487,710 | ||||||
| 96,230 | Milacron Holdings Corp.* | 1,841,842 | ||||||
| 74,300 | Modine Manufacturing Co.* | 1,500,860 | ||||||
| 15,030 | NACCO Industries, Inc., Class A | 565,880 | ||||||
| 72,870 | OMNOVA Solutions, Inc.* | 728,700 | ||||||
| 19,385 | Oshkosh Corp. | 1,761,903 | ||||||
| 70,630 | Owens-Illinois, Inc.* | 1,565,867 | ||||||
| 9,100 | Parker-Hannifin Corp. | 1,816,178 | ||||||
| 60,400 | Primoris Services Corp. | 1,642,276 | ||||||
| 75,190 | Quad Graphics, Inc. | 1,699,294 | ||||||
| 46,600 | Quanta Services, Inc.* | 1,822,526 | ||||||
| 64,970 | Stoneridge, Inc.* | 1,485,214 | ||||||
| 30,085 | Tenneco, Inc. | 1,761,176 | ||||||
| 36,000 | Timken Co. | 1,769,400 | ||||||
| 56,550 | Tower International, Inc. | 1,727,603 | ||||||
| 16,400 | Trex Co., Inc.* | 1,777,596 | ||||||
| 64,200 | TriMas Corp.* | 1,717,350 | ||||||
| 52,500 | Trinity Industries, Inc. | 1,966,650 | ||||||
| 63,100 | Tutor Perini Corp.* | 1,599,585 | ||||||
| 225,585 | United Rentals, Inc.* | 38,780,317 | ||||||
| 54,900 | Vectrus, Inc.* | 1,693,665 | ||||||
| 13,375 | Visteon Corp.* | 1,673,748 | ||||||
| 28,600 | WestRock Co. | 1,807,806 | ||||||
| See Notes to Financial Statements. |
| Semi-Annual Report | December 31, 2017 | 15 |
| Schedule of Investments | James Balanced: Golden Rainbow Fund |
| December 31, 2017 (Unaudited) |
| Shares or Principal Amount | Value | |||||||
| Industrial (continued) | ||||||||
| 15,685 | Zebra Technologies Corp., Class A* | $ | 1,628,103 | |||||
| 177,511,136 | ||||||||
| Technology-8.67% | ||||||||
| 733,837 | ACCO Brands Corp.* | 8,952,811 | ||||||
| 9,600 | Amgen, Inc. | 1,669,440 | ||||||
| 148,525 | Amkor Technology, Inc.* | 1,492,676 | ||||||
| 9,600 | Apple, Inc. | 1,624,608 | ||||||
| 29,860 | Applied Materials, Inc. | 1,526,443 | ||||||
| 337,600 | Arrow Electronics, Inc.* | 27,146,416 | ||||||
| 42,600 | Avnet, Inc. | 1,687,812 | ||||||
| 50,800 | Axcelis Technologies, Inc.* | 1,457,960 | ||||||
| 5,400 | Biogen, Inc.* | 1,720,278 | ||||||
| 32,520 | Blucora, Inc.* | 718,692 | ||||||
| 49,875 | Brooks Automation, Inc. | 1,189,519 | ||||||
| 55,000 | Cabot Microelectronics Corp. | 5,174,400 | ||||||
| 12,900 | CACI International, Inc., Class A* | 1,707,315 | ||||||
| 487,810 | Corning, Inc. | 15,605,042 | ||||||
| 101,000 | Cypress Semiconductor Corp. | 1,539,240 | ||||||
| 266,500 | Deluxe Corp. | 20,477,860 | ||||||
| 49,900 | Diodes, Inc.* | 1,430,633 | ||||||
| 44,890 | Ducommun, Inc.* | 1,277,120 | ||||||
| 18,200 | DXC Technology Co. | 1,727,180 | ||||||
| 51,840 | Entegris, Inc. | 1,578,528 | ||||||
| 63,500 | Exelixis, Inc.* | 1,930,400 | ||||||
| 142,900 | Extreme Networks, Inc.* | 1,789,108 | ||||||
| 27,640 | First Solar, Inc.* | 1,866,253 | ||||||
| 92,600 | Flex, Ltd.* | 1,665,874 | ||||||
| 97,800 | FormFactor, Inc.* | 1,530,570 | ||||||
| 28,500 | Garmin, Ltd. | 1,697,745 | ||||||
| 22,800 | Gilead Sciences, Inc. | 1,633,392 | ||||||
| 79,000 | HP, Inc. | 1,659,790 | ||||||
| 497,600 | Intel Corp. | 22,969,216 | ||||||
| 23,370 | InterDigital, Inc. | 1,779,625 | ||||||
| 11,100 | International Business Machines Corp. | 1,702,962 | ||||||
| 153,300 | Iridium Communications, Inc.* | 1,808,940 | ||||||
| 61,000 | Jabil, Inc. | 1,601,250 | ||||||
| 47,740 | KEMET Corp.* | 718,964 | ||||||
| 15,800 | KLA-Tencor Corp. | 1,660,106 | ||||||
| 71,765 | Kulicke & Soffa Industries, Inc.* | 1,746,401 | ||||||
| 8,000 | Lam Research Corp. | 1,472,560 | ||||||
| 26,900 | Leidos Holdings, Inc. | 1,736,933 | ||||||
| 21,200 | LivaNova PLC* | 1,694,304 | ||||||
| 30,900 | Maxim Integrated Products, Inc. | 1,615,452 | ||||||
| 18,500 | Microchip Technology, Inc. | 1,625,780 | ||||||
| 38,370 | Micron Technology, Inc.* | 1,577,774 | ||||||
| 15,870 | MKS Instruments, Inc. | 1,499,715 | ||||||
| 18,290 | Motorola Solutions, Inc. | 1,652,319 | ||||||
| 37,700 | NetApp, Inc. | 2,085,564 | ||||||
| 17,500 | Northrop Grumman Corp. | 5,370,925 | ||||||
| 27,210 | Nova Measuring Instruments, Ltd.* | 705,011 | ||||||
| 264,340 | Orbotech, Ltd.* | 13,280,442 | ||||||
| 85,720 | PC Connection, Inc. | 2,246,721 | ||||||
| 29,800 | Qualys, Inc.* | 1,768,630 | ||||||
| See Notes to Financial Statements. |
| 16 | www.jamesfunds.com |
| James Balanced: Golden Rainbow Fund | Schedule of Investments |
| December 31, 2017 (Unaudited) |
| Shares or Principal Amount | Value | |||||||
| Technology (continued) | ||||||||
| 88,600 | Sabre Corp. | $ | 1,816,300 | |||||
| 43,700 | ScanSource, Inc.* | 1,564,460 | ||||||
| 45,500 | Seagate Technology PLC | 1,903,720 | ||||||
| 20,500 | Spirit AeroSystems Holdings, Inc., Class A | 1,788,625 | ||||||
| 46,600 | Synaptics, Inc.* | 1,861,204 | ||||||
| 262,650 | SYNNEX Corp. | 35,707,268 | ||||||
| 72,100 | Syntel, Inc.* | 1,657,579 | ||||||
| 18,120 | TE Connectivity, Ltd. | 1,722,125 | ||||||
| 9,100 | Teledyne Technologies, Inc.* | 1,648,465 | ||||||
| 38,710 | Teradyne, Inc. | 1,620,788 | ||||||
| 17,100 | Texas Instruments, Inc. | 1,785,924 | ||||||
| 30,500 | T-Mobile US, Inc.* | 1,937,055 | ||||||
| 52,425 | Tower Semiconductor, Ltd.* | 1,786,644 | ||||||
| 53,200 | Triumph Group, Inc. | 1,447,040 | ||||||
| 33,160 | Ultra Clean Holdings, Inc.* | 765,664 | ||||||
| 10,000 | Universal Display Corp. | 1,726,500 | ||||||
| 79,900 | Vishay Intertechnology, Inc. | 1,657,925 | ||||||
| 72,400 | Web.com Group, Inc.* | 1,578,320 | ||||||
| 26,900 | Wesco International, Inc.* | 1,833,235 | ||||||
| 19,635 | Western Digital Corp. | 1,561,572 | ||||||
| 59,000 | Xerox Corp. | 1,719,850 | ||||||
| 254,886,962 | ||||||||
| Utilities-1.08% | ||||||||
| 75,400 | Atlantica Yield PLC | 1,599,234 | ||||||
| 289,850 | CenterPoint Energy, Inc. | 8,220,146 | ||||||
| 21,300 | Edison International | 1,347,012 | ||||||
| 11,542 | Entergy Corp. | 939,403 | ||||||
| 50,900 | FirstEnergy Corp. | 1,558,558 | ||||||
| 10,424 | IDACORP, Inc. | 952,337 | ||||||
| 67,600 | NRG Energy, Inc. | 1,925,248 | ||||||
| 45,300 | OGE Energy Corp. | 1,490,823 | ||||||
| 97,210 | Pinnacle West Capital Corp. | 8,280,348 | ||||||
| 117,420 | PNM Resources, Inc. | 4,749,639 | ||||||
| 20,483 | Portland General Electric Co. | 933,615 | ||||||
| 31,996,363 | ||||||||
| TOTAL COMMON STOCKS | ||||||||
| (Cost $919,639,029) | 1,271,571,277 | |||||||
| Shares or Principal Amount | Value | |||||||
| EXCHANGE TRADED FUNDS-0.79% | ||||||||
| 92,910 | iShares® MSCI All Peru Capped ETF | 3,807,452 | ||||||
| 35,000 | iShares® MSCI Brazil Capped ETF | 1,415,750 | ||||||
| 109,760 | iShares® MSCI Canada ETF | 3,253,286 | ||||||
| 94,410 | iShares® MSCI Chile Capped ETF | 4,924,426 | ||||||
| 15,590 | iShares® MSCI Philippines ETF | 605,204 | ||||||
| 10,000 | iShares® MSCI South Korea Capped ETF | 749,300 | ||||||
| 30,000 | iShares® MSCI Taiwan Capped ETF | 1,086,300 | ||||||
| 454,760 | iShares® Silver Trust ETF* | 7,271,612 | ||||||
| TOTAL EXCHANGE TRADED FUNDS | ||||||||
| (Cost $18,168,432) | 23,113,330 | |||||||
| See Notes to Financial Statements. |
| Semi-Annual Report | December 31, 2017 | 17 |
| Schedule of Investments | James Balanced: Golden Rainbow Fund |
| December 31, 2017 (Unaudited) |
| Shares or Principal Amount | Value | |||||||
| CORPORATE BONDS-11.66% | ||||||||
| Basic Materials-0.05% | ||||||||
| $ | 1,500,000 | E.I. du Pont de Nemours & Co., 5.750%, 3/15/19 | $ | 1,561,284 | ||||
| Consumer, Cyclical-0.69% | ||||||||
| 5,000,000 | eBay, Inc., 2.600%, 7/15/22 | 4,954,266 | ||||||
| 5,000,000 | Home Depot, Inc., 2.700%, 4/1/23 | 5,047,123 | ||||||
| 5,000,000 | Home Depot, Inc., 5.950%, 4/1/41 | 6,765,890 | ||||||
| 785,000 | McDonald's Corp., 5.700%, 2/1/39 | 989,423 | ||||||
| 2,000,000 | Wal-Mart Stores, Inc., 5.250%, 9/1/35 | 2,541,482 | ||||||
| 20,298,184 | ||||||||
| Consumer, Non-cyclical-1.63% | ||||||||
| 10,000,000 | Coca-Cola Co., 3.200%, 11/1/23 | 10,381,981 | ||||||
| 1,950,000 | Dr Pepper Snapple Group, Inc., 2.530%, 11/15/21 | 1,945,880 | ||||||
| 3,000,000 | Hershey Co., 4.125%, 12/1/20 | 3,155,089 | ||||||
| 5,475,000 | Johnson & Johnson, 4.500%, 9/1/40 | 6,252,782 | ||||||
| 5,000,000 | Merck & Co., Inc., 2.800%, 5/18/23 | 5,040,858 | ||||||
| 10,000,000 | Merck & Co., Inc., 4.150%, 5/18/43 | 11,112,053 | ||||||
| 10,000,000 | PepsiCo, Inc., 5.000%, 6/1/18 | 10,129,969 | ||||||
| 48,018,612 | ||||||||
| Energy-1.55% | ||||||||
| 5,000,000 | Apache Corp., 3.250%, 4/15/22 | 5,037,188 | ||||||
| 5,000,000 | BP Capital Markets PLC, 3.245%, 5/6/22 | 5,124,266 | ||||||
| 8,271,000 | Chevron Corp., 3.326%, 11/17/25 | 8,508,066 | ||||||
| 2,000,000 | Phillips 66, 4.300%, 4/1/22 | 2,125,421 | ||||||
| 5,050,000 | Shell International Finance BV, 2.375%, 8/21/22 | 5,013,222 | ||||||
| 5,000,000 | Shell International Finance BV, 6.375%, 12/15/38 | 6,965,580 | ||||||
| 2,625,000 | Shell International Finance BV, 4.375%, 5/11/45 | 2,948,756 | ||||||
| 10,000,000 | Statoil ASA, 2.250%, 11/8/19 | 9,998,062 | ||||||
| 45,720,561 | ||||||||
| Financial-3.88% | ||||||||
| 8,000,000 | Aflac, Inc., 3.625%, 11/15/24 | 8,366,121 | ||||||
| 3,000,000 | American Express Credit Corp., 2.125%, 7/27/18 | 3,003,519 | ||||||
| 5,250,000 | American Express Credit Corp., 2.600%, 9/14/20 | 5,276,211 | ||||||
| 5,000,000 | Australia & New Zealand Banking Group, Ltd., 2.625%, 5/19/22 | 4,983,085 | ||||||
| 8,100,000 | Berkshire Hathaway, Inc., 3.750%, 8/15/21 | 8,503,283 | ||||||
| 10,000,000 | GE Capital International Funding Co. Unlimited Co., 2.342%, 11/15/20 | 9,953,150 | ||||||
| 10,000,000 | Goldman Sachs Group, Inc., 2.600%, 4/23/20 | 10,013,033 | ||||||
| 10,000,000 | HSBC Holdings PLC, 4.000%, 3/30/22 | 10,444,424 | ||||||
| 11,000,000 | JPMorgan Chase & Co., 4.250%, 10/15/20 | 11,532,890 | ||||||
| 5,000,000 | National Australia Bank, Ltd., 2.500%, 5/22/22 | 4,960,458 | ||||||
| 5,000,000 | National Rural Utilities Cooperative Finance Corp., 2.450%, 6/15/22 | 4,917,206 | ||||||
| 15,956,000 | PNC Bank NA, 1.950%, 3/4/19 | 15,926,843 | ||||||
| 6,000,000 | PNC Bank NA, 2.950%, 2/23/25 | 5,986,468 | ||||||
| 5,305,000 | US Bank NA Cincinnati, 3M US L + 0.32%, 1/24/20(a) | 5,319,734 | ||||||
| 5,000,000 | Wells Fargo & Co., 2.500%, 3/4/21 | 4,997,249 | ||||||
| 114,183,674 | ||||||||
| Industrial-0.87% | ||||||||
| 1,000,000 | Caterpillar, Inc., 8.250%, 12/15/38 | 1,614,925 | ||||||
| 10,000,000 | General Electric Co., 3M US L + 0.80%, 4/15/20(a) | 10,087,090 | ||||||
| 1,000,000 | General Electric Co., 2.700%, 10/9/22 | 998,333 | ||||||
| 2,000,000 | General Electric Co., 6.875%, 1/10/39 | 2,879,929 | ||||||
| 5,000,000 | United Parcel Service, Inc., 2.350%, 5/16/22 | 4,976,897 | ||||||
| See Notes to Financial Statements. |
| 18 | www.jamesfunds.com |
| James Balanced: Golden Rainbow Fund | Schedule of Investments |
| December 31, 2017 (Unaudited) |
| Shares or Principal Amount | Value | |||||||
| Industrial (continued) | ||||||||
| $ | 5,000,000 | United Technologies Corp., 3.100%, 6/1/22 | $ | 5,092,188 | ||||
| 25,649,362 | ||||||||
| Technology-2.80% | ||||||||
| 8,000,000 | Alphabet, Inc., 3.625%, 5/19/21 | 8,373,939 | ||||||
| 3,419,000 | Apple, Inc., 1.550%, 2/7/20 | 3,381,309 | ||||||
| 10,000,000 | Apple, Inc., 3M US L + 0.20%, 2/7/20(a) | 10,019,422 | ||||||
| 4,840,000 | Gilead Sciences, Inc., 4.600%, 9/1/35 | 5,449,894 | ||||||
| 5,000,000 | Intel Corp., 3.300%, 10/1/21 | 5,184,658 | ||||||
| 5,000,000 | Intel Corp., 2.875%, 5/11/24 | 5,044,774 | ||||||
| 7,000,000 | International Business Machines Corp., 1.875%, 8/1/22 | 6,809,899 | ||||||
| 9,000,000 | Microsoft Corp., 1.850%, 2/6/20 | 8,972,891 | ||||||
| 3,700,000 | Microsoft Corp., 5.200%, 6/1/39 | 4,674,854 | ||||||
| 7,266,000 | Oracle Corp., 2.500%, 10/15/22 | 7,255,040 | ||||||
| 6,000,000 | Oracle Corp., 2.400%, 9/15/23 | 5,924,005 | ||||||
| 10,000,000 | QUALCOMM, Inc., 4.650%, 5/20/35 | 10,754,469 | ||||||
| 81,845,154 | ||||||||
| Utilities-0.19% | ||||||||
| 1,000,000 | Georgia Power Co., 5.400%, 6/1/18 | 1,014,396 | ||||||
| 4,600,000 | San Diego Gas & Electric Co., 3.000%, 8/15/21 | 4,700,920 | ||||||
| 5,715,316 | ||||||||
| TOTAL CORPORATE BONDS | ||||||||
| (Cost $337,572,087) | 342,992,147 | |||||||
| Shares or Principal Amount | Value | |||||||
| MUNICIPAL BONDS- 6.72% | ||||||||
| Connecticut-0.20% | ||||||||
| 5,350,000 | State of Connecticut, Series D, 5.000%, 11/1/25 | 5,930,101 | ||||||
| Florida-0.46% | ||||||||
| 10,775,000 | Florida State Board of Education Capital Outlay General Obligation Bonds, Series C, 5.000%, 6/1/23 | 12,581,321 | ||||||
| 1,000,000 | Florida State Board of Education Capital Outlay General Obligation Bonds, Series D, 5.000%, 6/1/38 | 1,024,630 | ||||||
| 13,605,951 | ||||||||
| Georgia-0.30% | ||||||||
| 3,000,000 | State of Georgia General Obligation Unlimited Bonds, Series B, Partially Prefunded, 4.500%, 1/1/29(b) | 3,081,270 | ||||||
| 5,000,000 | State of Georgia General Obligation Unlimited Bonds, Series D, 5.000%, 2/1/25 | 5,780,900 | ||||||
| 8,862,170 | ||||||||
| Hawaii-0.35% | ||||||||
| 9,000,000 | City and County of Honolulu General Obligation Unlimited Bonds, Series B, 5.000%, 11/1/25 | 10,298,880 | ||||||
| Illinois-0.04% | ||||||||
| 1,000,000 | Village of Bolingbrook General Obligation Unlimited Bonds, 5.000%, 1/1/37 | 1,002,210 | ||||||
| Maryland-0.17% | ||||||||
| 5,000,000 | County of Montgomery General Obligation Unlimited Bonds, Series A, 3.000%, 11/1/29 | 5,089,700 | ||||||
| Ohio-2.09% | ||||||||
| 7,450,000 | Beavercreek City School District General Obligation Unlimited Bonds, 3.250%, 12/1/36 | 7,607,418 | ||||||
| 6,395,000 | City of Cincinnati General Obligation Unlimited Bonds, Series A,, 3.000%, 12/1/27 | 6,660,776 | ||||||
| 5,450,000 | City of Columbus General Obligation Various Purpose Limited Tax Bonds, Series B, 3.250%, 8/15/24 | 5,822,126 | ||||||
| 5,000,000 | County of Cuyahoga General Obligation Limited (Capital Improvement), Series A, 4.000%, 12/1/37 | 5,229,300 | ||||||
| 5,000,000 | Greenville City School District General Obligation Unlimited Bonds (School Improvement): 5.000%, 1/1/46 | 5,506,400 | ||||||
| See Notes to Financial Statements. |
| Semi-Annual Report | December 31, 2017 | 19 |
| Schedule of Investments | James Balanced: Golden Rainbow Fund |
| December 31, 2017 (Unaudited) |
| Shares or Principal Amount | Value | |||||||
| Ohio (continued) | ||||||||
| $ | 11,000,000 | 5.500%, 1/1/51 | $ | 12,071,400 | ||||
| 1,100,000 | Miamisburg City School District General Obligation Unlimited Bonds (School Facilities Construction & Improvement), Prerefunded 12/1/18 @ 100, 5.000%, 12/1/33(b) | 1,134,903 | ||||||
| 500,000 | Mount Healthy City School District General Obligation Unlimited Bonds (School Improvement), Prefunded 6/1/18 @ 100, 5.000%, 12/1/26(b) | 507,180 | ||||||
| 1,000,000 | Ohio State University General Recipients Revenue Bonds, Series C, 4.910%, 6/1/40 | 1,211,430 | ||||||
| 105,000 | Ohio State University Revenue Bonds, Series A, Prefunded 12/1/18 @ 100, 5.000%, 12/1/28(b) | 108,332 | ||||||
| 500,000 | Springboro Community City School District General Obligation Unlimited Bonds, 5.250%, 12/1/23 | 586,700 | ||||||
| State of Ohio General Obligation Unlimited Bonds, Series A, Prefunded 3/1/18 @ 100: | ||||||||
| 365,000 | 5.375%, 9/1/28(b) | 367,347 | ||||||
| 635,000 | 5.375%, 9/1/28(b) | 639,083 | ||||||
| 3,475,000 | State of Ohio General Obligation Unlimited Bonds, Series C, 5.000%, 9/1/19 | 3,668,418 | ||||||
| 6,900,000 | State of Ohio General Obligation Unlimited Bonds, Series S, 5.000%, 5/1/28 | 8,450,844 | ||||||
| 105,000 | The Ohio State University Revenue Bonds, Series A, Prefunded 12/1/18 @ 100, 5.000%, 12/1/28(b) | 108,332 | ||||||
| 790,000 | The Ohio State University Revenue Bonds, Series A, Prefunded 12/1/18 @100, 5.000%, 12/1/28(b) | 815,067 | ||||||
| 1,000,000 | Wright State University Revenue Bonds, 4.000%, 5/1/18 | 1,006,830 | ||||||
| 61,501,886 | ||||||||
| Pennsylvania-1.55% | ||||||||
| Commonwealth of Pennsylvania General Obligation Unlimited Bonds, First Series: | ||||||||
| 12,005,000 | 5.000%, 3/15/25 | 14,161,578 | ||||||
| 7,050,000 | 5.000%, 9/15/26 | 8,542,908 | ||||||
| 20,000,000 | Commonwealth of Pennsylvania General Obligation Unlimited Bonds, First Series, Prefunded 6/1/22 @ 100, 5.000%, 6/1/24 | 22,738,400 | ||||||
| 45,442,886 | ||||||||
| Tennessee-0.19% | ||||||||
| 5,000,000 | Metropolitan Government of Nashville & Davidson County TN General Obligation Unlimited Bonds, Series C, 4.000%, 7/1/24 | 5,612,650 | ||||||
| Texas-0.79% | ||||||||
| 1,000,000 | Friendswood Independent School District General Obligation Unlimited Bonds (Schoolhouse), Prefunded 2/15/18 @ 100, 5.000%, 2/15/37(b) | 1,004,230 | ||||||
| 5,000,000 | Houston Texas Independent School District General Obligation Limited Bonds, Series A, 5.000%, 2/15/28 | 6,093,450 | ||||||
| 5,335,000 | Port of Houston Authority General Obligation Unlimited Bonds, Series D-1, 5.000%, 10/1/35 | 5,773,590 | ||||||
| 7,620,000 | Transportation Community Mobility General Obligation Unlimited Bonds, Series A, 5.000%, 10/1/25 | 9,288,933 | ||||||
| Tyler Independent School District General Obligation Unlimited Bonds, Prefunded 2/15/18 @ 100: | ||||||||
| 475,000 | 5.000%, 2/15/34(b) | 476,786 | ||||||
| 290,000 | 5.000%, 2/15/34(b) | 291,090 | ||||||
| 235,000 | Tyler Independent School District General Obligation Unlimited Bonds, Unrefunded 2016, 5.000%, 2/15/34 | 235,971 | ||||||
| 23,164,050 | ||||||||
| Washington-0.39% | ||||||||
| 5,000,000 | State of Washington General Obligation Unlimited Bonds, Series D, 4.000%, 2/1/37 | 5,219,800 | ||||||
| 5,845,000 | State of Washington General Obligation Various Purpose Unlimited Bonds, Series D, 5.000%, 2/1/20 | 6,251,929 | ||||||
| 11,471,729 | ||||||||
| Wisconsin-0.19% | ||||||||
| 5,000,000 | State of Wisconsin General Obligation Unlimited Bonds, Series C, Prefunded 5/1/21 @ 100, 5.000%, 5/1/25(b) | 5,517,850 | ||||||
| TOTAL MUNICIPAL BONDS | ||||||||
| (Cost $194,509,739) | 197,500,063 | |||||||
| See Notes to Financial Statements. |
| 20 | www.jamesfunds.com |
| James Balanced: Golden Rainbow Fund | Schedule of Investments |
| December 31, 2017 (Unaudited) |
| Shares or Principal Amount | Value | |||||||
| U.S. GOVERNMENT AGENCIES-8.48% | ||||||||
| Federal Agricultural Mortgage Corporation-0.55% | ||||||||
| $ | 10,000,000 | 3M US L + 0.08%, 1/3/22(a) | $ | 10,019,735 | ||||
| 6,177,000 | 3.150%, 11/9/27 | 6,104,315 | ||||||
| 16,124,050 | ||||||||
| Federal Farm Credit Banks-2.39% | ||||||||
| 10,000,000 | 1.170%, 5/16/19 | 9,889,510 | ||||||
| 10,000,000 | 2.350%, 5/2/24 | 9,771,470 | ||||||
| 5,725,000 | 2.750%, 11/6/26 | 5,746,572 | ||||||
| 10,000,000 | 3.300%, 3/22/27 | 10,014,580 | ||||||
| 10,000,000 | 2.800%, 6/2/28 | 9,689,090 | ||||||
| 5,000,000 | 3.390%, 5/20/30 | 4,965,985 | ||||||
| 10,000,000 | 3.220%, 3/26/31 | 10,190,130 | ||||||
| 5,000,000 | 3.420%, 5/27/31 | 4,989,255 | ||||||
| 5,000,000 | 3.110%, 11/1/33 | 5,013,550 | ||||||
| 70,270,142 | ||||||||
| Federal Home Loan Banks-4.41% | ||||||||
| 50,000,000 | 1.000%, 8/28/18 | 49,735,050 | ||||||
| 11,250,000 | 1.200%, 5/23/19 | 11,138,445 | ||||||
| 5,000,000 | 1.600%, 10/22/20 | 4,926,210 | ||||||
| 10,000,000 | 2.050%, 6/9/23 | 9,763,190 | ||||||
| 10,000,000 | 2.875%, 6/13/25 | 10,248,420 | ||||||
| 10,000,000 | 2.620%, 4/28/26 | 9,703,610 | ||||||
| 10,000,000 | 3.000%, 7/12/27 | 9,934,630 | ||||||
| 5,981,481 | 3.000%, 4/18/31 | 5,893,781 | ||||||
| 19,000,000 | 2.000%, 6/30/31(c) | 18,258,297 | ||||||
| 129,601,633 | ||||||||
| Federal Home Loan Mortgage Corporation-0.50% | ||||||||
| 5,000,000 | 1.250%, 8/26/19(c) | 4,970,060 | ||||||
| 10,000,000 | 1.800%, 4/13/20 | 9,929,400 | ||||||
| 14,899,460 | ||||||||
| Tennessee Valley Authority-0.46% | ||||||||
| 10,000,000 | 5.250%, 9/15/39 | 13,478,140 | ||||||
| United States Department of Housing and Urban Development-0.17% | ||||||||
| 5,000,000 | 2.050%, 8/1/19 | 4,987,780 | ||||||
| TOTAL U.S. GOVERNMENT AGENCIES | ||||||||
| (Cost $251,921,733) | 249,361,205 | |||||||
| Shares or Principal Amount | Value | |||||||
| MORTGAGE BACKED SECURITIES-1.00% | ||||||||
| Federal National Mortgage Association-1.00% | ||||||||
| 10,020,592 | 3.500%, 9/1/33 | 10,432,596 | ||||||
| 19,717,002 | 2.500%, 1/1/57 | 18,908,633 | ||||||
| 29,341,229 | ||||||||
| TOTAL MORTGAGE BACKED SECURITIES | ||||||||
| (Cost $29,138,526) | 29,341,229 | |||||||
| Shares or Principal Amount | Value | |||||||
| U.S. TREASURY BONDS & NOTES-25.57% | ||||||||
| U.S. Treasury Bonds-8.26% | ||||||||
| $ | 97,500,000 | 2.625%, 11/15/20 | 99,251,230 | |||||
| See Notes to Financial Statements. |
| Semi-Annual Report | December 31, 2017 | 21 |
| Schedule of Investments | James Balanced: Golden Rainbow Fund |
| December 31, 2017 (Unaudited) |
| Shares or Principal Amount | Value | |||||||
| U.S. Treasury Bonds (continued) | ||||||||
| $ | 60,000,000 | 2.000%, 8/15/25 | $ | 58,477,569 | ||||
| 85,000,000 | 2.750%, 11/15/47 | 85,043,776 | ||||||
| 242,772,575 | ||||||||
| U.S. Treasury Notes-13.82% | ||||||||
| 80,000,000 | 2.750%, 2/15/19 | 80,793,367 | ||||||
| 30,000,000 | 1.250%, 6/30/19 | 29,731,749 | ||||||
| 25,000,000 | 0.750%, 7/15/19 | 24,577,151 | ||||||
| 25,000,000 | 1.375%, 9/15/20 | 24,641,132 | ||||||
| 30,000,000 | 1.375%, 9/30/20 | 29,540,152 | ||||||
| 50,000,000 | 1.625%, 10/15/20 | 49,552,084 | ||||||
| 25,000,000 | 1.750%, 5/31/22 | 24,562,170 | ||||||
| 50,000,000 | 2.000%, 10/31/22 | 49,558,026 | ||||||
| 75,000,000 | 2.000%, 6/30/24 | 73,547,454 | ||||||
| 20,000,000 | 2.125%, 7/31/24 | 19,757,894 | ||||||
| 406,261,179 | ||||||||
| United States Treasury Inflation Indexed Bonds-3.49% | ||||||||
| 31,201,895 | 1.625%, 1/15/18 | 31,198,239 | ||||||
| 32,833,200 | 0.625%, 7/15/21 | 33,474,691 | ||||||
| 38,144,400 | 0.125%, 1/15/22 | 38,003,501 | ||||||
| 102,676,431 | ||||||||
| TOTAL U.S. TREASURY BONDS & NOTES | ||||||||
| (Cost $754,678,014) | 751,710,185 | |||||||
| Shares or Principal Amount | Value | |||||||
| FOREIGN BONDS-0.91% | ||||||||
| Australia Government Bond-0.28% | ||||||||
| AUD 10,000,000 | 5.250%, 3/15/19 | 8,113,511 | ||||||
| New Zealand Government Bond-0.37% | ||||||||
| NZD 15,000,000 | 5.000%, 3/15/19 | 11,015,156 | ||||||
| Singapore Government-0.26% | ||||||||
| SGD 10,000,000 | 2.250%, 6/1/21 | 7,616,120 | ||||||
| TOTAL FOREIGN BONDS | ||||||||
| (Cost $27,431,885) | 26,744,787 | |||||||
| Shares or Principal Amount | Value | |||||||
| SHORT TERM INVESTMENTS-1.49% | ||||||||
| Mutual Fund-1.49% | ||||||||
| 43,797,455 | First American Treasury Obligations Fund, Class Z, 7-Day Yield 1.173% | 43,797,455 | ||||||
| TOTAL SHORT TERM INVESTMENTS | ||||||||
| (Cost $43,797,455) | 43,797,455 | |||||||
| TOTAL INVESTMENT SECURITIES-99.87% | ||||||||
| (Cost $2,576,856,900) | 2,936,131,678 | |||||||
| OTHER ASSETS IN EXCESS OF LIABILITIES-0.13% | 3,938,589 | |||||||
| NET ASSETS- 100.00% | $ | 2,940,070,267 | ||||||
| See Notes to Financial Statements. |
| 22 | www.jamesfunds.com |
| James Balanced: Golden Rainbow Fund | Schedule of Investments |
| December 31, 2017 (Unaudited) |
For Fund compliance purposes, the Fund's industry classifications refer to any one or more of the industry sub-classifications used by one or more widely recognized market indexes or ratings group indexes, and/or as defined by Fund management. Those definitions may not apply for purposes of this report, which may combine industry sub-classifications for reporting ease. Industries are shown as a percentage of net assets.
| * | Non-income producing security. |
| (a) | Floating or variable rate security. The reference rate is described below. The rate in effect as of December 31, 2017 is based on the reference rate plus the displayed spread as of the security’s last reset date. |
| (b) | Prefunded Issues are bonds which are prerefunded and collateralized by U.S. Treasury securities held in escrow and used to pay principal and interest on tax exempt issues and to retire the bonds in full at the earliest refunding date. |
| (c) | Step coupon. Coupon increases periodically based upon a predetermined schedule. Interest rate disclosed is that which is in effect as of December 31, 2017. |
Investment Abbreviations:
LIBOR - London Interbank Offered Rate
Libor Rates:
3M US L - 3 Month LIBOR as of December 31, 2017 was 1.69%
AUD - Australian Dollar
NZD - New Zealand Dollar
SGD - Singapore Dollar
| See Notes to Financial Statements. |
| Semi-Annual Report | December 31, 2017 | 23 |
| Schedule of Investments | James Small Cap Fund |
| December 31, 2017 (Unaudited) |
| Shares | Value | |||||||
| COMMON STOCKS-98.59% | ||||||||
| Basic Materials-13.00% | ||||||||
| 24,065 | Boise Cascade Co. | $ | 960,193 | |||||
| 18,010 | Carpenter Technology Corp. | 918,330 | ||||||
| 142,325 | Cleveland-Cliffs, Inc.* | 1,026,163 | ||||||
| 36,560 | Ferro Corp.* | 862,450 | ||||||
| 110,635 | Hudbay Minerals, Inc. | 973,588 | ||||||
| 18,815 | Koppers Holdings, Inc.* | 957,683 | ||||||
| 17,900 | Kraton Corp.* | 862,243 | ||||||
| 61,510 | Mercer International, Inc. | 879,593 | ||||||
| 31,190 | Schnitzer Steel Industries, Inc., Class A | 1,044,865 | ||||||
| 8,485,108 | ||||||||
| Consumer, Cyclical-31.74% | ||||||||
| 15,690 | Atlas Air Worldwide Holdings, Inc.* | 920,218 | ||||||
| 16,915 | Big Lots, Inc. | 949,777 | ||||||
| 50,435 | Builders FirstSource, Inc.* | 1,098,979 | ||||||
| 7,950 | Children's Place, Inc. | 1,155,532 | ||||||
| 39,075 | China Yuchai International, Ltd. | 937,800 | ||||||
| 13,620 | Deckers Outdoor Corp.* | 1,093,005 | ||||||
| 58,250 | Gray Television, Inc.* | 975,687 | ||||||
| 11,110 | Group 1 Automotive, Inc. | 788,477 | ||||||
| 38,580 | Interface, Inc. | 970,287 | ||||||
| 29,327 | MDC Holdings, Inc. | 934,945 | ||||||
| 17,190 | Patrick Industries, Inc.* | 1,193,846 | ||||||
| 33,005 | Penn National Gaming, Inc.* | 1,034,047 | ||||||
| 17,455 | Rush Enterprises, Inc., Class A* | 886,889 | ||||||
| 18,915 | SkyWest, Inc. | 1,004,387 | ||||||
| 13,875 | SodaStream International, Ltd.* | 975,968 | ||||||
| 28,450 | SPX Corp.* | 893,046 | ||||||
| 23,180 | Systemax, Inc. | 771,199 | ||||||
| 59,795 | Tailored Brands, Inc. | 1,305,325 | ||||||
| 50,260 | TRI Pointe Group, Inc.* | 900,659 | ||||||
| 31,150 | William Lyon Homes, Class A* | 905,842 | ||||||
| 18,575 | Winnebago Industries, Inc. | 1,032,770 | ||||||
| 20,728,685 | ||||||||
| Consumer, Non-cyclical-5.73% | ||||||||
| 33,520 | Kelly Services, Inc., Class A | 914,090 | ||||||
| 10,595 | Magellan Health, Inc.* | 1,022,947 | ||||||
| 27,235 | Tivity Health, Inc.* | 995,439 | ||||||
| 14,830 | Universal Corp. | 778,575 | ||||||
| 5,652 | Valhi, Inc. | 34,873 | ||||||
| 3,745,924 | ||||||||
| Energy-2.69% | ||||||||
| 52,635 | Diamond Offshore Drilling, Inc.* | 978,485 | ||||||
| 117,905 | McDermott International, Inc.* | 775,815 | ||||||
| 1,754,300 | ||||||||
| Financial-16.82% | ||||||||
| 29,830 | American Equity Investment Life Holding Co. | 916,676 | ||||||
| 100,065 | BBX Capital Corp. | 797,518 | ||||||
| 35,195 | CoreCivic, Inc., REIT | 791,887 | ||||||
| See Notes to Financial Statements. |
| 24 | www.jamesfunds.com |
| James Small Cap Fund | Schedule of Investments |
| December 31, 2017 (Unaudited) |
| Shares | Value | |||||||
| Financial (continued) | ||||||||
| 18,320 | Encore Capital Group, Inc.* | $ | 771,272 | |||||
| 21,505 | Houlihan Lokey, Inc. | 976,972 | ||||||
| 77,770 | iStar, Inc., REIT* | 878,801 | ||||||
| 13,515 | LGI Homes, Inc.* | 1,014,030 | ||||||
| 10,175 | Meta Financial Group, Inc. | 942,714 | ||||||
| 21,015 | Moelis & Co., Class A | 1,019,228 | ||||||
| 12,595 | Piper Jaffray Cos. | 1,086,319 | ||||||
| 24,365 | SP Plus Corp.* | 903,942 | ||||||
| 41,430 | Xenia Hotels & Resources, Inc., REIT | 894,474 | ||||||
| 10,993,833 | ||||||||
| Industrial-15.04% | ||||||||
| 49,110 | American Axle & Manufacturing Holdings, Inc.* | 836,343 | ||||||
| 19,855 | Encore Wire Corp. | 965,946 | ||||||
| 17,490 | Greenbrier Cos., Inc. | 932,217 | ||||||
| 25,900 | H&E Equipment Services, Inc. | 1,052,835 | ||||||
| 8,425 | Kadant, Inc. | 845,870 | ||||||
| 33,455 | Meritor, Inc.* | 784,854 | ||||||
| 50,175 | Milacron Holdings Corp.* | 960,349 | ||||||
| 38,750 | Modine Manufacturing Co.* | 782,750 | ||||||
| 31,455 | Primoris Services Corp. | 855,261 | ||||||
| 39,250 | Quad Graphics, Inc. | 887,050 | ||||||
| 15,660 | Tenneco, Inc. | 916,736 | ||||||
| 9,820,211 | ||||||||
| Technology-12.31% | ||||||||
| 68,450 | ACCO Brands Corp.* | 835,090 | ||||||
| 42,595 | Blucora, Inc.* | 941,349 | ||||||
| 11,143 | Deluxe Corp. | 856,228 | ||||||
| 79,960 | Iridium Communications, Inc.* | 943,528 | ||||||
| 31,415 | Nova Measuring Instruments, Ltd.* | 813,963 | ||||||
| 22,180 | Orbotech, Ltd.* | 1,114,323 | ||||||
| 37,620 | Syntel, Inc.* | 864,884 | ||||||
| 36,650 | Ultra Clean Holdings, Inc.* | 846,249 | ||||||
| 37,755 | Web.com Group, Inc.* | 823,059 | ||||||
| 8,038,673 | ||||||||
| Utilities-1.26% | ||||||||
| 20,310 | PNM Resources, Inc. | 821,540 | ||||||
| 821,540 | ||||||||
| TOTAL COMMON STOCKS | ||||||||
| (Cost $55,507,253) | 64,388,274 | |||||||
| See Notes to Financial Statements. |
| Semi-Annual Report | December 31, 2017 | 25 |
| Schedule of Investments | James Small Cap Fund |
| December 31, 2017 (Unaudited) |
| Shares | Value | |||||||
| SHORT TERM INVESTMENTS-1.48% | ||||||||
| Mutual Fund-1.48% | ||||||||
| 969,593 | First American Treasury Obligations Fund, Class Z, 7-Day Yield 1.173% | $ | 969,593 | |||||
| TOTAL SHORT TERM INVESTMENTS | ||||||||
| (Cost $969,593) | 969,593 | |||||||
| TOTAL INVESTMENT SECURITIES- 100.07% | ||||||||
| (Cost $56,476,846) | 65,357,867 | |||||||
| OTHER LIABILITIES IN EXCESS OF OTHER ASSETS-(0.07)% | (47,398 | ) | ||||||
| NET ASSETS-100.00% | $ | 65,310,469 | ||||||
For Fund compliance purposes, the Fund's industry classifications refer to any one or more of the industry sub-classifications used by one or more widely recognized market indexes or ratings group indexes, and/or as defined by Fund management. Those definitions may not apply for purposes of this report, which may combine industry sub-classifications for reporting ease. Industries are shown as a percentage of net assets.
| * | Non-income producing security. |
| See Notes to Financial Statements. |
| 26 | www.jamesfunds.com |
| James Mid Cap Fund | Schedule of Investments |
| December 31, 2017 (Unaudited) |
| Shares | Value | |||||||
| COMMON STOCKS-98.12% | ||||||||
| Basic Materials-11.01% | ||||||||
| 3,150 | Carpenter Technology Corp. | $ | 160,618 | |||||
| 6,400 | Ferro Corp.* | 150,976 | ||||||
| 19,360 | Hudbay Minerals, Inc. | 170,368 | ||||||
| 4,855 | Huntsman Corp. | 161,623 | ||||||
| 3,390 | Kennametal, Inc. | 164,110 | ||||||
| 5,755 | Louisiana-Pacific Corp.* | 151,126 | ||||||
| 6,820 | Mosaic Co. | 175,001 | ||||||
| 4,300 | Norbord, Inc. | 145,383 | ||||||
| 2,160 | Trinseo SA | 156,816 | ||||||
| 5,720 | United States Steel Corp. | 201,287 | ||||||
| 4,110 | Universal Forest Products, Inc. | 154,618 | ||||||
| 1,791,926 | ||||||||
| Consumer, Cyclical-20.52% | ||||||||
| 3,110 | AMC Networks, Inc., Class A* | 168,189 | ||||||
| 12,060 | American Eagle Outfitters, Inc. | 226,728 | ||||||
| 2,920 | Big Lots, Inc. | 163,958 | ||||||
| 3,640 | Camping World Holdings, Inc., Class A | 162,817 | ||||||
| 2,340 | Deckers Outdoor Corp.* | 187,785 | ||||||
| 3,780 | Kohl's Corp. | 204,989 | ||||||
| 2,965 | Meredith Corp. | 195,838 | ||||||
| 8,450 | Michaels Cos., Inc.* | 204,406 | ||||||
| 5,770 | Penn National Gaming, Inc.* | 180,774 | ||||||
| 3,320 | Penske Automotive Group, Inc. | 158,862 | ||||||
| 1,340 | Polaris Industries, Inc. | 166,147 | ||||||
| 3,060 | Rush Enterprises, Inc., Class A* | 155,479 | ||||||
| 9,020 | Sally Beauty Holdings, Inc.* | 169,215 | ||||||
| 2,300 | Signet Jewelers, Ltd. | 130,065 | ||||||
| 4,930 | Skechers U.S.A., Inc., Class A* | 186,551 | ||||||
| 3,310 | SkyWest, Inc. | 175,761 | ||||||
| 1,205 | Thor Industries, Inc. | 181,618 | ||||||
| 3,390 | Toll Brothers, Inc. | 162,788 | ||||||
| 8,790 | TRI Pointe Group, Inc.* | 157,517 | ||||||
| 3,339,487 | ||||||||
| Consumer, Non-cyclical-10.78% | ||||||||
| 880 | Boston Beer Co., Inc., Class A* | 168,168 | ||||||
| 6,220 | Convergys Corp. | 146,170 | ||||||
| 3,370 | Halyard Health, Inc.* | 155,627 | ||||||
| 1,745 | Helen of Troy, Ltd.* | 168,131 | ||||||
| 10,990 | Horizon Pharma PLC* | 160,454 | ||||||
| 1,850 | Magellan Health, Inc.* | 178,618 | ||||||
| 1,240 | ManpowerGroup, Inc. | 156,376 | ||||||
| 2,550 | On Assignment, Inc.* | 163,889 | ||||||
| 5,050 | Pilgrim's Pride Corp.* | 156,853 | ||||||
| 1,055 | Sanderson Farms, Inc. | 146,413 | ||||||
| 760 | WellCare Health Plans, Inc.* | 152,844 | ||||||
| 1,753,543 | ||||||||
| Energy-5.94% | ||||||||
| 36,825 | Chesapeake Energy Corp.* | 145,827 | ||||||
| 4,900 | CVR Energy, Inc. | 182,476 | ||||||
| See Notes to Financial Statements. |
| Semi-Annual Report | December 31, 2017 | 27 |
| Schedule of Investments | James Mid Cap Fund |
| December 31, 2017 (Unaudited) |
| Shares | Value | |||||||
| Energy (continued) | ||||||||
| 9,220 | Diamond Offshore Drilling, Inc.* | $ | 171,400 | |||||
| 3,640 | HollyFrontier Corp. | 186,441 | ||||||
| 20,640 | McDermott International, Inc.* | 135,811 | ||||||
| 13,775 | Transocean, Ltd.* | 147,117 | ||||||
| 969,072 | ||||||||
| Financial-18.89% | ||||||||
| 2,945 | AerCap Holdings NV* | 154,936 | ||||||
| 5,220 | American Equity Investment Life Holding Co. | 160,411 | ||||||
| 10,100 | BGC Partners, Inc., Class A | 152,611 | ||||||
| 6,470 | CNO Financial Group, Inc. | 159,744 | ||||||
| 6,135 | CoreCivic, Inc., REIT | 138,037 | ||||||
| 540 | Credit Acceptance Corp.* | 174,679 | ||||||
| 3,715 | Essent Group, Ltd.* | 161,305 | ||||||
| 4,980 | Federated Investors, Inc., Class B | 179,678 | ||||||
| 2,780 | First American Financial Corp. | 155,791 | ||||||
| 3,760 | Houlihan Lokey, Inc. | 170,817 | ||||||
| 4,020 | Legg Mason, Inc. | 168,760 | ||||||
| 11,550 | MGIC Investment Corp.* | 162,971 | ||||||
| 3,680 | Moelis & Co., Class A | 178,480 | ||||||
| 8,820 | New Residential Investment Corp., REIT | 157,702 | ||||||
| 7,690 | Radian Group, Inc. | 158,491 | ||||||
| 1,020 | Reinsurance Group of America, Inc. | 159,049 | ||||||
| 9,260 | Santander Consumer U.S.A. Holdings, Inc. | 172,421 | ||||||
| 8,030 | Western Union Co. | 152,650 | ||||||
| 7,255 | Xenia Hotels & Resources, Inc., REIT | 156,635 | ||||||
| 3,075,168 | ||||||||
| Industrial-12.33% | ||||||||
| 3,510 | Allison Transmission Holdings, Inc. | 151,176 | ||||||
| 8,600 | American Axle & Manufacturing Holdings, Inc.* | 146,458 | ||||||
| 4,995 | Dana, Inc. | 159,890 | ||||||
| 1,890 | EMCOR Group, Inc. | 154,507 | ||||||
| 3,120 | Generac Holdings, Inc.* | 154,502 | ||||||
| 5,850 | Meritor, Inc.* | 137,241 | ||||||
| 1,760 | Oshkosh Corp. | 159,966 | ||||||
| 6,455 | Owens-Illinois, Inc.* | 143,107 | ||||||
| 2,745 | Tenneco, Inc. | 160,692 | ||||||
| 3,275 | Timken Co. | 160,966 | ||||||
| 4,780 | Trinity Industries, Inc. | 179,059 | ||||||
| 1,230 | Visteon Corp.* | 153,922 | ||||||
| 1,410 | Zebra Technologies Corp., Class A* | 146,358 | ||||||
| 2,007,844 | ||||||||
| Technology-17.77% | ||||||||
| 13,550 | Amkor Technology, Inc.* | 136,177 | ||||||
| 1,965 | Arrow Electronics, Inc.* | 158,006 | ||||||
| 3,890 | Avnet, Inc. | 154,122 | ||||||
| 4,540 | Brooks Automation, Inc. | 108,279 | ||||||
| 4,730 | Entegris, Inc. | 144,028 | ||||||
| 5,780 | Exelixis, Inc.* | 175,712 | ||||||
| 2,530 | First Solar, Inc.* | 170,826 | ||||||
| 8,440 | Flex, Ltd.* | 151,836 | ||||||
| 2,085 | InterDigital, Inc. | 158,773 | ||||||
| See Notes to Financial Statements. |
| 28 | www.jamesfunds.com |
| James Mid Cap Fund | Schedule of Investments |
| December 31, 2017 (Unaudited) |
| Shares | Value | |||||||
| Technology (continued) | ||||||||
| 5,570 | Jabil, Inc. | $ | 146,213 | |||||
| 1,930 | LivaNova PLC* | 154,246 | ||||||
| 1,440 | MKS Instruments, Inc. | 136,080 | ||||||
| 2,920 | Orbotech, Ltd.* | 146,701 | ||||||
| 1,865 | Spirit AeroSystems Holdings, Inc., Class A | 162,721 | ||||||
| 1,180 | SYNNEX Corp. | 160,421 | ||||||
| 3,540 | Teradyne, Inc. | 148,220 | ||||||
| 4,780 | Tower Semiconductor, Ltd.* | 162,902 | ||||||
| 7,275 | Vishay Intertechnology, Inc. | 150,956 | ||||||
| 2,460 | Wesco International, Inc.* | 167,649 | ||||||
| 2,893,868 | ||||||||
| Utilities-0.88% | ||||||||
| 3,560 | PNM Resources, Inc. | 144,002 | ||||||
| 144,002 | ||||||||
| TOTAL COMMON STOCKS | ||||||||
| (Cost $14,561,027) | 15,974,910 | |||||||
| Shares | Value | |||||||
| SHORT TERM INVESTMENTS- 1.94% | ||||||||
| Mutual Fund-1.94% | ||||||||
| 315,100 | First American Treasury Obligations Fund, Class Z, 7-Day Yield 1.173% | 315,100 | ||||||
| TOTAL SHORT TERM INVESTMENTS | ||||||||
| (Cost $315,100) | 315,100 | |||||||
| TOTAL INVESTMENT SECURITIES- 100.06% | ||||||||
| (Cost $14,876,127) | 16,290,010 | |||||||
| OTHER LIABILITIES IN EXCESS OF OTHER ASSETS-(0.06)% | (9,010 | ) | ||||||
| NET ASSETS- 100.00% | $ | 16,281,000 | ||||||
For Fund compliance purposes, the Fund's industry classifications refer to any one or more of the industry sub-classifications used by one or more widely recognized market indexes or ratings group indexes, and/or as defined by Fund management. Those definitions may not apply for purposes of this report, which may combine industry sub-classifications for reporting ease. Industries are shown as a percentage of net assets.
| * | Non-income producing security. |
| See Notes to Financial Statements. |
| Semi-Annual Report | December 31, 2017 | 29 |
| Schedule of Investments | James Micro Cap Fund |
| December 31, 2017 (Unaudited) |
| Shares | Value | |||||||
| COMMON STOCKS-99.99% | ||||||||
| Basic Materials-8.40% | ||||||||
| 73,270 | Fortuna Silver Mines, Inc.* | $ | 382,469 | |||||
| 394,000 | Golden Star Resources, Ltd.* | 350,660 | ||||||
| 5,670 | KMG Chemicals, Inc. | 374,674 | ||||||
| 8,920 | Koppers Holdings, Inc.* | 454,028 | ||||||
| 22,330 | Mercer International, Inc. | 319,319 | ||||||
| 23,800 | NL Industries, Inc.* | 339,150 | ||||||
| 9,140 | Schnitzer Steel Industries, Inc., Class A | 306,190 | ||||||
| 2,526,490 | ||||||||
| Consumer, Cyclical-19.52% | ||||||||
| 56,090 | Avianca Holdings SA, Sponsored ADR | 444,233 | ||||||
| 18,470 | Century Communities, Inc.* | 574,417 | ||||||
| 17,780 | China Yuchai International, Ltd. | 426,720 | ||||||
| 12,931 | Flexsteel Industries, Inc. | 604,912 | ||||||
| 8,880 | Hamilton Beach Brands Holding Co., Class A | 228,127 | ||||||
| 13,300 | Haverty Furniture Cos., Inc. | 301,245 | ||||||
| 4,220 | Johnson Outdoors, Inc., Class A | 262,020 | ||||||
| 18,860 | Kimball International, Inc., Class B | 352,116 | ||||||
| 15,740 | M/I Homes, Inc.* | 541,456 | ||||||
| 13,387 | Patrick Industries, Inc.* | 929,691 | ||||||
| 59,040 | Pier 1 Imports, Inc. | 244,426 | ||||||
| 35,110 | Tilly's, Inc., Class A | 518,224 | ||||||
| 20,400 | Wabash National Corp. | 442,680 | ||||||
| 5,870,267 | ||||||||
| Consumer, Non-cyclical-10.84% | ||||||||
| 12,720 | Heidrick & Struggles International, Inc. | 312,276 | ||||||
| 10,912 | John B Sanfilippo & Son, Inc. | 690,184 | ||||||
| 19,060 | K12, Inc.* | 303,054 | ||||||
| 13,730 | Kelly Services, Inc., Class A | 374,417 | ||||||
| 19,550 | Lantheus Holdings, Inc.* | 399,798 | ||||||
| 4,990 | Medifast, Inc. | 348,352 | ||||||
| 33,308 | Natural Health Trends Corp. | 505,949 | ||||||
| 23,870 | RPX Corp. | 320,813 | ||||||
| 3,254,843 | ||||||||
| Energy-4.71% | ||||||||
| 28,220 | FutureFuel Corp. | 397,620 | ||||||
| 95,041 | Star Group LP | 1,021,690 | ||||||
| 1,419,310 | ||||||||
| Financial-23.38% | ||||||||
| 55,430 | Ashford Hospitality Trust, Inc., REIT | 373,044 | ||||||
| 21,360 | B. Riley Financial, Inc. | 386,616 | ||||||
| 11,020 | CorEnergy Infrastructure Trust, Inc., REIT | 420,964 | ||||||
| 24,160 | Enova International, Inc.* | 367,232 | ||||||
| 19,626 | ePlus, Inc.* | 1,475,874 | ||||||
| 36,510 | EZCORP, Inc., Class A* | 445,422 | ||||||
| 29,390 | Forestar Group, Inc.* | 646,580 | ||||||
| 20,030 | LGI Homes, Inc.* | 1,502,850 | ||||||
| 17,490 | Maui Land & Pineapple Co., Inc.* | 302,577 | ||||||
| 3,525 | MutualFirst Financial, Inc. | 135,889 | ||||||
| See Notes to Financial Statements. |
| 30 | www.jamesfunds.com |
| James Micro Cap Fund | Schedule of Investments |
| December 31, 2017 (Unaudited) |
| Shares | Value | |||||||
| Financial (continued) | ||||||||
| 14,150 | People's Utah Bancorp | $ | 428,745 | |||||
| 5,370 | Piper Jaffray Cos. | 463,163 | ||||||
| 1,038 | World Acceptance Corp.* | 83,787 | ||||||
| 7,032,743 | ||||||||
| Industrial-17.17% | ||||||||
| 33,710 | Advanced Emissions Solutions, Inc. | 325,639 | ||||||
| 8,110 | ArcBest Corp. | 289,933 | ||||||
| 16,110 | CAI International, Inc.* | 456,235 | ||||||
| 21,350 | Casella Waste Systems, Inc., Class A* | 491,477 | ||||||
| 7,960 | Columbus McKinnon Corp. | 318,241 | ||||||
| 71,170 | DHT Holdings, Inc. | 255,500 | ||||||
| 6,410 | Encore Wire Corp. | 311,847 | ||||||
| 22,415 | Global Brass & Copper Holdings, Inc. | 741,937 | ||||||
| 4,440 | NACCO Industries, Inc., Class A | 167,166 | ||||||
| 30,860 | OMNOVA Solutions, Inc.* | 308,600 | ||||||
| 19,540 | Stoneridge, Inc.* | 446,684 | ||||||
| 17,330 | Tower International, Inc. | 529,432 | ||||||
| 16,740 | Vectrus, Inc.* | 516,429 | ||||||
| 5,159,120 | ||||||||
| Technology-15.97% | ||||||||
| 13,770 | Blucora, Inc.* | 304,317 | ||||||
| 13,490 | Ducommun, Inc.* | 383,791 | ||||||
| 7,240 | Engility Holdings, Inc.* | 205,399 | ||||||
| 59,560 | Extreme Networks, Inc.* | 745,691 | ||||||
| 41,800 | Iridium Communications, Inc.* | 493,240 | ||||||
| 21,350 | KEMET Corp.* | 321,531 | ||||||
| 11,520 | Nova Measuring Instruments, Ltd.* | 298,483 | ||||||
| 16,136 | Orbotech, Ltd.* | 810,673 | ||||||
| 34,858 | PC Connection, Inc. | 913,627 | ||||||
| 14,040 | Ultra Clean Holdings, Inc.* | 324,184 | ||||||
| 4,800,936 | ||||||||
| TOTAL COMMON STOCKS | ||||||||
| (Cost $22,305,659) | 30,063,709 | |||||||
| Shares | Value | |||||||
| SHORT TERM INVESTMENTS- 1.20% | ||||||||
| Mutual Fund-1.20% | ||||||||
| 362,270 | First American Treasury Obligations Fund, Class Z, 7-Day Yield 1.173% | 362,270 | ||||||
| TOTAL SHORT TERM INVESTMENTS | ||||||||
| (Cost $362,270) | 362,270 | |||||||
| TOTAL INVESTMENT SECURITIES- 101.19% | ||||||||
| (Cost $22,667,929) | 30,425,979 | |||||||
| OTHER LIABILITIES IN EXCESS OF OTHER ASSETS-(1.19)% | (356,367 | ) | ||||||
| NET ASSETS- 100.00% | $ | 30,069,612 | ||||||
For Fund compliance purposes, the Fund's industry classifications refer to any one or more of the industry sub-classifications used by one or more widely recognized market indexes or ratings group indexes, and/or as defined by Fund management. Those definitions may not apply for purposes of this report, which may combine industry sub-classifications for reporting ease. Industries are shown as a percentage of net assets.
| * | Non-income producing security. |
| See Notes to Financial Statements. |
| Semi-Annual Report | December 31, 2017 | 31 |
| Schedule of Investments | James Aggressive Allocation Fund |
| December 31, 2017 (Unaudited) |
| Shares or Principal Amount | Value | |||||||
| COMMON STOCKS- 71.47% | ||||||||
| Basic Materials-5.82% | ||||||||
| 1,000 | Celanese Corp., Series A | $ | 107,080 | |||||
| 5,000 | Ferro Corp.* | 117,950 | ||||||
| 4,000 | Newmont Mining Corp. | 150,080 | ||||||
| 1,200 | Trinseo SA | 87,120 | ||||||
| 1,500 | Westlake Chemical Corp. | 159,795 | ||||||
| 622,025 | ||||||||
| Consumer, Cyclical-10.67% | ||||||||
| 2,500 | Best Buy Co., Inc. | 171,175 | ||||||
| 2,000 | Big Lots, Inc. | 112,300 | ||||||
| 800 | Children's Place, Inc. | 116,280 | ||||||
| 1,350 | Deckers Outdoor Corp.* | 108,338 | ||||||
| 1,750 | General Motors Co. | 71,733 | ||||||
| 4,000 | Macy's, Inc. | 100,760 | ||||||
| 1,900 | Meritage Homes Corp.* | 97,280 | ||||||
| 1,200 | Michael Kors Holdings, Ltd.* | 75,540 | ||||||
| 3,000 | SkyWest, Inc. | 159,300 | ||||||
| 1,300 | Wal-Mart Stores, Inc. | 128,375 | ||||||
| 1,141,081 | ||||||||
| Consumer, Non-cyclical-7.37% | ||||||||
| 1,150 | Aetna, Inc. | 207,448 | ||||||
| 500 | Humana, Inc. | 124,035 | ||||||
| 4,000 | Kroger Co. | 109,800 | ||||||
| 1,100 | ManpowerGroup, Inc. | 138,721 | ||||||
| 1,200 | Procter & Gamble Co. | 110,256 | ||||||
| 2,200 | Weight Watchers International, Inc.* | 97,416 | ||||||
| 787,676 | ||||||||
| Energy-7.15% | ||||||||
| 5,000 | BP PLC, Sponsored ADR | 210,150 | ||||||
| 5,500 | Ecopetrol SA, Sponsored ADR | 80,465 | ||||||
| 5,000 | HollyFrontier Corp. | 256,100 | ||||||
| 15,000 | McDermott International, Inc.* | 98,700 | ||||||
| 1,300 | Valero Energy Corp. | 119,483 | ||||||
| 764,898 | ||||||||
| Financial-10.16% | ||||||||
| 1,150 | American Financial Group, Inc. | 124,821 | ||||||
| 3,000 | Fifth Third Bancorp | 91,020 | ||||||
| 575 | Goldman Sachs Group, Inc. | 146,487 | ||||||
| 3,000 | Houlihan Lokey, Inc. | 136,290 | ||||||
| 1,050 | JPMorgan Chase & Co. | 112,287 | ||||||
| 1,250 | KB Financial Group, Inc., ADR* | 73,138 | ||||||
| 1,000 | PNC Financial Services Group, Inc. | 144,290 | ||||||
| 6,000 | Regions Financial Corp. | 103,680 | ||||||
| 1,700 | Torchmark Corp. | 154,207 | ||||||
| 1,086,220 | ||||||||
| Industrial-14.00% | ||||||||
| 2,150 | AGCO Corp. | 153,574 | ||||||
| 2,600 | Dana, Inc. | 83,226 | ||||||
| See Notes to Financial Statements. |
| 32 | www.jamesfunds.com |
| James Aggressive Allocation Fund | Schedule of Investments |
| December 31, 2017 (Unaudited) |
| Shares or Principal Amount | Value | |||||||
| Industrial (continued) | ||||||||
| 1,200 | Deere & Co. | $ | 187,812 | |||||
| 500 | FedEx Corp. | 124,770 | ||||||
| 2,500 | Greenbrier Cos., Inc. | 133,250 | ||||||
| 3,000 | H&E Equipment Services, Inc. | 121,950 | ||||||
| 7,000 | Owens-Illinois, Inc.* | 155,190 | ||||||
| 4,000 | Primoris Services Corp. | 108,760 | ||||||
| 4,000 | TriMas Corp.* | 107,000 | ||||||
| 4,000 | Trinity Industries, Inc. | 149,840 | ||||||
| 1,000 | United Rentals, Inc.* | 171,910 | ||||||
| 1,497,282 | ||||||||
| Technology-12.57% | ||||||||
| 8,000 | ACCO Brands Corp.* | 97,600 | ||||||
| 650 | Apple, Inc. | 109,999 | ||||||
| 900 | Cabot Microelectronics Corp. | 84,672 | ||||||
| 2,700 | Cisco Systems, Inc. | 103,410 | ||||||
| 4,750 | Corning, Inc. | 151,952 | ||||||
| 3,250 | Intel Corp. | 150,020 | ||||||
| 375 | Lockheed Martin Corp. | 120,394 | ||||||
| 1,500 | Motorola Solutions, Inc. | 135,510 | ||||||
| 450 | Northrop Grumman Corp. | 138,110 | ||||||
| 4,000 | ON Semiconductor Corp.* | 83,760 | ||||||
| 2,500 | Tower Semiconductor, Ltd.* | 85,200 | ||||||
| 4,000 | Vishay Intertechnology, Inc. | 83,000 | ||||||
| 1,343,627 | ||||||||
| Utilities-3.73% | ||||||||
| 3,000 | AT&T, Inc. | 116,640 | ||||||
| 4,500 | CenterPoint Energy, Inc. | 127,620 | ||||||
| 3,000 | Public Service Enterprise Group, Inc. | 154,500 | ||||||
| 398,760 | ||||||||
| TOTAL COMMON STOCKS | ||||||||
| (Cost $6,288,431) | 7,641,569 | |||||||
| Shares or Principal Amount | Value | |||||||
| EXCHANGE TRADED FUNDS-2.66% | ||||||||
| 1,300 | iShares® MSCI Eurozone ETF | 56,394 | ||||||
| 1,500 | iShares® MSCI France ETF | 46,830 | ||||||
| 1,500 | iShares® MSCI Japan ETF | 89,895 | ||||||
| 500 | iShares® MSCI South Korea Capped ETF | 37,465 | ||||||
| 3,000 | VanEck Vectors Vietnam ETF | 53,640 | ||||||
| TOTAL EXCHANGE TRADED FUNDS | ||||||||
| (Cost $273,766) | 284,224 | |||||||
| Shares or Principal Amount | Value | |||||||
| CORPORATE BONDS-2.49% | ||||||||
| Consumer, Cyclical-0.61% | ||||||||
| $ | 67,000 | Walt Disney Co., 0.875%, 7/12/19 | 65,775 | |||||
| See Notes to Financial Statements. |
| Semi-Annual Report | December 31, 2017 | 33 |
| Schedule of Investments | James Aggressive Allocation Fund |
| December 31, 2017 (Unaudited) |
| Shares or Principal Amount | Value | |||||||
| Financial-0.47% | ||||||||
| $ | 50,000 | PNC Bank NA, 1.950%, 3/4/19 | $ | 49,908 | ||||
| Industrial-0.47% | ||||||||
| 50,000 | General Electric Co., 2.700%, 10/9/22 | 49,917 | ||||||
| Technology-0.47% | ||||||||
| 50,000 | Microsoft Corp., 1.850%, 2/6/20 | 49,849 | ||||||
| Utilities-0.47% | ||||||||
| 50,000 | Georgia Power Co., 5.400%, 6/1/18 | 50,720 | ||||||
| TOTAL CORPORATE BONDS | ||||||||
| (Cost $267,610) | 266,169 | |||||||
| Shares or Principal Amount | Value | |||||||
| CLOSED-END FUNDS-1.16% | ||||||||
| 7,250 | Aberdeen Chile Fund, Inc. | 64,742 | ||||||
| 2,250 | India Fund, Inc. | 58,770 | ||||||
| TOTAL CLOSED-END FUNDS | ||||||||
| (Cost $108,502) | 123,512 | |||||||
| Shares or Principal Amount | Value | |||||||
| U.S. TREASURY BONDS & NOTES-20.54% | ||||||||
| U.S. Treasury Bonds-4.21% | ||||||||
| $ | 450,000 | 2.750%, 8/15/47 | 450,057 | |||||
| U.S. Treasury Notes-7.89% | ||||||||
| 250,000 | 0.750%, 10/31/18 | 247,935 | ||||||
| 600,000 | 1.125%, 2/28/19 | 595,050 | ||||||
| 842,985 | ||||||||
| United States Treasury Inflation Indexed Bonds-8.44% | ||||||||
| 246,249 | 0.625%, 7/15/21 | 251,060 | ||||||
| 653,904 | 0.125%, 1/15/22 | 651,489 | ||||||
| 902,549 | ||||||||
| TOTAL U.S. TREASURY BONDS & NOTES | ||||||||
| (Cost $2,194,870) | 2,195,591 | |||||||
| Shares or Principal Amount | Value | |||||||
| SHORT TERM INVESTMENTS-1.05% | ||||||||
| Mutual Fund-1.05% | ||||||||
| 112,449 | First American Government Obligations Fund , Class Z, 7-Day Yield 1.147% | 112,449 | ||||||
| TOTAL SHORT TERM INVESTMENTS | ||||||||
| (Cost $112,449) | 112,449 | |||||||
| TOTAL INVESTMENT SECURITIES-99.37% | ||||||||
| (Cost $9,245,628) | 10,623,514 | |||||||
| OTHER ASSETS IN EXCESS OF LIABILITIES- 0.63% | 67,793 | |||||||
| NET ASSETS-100.00% | $ | 10,691,307 | ||||||
| See Notes to Financial Statements. |
| 34 | www.jamesfunds.com |
| James Aggressive Allocation Fund | Schedule of Investments |
| December 31, 2017 (Unaudited) |
For Fund compliance purposes, the Fund's industry classifications refer to any one or more of the industry sub-classifications used by one or more widely recognized market indexes or ratings group indexes, and/or as defined by Fund management. Those definitions may not apply for purposes of this report, which may combine industry sub-classifications for reporting ease. Industries are shown as a percentage of net assets.
| * | Non-income producing security. |
| See Notes to Financial Statements. |
| Semi-Annual Report | December 31, 2017 | 35 |
| Schedule of Investments | James Long-Short Fund |
| December 31, 2017 (Unaudited) |
| Shares | Value | |||||||
| COMMON STOCKS- 86.43% | ||||||||
| Basic Materials-10.85% | ||||||||
| 6,330 | Avery Dennison Corp. | $ | 727,064 | |||||
| 7,800 | Celanese Corp., Series A(a) | 835,224 | ||||||
| 6,550 | Cooper Tire & Rubber Co.(a) | 231,542 | ||||||
| 17,790 | Goodyear Tire & Rubber Co.(a) | 574,795 | ||||||
| 2,368,625 | ||||||||
| Consumer, Cyclical-12.50% | ||||||||
| 10,540 | Best Buy Co., Inc. | 721,674 | ||||||
| 8,700 | Big Lots, Inc. | 488,505 | ||||||
| 4,970 | General Motors Co. | 203,720 | ||||||
| 10,290 | Meritage Homes Corp.*(a) | 526,848 | ||||||
| 6,930 | Southwest Airlines Co.(a) | 453,569 | ||||||
| 3,380 | Wal-Mart Stores, Inc. | 333,775 | ||||||
| 2,728,091 | ||||||||
| Consumer, Non-cyclical-12.21% | ||||||||
| 2,130 | Aetna, Inc.(a) | 384,231 | ||||||
| 3,890 | Grand Canyon Education, Inc.* | 348,272 | ||||||
| 5,040 | ManpowerGroup, Inc. | 635,594 | ||||||
| 13,545 | Pfizer, Inc.(a) | 490,600 | ||||||
| 3,060 | Sanderson Farms, Inc. | 424,667 | ||||||
| 1,720 | UnitedHealth Group, Inc.(a) | 379,191 | ||||||
| 2,662,555 | ||||||||
| Energy-3.35% | ||||||||
| 13,470 | Diamond Offshore Drilling, Inc.* | 250,407 | ||||||
| 4,970 | HollyFrontier Corp. | 254,563 | ||||||
| 3,380 | Royal Dutch Shell PLC, Class A, Sponsored ADR | 225,480 | ||||||
| 730,450 | ||||||||
| Financial-15.58% | ||||||||
| 8,240 | Aaron's, Inc. | 328,364 | ||||||
| 3,450 | Aflac, Inc. | 302,841 | ||||||
| 14,790 | Chimera Investment Corp., REIT | 273,319 | ||||||
| 9,750 | Fifth Third Bancorp | 295,815 | ||||||
| 8,140 | JPMorgan Chase & Co.(a) | 870,492 | ||||||
| 15,690 | Regions Financial Corp. | 271,123 | ||||||
| 5,750 | Travelers Cos., Inc.(a) | 779,930 | ||||||
| 5,120 | Unum Group | 281,037 | ||||||
| 3,402,921 | ||||||||
| Industrial-9.55% | ||||||||
| 4,130 | BorgWarner, Inc. | 211,002 | ||||||
| 7,030 | Dana, Inc. | 225,030 | ||||||
| 4,500 | Deere & Co. | 704,295 | ||||||
| 9,560 | Owens-Illinois, Inc.* | 211,945 | ||||||
| 4,260 | United Rentals, Inc.* | 732,337 | ||||||
| 2,084,609 | ||||||||
| Technology-16.75% | ||||||||
| 1,760 | Apple, Inc. | 297,845 | ||||||
| 2,760 | Arrow Electronics, Inc.* | 221,932 | ||||||
| See Notes to Financial Statements. |
| 36 | www.jamesfunds.com |
| James Long-Short Fund | Schedule of Investments |
| December 31, 2017 (Unaudited) |
| Shares | Value | |||||||
| Technology (continued) | ||||||||
| 9,870 | Cisco Systems, Inc. | $ | 378,021 | |||||
| 7,360 | Corning, Inc. | 235,446 | ||||||
| 6,625 | Deluxe Corp.(a) | 509,065 | ||||||
| 1,680 | International Business Machines Corp. | 257,746 | ||||||
| 9,830 | Kulicke & Soffa Industries, Inc.* | 239,213 | ||||||
| 2,360 | Motorola Solutions, Inc. | 213,202 | ||||||
| 2,130 | Northrop Grumman Corp.(a) | 653,718 | ||||||
| 6,260 | Tower Semiconductor, Ltd.* | 213,341 | ||||||
| 5,480 | Western Digital Corp. | 435,824 | ||||||
| 3,655,353 | ||||||||
| Utilities-5.64% | ||||||||
| 2,590 | American Electric Power Co., Inc.(a) | 190,546 | ||||||
| 7,040 | Edison International(a) | 445,210 | ||||||
| 14,745 | PNM Resources, Inc.(a) | 596,435 | ||||||
| 1,232,191 | ||||||||
| TOTAL COMMON STOCKS | ||||||||
| (Cost $12,734,046) | 18,864,795 | |||||||
| Shares | Value | |||||||
| SHORT TERM INVESTMENTS-14.08% | ||||||||
| Mutual Fund-14.08% | ||||||||
| 3,074,141 | First American Treasury Obligations Fund, Class Z, 7-Day Yield 1.173% | 3,074,141 | ||||||
| TOTAL SHORT TERM INVESTMENTS | ||||||||
| (Cost $3,074,141) | 3,074,141 | |||||||
| TOTAL INVESTMENT SECURITIES-100.51% | ||||||||
| (Cost $15,808,187) | 21,938,936 | |||||||
| SECURITIES SOLD SHORT-(11.10)% | ||||||||
| (Proceeds $2,337,298) | (2,423,531 | ) | ||||||
| OTHER ASSETS IN EXCESS OF LIABILITIES-10.59% | 2,312,301 | (b) | ||||||
| NET ASSETS-100.00% | $ | 21,827,706 | ||||||
| Shares | Value | |||||||
| SCHEDULE OF SECURITIES SOLD SHORT | ||||||||
| COMMON STOCKS-(11.10)% | ||||||||
| Consumer, Cyclical-(3.01)% | ||||||||
| (195 | ) | Amazon.com, Inc. | $ | (228,047 | ) | |||
| (4,400 | ) | DISH Network Corp., Class A | (210,100 | ) | ||||
| (3,800 | ) | Starbucks Corp. | (218,234 | ) | ||||
| (656,381 | ) | |||||||
| Consumer, Non-cyclical-(2.15)% | ||||||||
| (3,300 | ) | Bunge, Ltd. | (221,364 | ) | ||||
| (12,500 | ) | Coty, Inc., Class A | (248,625 | ) | ||||
| (469,989 | ) | |||||||
| Energy-(1.68)% | ||||||||
| (3,660 | ) | Anadarko Petroleum Corp. | (196,322 | ) | ||||
| (2,510 | ) | Schlumberger, Ltd. | (169,149 | ) | ||||
| (365,471 | ) | |||||||
| See Notes to Financial Statements. |
| Semi-Annual Report | December 31, 2017 | 37 |
| Schedule of Investments | James Long-Short Fund |
| December 31, 2017 (Unaudited) |
| Shares | Value | |||||||
| Exchange Traded Funds-(1.09)% | ||||||||
| (1,770 | ) | iShares® Russell 1000 Growth ETF | $ | (238,383 | ) | |||
| Industrial-(1.30)% | ||||||||
| (914 | ) | Tesla, Inc. | (284,574 | ) | ||||
| Technology-(1.87)% | ||||||||
| (2,200 | ) | Incyte Corp., Ltd. | (208,362 | ) | ||||
| (1,960 | ) | salesforce.com, Inc. | (200,371 | ) | ||||
| (408,733 | ) | |||||||
| TOTAL COMMON STOCKS SOLD SHORT | (2,423,531 | ) | ||||||
| (Proceeds $2,337,298) | ||||||||
| TOTAL SECURITIES SOLD SHORT-(11.10)% | ||||||||
| (Proceeds $2,337,298) | $ | (2,423,531 | ) | |||||
For Fund compliance purposes, the Fund's industry classifications refer to any one or more of the industry sub-classifications used by one or more widely recognized market indexes or ratings group indexes, and/or as defined by Fund management. Those definitions may not apply for purposes of this report, which may combine industry sub-classifications for reporting ease. Industries are shown as a percentage of net assets.
| * | Non-income producing security. |
| (a) | Security position is either entirely or partially held in a segregated account as collateral for securities sold short, aggregating a total security position market value of $5,405,139. |
| (b) | Includes cash which is being held as collateral for securities sold short in the amount of $2,316,440. |
| See Notes to Financial Statements. |
| 38 | www.jamesfunds.com |
| James Advantage Funds | Statements of Assets and Liabilities |
December 31, 2017 (Unaudited)
| James Balanced: Golden Rainbow Fund | James Small Cap Fund | James Mid Cap Fund | James Micro Cap Fund | James Aggressive Allocation Fund | James Long-Short Fund | |||||||||||||||||||
| ASSETS: | ||||||||||||||||||||||||
| Investment securities: | ||||||||||||||||||||||||
| At cost | $ | 2,576,856,900 | $ | 56,476,846 | $ | 14,876,127 | $ | 22,667,929 | $ | 9,245,628 | $ | 15,808,187 | ||||||||||||
| At value | $ | 2,936,131,678 | $ | 65,357,867 | $ | 16,290,010 | $ | 30,425,979 | $ | 10,623,514 | $ | 21,938,936 | ||||||||||||
| Cash | 35,653 | – | 1,031 | – | – | – | ||||||||||||||||||
| Deposits with brokers for securities sold short | – | – | – | – | – | 2,316,440 | ||||||||||||||||||
| Dividends and interest receivable | 10,797,938 | 44,256 | 12,619 | 29,888 | 23,644 | 27,147 | ||||||||||||||||||
| Receivable for securities sold | – | – | 53 | – | 187,794 | – | ||||||||||||||||||
| Receivable for capital shares sold | 1,357,358 | 6,234 | 100 | 280 | – | 457 | ||||||||||||||||||
| Other assets | 63,100 | – | 6 | – | 4 | – | ||||||||||||||||||
| Total Assets | 2,948,385,727 | 65,408,357 | 16,303,819 | 30,456,147 | 10,834,956 | 24,282,980 | ||||||||||||||||||
| LIABILITIES: | ||||||||||||||||||||||||
| Payable for interest expense | – | – | – | – | – | 298 | ||||||||||||||||||
| Payable for securities sold short (proceeds $–, $–, $–, $–, $– and $2,337,298, respectively) | – | – | – | – | – | 2,423,531 | ||||||||||||||||||
| Payable for dividends on securities sold short | – | – | – | – | – | 1,255 | ||||||||||||||||||
| Payable for capital shares redeemed | 5,045,808 | 15,226 | 2,295 | 6,118 | – | 2,295 | ||||||||||||||||||
| Payable for securities purchased | 807,453 | – | – | 341,946 | 134,797 | – | ||||||||||||||||||
| Accrued expenses: | ||||||||||||||||||||||||
| Management fees | 1,659,633 | 68,827 | 17,089 | 38,471 | 8,852 | 23,227 | ||||||||||||||||||
| 12b-1 distribution and service fees | 399,517 | 13,835 | 3,435 | – | – | 4,668 | ||||||||||||||||||
| Other payables | 403,049 | – | – | – | – | – | ||||||||||||||||||
| Total Liabilities | 8,315,460 | 97,888 | 22,819 | 386,535 | 143,649 | 2,455,274 | ||||||||||||||||||
| Net Assets | $ | 2,940,070,267 | $ | 65,310,469 | $ | 16,281,000 | $ | 30,069,612 | $ | 10,691,307 | $ | 21,827,706 | ||||||||||||
| NET ASSETS CONSIST OF: | ||||||||||||||||||||||||
| Paid-in capital | $ | 2,516,679,951 | $ | 50,340,153 | $ | 13,956,919 | $ | 22,980,554 | $ | 9,469,745 | $ | 15,887,982 | ||||||||||||
| Accumulated net investment income/(loss) | (391,809 | ) | (160,458 | ) | 12,629 | (4,522 | ) | 1,006 | (47,870 | ) | ||||||||||||||
| Accumulated net realized gain/(loss) | 64,504,329 | 6,249,753 | 897,571 | (664,470 | ) | (157,330 | ) | (56,921 | ) | |||||||||||||||
| Net unrealized appreciation/ (depreciation) | 359,277,796 | 8,881,021 | 1,413,881 | 7,758,050 | 1,377,886 | 6,044,515 | ||||||||||||||||||
| Net Assets | $ | 2,940,070,267 | $ | 65,310,469 | $ | 16,281,000 | $ | 30,069,612 | $ | 10,691,307 | $ | 21,827,706 | ||||||||||||
See Notes to Financial Statements.
| Semi-Annual Report | December 31, 2017 | 39 |
| Statements of Assets and Liabilities | James Advantage Funds |
December 31, 2017 (Unaudited)
| James Balanced: Golden Rainbow Fund | James Small Cap Fund | James Mid Cap Fund | James Micro Cap Fund | James Aggressive Allocation Fund | James Long-Short Fund | |||||||||||||||||||
| PRICING OF RETAIL CLASS SHARES: | ||||||||||||||||||||||||
| Net assets | $ | 1,868,990,707 | N/A | N/A | N/A | N/A | N/A | |||||||||||||||||
| Shares of beneficial interest outstanding (unlimited number of shares authorized, no par) | 77,616,591 | N/A | N/A | N/A | N/A | N/A | ||||||||||||||||||
| Net assets value, offering price and redemption price per share | $ | 24.08 | N/A | N/A | N/A | N/A | N/A | |||||||||||||||||
| PRICING OF INSTITUTIONAL CLASS SHARES: | ||||||||||||||||||||||||
| Net assets | $ | 1,071,079,560 | N/A | N/A | N/A | N/A | N/A | |||||||||||||||||
| Shares of beneficial interest outstanding (unlimited number of shares authorized, no par) | 44,978,478 | N/A | N/A | N/A | N/A | N/A | ||||||||||||||||||
| Net assets value, offering price and redemption price per share | $ | 23.81 | N/A | N/A | N/A | N/A | N/A | |||||||||||||||||
| PRICING OF SHARES | ||||||||||||||||||||||||
| Net assets | N/A | $ | 65,310,469 | $ | 16,281,000 | $ | 30,069,612 | $ | 10,691,307 | $ | 21,827,706 | |||||||||||||
| Shares of beneficial interest outstanding (unlimited number of shares authorized, no par) | N/A | 2,160,585 | 1,431,082 | 1,745,589 | 980,991 | 1,424,958 | ||||||||||||||||||
| Net assets value, offering price and redemption price per share | N/A | $ | 30.23 | $ | 11.38 | $ | 17.23 | $ | 10.90 | $ | 15.32 | |||||||||||||
See Notes to Financial Statements.
| 40 | www.jamesfunds.com |
| James Advantage Funds | Statements of Operations |
For the Six Months Ended December 31, 2017 (Unaudited)
| James Balanced: Golden Rainbow Fund | James Small Cap Fund | James Mid Cap Fund | James Micro Cap Fund | James Aggressive Allocation Fund | James Long-Short Fund | |||||||||||||||||||
| INVESTMENT INCOME: | ||||||||||||||||||||||||
| Dividends (Net of withholding taxes of $100,559, $–, $769, $1,376, $25 and $–, respectively) | $ | 13,044,615 | $ | 337,227 | $ | 146,864 | $ | 222,682 | $ | 79,381 | $ | 187,234 | ||||||||||||
| Interest | 18,399,822 | – | – | – | 25,201 | – | ||||||||||||||||||
| Total Investment Income | 31,444,437 | 337,227 | 146,864 | 222,682 | 104,582 | 187,234 | ||||||||||||||||||
| EXPENSES: | ||||||||||||||||||||||||
| Management fees | 10,370,525 | 412,673 | 96,396 | 226,084 | 50,317 | 133,388 | ||||||||||||||||||
| 12b-1 distribution and service fees -Retail Class | 2,518,026 | – | – | – | – | – | ||||||||||||||||||
| 12b-1 distribution and service fees | – | 82,947 | 19,370 | – | – | 26,807 | ||||||||||||||||||
| Dividend expense on securities sold short | – | – | – | – | – | 7,800 | ||||||||||||||||||
| Broker fees and charges on securities sold short | – | – | – | – | – | 1,464 | ||||||||||||||||||
| Administration fee | 539,029 | – | – | – | – | – | ||||||||||||||||||
| Transfer agent fee | 165,167 | – | – | – | – | – | ||||||||||||||||||
| Interest expense | – | – | – | 159 | – | – | ||||||||||||||||||
| Custodian fees | 143,500 | – | – | – | – | – | ||||||||||||||||||
| Professional fees | 111,543 | – | – | – | – | – | ||||||||||||||||||
| Trustee fees | 102,960 | 2,062 | 452 | 963 | 306 | 648 | ||||||||||||||||||
| Registration fees | 41,580 | – | – | – | – | – | ||||||||||||||||||
| Shareholder report printing and mailing | 122,531 | – | – | – | – | – | ||||||||||||||||||
| Other expenses | 57,157 | – | – | – | – | – | ||||||||||||||||||
| Total Expenses | 14,172,018 | 497,682 | 116,218 | 227,206 | 50,623 | 170,107 | ||||||||||||||||||
| Net Investment Income/(Loss) | 17,272,419 | (160,455 | ) | 30,646 | (4,524 | ) | 53,959 | 17,127 | ||||||||||||||||
| REALIZED AND UNREALIZED GAIN/(LOSS) ON INVESTMENTS: | ||||||||||||||||||||||||
| Net realized gain/(loss) from: | ||||||||||||||||||||||||
| Investments | 168,042,051 | 11,650,729 | 1,008,874 | (654,340 | ) | 314,638 | 866,519 | |||||||||||||||||
| Securities sold short | – | – | – | – | – | (25,520 | ) | |||||||||||||||||
| Foreign currency transactions | 13,551 | (95 | ) | 11 | – | – | – | |||||||||||||||||
| Total realized gain/(loss) | 168,055,602 | 11,650,634 | 1,008,885 | (654,340 | ) | 314,638 | 840,999 | |||||||||||||||||
| Net change in unrealized appreciation/(depreciation) on investments | (42,857,940 | ) | (4,235,340 | ) | 487,486 | 2,680,156 | 595,173 | 757,017 | ||||||||||||||||
| Net change in unrealized depreciation on securities sold short | – | – | – | – | – | (141,278 | ) | |||||||||||||||||
| Net change in unrealized depreciation on foreign currency translation | (5,653 | ) | (65 | ) | (2 | ) | – | – | – | |||||||||||||||
| Total change in unrealized appreciation/(depreciation) | (42,863,593 | ) | (4,235,405 | ) | 487,484 | 2,680,156 | 595,173 | 615,739 | ||||||||||||||||
| Net Realized and Unrealized Gain on Investments | 125,192,009 | 7,415,229 | 1,496,369 | 2,025,816 | 909,811 | 1,456,738 | ||||||||||||||||||
| Net Increase in Net Assets Resulting from Operations | $ | 142,464,428 | $ | 7,254,774 | $ | 1,527,015 | $ | 2,021,292 | $ | 963,770 | $ | 1,473,865 | ||||||||||||
See Notes to Financial Statements.
| Semi-Annual Report | December 31, 2017 | 41 |
| Statements of Changes in Net Assets | James Balanced: Golden Rainbow Fund |
| For the Six Months Ended December 31, 2017 (Unaudited) | For the Year Ended June 30, 2017 | |||||||
| FROM OPERATIONS: | ||||||||
| Net investment income/(loss) | $ | 17,272,419 | $ | 44,307,182 | ||||
| Net realized gain/(loss) | 168,055,602 | 180,042,507 | ||||||
| Net change in unrealized appreciation/(depreciation) | (42,863,593 | ) | (67,166,407 | ) | ||||
| Net increase in net assets resulting from operations | 142,464,428 | 157,183,282 | ||||||
| DISTRIBUTIONS TO SHAREHOLDERS: | ||||||||
| Retail Class Shares: | ||||||||
| From net investment income | (10,974,072 | ) | (29,725,195 | ) | ||||
| From net realized gain on investments | (119,580,644 | ) | (10,139,227 | ) | ||||
| Institutional Class Shares: | ||||||||
| From net investment income | (7,838,093 | ) | (20,087,654 | ) | ||||
| From net realized gain on investments | (70,483,977 | ) | (5,583,143 | ) | ||||
| Decrease in net assets from distributions to shareholders | (208,876,786 | ) | (65,535,219 | ) | ||||
| CAPITAL SHARE TRANSACTIONS: | ||||||||
| Retail Class Shares: | ||||||||
| Proceeds from shares sold | 69,673,157 | 307,631,275 | ||||||
| Net asset value of shares issued in reinvestment of distributions to shareholders | 127,048,637 | 38,471,828 | ||||||
| Payments for shares redeemed, net of redemption fees | (450,341,316 | ) | (1,134,659,577 | ) | ||||
| Net decrease in net assets from Retail Class capital share transactions | (253,619,522 | ) | (788,556,474 | ) | ||||
| Institutional Class Shares: | ||||||||
| Proceeds from shares sold | 89,479,858 | 274,252,442 | ||||||
| Net asset value of shares issued in reinvestment of distributions to shareholders | 61,934,845 | 19,458,265 | ||||||
| Payments for shares redeemed | (275,192,747 | ) | (618,481,705 | ) | ||||
| Net decrease in net assets from Institutional Class capital share transactions | (123,778,044 | ) | (324,770,998 | ) | ||||
| Total Decrease in Net Assets | (443,809,924 | ) | (1,021,679,409 | ) | ||||
| NET ASSETS: | ||||||||
| Beginning of period | 3,383,880,191 | 4,405,559,600 | ||||||
| End of period | $ | 2,940,070,267 | $ | 3,383,880,191 | ||||
| Accumulated Net Investment Income/(Loss) | $ | (391,809 | ) | $ | 1,147,937 | |||
See Notes to Financial Statements.
| 42 | www.jamesfunds.com |
| James Balanced: Golden Rainbow Fund | Statements of Changes in Net Assets |
| For the Six Months Ended December 31, 2017 (Unaudited) | For the Year Ended June 30, 2017 | |||||||
| SUMMARY OF CAPITAL SHARE ACTIVITY: | ||||||||
| Retail Class Shares: | ||||||||
| Shares sold | 2,802,763 | 12,579,499 | ||||||
| Shares issued in reinvestment of distributions to shareholders | 5,287,346 | 1,576,194 | ||||||
| Shares redeemed | (18,083,704 | ) | (46,397,523 | ) | ||||
| Net decrease in shares outstanding | (9,993,595 | ) | (32,241,830 | ) | ||||
| Shares outstanding, beginning of period | 87,610,186 | 119,852,016 | ||||||
| Shares outstanding, end of period | 77,616,591 | 87,610,186 | ||||||
| Institutional Class Shares: | ||||||||
| Shares sold | 3,648,507 | 11,324,733 | ||||||
| Shares issued in reinvestment of distributions to shareholders | 2,604,759 | 804,853 | ||||||
| Shares redeemed | (11,188,946 | ) | (25,523,675 | ) | ||||
| Net decrease in shares outstanding | (4,935,680 | ) | (13,394,089 | ) | ||||
| Shares outstanding, beginning of period | 49,914,158 | 63,308,247 | ||||||
| Shares outstanding, end of period | 44,978,478 | 49,914,158 | ||||||
See Notes to Financial Statements.
| Semi-Annual Report | December 31, 2017 | 43 |
| Statements of Changes in Net Assets | James Small Cap Fund |
| For the Six Months Ended December 31, 2017 (Unaudited) | For the Year Ended June 30, 2017 | |||||||
| FROM OPERATIONS: | ||||||||
| Net investment income/(loss) | $ | (160,455 | ) | $ | 490,070 | |||
| Net realized gain/(loss) | 11,650,634 | 16,038,130 | ||||||
| Net change in unrealized appreciation/(depreciation) | (4,235,405 | ) | (7,509,937 | ) | ||||
| Net increase in net assets resulting from operations | 7,254,774 | 9,018,263 | ||||||
| DISTRIBUTIONS TO SHAREHOLDERS: | ||||||||
| From net investment income | (407,489 | ) | (400,002 | ) | ||||
| From net realized gain on investments | (13,184,672 | ) | – | |||||
| Decrease in net assets from distributions to shareholders | (13,592,161 | ) | (400,002 | ) | ||||
| CAPITAL SHARE TRANSACTIONS: | ||||||||
| Proceeds from shares sold | 2,023,292 | 4,446,345 | ||||||
| Net asset value of shares issued in reinvestment of distributions to shareholders | 12,971,014 | 366,727 | ||||||
| Payments for shares redeemed | (10,949,336 | ) | (30,054,112 | ) | ||||
| Net increase/(decrease) in net assets from capital share transactions | 4,044,970 | (25,241,040 | ) | |||||
| Total Decrease in Net Assets | (2,292,417 | ) | (16,622,779 | ) | ||||
| NET ASSETS: | ||||||||
| Beginning of period | 67,602,886 | 84,225,665 | ||||||
| End of period | $ | 65,310,469 | $ | 67,602,886 | ||||
| Accumulated Net Investment Income/(Loss) | $ | (160,458 | ) | $ | 407,486 | |||
| SUMMARY OF CAPITAL SHARE ACTIVITY: | ||||||||
| Shares sold | 58,495 | 131,508 | ||||||
| Shares issued in reinvestment of distributions to shareholders | 436,403 | 10,227 | ||||||
| Shares redeemed | (324,897 | ) | (900,250 | ) | ||||
| Net increase/(decrease) in shares outstanding | 170,001 | (758,515 | ) | |||||
| Shares outstanding, beginning of period | 1,990,584 | 2,749,099 | ||||||
| Shares outstanding, end of period | 2,160,585 | 1,990,584 | ||||||
See Notes to Financial Statements.
| 44 | www.jamesfunds.com |
| James Mid Cap Fund | Statements of Changes in Net Assets |
| For the Six Months Ended December 31, 2017 (Unaudited) | For the Year Ended June 30, 2017 | |||||||
| FROM OPERATIONS: | ||||||||
| Net investment income/(loss) | $ | 30,646 | $ | 50,998 | ||||
| Net realized gain/(loss) | 1,008,885 | 4,757,419 | ||||||
| Net change in unrealized appreciation/(depreciation) | 487,484 | (3,363,332 | ) | |||||
| Net increase in net assets resulting from operations | 1,527,015 | 1,445,085 | ||||||
| DISTRIBUTIONS TO SHAREHOLDERS: | ||||||||
| From net investment income | (55,290 | ) | (19,996 | ) | ||||
| From net realized gain on investments | (3,523,636 | ) | (1,674,446 | ) | ||||
| Decrease in net assets from distributions to shareholders | (3,578,926 | ) | (1,694,442 | ) | ||||
| CAPITAL SHARE TRANSACTIONS: | ||||||||
| Proceeds from shares sold | 1,198,156 | 1,418,143 | ||||||
| Net asset value of shares issued in reinvestment of distributions to shareholders | 3,550,104 | 1,664,429 | ||||||
| Payments for shares redeemed | (1,274,697 | ) | (2,299,515 | ) | ||||
| Net increase in net assets from capital share transactions | 3,473,563 | 783,057 | ||||||
| Total Increase in Net Assets | 1,421,652 | 533,700 | ||||||
| NET ASSETS: | ||||||||
| Beginning of period | 14,859,348 | 14,325,648 | ||||||
| End of period | $ | 16,281,000 | $ | 14,859,348 | ||||
| Accumulated Net Investment Income | $ | 12,629 | $ | 37,273 | ||||
| SUMMARY OF CAPITAL SHARE ACTIVITY: | ||||||||
| Shares sold | 86,242 | 108,509 | ||||||
| Shares issued in reinvestment of distributions to shareholders | 315,748 | 132,072 | ||||||
| Shares redeemed | (96,702 | ) | (170,964 | ) | ||||
| Net increase in shares outstanding | 305,288 | 69,617 | ||||||
| Shares outstanding, beginning of period | 1,125,794 | 1,056,177 | ||||||
| Shares outstanding, end of period | 1,431,082 | 1,125,794 | ||||||
See Notes to Financial Statements.
| Semi-Annual Report | December 31, 2017 | 45 |
| Statements of Changes in Net Assets | James Micro Cap Fund |
| For the Six Months Ended December 31, 2017 (Unaudited) | For the Year Ended June 30, 2017 | |||||||
| FROM OPERATIONS: | ||||||||
| Net investment income/(loss) | $ | (4,524 | ) | $ | 74,351 | |||
| Net realized gain/(loss) | (654,340 | ) | 4,773,673 | |||||
| Net change in unrealized appreciation/(depreciation) | 2,680,156 | (895,775 | ) | |||||
| Net increase in net assets resulting from operations | 2,021,292 | 3,952,249 | ||||||
| DISTRIBUTIONS TO SHAREHOLDERS: | ||||||||
| From net investment income | (97,620 | ) | – | |||||
| From net realized gain on investments | (2,102,730 | ) | – | |||||
| Decrease in net assets from distributions to shareholders | (2,200,350 | ) | – | |||||
| CAPITAL SHARE TRANSACTIONS: | ||||||||
| Proceeds from shares sold | 1,316,631 | 7,818,009 | ||||||
| Net asset value of shares issued in reinvestment of distributions to shareholders | 2,177,624 | – | ||||||
| Payments for shares redeemed, net of redemption fees | (5,054,316 | ) | (6,476,089 | ) | ||||
| Net increase/(decrease) in net assets from capital share transactions | (1,560,061 | ) | 1,341,920 | |||||
| Total Increase/(Decrease) in Net Assets | (1,739,119 | ) | 5,294,169 | |||||
| NET ASSETS: | ||||||||
| Beginning of period | 31,808,731 | 26,514,562 | ||||||
| End of period | $ | 30,069,612 | $ | 31,808,731 | ||||
| Accumulated Net Investment Income/(Loss) | $ | (4,522 | ) | $ | 97,622 | |||
| SUMMARY OF CAPITAL SHARE ACTIVITY: | ||||||||
| Shares sold | 73,735 | 464,020 | ||||||
| Shares issued in reinvestment of distributions to shareholders | 126,191 | – | ||||||
| Shares redeemed | (296,286 | ) | (386,257 | ) | ||||
| Net increase/(decrease) in shares outstanding | (96,360 | ) | 77,763 | |||||
| Shares outstanding, beginning of period | 1,841,949 | 1,764,186 | ||||||
| Shares outstanding, end of period | 1,745,589 | 1,841,949 | ||||||
See Notes to Financial Statements.
| 46 | www.jamesfunds.com |
| James Aggressive Allocation Fund | Statements of Changes in Net Assets |
| For the Six Months Ended December 31, 2017 (Unaudited) | For the Year Ended June 30, 2017 | |||||||
| FROM OPERATIONS: | ||||||||
| Net investment income/(loss) | $ | 53,959 | $ | 85,250 | ||||
| Net realized gain/(loss) | 314,638 | 62,289 | ||||||
| Net change in unrealized appreciation/(depreciation) | 595,173 | 415,138 | ||||||
| Net increase in net assets resulting from operations | 963,770 | 562,677 | ||||||
| DISTRIBUTIONS TO SHAREHOLDERS: | ||||||||
| From net investment income | (75,908 | ) | (84,996 | ) | ||||
| Decrease in net assets from distributions to shareholders | (75,908 | ) | (84,996 | ) | ||||
| CAPITAL SHARE TRANSACTIONS: | ||||||||
| Proceeds from shares sold | 196,101 | 2,828,998 | ||||||
| Net asset value of shares issued in reinvestment of distributions to shareholders | 75,908 | 84,996 | ||||||
| Payments for shares redeemed | (422,683 | ) | (609,188 | ) | ||||
| Net increase/(decrease) in net assets from capital share transactions | (150,674 | ) | 2,304,806 | |||||
| Total Increase in Net Assets | 737,188 | 2,782,487 | ||||||
| NET ASSETS: | ||||||||
| Beginning of period | 9,954,119 | 7,171,632 | ||||||
| End of period | $ | 10,691,307 | $ | 9,954,119 | ||||
| Accumulated Net Investment Income | $ | 1,006 | $ | 22,955 | ||||
| SUMMARY OF CAPITAL SHARE ACTIVITY: | ||||||||
| Shares sold | 18,992 | 291,401 | ||||||
| Shares issued in reinvestment of distributions to shareholders | 6,932 | 8,577 | ||||||
| Shares redeemed | (40,728 | ) | (61,509 | ) | ||||
| Net increase/(decrease) in shares outstanding | (14,804 | ) | 238,469 | |||||
| Shares outstanding, beginning of period | 995,795 | 757,326 | ||||||
| Shares outstanding, end of period | 980,991 | 995,795 | ||||||
See Notes to Financial Statements.
| Semi-Annual Report | December 31, 2017 | 47 |
| Statements of Changes in Net Assets | James Long-Short Fund |
| For the Six Months Ended December 31, 2017 (Unaudited) | For the Year Ended June 30, 2017 | |||||||
| FROM OPERATIONS: | ||||||||
| Net investment income/(loss) | $ | 17,127 | $ | 89,674 | ||||
| Net realized gain/(loss) | 840,999 | 1,332,216 | ||||||
| Net change in unrealized appreciation/(depreciation) | 615,739 | 751,160 | ||||||
| Net increase in net assets resulting from operations | 1,473,865 | 2,173,050 | ||||||
| DISTRIBUTIONS TO SHAREHOLDERS: | ||||||||
| From net investment income | (64,997 | ) | – | |||||
| Decrease in net assets from distributions to shareholders | (64,997 | ) | – | |||||
| CAPITAL SHARE TRANSACTIONS: | ||||||||
| Proceeds from shares sold | 1,160,168 | 503,629 | ||||||
| Net asset value of shares issued in reinvestment of distributions to shareholders | 64,533 | – | ||||||
| Payments for shares redeemed | (2,264,986 | ) | (5,922,071 | ) | ||||
| Net decrease in net assets from capital share transactions | (1,040,285 | ) | (5,418,442 | ) | ||||
| Total Increase/(Decrease) in Net Assets | 368,583 | (3,245,392 | ) | |||||
| NET ASSETS: | ||||||||
| Beginning of period | 21,459,123 | 24,704,515 | ||||||
| End of period | $ | 21,827,706 | $ | 21,459,123 | ||||
| Accumulated Net Investment Loss | $ | (47,870 | ) | $ | – | |||
| SUMMARY OF CAPITAL SHARE ACTIVITY: | ||||||||
| Shares sold | 78,747 | 37,695 | ||||||
| Shares issued in reinvestment of distributions to shareholders | 4,190 | – | ||||||
| Shares redeemed | (156,101 | ) | (442,700 | ) | ||||
| Net decrease in shares outstanding | (73,164 | ) | (405,005 | ) | ||||
| Shares outstanding, beginning of period | 1,498,122 | 1,903,127 | ||||||
| Shares outstanding, end of period | 1,424,958 | 1,498,122 | ||||||
See Notes to Financial Statements.
| 48 | www.jamesfunds.com |
| James Balanced: Golden Rainbow Fund – Retail Class | Financial Highlights |
For a share outstanding throughout the years or period indicated.
| For the Six Months Ended December 31, 2017 (Unaudited) | For the Year Ended June 30, 2017 | For the Year Ended June 30, 2016 | For the Year Ended June 30, 2015 | For the Year Ended June 30, 2014 | For the Year Ended June 30, 2013 | |||||||||||||||||||
| Net asset value - beginning of year | $ | 24.70 | $ | 24.14 | $ | 24.96 | $ | 25.28 | $ | 22.55 | $ | 20.93 | ||||||||||||
| Income/(Loss) from investment operations: | ||||||||||||||||||||||||
| Net investment income(a) | 0.13 | 0.25 | 0.25 | 0.22 | 0.24 | 0.32 | ||||||||||||||||||
| Net realized and unrealized gain/(loss) | 1.00 | 0.68 | (0.41 | ) | 0.49 | 2.96 | 1.75 | |||||||||||||||||
| Total from investment operations | 1.13 | 0.93 | (0.16 | ) | 0.71 | 3.20 | 2.07 | |||||||||||||||||
| Less distributions: | ||||||||||||||||||||||||
| From net investment income | (0.14 | ) | (0.28 | ) | (0.23 | ) | (0.18 | ) | (0.24 | ) | (0.30 | ) | ||||||||||||
| From net realized gain on investments | (1.61 | ) | (0.09 | ) | (0.43 | ) | (0.85 | ) | (0.23 | ) | (0.15 | ) | ||||||||||||
| Total distributions | (1.75 | ) | (0.37 | ) | (0.66 | ) | (1.03 | ) | (0.47 | ) | (0.45 | ) | ||||||||||||
| Paid-in capital from redemption fees | – | 0.00 | (b) | – | – | – | – | |||||||||||||||||
| Net asset value at end of year | $ | 24.08 | $ | 24.70 | $ | 24.14 | $ | 24.96 | $ | 25.28 | $ | 22.55 | ||||||||||||
| Total return | 4.62 | %(c) | 3.92 | % | (0.64 | )% | 2.90 | % | 14.32 | % | 9.98 | % | ||||||||||||
| Net assets, end of year (in thousands) | $ | 1,868,991 | $ | 2,163,786 | $ | 2,892,809 | $ | 2,973,350 | $ | 2,493,030 | $ | 1,735,736 | ||||||||||||
| Ratios/Supplemental Data: | ||||||||||||||||||||||||
| Ratio of net expenses to average net assets | 0.99 | %(d) | 0.96 | % | 0.96 | % | 0.97 | % | 1.00 | % | 1.04 | % | ||||||||||||
| Ratio of net investment income to average net assets | 1.00 | %(d) | 1.02 | % | 1.03 | % | 0.87 | % | 0.99 | % | 1.45 | % | ||||||||||||
| Portfolio turnover rate | 38 | %(c) | 46 | % | 46 | % | 43 | % | 32 | % | 58 | % | ||||||||||||
| (a) | Calculated using the average shares method. |
| (b) | Amount rounds to less than $0.005 per share. |
| (c) | Not Annualized. |
| (d) | Annualized. |
See Notes to Financial Statements.
| Semi-Annual Report | December 31, 2017 | 49 |
| Financial Highlights | James Balanced: Golden Rainbow Fund – Institutional Class |
For a share outstanding throughout the years or period indicated.
| For the Six Months Ended December 31, 2017 (Unaudited) | For the Year Ended June 30, 2017 | For the Year Ended June 30, 2016 | For the Year Ended June 30, 2015 | For the Year Ended June 30, 2014 | For the Year Ended June 30, 2013 | |||||||||||||||||||
| Net asset value - beginning of year | $ | 24.44 | $ | 23.89 | $ | 24.72 | $ | 25.05 | $ | 22.35 | $ | 20.81 | ||||||||||||
| Income/(Loss) from investment operations: | ||||||||||||||||||||||||
| Net investment income(a) | 0.16 | 0.31 | 0.31 | 0.28 | 0.29 | 0.38 | ||||||||||||||||||
| Net realized and unrealized gain/(loss) | 0.99 | 0.68 | (0.42 | ) | 0.50 | 2.94 | 1.73 | |||||||||||||||||
| Total from investment operations | 1.15 | 0.99 | (0.11 | ) | 0.78 | 3.23 | 2.11 | |||||||||||||||||
| Less distributions: | ||||||||||||||||||||||||
| From net investment income | (0.17 | ) | (0.35 | ) | (0.29 | ) | (0.26 | ) | (0.30 | ) | (0.42 | ) | ||||||||||||
| From net realized gain on investments | (1.61 | ) | (0.09 | ) | (0.43 | ) | (0.85 | ) | (0.23 | ) | (0.15 | ) | ||||||||||||
| Total distributions | (1.78 | ) | (0.44 | ) | (0.72 | ) | (1.11 | ) | (0.53 | ) | (0.57 | ) | ||||||||||||
| Paid-in capital from redemption fees | – | 0.00 | (b) | – | – | – | 0.00 | (b) | ||||||||||||||||
| Net asset value at end of year | $ | 23.81 | $ | 24.44 | $ | 23.89 | $ | 24.72 | $ | 25.05 | $ | 22.35 | ||||||||||||
| Total return | 4.76 | %(c) | 4.19 | % | (0.43 | )% | 3.20 | % | 14.59 | % | 10.26 | % | ||||||||||||
| Net assets, end of year (in thousands) | $ | 1,071,080 | $ | 1,220,095 | $ | 1,512,751 | $ | 1,277,641 | $ | 805,973 | $ | 555,766 | ||||||||||||
| Ratios/Supplemental Data: | ||||||||||||||||||||||||
| Ratio of net expenses to average net assets | 0.74 | %(d) | 0.71 | % | 0.71 | % | 0.73 | % | 0.75 | % | 0.79 | % | ||||||||||||
| Ratio of net investment income to average net assets | 1.25 | %(d) | 1.27 | % | 1.28 | % | 1.11 | % | 1.24 | % | 1.71 | % | ||||||||||||
| Portfolio turnover rate | 38 | %(c) | 46 | % | 46 | % | 43 | % | 32 | % | 58 | % | ||||||||||||
| (a) | Calculated using the average shares method. |
| (b) | Amount rounds to less than $0.005 per share. |
| (c) | Not Annualized. |
| (d) | Annualized. |
See Notes to Financial Statements.
| 50 | www.jamesfunds.com |
| James Small Cap Fund | Financial Highlights |
For a share outstanding throughout the years or period indicated.
| For the Six Months Ended December 31, 2017 (Unaudited) | For the Year Ended June 30, 2017 | For the Year Ended June 30, 2016 | For the Year Ended June 30, 2015 | For the Year Ended June 30, 2014 | For the Year Ended June 30, 2013 | |||||||||||||||||||
| Net asset value - beginning of year | $ | 33.96 | $ | 30.64 | $ | 33.47 | $ | 33.88 | $ | 28.66 | $ | 23.89 | ||||||||||||
| Income/(Loss) from investment operations: | ||||||||||||||||||||||||
| Net investment income/(loss)(a) | (0.08 | ) | 0.21 | 0.17 | 0.01 | (0.00 | )(b) | 0.36 | ||||||||||||||||
| Net realized and unrealized gain/(loss) | 3.90 | 3.28 | (1.64 | ) | (0.42 | ) | 6.12 | 4.92 | ||||||||||||||||
| Total from investment operations | 3.82 | 3.49 | (1.47 | ) | (0.41 | ) | 6.12 | 5.28 | ||||||||||||||||
| Less distributions: | ||||||||||||||||||||||||
| From net investment income | (0.19 | ) | (0.17 | ) | (0.12 | ) | – | (0.90 | ) | (0.51 | ) | |||||||||||||
| From net realized gain on investments | (7.36 | ) | – | (1.24 | ) | – | – | – | ||||||||||||||||
| Total distributions | (7.55 | ) | (0.17 | ) | (1.36 | ) | – | (0.90 | ) | (0.51 | ) | |||||||||||||
| Net asset value at end of year | $ | 30.23 | $ | 33.96 | $ | 30.64 | $ | 33.47 | $ | 33.88 | $ | 28.66 | ||||||||||||
| Total return | 11.78 | %(c) | 11.36 | % | (4.62 | )% | (1.21 | )% | 21.46 | % | 22.51 | % | ||||||||||||
| Net assets, end of year (in thousands) | $ | 65,310 | $ | 67,603 | $ | 84,226 | $ | 125,145 | $ | 163,537 | $ | 161,271 | ||||||||||||
| Ratios/Supplemental Data: | ||||||||||||||||||||||||
| Ratio of net expenses to average net assets | 1.50 | %(d) | 1.50 | % | 1.50 | % | 1.50 | % | 1.50 | % | 1.50 | % | ||||||||||||
| Ratio of net investment income/(loss) to average net assets | (0.48 | )%(d) | 0.62 | % | 0.55 | % | 0.04 | % | (0.00 | )%(e) | 1.39 | % | ||||||||||||
| Portfolio turnover rate | 110 | %(c) | 129 | % | 57 | % | 76 | % | 62 | % | 41 | % | ||||||||||||
| (a) | Calculated using the average shares method. |
| (b) | Amount rounds to less than ($0.005) per share. |
| (c) | Not Annualized. |
| (d) | Annualized. |
| (e) | Amount rounds to less than (0.005%). |
See Notes to Financial Statements.
| Semi-Annual Report | December 31, 2017 | 51 |
| Financial Highlights | James Mid Cap Fund |
For a share outstanding throughout the years or period indicated.
| For the Six Months Ended December 31, 2017 (Unaudited) | For the Year Ended June 30, 2017 | For the Year Ended June 30, 2016 | For the Year Ended June 30, 2015 | For the Year Ended June 30, 2014 | For the Year Ended June 30, 2013 | |||||||||||||||||||
| Net asset value - beginning of year | $ | 13.20 | $ | 13.56 | $ | 14.86 | $ | 16.42 | $ | 12.97 | $ | 10.69 | ||||||||||||
| Income/(Loss) from investment operations: | ||||||||||||||||||||||||
| Net investment income/(loss)(a) | 0.03 | 0.05 | 0.08 | (0.02 | ) | 0.01 | 0.08 | |||||||||||||||||
| Net realized and unrealized gain/(loss) | 1.32 | 1.29 | (0.42 | ) | (0.15 | ) | 3.87 | 2.23 | ||||||||||||||||
| Total from investment operations | 1.35 | 1.34 | (0.34 | ) | (0.17 | ) | 3.88 | 2.31 | ||||||||||||||||
| Less distributions: | ||||||||||||||||||||||||
| From net investment income | (0.04 | ) | (0.02 | ) | (0.05 | ) | (0.01 | ) | (0.04 | ) | (0.03 | ) | ||||||||||||
| From net realized gain on investments | (3.13 | ) | (1.68 | ) | (0.91 | ) | (1.38 | ) | (0.39 | ) | – | |||||||||||||
| Total distributions | (3.17 | ) | (1.70 | ) | (0.96 | ) | (1.39 | ) | (0.43 | ) | (0.03 | ) | ||||||||||||
| Net asset value at end of year | $ | 11.38 | $ | 13.20 | $ | 13.56 | $ | 14.86 | $ | 16.42 | $ | 12.97 | ||||||||||||
| Total return | 10.58 | %(b) | 10.50 | % | (2.46 | )% | (0.86 | )% | 30.34 | % | 21.68 | % | ||||||||||||
| Net assets, end of year (in thousands) | $ | 16,281 | $ | 14,859 | $ | 14,326 | $ | 21,190 | $ | 18,631 | $ | 14,643 | ||||||||||||
| Ratios/Supplemental Data: | ||||||||||||||||||||||||
| Ratio of net expenses to average net assets | 1.50 | %(c) | 1.50 | % | 1.50 | % | 1.50 | % | 1.50 | % | 1.50 | % | ||||||||||||
| Ratio of net investment income/(loss) to average net assets | 0.40 | %(c) | 0.35 | % | 0.54 | % | (0.13 | )% | 0.05 | % | 0.64 | % | ||||||||||||
| Portfolio turnover rate | 73 | %(b) | 150 | % | 47 | % | 50 | % | 31 | % | 26 | % | ||||||||||||
| (a) | Calculated using the average shares method. |
| (b) | Not Annualized. |
| (c) | Annualized. |
See Notes to Financial Statements.
| 52 | www.jamesfunds.com |
| James Micro Cap Fund | Financial Highlights |
For a share outstanding throughout the years or period indicated.
| For the Six Months Ended December 31, 2017 (Unaudited) | For the Year Ended June 30, 2017 | For the Year Ended June 30, 2016 | For the Year Ended June 30, 2015 | For the Year Ended June 30, 2014 | For the Year Ended June 30, 2013 | |||||||||||||||||||
| Net asset value - beginning of year | $ | 17.27 | $ | 15.03 | $ | 15.11 | $ | 17.40 | $ | 13.96 | $ | 11.71 | ||||||||||||
| Income/(Loss) from investment operations: | ||||||||||||||||||||||||
| Net investment income/(loss)(a) | (0.00 | )(b) | 0.04 | (0.04 | ) | 0.06 | (0.05 | ) | 0.14 | |||||||||||||||
| Net realized and unrealized gain/(loss) | 1.31 | 2.20 | (0.06 | ) | 1.12 | 3.50 | 2.25 | |||||||||||||||||
| Total from investment operations | 1.31 | 2.24 | (0.10 | ) | 1.18 | 3.45 | 2.39 | |||||||||||||||||
| Less distributions: | ||||||||||||||||||||||||
| From net investment income | (0.06 | ) | – | (0.01 | ) | (0.02 | ) | (0.01 | ) | (0.14 | ) | |||||||||||||
| From net realized gain on investments | (1.29 | ) | – | – | (3.45 | ) | – | – | ||||||||||||||||
| Total distributions | (1.35 | ) | – | (0.01 | ) | (3.47 | ) | (0.01 | ) | (0.14 | ) | |||||||||||||
| Paid-in capital from redemption fees | 0.00 | (c) | 0.00 | (c) | 0.03 | 0.00 | (c) | 0.00 | (c) | 0.00 | (c) | |||||||||||||
| Net asset value at end of year | $ | 17.23 | $ | 17.27 | $ | 15.03 | $ | 15.11 | $ | 17.40 | $ | 13.96 | ||||||||||||
| Total return | 7.57 | %(d) | 14.90 | % | (0.44 | )% | 7.95 | % | 24.75 | % | 20.64 | % | ||||||||||||
| Net assets, end of year (in thousands) | $ | 30,070 | $ | 31,809 | $ | 26,515 | $ | 24,026 | $ | 16,256 | $ | 11,817 | ||||||||||||
| Ratios/Supplemental Data: | ||||||||||||||||||||||||
| Ratio of net expenses to average net assets | 1.50 | %(e) | 1.50 | % | 1.50 | % | 1.50 | % | 1.50 | % | 1.50 | % | ||||||||||||
| Ratio of net investment income/(loss) to average net assets | (0.03 | )%(e) | 0.23 | % | (0.24 | )% | 0.38 | % | (0.31 | )% | 1.12 | % | ||||||||||||
| Portfolio turnover rate | 19 | %(d) | 97 | % | 44 | % | 52 | % | 96 | % | 46 | % | ||||||||||||
| (a) | Calculated using the average shares method. |
| (b) | Amount rounds to less than ($0.005) per share. |
| (c) | Amount rounds to less than $0.005 per share. |
| (d) | Not Annualized. |
| (e) | Annualized. |
See Notes to Financial Statements.
| Semi-Annual Report | December 31, 2017 | 53 |
| Financial Highlights | James Aggressive Allocation Fund |
For a share outstanding throughout the years or period indicated.
| For the Six Months Ended December 31, 2017 (Unaudited) | For the Year Ended June 30, 2017 | For the Year Ended June 30, 2016(a) | ||||||||||
| Net asset value - beginning of year | $ | 10.00 | $ | 9.47 | $ | 10.00 | ||||||
| Income/(Loss) from investment operations: | ||||||||||||
| Net investment income(b) | 0.05 | 0.09 | 0.07 | |||||||||
| Net realized and unrealized gain/(loss) | 0.93 | 0.53 | (0.57 | ) | ||||||||
| Total from investment operations | 0.98 | 0.62 | (0.50 | ) | ||||||||
| Less distributions: | ||||||||||||
| From net investment income | (0.08 | ) | (0.09 | ) | (0.03 | ) | ||||||
| Total distributions | (0.08 | ) | (0.09 | ) | (0.03 | ) | ||||||
| Net asset value at end of year | $ | 10.90 | $ | 10.00 | $ | 9.47 | ||||||
| Total return | 9.78 | %(c) | 6.54 | % | (4.98 | )% | ||||||
| Net assets, end of year (in thousands) | $ | 10,691 | $ | 9,954 | $ | 7,172 | ||||||
| Ratios/Supplemental Data: | ||||||||||||
| Ratio of net expenses to average net assets | 0.98 | %(d) | 0.98 | % | 0.98 | % | ||||||
| Ratio of net investment income to average net assets | 1.04 | %(d) | 0.95 | % | 0.81 | % | ||||||
| Portfolio turnover rate | 122 | %(c) | 198 | % | 218 | % | ||||||
| (a) | Fund commenced operations on July 1, 2015. |
| (b) | Calculated using the average shares method. |
| (c) | Not Annualized. |
| (d) | Annualized. |
See Notes to Financial Statements.
| 54 | www.jamesfunds.com |
| James Long-Short Fund | Financial Highlights |
For a share outstanding throughout the years or period indicated.
| For the Six Months Ended December 31, 2017 (Unaudited) | For the Year Ended June 30, 2017 | For the Year Ended June 30, 2016 | For the Year Ended June 30, 2015 | For the Year Ended June 30, 2014 | For the Year Ended June 30, 2013 | |||||||||||||||||||
| Net asset value - beginning of year | $ | 14.32 | $ | 12.98 | $ | 13.24 | $ | 13.80 | $ | 11.70 | $ | 9.99 | ||||||||||||
| Income/(Loss) from investment operations: | ||||||||||||||||||||||||
| Net investment income/(loss)(a) | 0.01 | 0.05 | (0.09 | ) | (0.13 | ) | (0.06 | ) | 0.04 | |||||||||||||||
| Net realized and unrealized gain/(loss) | 1.04 | 1.29 | (0.17 | ) | (0.43 | ) | 2.16 | 1.71 | ||||||||||||||||
| Total from investment operations | 1.05 | 1.34 | (0.26 | ) | (0.56 | ) | 2.10 | 1.75 | ||||||||||||||||
| Less distributions: | ||||||||||||||||||||||||
| From net investment income | (0.05 | ) | – | – | – | – | (0.04 | ) | ||||||||||||||||
| Total distributions | (0.05 | ) | – | – | – | – | (0.04 | ) | ||||||||||||||||
| Net asset value at end of year | $ | 15.32 | $ | 14.32 | $ | 12.98 | $ | 13.24 | $ | 13.80 | $ | 11.70 | ||||||||||||
| Total return | 7.30 | %(b) | 10.32 | % | (1.96 | )% | (4.06 | )% | 17.95 | % | 17.57 | % | ||||||||||||
| Net assets, end of year (in thousands) | $ | 21,828 | $ | 21,459 | $ | 24,705 | $ | 33,890 | $ | 23,446 | $ | 15,694 | ||||||||||||
| Ratios/Supplemental Data: | ||||||||||||||||||||||||
| Ratio of net expenses to average net assets(c) | 1.59 | %(d) | 1.56 | % | 2.50 | % | 2.70 | % | 2.57 | % | 2.70 | % | ||||||||||||
| Ratio of net investment income/(loss) to average net assets | 0.16 | %(d) | 0.40 | % | (0.70 | )% | (0.92 | )% | (0.44 | )% | 0.35 | % | ||||||||||||
| Portfolio turnover rate | 11 | %(b) | 38 | % | 49 | % | 117 | % | 171 | % | 58 | % | ||||||||||||
| (a) | Calculated using the average shares method. |
| (b) | Not Annualized. |
| (c) | Dividend and interest expense on securities sold short totaled 0.09%, 0.06%, 1.00%, 1.20%, 1.07% and 1.20% of average net assets for the six months ended December 31, 2017 and the years ended June 30, 2017, June 30, 2016, June 30, 2015, June 30, 2014 and June 30, 2013, respectively. |
| (d) | Annualized. |
See Notes to Financial Statements.
| Semi-Annual Report | December 31, 2017 | 55 |
| Notes to Financial Statements | James Advantage Funds |
| December 31, 2017 (Unaudited) |
| 1. ORGANIZATION |
James Advantage Funds (the “Trust”) is an open-end management investment company that was organized as an Ohio business trust on August 29, 1997. The Trust is registered under the Investment Company Act of 1940, as amended (the “1940 Act”). James Balanced: Golden Rainbow Fund, James Small Cap Fund, James Mid Cap Fund, James Micro Cap Fund, James Aggressive Allocation Fund, and James Long-Short Fund are each a diversified series of the Trust (individually a “Fund,” collectively the “Funds”). Each class of James Balanced: Golden Rainbow Fund represents an interest in the same portfolio of investments and has the same rights, but differs primarily in distribution fees and shareholder features. The Retail Class shares are subject to distribution (12b-1) fees but have a lower minimum investment requirement and offer certain shareholder services not available to Institutional Class shareholders. The Institutional Class shares are not subject to distribution (12b-1) fees and are available only through investment advisers and bank trust departments that have made arrangements for shares of all of their clients investing in the Fund to be held in an omnibus account (as well as other investors that are approved by management of the Trust). The James Balanced: Golden Rainbow Fund registered T Class Shares with the Securities and Exchange Commission on April 3, 2017. As of December 31, 2017, the James Balanced: Golden Rainbow Fund has not offered T Class Shares to shareholders and as such, no financial data is included within this annual report.
James Balanced: Golden Rainbow Fund seeks to provide total return through a combination of growth and income and preservation of capital in declining markets. The James Balanced: Golden Rainbow Fund seeks to achieve its objective by investing primarily in common stocks and/or debt securities that the Fund’s adviser, James Investment Research, Inc. (“James” or the “Adviser”), believes are undervalued.
James Small Cap Fund seeks to provide long-term capital appreciation. The James Small Cap Fund seeks to achieve its objective by investing primarily in common stocks of small capitalization companies. The Adviser defines small capitalization as those companies with market capitalizations at the time of purchase no larger than the stocks in the James Small Cap Fund’s benchmark, the Russell 2000® Index. As of December 31, 2017, the stock with the maximum capitalization in the Russell 2000® Index had a capitalization of $9.40 billion.
James Mid Cap Fund seeks to provide long-term capital appreciation. The James Mid Cap Fund seeks to achieve its objective by investing primarily in common stocks of mid capitalization companies. The Adviser defines mid capitalization companies as those with market capitalizations at the time of purchase that fall within the range of the S&P MidCap 400® Value Index. As of December 31, 2017, the stock with the maximum capitalization in the S&P MidCap 400® Value Index had a capitalization of $12.52 billion.
James Micro Cap Fund seeks to provide long-term capital appreciation. The James Micro Cap Fund seeks to achieve its objective by investing primarily in common stocks of micro capitalization companies. Micro capitalization companies are defined as those companies with market capitalizations at the time of purchase no larger than the stocks in the Russell Microcap® Index, including exchange traded funds (“ETFs”) that invest primarily in such securities. As of December 31, 2017, the stock with the maximum capitalization in the Russell Microcap® Index had a capitalization of $2.46 billion.
James Aggressive Allocation Fund seeks to provide total return through a combination of growth and income. Preservation of capital in declining markets is a secondary objective. The James Aggressive Allocation Fund will generally run equity allocations of 60% or higher and, therefore, could be more volatile than a more conservative fund that holds a smaller percentage of its assets in stocks. Due to its aggressive nature, the James Aggressive Allocation Fund will generally have a turnover ratio much higher than the James Balanced: Golden Rainbow Fund.
James Long-Short Fund seeks to provide long-term capital appreciation. The James Long-Short Fund seeks to achieve its objective by investing primarily in foreign and domestic equity securities that the Adviser believes are undervalued and more likely to appreciate, and by selling short equity securities that the Adviser believes are overvalued and more likely to depreciate. The James Long-Short Fund also may take long positions in domestic and foreign fixed income securities that the Adviser believes are more likely to appreciate in the interest rate and spread environment anticipated by the Adviser, and short positions in fixed income securities that the Adviser believes are more likely to depreciate in the interest rate and spread environment anticipated by the Adviser. The James Long-Short Fund seeks to achieve positive returns on both the long positions and short positions that it takes in various securities.
| 2. SIGNIFICANT ACCOUNTING POLICIES |
The following is a summary of significant accounting policies followed by the Funds in preparation of their financial statements, in accordance with accounting principles generally accepted in the United States of America (“GAAP”). The Funds are considered an investment company for financial reporting purposes under GAAP.
Share Valuation
The net asset value per share of each Fund, other than the James Balanced: Golden Rainbow Fund, is calculated daily by dividing the total value of the Fund’s assets, less liabilities, by the number of shares outstanding. The net asset value per share of each class of shares of the James Balanced: Golden Rainbow Fund is calculated daily by dividing the total value of the Fund’s assets attributable to that class, less liabilities attributable to that class, by the number of outstanding shares of that class. The offering price and redemption price per share is equal to the net asset value per share, except that shares of the James Micro Cap Fund are subject to a redemption fee of 2% if redeemed within 180 days of purchase. Redemption fees received by the James Micro Cap Fund were $5,902 and $5,848 for the six months ended December 31, 2017 and for the year ended June 30, 2017, respectively. The redemption fee is reflected in the “Payment for shares redeemed, net of redemption fees” in the Statements of Changes in Net Assets.
Securities Valuation
Securities are valued at fair value. The Funds' portfolio securities, including short positions, are valued as of the close of the New York Stock Exchange (“NYSE”) (generally, 4:00 p.m., Eastern time) on each day that the NYSE is open for business. Equity securities that are traded on any exchange, including closed-end funds and exchange-traded funds, are valued at the last quoted sale price on the exchange or market in which such securities are principally traded. Lacking a last sale price, a security is valued at its last bid price except when, in James’s opinion, the last bid price does not accurately reflect the current value of the security. Securities that are traded on the NASDAQ® over-the-counter market are valued at their NASDAQ® Official Closing Price (“NOCP”) for all NASDAQ® National Market (“NNM”) and NASDAQ® Capital Market® securities. When market quotations are not readily available, if an event occurs after the close of the trading market (but before the time as of which a Fund calculates its net asset value) that materially affects a security’s value, when James determines that the market quotation does not accurately reflect the current value or when a non-144A restricted security is being valued, that security will be valued at its fair value as determined in good faith in conformity with guidelines adopted by and subject to review of the Board of Trustees (the “Board”). Corporate bonds, U.S. government agencies, U.S. Treasury bonds & notes, foreign, and municipal bonds are generally valued at the mean between the closing bid and asked prices provided by an independent pricing service. The pricing services generally use market models that consider trade data, yields, spreads, quotations from dealers and active market makers, credit worthiness, market information of comparable securities, and other relevant security specific information. Asset backed/commercial mortgage backed securities are generally valued at the mean between the closing bid and asked prices provided by an independent pricing service. The pricing service generally uses models that consider trade data, prepayment, and default projections, benchmark yield and spread data and estimated cash flows of each tranche of the issuer. If the Adviser decides that a price provided by the pricing service does not accurately reflect the fair market value of the securities or when prices are not readily available from a pricing service, those securities will be priced at fair value as determined in good faith by the Adviser. Shares of open-end investment companies are valued at net asset value.
| 56 | www.jamesfunds.com |
| James Advantage Funds | Notes to Financial Statements |
| December 31, 2017 (Unaudited) |
For valuation purposes, quotations of foreign securities in a foreign currency are converted to U.S. dollar equivalents at the time of pricing the Funds. The values of foreign portfolio securities are generally based upon market quotations which, depending upon the exchange or market, may be last sale price, last bid price or the average of the last bid and asked prices as of, in each case, the close of the appropriate exchange or another designated time.
In accordance with the Trust’s good faith pricing guidelines, James is required to consider all appropriate factors relevant to the value of securities for which it has determined other pricing sources are not available or reliable as described above. There is no single standard for determining fair value, since fair value depends upon the circumstances of each individual case. As a general principle, the current fair value of an issue of securities being valued by the Adviser would appear to be the amount that the owner might reasonably expect to receive for them upon their current sale. Methods which are in accordance with this principle may, for example, be based on (i) a multiple of earnings, (ii) a discount from market of a similar freely traded security (including a derivative security or a basket of securities traded on other markets, exchanges or among dealers), or (iii) yield to maturity with respect to debt issues, or a combination of these and other methods.
Various inputs are used in determining the value of the Funds’ investments. These inputs are summarized in the three broad levels listed below:
| Level 1 - | Unadjusted quoted prices in active markets for identical, unrestricted assets or liabilities that a Fund has the ability to access at the measurement date; |
| Level 2 - | Quoted prices which are not active, quoted prices for similar assets or liabilities in active markets or inputs other than quoted prices that are observable (either directly or indirectly) for substantially the full term of the asset or liability; or |
| Level 3 - | Significant unobservable prices or inputs (including a Fund’s own assumptions in determining the fair value of investments) where there is little or no market activity for the asset or liability at the measurement date. |
The inputs or methodologies used for valuing securities are not necessarily an indication of the risk associated with investing in those securities. Generally, amortized cost approximates the current fair value of a security, but since the value is not obtained from a quoted price in an active market, such securities are reflected as Level 2.
| Semi-Annual Report | December 31, 2017 | 57 |
| Notes to Financial Statements | James Advantage Funds |
| December 31, 2017 (Unaudited) |
The following is a summary of the inputs used to value the Funds’ investments as of December 31, 2017:
James Balanced: Golden Rainbow Fund
| Valuation Inputs | ||||||||||||||||
| Investments in Securities at Value* | Level 1 | Level 2 | Level 3 | Total | ||||||||||||
| Common Stocks | $ | 1,271,571,277 | $ | – | $ | – | $ | 1,271,571,277 | ||||||||
| Exchange Traded Funds | 23,113,330 | – | – | 23,113,330 | ||||||||||||
| Corporate Bonds | – | 342,992,147 | – | 342,992,147 | ||||||||||||
| Municipal Bonds | – | 197,500,063 | – | 197,500,063 | ||||||||||||
| U.S. Government Agencies | 4,987,780 | 244,373,425 | – | 249,361,205 | ||||||||||||
| Mortgage Backed Securities | – | 29,341,229 | – | 29,341,229 | ||||||||||||
| U.S. Treasury Bonds & Notes | 751,710,185 | – | – | 751,710,185 | ||||||||||||
| Foreign Bonds | – | 26,744,787 | – | 26,744,787 | ||||||||||||
| Short Term Investments | 43,797,455 | – | – | 43,797,455 | ||||||||||||
| Total | $ | 2,095,180,027 | $ | 840,951,651 | $ | – | $ | 2,936,131,678 | ||||||||
James Small Cap Fund
| Valuation Inputs | ||||||||||||||||
| Investments in Securities at Value* | Level 1 | Level 2 | Level 3 | Total | ||||||||||||
| Common Stocks | $ | 64,388,274 | $ | – | $ | – | $ | 64,388,274 | ||||||||
| Short Term Investments | 969,593 | – | – | 969,593 | ||||||||||||
| Total | $ | 65,357,867 | $ | – | $ | – | $ | 65,357,867 | ||||||||
James Mid Cap Fund
| Valuation Inputs | ||||||||||||||||
| Investments in Securities at Value* | Level 1 | Level 2 | Level 3 | Total | ||||||||||||
| Common Stocks | $ | 15,974,910 | $ | – | $ | – | $ | 15,974,910 | ||||||||
| Short Term Investments | 315,100 | – | – | 315,100 | ||||||||||||
| Total | $ | 16,290,010 | $ | – | $ | – | $ | 16,290,010 | ||||||||
James Micro Cap Fund
| Valuation Inputs | ||||||||||||||||
| Investments in Securities at Value* | Level 1 | Level 2 | Level 3 | Total | ||||||||||||
| Common Stocks | $ | 30,063,709 | $ | – | $ | – | $ | 30,063,709 | ||||||||
| Short Term Investments | 362,270 | – | – | 362,270 | ||||||||||||
| Total | $ | 30,425,979 | $ | – | $ | – | $ | 30,425,979 | ||||||||
James Aggressive Allocation Fund
| Valuation Inputs | ||||||||||||||||
| Investments in Securities at Value* | Level 1 | Level 2 | Level 3 | Total | ||||||||||||
| Common Stocks | $ | 7,641,569 | $ | – | $ | – | $ | 7,641,569 | ||||||||
| Exchange Traded Funds | 284,224 | – | – | 284,224 | ||||||||||||
| Corporate Bonds | – | 266,169 | – | 266,169 | ||||||||||||
| Closed-End Funds | 123,512 | – | – | 123,512 | ||||||||||||
| U.S. Treasury Bonds & Notes | 2,195,591 | – | – | 2,195,591 | ||||||||||||
| Short Term Investments | 112,449 | – | – | 112,449 | ||||||||||||
| Total | $ | 10,357,345 | $ | 266,169 | $ | – | $ | 10,623,514 | ||||||||
| 58 | www.jamesfunds.com |
| James Advantage Funds | Notes to Financial Statements |
| December 31, 2017 (Unaudited) |
| James Long-Short Fund | Valuation Inputs | |||||||||||||||
| Investments in Securities at Value* | Level 1 | Level 2 | Level 3 | Total | ||||||||||||
| Common Stocks | $ | 18,864,795 | $ | – | $ | – | $ | 18,864,795 | ||||||||
| Short Term Investments | 3,074,141 | – | – | 3,074,141 | ||||||||||||
| Total | $ | 21,938,936 | $ | – | $ | – | $ | 21,938,936 | ||||||||
| Valuation Inputs | ||||||||||||||||
| Other Financial Instruments* | Level 1 | Level 2 | Level 3 | Total | ||||||||||||
| Liabilities | ||||||||||||||||
| Securities Sold Short | ||||||||||||||||
| Common Stocks | $ | (2,423,531 | ) | $ | – | $ | – | $ | (2,423,531 | ) | ||||||
| TOTAL | $ | (2,423,531 | ) | $ | – | $ | – | $ | (2,423,531 | ) | ||||||
| * | For detailed descriptions of sector and industry, see the accompanying Schedule of Investments. |
The Funds recognize transfer between levels as of the end of period. For the six months ended December 31, 2017, the Funds did not have any transfer between Level 1 and Level 2 securities.
Investment Transactions
Investment transactions are recorded on a trade date basis. Gains and losses are determined using the specific identification method, which liquidates all losses first, before any gains. Securities purchased or sold on a when-issued or delayed delivery basis may have extended settlement periods. Any securities so purchased are subject to market fluctuation during this period. The Funds will instruct its custodian to segregate assets in a separate account with a current value at least equal to the amount of its when-issued and delayed delivery purchase commitments. As of December 31, 2017, the Funds did not hold when-issued securities or delayed delivery purchase commitments.
Withholding taxes on foreign dividends have been provided for in accordance with the Trust’s understanding of the applicable country’s tax rules and rates.
Foreign Currency Translation
The market value of investment securities and other assets and liabilities denominated in foreign currencies are translated into U.S. dollars at the current exchange rate, provided by WM Reuters, at the close of each business day. Purchases and sales of securities, income receipts and expense payments are translated into U.S. dollars based at the exchange rate on the date of the transaction.
Reported net realized foreign exchange gains or losses arise from sales and maturities of short-term securities, sales of foreign currencies, currency gains or losses realized and between the trade and settlement dates on securities transactions, and the difference between the amounts of dividends, interest, and foreign withholding taxes recorded on the Funds’ books and the U.S. dollar equivalent of the amounts actually received or paid. Net unrealized foreign exchange gains and losses arise from the changes in the value of assets and liabilities including investments in securities at the reporting period, resulting from changes in the exchange rate. The portion of realized and unrealized gains or losses on investments due fluctuations in foreign currency exchange rates is not separately disclosed and is included in realized and unrealized gains or losses on investments, when applicable.
Short Sales and Segregated Cash
The James Long-Short Fund may actively sell short equity and fixed income securities. Short sales are transactions in which the Fund sells a security it does not own in anticipation of a decline in the market value of that security. To complete such a transaction, the Fund must borrow the security to deliver to the buyer upon the short sale; the Fund is then obligated to replace the security borrowed by purchasing it in the open market at some later date.
The Fund will incur a loss if the market price of the security increases between the date of the short sale and the date on which the Fund replaces the borrowed security. The Fund will realize a gain if the security declines in value between those dates. The Fund is required to pay any dividend or interest due on securities sold short. Such dividends and interest are recorded as an expense. The Fund may pay fees or charges on the assets borrowed for securities sold short.
All short sales are collateralized, as required by the Fund’s prime broker. The Fund maintains the collateral in segregated accounts consisting of cash and/or equity securities sufficient to collateralize the market value of the Fund’s short positions.
Investment Income
Dividend income and dividend expense on long securities and securities sold short are recorded on the ex-dividend date. Interest income is determined on the basis of interest accrued, adjusted for amortization of premiums and accretion of discounts on all debt securities. Amortization and accretion is calculated using the effective yield method.
Dividend income includes dividends earned on Real Estate Investment Trusts (“REITs”), which may include a return of capital. As such, important taxation issues may arise, which the Funds account for when information is provided by the issuing REIT.
| Semi-Annual Report | December 31, 2017 | 59 |
| Notes to Financial Statements | James Advantage Funds |
| December 31, 2017 (Unaudited) |
Due to the actual character of dividends paid by REITs not being available until the end of the calendar year, the net investment income and long-term capital gains of the Funds can be different on the tax return compared to this annual report. Substantial unanticipated levels of return of capital may affect the Funds’ earnings and profits from which distributions are made.
Distributions received from Limited Partnership investments of a Fund are usually recorded as a return of capital and are excluded from available income in the calculation of distributions paid by the Funds. Return of capital is recorded as a reduction to the cost of investments in the Statements of Assets and Liabilities and in the Schedule of Investments.
Dividends and Distributions to Shareholders
Net investment income, if any, is generally declared and distributed to shareholders of each Fund on at least an annual basis. Net realized capital gains from security transactions, if any, are distributed to shareholders not less frequently than annually. Furthermore, capital gains are distributed only to the extent they exceed available capital loss carryforwards. Distributions to shareholders of net investment income and net realized capital gains are recorded on the ex-dividend date. The amount and timing of distributions are determined in accordance with federal income tax regulations, which may differ from GAAP.
Allocation of Income and Expense
Investment income earned, realized capital gains and losses, and unrealized appreciation and depreciation for the James Balanced: Golden Rainbow Fund is allocated daily to each class of shares based upon its proportionate share of total net assets of the Fund. Class-specific expenses are charged directly to the class incurring the expense. Common expenses, which are not attributable to a specific class, are allocated daily to each class of shares based upon its proportionate share of total net assets of the Fund. Expenses not directly billed to a particular Fund are allocated proportionally among all Funds daily in relation to net assets of each Fund or another reasonable measure.
Use of Estimates
The preparation of financial statements in conformity with GAAP requires management to make estimates and assumptions that affect the reported amounts of assets and liabilities and disclosure of contingent assets and liabilities at the date of the financial statements and the reported amounts of increases and decreases in net assets from operations during the reporting period. Actual results could differ from those estimates.
Federal Income Taxes
The Funds generally intend to distribute all taxable income and capital gains to shareholders, if any, and to otherwise continue to comply with the requirements of Subchapter M of the Internal Revenue Code of 1986, as amended, applicable to regulated investment companies. Therefore, no federal tax provision is required.
As of and during the six months ended December 31, 2017, the Funds did not have a liability for any unrecognized tax benefits. The Funds file U.S. federal, state, and local tax returns as required. The Funds’ tax returns are subject to examination by the relevant tax authorities until expiration of the applicable statute of limitations, which is generally three years after the filing of the tax return for federal purposes and four years for most state returns. Tax returns for open years have incorporated no uncertain tax positions that require a provision for income taxes.
As of December 31, 2017, the components of distributable earnings on a tax basis were as follows:
| James Balanced: Golden Rainbow Fund | James Small Cap Fund | James Mid Cap Fund | James Micro Cap Fund | James Aggressive Allocation Fund | James Long-Short Fund | |||||||||||||||||||
| Tax cost of portfolio investments | $ | 2,578,141,796 | $ | 56,476,846 | $ | 14,889,650 | $ | 22,667,929 | $ | 9,257,679 | $ | 15,847,468 | ||||||||||||
| Gross unrealized appreciation | $ | 379,768,106 | $ | 9,937,871 | $ | 1,767,204 | $ | 8,400,829 | $ | 1,404,161 | $ | 6,203,291 | ||||||||||||
| Gross unrealized depreciation | (21,778,224 | ) | (1,056,850 | ) | (366,791 | ) | (642,779 | ) | (38,326 | ) | (198,057 | ) | ||||||||||||
| Net unrealized appreciation | 357,989,882 | 8,881,021 | 1,400,413 | 7,758,050 | 1,365,835 | 6,005,234 | ||||||||||||||||||
| Total | $ | 357,989,882 | $ | 8,881,021 | $ | 1,400,413 | $ | 7,758,050 | $ | 1,365,835 | $ | 6,005,234 | ||||||||||||
The difference between the cost of portfolio investments on a tax basis and financial statement cost for the Funds is due primarily to the deferral of wash sale losses and to the differing treatment of certain investments under income tax regulations and GAAP.
| 60 | www.jamesfunds.com |
| James Advantage Funds | Notes to Financial Statements |
December 31, 2017 (Unaudited)
The tax character of distributions paid for the year ended June 30, 2017 was as follows:
| James Balanced: Golden Rainbow Fund | James Small Cap Fund | James Mid Cap Fund | James Micro Cap Fund | James Aggressive Allocation Fund | James Long-Short Fund | |||||||||||||||||||
| Ordinary Income | $ | 49,812,849 | $ | 400,002 | $ | 131,210 | $ | – | $ | 84,996 | $ | – | ||||||||||||
| Long-Term Capital Gains | 15,722,370 | – | 1,563,232 | – | – | – | ||||||||||||||||||
| Total | $ | 65,535,219 | $ | 400,002 | $ | 1,694,442 | $ | – | $ | 84,996 | $ | – | ||||||||||||
The tax character of distributions paid for the year ended June 30, 2016 was as follows:
| James Balanced: Golden Rainbow Fund | James Small Cap Fund | James Mid Cap Fund | James Micro Cap Fund | James Aggressive Allocation Fund | James Long-Short Fund | |||||||||||||||||||
| Ordinary Income | $ | 45,525,513 | $ | 517,857 | $ | 67,006 | $ | 27,110 | $ | 18,000 | $ | – | ||||||||||||
| Long-Term Capital Gains | 77,342,586 | 4,796,221 | 1,140,548 | – | – | – | ||||||||||||||||||
| Total | $ | 122,868,099 | $ | 5,314,078 | $ | 1,207,554 | $ | 27,110 | $ | 18,000 | $ | – | ||||||||||||
The amounts and characteristics of tax basis distributions and composition of distributable earnings/(accumulated losses) are finalized at fiscal year-end. Accordingly, tax basis balances have not been determined as of December 31, 2017.
Capital Losses
Under the tax code, Capital Losses are carried over to future tax years and will retain their character as either short-term or long-term capital losses. These losses do not include any late year capital losses (losses arising in the period from November 1st through June 30th) that the funds have elected to defer for the current fiscal year. The Funds’ ability to utilize capital loss carryforwards in the future may be limited under the Internal Revenue Code and related regulations based on the results of future transactions.
Capital losses carried forward to the next tax year were as follows:
| Short Term | Long Term | |||||||
| James Aggressive Allocation Fund | $ | 346,134 | $ | – | ||||
| James Long-Short Fund | 488,779 | – | ||||||
The Funds elect to defer to the year ending June 30, 2018 capital losses recognized during the period November 1, 2016 through June 30, 2017 in the amount of:
| Amount | ||||
| James Aggressive Allocation | $ | 116,994 | ||
| James Long-Short Fund | 362,443 | |||
3. INVESTMENT TRANSACTIONS
Purchases and sales (including maturities) of investments in other long-term U.S. Government obligations for the six months ended December 31, 2017 were as follows:
| Purchases | Sales | |||||||
| James Balanced: Golden Rainbow Fund | $ | 501,518,750 | $ | 590,767,656 | ||||
| James Aggressive Allocation Fund | 4,827,728 | 4,778,939 | ||||||
Purchases and sales (including maturities) of investments in other long-term securities for the six months ended December 31, 2017 were as follows:
| Purchases | Sales | |||||||
| James Balanced: Golden Rainbow Fund | $ | 644,638,116 | $ | 1,058,967,137 | ||||
| James Small Cap Fund | 71,003,657 | 79,087,448 | ||||||
| James Mid Cap Fund | 11,012,435 | 10,642,636 | ||||||
| James Micro Cap Fund | 5,372,743 | 8,634,487 | ||||||
| James Aggressive Allocation Fund | 7,404,289 | 7,642,864 | ||||||
| James Long-Short Fund | 1,931,655 | 3,183,845 | ||||||
For the six months ended December 31, 2017, the cost of securities purchased to cover short sales and the proceeds from securities sold short were $1,852,095 and $2,385,734, respectively, for the Long-Short Fund.
| Semi-Annual Report | December 31, 2017 | 61 |
Notes to Financial Statements | James Advantage Funds |
December 31, 2017 (Unaudited)
4. MANAGEMENT FEE AND OTHER TRANSACTIONS WITH AFFILIATES
Investment Management Agreement
The Funds retain James to manage the Funds’ investments. The investment decisions for the Funds are made by a committee of James’ personnel, which is primarily responsible for the day-to-day management of each Fund’s portfolio. The Funds pay James on a monthly basis at the annual rate set forth below of the Funds’ average daily net assets.
James Balanced: Golden Rainbow Fund
| Average Total Net Assets | Contractual Fee |
| Up to and including $500 million | 0.74% |
| Over $500 million and including $1 billion | 0.70% |
| Over $1 billion and including $2 billion | 0.65% |
| Over $2 billion | 0.60% |
James Small Cap Fund
| Average Total Net Assets | Contractual Fee |
| Up to and including $500 million | 1.25% |
| Over $500 million and including $1 billion | 1.20% |
| Over $1 billion and including $2 billion | 1.15% |
| Over $2 billion | 1.10% |
James Mid Cap Fund
| Average Total Net Assets | Contractual Fee |
| Up to and including $500 million | 1.25% |
| Over $500 million and including $1 billion | 1.20% |
| Over $1 billion and including $2 billion | 1.15% |
| Over $2 billion | 1.10% |
James Micro Cap Fund
| Average Total Net Assets | Contractual Fee |
| Up to and including $500 million | 1.50% |
| Over $500 million | 1.45% |
James Aggressive Allocation Fund
| Average Total Net Assets | Contractual Fee |
| Up to and including $500 million | 0.98% |
| Over $500 million and including $1 billion | 0.95% |
| Over $1 billion and including $2 billion | 0.90% |
| Over $2 billion | 0.85% |
James Long-Short Fund
| Average Total Net Assets | Contractual Fee |
| Up to and including $500 million | 1.25% |
| Over $500 million and including $1 billion | 1.20% |
| Over $1 billion and including $2 billion | 1.15% |
| Over $2 billion | 1.10% |
Advisory fees for the James Small Cap Fund, James Mid Cap Fund, James Micro Cap Fund, James Aggressive Allocation Fund and James Long-Short Fund are reduced by the fees and expenses of the non-interested trustees incurred by the applicable Fund. Under the investment management agreement, James is responsible for the payment of all operating expenses of the James Small Cap Fund, James Mid Cap Fund, James Micro Cap Fund, James Aggressive Allocation Fund and James Long-Short Fund, except for brokerage fees and commissions, taxes, interest (including dividend expense on securities sold short), fees and expenses of non-interested person trustees, 12b-1 expenses and extraordinary expenses.
Administrative Services Agreement
ALPS Fund Services, Inc. (“ALPS” or the “Administrator”) serves as administrator to the Funds. ALPS receives a monthly fee paid by James Balanced: Golden Rainbow Fund, for itself, and paid by James for the remaining Funds, subject to a minimum monthly fee. Pursuant to an administrative agreement, ALPS will provide operational services to the Funds including, but not limited to fund accounting and fund administration and generally assist in each Fund’s operations. Administration fees paid by the Funds for the six months ended December 31, 2017 are disclosed in the Statements of Operations.
Transfer Agency and Services Agreement
ALPS, pursuant to a Transfer Agency and Services Agreement with the Trust, serves as transfer agent for the Funds. Under the Transfer Agency and Services Agreement, ALPS receives an annual minimum fee, a fee based upon the number of shareholder accounts and is also reimbursed for out-of-pocket expenses. These fees and reimbursements for out-of-pocket expenses are paid and reimbursed by James Balanced: Golden Rainbow Fund, for itself, and by James for the remaining Funds. Transfer agent fees paid by the Funds for the six months ended December 31, 2017 are disclosed in the Statements of Operations.
Plans of Distribution
The James Balanced: Golden Rainbow Fund (Retail Class), James Small Cap Fund, James Mid Cap Fund and James Long-Short Fund have adopted a plan pursuant to Rule 12b-1 under the 1940 Act (collectively, the “Plans”) under which each Fund may incur expenses related to distribution of its shares and for services provided to shareholders. Payments under a Plan are made to James, which uses them to pay distribution and shareholder service expenses on behalf of and as agent of the Fund. The amount payable by each Fund (the Retail Class of the James Balanced: Golden Rainbow Fund), with a Plan, under its Plan is 0.25% of its average daily net assets for the year. The Plans are compensation plans, which means that payments are made to James regardless of 12b-1 expenses actually incurred. Therefore, payments under a Plan may exceed distribution and shareholder service expenses incurred pursuant to the Plan, and James is permitted to retain the excess. It is also possible that 12b-1 expenses paid by James for a period will exceed the payments received by James, in which case James may pay such excess expenses out of its own resources. Payments received by James under the Plans are in addition to the fees paid to James pursuant to the Management Agreements. The Plans require that James act in the Funds’ best interests in expending the payments it receives from the Funds and use payments solely for the purpose of paying distribution and shareholder services expenses on behalf of the Funds. The Funds’ distributor, ALPS Distributors, Inc., validates all payment amounts to be made to brokers that have properly executed dealer agreements with the Funds before James will make such payments. The expenses of the James Balanced: Golden Rainbow Fund’s Plans are reflected as 12b-1 distribution and service fees – Retail Class on the Statements of Operations. The Plan expenses of the James Small Cap Fund, James Mid Cap Fund and James Long-Short Fund are reflected as 12b-1 distribution and service fees on the Statements of Operations.
| 62 | www.jamesfunds.com |
| James Advantage Funds | Notes to Financial Statements |
December 31, 2017 (Unaudited)
5. COMMITMENTS AND CONTINGENCIES
The Funds indemnify the Trust’s officers and trustees for certain liabilities that might arise from their performance of their duties to the Funds. Additionally, in the normal course of business, the Funds enter into contracts that contain a variety of representations and warranties and that provide general indemnifications. The Funds’ maximum exposure under these arrangements is unknown, as this would involve future claims that may be made against the Funds that have not yet occurred. However, based on experience, the Funds expect the risk of loss to be remote.
6. LINE OF CREDIT
Each Fund has a revolving line of credit agreement with U.S. Bank, N.A. (the “Bank”). Borrowings under these arrangements are secured by investments held in the Funds’ portfolios as notated on the Schedules of Investments and bear interest at the Bank’s prime rate. During the six months ended December 31, 2017, James Micro Cap Fund utilized its line of credit. The average amount of borrowings was $270,000 over 5 days with a weighted-average interest rate of 4.25%. During the six months ended December 31, 2017, the James Balanced: Golden Rainbow Fund, James Small Cap Fund, James Mid Cap Fund, James Aggressive Allocation Fund, and James Long-Short Fund did not utilize their line of credit. Interest on funded and unfunded loans can be found under interest expense on the Statements of Operations. Each Fund’s line of credit agreement expired on July 11, 2017 and was renewed for one year. The terms of the agreements can be characterized as follows:
| Fund | Maximum Balance Available | Interest Rate | Expiration Date | |||||
| James Balanced: Golden Rainbow Fund | $ | 50,000,000 | Prime Rate* | July 10, 2018 | ||||
| James Small Cap Fund | $ | 3,500,000 | Prime Rate* | July 10, 2018 | ||||
| James Mid Cap Fund | $ | 750,000 | Prime Rate* | July 10, 2018 | ||||
| James Micro Cap Fund | $ | 1,500,00 | Prime Rate* | July 10, 2018 | ||||
| James Aggressive Allocation Fund | $ | 500,000 | Prime Rate* | July 10, 2018 | ||||
| James Long-Short Fund | $ | 3,000,000 | Prime Rate* | July 10, 2018 | ||||
| * | The rate at which the Bank announces as its prime lending rate. |
| Semi-Annual Report | December 31, 2017 | 63 |
| Additional Information | James Advantage Funds |
December 31, 2017 (Unaudited)
PROXY VOTING GUIDELINES
James is responsible for exercising the voting rights associated with the securities purchased and held by the Funds. A description of the policies and procedures that James uses in fulfilling this responsibility and information regarding how those proxies were voted during the most recent 12-month period ended June 30 are available without charge upon request by calling toll free 1-800-995-2637. These items are also available on the Securities and Exchange Commission’s (the “Commission”) website at http://www.sec.gov.
QUARTERLY PORTFOLIO DISCLOSURE
James files a complete listing of portfolio holdings for each Fund as of the end of the first and third quarters of each fiscal year on Form N-Q. The complete listing (i) is available on the Commission’s website; (ii) may be reviewed and copied at the Commission’s Public Reference Room in Washington, DC; and (iii) will be made available to shareholders upon request by calling 1-800-995-2637. Information on the operation of the Public Reference Room may be obtained by calling 1-800-SEC-0330.
| 64 | www.jamesfunds.com |
| James Advantage Funds | Privacy Policy |
December 31, 2017 (Unaudited)
Facts
What does James Advantage Funds do with your personal information?
Why?
Financial companies choose how they share your personal information. Federal law gives consumers the right to limit some, but not all sharing. Federal law also requires us to tell you how we collect, share, and protect your personal information. Please read this notice carefully to understand what we do.
What?
The types of personal information we collect and share depends on the product or service that you have with us. This information can include:
| ● | Social Security number and wire transfer instructions |
| ● | account transactions and transaction history |
| ● | investment experience and purchase history |
When you are no longer our customer, we continue to share your information as described in this notice.
How?
All financial companies need to share customers’ personal information to run their everyday business. In the section below, we list the reasons financial companies can share their customers’ personal information; the reasons James Advantage Funds chooses to share; and whether you can limit this sharing.
| Reasons we can share your personal information: | Does James Advantage Funds share information? | Can you limit this sharing? |
| For our everyday business purposes - such as to process your transactions, maintain your account(s), respond to court orders and legal investigations, or report to credit bureaus. | YES | NO |
| For our marketing purposes - to offer our products and services to you. | YES | NO |
| For joint marketing with other financial companies. | NO | We don’t share |
| For our affiliates’ everyday business purposes - information about your transactions and records. | NO | We don’t share |
| For our affiliates’ everyday business purposes - information about your credit worthiness. | NO | We don’t share |
| For our affiliates to market to you | NO | We don’t share |
| For non-affiliates to market to you | NO | We don’t share |
Questions? Call 1-800-99 James
| What we do: | ||||
| How does James Advantage Funds protect my personal information? | To protect your personal information from unauthorized access and use, we use security measures that comply with federal law. These measures include computer safeguards and secured files and buildings. | |||
| Our service providers are held accountable for adhering to strict policies and procedures to prevent any misuse of your nonpublic personal information. | ||||
How does James Advantage Funds collect my personal information?
| We collect your personal information, for example, when you | |||
| ● | open an account or deposit money | |||
| ● | direct us to buy securities or direct us to sell your securities | |||
| ● | seek advice about your investments | |||
| We also collect your personal information from others, such as credit bureaus, affiliates, or other companies. | ||||
| Why can’t I limit all sharing? | Federal law gives you the right to limit only: | |||
| ● | sharing for affiliates’ everyday business purposes – information about your creditworthiness. | |||
| ● | affiliates from using your information to market to you. | |||
| ● | sharing for nonaffiliates to market to you. | |||
| State laws and individual companies may give you additional rights to limit sharing. | ||||
| Definitions | ||||
| Affiliates | Companies related by common ownership or control. They can be financial and non-financial companies. | |||
| ● | Our affiliates include financial companies, such as James Investment Research, Inc. and James Capital Alliance. | |||
| Non-affiliates | Companies not related by common ownership or control. They can be financial and non-financial companies. | |||
| ● | James Advantage Funds does not share with nonaffiliates so they can market to you. | |||
| Joint marketing | A formal agreement between nonaffiliated financial companies that together market financial products or services to you. | |||
| ● | James Advantage Funds does not jointly market. | |||
| Semi-Annual Report | December 31, 2017 | 65 |

Item 2. Code of Ethics.
Not applicable to this Report.
Item 3. Audit Committee Financial Expert.
Not applicable to this Report.
Item 4. Principal Accountant Fees and Services.
Not applicable to this Report.
Item 5. Audit Committee of Listed Registrants.
Not applicable to the registrant.
Item 6. Investments.
| (a) | The Schedule of Investments is included as part of the report to shareholders filed under Item 1 of this Form. |
| (b) | Not applicable to the registrant. |
Item 7. Disclosure of Proxy Voting Policies and Procedures for Closed-End Management Investment Companies.
Not applicable to the registrant.
Item 8. Portfolio Managers of Closed-End Management Investment Companies.
Not applicable to the registrant.
Item 9. Purchases of Equity Securities by Closed-End Management Investment Company and Affiliated Purchasers.
Not applicable to the registrant.
Item 10. Submission of Matters to a Vote of Security Holders.
The registrant has not adopted procedures by which shareholders may recommend nominees to the registrant’s board of trustees.
Item 11. Controls and Procedures.
| (a) | Based on an evaluation of the registrant’s disclosure controls and procedures (as defined in Rule 30a-3(c) under the Investment Company Act of 1940, as amended), the registrant’s principal executive officer and principal financial officer have concluded that the registrant’s disclosure controls and procedures are effective as of a date within 90 days of the filing date of this report. |
| (b) | There were no significant changes in the registrant’s internal control over financial reporting (as defined in Rule 30a-3(d) under the Investment Company Act of 1940, as amended) that occurred during the second fiscal quarter of the period covered by this Report that have materially affected, or are reasonably likely to materially affect, the registrant’s internal control over financial reporting. |
Item 12. Disclosure of Securities Lending Activities for Closed-End Management Investment Companies.
Not applicable.
Item 13. Exhibits.
| (a)(1) | Not applicable to this Report. |
| (a)(2) | Certifications required by Item 13(a)(2) of Form N-CSR are filed herewith as Exhibit 99.CERT. |
| (a)(3) | Not applicable. |
| (a)(4) | Not applicable. |
| (b) | Certifications required by Item 13(b) of Form N-CSR are filed herewith as Exhibit 99.906CERT. |
SIGNATURES
Pursuant to the requirements of the Securities Exchange Act of 1934 and the Investment Company Act of 1940, the Registrant has duly caused this Report to be signed on its behalf by the undersigned, thereunto duly authorized.
(Registrant) The James Advantage Funds
By (Signature and Title)
| /s/ Barry R. James | |
| Barry R. James | |
| President |
Date: March 9, 2018
Pursuant to the requirements of the Securities Exchange Act of 1934 and the Investment Company Act of 1940, this report has been signed below by the following persons on behalf of the registrant and in the capacities and on the dates indicated.
By (Signature and Title)
| /s/ Barry R. James | |
| Barry R. James | |
| President |
Date: March 9, 2018
By (Signature and Title)
| /s/ Thomas L. Mangan | |
| Thomas L. Mangan | |
| Chief Financial Officer |
Date: March 9, 2018