UNITED STATES
SECURITIES AND EXCHANGE COMMISSION
Washington, D.C. 20549
FORM N-CSR
CERTIFIED SHAREHOLDER REPORT OF REGISTERED
MANAGEMENT INVESTMENT COMPANIES
| Investment Company Act file number | 811-08411 |
James Advantage Funds
(Exact name of registrant as specified in charter)
| 1349 Fairground Road Xenia, Ohio | 45385 |
| (Address of principal executive offices) | (Zip code) |
R. Brian Culpepper
P.O. Box 8 Alpha, Ohio 45301
(Name and address of agent for service)
| Registrant's telephone number, including area code: | (937) 426-7640 |
| Date of fiscal year end: | June, 30 | |
| Date of reporting period: | December 31, 2023 |
Form N-CSR is to be used by management investment companies to file reports with the Commission not later than 10 days after the transmission to stockholders of any report that is required to be transmitted to stockholders under Rule 30e-1 under the Investment Company Act of 1940 (17 CFR 270.30e-1). The Commission may use the information provided on Form N-CSR in its regulatory, disclosure review, inspection, and policymaking roles.
A registrant is required to disclose the information specified by Form N-CSR, and the Commission will make this information public. A registrant is not required to respond to the collection of information contained in Form N-CSR unless the Form displays a currently valid Office of Management and Budget ("OMB") control number. Please direct comments concerning the accuracy of the information collection burden estimate and any suggestions for reducing the burden to the Secretary, Securities and Exchange Commission, 450 Fifth Street, NW, Washington, DC 20549-0609. The OMB has reviewed this collection of information under the clearance requirements of 44 U.S.C. § 3507.
| Item 1. | Reports to Stockholders. |
| (a) |

| Semi-Annual Report |
| December 31, 2023 |
| James Balanced: Golden Rainbow Fund |
| James Small Cap Fund |
| James Micro Cap Fund |
| James Aggressive Allocation Fund |
TABLE OF CONTENTS
| Shareholder Letter | 1 |
| Growth of $10,000 or $50,000 Charts | 4 |
| Representation of Schedules of Investments | 8 |
| Schedule of Investments | |
| James Balanced: Golden Rainbow Fund | 9 |
| James Small Cap Fund | 14 |
| James Micro Cap Fund | 17 |
| James Aggressive Allocation Fund | 19 |
| Statements of Assets and Liabilities | 23 |
| Statements of Operations | 24 |
| Statements of Changes in Net Assets | 25 |
| Financial Highlights | |
| James Balanced: Golden Rainbow Fund – Retail Class | 29 |
| James Balanced: Golden Rainbow Fund – Institutional Class | 30 |
| James Small Cap Fund | 31 |
| James Micro Cap Fund | 32 |
| James Aggressive Allocation Fund | 33 |
| Notes to Financial Statements | 34 |
| Disclosure of Fund Expenses | 42 |
| Additional Information | 43 |
| Privacy Policy | 44 |
| James Advantage Funds | Shareholder Letter |
| December 31, 2023 (Unaudited) |
LETTER TO THE SHAREHOLDERS
OF THE JAMES ADVANTAGE FUNDS
Following a challenging 2022 for the stock market, 2023 brought a pleasant surprise. Despite many pundits’ initial predictions of a looming recession, stocks of all sizes across various sectors saw double digit returns. We are especially proud to note our funds performed just as impressively, if not better than, many indexes.
The Markets Over the Past Six Months
While past performance is no guarantee of future results, history often repeats itself. Based on historical monthly average returns, November and December are often the best months for the stock market while September and August tend to be the worst. In 2023, those outcomes remained consistent. During the difficult summer quarter (July, August, and September), the VettaFi US Equity 3000 Total Return Index fell 3.31% while the last three months of the year saw a positive return of 9.62%. Combining the two time periods, 2023 finished strong providing a solid 6.00% for the second half of the calendar year.
Smaller stocks, as seen by the VettaFi US Small-Cap 2000 Total Return Index, followed a similar pattern. The third calendar quarter declined 6.04% and the fourth quarter increased 15.43%, providing a total return of 8.46% for the six-month period.
This market reversal coincided with some of the action taken by the Federal Reserve (“Fed”). Initially, the Fed paused its policy of hiking rates policy, then suggested potential rate cuts might be made in 2024. This dovish stance allowed the markets to flourish towards the end of the year.
Not only did equity markets advance towards the end of the year, so did fixed income investments. The Bloomberg Intermediate Government/ Credit Index finished with a six-month return of 3.69%, of which, 4.56% came in the last three months.
Investment Goals and Objectives
The James Balanced: Golden Rainbow Fund (the “Golden Rainbow Fund”) seeks to provide total return through a combination of growth and income and preservation of capital in declining markets. The Golden Rainbow Fund will generally hold positions in common stocks that in aggregate constitute between 35 percent and 60 percent of the Fund’s net assets. Bonds held in the Fund will generally be rated at or above Baa2 by Moody’s or BBB by S&P at the time of purchase. The Golden Rainbow Fund may hold municipal bonds, but generally buys them when they are attractively priced compared with taxable bonds.
The Golden Rainbow Fund’s benchmark is a blend of 25% VettaFi US Equity Large/Mid-Cap 1000 Total Return Index, 25% VettaFi US Equity Small-Cap 2000 Total Return Index, and 50% Bloomberg U.S. Intermediate Government/Credit Bond Index. The benchmark is the same for all share classes of the Golden Rainbow Fund. We believe this index to be an appropriate benchmark for the Fund as it provides representation from both large, mid, and small capitalization stocks as well as a fixed income component.
The James Aggressive Allocation Fund (the “Aggressive Allocation Fund”) seeks to provide total return through a combination of growth and income. Preservation of capital in declining markets is a secondary objective. Shareholders should be aware this Fund will likely have a higher level of volatility than the Golden Rainbow Fund. The Aggressive Allocation Fund’s benchmark is a blend of 65% VettaFi US Equity 3000 Total Return Index and 35% Bloomberg U.S. Aggregate Government/Credit Bond Index.
The James Small Cap Fund (the “Small Cap Fund”) and the James Micro Cap Fund (the “Micro Cap Fund”) each seek to provide long-term capital appreciation. These Funds hold only equity securities and cash/cash equivalents, under most circumstances. The Small Cap Fund’s benchmark is the VettaFi US Equity Small-Cap 2000 Total Return Index, and the Micro Cap Fund’s benchmark is the VettaFi US Equity Micro-Cap Total Return Index.
Investment Philosophy
James Investment Research, Inc., the James Advantage Funds’ adviser (the “Adviser” or “JIR”), commenced operations in 1972 and became known as a value manager, seeking to identify stocks with good relative valuations, profitability, and positive price momentum. The Adviser’s research, along with much academic research, supports the view that value investing tends to outperform growth investing over the longer-run. There are times, however, when traditional valuation techniques do not correlate with future stock market performance. This is why we use a three-factor approach, often times relying more on profitability and momentum.
The James Advantage Funds offer several different styles, but they all have a slant towards relative value when it comes to stock selection. The Aggressive Allocation Fund generally takes on greater risk than the Golden Rainbow Fund in terms of its higher allocation to stocks, but still seeks to reduce that risk in anticipation of when the Adviser believes there could be a major decline in stock prices. Due to potentially higher equity levels, Aggressive Allocation Fund shareholders should generally have higher risk appetites for their mutual fund investments than those in the Golden Rainbow Fund.
The Micro Cap Fund and the Small Cap Fund invest in smaller capitalization companies. The Small Cap and Micro Cap Funds are niche products designed to meet the objectives of investors who want to establish diversified positions in these areas. As these Funds are equity products, they are intrinsically riskier than some of the other James Funds that hold bonds and the shareholder should expect relatively greater volatility in Net Asset Value (“NAV”) prices and a higher standard deviation of returns. Still, these portfolios include stocks ranked highly by the Adviser and undergo a thorough review by the Adviser’s researchers and portfolio managers.
The Adviser does not purchase research from broker/dealers, and consequentially, does not engage in any soft-dollar arrangements.
| Semi-Annual Report | December 31, 2023 | 1 |
| James Advantage Funds | Shareholder Letter |
| December 31, 2023 (Unaudited) |
Strategy for Seeking to Meet Fund Objectives
For the Balanced: Golden Rainbow and the Aggressive Allocation, the main objective is to provide total return through growth and income. The Adviser has always held to the belief that preservation of capital in down markets is the key to long-term investment success. Hence, the Golden Rainbow Fund seeks to preserve capital by constructing a portfolio of both bonds and stocks. In the past, stocks have often provided capital appreciation when the economy has proven to be strong. Bonds, in general, are uncorrelated with stocks, and can provide asset class diversification as well as an income stream. In times when the stock market is strong, some investors may forget these positive characteristics of bonds, but the Golden Rainbow Fund has always held a significant position in bonds. The Aggressive Allocation Fund has a similar portfolio construction; however, it tends to hold a higher allocation to stocks and a lower investment in bonds.
The Small Cap Fund and the Micro Cap Fund look for stocks the Adviser believes to be undervalued, using its proprietary research to screen a database of over 3,000 stocks. Deterioration in a stock’s fundamental value characteristics can lead the Adviser to trim or sell the position.
Fund Performance
The Golden Rainbow Fund and the Aggressive Allocation Fund both hold significant bond positions. The expectation is that in periods of strong stock market returns, the Funds will participate, however not to the full extent, in those returns. The same can be said should stocks fall. These balanced styles aim to reduce the volatility commonly observed in pure stock funds. Over the six-month period ended December 31, 2023, the Retail Class shares of the Golden Rainbow Fund advanced 5.13% and the Institutional Class shares advanced 5.30%. The Golden Rainbow Fund paid a dividend in both quarters. The Retail Class shares paid 6.54 cents per share in September and 6.04 cents per share in December. The Institutional Class shares paid 7.77 cents per share in September and 7.26 cents per share in December. Additionally, in December the Golden Rainbow Fund paid all shareholders a long-term capital gain distribution of $0.187 per share.
Over the six months ended December 31, 2023, the Small Cap Fund increased 14.34%, compared to 8.18% earned by its 2000 stock small cap benchmark. In December, the Small Cap Fund distributed an ordinary dividend of 10.62 cents per share and a long-term capital gain of $0.0939 per share for the year.
The Micro Cap Fund increased 18.37% for the six months ended December 31, 2023. The Fund paid an ordinary dividend of 12.85 cents per share in December but did not provide a capital gain distribution.
Similar to the Golden Rainbow Fund, the Aggressive Allocation Fund’s strategy involves holding both stocks and bonds. However, the Aggressive Allocation Fund is more aggressive, typically maintaining a higher allocation to stocks compared to the Golden Rainbow Fund. The Aggressive Allocation Fund paid an ordinary dividend of 7.50 cents per share in December. A capital gain distribution was not paid. For the six months ended December 31, 2023, the Aggressive Allocation Fund increased by 7.37%.
Expectations for the Future (as of December 31, 2023)
The 2024 U.S. economic outlook is cautiously optimistic, relying on a ’soft-landing’ scenario where the economy slows but continues to grow, aided by Federal Reserve rate reductions as inflation moderates. Several factors are expected to contribute to this inflation moderation, including a decrease in shelter inflation, a normalization of supply chains, and controlled wage growth. Collectively, these elements increase the likelihood of inflation meeting its target and potentially triggering a Federal Reserve interest rate reduction.
We believe the success of this scenario depends on the Federal Reserve’s flexibility in adjusting policies, especially if early progress on inflation aligns with the target. The expected trajectory of the labor market, featuring a modest rise in unemployment, aligns with this ’soft-landing’ scenario.
Consumer spending is predicted to decelerate but remain positive, with its direction contingent on the Fed’s policy stance. The housing market may continue to stagnate due to high mortgage rates and prices unless there is a significant drop in mortgage rates. Signs of a manufacturing recovery offer hope, and in general, a gradual economic slowdown without recession is anticipated for 2024.
Globally, the economic outlook remains cautious, with concerns about slowing growth in the U.S., recessionary conditions in Europe, and challenges in China. Geopolitical events and upcoming elections introduce uncertainties that investors must navigate. However, we believe the late business cycle stage poses potential challenges, including downward trends in earnings revisions and stress on consumer spending due to higher prices. A weakening labor market and low consumer confidence contribute to this challenging landscape. In terms of investment, our view is intermediate and long-term indicators suggest neutrality with positive momentum for large-cap stocks, while small-caps remain attractively priced. We believe cyclical sectors are gaining appeal over defensive sectors.
The Federal Reserve’s pivot strategy has generated differing opinions on the timing and number of rate changes. While the hope for Fed easing replaces the earlier “higher for longer” sentiment, quantitative tightening continues. Concerns about debt sustainability, the impact of government spending on the economy, and bond markets persist. Lower investment-grade corporate bond spreads reflect increased confidence in the Fed’s approach and reduced recession fears.
In fixed income, we favor bonds with intermediate and longer maturities, as we believe that interest rates have peaked in this cycle. Additionally, we see value in high-quality bonds and agency mortgage-backed securities.
Our economic forecast faces several potential risks. These include persistently higher-than-anticipated inflation, a reversal in the Fed’s rate-cutting strategy, escalating geopolitical conflicts, surging oil prices, or economic data that significantly deviates from expectations. These factors introduce an element of uncertainty into the economic landscape in 2024.
| 2 | www.jamesinvestment.com |
| James Advantage Funds | Shareholder Letter |
| December 31, 2023 (Unaudited) |
Thank you once again for your continued support and confidence in the James Advantage Funds.
Brian P. Shepardson
Secretary, Chief Financial Officer
The James Advantage Funds
The statements and opinions expressed are those of the author, are as of the date of this report, are subject to change, and may not reflect the writer’s current views. All information is historical and not indicative of future results and subject to change. It should not be assumed that an investment in the securities mentioned will be profitable in the future. This information is not a recommendation to buy or sell.
Investing involves risk, including loss of principal. You should carefully consider the investment objectives, potential risks, management fees, and charges and expenses of the Fund before investing. The Fund’s prospectus contains this and other information about the Fund and should be read carefully before investing. You may obtain a current copy of the Fund’s prospectus by calling 1-800-995-2637.
The performance data quoted represents past performance; past performance does not guarantee future results. The investment return and principal value of an investment in the Fund will fluctuate so that an investor’s shares, when redeemed, may be worth more or less than their original cost. The Fund’s current performance may be lower or higher than the performance data quoted. Investors may obtain performance information current to the last month-end at www.jamesinvestment.com.
Credit ratings apply to the underlying holdings of the Fund, and not to the Fund itself. Moody’s and S&P study the financial condition of an entity to ascertain its creditworthiness. The credit ratings reflect the rating agency’s opinion of the holdings financial condition and histories. The ratings shown (Baa2 by Moody’s/BBB by S&P) are all considered investment grade and are listed by highest to lowest in percentage of what the Fund holds.
Diversification does not eliminate the risk of experiencing investment loss.
The James Advantage Funds are distributed by Ultimus Fund Distributors, LLC 225 Pictoria Drive, Suite 450, Cincinnati, OH 45246 (Member FINRA). Ultimus is not affiliated with James Investment Research, Inc.
| Semi-Annual Report | December 31, 2023 | 3 |
| James Advantage Funds | Growth of $10,000 or $50,000 Charts |
| December 31, 2023 (Unaudited) |
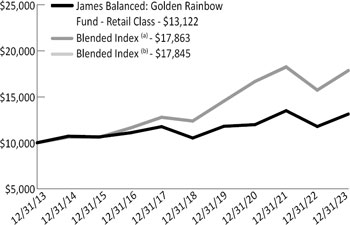
Comparison of the Change in Value of a $10,000 Investment in the James Balanced: Golden Rainbow Fund – Retail Class
| Average Annual Total Returns |
| (for the periods ended December 31, 2023) |
| 1 Year | 5 Years | 10 Years | Since Inception^ | |||||||||||||
| James Balanced: Golden Rainbow - Retail Class | 11.52 | % | 4.53 | % | 2.75 | % | 6.66 | % | ||||||||
| Blended Index (a) | 13.54 | % | 7.63 | % | 5.97 | % | N/A | * | ||||||||
| VettaFi U.S. Equity Large/ Mid-Cap 1000 Total Return Index | 26.40 | % | 15.41 | % | 11.73 | % | N/A | * | ||||||||
| VettaFi U.S. Equity Small-Cap 2000 Total Return Index | 16.52 | % | 9.93 | % | 7.16 | % | N/A | * | ||||||||
| Bloomberg U.S. Intermediate Government/Credit Bond Index | 5.24 | % | 1.59 | % | 1.72 | % | 4.60 | % | ||||||||
| Blended Index (b) | 13.62 | % | 7.62 | % | 5.96 | % | 7.70 | % | ||||||||
| Russell 1000® Index | 26.53 | % | 15.52 | % | 11.80 | % | 10.41 | % | ||||||||
| Russell 2000® Index | 16.93 | % | 9.97 | % | 7.16 | % | 9.46 | % | ||||||||
| (a) | The Blended Index is comprised of a 25% weighting in the VettaFi U.S. Equity Large/Mid-Cap 1000 Total Return Index, a 25% weighting in the VettaFi U.S. Equity Small-Cap 2000 Total Return Index and a 50% weighting in the Bloomberg U.S. Intermediate Government/Credit Bond Index. Effective May 31, 2023 the Fund Changed it’s primary benchmark to the Blended Index(a). |
| (b) | The Blended Index is comprised of a 25% weighting in the Russell 1000® Index, a 25% weighting in the Russell 2000® Index and a 50% weighting in the Bloomberg U.S. Intermediate Government/Credit Bond Index. |
| ^ | Fund and Class inception was July 1, 1991. |
| * | Inception date of the VettaFi U.S. Equity Large Cap/Mid-Cap 1000 Total Return Index and VettaFi U.S. Equity Small-Cap 2000 Total Return Index was December 17, 1999. |
| The total annual operating expense ratio as stated in the fee table of the most recent prospectus, dated November 1, 2023 was 1.25%. |
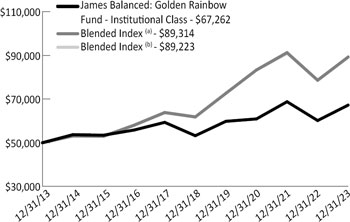
Comparison of the Change in Value of a $50,000 Investment in the James Balanced: Golden Rainbow Fund – Institutional Class
| Average Annual Total Returns |
| (for the periods ended December 31, 2023) |
| 1 Year | 5 Years | 10 Years | Since Inception^ | |||||||||||||
| James Balanced: Golden Rainbow - Institutional Class | 11.78 | % | 4.80 | % | 3.01 | % | 6.25 | % | ||||||||
| Blended Index (a) | 13.54 | % | 7.63 | % | 5.97 | % | 9.27 | % | ||||||||
| VettaFi U.S. Equity Large/ Mid-Cap 1000 Total Return Index | 26.40 | % | 15.41 | % | 11.73 | % | 15.95 | % | ||||||||
| VettaFi U.S. Equity Small-Cap 2000 Total Return Index | 16.52 | % | 9.93 | % | 7.16 | % | 14.82 | % | ||||||||
| Bloomberg U.S. Intermediate Government/Credit Bond Index | 5.24 | % | 1.59 | % | 1.72 | % | 2.53 | % | ||||||||
| Blended Index (b) | 13.62 | % | 7.62 | % | 5.96 | % | 9.01 | % | ||||||||
| Russell 1000® Index | 26.53 | % | 15.52 | % | 11.80 | % | 16.08 | % | ||||||||
| Russell 2000® Index | 16.93 | % | 9.97 | % | 7.16 | % | 13.74 | % | ||||||||
| (a) | The Blended Index is comprised of a 25% weighting in the VettaFi U.S. Equity Large/Mid-Cap 1000 Total Return Index, a 25% weighting in the VettaFi U.S. Equity Small-Cap 2000 Total Return Index and a 50% weighting in the Bloomberg U.S. Intermediate Government/Credit Bond Index. Effective May 31, 2023 the Fund Changed it’s primary benchmark to the Blended Index(a). |
| (b) | The Blended Index is comprised of a 25% weighting in the Russell 1000® Index, a 25% weighting in the Russell 2000® Index and a 50% weighting in the Bloomberg U.S. Intermediate Government/Credit Bond Index. |
| ^ | Class inception was March 2, 2009. |
| The total annual operating expense ratio as stated in the fee table of the most recent prospectus, dated November 1, 2023 was 1.00%. |
Past performance does not guarantee future results. The performance data quoted represents past performance and current returns may be lower or higher. The investment return and principal value will fluctuate so that an investor’s shares, when redeemed, may be worth more or less than the original cost. These performance figures do not reflect the deduction of taxes that a shareholder would pay on Fund distributions or the redemption of Fund shares. Please call 1-800-995-2637 for most recent month-end performance information.
| 4 | www.jamesinvestment.com |
| James Advantage Funds | Growth of $10,000 or $50,000 Charts |
| December 31, 2023 (Unaudited) |
VettaFi U.S. Equity Large/Mid-Cap 1000 Total Return Index is an index comprised of 1,000 of the largest U.S. stocks.
VettaFi U.S. Equity Small-Cap 2000 Total Return Index is an index that is comprised of the 1001st through the 3000th largest U.S. Stocks.
The Bloomberg U.S. Intermediate Government/Credit Bond Index measures the performance of U.S. Dollar denominated U.S. Treasures government-related and investment grade U.S. corporate securities that have a remaining maturity of greater than one year and less than ten years.
The Russell 1000® Index is an index of approximately 1,000 of the largest companies in the U.S. Equity Market. Russell 1000® Index is a subset of the Russell 3000® Index. It represents the top companies by market capitalization.
The Russell 2000® Index is a widely recognized, unmanaged index comprised of the 2,000 smallest U.S. domiciled publicly-traded common stocks of the Russell 3000® Index, which represents approximately 8% of the total market capitalization of the Russell 3000® Index, an unmanaged index of the 3,000 largest U.S. domiciled publicly-traded common stocks by market capitalization.
The VettaFi U.S. Equity Large/Mid-Cap 1000 Total Return Index, VettaFi U.S. Equity Small-Cap 2000 Total Return Index, Bloomberg U.S. Intermediate Government/Credit Bond Index, Russell 1000® Index, Russell 2000® Index and Blended Index are widely recognized unmanaged indices of security prices and are representative of a broader market and range of securities than is found in the Fund’s portfolio. The Index returns do not reflect the deduction of expenses, which have been deducted from a Fund’s returns. The Index returns assume reinvestment of all distributions and do not reflect the deduction of taxes and fees. Individuals cannot invest directly in any Index; however, an individual can invest in exchange traded funds or other investment vehicles that attempt to track the performance of a benchmark index.
| Semi-Annual Report | December 31, 2023 | 5 |
| James Advantage Funds | Growth of $10,000 or $50,000 Charts |
| December 31, 2023 (Unaudited) |
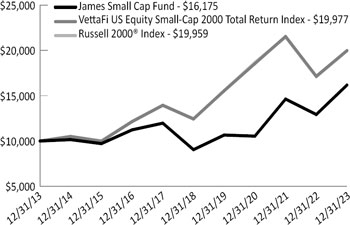
Comparison of the Change in Value of a $10,000 Investment in the James Small Cap Fund
| Average Annual Total Returns |
| (for the periods ended December 31, 2023) |
| 1 Year | 5 Years | 10 Years | Since Inception^ | |||||||||||||
| James Small Cap Fund | 25.16 | % | 12.32 | % | 4.93 | % | 7.55 | % | ||||||||
| VettaFi U.S. Equity Small-Cap 2000 Total Return Index(a) | 16.52 | % | 9.93 | % | 7.16 | % | N/A | * | ||||||||
| Russell 2000® Index | 16.93 | % | 9.97 | % | 7.16 | % | 8.64 | % | ||||||||
| (a) | Effective May 31, 2023 the Fund changed it’s primary benchmark to VettaFi US Equity Small-Cap 2000 Total Return Index |
| ^ | Fund inception was October 2, 1998. |
| * | Inception date of the VettaFi U.S. Equity Small-Cap 2000 Total Return Index was December 17, 1999. |
| The total annual operating expense ratio as stated in the fee table of the most recent prospectus, dated November 1, 2023 was 1.51%. |
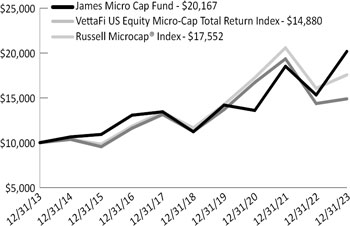
Comparison of the Change in Value of a $10,000 Investment in the James Micro Cap Fund
| Average Annual Total Returns |
| (for the periods ended December 31, 2023) |
| 1 Year | 5 Years | 10 Years | Since Inception^ | |||||||||||||
| James Micro Cap Fund | 31.72 | % | 12.46 | % | 7.27 | % | 9.80 | % | ||||||||
| VettaFi U.S. Equity Micro-Cap Total Return Index(a) | 3.64 | % | 5.79 | % | 4.05 | % | N/A | * | ||||||||
| Russell Microcap® Index | 9.35 | % | 8.56 | % | 5.79 | % | 9.97 | % | ||||||||
| (a) | Effective May 31, 2023 the Fund changed it’s primary benchmark to VettaFi U.S. Equity Micro-Cap Total Return Index. |
| ^ | Fund inception was July 1, 2010. |
| * | Inception date of the VettaFi U.S. Equity Micro-Cap Total Return Index was December 16, 2011. |
| The total annual operating expense ratio as stated in the fee table of the most recent prospectus, dated November 1, 2023 was 1.50%. |
Past performance does not guarantee future results. The performance data quoted represents past performance and current returns may be lower or higher. The investment return and principal value will fluctuate so that an investor’s shares, when redeemed, may be worth more or less than the original cost. These performance figures do not reflect the deduction of taxes that a shareholder would pay on Fund distributions or the redemption of Fund shares. Please call 1-800-995-2637 for most recent month-end performance information..
Small and Micro Cap investing involve greater risk not associated with investing in more established companies, such as greater price volatility, business risk, less liquidity and increased competitive threat.
VettaFi U.S. Equity Small-Cap 2000 Total Return Index is an index that is comprised of the 1001st through the 3000th largest U.S. Stocks.
VettaFi U.S. Equity Micro-Cap Total Return Index is an index that is comprised of the lower half of the VettaFi U.S. Equity Small-Cap 2000 Index plus U.S. Stocks ranked too low for inclusion.
The Russell Microcap® Index measures the performance of the microcap segment of the U.S. equity market. It makes up less than 3% of the U.S. equity market. It includes 1,000 of the smallest securities in the small cap Russell 2000® Index, plus the next smallest eligible securities by market cap.
The Russell 2000® Index is a widely recognized, unmanaged index comprised of the 2,000 smallest U.S. domiciled publicly-traded common stocks of the Russell 3000® Index, which represents approximately 8% of the total market capitalization of the Russell 3000® Index, an unmanaged index of the 3,000 largest U.S. domiciled publicly-traded common stocks by market capitalization.
The VettaFi U.S. Equity Small-Cap 2000 Total Return Index, VettaFi U.S. Equity Micro Cap Total Return Index, Russell 2000® Index and Russell Microcap® Index are widely recognized unmanaged indices of security prices and are representative of a broader market and range of securities than is found in the Fund’s portfolio. The Index returns do not reflect the deduction of expenses, which have been deducted from a Fund’s returns. The Index returns assume reinvestment of all distributions and do not reflect the deduction of taxes and fees. Individuals cannot invest directly in any Index; however, an individual can invest in exchange traded funds or other investment vehicles that attempt to track the performance of a benchmark index.
| 6 | www.jamesinvestment.com |
| James Advantage Funds | Growth of $10,000 or $50,000 Charts |
| December 31, 2023 (Unaudited) |
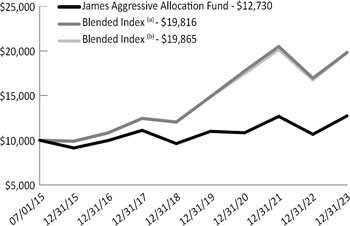
Comparison of the Change in Value of a $10,000 Investment in the James Aggressive Allocation Fund
| Average Annual Total Returns |
| (for the periods ended December 31, 2023) |
| 1 Year | 5 Years | Since Inception^ | ||||||||||
| James Aggressive Allocation Fund | 19.31 | % | 5.73 | % | 2.88 | % | ||||||
| Blended Index (a) | 16.84 | % | 10.48 | % | 8.38 | % | ||||||
| VettaFi U.S. Equity 3000 Total Return Index | 23.05 | % | 15.08 | % | 11.67 | % | ||||||
| Bloomberg U.S. Aggregate Government/ Credit Bond Index | 5.72 | % | 1.41 | % | 1.70 | % | ||||||
| Blended Index (b) | 18.62 | % | 10.52 | % | 8.41 | % | ||||||
| Russell 3000® Index | 25.96 | % | 15.16 | % | 11.73 | % | ||||||
| (a) | The Blended Index is comprised of a 65% weighting in the VettaFi U.S. Equity 3000 Total Return Index, and a 35% weighting in the Bloomberg U.S. Aggregate Government/Credit Bond Index. Effective May 31, 2023 the Fund Changed it’s primary benchmark to the Blended Index (a). |
| (b) | The Blended Index is comprised of a 65% weighting in the Russell 3000® Index, and a 35% weighting in the Bloomberg U.S. Aggregate Government/Credit Bond Index. |
| ^ | Fund inception was July 1, 2015. |
| The total annual operating expense ratio as stated in the fee table of the most recent prospectus, dated November 1, 2023 was 1.04%. |
Past performance does not guarantee future results. The performance data quoted represents past performance and current returns may be lower or higher. The investment return and principal value will fluctuate so that an investor’s shares, when redeemed, may be worth more or less than the original cost. These performance figures do not reflect the deduction of taxes that a shareholder would pay on Fund distributions or the redemption of Fund shares. Please call 1-800-995-2637 for most recent month-end performance information.
VettaFi U.S. Equity 3000 Total Return Index is an index comprised of 3,000 of the largest U.S. stocks.
The Bloomberg U.S. Aggregate Government/Credit Bond Index is an unmanaged index generally representative of U.S. Dollar denominated U.S. Treasuries, government related and investment grade U.S. corporate securities, that have a remaining maturity greater than one year.
The Russell 3000® Index is a stock market index of U.S. stocks. The Index measures the performance of 3,000 publicly held U.S. companies based on total market capitalization, which represents approximately 98% of the investable U.S. equity market.
The VettaFi U.S. Equity 3000 Total Return Index, Bloomberg U.S. Aggregate Government/Credit Bond Index, Russell 3000® Index and the Blended Index are widely recognized unmanaged indices of security prices and are representative of a broader market and range of securities than is found in the Fund’s portfolio. The Index returns do not reflect the deduction of expenses, which have been deducted from a Fund’s returns. The Index returns assume reinvestment of all distributions and do not reflect the deduction of taxes and fees. Individuals cannot invest directly in any Index; however, an individual can invest in exchange-traded funds or other investment vehicles that attempt to track the performance of a benchmark index.
| Semi-Annual Report | December 31, 2023 | 7 |
| James Advantage Funds | Representation of Schedules of Investments |
| December 31, 2023 (Unaudited) |
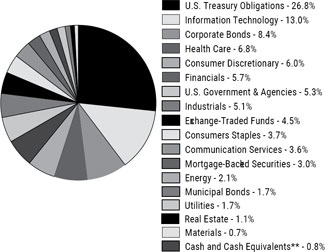
The illustrations below provide the industry sectors for the James Balanced: Golden Rainbow Fund, James Small Cap Fund, James Micro Cap Fund and James Aggressive Allocation Fund.
| James Balanced: Golden Rainbow Fund - Industry Sector Allocation (% of Net Assets)* | James Small Cap Fund - Industry Sector Allocation (% of Net Assets)* | |
 | 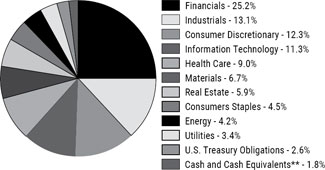 | |
| James Micro Cap Fund - Industry Sector Allocation (% of Net Assets)* | James Aggressive Allocation Fund - Industry Sector Allocation (% of Net Assets)* | |
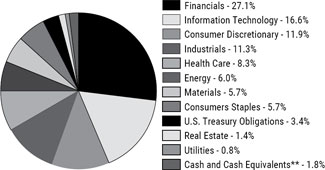 | 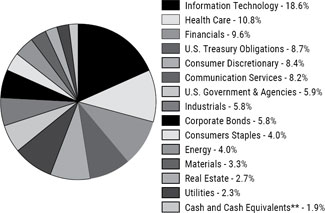 |
| * | Holdings are subject to change, and may not reflect the current or future position of the portfolio. |
| ** | Cash and Cash Equivalent percentage include the net of other assets and liabilities, which are contained on the Statement of Assets and Liabilities. |
| 8 | www.jamesinvestment.com |
| James Balanced: Golden Rainbow Fund | Schedule of Investments |
| December 31, 2023 (Unaudited) |
| Shares | Value | |||||||
| COMMON STOCKS - 49.5% | ||||||||
| Communication Services - 3.6% | ||||||||
| Alphabet, Inc. - Class A (a) | 72,807 | $ | 10,170,410 | |||||
| Meta Platforms, Inc. - Class A (a) | 7,372 | 2,609,393 | ||||||
| T-Mobile US, Inc. | 15,000 | 2,404,950 | ||||||
| 15,184,753 | ||||||||
| Consumer Discretionary - 6.0% | ||||||||
| Amazon.com, Inc. (a) | 31,310 | 4,757,241 | ||||||
| Boot Barn Holdings, Inc. (a) | 4,567 | 350,563 | ||||||
| Deckers Outdoor Corporation (a) | 1,800 | 1,203,174 | ||||||
| Home Depot, Inc. (The) | 16,000 | 5,544,800 | ||||||
| Installed Building Products, Inc. | 5,071 | 927,080 | ||||||
| M/I Homes, Inc. (a) | 20,189 | 2,780,833 | ||||||
| McDonald’s Corporation | 23,800 | 7,056,938 | ||||||
| Oxford Industries, Inc. | 9,000 | 900,000 | ||||||
| TJX Companies, Inc. (The) | 15,000 | 1,407,150 | ||||||
| Winmark Corporation | 1,401 | 584,988 | ||||||
| 25,512,767 | ||||||||
| Consumer Staples - 3.7% | ||||||||
| Casey’s General Stores, Inc. | 2,500 | 686,850 | ||||||
| Nestlé S.A. - ADR | 16,300 | 1,884,769 | ||||||
| PepsiCo, Inc. | 6,050 | 1,027,532 | ||||||
| Procter & Gamble Company (The) | 31,100 | 4,557,394 | ||||||
| Sysco Corporation | 35,125 | 2,568,691 | ||||||
| Walmart, Inc. | 30,000 | 4,729,500 | ||||||
| 15,454,736 | ||||||||
| Energy - 2.1% | ||||||||
| Chevron Corporation | 25,000 | 3,729,000 | ||||||
| ConocoPhillips | 11,615 | 1,348,153 | ||||||
| Exxon Mobil Corporation | 11,375 | 1,137,273 | ||||||
| Matador Resources Company | 8,059 | 458,235 | ||||||
| Pioneer Natural Resources Company | 1,821 | 409,506 | ||||||
| Shell plc - ADR | 10,600 | 697,480 | ||||||
| Valero Energy Corporation | 10,032 | 1,304,160 | ||||||
| 9,083,807 | ||||||||
| Financials - 5.7% | ||||||||
| Arthur J. Gallagher & Company | 9,295 | 2,090,260 | ||||||
| Bancorp, Inc. (The) (a) | 29,488 | 1,137,057 | ||||||
| Berkshire Hathaway, Inc. - Class B (a) | 7,007 | 2,499,117 | ||||||
| BlackRock, Inc. | 2,642 | 2,144,776 | ||||||
| Charles Schwab Corporation (The) | 19,421 | 1,336,165 | ||||||
| Enova International, Inc. (a) | 49,844 | 2,759,363 | ||||||
| Goldman Sachs Group, Inc. (The) | 4,377 | 1,688,515 | ||||||
| JPMorgan Chase & Company | 30,926 | 5,260,513 | ||||||
| LPL Financial Holdings, Inc. | 5,000 | 1,138,100 | ||||||
| MGIC Investment Corporation | 31,967 | 616,643 | ||||||
| Nelnet, Inc. - Class A | 17,630 | 1,555,319 | ||||||
| Primerica, Inc. | 2,086 | 429,215 | ||||||
| Regions Financial Corporation | 65,499 | 1,269,371 | ||||||
| 23,924,414 | ||||||||
| See Notes to Financial Statements. | |
| Semi-Annual Report | December 31, 2023 | 9 |
| James Balanced: Golden Rainbow Fund | Schedule of Investments |
| December 31, 2023 (Unaudited) |
| Shares | Value | |||||||
| Health Care - 6.8% | ||||||||
| Abbott Laboratories | 19,650 | $ | 2,162,876 | |||||
| AbbVie, Inc. | 14,792 | 2,292,316 | ||||||
| AstraZeneca plc - ADR | 60,273 | 4,059,387 | ||||||
| Danaher Corporation | 9,000 | 2,082,060 | ||||||
| Elevance Health, Inc. | 3,467 | 1,634,899 | ||||||
| Eli Lilly & Company | 9,569 | 5,577,960 | ||||||
| Johnson & Johnson | 14,030 | 2,199,062 | ||||||
| Thermo Fisher Scientific, Inc. | 5,000 | 2,653,950 | ||||||
| UnitedHealth Group, Inc. | 10,339 | 5,443,173 | ||||||
| Zoetis, Inc. | 2,550 | 503,294 | ||||||
| 28,608,977 | ||||||||
| Industrials - 5.1% | ||||||||
| ABB Ltd. - ADR | 34,656 | 1,535,261 | ||||||
| Caterpillar, Inc. | 10,762 | 3,182,001 | ||||||
| Deere & Company | 8,500 | 3,398,895 | ||||||
| Eaton Corporation plc | 19,768 | 4,760,530 | ||||||
| Encore Wire Corporation | 4,283 | 914,849 | ||||||
| Generac Holdings, Inc. (a) | 2,492 | 322,066 | ||||||
| Lockheed Martin Corporation | 2,220 | 1,006,193 | ||||||
| Northrop Grumman Corporation | 2,740 | 1,282,703 | ||||||
| Schneider Electric SE - ADR | 12,004 | 482,921 | ||||||
| Union Pacific Corporation | 8,562 | 2,102,998 | ||||||
| United Rentals, Inc. | 4,500 | 2,580,390 | ||||||
| 21,568,807 | ||||||||
| Information Technology - 13.0% | ||||||||
| Accenture plc - Class A | 7,000 | 2,456,370 | ||||||
| Apple, Inc. | 54,000 | 10,396,620 | ||||||
| ASML Holding N.V. | 2,740 | 2,073,961 | ||||||
| Broadcom, Inc. | 2,221 | 2,479,191 | ||||||
| Cisco Systems, Inc. | 23,171 | 1,170,599 | ||||||
| Insight Enterprises, Inc. (a) | 25,000 | 4,429,750 | ||||||
| Jabil, Inc. | 26,500 | 3,376,100 | ||||||
| Mastercard, Inc. - Class A | 9,000 | 3,838,590 | ||||||
| Microsoft Corporation | 40,376 | 15,182,992 | ||||||
| Nova Ltd. (a) | 22,432 | 3,081,932 | ||||||
| NVIDIA Corporation | 11,244 | 5,568,254 | ||||||
| Vishay Intertechnology, Inc. | 30,833 | 739,067 | ||||||
| 54,793,426 | ||||||||
| Materials - 0.7% | ||||||||
| Avery Dennison Corporation | 8,000 | 1,617,280 | ||||||
| Linde plc | 1,757 | 721,617 | ||||||
| Nucor Corporation | 3,698 | 643,600 | ||||||
| 2,982,497 | ||||||||
| Real Estate - 1.1% | ||||||||
| American Tower Corporation | 5,050 | 1,090,194 | ||||||
| CBRE Group, Inc. - Class A (a) | 14,100 | 1,312,569 | ||||||
| Prologis, Inc. | 16,000 | 2,132,800 | ||||||
| 4,535,563 | ||||||||
| See Notes to Financial Statements. | |
| 10 | www.jamesinvestment.com |
| James Balanced: Golden Rainbow Fund | Schedule of Investments |
| December 31, 2023 (Unaudited) |
| Shares | Value | |||||||
| Utilities - 1.7% | ||||||||
| Ameren Corporation | 10,422 | $ | 753,927 | |||||
| American Electric Power Company, Inc. | 25,700 | 2,087,354 | ||||||
| Iberdrola S.A. - ADR | 20,100 | 1,055,250 | ||||||
| NextEra Energy, Inc. | 19,600 | 1,190,504 | ||||||
| Sempra | 26,800 | 2,002,764 | ||||||
| 7,089,799 | ||||||||
| Total Common Stocks | ||||||||
| (Cost $129,287,606) | $ | 208,739,546 | ||||||
| EXCHANGE-TRADED FUNDS - 4.5% | ||||||||
| Consumer Discretionary Select Sector SPDR® Fund | 17,300 | $ | 3,093,413 | |||||
| iShares Gold Trust (a) | 209,455 | 8,175,029 | ||||||
| iShares Russell 2000 ETF | 30,000 | 6,021,300 | ||||||
| Technology Select Sector SPDR® Fund | 9,000 | 1,732,320 | ||||||
| Total Exchange-Traded Funds | ||||||||
| (Cost $13,791,078) | $ | 19,022,062 | ||||||
| Par Value | Value | |||||||
| CORPORATE BONDS - 8.4% | ||||||||
| Communication Services - 0.7% | ||||||||
| AT&T, Inc., 2.950%, due 07/15/26 | $ | 1,000,000 | $ | 953,025 | ||||
| Comcast Corporation, 5.350%, due 11/15/27 | 2,000,000 | 2,067,274 | ||||||
| 3,020,299 | ||||||||
| Consumer Discretionary - 0.2% | ||||||||
| Ross Stores, Inc., 4.700%, due 04/15/27 | 1,000,000 | 989,253 | ||||||
| Consumer Staples - 0.9% | ||||||||
| Tyson Foods, Inc., 4.000%, due 03/01/26 | 1,500,000 | 1,470,806 | ||||||
| Walmart, Inc., 5.250%, due 09/01/35 | 2,000,000 | 2,185,043 | ||||||
| 3,655,849 | ||||||||
| Energy - 0.2% | ||||||||
| BP Capital Markets America, Inc., 4.234%, due 11/06/28 | 1,000,000 | 993,884 | ||||||
| Financials - 2.7% | ||||||||
| Bank of America Corporation, | ||||||||
| 1.250%, due 09/24/26 | 2,000,000 | 1,782,101 | ||||||
| 5.000%, due 06/22/27 | 1,000,000 | 998,099 | ||||||
| Bank of Montreal, | ||||||||
| 2.000%, due 12/22/26 | 2,500,000 | 2,267,379 | ||||||
| Citigroup Global Markets Holdings, Inc., | �� | |||||||
| 3.000%, due 03/28/24 | 2,500,000 | 2,479,510 | ||||||
| Citigroup, Inc., 3.875%, due 03/26/25 | 2,000,000 | 1,962,610 | ||||||
| Goldman Sachs Group, Inc. (The), 3.500%, due 04/01/25 | 1,000,000 | 977,257 | ||||||
| Royal Bank of Canada, 5.848%, due 02/14/25 | 1,000,000 | 992,743 | ||||||
| 11,459,699 | ||||||||
| Health Care - 1.0% | ||||||||
| Johnson & Johnson, 1.300%, due 09/01/30 | 5,000,000 | 4,196,086 | ||||||
| Industrials - 0.3% | ||||||||
| Caterpillar, Inc., 8.250%, due 12/15/38 | 1,000,000 | 1,333,434 | ||||||
| See Notes to Financial Statements. | |
| Semi-Annual Report | December 31, 2023 | 11 |
| James Balanced: Golden Rainbow Fund | Schedule of Investments |
| December 31, 2023 (Unaudited) |
| Par Value | Value | |||||||
| Information Technology - 2.4% | ||||||||
| Apple, Inc., 2.050%, due 09/11/26 | $ | 2,500,000 | $ | 2,354,952 | ||||
| Automatic Data Processing, Inc., 1.250%, due 09/01/30 | 2,000,000 | 1,664,695 | ||||||
| Intel Corporation, 2.875%, due 05/11/24 | 5,000,000 | 4,951,347 | ||||||
| PayPal Holdings, Inc., 2.650%, due 10/01/26 | 1,000,000 | 949,755 | ||||||
| 9,920,749 | ||||||||
| Total Corporate Bonds | ||||||||
| (Cost $37,385,042) | $ | 35,569,253 | ||||||
| Par Value | Value | |||||||
| MORTGAGE-BACKED SECURITIES - 3.0% | ||||||||
| Federal National Mortgage Association - 3.0% | ||||||||
| 3.500%, due 09/01/33 | $ | 3,037,629 | $ | 2,919,180 | ||||
| 3.500%, due 05/25/47 | 264,510 | 248,184 | ||||||
| 2.500%, due 01/01/57 | 11,308,272 | 9,616,618 | ||||||
| Total Mortgage-Backed Securities | ||||||||
| (Cost $14,232,796) | $ | 12,783,982 | ||||||
| Par Value | Value | |||||||
| MUNICIPAL BONDS - 1.7% | ||||||||
| Ohio - 1.7% | ||||||||
| Beavercreek Ohio City School District Series 2015, 3.250%, due 12/01/36 (Cost $7,409,029) | $ | 7,450,000 | $ | 7,342,877 | ||||
| Par Value | Value | |||||||
| U.S. GOVERNMENT & AGENCIES - 5.3% | ||||||||
| Federal Farm Credit Bank - 1.8% | ||||||||
| 0.670%, due 08/04/25 | $ | 2,000,000 | $ | 1,879,361 | ||||
| 2.750%, due 11/06/26 | 5,725,000 | 5,518,961 | ||||||
| 7,398,322 | ||||||||
| Federal Home Loan Bank - 3.0% | ||||||||
| 3.650%, due 07/19/24 | 1,000,000 | 992,172 | ||||||
| 3.000%, due 12/30/24 | 1,000,000 | 982,718 | ||||||
| 3.125%, due 04/29/25 | 2,500,000 | 2,460,048 | ||||||
| 4.050%, due 07/28/25 | 2,000,000 | 1,988,600 | ||||||
| 0.580%, due 09/11/25 | 2,000,000 | 1,874,220 | ||||||
| 1.020%, due 09/17/26 | 2,500,000 | 2,289,085 | ||||||
| 0.850%, due 10/15/27 | 2,500,000 | 2,214,363 | ||||||
| 12,801,206 | ||||||||
| Federal Home Loan Mortgage Corporation - 0.5% | ||||||||
| 3.125%, due 06/28/24 | 2,000,000 | 1,980,277 | ||||||
| Total U.S. Government & Agencies | ||||||||
| (Cost $23,211,237) | $ | 22,179,805 | ||||||
| See Notes to Financial Statements. | |
| 12 | www.jamesinvestment.com |
| James Balanced: Golden Rainbow Fund | Schedule of Investments |
| December 31, 2023 (Unaudited) |
| Par Value | Value | |||||||
| U.S. TREASURY OBLIGATIONS - 26.8% | ||||||||
| U.S. Treasury Bills (b)- 0.2% | ||||||||
| 5.445%, due 09/05/24 | $ | 1,000,000 | $ | 967,508 | ||||
| U.S. Treasury Bonds - 2.5% | ||||||||
| 3.125%, due 05/15/48 | 12,500,000 | 10,414,063 | ||||||
| U.S. Treasury Notes - 24.1% | ||||||||
| 0.250%, due 03/15/24 | 15,000,000 | 14,850,586 | ||||||
| 2.000%, due 06/30/24 | 2,000,000 | 1,968,828 | ||||||
| 4.500%, due 11/30/24 | 30,000,000 | 29,889,843 | ||||||
| 5.000%, due 09/30/25 | 5,000,000 | 5,050,977 | ||||||
| 2.375%, due 05/15/27 | 15,000,000 | 14,247,070 | ||||||
| 5.500%, due 08/15/28 | 5,000,000 | 5,344,922 | ||||||
| 3.125%, due 11/15/28 | 30,000,000 | 28,980,469 | ||||||
| 4.125%, due 11/15/32 | 1,000,000 | 1,016,484 | ||||||
| 101,349,179 | ||||||||
| Total U.S. Treasury Obligations | ||||||||
| (Cost $114,369,695) | $ | 112,730,750 | ||||||
| Shares | Value | |||||||
| MONEY MARKET FUNDS - 0.7% | ||||||||
| First American Treasury Obligations Fund - Class X, 5.28% (c) (Cost $2,765,611) | 2,765,611 | $ | 2,765,611 | |||||
| Total Investments at Value - 99.9% | ||||||||
| (Cost $342,452,094) | $ | 421,133,886 | ||||||
| Other Assets in Excess of Liabilities - 0.1% | 295,764 | |||||||
| Net Assets - 100.0% | $ | 421,429,650 | ||||||
| (a) | Non-income producing security. |
| (b) | The rate shown is the annualized yield at time of purchase. |
| (c) | The rate shown is the 7-day effective yield as of December 31, 2023. |
ADR- American Depositary Receipt.
| See Notes to Financial Statements. | |
| Semi-Annual Report | December 31, 2023 | 13 |
| James Small Cap Fund | Schedule of Investments |
| December 31, 2023 (Unaudited) |
| Shares | Value | |||||||
| COMMON STOCKS - 95.6% | ||||||||
| Consumer Discretionary - 12.3% | ||||||||
| Boyd Gaming Corporation | 3,895 | $ | 243,866 | |||||
| Brinker International, Inc. (a) | 22,182 | 957,819 | ||||||
| Deckers Outdoor Corporation (a) | 1,888 | 1,261,995 | ||||||
| Marriott Vacations Worldwide Corporation | 2,670 | 226,656 | ||||||
| Oxford Industries, Inc. | 3,040 | 304,000 | ||||||
| Patrick Industries, Inc. | 6,190 | 621,167 | ||||||
| Winmark Corporation | 1,921 | 802,114 | ||||||
| YETI Holdings, Inc. (a) | 6,670 | 345,373 | ||||||
| 4,762,990 | ||||||||
| Consumer Staples - 4.5% | ||||||||
| Andersons, Inc. (The) | 5,993 | 344,838 | ||||||
| Casey’s General Stores, Inc. | 699 | 192,043 | ||||||
| Coca-Cola Consolidated, Inc. | 960 | 891,264 | ||||||
| Ingles Markets, Inc. - Class A | 3,455 | 298,408 | ||||||
| 1,726,553 | ||||||||
| Energy - 4.2% | ||||||||
| Callon Petroleum Company (a) | 10,659 | 345,352 | ||||||
| HF Sinclair Corporation | 8,907 | 494,962 | ||||||
| Magnolia Oil & Gas Corporation - Class A | 19,100 | 406,639 | ||||||
| Matador Resources Company | 6,600 | 375,276 | ||||||
| 1,622,229 | ||||||||
| Financials - 25.2% | ||||||||
| American Equity Investment Life Holding Company (a) | 9,397 | 524,353 | ||||||
| American Financial Group, Inc. | 2,630 | 312,681 | ||||||
| Assured Guaranty Ltd. | 10,300 | 770,748 | ||||||
| Axos Financial, Inc. (a) | 6,132 | 334,807 | ||||||
| Bancorp, Inc. (The) (a) | 7,299 | 281,449 | ||||||
| Enova International, Inc. (a) | 17,830 | 987,069 | ||||||
| Evercore, Inc. - Class A | 6,730 | 1,151,166 | ||||||
| EZCORP, Inc. - Class A (a) | 33,000 | 288,420 | ||||||
| Federated Hermes, Inc. | 7,149 | 242,065 | ||||||
| First BanCorporation | 47,750 | 785,488 | ||||||
| Houlihan Lokey, Inc. | 6,300 | 755,433 | ||||||
| LPL Financial Holdings, Inc. | 1,313 | 298,865 | ||||||
| MGIC Investment Corporation | 37,900 | 731,091 | ||||||
| Piper Sandler Companies | 6,085 | 1,064,084 | ||||||
| Radian Group, Inc. | 26,798 | 765,083 | ||||||
| SouthState Corporation | 5,620 | 474,609 | ||||||
| 9,767,411 | ||||||||
| Health Care - 9.0% | ||||||||
| AMN Healthcare Services, Inc. (a) | 3,900 | 292,032 | ||||||
| Corcept Therapeutics, Inc. (a) | 18,033 | 585,712 | ||||||
| Dynavax Technologies Corporation (a) | 46,770 | 653,845 | ||||||
| Innoviva, Inc. (a) | 35,600 | 571,024 | ||||||
| Integer Holdings Corporation (a) | 4,878 | 483,312 | ||||||
| National HealthCare Corporation | 3,545 | 327,629 | ||||||
| Option Care Helath, Inc. (a) | 10,500 | 353,745 | ||||||
| Varex Imaging Corporation (a) | 11,600 | 237,800 | ||||||
| 3,505,099 | ||||||||
| See Notes to Financial Statements. | |
| 14 | www.jamesinvestment.com |
| James Small Cap Fund | Schedule of Investments |
| December 31, 2023 (Unaudited) |
| Shares | Value | |||||||
| Industrials - 13.1% | ||||||||
| Allegiant Travel Company | 2,400 | $ | 198,264 | |||||
| Boise Cascade Company | 4,976 | 643,695 | ||||||
| Encore Wire Corporation | 6,285 | 1,342,475 | ||||||
| FTI Consulting, Inc. (a) | 5,420 | 1,079,393 | ||||||
| Generac Holdings, Inc. (a) | 4,288 | 554,181 | ||||||
| Hillenbrand, Inc. | 13,136 | 628,558 | ||||||
| WESCO International, Inc. | 3,556 | 618,317 | ||||||
| 5,064,883 | ||||||||
| Information Technology - 11.3% | ||||||||
| Avnet, Inc. | 8,250 | 415,800 | ||||||
| Concentrix Corporation | 2,500 | 245,525 | ||||||
| Insight Enterprises, Inc. (a) | 3,605 | 638,770 | ||||||
| Nova Ltd. (a) | 3,000 | 412,170 | ||||||
| PC Connection, Inc. | 17,500 | 1,176,175 | ||||||
| Progress Software Corporation | 5,935 | 322,271 | ||||||
| Super Micro Computer, Inc. (a) | 2,494 | 708,944 | ||||||
| TD SYNNEX Corporation | 1,100 | 118,371 | ||||||
| Vishay Intertechnology, Inc. | 13,612 | 326,280 | ||||||
| 4,364,306 | ||||||||
| Materials - 6.7% | ||||||||
| Cleveland-Cliffs, Inc. (a) | 24,575 | 501,822 | ||||||
| Graphic Packaging Holding Company | 7,745 | 190,914 | ||||||
| Innospec, Inc. | 5,286 | 651,447 | ||||||
| Schnitzer Steel Industries, Inc. - Class A | 13,820 | 416,811 | ||||||
| Warrior Met Coal, Inc | 13,785 | 840,471 | ||||||
| 2,601,465 | ||||||||
| Real Estate - 5.9% | ||||||||
| Agree Realty Corporation | 6,505 | 409,490 | ||||||
| Healthcare Realty Trust, Inc. | 8,000 | 137,840 | ||||||
| LXP Industrial Trust | 58,560 | 580,915 | ||||||
| Physicians Realty Trust | 21,000 | 279,510 | ||||||
| Sabra Health Care REIT, Inc. | 10,000 | 142,700 | ||||||
| STAG Industrial, Inc. | 6,000 | 235,560 | ||||||
| Terreno Realty Corporation | 4,200 | 263,214 | ||||||
| Xenia Hotel & Resorts, Inc. | 16,940 | 230,723 | ||||||
| 2,279,952 | ||||||||
| Utilities - 3.4% | ||||||||
| IDACORP, Inc. | 3,753 | 368,995 | ||||||
| Otter Tail Corporation | 5,935 | 504,297 | ||||||
| Portland General Electric Company | 10,455 | 453,120 | ||||||
| 1,326,412 | ||||||||
| TOTAL COMMON STOCKS | ||||||||
| (Cost $23,285,005) | $ | 37,021,300 | ||||||
| See Notes to Financial Statements. | |
| Semi-Annual Report | December 31, 2023 | 15 |
| James Small Cap Fund | Schedule of Investments |
| December 31, 2023 (Unaudited) |
| Par Value | Value | |||||||
| U.S. TREASURY OBLIGATIONS - 2.6% | ||||||||
| U.S. Treasury Bills (b)- 2.6% | ||||||||
| 5.444%, due 01/25/24 (Cost $996,511) | $ | 1,000,000 | $ | 996,631 | ||||
| Shares | Value | |||||||
| MONEY MARKET FUNDS - 2.0% | ||||||||
| First American Treasury Obligations Fund - Class X, 5.28% (c) (Cost $779,898) | 779,898 | $ | 779,898 | |||||
| Total Investments at Value - 100.2% | ||||||||
| (Cost $25,061,414) | $ | 38,797,829 | ||||||
| Liabilities in Excess of Other Assets - (0.2%) | (65,335 | ) | ||||||
| Net Assets - 100.0% | $ | 38,732,494 | ||||||
| (a) | Non-income producing security. |
| (b) | The rate shown is the annualized yield at time of purchase. |
| (c) | The rate shown is the 7-day effective yield as of December 31, 2023. |
| See Notes to Financial Statements. | |
| 16 | www.jamesinvestment.com |
| James Micro Cap Fund | Schedule of Investments |
| December 31, 2023 (Unaudited) |
| Shares | Value | |||||||
| COMMON STOCKS - 94.8% | ||||||||
| Consumer Discretionary - 11.9% | ||||||||
| Century Communities, Inc. | 4,662 | $ | 424,895 | |||||
| Haverty Furniture Companies, Inc. | 21,134 | 750,256 | ||||||
| M/I Homes, Inc. (a) | 4,742 | 653,163 | ||||||
| MarineMax, Inc. (a) | 5,750 | 223,675 | ||||||
| Patrick Industries, Inc. | 4,044 | 405,816 | ||||||
| Shoe Carnival, Inc. | 12,950 | 391,220 | ||||||
| Standard Motor Products, Inc. | 5,625 | 223,931 | ||||||
| Zumiez, Inc. (a) | 4,568 | 92,913 | ||||||
| 3,165,869 | ||||||||
| Consumer Staples - 5.7% | ||||||||
| Central Garden & Pet Company - Class A (a) | 13,108 | 577,276 | ||||||
| Ingles Markets, Inc. - Class A | 10,714 | 925,369 | ||||||
| 1,502,645 | ||||||||
| Energy - 6.0% | ||||||||
| Civitas Resources, Inc. | 7,254 | 496,029 | ||||||
| Dorian LPG Ltd. | 19,032 | 834,933 | ||||||
| Vital Energy, Inc. (a) | 5,814 | 264,479 | ||||||
| 1,595,441 | ||||||||
| Financials - 27.1% | ||||||||
| Bancorp, Inc. (The) (a) | 6,900 | 266,064 | ||||||
| Donnelley Financial Solutions, Inc. (a) | 20,288 | 1,265,363 | ||||||
| Enova International, Inc. (a) | 17,016 | 942,006 | ||||||
| Federal Agricultural Mortgage Corporation - Class C | 6,912 | 1,321,712 | ||||||
| Merchants Bancorp | 25,704 | 1,094,476 | ||||||
| Nelnet, Inc. - Class A | 5,646 | 498,090 | ||||||
| OFG Bancorp | 25,456 | 954,091 | ||||||
| Piper Sandler Companies | 4,960 | 867,355 | ||||||
| 7,209,157 | ||||||||
| Health Care - 8.3% | ||||||||
| Cartesian Therapeutics, Inc. (a) | 94,737 | 947 | ||||||
| Innoviva, Inc. (a) | 40,082 | 642,915 | ||||||
| Integer Holdings Corporation (a) | 6,396 | 633,716 | ||||||
| iRadmed Corporation | 2,400 | 113,928 | ||||||
| iTeos Therapeutics, Inc. (a) | 3,964 | 43,406 | ||||||
| Kiniksa Pharmaceuticals, Ltd. - Class A (a) | 6,909 | 121,184 | ||||||
| SIGA Technologies, Inc. | 52,400 | 293,440 | ||||||
| Utah Medical Products, Inc. | 4,200 | 353,724 | ||||||
| 2,203,260 | ||||||||
| Industrials - 11.3% | ||||||||
| ACCO Brands Corporation | 74,997 | 455,982 | ||||||
| ArcBest Corporation | 5,285 | 635,310 | ||||||
| Boise Cascade Company | 2,500 | 323,400 | ||||||
| CRA International, Inc. | 3,384 | 334,508 | ||||||
| Cross Country Healthcare, Inc. (a) | 4,213 | 95,382 | ||||||
| Genco Shipping & Trading Ltd. | 8,000 | 132,720 | ||||||
| Heidrick & Struggles International, Inc. | 3,400 | 100,402 | ||||||
| Insteel Industries, Inc. | 3,500 | 134,015 | ||||||
| Kforce, Inc. | 2,400 | 162,144 | ||||||
| Shyft Group, Inc. (The) | 6,336 | 77,426 | ||||||
| Transcat, Inc. (a) | 2,200 | 240,526 | ||||||
| See Notes to Financial Statements. | |
| Semi-Annual Report | December 31, 2023 | 17 |
| James Micro Cap Fund | Schedule of Investments |
| December 31, 2023 (Unaudited) |
| Shares | Value | |||||||
| Industrials - 11.3% (continued) | ||||||||
| V2X, Inc. (a) | 6,950 | $ | 322,758 | |||||
| 3,014,573 | ||||||||
| Information Technology - 16.6% | ||||||||
| Cohu, Inc. (a) | 8,022 | 283,899 | ||||||
| ePlus, Inc. (a) | 4,600 | 367,264 | ||||||
| Insight Enterprises, Inc. (a) | 5,163 | 914,831 | ||||||
| Nova Ltd. (a) | 8,143 | 1,118,767 | ||||||
| PC Connection, Inc. | 12,184 | 818,887 | ||||||
| Photronics, Inc. (a) | 22,198 | 696,351 | ||||||
| Vishay Precision Group, Inc. (a) | 6,384 | 217,503 | ||||||
| 4,417,502 | ||||||||
| Materials - 5.7% | ||||||||
| Innospec, Inc. | 4,000 | 492,960 | ||||||
| Schnitzer Steel Industries, Inc. - Class A | 18,045 | 544,237 | ||||||
| United States Lime & Minerals, Inc. | 2,070 | 476,825 | ||||||
| 1,514,022 | ||||||||
| Real Estate - 1.4% | ||||||||
| PotlatchDeltic Corporation | 7,517 | 369,085 | ||||||
| Utilities - 0.8% | ||||||||
| Clearway Energy, Inc. - Class C | 7,332 | 201,117 | ||||||
| Total Common Stocks | ||||||||
| (Cost $13,841,553) | $ | 25,192,671 | ||||||
| Par Value | Value | |||||||
| U.S. TREASURY OBLIGATIONS - 3.4% | ||||||||
| U.S. Treasury Bills (b)- 3.4% | �� | |||||||
| 5.069%, due 01/25/24 (Cost $897,134) | $ | 900,000 | $ | 896,968 | ||||
| Shares | Value | |||||||
| MONEY MARKET FUNDS - 1.0% | ||||||||
| First American Treasury Obligations Fund - Class X, 5.28% (c) (Cost $260,425) | 260,425 | $ | 260,425 | |||||
| Total Investments at Value - 99.2% | ||||||||
| (Cost $14,999,112) | $ | 26,350,064 | ||||||
| Other Assets in Excess of Liabilities - 0.8% | 221,371 | |||||||
| Net Assets - 100.0% | $ | 26,571,435 | ||||||
| (a) | Non-income producing security. |
| (b) | The rate shown is the annualized yield at time of purchase. |
| (c) | The rate shown is the 7-day effective yield as of December 31, 2023. |
| See Notes to Financial Statements. | |
| 18 | www.jamesinvestment.com |
| James Aggressive Allocation Fund | Schedule of Investments |
| December 31, 2023 (Unaudited) |
| Shares | Value | |||||||
| COMMON STOCKS - 77.7% | ||||||||
| Communication Services - 8.2% | ||||||||
| Alphabet, Inc. - Class A (a) | 4,750 | $ | 663,528 | |||||
| Comcast Corporation - Class A | 6,645 | 291,383 | ||||||
| Meta Platforms, Inc. - Class A (a) | 1,300 | 460,148 | ||||||
| T-Mobile US, Inc. | 2,300 | 368,759 | ||||||
| 1,783,818 | ||||||||
| Consumer Discretionary - 8.4% | ||||||||
| Best Buy Company, Inc. | 1,815 | 142,078 | ||||||
| Crocs, Inc. (a) | 2,000 | 186,820 | ||||||
| Deckers Outdoor Corporation (a) | 700 | 467,901 | ||||||
| Home Depot, Inc. (The) | 700 | 242,585 | ||||||
| M/I Homes, Inc. (a) | 1,725 | 237,602 | ||||||
| McDonald’s Corporation | 1,000 | 296,510 | ||||||
| Tractor Supply Company | 1,205 | 259,111 | ||||||
| 1,832,607 | ||||||||
| Consumer Staples - 4.0% | ||||||||
| Lamb Weston Holdings, Inc. | 1,500 | 162,135 | ||||||
| PepsiCo, Inc. | 1,100 | 186,824 | ||||||
| Procter & Gamble Company (The) | 1,700 | 249,118 | ||||||
| Walmart, Inc. | 1,700 | 268,005 | ||||||
| 866,082 | ||||||||
| Energy - 4.0% | ||||||||
| Cheniere Energy, Inc. | 845 | 144,250 | ||||||
| Chevron Corporation | 2,000 | 298,320 | ||||||
| Matador Resources Company | 5,000 | 284,300 | ||||||
| Valero Energy Corporation | 1,000 | 130,000 | ||||||
| 856,870 | ||||||||
| Financials - 9.6% | ||||||||
| Bancorp, Inc. (The) (a) | 4,400 | 169,664 | ||||||
| BlackRock, Inc. | 500 | 405,900 | ||||||
| Charles Schwab Corporation (The) | 3,000 | 206,400 | ||||||
| Enova International, Inc. (a) | 8,485 | 469,730 | ||||||
| Goldman Sachs Group, Inc. (The) | 855 | 329,833 | ||||||
| JPMorgan Chase & Company | 2,000 | 340,200 | ||||||
| Primerica, Inc. | 800 | 164,608 | ||||||
| 2,086,335 | ||||||||
| Health Care - 10.8% | ||||||||
| Abbott Laboratories | 2,625 | 288,934 | ||||||
| AbbVie, Inc. | 1,250 | 193,713 | ||||||
| AstraZeneca plc - ADR | 4,000 | 269,400 | ||||||
| Danaher Corporation | 825 | 190,856 | ||||||
| Eli Lilly & Company | 600 | 349,751 | ||||||
| Johnson & Johnson | 1,295 | 202,978 | ||||||
| Novo Nordisk A/S - ADR | 2,000 | 206,900 | ||||||
| UnitedHealth Group, Inc. | 610 | 321,147 | ||||||
| Zoetis, Inc. | 1,595 | 314,805 | ||||||
| 2,338,484 | ||||||||
| Industrials - 5.8% | ||||||||
| ABB Ltd. - ADR | 3,500 | 155,050 | ||||||
| Caterpillar, Inc. | 800 | 236,536 | ||||||
| Deere & Company | 435 | 173,943 | ||||||
| Eaton Corporation plc | 1,175 | 282,963 | ||||||
| See Notes to Financial Statements. | |
| Semi-Annual Report | December 31, 2023 | 19 |
| James Aggressive Allocation Fund | Schedule of Investments |
| December 31, 2023 (Unaudited) |
| Shares | Value | |||||||
| Industrials - 5.8% (continued) | ||||||||
| Lockheed Martin Corporation | 415 | $ | 188,095 | |||||
| Union Pacific Corporation | 850 | 208,777 | ||||||
| Veralto Corporation | 275 | 22,622 | ||||||
| 1,267,986 | ||||||||
| Information Technology - 18.6% | ||||||||
| Accenture plc - Class A | 465 | 163,173 | ||||||
| Apple, Inc. | 3,300 | 635,349 | ||||||
| ASML Holding N.V. | 550 | 416,306 | ||||||
| Broadcom, Inc. | 300 | 334,875 | ||||||
| Cadence Design Systems, Inc. (a) | 2,000 | 544,740 | ||||||
| Cisco Systems, Inc. | 1,500 | 75,780 | ||||||
| Jabil, Inc. | 1,800 | 229,320 | ||||||
| Mastercard, Inc. - Class A | 735 | 313,485 | ||||||
| Microsoft Corporation | 1,690 | 635,508 | ||||||
| NVIDIA Corporation | 1,400 | 693,307 | ||||||
| 4,041,843 | ||||||||
| Materials - 3.3% | ||||||||
| Albemarle Corporation | 825 | 119,196 | ||||||
| CF Industries Holdings, Inc. | 500 | 39,750 | ||||||
| James Hardie Industries plc - ADR (a) | 6,800 | 262,956 | ||||||
| Linde plc | 400 | 164,284 | ||||||
| Nucor Corporation | 700 | 121,828 | ||||||
| 708,014 | ||||||||
| Real Estate - 2.7% | ||||||||
| Digital Realty Trust, Inc. | 1,500 | 201,870 | ||||||
| Prologis, Inc. | 2,905 | 387,237 | ||||||
| 589,107 | ||||||||
| Utilities - 2.3% | ||||||||
| American Water Works Company, Inc. | 750 | 98,993 | ||||||
| Iberdrola S.A. - ADR | 2,000 | 105,000 | ||||||
| NextEra Energy, Inc. | 3,480 | 211,374 | ||||||
| Sempra | 1,220 | 91,171 | ||||||
| 506,538 | ||||||||
| Total Common Stocks | ||||||||
| (Cost $11,824,744) | $ | 16,877,684 | ||||||
| Par Value | Value | |||||||
| CORPORATE BONDS - 5.8% | ||||||||
| Consumer Discretionary - 2.0% | ||||||||
| Starbucks Corporation, 2.550%, due 11/15/30 | $ | 500,000 | $ | 442,211 | ||||
| Financials - 2.0% | ||||||||
| Bank of Montreal, 2.000%, due 12/22/26 | 200,000 | 181,390 | ||||||
| Citigroup, Inc., 3.875%, due 03/26/25 | 250,000 | 245,327 | ||||||
| 426,717 | ||||||||
| Health Care - 1.0% | ||||||||
| AstraZeneca plc, 0.700%, due 04/08/26 | 250,000 | 230,146 | ||||||
| See Notes to Financial Statements. | |
| 20 | www.jamesinvestment.com |
| James Aggressive Allocation Fund | Schedule of Investments |
| December 31, 2023 (Unaudited) |
| Par Value | Value | |||||||
| Information Technology - 0.8% | ||||||||
| Automatic Data Processing, Inc., 1.250%, due 09/01/30 | $ | 200,000 | $ | 166,470 | ||||
| Total Corporate Bonds | ||||||||
| (Cost $1,402,436) | $ | 1,265,544 | ||||||
| Par Value | Value | |||||||
| U.S. GOVERNMENT & AGENCIES - 5.9% | ||||||||
| Federal Farm Credit Bank - 2.2% | ||||||||
| 0.670%, due 08/04/25 | $ | 500,000 | $ | 469,840 | ||||
| Federal Home Loan Bank - 0.5% | ||||||||
| 3.650%, due 07/19/24 | 100,000 | 99,217 | ||||||
| Federal Home Loan Mortgage Corporation - 1.1% | ||||||||
| 3.125%, due 06/28/24 | 250,000 | 247,535 | ||||||
| Federal National Mortgage Association - 2.1% | ||||||||
| 0.560%, due 10/22/25 | 500,000 | 465,847 | ||||||
| Total U.S. Government & Agencies | ||||||||
| (Cost $1,350,000) | $ | 1,282,439 | ||||||
| Par Value | Value | |||||||
| U.S. TREASURY OBLIGATIONS - 8.7% | ||||||||
| U.S. Treasury Bills (b)- 1.1% | ||||||||
| 5.385%, due 08/08/24 | $ | 250,000 | $ | 242,806 | ||||
| U.S. Treasury Bonds - 2.4% | ||||||||
| 2.250%, due 08/15/49 | 750,000 | 523,652 | ||||||
| U.S. Treasury Notes - 5.2% | ||||||||
| 0.250%, due 03/15/24 | 500,000 | 495,020 | ||||||
| 1.125%, due 02/28/25 | 400,000 | 384,203 | ||||||
| 2.625%, due 02/15/29 | 250,000 | 235,371 | ||||||
| 1,114,594 | ||||||||
| Total U.S. Treasury Obligations | ||||||||
| (Cost $1,882,411) | $ | 1,881,052 | ||||||
| See Notes to Financial Statements. | |
| Semi-Annual Report | December 31, 2023 | 21 |
| James Aggressive Allocation Fund | Schedule of Investments |
| December 31, 2023 (Unaudited) |
| Shares | Value | |||||||
| MONEY MARKET FUNDS - 1.9% | ||||||||
| First American Treasury Obligations Fund - Class X, 5.28% (c) (Cost $409,822) | 409,822 | $ | 409,822 | |||||
| Total Investments at Value - 100.0% | ||||||||
| (Cost $16,869,413) | $ | 21,716,541 | ||||||
| Other Assets in Excess of Liabilities - 0.0% (d) | 10,772 | |||||||
| Net Assets - 100.0% | $ | 21,727,313 | ||||||
| (a) | Non-income producing security. |
| (b) | The rate shown is the annualized yield at time of purchase. |
| (c) | The rate shown is the 7-day effective yield as of December 31, 2023. |
| (d) | Percentage rounds to less than 0.1%. |
ADR- American Depositary Receipt.
| See Notes to Financial Statements. | |
| 22 | www.jamesinvestment.com |
| James Advantage Funds | Statements of Assets and Liabilities |
| December 31, 2023 (Unaudited) |
| James Balanced: | ||||||||||||||||
| Golden Rainbow | James Small | James Micro | James Aggressive | |||||||||||||
| Fund | Cap Fund | Cap Fund | Allocation Fund | |||||||||||||
| ASSETS | ||||||||||||||||
| Investment securities: | ||||||||||||||||
| At cost | $ | 342,452,094 | $ | 25,061,414 | $ | 14,999,112 | $ | 16,869,413 | ||||||||
| At value | 421,133,886 | 38,797,829 | 26,350,064 | 21,716,541 | ||||||||||||
| Receivable for capital shares sold | 69,185 | 4,691 | 266,835 | — | ||||||||||||
| Dividends and interest receivable | 1,054,744 | 28,980 | 12,665 | 29,984 | ||||||||||||
| Tax reclaims receivable | 19,294 | — | — | 1,428 | ||||||||||||
| Other assets | 50,118 | 1,296 | 886 | — | ||||||||||||
| Total Assets | 422,327,227 | 38,832,796 | 26,630,450 | 21,747,953 | ||||||||||||
| LIABILITIES | ||||||||||||||||
| Payable for capital shares redeemed | 439,418 | 35,834 | 23,522 | 160 | ||||||||||||
| Accrued expenses: | ||||||||||||||||
| Management fees (Note 4) | 262,774 | 40,044 | 32,546 | 17,755 | ||||||||||||
| Administration fees (Note 4) | 13,259 | — | — | — | ||||||||||||
| 12b-1 distribution and service fees (Note 4) | 68,590 | 20,423 | — | — | ||||||||||||
| Trustee fees (Note 4) | 27,224 | 4,001 | 2,947 | 2,725 | ||||||||||||
| Other accrued expenses | 86,312 | — | — | — | ||||||||||||
| Total Liabilities | 897,577 | 100,302 | 59,015 | 20,640 | ||||||||||||
| Net Assets | $ | 421,429,650 | $ | 38,732,494 | $ | 26,571,435 | $ | 21,727,313 | ||||||||
| NET ASSETS CONSIST OF | ||||||||||||||||
| Paid-in capital | $ | 339,743,330 | $ | 24,006,671 | $ | 15,540,381 | $ | 17,722,590 | ||||||||
| Accumulated Earnings | 81,686,320 | 14,725,823 | 11,031,054 | 4,004,723 | ||||||||||||
| Net Assets | $ | 421,429,650 | $ | 38,732,494 | $ | 26,571,435 | $ | 21,727,313 | ||||||||
| PRICING OF RETAIL CLASS SHARES | ||||||||||||||||
| Net assets | $ | 330,225,478 | N/A | N/A | N/A | |||||||||||
| Shares of beneficial interest outstanding (unlimited number of shares authorized, no par) | 16,145,908 | N/A | N/A | N/A | ||||||||||||
| Net assets value, offering price and redemption price per share | $ | 20.45 | N/A | N/A | N/A | |||||||||||
| PRICING OF INSTITUTIONAL CLASS SHARES | ||||||||||||||||
| Net assets | $ | 91,204,172 | N/A | N/A | N/A | |||||||||||
| Shares of beneficial interest outstanding (unlimited number of shares authorized, no par) | 4,538,846 | N/A | N/A | N/A | ||||||||||||
| Net assets value, offering price and redemption price per share | $ | 20.09 | N/A | N/A | N/A | |||||||||||
| PRICING OF SHARES | ||||||||||||||||
| Net assets | N/A | $ | 38,732,494 | $ | 26,571,435 | $ | 21,727,313 | |||||||||
| Shares of beneficial interest outstanding (unlimited number of shares authorized, no par) | N/A | 1,119,397 | 1,293,934 | 1,819,946 | ||||||||||||
| Net assets value, offering price and redemption price per share | N/A | $ | 34.60 | $ | 20.54 | $ | 11.94 | |||||||||
| See Notes to Financial Statements. | |
| Semi-Annual Report | December 31, 2023 | 23 |
| James Advantage Funds | Statements of Operations |
| For the Six Months Ended December 31, 2023 (Unaudited) |
| James Balanced: | ||||||||||||||||
| Golden Rainbow | James Small | James Micro | James Aggressive | |||||||||||||
| Fund | Cap Fund | Cap Fund | Allocation Fund | |||||||||||||
| INVESTMENT INCOME | ||||||||||||||||
| Dividends (Net of withholding taxes of $7,243, $1,003, $0 and $192, respectively) | $ | 1,683,176 | $ | 313,948 | $ | 232,858 | $ | 118,095 | ||||||||
| Interest | 3,259,138 | 21,950 | 21,970 | 48,573 | ||||||||||||
| Total Income | 4,942,314 | 335,898 | 254,828 | 166,668 | ||||||||||||
| EXPENSES | ||||||||||||||||
| Management fees (Note 4) | 1,562,880 | 215,581 | 173,117 | 98,733 | ||||||||||||
| 12b-1 distribution and service fees - Retail Class (Note 4) | 414,969 | — | — | — | ||||||||||||
| 12b-1 distribution and service fees (Note 4) | — | 44,656 | — | — | ||||||||||||
| Administration fees (Note 4) | 105,603 | — | — | — | ||||||||||||
| Trustee fees and expenses (Note 4) | 90,112 | 7,698 | 5,255 | 4,418 | ||||||||||||
| Audit and tax services fees | 44,101 | — | — | — | ||||||||||||
| Transfer agent fees (Note 4) | 42,649 | — | — | — | ||||||||||||
| Legal fees | 37,422 | — | — | — | ||||||||||||
| Insurance fees | 27,521 | — | — | — | ||||||||||||
| Registration fees | 21,285 | — | — | — | ||||||||||||
| Custodian fees | 16,496 | — | — | — | ||||||||||||
| Shareholder reporting expenses | 2,266 | — | — | — | ||||||||||||
| Other expenses | 53,123 | — | — | — | ||||||||||||
| Total Expenses | 2,418,427 | 267,935 | 178,372 | 103,151 | ||||||||||||
| Net Investment Income | 2,523,887 | 67,963 | 76,456 | 63,517 | ||||||||||||
| REALIZED AND UNREALIZED GAINS (LOSSES) ON INVESTMENTS | ||||||||||||||||
| Net realized gains (losses) from investment transactions | 5,264,551 | 921,552 | 124,188 | (98,428 | ) | |||||||||||
| Net change in unrealized appreciation (depreciation) on investments | 13,125,090 | 3,908,952 | 3,967,945 | 1,517,665 | ||||||||||||
| Net Realized and Unrealized Gains on Investments | 18,389,641 | 4,830,504 | 4,092,133 | 1,419,237 | ||||||||||||
| Net Increase in Net Assets Resulting from Operations | $ | 20,913,528 | $ | 4,898,467 | $ | 4,168,589 | $ | 1,482,754 | ||||||||
| See Notes to Financial Statements. | |
| 24 | www.jamesinvestment.com |
| James Balanced: Golden Rainbow Fund | Statements of Changes in Net Assets |
| For the | ||||||||
| Six Months Ended | ||||||||
| December 31, | For the | |||||||
| 2023 | Year Ended | |||||||
| (Unaudited) | June 30, 2023 | |||||||
| FROM OPERATIONS | ||||||||
| Net investment income | $ | 2,523,887 | $ | 5,487,744 | ||||
| Net realized gains from investment transactions | 5,264,551 | 7,209,330 | ||||||
| Net change in unrealized appreciation (depreciation) on investments | 13,125,090 | 14,730,213 | ||||||
| Net increase in net assets resulting from operations | 20,913,528 | 27,427,287 | ||||||
| DISTRIBUTIONS TO SHAREHOLDERS (Note 2) | ||||||||
| Retail Class Shares | (5,096,277 | ) | (17,821,373 | ) | ||||
| Institutional Class | (1,524,579 | ) | (5,557,368 | ) | ||||
| Decrease in net assets from distributions to shareholders | (6,620,856 | ) | (23,378,741 | ) | ||||
| CAPITAL SHARE TRANSACTIONS: | ||||||||
| Retail Class Shares | ||||||||
| Proceeds from shares sold | 1,826,477 | 5,169,408 | ||||||
| Net asset value of shares issued in reinvestment of distributions to shareholders | 5,015,057 | 17,394,078 | ||||||
| Payments for shares redeemed | (26,311,552 | ) | (67,278,578 | ) | ||||
| Net decrease in net assets from Retail Class capital share transactions | (19,470,018 | ) | (44,715,092 | ) | ||||
| Institutional Class Shares | ||||||||
| Proceeds from shares sold | 4,422,540 | 5,724,232 | ||||||
| Net asset value of shares issued in reinvestment of distributions to shareholders | 1,472,488 | 5,201,476 | ||||||
| Payments for shares redeemed | (11,540,368 | ) | (24,221,764 | ) | ||||
| Net decrease in net assets from Institutional Class capital share transactions | (5,645,340 | ) | (13,296,056 | ) | ||||
| Total decrease in net assets | (10,822,686 | ) | (53,962,602 | ) | ||||
| NET ASSETS: | ||||||||
| Beginning of period | 432,252,336 | 486,214,938 | ||||||
| End of period | $ | 421,429,650 | $ | 432,252,336 | ||||
| CAPITAL SHARE ACTIVITY | ||||||||
| Retail Class | ||||||||
| Shares sold | 91,858 | 265,747 | ||||||
| Shares issued in reinvestment of distributions to shareholders | 252,458 | 913,750 | ||||||
| Shares redeemed | (1,331,148 | ) | (3,478,060 | ) | ||||
| Net decrease in shares outstanding | (986,832 | ) | (2,298,563 | ) | ||||
| Shares outstanding, beginning of period | 17,132,740 | 19,431,303 | ||||||
| Shares outstanding, end of period | 16,145,908 | 17,132,740 | ||||||
| Institutional Class Shares | ||||||||
| Shares sold | 226,559 | 300,675 | ||||||
| Shares issued in reinvestment of distributions to shareholders | 75,413 | 277,703 | ||||||
| Shares redeemed | (594,086 | ) | (1,276,089 | ) | ||||
| Net decrease in shares outstanding | (292,114 | ) | (697,711 | ) | ||||
| Shares outstanding, beginning of period | 4,830,960 | 5,528,671 | ||||||
| Shares outstanding, end of period | 4,538,846 | 4,830,960 | ||||||
| See Notes to Financial Statements. | |
| Semi-Annual Report | December 31, 2023 | 25 |
| James Small Cap Fund | Statements of Changes in Net Assets |
| For the | ||||||||
| Six Months Ended | ||||||||
| December 31, | For the | |||||||
| 2023 | Year Ended | |||||||
| (Unaudited) | June 30, 2023 | |||||||
| FROM OPERATIONS | ||||||||
| Net investment income | $ | 67,963 | $ | 121,182 | ||||
| Net realized gains from investment transactions | 921,552 | 105,071 | ||||||
| Net change in unrealized appreciation (depreciation) on investments | 3,908,952 | 4,708,361 | ||||||
| Net increase in net assets resulting from operations | 4,898,467 | 4,934,614 | ||||||
| DISTRIBUTIONS TO SHAREHOLDERS (Note 2) | (223,700 | ) | (2,074,237 | ) | ||||
| CAPITAL SHARE TRANSACTIONS | ||||||||
| Proceeds from shares sold | 310,144 | 679,374 | ||||||
| Net asset value of shares issued in reinvestment of distributions to shareholders | 219,561 | 2,031,225 | ||||||
| Payments for shares redeemed | (1,258,892 | ) | (3,544,334 | ) | ||||
| Net decrease in net assets from capital share transactions | (729,187 | ) | (833,735 | ) | ||||
| Total increase in net assets | 3,945,580 | 2,026,642 | ||||||
| NET ASSETS | ||||||||
| Beginning of period | 34,786,914 | 32,760,272 | ||||||
| End of period | $ | 38,732,494 | $ | 34,786,914 | ||||
| CAPITAL SHARE ACTIVITY | ||||||||
| Shares sold | 9,852 | 22,888 | ||||||
| Shares issued in reinvestment of distributions to shareholders | 6,537 | 70,981 | ||||||
| Shares redeemed | (39,801 | ) | (123,013 | ) | ||||
| Net decrease in shares outstanding | (23,412 | ) | (29,144 | ) | ||||
| Shares outstanding, beginning of period | 1,142,809 | 1,171,953 | ||||||
| Shares outstanding, end of period | 1,119,397 | 1,142,809 | ||||||
| See Notes to Financial Statements. | |
| 26 | www.jamesinvestment.com |
| James Micro Cap Fund | Statements of Changes in Net Assets |
| For the | ||||||||
| Six Months Ended | ||||||||
| December 31, | For the | |||||||
| 2023 | Year Ended | |||||||
| (Unaudited) | June 30, 2023 | |||||||
| FROM OPERATIONS | ||||||||
| Net investment income | $ | 76,456 | $ | 142,510 | ||||
| Net realized gains (losses) from investment transactions | 124,188 | (364,636 | ) | |||||
| Net change in unrealized appreciation (depreciation) on investments | 3,967,945 | 3,463,217 | ||||||
| Net increase in net assets resulting from operations | 4,168,589 | 3,241,091 | ||||||
| DISTRIBUTIONS TO SHAREHOLDERS (Note 2) | (163,890 | ) | (1,830,954 | ) | ||||
| CAPITAL SHARE TRANSACTIONS | ||||||||
| Proceeds from shares sold | 523,632 | 85,589 | ||||||
| Net asset value of shares issued in reinvestment of distributions to shareholders | 162,067 | 1,803,440 | ||||||
| Payments for shares redeemed, net redemption fees | (799,598 | ) | (2,894,276 | ) | ||||
| Net decrease in net assets from capital share transactions | (113,899 | ) | (1,005,247 | ) | ||||
| Total increase in net assets | 3,890,800 | 404,890 | ||||||
| NET ASSETS | ||||||||
| Beginning of period | 22,680,635 | 22,275,745 | ||||||
| End of period | $ | 26,571,435 | $ | 22,680,635 | ||||
| CAPITAL SHARE ACTIVITY | ||||||||
| Shares sold | 27,238 | 4,984 | ||||||
| Shares issued in reinvestment of distributions to shareholders | 7,810 | 111,320 | ||||||
| Shares redeemed | (40,371 | ) | (172,004 | ) | ||||
| Net decrease in shares outstanding | (5,323 | ) | (55,700 | ) | ||||
| Shares outstanding, beginning of period | 1,299,257 | 1,354,957 | ||||||
| Shares outstanding, end of period | 1,293,934 | 1,299,257 | ||||||
| See Notes to Financial Statements. | |
| Semi-Annual Report | December 31, 2023 | 27 |
| James Aggressive Allocation Fund | Statements of Changes in Net Assets |
| For the | ||||||||
| Six Months Ended | ||||||||
| December 31, | For the | |||||||
| 2023 | Year Ended | |||||||
| (Unaudited) | June 30, 2023 | |||||||
| FROM OPERATIONS | ||||||||
| Net investment income | $ | 63,517 | $ | 167,833 | ||||
| Net realized gains (losses) from investment transactions | (98,428 | ) | 250,927 | |||||
| Net change in unrealized appreciation (depreciation) on investments | 1,517,665 | 2,248,826 | ||||||
| Net increase in net assets resulting from operations | 1,482,754 | 2,667,586 | ||||||
| DISTRIBUTIONS TO SHAREHOLDERS (Note 2) | (135,785 | ) | (148,040 | ) | ||||
| CAPITAL SHARE TRANSACTIONS | ||||||||
| Proceeds from shares sold | 2,747,763 | 143,095 | ||||||
| Net asset value of shares issued in reinvestment of distributions to shareholders | 130,771 | 145,414 | ||||||
| Payments for shares redeemed | (2,152,768 | ) | (2,208,590 | ) | ||||
| Net increase (decrease) in net assets from capital share transactions | 725,766 | (1,920,081 | ) | |||||
| Total increase in net assets | 2,072,735 | 599,465 | ||||||
| NET ASSETS | ||||||||
| Beginning of period | 19,654,578 | 19,055,113 | ||||||
| End of period | $ | 21,727,313 | $ | 19,654,578 | ||||
| SUMMARY OF CAPITAL SHARE ACTIVITY | ||||||||
| Shares sold | 232,883 | 13,913 | ||||||
| Shares issued in reinvestment of distributions to shareholders | 10,925 | 14,570 | ||||||
| Shares redeemed | (180,705 | ) | (214,129 | ) | ||||
| Net increase (decrease) in shares outstanding | 63,103 | (185,646 | ) | |||||
| Shares outstanding, beginning of period | 1,756,843 | 1,942,489 | ||||||
| Shares outstanding, end of period | 1,819,946 | 1,756,843 | ||||||
| See Notes to Financial Statements. | |
| 28 | www.jamesinvestment.com |
| James Balanced: Golden Rainbow Fund – Retail Class | Financial Highlights |
| Per share data for a share outstanding throughout each period: | |
| For the | ||||||||||||||||||||||||
| Six Months | ||||||||||||||||||||||||
| Ended | For the | For the | For the | For the | For the | |||||||||||||||||||
| December 31, 2023 | Year Ended | Year Ended | Year Ended | Year Ended | Year Ended | |||||||||||||||||||
| (Unaudited) | June 30, 2023 | June 30, 2022 | June 30, 2021 | June 30, 2020 | June 30, 2019 | |||||||||||||||||||
| Net asset value - beginning of period | $ | 19.76 | $ | 19.54 | $ | 22.94 | $ | 20.08 | $ | 20.69 | $ | 23.32 | ||||||||||||
| Income (loss) from investment operations: | ||||||||||||||||||||||||
| Net investment income(a) | 0.11 | 0.22 | 0.15 | 0.17 | 0.26 | 0.25 | ||||||||||||||||||
| Net realized and unrealized gains (losses) on investments and foreign currencies | 0.90 | 0.98 | (2.02 | ) | 2.90 | (0.50 | ) | (0.64 | ) | |||||||||||||||
| Total from investment operations | 1.01 | 1.20 | (1.87 | ) | 3.07 | (0.24 | ) | (0.39 | ) | |||||||||||||||
| Less distributions from: | ||||||||||||||||||||||||
| Net investment income | (0.13 | ) | (0.21 | ) | (0.16 | ) | (0.18 | ) | (0.22 | ) | (0.29 | ) | ||||||||||||
| Net realized gains on investments | (0.19 | ) | (0.77 | ) | (1.37 | ) | (0.03 | ) | (0.15 | ) | (1.95 | ) | ||||||||||||
| Total distributions | (0.32 | ) | (0.98 | ) | (1.53 | ) | (0.21 | ) | (0.37 | ) | (2.24 | ) | ||||||||||||
| Net asset value at end of period | $ | 20.45 | $ | 19.76 | $ | 19.54 | $ | 22.94 | $ | 20.08 | $ | 20.69 | ||||||||||||
| Total return | 5.13 | % (b) | 6.41 | % | (8.97 | )% | 15.38 | % | (1.18 | )% | (1.24 | )% | ||||||||||||
| Net assets, end of period (in thousands) | $ | 330,225 | $ | 338,463 | $ | 379,714 | $ | 485,082 | $ | 534,314 | $ | 771,733 | ||||||||||||
| Ratios/Supplemental Data: | ||||||||||||||||||||||||
| Ratio of expenses to average net assets | 1.20 | % (c) | 1.23 | % | 1.18 | % | 1.16 | % | 1.13 | % | 1.06 | % | ||||||||||||
| Ratio of net investment income to average net assets | 1.14 | % (c) | 1.16 | % | 0.68 | % | 0.81 | % | 1.25 | % | 1.14 | % | ||||||||||||
| Portfolio turnover rate | 6 | % (b) | 34 | % | 26 | % | 57 | % | 36 | % | 71 | % | ||||||||||||
| (a) | Calculated using the average shares method. |
| (b) | Not annualized. |
| (c) | Annualized. |
| See Notes to Financial Statements. | |
| Semi-Annual Report | December 31, 2023 | 29 |
| James Balanced: Golden Rainbow Fund – Institutional Class | Financial Highlights |
| Per share data for a share outstanding throughout each period: | |
| For the | ||||||||||||||||||||||||
| Six Months | ||||||||||||||||||||||||
| Ended | For the | For the | For the | For the | For the | |||||||||||||||||||
| December 31, 2023 | Year Ended | Year Ended | Year Ended | Year Ended | Year Ended | |||||||||||||||||||
| (Unaudited) | June 30, 2023 | June 30, 2022 | June 30, 2021 | June 30, 2020 | June 30, 2019 | |||||||||||||||||||
| Net asset value - beginning of period | $ | 19.41 | $ | 19.26 | $ | 22.63 | $ | 19.82 | $ | 20.43 | $ | 23.06 | ||||||||||||
| Income (loss) from investment operations: | ||||||||||||||||||||||||
| Net investment income(a) | 0.14 | 0.27 | 0.20 | 0.22 | 0.31 | 0.30 | ||||||||||||||||||
| Net realized and unrealized gains (losses) on investments and foreign currencies | 0.88 | 0.95 | (1.99 | ) | 2.86 | (0.50 | ) | (0.63 | ) | |||||||||||||||
| Total from investment operations | 1.02 | 1.22 | (1.79 | ) | 3.08 | (0.19 | ) | (0.33 | ) | |||||||||||||||
| Less distributions from: | ||||||||||||||||||||||||
| Net investment income | (0.15 | ) | (0.30 | ) | (0.21 | ) | (0.24 | ) | (0.27 | ) | (0.35 | ) | ||||||||||||
| Net realized gains on investments | (0.19 | ) | (0.77 | ) | (1.37 | ) | (0.03 | ) | (0.15 | ) | (1.95 | ) | ||||||||||||
| Total distributions | (0.34 | ) | (1.07 | ) | (1.58 | ) | (0.27 | ) | (0.42 | ) | (2.30 | ) | ||||||||||||
| Net asset value at end of period | $ | 20.09 | $ | 19.41 | $ | 19.26 | $ | 22.63 | $ | 19.82 | $ | 20.43 | ||||||||||||
| Total return | 5.30 | % (b) | 6.64 | % | (8.73 | )% | 15.63 | % | (0.93 | )% | (0.99 | )% | ||||||||||||
| Net assets, end of period (in thousands) | $ | 91,204 | $ | 93,789 | $ | 106,501 | $ | 139,806 | $ | 171,173 | $ | 304,290 | ||||||||||||
| Ratios/Supplemental Data: | ||||||||||||||||||||||||
| Ratio of expenses to average net assets | 0.95 | % (c) | 0.98 | % | 0.93 | % | 0.91 | % | 0.88 | % | 0.80 | % | ||||||||||||
| Ratio of net investment income to average net assets | 1.39 | % (c) | 1.40 | % | 0.92 | % | 1.06 | % | 1.51 | % | 1.38 | % | ||||||||||||
| Portfolio turnover rate | 6 | % (b) | 34 | % | 26 | % | 57 | % | 36 | % | 71 | % | ||||||||||||
| (a) | Calculated using the average shares method. |
| (b) | Not annualized. |
| (c) | Annualized. |
| See Notes to Financial Statements. | |
| 30 | www.jamesinvestment.com |
| James Small Cap Fund | Financial Highlights |
| Per share data for a share outstanding throughout each period: | |
| For the | ||||||||||||||||||||||||
| Six Months | ||||||||||||||||||||||||
| Ended | For the | For the | For the | For the | For the | |||||||||||||||||||
| December 31, 2023 | Year Ended | Year Ended | Year Ended | Year Ended | Year Ended | |||||||||||||||||||
| (Unaudited) | June 30, 2023 | June 30, 2022 | June 30, 2021 | June 30, 2020 | June 30, 2019 | |||||||||||||||||||
| Net asset value - beginning of period | $ | 30.44 | $ | 27.95 | $ | 30.46 | $ | 18.80 | $ | 23.22 | $ | 30.13 | ||||||||||||
| Income (loss) from investment operations: | ||||||||||||||||||||||||
| Net investment income (loss)(a) | 0.06 | 0.11 | 0.13 | 0.09 | 0.10 | (0.01 | ) | |||||||||||||||||
| Net realized and unrealized gains (losses) on investments | 4.30 | 4.19 | (2.55 | ) | 11.70 | (4.52 | ) | (4.76 | ) | |||||||||||||||
| Total from investment operations | 4.36 | 4.30 | (2.42 | ) | 11.79 | (4.42 | ) | (4.77 | ) | |||||||||||||||
| Less distributions from: | ||||||||||||||||||||||||
| Net investment income | (0.11 | ) | (0.14 | ) | (0.09 | ) | (0.13 | ) | — | — | ||||||||||||||
| Net realized gains on investments | (0.09 | ) | (1.67 | ) | — | — | — | (2.14 | ) | |||||||||||||||
| Total distributions | (0.20 | ) | (1.81 | ) | (0.09 | ) | (0.13 | ) | — | (2.14 | ) | |||||||||||||
| Net asset value at end of period | $ | 34.60 | $ | 30.44 | $ | 27.95 | $ | 30.46 | $ | 18.80 | $ | 23.22 | ||||||||||||
| Total return | 14.34 | % (b) | 15.83 | % | (7.99 | )% | 62.87 | % | (19.04 | )% | (15.63 | )% | ||||||||||||
| Net assets, end of period (in thousands) | $ | 38,732 | $ | 34,787 | $ | 32,760 | $ | 39,859 | $ | 29,006 | $ | 42,266 | ||||||||||||
| Ratios/Supplemental Data: | ||||||||||||||||||||||||
| Ratio of expenses to average net assets | 1.50 | % (c) | 1.50 | % | 1.50 | % | 1.50 | % | 1.50 | % | 1.50 | % | ||||||||||||
| Ratio of net investment income (loss) to average net assets | 0.38 | % (c) | 0.36 | % | 0.42 | % | 0.36 | % | 0.46 | % | (0.02 | )% | ||||||||||||
| Portfolio turnover rate | 6 | % (b) | 18 | % | 34 | % | 42 | % | 35 | % | 75 | % | ||||||||||||
| (a) | Calculated using the average shares method. |
| (b) | Not annualized. |
| (c) | Annualized. |
| See Notes to Financial Statements. | |
| Semi-Annual Report | December 31, 2023 | 31 |
| James Micro Cap Fund | Financial Highlights |
| Per share data for a share outstanding throughout each period: | |
| For the | ||||||||||||||||||||||||
| Six Months | ||||||||||||||||||||||||
| Ended | For the | For the | For the | For the | For the | |||||||||||||||||||
| December 31, 2023 | Year Ended | Year Ended | Year Ended | Year Ended | Year Ended | |||||||||||||||||||
| (Unaudited) | June 30, 2023 | June 30, 2022 | June 30, 2021 | June 30, 2020 | June 30, 2019 | |||||||||||||||||||
| Net asset value - beginning of period | $ | 17.46 | $ | 16.44 | $ | 19.54 | $ | 12.73 | $ | 15.92 | $ | 17.88 | ||||||||||||
| Income (loss) from investment operations: | ||||||||||||||||||||||||
| Net investment income (a) | 0.06 | 0.11 | 0.06 | 0.01 | 0.06 | 0.01 | ||||||||||||||||||
| Net realized and unrealized gains (losses) on investments | 3.15 | 2.34 | (2.37 | ) | 6.88 | (2.70 | ) | (1.06 | ) | |||||||||||||||
| Total from investment operations | 3.21 | 2.45 | (2.31 | ) | 6.89 | (2.64 | ) | (1.05 | ) | |||||||||||||||
| Less distributions from: | ||||||||||||||||||||||||
| Net investment income | (0.13 | ) | (0.09 | ) | (0.01 | ) | (0.07 | ) | (0.04 | ) | — | |||||||||||||
| Net realized gains on investments | — | (1.34 | ) | (0.78 | ) | (0.01 | ) | (0.51 | ) | (0.91 | ) | |||||||||||||
| Total distributions | (0.13 | ) | (1.43 | ) | (0.79 | ) | (0.08 | ) | (0.55 | ) | (0.91 | ) | ||||||||||||
| Paid-in capital from redemption fees | 0.00 | (b) | — | 0.00 | (b) | 0.00 | (b) | 0.00 | (b) | 0.00 | (b) | |||||||||||||
| Net asset value at end of period | $ | 20.54 | $ | 17.46 | $ | 16.44 | $ | 19.54 | $ | 12.73 | $ | 15.92 | ||||||||||||
| Total return | 18.37 | % (c) | 15.66 | % | (12.56 | )% | 54.32 | % | (17.38 | )% | (5.25 | )% | ||||||||||||
| Net assets, end of period (in thousands) | $ | 26,571 | $ | 22,681 | $ | 22,276 | $ | 29,345 | $ | 19,580 | $ | 26,600 | ||||||||||||
| Ratios/Supplemental Data: | ||||||||||||||||||||||||
| Ratio of expenses to average net assets | 1.50 | % (d) | 1.50 | % | 1.50 | % | 1.50 | % | 1.50 | % | 1.50 | % | ||||||||||||
| Ratio of net investment income (loss) to average net assets | 0.64 | % (d) | 0.64 | % | 0.30 | % | 0.03 | % | 0.41 | % | 0.05 | % | ||||||||||||
| Portfolio turnover rate | 0 | % (c) | 5 | % | 20 | % | 55 | % | 35 | % | 65 | % | ||||||||||||
| (a) | Calculated using the average shares method. |
| (b) | Amount rounds to less than $0.01 per share. |
| (c) | Not annualized. |
| (d) | Annualized. |
| See Notes to Financial Statements. | |
| 32 | www.jamesinvestment.com |
| James Aggressive Allocation Fund | Financial Highlights |
| Per share data for a share outstanding throughout each period: | |
| For the | ||||||||||||||||||||||||
| Six Months | ||||||||||||||||||||||||
| Ended | For the | For the | For the | For the | For the | |||||||||||||||||||
| December 31, 2023 | Year Ended | Year Ended | Year Ended | Year Ended | Year Ended | |||||||||||||||||||
| (Unaudited) | June 30, 2023 | June 30, 2022 | June 30, 2021 | June 30, 2020 | June 30, 2019 | |||||||||||||||||||
| Net asset value - beginning of period | $ | 11.19 | $ | 9.81 | $ | 11.45 | $ | 9.23 | $ | 10.20 | $ | 10.66 | ||||||||||||
| Income (loss) from investment operations: | ||||||||||||||||||||||||
| Net investment income(a) | 0.03 | 0.10 | 0.04 | 0.04 | 0.12 | 0.13 | ||||||||||||||||||
| Net realized and unrealized gains (losses) on investments and foreign currencies | 0.80 | 1.36 | (1.66 | ) | 2.27 | (0.98 | ) | (0.50 | ) | |||||||||||||||
| Total from investment operations | 0.83 | 1.46 | (1.62 | ) | 2.31 | (0.86 | ) | (0.37 | ) | |||||||||||||||
| Less distributions from: | ||||||||||||||||||||||||
| Net investment income | (0.08 | ) | (0.08 | ) | (0.02 | ) | (0.09 | ) | (0.11 | ) | (0.09 | ) | ||||||||||||
| Net asset value at end of period | $ | 11.94 | $ | 11.19 | $ | 9.81 | $ | 11.45 | $ | 9.23 | $ | 10.20 | ||||||||||||
| Total return | 7.37 | % (b) | (15.02 | )% | (14.15 | )% | 25.12 | % | (8.60 | )% | (3.40 | )% | ||||||||||||
| Net assets, end of period (in thousands) | $ | 21,727 | $ | 19,655 | $ | 19,055 | $ | 25,576 | $ | 20,795 | $ | 22,936 | ||||||||||||
| Ratios/Supplemental Data: | ||||||||||||||||||||||||
| Ratio of expenses to average net assets | 1.02 | % (c) | 1.02 | % | 1.01 | % | 1.01 | % | 0.98 | % | 0.98 | % | ||||||||||||
| Ratio of net investment income to average net assets | 0.63 | % (c) | 0.89 | % | 0.34 | % | 0.42 | % | 1.17 | % | 1.29 | % | ||||||||||||
| Portfolio turnover rate | 9 | % (b) | 17 | % | 39 | % | 77 | % | 80 | % | 69 | % | ||||||||||||
| (a) | Calculated using the average shares method. |
| (b) | Not annualized. |
| (c) | Annualized. |
| See Notes to Financial Statements. | |
| Semi-Annual Report | December 31, 2023 | 33 |
| James Advantage Funds | Notes to Financial Statements |
| December 31, 2023 (Unaudited) |
1. ORGANIZATION
James Advantage Funds (the “Trust”) is an open-end management investment company that was organized as an Ohio business trust on August 29, 1997. The Trust is registered under the Investment Company Act of 1940, as amended (the “1940 Act”). The James Balanced: Golden Rainbow Fund, James Small Cap Fund, James Micro Cap Fund, and James Aggressive Allocation Fund are each a diversified series of the Trust (individually a “Fund,” and collectively, the “Funds”). Each class of James Balanced: Golden Rainbow Fund represents an interest in the same portfolio of investments and has the same rights, but differs primarily in distribution fees and shareholder features. The Retail Class shares are subject to distribution (12b-1) fees but have a lower minimum investment requirement and offer certain shareholder services not available to Institutional Class shareholders. The Institutional Class shares are not subject to distribution (12b-1) fees and are available only through investment advisers and bank trust departments that have made arrangements for shares of all of their clients investing in the Fund to be held in an omnibus account (as well as other investors that are approved by management of the Trust).
The James Balanced: Golden Rainbow Fund seeks to provide total return through a combination of growth and income and preservation of capital in declining markets. The James Balanced: Golden Rainbow Fund seeks to achieve its objective by investing primarily in equity securities that the Fund’s adviser, James Investment Research, Inc. (“James” or the “Adviser”), believes are undervalued, and in fixed income securities.
The James Small Cap Fund seeks to provide long-term capital appreciation. The James Small Cap Fund seeks to achieve its objective by investing primarily in equity securities of small capitalization companies that the Adviser believes are undervalued. Small capitalization companies are defined as those companies with market capitalizations at the time of purchase no larger than the stocks in the VettaFi U.S. Equity Small-Cap 2000 Total Return Index.
The James Micro Cap Fund seeks to provide long-term capital appreciation. The James Micro Cap Fund seeks to achieve its objective by investing primarily in equity securities of micro capitalization companies that the Adviser believes are undervalued. Micro capitalization companies are defined as those companies with market capitalizations at the time of purchase no larger than the stocks in the VettaFi U.S. Equity Micro-Cap Total Return Index, including exchange-traded funds (“ETFs”) that invest primarily in such securities.
The James Aggressive Allocation Fund seeks to provide total return through a combination of growth and income. Preservation of capital in declining markets is a secondary objective. The James Aggressive Allocation Fund will generally run equity allocations of 60% or higher and, therefore, could be more volatile than a more conservative fund that holds a smaller percentage of its assets in stocks. Due to its aggressive nature, the James Aggressive Allocation Fund will generally have a turnover ratio much higher than the James Balanced: Golden Rainbow Fund.
2. SIGNIFICANT ACCOUNTING POLICIES
The following is a summary of significant accounting policies followed by the Funds in preparation of their financial statements, in accordance with accounting principles generally accepted in the United States of America (“U.S. GAAP”). The Funds are considered an investment company for financial reporting purposes under U.S. GAAP and follow the accounting and reporting guidance applicable to investment companies in the Financial Accounting Standards Board (“FASB”) Accounting Standards Codification Topic 946.
Regulatory Update
Tailored Shareholder Reports for Mutual Funds and Exchange-Traded Funds (“ETFs”) – Effective January 24, 2023, the Securities and Exchange Commission (the “SEC”) adopted rule and form amendments to require mutual funds and ETFs to transmit concise and visually engaging streamlined annual and semi-annual reports to shareholders that highlight key information. Other information, including financial statements, will no longer appear in a streamlined shareholder report but must be available online, delivered free of charge upon request, and filed on a semi-annual basis on Form N-CSR. The rule and form amendments have a compliance date of July 24, 2024. At this time, management is evaluating the impact of these amendments on the shareholder reports for the Funds.
Share Valuation
The net asset value (“NAV”) per share of each Fund, other than the James Balanced: Golden Rainbow Fund, is calculated daily by dividing the total value of the Fund’s assets, less liabilities, by the number of shares outstanding. The NAV per share of each class of shares of the James Balanced: Golden Rainbow Fund is calculated daily by dividing the total value of the Fund’s assets attributable to that class, less liabilities attributable to that class, by the number of outstanding shares of that class. The offering price and redemption price per share is equal to the NAV per share, except that shares of the James Micro Cap Fund are subject to a redemption fees of 2% if redeemed within 180 days of purchase. Redemption fees received by the James Micro Cap Fund were $16 and $0 for the periods ended December 31, 2023 and June 30, 2023, respectively. The redemption fees are reflected in the “Payment for shares redeemed, net of redemption fee” in the Statements of Changes in Net Assets.
Securities Valuation
Securities are valued at fair value. The Funds’ portfolio securities are valued as of the close of the New York Stock Exchange (“NYSE”) (generally, 4:00 p.m., Eastern Time) on each day that the NYSE is open for business. Equity securities that are traded on any exchange, including closed-end funds and exchange-traded funds, are valued at the last quoted sale price on the exchange or market in which such securities are principally traded. Lacking a last sale price, a security is valued at its last bid price except when, in James’ opinion, the last bid price does not accurately reflect the current value of the security. Securities that are traded on the NASDAQ® over-the-counter market are valued at their NASDAQ® Official Closing Price (“NOCP”) for all NASDAQ® National Market (“NNM”) and NASDAQ® Capital Market® securities. When market quotations are not readily available, if an
| 34 | www.jamesinvestment.com |
| James Advantage Funds | Notes to Financial Statements |
| December 31, 2023 (Unaudited) |
event occurs after the close of the trading market (but before the time as of which a Fund calculates its NAV) that materially affects a security’s value, when James determines that the market quotation does not accurately reflect the current value or when a restricted security is being valued, that security will be valued at its fair value as determined by the Adviser as the Fund’s valuation designee, in good faith in conformity with guidelines adopted by and subject to review of the Board of Trustees of the Trust (the “Board”) pursuant to Rule 2a-5 under the 1940 Act. Corporate bonds, U.S. government agencies, U.S. Treasury obligations, foreign, and municipal bonds are generally valued at the mean between the closing bid and asked prices provided by an independent pricing service. The pricing services generally use market models that consider trade data, yields, spreads, quotations from dealers and active market makers, credit worthiness, market information of comparable securities, and other relevant security specific information. Asset backed/commercial mortgage-backed securities are generally valued at the mean between the closing bid and asked prices provided by an independent pricing service. The pricing service generally uses models that consider trade data, prepayment, and default projections, benchmark yield and spread data and estimated cash flows of each tranche of the issuer. If the Adviser decides that a price provided by the pricing service does not accurately reflect the fair market value of the securities or when prices are not readily available from a pricing service, those securities will be priced at fair value as determined in good faith by the Adviser. Shares of open-end investment companies are valued at NAV.
For valuation purposes, quotations of foreign securities in a foreign currency are converted to U.S. dollar equivalents at the time of pricing the Funds. The values of foreign portfolio securities are generally based upon market quotations which, depending upon the exchange or market, may be last sale price, last bid price or the average of the last bid and asked prices as of, in each case, the close of the appropriate exchange or another designated time.
In accordance with the Trust’s good faith pricing guidelines, James is required to consider all appropriate factors relevant to the value of securities for which it has determined other pricing sources are not available or reliable as described above. There is no single standard for determining fair value, since fair value depends upon the circumstances of each individual case. As a general principle, the current fair value of an issue of securities being valued by the Adviser would appear to be the amount that the owner might reasonably expect to receive for them upon their current sale. Methods which are in accordance with this principle may, for example, be based on (i) a multiple of earnings, (ii) a discount from market of a similar freely traded security (including a derivative security or a basket of securities traded on other markets, exchanges or among dealers), or (iii) yield to maturity with respect to debt issues, or a combination of these and other methods.
Various inputs are used in determining the value of the Funds’ investments. These inputs are summarized in the three broad levels listed below:
| Level 1 – | Unadjusted quoted prices in active markets for identical, unrestricted assets or liabilities that a Fund has the ability to access at the measurement date; |
| Level 2 – | Quoted prices which are not active, quoted prices for similar assets or liabilities in active markets or inputs other than quoted prices that are observable (either directly or indirectly) for substantially the full term of the asset or liability; or |
| Level 3 – | Significant unobservable prices or inputs (including a Fund’s own assumptions in determining the fair value of investments) where there is little or no market activity for the asset or liability at the measurement date. |
The inputs or methodologies used for valuing securities are not necessarily an indication of the risk associated with investing in those securities.
| Semi-Annual Report | December 31, 2023 | 35 |
| James Advantage Funds | Notes to Financial Statements |
| December 31, 2023 (Unaudited) |
The following is a summary of the inputs used to value the Funds’ investments as of December 31, 2023:
| James Balanced: Golden Rainbow Fund | Level 1 | Level 2 | Level 3 | Total | ||||||||||||
| Common Stocks | $ | 208,739,546 | $ | — | $ | — | $ | 208,739,546 | ||||||||
| Exchange-Traded Funds | 19,022,062 | — | — | 19,022,062 | ||||||||||||
| Corporate Bonds | — | 35,569,253 | — | 35,569,253 | ||||||||||||
| Mortgage-Backed Securities | — | 12,783,982 | — | 12,783,982 | ||||||||||||
| Municipal Bonds | — | 7,342,877 | — | 7,342,877 | ||||||||||||
| U.S. Government & Agencies | — | 22,179,805 | — | 22,179,805 | ||||||||||||
| U.S. Treasury Obligations | — | 112,730,750 | — | 112,730,750 | ||||||||||||
| Money Market Funds | 2,765,611 | — | — | 2,765,611 | ||||||||||||
| Total | $ | 230,527,219 | $ | 190,606,667 | $ | — | $ | 421,133,886 | ||||||||
| James Small Cap Fund | Level 1 | Level 2 | Level 3 | Total | ||||||||||||
| Common Stocks | $ | 37,021,300 | $ | — | $ | — | $ | 37,021,300 | ||||||||
| U.S. Treasury Obligations | — | 996,631 | — | 996,631 | ||||||||||||
| Money Market Funds | 779,898 | — | — | 779,898 | ||||||||||||
| Total | $ | 37,801,198 | $ | 996,631 | $ | — | $ | 38,797,829 | ||||||||
| James Micro Cap Fund | Level 1 | Level 2 | Level 3 | Total | ||||||||||||
| Common Stocks | $ | 25,192,671 | $ | — | $ | — | $ | 25,192,671 | ||||||||
| U.S. Treasury Obligations | — | 896,968 | — | 896,968 | ||||||||||||
| Money Market Funds | 260,425 | — | — | 260,425 | ||||||||||||
| Total | $ | 25,453,096 | $ | 896,968 | $ | — | $ | 26,350,064 | ||||||||
| James Aggressive Allocation Fund | Level 1 | Level 2 | Level 3 | Total | ||||||||||||
| Common Stocks | $ | 16,877,684 | $ | — | $ | — | $ | 16,877,684 | ||||||||
| Corporate Bonds | — | 1,265,544 | — | 1,265,544 | ||||||||||||
| U.S. Government & Agencies | — | 1,282,439 | — | 1,282,439 | ||||||||||||
| U.S. Treasury Obligations | — | 1,881,052 | — | 1,881,052 | ||||||||||||
| Money Market Funds | 409,822 | — | — | 409,822 | ||||||||||||
| Total | $ | 17,287,506 | $ | 4,429,035 | $ | — | $ | 21,716,541 | ||||||||
The Funds did not hold any derivative instruments or assets or liabilities that were measured at fair value on a recurring basis using significant unobservable inputs (Level 3) as of or during the six months ended December 31, 2023.
| 36 | www.jamesinvestment.com |
| James Advantage Funds | Notes to Financial Statements |
| December 31, 2023 (Unaudited) |
Investment Transactions
Investment transactions are recorded on a trade date basis. Gains and losses are determined using the specific identification method. Securities purchased or sold on a when-issued or delayed delivery basis may have extended settlement periods. Any securities so purchased are subject to market fluctuation during this period. The Funds will instruct its custodian to segregate assets in a separate account with a current value at least equal to the amount of its when-issued and delayed delivery purchase commitments. As of December 31, 2023, the Funds did not hold when-issued securities or delayed delivery purchase commitments.
Foreign Currency Translation
Securities and other assets and liabilities denominated in or expected to settle in foreign currencies, if any, are translated into U.S. dollars based on exchange rates on the following basis:
| A. | The fair values of investment securities and other assets and liabilities are translated as of the close of the NYSE each day. |
| B. | Purchases and sales of investment securities and income and expenses are translated at the rate of exchange prevailing as of 4:00 p.m. Eastern time on the respective date of such transactions. |
| C. | The Funds do not isolate that portion of the results of operations caused by changes in foreign exchange rates on investments from those caused by changes in market prices of securities held. Such fluctuations are included with the net realized and unrealized gains or losses on investments. |
Reported net realized foreign exchange gains or losses arise from 1) purchases and sales of foreign currencies, 2) currency gains or losses realized between trade and settlement dates on securities transactions, and 3) the difference between the amounts of dividends and foreign withholding taxes recorded on the Fund’s books and the U.S. dollar equivalent of the amounts actually received or paid. Reported net unrealized foreign exchange gains and losses arise from changes in the value of assets and liabilities, other than investments in securities, that result from changes in exchange rates.
Investment Income
Dividend income is recorded on the ex-dividend date. Interest income is determined on the basis of interest accrued, adjusted for amortization of premiums and accretion of discounts on all debt securities. Amortization and accretion is calculated using the effective yield method. Withholding taxes on foreign dividends have been provided for in accordance with the Trust’s understanding of the applicable country’s tax rules and rates.
Dividend income includes dividends earned on Real Estate Investment Trusts (“REITs”), which may include a return of capital. As such, important taxation issues may arise, which the Funds account for when information is provided by the issuing REIT. Due to the actual character of dividends paid by REITs not being available until the end of the calendar year, the net investment income and long-term capital gains of the Funds can be different on the tax return compared to this annual report. Substantial unanticipated levels of return of capital may affect the Funds’ earnings and profits from which distributions are made.
Distributions received from Limited Partnership investments of a Fund are usually recorded as a return of capital and are excluded from available income in the calculation of distributions paid by the Funds. Return of capital is recorded as a reduction to the cost of investments in the Statements of Assets and Liabilities and in the Schedule of Investments.
Dividends and Distributions to Shareholders
Net investment income, if any, is generally declared and distributed to shareholders of each Fund on at least an annual basis. Net realized capital gains from security transactions, if any, are distributed to shareholders not less frequently than annually. Furthermore, capital gains are distributed only to the extent they exceed available capital loss carryforwards. Distributions to shareholders of net investment income and net realized capital gains are recorded on the ex-dividend date. The amount and timing of distributions are determined in accordance with federal income tax regulations, which may differ from U.S. GAAP. The tax character of distributions paid to shareholders during the periods ended December 31, 2023 and June 30, 2023 was as follows:
| James Balanced: Golden | James Aggressive | |||||||||||||||
| Rainbow Fund | James Small Cap Fund | James Micro Cap Fund | Allocation Fund | |||||||||||||
| December 31, 2023 | ||||||||||||||||
| Ordinary Income | $ | 2,752,735 | $ | 118,656 | $ | 163,890 | $ | 135,785 | ||||||||
| Long-Term Capital Gains | 3,868,121 | 105,044 | — | — | ||||||||||||
| Total | $ | 6,620,856 | $ | 223,700 | $ | 163,890 | $ | 135,785 | ||||||||
| June 30, 2023 | ||||||||||||||||
| Ordinary Income | $ | 5,349,487 | $ | 165,848 | $ | 131,001 | $ | 148,040 | ||||||||
| Long-Term Capital Gains | 18,029,254 | 1,908,389 | 1,699,953 | — | ||||||||||||
| Total | $ | 23,378,741 | $ | 2,074,237 | $ | 1,830,954 | $ | 148,040 | ||||||||
| Semi-Annual Report | December 31, 2023 | 37 |
| James Advantage Funds | Notes to Financial Statements |
| December 31, 2023 (Unaudited) |
Allocation of Income and Expense
Investment income earned, realized capital gains and losses, and unrealized appreciation and depreciation for the James Balanced: Golden Rainbow Fund is allocated daily to each class of shares based upon its proportionate share of total net assets of the Fund. Class-specific expenses are charged directly to the class incurring the expense. Common expenses, which are not attributable to a specific class, are allocated daily to each class of shares based upon its proportionate share of total net assets of the Fund. The Adviser pays the expenses of each Fund, except for the James Balanced: Golden Rainbow Fund. These expenses exclude the management fees, detailed in Note 4, brokerage fees and commissions, taxes, interest, fees and expenses of the non-interested person trustees, 12b-1 fees and extraordinary expenses. Expenses not directly billed to a particular Fund are allocated proportionally among all Funds daily in relation to net assets of each Fund.
Use of Estimates
The preparation of financial statements in conformity with U.S. GAAP requires management to make estimates and assumptions that affect the reported amounts of assets and liabilities and disclosure of contingent assets and liabilities at the date of the financial statements and the reported amounts of increases and decreases in net assets from operations during the reporting period. Actual results could differ from those estimates.
Federal Income Taxes
The Funds generally intend to distribute all taxable income and capital gains to shareholders, if any, and to otherwise continue to comply with the requirements of Subchapter M of the Internal Revenue Code of 1986, as amended, (the “Code”) applicable to regulated investment companies. Therefore, no federal tax provision is required.
As of and during the six months ended December 31, 2023, the Funds did not have a liability for any unrecognized tax benefits. The Funds file U.S. federal, state, and local tax returns as required. The Funds’ tax returns are subject to examination by the relevant tax authorities until expiration of the applicable statute of limitations, which is generally three years after the filing of the tax return for federal purposes and four years for most state returns. Tax returns for the current and all open years have incorporated no uncertain tax positions that require a provision for income taxes.
The following information is computed on a tax basis for each item as of June 30, 2023:
| James Balanced: Golden | James Aggressive | |||||||||||||||
| Rainbow Fund | James Small Cap Fund | James Micro Cap Fund | Allocation Fund | |||||||||||||
| Cost of investments | $ | 367,194,317 | $ | 25,011,647 | $ | 15,322,938 | $ | 16,372,043 | ||||||||
| Gross unrealized appreciation | $ | 78,321,709 | $ | 10,963,097 | $ | 8,424,455 | $ | 4,091,813 | ||||||||
| Gross unrealized depreciation | (13,240,771 | ) | (1,135,634 | ) | (1,041,448 | ) | (763,102 | ) | ||||||||
| Net unrealized appreciation | 65,080,938 | 9,827,463 | 7,383,007 | 3,328,711 | ||||||||||||
| Undistributed ordinary income | 234,887 | 118,572 | 11,509 | 65,061 | ||||||||||||
| Undistributed long-term capital gains | 2,077,823 | 105,021 | — | — | ||||||||||||
| Accumulated capital and other losses | — | — | (368,161 | ) | (736,018 | ) | ||||||||||
| Distributable earnings | $ | 67,393,648 | $ | 10,051,056 | $ | 7,026,355 | $ | 2,657,754 | ||||||||
The following information is computed on a tax basis for each item as of December 31, 2023:
| James Balanced: Golden | James Aggressive | |||||||||||||||
| Rainbow Fund | James Small Cap Fund | James Micro Cap Fund | Allocation Fund | |||||||||||||
| Cost of investments | $ | 342,520,300 | $ | 25,061,414 | $ | 14,999,112 | $ | 16,870,165 | ||||||||
| Gross unrealized appreciation | $ | 88,509,912 | $ | 14,665,522 | $ | 12,279,493 | $ | 5,373,237 | ||||||||
| Gross unrealized depreciation | (9,896,326 | ) | (929,107 | ) | (928,541 | ) | (526,861 | ) | ||||||||
| Net unrealized appreciation | $ | 78,613,586 | $ | 13,736,415 | $ | 11,350,952 | $ | 4,846,376 | ||||||||
The difference between the cost of investments on a tax basis and financial statement cost for the Funds is due primarily to the deferral of wash sale losses and to the differing treatment of certain investments under income tax regulations and U.S. GAAP.
| 38 | www.jamesinvestment.com |
| James Advantage Funds | Notes to Financial Statements |
| December 31, 2023 (Unaudited) |
Capital Losses
Under the Code, Capital Losses are carried over to future tax years and will retain their character as either short-term or long-term capital losses. These losses do not include any late year capital losses (losses arising in the period from November 1st through June 30th) that the Funds have elected to defer for the current fiscal year. The Funds’ ability to utilize capital loss carryforwards in the current and future may be limited under the Code and related regulations based on the results of future transactions.
Capital losses carried forward to the current tax year were as follows:
| Short-Term | Long-Term | |||||||
| James Aggressive Allocation Fund | $ | 736,018 | $ | — | ||||
3. INVESTMENT TRANSACTIONS
During the six months ended December 31, 2023, cost of purchases and proceeds from sales and maturities of investment securities (excluding short-term securities and U.S. government obligations) was as follows:
| James Balanced: Golden | James Aggressive | |||||||||||||||
| Rainbow Fund | James Small Cap Fund | James Micro Cap Fund | Allocation Fund | |||||||||||||
| Purchases of investment securities | $ | 15,915,529 | $ | 2,088,171 | $ | — | $ | 1,565,048 | ||||||||
| Proceeds from sales and maturities of investment securities | $ | 28,775,013 | $ | 2,956,012 | $ | 485,009 | $ | 1,094,379 | ||||||||
During the year ended June 30, 2023, cost of purchases and proceeds from sales and maturities of long-term U.S. government obligations was as follows:
| James Balanced: Golden | James Aggressive | |||||||||||||||
| Rainbow Fund | James Small Cap Fund | James Micro Cap Fund | Allocation Fund | |||||||||||||
| Purchases of investment securities | $ | 10,127,947 | $ | — | $ | — | $ | 480,592 | ||||||||
| Proceeds from sales and maturities of investment securities | $ | 17,642,380 | $ | — | $ | — | $ | 608,831 | ||||||||
4. MANAGEMENT FEE AND OTHER TRANSACTIONS WITH AFFILIATES
Investment Management Agreement
The Funds retain James to manage the Funds’ investments. The investment decisions for the Funds are made by a committee of James’ personnel, which is primarily responsible for the day-to-day management of each Fund’s portfolio and pursuant to separate management agreements between the Trust, on behalf of each Fund, and the Adviser (the “Investment Management Agreements”).
| Semi-Annual Report | December 31, 2023 | 39 |
| James Advantage Funds | Notes to Financial Statements |
| December 31, 2023 (Unaudited) |
The Funds pay James on a monthly basis at the annual rate set forth below of the Funds’ average daily net assets.
James Balanced: Golden Rainbow Fund
| Average Total Net Assets | Contractual Fee |
| Up to and including $500 million | 0.74% |
| Over $500 million and including $1 billion | 0.70% |
| Over $1 billion and including $2 billion | 0.65% |
| Over $2 billion | 0.60% |
James Small Cap Fund
| Average Total Net Assets | Contractual Fee |
| Up to and including $500 million | 1.25% |
| Over $500 million and including $1 billion | 1.20% |
| Over $1 billion and including $2 billion | 1.15% |
| Over $2 billion | 1.10% |
James Micro Cap Fund
| Average Total Net Assets | Contractual Fee |
| Up to and including $500 million | 1.50% |
| Over $500 million | 1.45% |
James Aggressive Allocation Fund
| Average Total Net Assets | Contractual Fee |
| Up to and including $500 million | 0.98% |
| Over $500 million and including $1 billion | 0.95% |
| Over $1 billion and including $2 billion | 0.90% |
| Over $2 billion | 0.85% |
Advisory fees for the James Small Cap Fund and the James Micro Cap Fund are reduced by the fees and expenses of the non-interested trustees incurred by the applicable Fund. Under the Investment Management Agreement, the Adviser is responsible for the payment of all operating expenses of the James Small Cap Fund, James Micro Cap Fund, and James Aggressive Allocation Fund, except for brokerage fees and commissions, taxes, interest, fees and expenses of non-interested person trustees, 12b-1 expenses and extraordinary expenses. The Adviser is not entitled to recoupment of such expenses.
Other Service Providers
Ultimus Fund Solutions, LLC (“Ultimus”) provides administration, fund accounting and transfer agency services to the Funds. The Funds or the Adviser pay Ultimus fees in accordance with the agreements for such services. In addition, the Funds pay out-of-pocket expenses including, but not limited to, postage, supplies and certain cost related to the pricing of the Funds’ portfolio securities. Administration and transfer agent fees paid by the Funds for the six months ended December 31, 2023, are disclosed on the Statements of Operations.
Plan of Distribution
Pursuant to the terms of a Distribution Agreement with the Trust, Ultimus Fund Distributors, LLC (“UFD”) serves as principal underwriter and exclusive agent for distribution of shares of the Funds. UFD is a wholly-owned subsidiary of Ultimus. The James Balanced: Golden Rainbow Fund (Retail Class) and James Small Cap Fund have each adopted a plan pursuant to Rule 12b-1 under the 1940 Act (collectively, the “Plan”) under which each Fund may incur expenses related to distribution of its shares and for services provided to shareholders (“Distribution Expenses”). These Distribution Expenses are reflected as 12b-1 distribution and service fees on the Statements of Operations. Payments under a Plan are made to the Adviser or its designee, which uses them to pay Distribution Expenses on behalf of and as agent of the Trust. The amount payable by the James Small Cap Fund and the Retail Class of the James Balanced: Golden Rainbow Fund, under its Plan is 0.25% of its average daily net assets. Payments received under the Plan are in addition to the fees paid to the Adviser pursuant to the Management Agreements. Pursuant to the Plan, the Adviser shall act in the Funds’ best interests in expending or directing its designee to expend payments received by the Adviser or its designee, and such payments shall be used solely for the purpose of paying Distribution Expenses on behalf of the Funds; provided, however, that to the extent the Distribution Expenses for the period to which a payment relates are less than the payment, the Adviser may retain the excess.
Trustee Fees
Effective January 1, 2024, each Trustee who is not an interested person of the Trust (“Independent Trustees”), as defined in the 1940 Act, receives (1) a quarterly retainer of $8,300, (2) a per meeting fee for regularly scheduled Board meetings of $2,200, (3) a quarterly fee paid to the Audit Committee Chair of $1,050 and a quarterly fee paid to the other members of the Audit Committee of $525, (4) a per meeting fee of $2,200 for any special meeting held outside of a regularly scheduled Board meeting that the Independent Trustee is required to attend in person, (5) a per meeting fee of $220 for any special telephonic meetings held outside of a regularly scheduled Board meeting, and (6) reimbursement for all reasonable out-of-pocket expenses relating to attendance at meetings.
Prior to January 1, 2024, each Independent Trustee received (1) a quarterly retainer of $7,900, (2) a per meeting fee for regularly scheduled Board meetings of $2,100, (3) a quarterly fee paid to the Audit Committee Chair of $1,000 and a quarterly fee paid to the other members of the Audit Committee of $500, (4) a per meeting fee of $2,100 for any special meeting held outside of a regularly scheduled Board meeting that the Independent Trustee is required to attend in person, (5) a per meeting fee of $210 for any special telephonic meetings held outside of a regularly scheduled Board meeting, and (6) reimbursement for all reasonable out-of-pocket expenses relating to attendance at meetings. Such fees are presented on the Statements of Operations as Trustee fees.
| 40 | www.jamesinvestment.com |
| James Advantage Funds | Notes to Financial Statements |
| December 31, 2023 (Unaudited) |
Principal Holders of Fund Shares
As of December 31, 2023, the following shareholders owned of record 25% or more of the outstanding shares of each Fund, as applicable:
| NAME OF RECORD OWNER | % OWNERSHIP | |
| James Balanced: Golden Rainbow Fund | ||
| National Financial Services, LLC (for the benefit of its customers) | 38% | |
| James Micro Cap Fund | ||
| Iris James | 27% | |
| James Aggressive Allocation Fund | ||
| Iris James | 25% |
A beneficial owner of 25% or more of a Fund’s outstanding shares may be considered a controlling person. That shareholder’s vote could have a more significant effect on matters presented at a shareholders’ meeting.
5. COMMITMENTS AND CONTINGENCIES
The Funds indemnify the Trust’s officers and trustees for certain liabilities that might arise from their performance of their duties to the Funds. Additionally, in the normal course of business, the Funds enter into contracts that contain a variety of representations and warranties and that provide general indemnifications. The Funds’ maximum exposure under these arrangements is unknown, as this would involve future claims that may be made against the Funds that have not yet occurred. However, based on experience, the Funds expect the risk of loss to be remote.
6. LINE OF CREDIT
Each Fund has a revolving line of credit agreement with U.S. Bank, N.A. (the “Bank”). Borrowings under these arrangements are secured by investments held in the Funds’ portfolios as notated on the Schedules of Investments and bear interest at the Bank’s prime rate. As of December 31, 2023, none of the Funds had outstanding borrowings under the line of credit agreement. For the six months ended December 31, 2023, none of the Funds utilized the line of credit. Each Fund’s line of credit agreement is set to expire on July 3, 2024.
The terms of the agreements can be characterized as follows:
| Maximum | ||||||||
| Balance | Interest | |||||||
| Available | Rate | Expiration Date | ||||||
| James Balanced: Golden Rainbow Fund | $ | 25,000,000 | Prime Rate* | July 3, 2024 | ||||
| James Small Cap Fund | $ | 2,000,000 | Prime Rate* | July 3, 2024 | ||||
| James Micro Cap Fund | $ | 1,250,000 | Prime Rate* | July 3, 2024 | ||||
| James Aggressive Allocation Fund | $ | 750,000 | Prime Rate* | July 3, 2024 | ||||
| * | The rate at which the Bank announces as its prime lending rate. |
7. SECTOR RISK
If a Fund has significant investments in the securities of issuers in industries within a particular business sector, any development affecting that sector will have a greater impact on the value of the net assets of the Fund than would be the case if the Fund did not have significant investments in that sector. In addition, this may increase the risk of loss of an investment in the Fund and increase the volatility of the Fund’s NAV per share. From time to time, circumstances may affect a particular sector and the companies within such sector. For instance, economic or market factors, regulation or deregulation, or other developments may negatively impact all companies in a particular sector and therefore the value of a Fund’s portfolio would be adversely affected. As of December 31, 2023, the James Small Cap Fund and the James Micro Cap Fund had 25.2% and 27.1% of their net assets invested in common stocks within the Financials industry sector, respectively.
8. SUBSEQUENT EVENTS
The Funds are required to recognize in the financial statements the effects of all subsequent events that provide additional evidence about conditions that existed as of the date of the Statements of Assets and Liabilities. For non-recognized subsequent events that must be disclosed to keep the financial statements from being misleading, the Funds are required to disclose the nature of the event as well as an estimate of its financial effect, or a statement that such an estimate cannot be made. Management has evaluated subsequent events through the issuance of these financial statements and has noted no such events.
| Semi-Annual Report | December 31, 2023 | 41 |
| James Advantage Funds | Disclosure of Fund Expenses |
| December 31, 2023 (Unaudited) |
Example. As a shareholder of a Fund, you incur two types of costs: (1) transaction costs, including reinvested dividends or other distributions, and redemption fees; and (2) ongoing costs, including management fees, distribution (12b-1) fees and other Fund expenses. This example is intended to help you understand your ongoing costs (in dollars) of investing in the Funds and to compare these costs with the ongoing costs of investing in other mutual funds.
The example is based on an investment of $1,000 invested at the beginning of the period and held for the entire period July 1, 2023 through December 31, 2023.
Actual Expenses. The first line of the table below provides information about actual account values and actual expenses. You may use the information in this line, together with the amount you invested, to estimate the expenses that you paid over the period. Simply divide your account value by $1,000 (for example, an $8,600 account value divided by $1,000 = 8.6), then multiply the result by the number in the first line under the heading “Expense Paid During Period” to estimate the expenses you paid on your account during this period.
Hypothetical Example for Comparison Purposes. The second line of the table below provides information about hypothetical account values and hypothetical expenses based on a Fund’s actual expense ratio and an assumed rate of return of 5% per year before expenses, which is not the Fund’s actual returns. The hypothetical account values and expenses may not be used to estimate the actual ending account balance or expenses you paid for the period. You may use this information to compare the ongoing costs of investing in a Fund and other mutual funds. To do so, compare this 5% hypothetical example with the 5% hypothetical examples that appear in the shareholder reports of the other funds.
Please note that expenses shown in the table are meant to highlight and help you compare ongoing costs only. The calculations assume no shares were bought or sold during the period. Your actual costs may have been higher or lower, depending on the amount of your investment and the timing of any purchases or redemptions.
| Beginning | Ending | Net | Expenses | |||||||||||
| Account Value | Account Value | Expense | Paid During | |||||||||||
| July 1, 2023 | December 31, 2023 | Ratio(a) | Period(b) | |||||||||||
| James Balanced: Golden Rainbow Fund - Retail Class | ||||||||||||||
| Based on Actual Fund Return | $ | 1,000.00 | $ | 1,051.30 | 1.20% | $ | 6.20 | |||||||
| Based on Hypothetical 5% Return (before expenses) | $ | 1,000.00 | $ | 1,019.16 | 1.20% | $ | 6.11 | |||||||
| James Balanced: Golden Rainbow Fund - Institutional Class | ||||||||||||||
| Based on Actual Fund Return | $ | 1,000.00 | $ | 1,053.00 | 0.95% | $ | 4.92 | |||||||
| Based on Hypothetical 5% Return (before expenses) | $ | 1,000.00 | $ | 1,020.42 | 0.95% | $ | 4.84 | |||||||
| James Small Cap Fund | ||||||||||||||
| Based on Actual Fund Return | $ | 1,000.00 | $ | 1,143.40 | 1.50% | $ | 8.10 | |||||||
| Based on Hypothetical 5% Return (before expenses) | $ | 1,000.00 | $ | 1,017.64 | 1.50% | $ | 7.63 | |||||||
| James Micro Cap Fund | ||||||||||||||
| Based on Actual Fund Return | $ | 1,000.00 | $ | 1,183.70 | 1.50% | $ | 8.26 | |||||||
| Based on Hypothetical 5% Return (before expenses) | $ | 1,000.00 | $ | 1,017.64 | 1.50% | $ | 7.63 | |||||||
| James Aggressive Allocation Fund | ||||||||||||||
| Based on Actual Fund Return | $ | 1,000.00 | $ | 1,073.70 | 1.02% | $ | 5.33 | |||||||
| Based on Hypothetical 5% Return (before expenses) | $ | 1,000.00 | $ | 1,020.06 | 1.02% | $ | 5.19 | |||||||
| (a) | Annualized, based on each Fund’s most recent fiscal half year expenses. |
| (b) | Expenses are equal to each Fund’s annualized expense ratio multiplied by the average account value over the period, multiplied by the number of days in the most recent fiscal half year (184), divided by 365. |
| 42 | www.jamesinvestment.com |
| James Advantage Funds | Additional Information |
| December 31, 2023 (Unaudited) |
PROXY VOTING GUIDELINES
James is responsible for exercising the voting rights associated with the securities purchased and held by the Funds. A description of the policies and procedures that James uses in fulfilling this responsibility and information regarding how those proxies were voted during the most recent 12-month period ended June 30 are available without charge upon request by calling toll free 1-800-995-2637. These items are also available on the Securities and Exchange Commission’s (the “Commission”) website at http://www.sec.gov.
QUARTERLY PORTFOLIO DISCLOSURE
The Funds’ portfolio holdings are made available semi-annually in shareholder reports within 60 days after the close of the period for which the report is being made, as required by federal securities laws. The Funds also file their complete schedules of portfolio holdings with the Commission for the first and third quarters of each fiscal year as an exhibit on Form N-PORT. The Funds’ Form N-PORT reports are available on the Commission’s website at http://www.sec.gov. Schedules of portfolio holdings are also available at www.jamesinvestment.com, or upon request, without charge by calling at 1-800-995-2637.
| Semi-Annual Report | December 31, 2023 | 43 |
| James Advantage Funds | Privacy Policy |
| December 31, 2023 (Unaudited) |
Facts
What does James Advantage Funds do with your personal information?
Why?
Financial companies choose how they share your personal information. Federal law gives consumers the right to limit some, but not all sharing. Federal law also requires us to tell you how we collect, share, and protect your personal information. Please read this notice carefully to understand what we do.
What?
The types of personal information we collect and share depends on the product or service that you have with us. This information can include:
| ● | Social Security number and wire transfer instructions |
| ● | account transactions and transaction history |
��
| ● | investment experience and purchase history |
When you are no longer our customer, we continue to share your information as described in this notice.
How?
All financial companies need to share customers’ personal information to run their everyday business. In the section below, we list the reasons financial companies can share their customers’ personal information; the reasons James Advantage Funds chooses to share; and whether you can limit this sharing.
| Reasons we can share your personal information: | Does James Advantage Funds share information? | Can you limit this sharing? |
| For our everyday business purposes - such as to process your transactions, maintain your account(s), respond to court orders and legal investigations, or report to credit bureaus. | YES | NO |
| For our marketing purposes - to offer our products and services to you. | YES | NO |
| For joint marketing with other financial companies. | NO | We don’t share |
| For our affiliates’ everyday business purposes - information about your transactions and records. | NO | We don’t share |
| For our affiliates’ everyday business purposes - information about your credit worthiness. | NO | We don’t share |
| For our affiliates to market to you | NO | We don’t share |
| For non-affiliates to market to you | NO | We don’t share |
Questions? Call 1-800-99JAMES (800-995-2637)
| What we do: | ||
| How does James Advantage Funds To protect your personal information from unauthorized access and use, we use security measures that comply protect my personal information? with federal law. These measures include computer safeguards and secured files and buildings. | ||
| Our service providers are held accountable for adhering to strict policies and procedures to prevent any misuse of your nonpublic personal information. | ||
| How does James Advantage Funds | We collect your personal information, for example, when you | |
| collect my personal information? | ● | open an account or deposit money |
| ● | direct us to buy securities or direct us to sell your securities | |
| ● | seek advice about your investments | |
| We also collect your personal information from others, such as credit bureaus, affiliates, or other companies. | ||
| Why can’t I limit all sharing? | Federal law gives you the right to limit only: | |
| ● | sharing for affiliates’ everyday business purposes – information about your creditworthiness. | |
| ● | affiliates from using your information to market to you. | |
| ● | sharing for nonaffiliates to market to you. | |
| State laws and individual companies may give you additional rights to limit sharing. | ||
| Definitions | ||
| Affiliates | Companies related by common ownership or control. They can be financial and non-financial companies. | |
| ● | Our affiliates include financial companies, such as James Investment Research, Inc. and James Capital Alliance. | |
| Non-affiliates | Companies not related by common ownership or control. They can be financial and non-financial companies. | |
| ● | James Advantage Funds does not share with nonaffiliates so they can market to you. | |
| Joint marketing | A formal agreement between nonaffiliated financial companies that together market financial products or services to you. | |
| ● | James Advantage Funds does not jointly market. | |
| 44 | www.jamesinvestment.com |
Intentionally Left Blank
 | INVESTMENT ADVISER
CUSTODIAN
TRANSFER AGENT | INDEPENDENT REGISTERED
DISTRIBUTOR
LEGAL COUNSEL |
For information about the Funds, or to make inquiries about the Funds,
please call 1-800-99JAMES (1-800-995-2637).
| www.jamesinvestment.com | JAF-SAR-23 |
| (b) | Not applicable |
| Item 2. | Code of Ethics. |
Not applicable.
| Item 3. | Audit Committee Financial Expert. |
Not applicable.
| Item 4. | Principal Accountant Fees and Services. |
Not applicable.
| Item 5. | Audit Committee of Listed Registrants. |
Not applicable.
| Item 6. | Investments. |
| (a) | Schedules of Investments in securities of unaffiliated issuers as of the close of the reporting period are included as part of the report to shareholders filed under Item 1 of this form. |
| (b) | Not applicable. |
| Item 7. | Disclosure of Proxy Voting Policies and Procedures for Closed-End Management Investment Companies. |
Not applicable.
| Item 8. | Portfolio Managers of Closed-End Management Investment Companies. |
Not applicable.
| Item 9. | Purchases of Equity Securities by Closed-End Management Investment Company and Affiliated Purchasers. |
Not applicable.
| Item 10. | Submission of Matters to a Vote of Security Holders. |
The registrant has not adopted procedures by which shareholders may recommend nominees to the registrant’s Board of Trustees.
| Item 11. | Controls and Procedures. |
(a) Based on an evaluation of the registrant’s disclosure controls and procedures (as defined in Rule 30a-3(c) under the Investment Company Act of 1940, as amended (the “1940 Act”) (17 CFR 270.30a-3(c))), the registrant’s principal executive officer and principal financial officer have concluded that the registrant’s disclosure controls and procedures are effective as of a date within 90 days of the filing date of this report.
(b) There were no changes in the registrant’s internal control over financial reporting (as defined in Rule 30a-3(d) under the 1940 Act (17 CFR 270.30a-3(d))) that occurred during the period covered by this report that have materially affected, or are reasonably likely to materially affect, the registrant’s internal control over financial reporting.
Item 12. Disclosure of Securities Lending Activities for Closed-End Management Investment Companies.
(a) Not applicable.
(b) Not applicable.
| Item 13. | Exhibits. |
(a)(1) Not applicable.
(1) Not applicable.
(2) Change in the registrant’s independent public accountants: Not applicable.
Exhibit 99.CERT Certifications required by Rule 30a-2(a) under the Act
Exhibit 99.906CERT Certifications required by Rule 30a-2(b) under the Act
SIGNATURES
Pursuant to the requirements of the Securities Exchange Act of 1934 and the Investment Company Act of 1940, the registrant has duly caused this report to be signed on its behalf by the undersigned, thereunto duly authorized.
| (Registrant) | James Advantage Funds | ||
| By (Signature and Title) | /s/ R. Brian Culpepper | ||
R. Brian Culpepper, President (Principal Executive Officer) | |||
| Date | February 26, 2024 | ||
| Pursuant to the requirements of the Securities Exchange Act of 1934 and the Investment Company Act of 1940, this report has been signed below by the following persons on behalf of the registrant and in the capacities and on the dates indicated. | |||
| By (Signature and Title) | /s/ R. Brian Culpepper | ||
R. Brian Culpepper, President (Principal Executive Officer) | |||
| Date | February 26, 2024 | ||
| By (Signature and Title) | /s/ Brian P. Shepardson | ||
Brian P. Shepardson, Chief Financial Officer and Treasurer (Principal Financial Officer) | |||
| Date | February 26, 2024 | ||