Exhibit B.3(c): Management’s discussion and analysis excerpted from pages 1-90 of CIBC’s 2015 Annual Report
|
Management’s discussion and analysis |
Management’s discussion and analysis
Management’s discussion and analysis (MD&A) is provided to enable readers to assess CIBC’s financial condition and results of operations as at and for the year ended October 31, 2015, compared with prior years. The MD&A should be read in conjunction with the audited consolidated financial statements. Unless otherwise indicated, all financial information in this MD&A has been prepared in accordance with International Financial Reporting Standards (IFRS or GAAP) and all amounts are expressed in Canadian dollars. This MD&A is current as of December 2, 2015. Additional information relating to CIBC, including the Annual Information Form, is available on SEDAR at www.sedar.com and on the U.S. Securities and Exchange Commission’s (SEC) website at www.sec.gov. No information on CIBC’s website (www.cibc.com) should be considered incorporated herein by reference. A glossary of terms used in the MD&A and the audited consolidated financial statements is provided on pages 172 to 177 of this Annual Report.
| | |
| 2 | | External reporting changes |
| |
| 3 | | Overview |
| 3 | | CIBC’s strategy |
| 3 | | Performance against objectives |
| 4 | | Economic and market environment |
| |
| 5 | | Financial performance overview |
| 5 | | Financial highlights |
| 6 | | 2015 Financial results |
| 6 | | Net interest income and margin |
| | |
| 7 | | Non-interest income |
| 7 | | Trading activities (TEB) |
| 8 | | Provision for credit losses |
| 8 | | Non-interest expenses |
| 8 | | Taxes |
| 9 | | Foreign exchange |
| 9 | | Significant events |
| 9 | | Fourth quarter review |
| 10 | | Quarterly trend analysis |
| 11 | | Review of 2014 financial performance |
| 12 | | Outlook for calendar year 2016 |
| |
| 13 | | Non-GAAP measures |
| | |
| 16 | | Strategic business units overview |
| 17 | | Retail and Business Banking |
| 20 | | Wealth Management |
| 23 | | Capital Markets |
| 28 | | Corporate and Other |
| |
| 29 | | Financial condition |
| 29 | | Review of condensed consolidated balance sheet |
| 30 | | Capital resources |
| 39 | | Off-balance sheet arrangements |
| |
| 41 | | Management of risk |
| | |
| 76 | | Accounting and control matters |
| 76 | | Critical accounting policies and estimates |
| 80 | | Financial instruments |
| 80 | | Accounting developments |
| 81 | | Regulatory developments |
| 82 | | Related-party transactions |
| 82 | | Policy on the Scope of Services of the Shareholders’ Auditors |
| 82 | | Controls and procedures |
| |
| 83 | | Supplementary annual financial information |
A NOTE ABOUT FORWARD-LOOKING STATEMENTS: From time to time, we make written or oral forward-looking statements within the meaning of certain securities laws, including in this Annual Report, in other filings with Canadian securities regulators or the SEC and in other communications. All such statements are made pursuant to the “safe harbour” provisions of, and are intended to be forward-looking statements under applicable Canadian and U.S. securities legislation, including the U.S. Private Securities Litigation Reform Act of 1995. These statements include, but are not limited to, statements made in the “Message from the President and Chief Executive Officer”, “Overview – Performance against objectives”, “Financial performance overview – Taxes”, “Financial performance overview – Significant events”, “Financial performance overview – Outlook for calendar year 2016”, “Strategic business units overview – Retail and Business Banking”, “Strategic business units overview – Wealth Management”, “Strategic business units overview – Capital Markets”, “Financial condition – Capital resources”, “Financial condition – Off-balance sheet arrangements”, “Management of risk – Risk overview”, “Management of risk – Top and emerging risks”, “Management of risk – Credit risk”, “Management of risk – Market risk”, “Management of risk – Liquidity risk”, “Accounting and control matters – Critical accounting policies and estimates”, “Accounting and control matters – Financial instruments”, “Accounting and control matters – Accounting developments”, “Accounting and control matters – Regulatory developments” and “Accounting and control matters – Controls and procedures” sections of this report and other statements about our operations, business lines, financial condition, risk management, priorities, targets, ongoing objectives, strategies and outlook for calendar year 2016 and subsequent periods. Forward-looking statements are typically identified by the words “believe”, “expect”, “anticipate”, “intend”, “estimate”, “forecast”, “target”, “objective” and other similar expressions or future or conditional verbs such as “will”, “should”, “would” and “could”. By their nature, these statements require us to make assumptions, including the economic assumptions set out in the “Financial performance overview – Outlook for calendar year 2016” section of this report, and are subject to inherent risks and uncertainties that may be general or specific. A variety of factors, many of which are beyond our control, affect our operations, performance and results, and could cause actual results to differ materially from the expectations expressed in any of our forward-looking statements. These factors include: credit, market, liquidity, strategic, insurance, operational, reputation and legal, regulatory and environmental risk; the effectiveness and adequacy of our risk management and valuation models and processes; legislative or regulatory developments in the jurisdictions where we operate, including the Dodd-Frank Wall Street Reform and Consumer Protection Act and the regulations issued and to be issued thereunder, the U.S. Foreign Account Tax Compliance Act and regulatory reforms in the United Kingdom and Europe, the Basel Committee on Banking Supervision’s global standards for capital and liquidity reform, and those relating to the payments system in Canada; amendments to, and interpretations of, risk-based capital guidelines and reporting instructions, and interest rate and liquidity regulatory guidance; the resolution of legal and regulatory proceedings and related matters; the effect of changes to accounting standards, rules and interpretations; changes in our estimates of reserves and allowances; changes in tax laws; changes to our credit ratings; political conditions and developments; the possible effect on our business of international conflicts and the war on terror; natural disasters, public health emergencies, disruptions to public infrastructure and other catastrophic events; reliance on third parties to provide components of our business infrastructure; potential disruptions to our information technology systems and services; increasing cyber security risks which may include theft of assets, unauthorized access to sensitive information, or operational disruption; social media risk; losses incurred as a result of internal or external fraud; anti-money laundering; the accuracy and completeness of information provided to us concerning clients and counterparties; the failure of third parties to comply with their obligations to us and our affiliates or associates; intensifying competition from established competitors and new entrants in the financial services industry including through internet and mobile banking; technological change; global capital market activity; changes in monetary and economic policy; currency value and interest rate fluctuations, including as a result of oil price volatility; general business and economic conditions worldwide, as well as in Canada, the U.S. and other countries where we have operations, including increasing Canadian household debt levels and Europe’s sovereign debt crisis; our success in developing and introducing new products and services, expanding existing distribution channels, developing new distribution channels and realizing increased revenue from these channels; changes in client spending and saving habits; our ability to attract and retain key employees and executives; our ability to successfully execute our strategies and complete and integrate acquisitions and joint ventures; and our ability to anticipate and manage the risks associated with these factors. This list is not exhaustive of the factors that may affect any of our forward-looking statements. These and other factors should be considered carefully and readers should not place undue reliance on our forward-looking statements. Any forward-looking statements contained in this report represent the views of management only as of the date hereof and are presented for the purpose of assisting our shareholders and financial analysts in understanding our financial position, objectives and priorities and anticipated financial performance as at and for the periods ended on the dates presented, and may not be appropriate for other purposes. We do not undertake to update any forward-looking statement that is contained in this report or in other communications except as required by law.
|
Management’s discussion and analysis |
External reporting changes
The following external reporting changes were made in 2015. Prior period amounts were restated accordingly.
Capital Markets
In November 2015, the name of this strategic business unit (SBU) was changed to Capital Markets from Wholesale Banking. This SBU comprises global markets, corporate and investment banking, and other.
Assets under administration (AUA) and assets under management (AUM)
We restated certain amounts classified as AUA and AUM, and reclassified certain AUA and AUM between Wealth Management and Corporate and Other.
Income statement presentation
We reclassified certain amounts relating to our insurance business within Retail and Business Banking from non-interest expenses to non-interest income. There was no impact on consolidated net income due to this reclassification.
|
Management’s discussion and analysis |
Overview
CIBC is a leading Canadian-based financial institution with a market capitalization of $40 billion and a Basel III Common Equity Tier 1 (CET1) ratio of 10.8%. Through our three main businesses, Retail and Business Banking, Wealth Management, and Capital Markets, CIBC provides a full range of financial products and services to 11 million individual, small business, commercial, corporate and institutional clients in Canada and around the world. We have more than 44,000 employees dedicated to providing our clients with banking that fits their lives; delivering consistent and sustainable earnings growth for our shareholders; and giving back to our communities.
CIBC’s strategy
At CIBC, we are building a strong, innovative, relationship-oriented bank. We have a great team and strong franchise that has proven that it can deliver consistent, sustainable results. Our opportunity now is to transform our bank and deliver growth. We will accelerate our transformation by focusing on three bank-wide priorities:
| • | | Focusing on our clients – our goal is clear. We are targeting to be #1 in client experience. |
| • | | Innovating for the future – we have a long history of innovating for our clients and we will continue to build on our leadership position. |
| • | | Simplifying our bank – we will simplify our bank to make it easier to bank at CIBC and easier to get work done. This will allow us to redeploy resources for reinvestment in our business for future growth and improved efficiency. |
Performance against objectives
For many years, CIBC has reported a scorecard of financial measures that we use to measure and report on our progress to external stakeholders. These measures can be categorized into four key areas of shareholder value – earnings growth, return on common shareholders’ equity (ROE), total shareholder return (TSR) and balance sheet strength. We have set targets for each of these measures over the medium term, which we define as three to five years.
| | |
Earnings growth(1) To assess our earnings growth, we monitor our earnings per share (EPS). CIBC has an EPS growth target of 5% to 10% on average annually. In 2015, we reported adjusted diluted EPS(1) of $9.45, up 6% from $8.94 in 2014 and within our target range. We are maintaining our 5% to 10% average annual EPS growth target over the medium term. In addition to earnings growth, CIBC is focused on achieving positive operating leverage. Over the medium term, as we invest in our core business to enhance client experience, our objective is to grow revenue faster than expenses. | | Adjusted diluted EPS(1) ($) 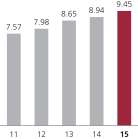
|
Adjusted return on common shareholders’ equity(1) Adjusted ROE is another key measure of shareholder value. CIBC’s 2015 target was to achieve adjusted ROE of 20% through the cycle. In 2015, adjusted ROE of 19.9% was in-line with this target, but below the 20.9% in 2014. Going forward, our target adjusted ROE is 18% to 20% through the cycle. | | Adjusted return on common shareholders’ equity(1) (%) 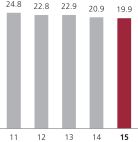
|
| (1) | For additional information, see the “Non-GAAP measures” section. |
|
Management’s discussion and analysis |
| | |
Total shareholder return One of CIBC’s priorities is to fulfill the commitments we have made to each of our stakeholders, which includes generating a strong level of TSR. We have two targets that support this priority: 1. In 2015, consistent with prior years, we target on a long-term, average basis, between 40% and 50% of our earnings to be paid in the form of dividends to our common shareholders. In 2015, our adjusted dividend payout ratio(1) was within this target range. Our key criteria for considering dividend increases are our current level of payout relative to our target and our view on the sustainability of our current earnings level through the cycle. Our confidence in our ability to generate consistent, sustainable returns allowed us to increase our quarterly dividend by $0.12 to $1.12 per share in 2015. On September 16, 2015, we announced a new share buyback program to purchase for cancellation up to a maximum of 8.0 million outstanding common shares. In 2015, we repurchased 115,900 CIBC shares for cancellation. 2. We also have an objective to deliver a TSR that exceeds the industry average, which we have defined as the S&P/TSX Composite Banks Index, over a rolling five-year period. For the five years ended October 31, 2015, CIBC delivered a TSR of 60.9%, above the Bank Index return of 59.6%. Going forward, our target is to deliver an adjusted dividend payout ratio of approximately 50% of our earnings and a rolling five-year TSR above the industry average. | | Adjusted dividend payout ratio(1) (%) 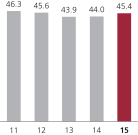
Rolling five-year total shareholder return (%) 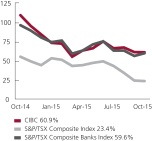
|
Balance sheet strength Maintaining a strong balance sheet is foundational to our long-term sustainability. Capital levels are a key component of balance sheet strength. Our goal is to maintain strong capital ratios that exceed regulatory targets. At the end of 2015, our Basel III CET1 ratio on an all-in basis was 10.8%, well above the regulatory target set by OSFI. In addition to our capital objectives, we remain focused on asset quality and a strong funding profile as key underpinnings of a strong balance sheet. | | CET1 ratio(2) (%) 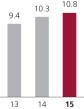
|
| (1) | For additional information, see the “Non-GAAP measures” section. |
| (2) | CET1 ratio was effective beginning in 2013. |
Economic and market environment
CIBC operated in an environment of decelerating domestic and global economic growth in 2015, including declines in Canada through the first half of the calendar year. Weakness in oil and other resource prices led to a drop in Canadian business capital spending, and softer employment growth that pushed the unemployment rate modestly higher. Supported by lower interest rates, household consumption and housing remained healthy, while household borrowing accelerated as average mortgage sizes trended in line with house prices. Business credit maintained a solid pace of growth. Capital markets saw firmer growth in government bonds, but lower issuance activity for domestic currency corporate bonds. Weaker equity markets impacted wealth management and equity origination, but market volatility was supportive for secondary trading across capital markets businesses.
|
Management’s discussion and analysis |
Financial performance overview
Financial highlights
| | | | | | | | | | | | | | | | | | | | | | |
| As at or for the year ended October 31 | | | | 2015 | | | 2014 (1) | | | 2013 (1) | | | 2012 | | | 2011 | |
Financial results ($ millions) | | | | | | | | | | | | | | | | | | | | | | |
Net interest income | | | | $ | 7,915 | | | $ | 7,459 | | | $ | 7,453 | | | $ | 7,326 | | | $ | 7,062 | |
Non-interest income | | | | | 5,941 | | | | 5,904 | | | | 5,252 | | | | 5,159 | | | | 5,373 | |
Total revenue | | | | | 13,856 | | | | 13,363 | | | | 12,705 | | | | 12,485 | | | | 12,435 | |
Provision for credit losses | | | | | 771 | | | | 937 | | | | 1,121 | | | | 1,291 | | | | 1,144 | |
Non-interest expenses | | | | | 8,861 | | | | 8,512 | | | | 7,608 | | | | 7,202 | | | | 7,486 | |
Income before income taxes | | | | | 4,224 | | | | 3,914 | | | | 3,976 | | | | 3,992 | | | | 3,805 | |
Income taxes | | | | | 634 | | | | 699 | | | | 626 | | | | 689 | | | | 927 | |
Net income | | | | $ | 3,590 | | | $ | 3,215 | | | $ | 3,350 | | | $ | 3,303 | | | $ | 2,878 | |
Net income (loss) attributable to non-controlling interests | | | 14 | | | | (3 | ) | | | (2 | ) | | | 9 | | | | 11 | |
Preferred shareholders | | | | | 45 | | | | 87 | | | | 99 | | | | 158 | | | | 177 | |
Common shareholders | | | | | 3,531 | | | | 3,131 | | | | 3,253 | | | | 3,136 | | | | 2,690 | |
Net income attributable to equity shareholders | | $ | 3,576 | | | $ | 3,218 | | | $ | 3,352 | | | $ | 3,294 | | | $ | 2,867 | |
Financial measures | | | | | | | | | | | | | | | | | | | | | | |
Reported efficiency ratio | | | | | 63.9 | % | | | 63.7 | % | | | 59.9 | % | | | 57.7 | % | | | 60.2 | % |
Adjusted efficiency ratio (2) | | | | | 59.6 | % | | | 59.0 | % | | | 56.5 | % | | | 56.0 | % | | | 56.4 | % |
Loan loss ratio | | | | | 0.27 | % | | | 0.38 | % | | | 0.44 | % | | | 0.53 | % | | | 0.51 | % |
Reported return on common shareholders’ equity | | | 18.7 | % | | | 18.3 | % | | | 21.4 | % | | | 22.2 | % | | | 22.2 | % |
Adjusted return on common shareholders’ equity (2) | | | 19.9 | % | | | 20.9 | % | | | 22.9 | % | | | 22.8 | % | | | 24.8 | % |
Net interest margin | | | | | 1.74 | % | | | 1.81 | % | | | 1.85 | % | | | 1.84 | % | | | 1.79 | % |
Net interest margin on average interest-earning assets | | | 2.00 | % | | | 2.05 | % | | | 2.12 | % | | | 2.15 | % | | | 2.03 | % |
Return on average assets | | | | | 0.79 | % | | | 0.78 | % | | | 0.83 | % | | | 0.83 | % | | | 0.73 | % |
Return on average interest-earning assets | | | 0.91 | % | | | 0.89 | % | | | 0.95 | % | | | 0.97 | % | | | 0.83 | % |
Total shareholder return | | | | | 1.96 | % | | | 20.87 | % | | | 18.41 | % | | | 9.82 | % | | | 0.43 | % |
Reported effective tax rate | | | | | 15.0 | % | | | 17.9 | % | | | 15.8 | % | | | 17.3 | % | | | 24.4 | % |
Adjusted effective tax rate (2) | | | | | 15.5 | % | | | 15.4 | % | | | 16.5 | % | | | 18.0 | % | | | 23.0 | % |
Common share information | | | | | | | | | | | | | | | | | | | | | | |
Per share ($) | | – basic earnings | | $ | 8.89 | | | $ | 7.87 | | | $ | 8.11 | | | $ | 7.77 | | | $ | 6.79 | |
| | – reported diluted earnings | | | 8.87 | | | | 7.86 | | | | 8.11 | | | | 7.76 | | | | 6.71 | |
| | – adjusted diluted earnings (2) | | | 9.45 | | | | 8.94 | | | | 8.65 | | | | 7.98 | | | | 7.57 | |
| | – dividends | | | 4.30 | | | | 3.94 | | | | 3.80 | | | | 3.64 | | | | 3.51 | |
| | – book value | | | 51.25 | | | | 44.30 | | | | 40.36 | | | | 35.83 | | | | 32.88 | |
Share price ($) | | – high | | | 107.16 | | | | 107.01 | | | | 88.70 | | | | 78.56 | | | | 85.49 | |
| | – low | | | 86.00 | | | | 85.49 | | | | 74.10 | | | | 68.43 | | | | 67.84 | |
| | – closing | | | 100.28 | | | | 102.89 | | | | 88.70 | | | | 78.56 | | | | 75.10 | |
Shares outstanding (thousands) | | – weighted-average basic | | | 397,213 | | | | 397,620 | | | | 400,880 | | | | 403,685 | | | | 396,233 | |
| | – weighted-average diluted | | | 397,832 | | | | 398,420 | | | | 401,261 | | | | 404,145 | | | | 406,696 | |
| | – end of period | | | 397,291 | | | | 397,021 | | | | 399,250 | | | | 404,485 | | | | 400,534 | |
Market capitalization ($ millions) | | | | $ | 39,840 | | | $ | 40,850 | | | $ | 35,413 | | | $ | 31,776 | | | $ | 30,080 | |
Value measures | | | | | | | | | | | | | | | | | | | | | | |
Dividend yield (based on closing share price) | | | 4.3 | % | | | 3.8 | % | | | 4.3 | % | | | 4.6 | % | | | 4.7 | % |
Reported dividend payout ratio | | | | | 48.4 | % | | | 50.0 | % | | | 46.8 | % | | | 46.9 | % | | | 51.7 | % |
Adjusted dividend payout ratio (2) | | | | | 45.4 | % | | | 44.0 | % | | | 43.9 | % | | | 45.6 | % | | | 46.3 | % |
Market value to book value ratio | | | | | 1.96 | | | | 2.32 | | | | 2.20 | | | | 2.19 | | | | 2.28 | |
On- and off-balance sheet information($ millions) | | | | | | | | | | | | | | | | | | | | |
Cash, deposits with banks and securities | | | | $ | 93,619 | | | $ | 73,089 | | | $ | 78,363 | | | $ | 70,061 | | | $ | 65,437 | |
Loans and acceptances, net of allowance | | | | | 290,981 | | | | 268,240 | | | | 256,380 | | | | 252,732 | | | | 248,409 | |
Total assets | | | | | 463,309 | | | | 414,903 | | | | 398,006 | | | | 393,119 | | | | 383,758 | |
Deposits | | | | | 366,657 | | | | 325,393 | | | | 315,164 | | | | 300,344 | | | | 289,220 | |
Common shareholders’ equity | | | | | 20,360 | | | | 17,588 | | | | 16,113 | | | | 14,491 | | | | 13,171 | |
Average assets | | | | | 455,324 | | | | 411,481 | | | | 403,546 | | | | 397,155 | | | | 394,527 | |
Average interest-earning assets | | | | | 395,616 | | | | 362,997 | | | | 351,687 | | | | 341,053 | | | | 347,634 | |
Average common shareholders’ equity | | | | | 18,857 | | | | 17,067 | | | | 15,167 | | | | 14,116 | | | | 12,145 | |
AUA (3)(4) | | | | | 1,846,142 | | | | 1,703,360 | | | | 1,499,885 | | | | 1,445,870 | | | | 1,317,799 | |
AUM (4) | | | | | 170,465 | | | | 151,913 | | | | 105,123 | | | | 89,223 | | | | 80,521 | |
Balance sheet quality (All-in basis) and liquidity measures (5) | | | | | | | | | | | | | | | | | | | | |
Basel III - All-in basis | | | | | | | | | | | | | | | | | | | | | | |
Risk-weighted assets (RWA) ($ millions) | | | | | | | | | | | | | | | | | | | | |
CET1 capital RWA | | | | $ | 156,107 | | | $ | 141,250 | | | $ | 136,747 | | | | n/a | | | | n/a | |
Tier 1 capital RWA | | | | | 156,401 | | | | 141,446 | | | | 136,747 | | | | n/a | | | | n/a | |
Total capital RWA | | | | | 156,652 | | | | 141,739 | | | | 136,747 | | | | n/a | | | | n/a | |
Capital ratios | | | | | | | | | | | | | | | | | | | | |
CET1 ratio | | | | | 10.8 | % | | | 10.3 | % | | | 9.4 | % | | | n/a | | | | n/a | |
Tier 1 capital ratio | | | | | 12.5 | % | | | 12.2 | % | | | 11.6 | % | | | n/a | | | | n/a | |
Total capital ratio | | | | | 15.0 | % | | | 15.5 | % | | | 14.6 | % | | | n/a | | | | n/a | |
Basel II (6) | | | | | | | | | | | | | | | | | | | | | | |
RWA ($ millions) | | | | | n/a | | | | n/a | | | | n/a | | | $ | 115,229 | | | $ | 109,968 | |
Tier 1 capital ratio | | | | | n/a | | | | n/a | | | | n/a | | | | 13.8 | % | | | 14.7 | % |
Total capital ratio | | | | | n/a | | | | n/a | | | | n/a | | | | 17.3 | % | | | 18.4 | % |
Basel III leverage ratio | | | | | | | | | | | | | | | | | | | | | | |
Tier 1 capital | | | | $ | 19,520 | | | $ | 17,300 | | | $ | 15,888 | | | | n/a | | | | n/a | |
Leverage ratio exposure | | | | | 502,552 | | | | n/a | | | | n/a | | | | n/a | | | | n/a | |
Leverage ratio | | | | | 3.9 | % | | | n/a | | | | n/a | | | | n/a | | | | n/a | |
Liquidity coverage ratio (LCR) (7) | | | | | 118.9 | % | | | n/a | | | | n/a | | | | n/a | | | | n/a | |
Other information | | | | | | | | | | | | | | | | | | | | | | |
Full-time equivalent employees | | | | | 44,201 | | | | 44,424 | | | | 43,039 | | | | 42,595 | | | | 42,239 | |
| (1) | Certain information has been reclassified/restated to conform to the presentation adopted in the current year. See “External reporting changes” for additional details. |
| (2) | For additional information, see the “Non-GAAP measures” section. |
| (3) | Includes the full contract amount of AUA or custody under a 50/50 joint venture between CIBC and The Bank of New York Mellon of $1,465.7 billion (2014: $1,347.2 billion). |
| (4) | AUM amounts are included in the amounts reported under AUA. |
| (5) | Capital measures for fiscal years 2015, 2014 and 2013 are based on Basel III whereas measures for prior years are based on Basel II. |
| (6) | Capital measures for fiscal year 2011 are under Canadian GAAP and have not been restated for IFRS. |
| (7) | Average for the three months ended October 31, 2015. |
|
Management’s discussion and analysis |
2015 Financial results
Reported net income for the year was $3,590 million, compared with $3,215 million in 2014.
Adjusted net income(1) for the year was $3,822 million, compared with $3,657 million in 2014.
Reported diluted EPS for the year was $8.87, compared with $7.86 in 2014.
Adjusted diluted EPS(1) for the year was $9.45, compared with $8.94 in 2014.
2015
Net income was affected by the following items of note:
| • | | $296 million ($225 million after-tax) in cumulative restructuring charges primarily relating to employee severance (Corporate and Other); |
| • | | $46 million ($34 million after-tax) gain arising from accounting adjustments on credit card-related balance sheet amounts (Retail and Business Banking); |
| • | | $42 million ($33 million after-tax) amortization of intangible assets ($6 million after-tax in Retail and Business Banking, $18 million after-tax in Wealth Management, and $9 million after-tax in Corporate and Other); |
| • | | $29 million ($21 million after-tax) loss from the structured credit run-off business (Capital Markets); and |
| • | | $23 million ($13 million after-tax) gain on sale of an investment in our merchant banking portfolio (Capital Markets). |
The above items of note increased revenue by $40 million and non-interest expenses by $338 million, and decreased income tax expense by $66 million. In aggregate, these items of note decreased net income by $232 million.
2014
Net income was affected by the following items of note:
| • | | $543 million ($543 million after-tax) of charges relating to FirstCaribbean International Bank Limited (CIBC FirstCaribbean), comprising a goodwill impairment charge of $420 million ($420 million after-tax) and loan losses of $123 million ($123 million after-tax), reflecting revised expectations on the extent and timing of the anticipated economic recovery in the Caribbean region (Corporate and Other); |
| • | | $190 million ($147 million after-tax) gain in respect of the Aeroplan transactions with Aimia Canada Inc. (Aimia) and the Toronto-Dominion Bank (TD), net of costs relating to the development of our enhanced travel rewards program ($87 million after-tax in Retail and Business Banking, and $60 million after-tax in Corporate and Other); |
| • | | $112 million ($82 million after-tax) charge relating to the incorporation of funding valuation adjustments (FVA) into the valuation of our uncollateralized derivatives (Capital Markets); |
| • | | $78 million ($57 million after-tax) gain, net of associated expenses, on the sale of an equity investment in our exited European leveraged finance portfolio (Capital Markets); |
| • | | $52 million ($30 million after-tax) gain within an equity-accounted investment in our merchant banking portfolio (Capital Markets); |
| • | | $36 million ($28 million after-tax) amortization of intangible assets ($4 million after-tax in Retail and Business Banking, $15 million after-tax in Wealth Management, and $9 million after-tax in Corporate and Other); |
| • | | $26 million ($19 million after-tax) reduction in the portion of the collective allowance recognized in Corporate and Other(2), including lower estimated credit losses relating to the Alberta floods (Corporate and Other); |
| • | | $26 million ($19 million after-tax) charge resulting from operational changes in the processing of write-offs in Retail and Business Banking; |
| • | | $22 million ($12 million after-tax) loan losses in our exited U.S. leveraged finance portfolio (Capital Markets); and |
| • | | $15 million ($11 million after-tax) loss from the structured credit run-off business (Capital Markets). |
The above items of note increased revenue by $276 million, provision for credit losses by $145 million, non-interest expenses by $539 million, and income tax expense by $34 million. In aggregate, these items of note decreased net income by $442 million.
Net interest income and margin
| | | | | | | | | | | | |
| $ millions, for the year ended October 31 | | 2015 | | | 2014 | | | 2013 | |
Average interest-earning assets | | | $ 395,616 | | | | $ 362,997 | | | | $ 351,687 | |
Net interest income | | | 7,915 | | | | 7,459 | | | | 7,453 | |
Net interest margin on average interest-earning assets | | | 2.00 | % | | | 2.05 | % | | | 2.12 | % |
Net interest income was up $456 million or 6% from 2014, primarily due to volume growth across retail products, higher trading income, and a gain arising from accounting adjustments on credit card-related balance sheet amounts, shown as an item of note. These factors were partially offset by lower treasury revenue, and lower card revenue as a result of the Aeroplan transactions in 2014 noted above.
Net interest margin on average interest-earning assets was down 5 basis points due to higher average interest-earning assets, primarily driven by growth across CIBC’s businesses and higher short-term placements in treasury, partially offset by higher net interest income.
Additional information on net interest income and margin is provided in the “Supplementary annual financial information” section.
| (1) | For additional information, see the “Non-GAAP measures” section. |
| (2) | Relates to collective allowance, except for (i) residential mortgages greater than 90 days delinquent; (ii) personal loans and scored small business loans greater than 30 days delinquent; and (iii) netwrite-offs for the cards portfolio, which are all reported in the respective SBUs. |
|
Management’s discussion and analysis |
Non-interest income
| | | | | | | | | | | | |
| $ millions, for the year ended October 31 | | 2015 | | | 2014 | | | 2013 | |
Underwriting and advisory fees | | $ | 427 | | | $ | 444 | | | $ | 389 | |
Deposit and payment fees | | | 830 | | | | 848 | | | | 824 | |
Credit fees | | | 533 | | | | 478 | | | | 462 | |
Card fees | | | 449 | | | | 414 | | | | 535 | |
Investment management and custodial fees(1)(2) | | | 814 | | | | 677 | | | | 474 | |
Mutual fund fees(2) | | | 1,457 | | | | 1,236 | | | | 1,014 | |
Insurance fees, net of claims(3) | | | 361 | | | | 356 | | | | 345 | |
Commissions on securities transactions | | | 385 | | | | 408 | | | | 412 | |
Trading income (loss) | | | (139 | ) | | | (176 | ) | | | 27 | |
Available-for-sale (AFS) securities gains, net | | | 138 | | | | 201 | | | | 212 | |
Designated at fair value (FVO) gains (losses), net | | | (3 | ) | | | (15 | ) | | | 5 | |
Foreign exchange other than trading | | | 92 | | | | 43 | | | | 44 | |
Income from equity-accounted associates and joint ventures(1) | | | 177 | | | | 226 | | | | 140 | |
Other | | | 420 | | | | 764 | | | | 369 | |
| | | $ | 5,941 | | | $ | 5,904 | | | $ | 5,252 | |
| (1) | Custodial fees directly recognized by CIBC are included in Investment management and custodial fees, and our proportionate share of CIBC Mellon’s custodial fees are included within Income from equity-accounted associates and joint ventures. |
| (2) | Investment management fees and mutual fund fees are driven by various factors, including the amount of AUM. Investment management fees in our asset management and private wealth management businesses are generally driven by the amount of AUM, while investment management fees in our retail brokerage business are driven by a combination of the amount of AUA and, to a lesser extent, other factors unrelated to the amount of AUA (e.g. flat fees on a per account basis). |
| (3) | Certain prior period information has been reclassified to conform to the presentation adopted in the current year. See “External reporting changes” for additional details. |
Non-interest income was up $37 million or 1% from 2014.
Credit fees were up $55 million or 12%, primarily due to higher lending volumes in Retail and Business Banking and Capital Markets.
Card fees were up $35 million or 8%, due to growth in CIBC cards following the Aeroplan transactions in the prior year.
Investment management and custodial fees were up $137 million or 20%. Approximately 33% of the increase was driven by the inclusion of a full year of Atlantic Trust Private Wealth Management (Atlantic Trust) results in the current year versus ten months in the prior year, and an increase in Atlantic Trust AUM balances. Approximately 62% of the increase was driven by AUM and AUA growth in other areas within Wealth Management.
Mutual fund fees were up $221 million or 18%. Approximately 76% of the increase was due to higher AUM in our asset management business, driven by net sales of long-term mutual funds and market appreciation. The remaining increase was mainly due to Atlantic Trust, driven by annual performance fees earned, and growth in AUM.
Commissions on securities transactions were down $23 million or 6%, primarily due to lower commissions in our retail brokerage business.
Trading losswas down $37 million or 21%. See the “Trading activities (TEB)” section which follows for further details.
AFS securities gains, net, were down $63 million or 31%, primarily due to lower gains in our treasury and merchant banking portfolios.
Foreign exchange other than tradingwas up $49 million or 114%, largely driven by higher gains on economic hedging activities.
Income from equity-accounted associates and joint ventureswas down $49 million or 22%, as the prior year included a gain within an equity-accounted investment in our merchant banking portfolio, shown as an item of note.
Otherwas down $344 million or 45%, as the prior year included the gains relating to the Aeroplan transactions and the sale of an equity investment in our exited European leveraged finance portfolio, both shown as items of note.
Trading activities (TEB)
| | | | | | | | | | | | |
| $ millions, for the year ended October 31 | | 2015 | | | 2014 | | | 2013 | |
Trading income (loss) consists of: | | | | | | | | | | | | |
Net interest income(1) | | $ | 1,259 | | | $ | 1,049 | | | $ | 969 | |
Non-interest income | | | (139 | ) | | | (176 | ) | | | 27 | |
| | | $ | 1,120 | | | $ | 873 | | | $ | 996 | |
Trading income (loss) by product line: | | | | | | | | | | | | |
Interest rates | | $ | 109 | | | $ | (22 | ) | | $ | 135 | |
Foreign exchange | | | 471 | | | | 392 | | | | 344 | |
Equities | | | 414 | | | | 369 | | | | 333 | |
Commodities | | | 78 | | | | 48 | | | | 55 | |
Structured credit | | | – | | | | 35 | | | | 77 | |
Other | | | 48 | | | | 51 | | | | 52 | |
| | | $ | 1,120 | | | $ | 873 | | | $ | 996 | |
| (1) | Includes taxable equivalent basis (TEB) adjustment of $482 million (2014: $421 million; 2013: $356 million) reported within Capital Markets. See “Strategic business units overview” section for further details. |
Net interest income comprises interest and dividends relating to financial assets and liabilities associated with trading activities, net of interest expense and interest income associated with funding these assets and liabilities. Non-interest income includes realized and unrealized gains and losses on securities held-for-trading and income relating to changes in fair value of derivative financial instruments. Trading activities and related risk management strategies can
|
Management’s discussion and analysis |
periodically shift income between net interest income and non-interest income. Therefore, we view total trading revenue as the most appropriate measure of trading performance.
Trading income was up $247 million or 28% from 2014, as the prior year included the charge relating to the incorporation of FVA into the valuation of our uncollateralized derivatives, shown as an item of note. The current year had higher trading income in foreign exchange, equities, and commodities, partially offset by lower income in the structured credit run-off business.
Provision for credit losses
| | | | | | | | | | | | |
| $ millions, for the year ended October 31 | | 2015 | | | 2014 | | | 2013 | |
Retail and Business Banking | | $ | 707 | | | $ | 731 | | | $ | 930 | |
Wealth Management | | | (1 | ) | | | – | | | | 1 | |
Capital Markets | | | 17 | | | | 43 | | | | 44 | |
Corporate and Other | | | 48 | | | | 163 | | | | 146 | |
| | | $ | 771 | | | $ | 937 | | | $ | 1,121 | |
Provision for credit losses was down $166 million or 18% from 2014.
In Retail and Business Banking, the prior year included a charge resulting from operational changes in the processing of write-offs, shown as an item of note. Lower loan losses in the card portfolio in the current year reflect credit improvements, as well as the impact of an initiative to enhance account management practices, and the sold Aeroplan portfolio. This was partially offset by higher losses in the oil and gas sector within the business lending portfolio.
In Capital Markets, the provision was down as the prior year included loan losses in our exited U.S. leveraged finance portfolio, shown as an item of note. The current year included lower losses in our corporate lending portfolio.
In Corporate and Other, the provision was down as the prior year included loan losses relating to CIBC FirstCaribbean, partially offset by a reduction in the collective allowance, including lower estimated credit losses relating to the Alberta floods, both shown as items of note. Excluding items of note, the current year still had lower losses in CIBC FirstCaribbean, partially offset by an increase in the collective allowance versus a reduction in the prior year.
Non-interest expenses
| | | | | | | | | | | | |
| $ millions, for the year ended October 31 | | 2015 | | | 2014 | | | 2013 | |
Employee compensation and benefits | | | | | | | | | | | | |
Salaries | | $ | 2,826 | | | $ | 2,502 | | | $ | 2,397 | |
Performance-based compensation | | | 1,568 | | | | 1,483 | | | | 1,299 | |
Benefits | | | 705 | | | | 651 | | | | 628 | |
| | | 5,099 | | | | 4,636 | | | | 4,324 | |
Occupancy costs | | | 782 | | | | 736 | | | | 700 | |
Computer, software and office equipment | | | 1,292 | | | | 1,200 | | | | 1,052 | |
Communications | | | 326 | | | | 312 | | | | 307 | |
Advertising and business development | | | 281 | | | | 285 | | | | 236 | |
Professional fees | | | 230 | | | | 201 | | | | 179 | |
Business and capital taxes | | | 68 | | | | 59 | | | | 62 | |
Other (1) | | | 783 | | | | 1,083 | | | | 748 | |
| | | $ | 8,861 | | | $ | 8,512 | | | $ | 7,608 | |
| (1) | Certain prior period information has been reclassified to conform to the presentation adopted in the current year. See “External reporting changes” for additional details. |
Non-interest expenses increased by $349 million or 4% from 2014.
Employee compensation and benefits increased by $463 million or 10%, mainly due to cumulative restructuring charges primarily relating to employee severance, shown as an item of note, and higher salaries, performance-based compensation and benefits.
Computer, software and office equipmentincreased by $92 million or 8%, primarily due to higher spending on strategic initiatives.
Other decreased by $300 million or 28%, as the prior year included a goodwill impairment charge relating to CIBC FirstCaribbean, shown as an item of note.
Taxes
| | | | | | | | | | | | |
| $ millions, for the year ended October 31 | | 2015 | | | 2014 | | | 2013 | |
Income tax expense | | $ | 634 | | | $ | 699 | | | $ | 626 | |
Indirect taxes (1) | | | | | | | | | | | | |
Goods and services tax (GST), harmonized sales tax (HST) and sales taxes | | | 342 | | | | 330 | | | | 324 | |
Payroll taxes | | | 239 | | | | 216 | | | | 204 | |
Capital taxes | | | 39 | | | | 34 | | | | 40 | |
Property and business taxes | | | 68 | | | | 59 | | | | 55 | |
Total indirect taxes | | | 688 | | | | 639 | | | | 623 | |
Total taxes | | $ | 1,322 | | | $ | 1,338 | | | $ | 1,249 | |
Reported effective tax rate | | | 15.0 | % | | | 17.9 | % | | | 15.8 | % |
Total taxes as a percentage of net income before deduction of total taxes | | | 26.9 | % | | | 29.4 | % | | | 27.2 | % |
| (1) | Certain amounts are based on a paid or payable basis and do not factor in capitalization and subsequent amortization. |
Income taxes include those imposed on CIBC as a Canadian legal entity, as well as on our domestic and foreign subsidiaries. Indirect taxes comprise GST, HST and sales, payroll, capital, property and business taxes. Indirect taxes are included in non-interest expenses.
Total income and indirect taxes were down $16 million from 2014.
|
Management’s discussion and analysis |
Income tax expense was $634 million, compared with $699 million in 2014. Income tax expense was lower, notwithstanding higher income in the current year, primarily due to no tax recovery being booked in the prior year in respect of the CIBC FirstCaribbean goodwill impairment charge and loan losses, and the impact of higher tax-exempt income in the current year.
Indirect taxes were up by $49 million, mainly due to higher payroll and sales taxes. Payroll taxes increased due to higher rates and compensation.
In prior years, the Canada Revenue Agency issued reassessments disallowing the deduction of approximately $3 billion of the 2005 Enron settlement payments and related legal expenses. The matter is currently in litigation. The Tax Court of Canada trial on the deductibility of the Enron payments is expected to be set down for trial in 2016.
Should we successfully defend our tax filing position in its entirety, we would recognize an additional accounting tax benefit of $231 million and taxable refund interest of approximately $182 million. Should we fail to defend our position in its entirety, we would incur an additional tax expense of approximately $820 million and non-deductible interest of approximately $157 million.
The statutory income tax rate applicable to CIBC as a legal entity was 26.4% in 2015. The rate will increase to 26.5% in 2016.
For a reconciliation of our income taxes in the consolidated statement of income with the combined Canadian federal and provincial income tax rate, see Note 20 to the consolidated financial statements.
Foreign exchange
The estimated impact of U.S. dollar translation on key lines of our consolidated statement of income, as a result of changes in average exchange rates, is as follows:
| | | | | | | | | | | | |
| $ millions, for the year ended October 31 | | 2015 vs. 2014 | | | 2014 vs. 2013 | | | 2013 vs. 2012 | |
Estimated increase in: | | | | | | | | | | | | |
Total revenue | | $ | 281 | | | $ | 131 | | | $ | 34 | |
Provision for credit losses | | | 7 | | | | 17 | | | | 3 | |
Non-interest expenses | | | 145 | | | | 83 | | | | 14 | |
Income taxes | | | 5 | | | | 5 | | | | 1 | |
Net income | | | 124 | | | | 26 | | | | 16 | |
Average USD appreciation relative to CAD | | | 14.7 | % | | | 6.9 | % | | | 2.0 | % |
Significant events
Restructuring
During the year, we recorded cumulative restructuring charges of $296 million ($225 million after-tax) in Corporate and Other, which includes $85 million ($62 million after-tax) recorded in the first quarter and $211 million ($163 million after-tax) recorded in the fourth quarter. The charges primarily relate to employee severance and include Program Clarity, a bank-wide priority focused on simplifying our bank. Program Clarity will make it easier to bank at CIBC and easier to get work done, improve efficiency and enable reinvestment. The charge recorded in the fourth quarter also includes restructuring costs related to CIBC FirstCaribbean, which include charges related to the sale by CIBC FirstCaribbean of its Belize banking operations that is expected to close in the first quarter of 2016.
Sale of equity investment
On April 30, 2015, CIBC sold its equity investment in The Bank of N.T. Butterfield & Son Limited, which was accounted for as an associate within Corporate and Other, for an amount, net of associated expenses, that approximated its carrying value.
Fourth quarter review
| | | | | | | | | | | | | | | | | | | | | | | | | | | | | | | | | | |
| $ millions, except per share amounts, for the three months ended | | | | | | | | | 2015 | | | 2014 (1) | |
| | | | | Oct. 31 | | | Jul. 31 | | | Apr. 30 | | | Jan. 31 | | | Oct. 31 | | | Jul. 31 | | | Apr. 30 | | | Jan. 31 | |
Revenue | | | | | | | | | | | | | | | | | | | | | | | | | | | | | | | | |
Retail and Business Banking | | $ | 2,183 | | | $ | 2,127 | | | $ | 2,037 | | | $ | 2,093 | | | $ | 2,046 | | | $ | 2,029 | | | $ | 1,936 | | | $ | 2,252 | |
Wealth Management | | | 609 | | | | 628 | | | | 615 | | | | 619 | | | | 584 | | | | 568 | | | | 548 | | | | 502 | |
Capital Markets (2) | | | 579 | | | | 696 | | | | 661 | | | | 706 | | | | 468 | | | | 670 | | | | 606 | | | | 680 | |
Corporate and Other (2) | | | 112 | | | | 69 | | | | 81 | | | | 41 | | | | 115 | | | | 88 | | | | 74 | | | | 197 | |
Total revenue | | $ | 3,483 | | | $ | 3,520 | | | $ | 3,394 | | | $ | 3,459 | | | $ | 3,213 | | | $ | 3,355 | | | $ | 3,164 | | | $ | 3,631 | |
Net interest income | | $ | 2,043 | | | $ | 2,021 | | | $ | 1,895 | | | $ | 1,956 | | | $ | 1,881 | | | $ | 1,875 | | | $ | 1,798 | | | $ | 1,905 | |
Non-interest income | | | 1,440 | | | | 1,499 | | | | 1,499 | | | | 1,503 | | | | 1,332 | | | | 1,480 | | | | 1,366 | | | | 1,726 | |
Total revenue | | | 3,483 | | | | 3,520 | | | | 3,394 | | | | 3,459 | | | | 3,213 | | | | 3,355 | | | | 3,164 | | | | 3,631 | |
Provision for credit losses | | | 198 | | | | 189 | | | | 197 | | | | 187 | | | | 194 | | | | 195 | | | | 330 | | | | 218 | |
Non-interest expenses | | | 2,383 | | | | 2,179 | | | | 2,104 | | | | 2,195 | | | | 2,083 | | | | 2,044 | | | | 2,409 | | | | 1,976 | |
Income before income taxes | | | 902 | | | | 1,152 | | | | 1,093 | | | | 1,077 | | | | 936 | | | | 1,116 | | | | 425 | | | | 1,437 | |
Income taxes | | | 124 | | | | 174 | | | | 182 | | | | 154 | | | | 125 | | | | 195 | | | | 119 | | | | 260 | |
Net income | | $ | 778 | | | $ | 978 | | | $ | 911 | | | $ | 923 | | | $ | 811 | | | $ | 921 | | | $ | 306 | | | $ | 1,177 | |
Net income (loss) attributable to: | | | | | | | | | | | | | | | | | | | | | | | | | | | | | | | | |
Non-controlling interests | | $ | 2 | | | $ | 5 | | | $ | 4 | | | $ | 3 | | | $ | 2 | | | $ | 3 | | | $ | (11 | ) | | $ | 3 | |
Equity shareholders | | | 776 | | | | 973 | | | | 907 | | | | 920 | | | | 809 | | | | 918 | | | | 317 | | | | 1,174 | |
EPS | | – basic | | $ | 1.93 | | | $ | 2.42 | | | $ | 2.25 | | | $ | 2.28 | | | $ | 1.99 | | | $ | 2.26 | | | $ | 0.73 | | | $ | 2.88 | |
| | | – diluted | | $ | 1.93 | | | $ | 2.42 | | | $ | 2.25 | | | $ | 2.28 | | | $ | 1.98 | | | $ | 2.26 | | | $ | 0.73 | | | $ | 2.88 | |
| (1) | Certain information has been reclassified to conform to the presentation adopted in the current year. See “External reporting changes” for additional details. |
| (2) | Capital Markets revenue and income taxes are reported on a TEB basis with an equivalent offset in the revenue and income taxes of Corporate and Other. |
|
Management’s discussion and analysis |
Compared with Q4/14
Net income for the quarter was $778 million, down $33 million or 4% from the fourth quarter of 2014.
Net interest income was up $162 million or 9%, primarily due to volume growth across retail products, wider retail spreads, and higher trading income, partially offset by lower treasury revenue.
Non-interest income was up $108 million or 8%, as the same quarter last year included a charge relating to FVA, shown as an item of note. The current quarter had higher fee-based revenue and higher foreign exchange other than trading revenue, partially offset by equities and interest rates trading losses.
Provision for credit losses was up $4 million or 2%. In Retail and Business Banking, the provision was up due to higher losses in the oil and gas sector within the business lending portfolio, partially offset by lower write-offs and bankruptcies in the card portfolio. In Capital Markets, the current quarter had a reversal compared with a provision for credit losses in the prior year quarter, primarily due to recoveries in the U.S. real estate finance portfolio versus losses in the prior year quarter. In Corporate and Other, the provision was up primarily due to an increase in the collective allowance versus a reduction in the prior year quarter, partially offset by lower losses in CIBC FirstCaribbean.
Non-interest expenses were up $300 million or 14%, mainly due to restructuring charges primarily relating to employee severance, shown as an item of note, and higher spending on other strategic initiatives.
Income tax expense was comparable as lower income in the current quarter was offset by a decrease in the relative proportion of income earned in low tax jurisdictions.
Compared with Q3/15
Net income for the quarter was $778 million, down $200 million or 20% from the prior quarter.
Net interest income was up $22 million or 1%, primarily due to volume growth across retail products and higher trading income, partially offset by lower treasury revenue.
Non-interest income was down $59 million or 4%, primarily due to equities and interest rates trading losses, and lower commodities trading revenue, partially offset by higher insurance fees and net FVO gains in the current quarter, compared with losses in the prior quarter.
Provision for credit losses was up $9 million or 5%. In Retail and Business Banking, the provision was up primarily due to higher losses in the oil and gas sector within the business lending portfolio, partially offset by lower write-offs and bankruptcies in the card portfolio. In Capital Markets, the current quarter had a reversal compared with a provision for credit losses in the prior quarter, primarily due to recoveries in the U.S. real estate finance portfolio versus losses in the prior quarter. In Corporate and Other, the provision was comparable with the prior quarter.
Non-interest expenses were up $204 million or 9%, mainly due to restructuring charges primarily relating to employee severance, shown as an item of note.
Income tax expense was down $50 million or 29%, primarily due to lower income.
Quarterly trend analysis
Our quarterly results are modestly affected by seasonal factors. The second quarter has fewer days as compared with the other quarters, generally leading to lower earnings. The summer months (July – third quarter and August – fourth quarter) typically experience lower levels of market activity, which affects our brokerage, investment management, and Capital Markets activities.
Revenue
Retail and Business Banking revenue has benefited from volume growth across most retail products, largely offset by the impact of the sold Aeroplan portfolio in the first quarter of 2014, the continued low interest rate environment, and attrition in our exited FirstLine mortgage broker business. The first quarter of 2015 included the gain arising from accounting adjustments on credit card-related balance sheet amounts, and the first quarter of 2014 included the gain relating to the Aeroplan transactions with Aimia and TD.
Wealth Management revenue has benefited from the impact of the acquisition of Atlantic Trust on December 31, 2013, including annual performance fees earned in the first quarter of 2015, and has also experienced growth in AUM mainly driven by strong net flows.
Capital Markets revenue is influenced, to a large extent, by market conditions and growth in the equity derivatives business, which has generally resulted in higher tax-exempt income. Revenue has also been impacted by the volatility in the structured credit run-off business. The first quarter of 2015 included the gain on sale of an investment in our merchant banking portfolio. The fourth quarter of 2014 included the charge related to FVA, while the third quarter and the first quarter of 2014 included gains within an equity-accounted investment in our merchant banking portfolio and on the sale of an equity investment in our exited European leveraged finance portfolio, respectively.
Corporate and Other includes the offset related to the TEB component of tax-exempt income noted above. The first quarter of 2014 included the gain relating to the Aeroplan transactions noted above.
Provision for credit losses
Provision for credit losses is dependent upon the credit cycle in general and on the credit performance of the loan portfolios. In Retail and Business Banking, losses in the card portfolio have been generally trending lower due to credit improvements, as well as the impact of an initiative to enhance account management practices, and the sold Aeroplan portfolio. The fourth quarter of 2015 had higher losses in the oil and gas sector within the business banking portfolio. A charge resulting from operational changes in the processing of write-offs was included in the first quarter of 2014. In Capital Markets, the second quarter of 2014 included losses in the exited U.S. leveraged finance portfolio. In Corporate and Other, the second quarter of 2014 had elevated loan losses relating to CIBC FirstCaribbean. The first and third quarters of 2014 included a reduction in the collective allowance, including the partial reversal of the credit losses relating to the Alberta floods.
Non-interest expenses
Non-interest expenses have fluctuated over the period largely due to changes in employee-related compensation and benefits, as well as higher spending on strategic initiatives. The first and fourth quarters of 2015 included restructuring charges primarily relating to employee severance. The second quarter of 2014 had a goodwill impairment charge. All quarters in 2014 had expenses relating to the development of our enhanced travel rewards program and to the Aeroplan transactions with Aimia and TD.
Income taxes
Income taxes vary with changes in income subject to tax, and the jurisdictions in which the income is earned. Taxes can also be affected by the impact of significant items and the level of tax-exempt income, which has generally been trending higher for the periods presented in the table above. No tax recovery was booked in the second quarter of 2014 in respect of the CIBC FirstCaribbean goodwill impairment charge and loan losses.
| | |
| 10 | | CIBC2015 ANNUAL REPORT |
|
Management’s discussion and analysis |
Review of 2014 financial performance
| | | | | | | | | | | | | | | | | | | | | | |
| $ millions, for the year ended October 31 | | Retail and
Business
Banking (1) | | | Wealth
Management | | | Capital
Markets (2) | | | Corporate
and Other (2) | | | CIBC Total | |
2014 | | Net interest income | | $ | 5,634 | | | $ | 198 | | | $ | 1,561 | | | $ | 66 | | | $ | 7,459 | |
| | Non-interest income | | | 2,232 | | | | 2,408 | | | | 856 | | | | 408 | | | | 5,904 | |
| | | Intersegment revenue | | | 397 | | | | (404 | ) | | | 7 | | | | – | | | | – | |
| | Total revenue | | | 8,263 | | | | 2,202 | | | | 2,424 | | | | 474 | | | | 13,363 | |
| | Provision for credit losses | | | 731 | | | | – | | | | 43 | | | | 163 | | | | 937 | |
| | | Non-interest expenses | | | 4,225 | | | | 1,582 | | | | 1,219 | | | | 1,486 | | | | 8,512 | |
| | Income (loss) before income taxes | | | 3,307 | | | | 620 | | | | 1,162 | | | | (1,175 | ) | | | 3,914 | |
| | | Income taxes | | | 824 | | | | 149 | | | | 267 | | | | (541 | ) | | | 699 | |
| | | Net income (loss) | | $ | 2,483 | | | $ | 471 | | | $ | 895 | | | $ | (634 | ) | | $ | 3,215 | |
| | Net income (loss) attributable to: | | | | | | | | | | | | | | | | | | | | |
| | Non-controlling interests | | $ | – | | | $ | 2 | | | $ | – | | | $ | (5 | ) | | $ | (3 | ) |
| | | Equity shareholders | | | 2,483 | | | | 469 | | | | 895 | | | | (629 | ) | | | 3,218 | |
2013 | | Net interest income | | $ | 5,656 | | | $ | 186 | | | $ | 1,403 | | | $ | 208 | | | $ | 7,453 | |
| | Non-interest income | | | 2,142 | | | | 1,960 | | | | 832 | | | | 318 | | | | 5,252 | |
| | | Intersegment revenue | | | 338 | | | | (343 | ) | | | 5 | | | | – | | | | – | |
| | Total revenue | | | 8,136 | | | | 1,803 | | | | 2,240 | | | | 526 | | | | 12,705 | |
| | Provision for credit losses | | | 930 | | | | 1 | | | | 44 | | | | 146 | | | | 1,121 | |
| | | Non-interest expenses | | | 4,038 | | | | 1,301 | | | | 1,317 | | | | 952 | | | | 7,608 | |
| | Income (loss) before income taxes | | | 3,168 | | | | 501 | | | | 879 | | | | (572 | ) | | | 3,976 | |
| | | Income taxes | | | 791 | | | | 116 | | | | 180 | | | | (461 | ) | | | 626 | |
| | | Net income (loss) | | $ | 2,377 | | | $ | 385 | | | $ | 699 | | | $ | (111 | ) | | $ | 3,350 | |
| | Net income (loss) attributable to: | | | | | | | | | | | | | | | | | | | | |
| | Non-controlling interests | | $ | – | | | $ | – | | | $ | – | | | $ | (2 | ) | | $ | (2 | ) |
| | | Equity shareholders | | | 2,377 | | | | 385 | | | | 699 | | | | (109 | ) | | | 3,352 | |
| (1) | Certain information has been reclassified to conform to the presentation adopted in the current year. See “External reporting changes” for additional details. |
| (2) | Capital Markets revenue and income taxes are reported on a TEB basis with an equivalent offset in the revenue and income taxes of Corporate and Other. |
The following discussion provides a comparison of our results of operations for the years ended October 31, 2014 and 2013.
Overview
Net income for 2014 was $3,215 million, compared with $3,350 million in 2013. The decrease in net income of $135 million was due to highernon-interest expenses and income taxes, partially offset by higher revenue and a lower provision for credit losses.
Revenue by segment
Retail and Business Banking
Revenue was up $127 million or 2% from 2013, primarily due to volume growth across most products, higher fees, and the gain relating to the Aeroplan transactions, shown as an item of note. These factors were partially offset by lower cards revenue as a result of the Aeroplan transactions, and lower revenue from our exited FirstLine mortgage broker business.
Wealth Management
Revenue was up $399 million or 22% from 2013, primarily due to the acquisition of Atlantic Trust in 2014, higher AUA and AUM in retail brokerage, higher AUM in asset management driven by net sales of long-term mutual funds and market appreciation, and a higher contribution from our equity-accounted investment in American Century Investments (ACI).
Capital Markets
Revenue was up $184 million or 8% from 2013, primarily due to higher revenue from corporate banking, U.S. real estate finance and underwriting and advisory activity, and gains on the sale of an equity investment in our exited European leveraged finance portfolio, and within an equity-accounted investment in our merchant banking portfolio, shown as items of note. These factors were partially offset by a charge relating to the incorporation of FVA into the valuation of our uncollateralized derivatives.
Corporate and Other
Revenue was down $52 million or 10% from 2013, primarily due to lower treasury revenue and a higher TEB adjustment, partially offset by the gain relating to the Aeroplan transactions, noted above.
Consolidated CIBC
Net interest income
Net interest income was comparable with 2013 as volume growth across most retail products and higher revenue from corporate banking were offset by lower card revenue, as a result of the Aeroplan transactions noted above, and lower treasury revenue.
Non-interest income
Non-interest income was up $652 million or 12% from 2013, primarily due to higher AUM driven by net sales of long-term mutual funds and market appreciation, the acquisition of Atlantic Trust in 2014, and gains relating to the Aeroplan transactions, the sale of an equity investment in our exited European leveraged financial portfolio, and within an equity-accounted investment in our merchant banking portfolio, noted above. These factors were partially offset by the charge relating to FVA noted above.
| | | | |
| CIBC2015 ANNUAL REPORT | | | 11 | |
|
Management’s discussion and analysis |
Provision for credit losses
Provision for credit losses was down $184 million or 16% from 2013. In Retail and Business Banking, the provision was down mainly due to lowerwrite-offs and bankruptcies in the card portfolio which reflected credit improvements, as well as the impact of an initiative to enhance account management practices, and the sold Aeroplan portfolio. In addition, 2014 had lower losses in the business lending portfolio, and included a charge resulting from operational changes in the processing of write-offs, while 2013 included a charge resulting from a revision of estimated loss parameters on our unsecured lending portfolios, both shown as items of note. In Capital Markets, the provision was comparable with 2013. Losses were experienced in 2014 in our exited U.S. leveraged finance portfolio, while 2013 had losses in our exited European leveraged finance portfolio, both shown as items of note. In Corporate and Other, the provision was up primarily due to the loan losses in 2014 relating to CIBC FirstCaribbean, shown as an item of note, partially offset by a decrease in the collective allowance. In 2013, results included estimated credit losses related to the Alberta floods, shown as an item of note, a portion of which was estimated to not be required and therefore reversed in 2014.
Non-interest expenses
Non-interest expenses increased by $904 million or 12% from 2013, primarily due to the goodwill impairment charge relating to CIBC FirstCaribbean in 2014, shown as an item of note, higher employee compensation and benefits, and higher spending on strategic initiatives.
Income taxes
Income tax expense was $699 million, compared with $626 million in 2013. Income tax expense was higher, notwithstanding lower income in 2014, primarily due to no tax recovery being booked in 2014 in respect of the CIBC FirstCaribbean goodwill impairment charge and loan losses, partially offset by the impact of higher tax-exempt income.
Outlook for calendar year 2016
Global growth is expected to gradually strengthen in 2016, but still be roughly in line with the moderate pace achieved in the 2012 to 2014 period. Emerging markets are forecast to be sluggish but should still improve after a very weak year, responding to currency depreciations and lower interest rates. The U.S. and Europe should be fairly steady with growth in the 2% to 2.5% range, with Europe responding to monetary stimulus and the U.S. driven by continued healthy domestic demand. The U.S. Federal Reserve is likely to begin raising interest rates, but the federal funds rate could close the year near 1%, still very low by historical standards. Canada’s economic growth should accelerate to a roughly 2% pace, as it moves past the most severe declines in energy sector capital spending, and sees a lift to non-energy exports from the prior year’s decline in the Canadian dollar. Movement in both exchange rates and short-term interest rates are expected to be limited, with long yields moving up somewhat in response to higher U.S. Treasury yields.
Retail and Business Banking should see steady growth in consumer credit as interest rates stay low, alongside a moderation in mortgage growth linked to diminishing price gains in real estate. Business credit demand should remain healthy, helped by increased capital spending outside the energy sector. Credit quality should remain healthy, with little stress outside the energy-producing provinces.
A gradual firming in commodity prices on better global growth should be supportive for equity-related business in Capital Markets and Wealth Management, and Capital Markets should see continued strength in the issuance of government debt, in part to cover deficits in the energy-producing provinces.
| | |
| 12 | | CIBC2015 ANNUAL REPORT |
|
Management’s discussion and analysis |
Non-GAAP measures
We use a number of financial measures to assess the performance of our business lines as described below. Some measures are calculated in accordance with GAAP (IFRS), while other measures do not have a standardized meaning under GAAP, and accordingly, these measures may not be comparable to similar measures used by other companies. Investors may find these non-GAAP measures useful in analyzing financial performance.
Adjusted measures
Management assesses results on a reported and adjusted basis and considers both as useful measures of performance. Adjusted results remove items of note from reported results and are used to calculate our adjusted measures noted below. Items of note include the results of our structured credit run-off business, the amortization of intangibles, and certain items of significance that arise from time to time which management believes are not reflective of underlying business performance. We believe that adjusted measures provide the reader with a better understanding of how management assesses underlying business performance and facilitate a more informed analysis of trends. While we believe that adjusted measures may facilitate comparisons between our results and those of some of our Canadian peer banks which make similar adjustments in their public disclosure, it should be noted that there is no standardized meaning for adjusted measures under GAAP.
We also adjust our results to gross up tax-exempt revenue on certain securities to a TEB basis, being the amount of fully taxable revenue, which, were it to have incurred tax at the statutory income tax rate, would yield the same after-tax revenue.
Adjusted diluted EPS
We adjust our reported diluted EPS to remove the impact of items of note, net of income taxes, and any other item specified in the table on the following page to calculate the adjusted EPS.
Adjusted efficiency ratio
We adjust our reported revenue and non-interest expenses to remove the impact of items of note and gross up tax-exempt revenue to bring it to a TEB basis, as applicable.
Adjusted dividend payout ratio
We adjust our reported net income attributable to common shareholders to remove the impact of items of note, net of income taxes, to calculate the adjusted dividend payout ratio.
Adjusted return on common shareholders’ equity
We adjust our reported net income attributable to common shareholders to remove the impact of items of note, net of income taxes, to calculate the adjusted ROE.
Adjusted effective tax rate
We adjust our reported income before income taxes and reported income taxes to remove the impact of items of note to calculate the adjusted effective tax rate.
Economic capital
Economic capital provides a framework to evaluate the returns of each SBU, commensurate with risk assumed. The economic capital measure is based upon an estimate of equity capital required by the businesses to absorb unexpected losses consistent with our targeted risk rating over a one-year horizon. Economic capital comprises primarily credit, market, operational, and strategic risk capital. The difference between our total equity capital and economic capital is held in Corporate and Other.
There is no comparable GAAP measure for economic capital.
Economic profit
Net income attributable to equity shareholders, adjusted for a charge on economic capital, determines economic profit. This measures the return generated by each SBU in excess of our cost of capital, thus enabling users of our financial information to identify relative contributions to shareholder value.
Segmented return on equity
We use ROE on a segmented basis as one of the measures for performance evaluation and resource allocation decisions. While ROE for total CIBC provides a measure of return on common equity, ROE on a segmented basis provides a similar metric relating to the economic capital allocated to the segments. As a result, segmented ROE is a non-GAAP measure.
| | | | |
| CIBC2015 ANNUAL REPORT | | | 13 | |
|
Management’s discussion and analysis |
The following table provides a reconciliation of non-GAAP to GAAP measures related to CIBC on a consolidated basis.
| | | | | | | | | | | | | | | | | | | | | | | | |
| $ millions, for the year ended October 31 | | | | 2015 | | | 2014 | | | 2013 | | | 2012 | | | | | 2011 | |
Reported and adjusted diluted EPS | | | | | | | | | | | | | | | | | | | | | | | | |
Reported net income attributable to diluted common shareholders | | A | | $ | 3,531 | | | $ | 3,131 | | | $ | 3,253 | | | $ | 3,136 | | | | | $ | 2,728 | |
After-tax impact of items of note (1) | | | | | 232 | | | | 442 | | | | 219 | | | | 88 | | | | | | 316 | |
After-tax impact of items of note on non-controlling interests | | | | | (2 | ) | | | (10 | ) | | | – | | | | – | | | | | | – | |
Dividends on convertible preferred shares (2) | | | | | – | | | | – | | | | – | | | | – | | | | | | (38 | ) |
Adjusted net income attributable to diluted common shareholders (3) | | B | | $ | 3,761 | | | $ | 3,563 | | | $ | 3,472 | | | $ | 3,224 | | | | | $ | 3,006 | |
Reported diluted weighted-average common shares outstanding (thousands) | | C | | | 397,832 | | | | 398,420 | | | | 401,261 | | | | 404,145 | | | | | | 406,696 | |
Removal of impact of convertible preferred shares (thousands) (2) | | | | | – | | | | – | | | | – | | | | – | | | | | | (9,609 | ) |
Adjusted diluted weighted-average shares outstanding (thousands) (3) | | D | | | 397,832 | | | | 398,420 | | | | 401,261 | | | | 404,145 | | | | | | 397,087 | |
Reported diluted EPS ($) | | A/C | | $ | 8.87 | | | $ | 7.86 | | | $ | 8.11 | | | $ | 7.76 | | | | | $ | 6.71 | |
Adjusted diluted EPS ($) (3) | | B/D | | | 9.45 | | | | 8.94 | | | | 8.65 | | | | 7.98 | | | | | | 7.57 | |
Reported and adjusted efficiency ratio | | | | | | | | | | | | | | | | | | | | | | | | |
Reported total revenue (4) | | E | | $ | 13,856 | | | $ | 13,363 | | | $ | 12,705 | | | $ | 12,485 | | | | | $ | 12,435 | |
Pre-tax impact of items of note (1) | | | | | (40 | ) | | | (276 | ) | | | (30 | ) | | | (9 | ) | | | | | 21 | |
TEB | | | | | 482 | | | | 421 | | | | 357 | | | | 281 | | | | | | 189 | |
Adjusted total revenue (3) | | F | | $ | 14,298 | | | $ | 13,508 | | | $ | 13,032 | | | $ | 12,757 | | | | | $ | 12,645 | |
Reported non-interest expenses (4) | | G | | $ | 8,861 | | | $ | 8,512 | | | $ | 7,608 | | | $ | 7,202 | | | | | $ | 7,486 | |
Pre-tax impact of items of note (1) | | | | | (338 | ) | | | (539 | ) | | | (249 | ) | | | (63 | ) | | | | | (358 | ) |
Adjusted non-interest expenses (3) | | H | | $ | 8,523 | | | $ | 7,973 | | | $ | 7,359 | | | $ | 7,139 | | | | | $ | 7,128 | |
Reported efficiency ratio (4) | | G/E | | | 63.9 | % | | | 63.7 | % | | | 59.9 | % | | | 57.7 | % | | | | | 60.2 | % |
Adjusted efficiency ratio (3)(4) | | H/F | | | 59.6 | % | | | 59.0 | % | | | 56.5 | % | | | 56.0 | % | | | | | 56.4 | % |
Reported and adjusted dividend payout ratio | | | | | | | | | | | | | | | | | | | | | | | | |
Reported net income attributable to common shareholders | | I | | $ | 3,531 | | | $ | 3,131 | | | $ | 3,253 | | | $ | 3,136 | | | | | $ | 2,690 | |
After-tax impact of items of note (1) | | | | | 232 | | | | 442 | | | | 219 | | | | 88 | | | | | | 316 | |
After-tax impact of items of note on non-controlling interests | | | | | (2 | ) | | | (10 | ) | | | – | | | | – | | | | | | – | |
Adjusted net income attributable to common shareholders (3) | | J | | $ | 3,761 | | | $ | 3,563 | | | $ | 3,472 | | | $ | 3,224 | | | | | $ | 3,006 | |
Dividends paid to common shares | | K | | $ | 1,708 | | | $ | 1,567 | | | $ | 1,523 | | | $ | 1,470 | | | | | $ | 1,391 | |
Reported dividend payout ratio | | K/I | | | 48.4 | % | | | 50.0 | % | | | 46.8 | % | | | 46.9 | % | | | | | 51.7 | % |
Adjusted dividend payout ratio (3) | | K/J | | | 45.4 | % | | | 44.0 | % | | | 43.9 | % | | | 45.6 | % | | | | | 46.3 | % |
Reported and adjusted return on common shareholders’ equity | | | | | | | | | | | | | | | | | | | | | | | | |
Average common shareholders’ equity | | L | | | $ 18,857 | | | $ | 17,067 | | | $ | 15,167 | | | $ | 14,116 | | | | | $ | 12,145 | |
Reported return on common shareholders’ equity | | I/L | | | 18.7 | % | | | 18.3 | % | | | 21.4 | % | | | 22.2 | % | | | | | 22.2 | % |
Adjusted return on common shareholders’ equity (3) | | J/L | | | 19.9 | % | | | 20.9 | % | | | 22.9 | % | | | 22.8 | % | | | | | 24.8 | % |
Reported and adjusted effective tax rate | | | | | | | | | | | | | | | | | | | | | | | | |
Reported income before income taxes | | M | | $ | 4,224 | | | $ | 3,914 | | | $ | 3,976 | | | $ | 3,992 | | | | | $ | 3,805 | |
Pre-tax impact of items of note (1) | | | | | 298 | | | | 408 | | | | 298 | | | | 107 | | | | | | 328 | |
Adjusted income before income taxes (3) | | N | | $ | 4,522 | | | $ | 4,322 | | | $ | 4,274 | | | $ | 4,099 | | | | | $ | 4,133 | |
Reported income taxes | | O | | $ | 634 | | | $ | 699 | | | $ | 626 | | | $ | 689 | | | | | $ | 927 | |
Tax impact of items of note (1) | | | | | 66 | | | | (34 | ) | | | 79 | | | | 49 | | | | | | 24 | |
Adjusted income taxes (3) | | P | | $ | 700 | | | $ | 665 | | | $ | 705 | | | $ | 738 | | | | | $ | 951 | |
Reported effective tax rate | | O/M | | | 15.0 | % | | | 17.9 | % | | | 15.8 | % | | | 17.3 | % | | | | | 24.4 | % |
Adjusted effective tax rate (3) | | P/N | | | 15.5 | % | | | 15.4 | % | | | 16.5 | % | | | 18.0 | % | | | | | 23.0 | % |
| | | | | | | |
| $ millions, for the year ended October 31 | | | | Retail and Business Banking | | | Wealth Management | | | Capital Markets | | | Corporate and Other | | | | | CIBC Total | |
2015 Reported net income (loss) | | | | $ | 2,524 | | | $ | 520 | | | $ | 1,004 | | | $ | (458 | ) | | | | $ | 3,590 | |
After-tax impact of items of note (1) | | | | | (28 | ) | | | 18 | | | | 8 | | | | 234 | | | | | | 232 | |
Adjusted net income (loss)(3) | | | | $ | 2,496 | | | $ | 538 | | | $ | 1,012 | | | $ | (224 | ) | | | | $ | 3,822 | |
2014 Reported net income (loss) | | | | $ | 2,483 | | | $ | 471 | | | $ | 895 | | | $ | (634 | ) | | | | $ | 3,215 | |
After-tax impact of items of note (1) | | | | | (64 | ) | | | 15 | | | | 18 | | | | 473 | | | | | | 442 | |
Adjusted net income (loss) (3) | | | | $ | 2,419 | | | $ | 486 | | | $ | 913 | | | $ | (161 | ) | | | | $ | 3,657 | |
2013 Reported net income (loss) | | | | $ | 2,377 | | | $ | 385 | | | $ | 699 | | | $ | (111 | ) | | | | $ | 3,350 | |
After-tax impact of items of note (1) | | | | | 38 | | | | 4 | | | | 118 | | | | 59 | | | | | | 219 | |
Adjusted net income (loss) (3) | | | | $ | 2,415 | | | $ | 389 | | | $ | 817 | | | $ | (52 | ) | | | | $ | 3,569 | |
2012 Reported net income | | | | $ | 2,156 | | | $ | 335 | | | $ | 589 | | | $ | 223 | | | | | $ | 3,303 | |
After-tax impact of items of note (1) | | | | | 8 | | | | (34 | ) | | | 67 | | | | 17 | | | | | | 58 | |
Adjusted net income (3) | | | | $ | 2,164 | | | $ | 301 | | | $ | 656 | | | $ | 240 | | | | | $ | 3,361 | |
2011 Reported net income (loss) | | | | $ | 2,184 | | | $ | 279 | | | $ | 543 | | | $ | (128 | ) | | | | $ | 2,878 | |
After-tax impact of items of note (1) | | | | | 9 | | | | 1 | | | | 100 | | | | 194 | | | | | | 304 | |
Adjusted net income (3) | | | | $ | 2,193 | | | $ | 280 | | | $ | 643 | | | $ | 66 | | | | | $ | 3,182 | |
| (1) | Reflects impact of items of note under “2015 Financial results” section and below. |
| (2) | We irrevocably renounced by way of a deed poll, our right to convert the series 26, 27, and 29 non-cumulative Class A Preferred Shares (the Convertible Preferred Shares) into CIBC common shares, except in circumstances that would be a “Trigger Event” as described in the August 2011 Non-Viability Contingent Capital (NVCC) advisory issued by OSFI. By renouncing our conversion rights, the Convertible Preferred Shares are no longer dilutive subsequent to August 16, 2011, the date the conversion rights were renounced by CIBC. The impact of dilution prior to August 17, 2011 has been removed for the purposes of calculation of the adjusted diluted EPS. |
| (4) | Certain prior period information has been reclassified to conform to the presentation adopted in the current year. See “External reporting changes” for additional details. |
| | |
| 14 | | CIBC2015 ANNUAL REPORT |
|
Management’s discussion and analysis |
Impact of items of note in prior years
2013
Net income was affected by the following items of note:
| • | | $114 million ($84 million after-tax) loss from the structured credit run-off business, including the charge in respect of a settlement of the U.S. Bankruptcy Court adversary proceeding brought by the Estate of Lehman Brothers Holdings, Inc. (Capital Markets); |
| • | | $39 million ($37 million after-tax) restructuring charge relating to CIBC FirstCaribbean (Corporate and Other); |
| • | | $38 million ($28 million after-tax) increase in the portion of the collective allowance recognized in Corporate and Other(1), including $56 million of estimated credit losses relating to the Alberta floods; |
| • | | $35 million ($19 million after-tax) impairment of an equity position associated with our exited U.S. leveraged finance portfolio (Capital Markets); |
| • | | $24 million ($18 million after-tax) costs relating to the development of our enhanced travel rewards program and to the Aeroplan transactions with Aimia and TD (Retail and Business Banking); |
| • | | $23 million ($19 million after-tax) amortization of intangible assets(2) ($5 million after-tax in Retail and Business Banking, $4 million after-tax in Wealth Management, and $10 million after-tax in Corporate and Other); |
| • | | $21 million ($15 million after-tax) loan losses in our exited European leveraged finance portfolio (Capital Markets); |
| • | | $20 million ($15 million after-tax) charge resulting from a revision of estimated loss parameters on our unsecured lending portfolios (Retail and Business Banking); and |
| • | | $16 million ($16 million after-tax) gain, net of associated expenses, on the sale of our Hong Kong and Singapore-based private wealth management business (Corporate and Other). |
The above items of note increased revenue by $30 million, provision for credit losses by $79 million and non-interest expenses by $249 million, and decreased income tax expense by $79 million. In aggregate, these items of note decreased net income by $219 million.
2012
Net income was affected by the following items of note:
| • | | $57 million ($32 million after-tax) loan losses in our exited U.S. leveraged finance portfolio (Capital Markets); |
| • | | $37 million ($35 million after-tax) gain relating to an equity-accounted investment (Wealth Management); |
| • | | $33 million ($24 million after-tax) loss relating to the change in valuation of collateralized derivatives to an overnight index swap (OIS) basis ($23 million after-tax in Capital Markets and $1 million after-tax in Corporate and Other); |
| • | | $30 million ($25 million after-tax) amortization of intangible assets ($8 million after-tax in Retail and Business Banking, $1 million after-tax in Wealth Management and $16 million after-tax in Corporate and Other); |
| • | | $28 million ($16 million after-tax) hedge accounting loss on leveraged leases (Capital Markets); |
| • | | $24 million ($19 million after-tax) gain on sale of interests in entities in relation to the acquisition of TMX Group Inc. by Maple Group Acquisition Corporation, net of associated expenses (Capital Markets); and |
| • | | $20 million ($15 million after-tax) loss from the structured credit run-off business (Capital Markets). |
The above items of note increased revenue by $9 million, provision for credit losses by $53 million and non-interest expenses by $63 million, and decreased income tax expense by $49 million. In aggregate, these items of note decreased net income by $58 million.
In addition, net income attributable to common shareholders was also affected by the following item of note:
| • | | $30 million premium paid on preferred share redemptions. |
2011
Net income was affected by the following items of note:
| • | | $203 million goodwill impairment charge relating to CIBC FirstCaribbean (Corporate and Other); |
| • | | $178 million ($128 million after-tax) loss from the structured credit run-off business (Capital Markets); |
| • | | $90 million ($65 million after-tax) loss from mark-to-market (MTM) volatility prior to the establishment of accounting hedges on securitized mortgages and funding liabilities (Corporate and Other); |
| • | | $90 million ($46 million after-tax) gain on sale of a merchant banking investment, net of associated expenses (Capital Markets); |
| • | | $76 million ($55 million after-tax) reduction in the collective allowance (Corporate and Other); |
| • | | $37 million after-tax gain on the sale of CIBC Mellon Trust Company’s Issuer Services business (Corporate and Other); |
| • | | $35 million ($28 million after-tax) amortization of intangible assets ($9 million after-tax in Retail and Business Banking, $1 million after-tax in Wealth Management and $18 million after-tax in Corporate and Other); and |
| • | | $25 million ($18 million after-tax) loan loss in our exited European leveraged finance business (Capital Markets). |
The above items of note decreased revenue by $21 million, provision for credit losses by $51 million, increased non-interest expenses by $358 million, and decreased income tax expense by $24 million. In aggregate, these items of note decreased net income by $304 million.
In addition, net income attributable to common shareholders was also affected by the following item of note:
| • | | $12 million premium paid on preferred share redemptions. |
| (1) | Relates to collective allowance, except for (i) residential mortgages greater than 90 days delinquent; (ii) personal loans and scored small business loans greater than 30 days delinquent; and (iii) net write-offs for the cards portfolio, which are all reported in the respective SBUs. |
| (2) | Beginning in the fourth quarter of 2013, also includes amortization of intangible assets for equity-accounted associates. |
| | | | |
| CIBC2015 ANNUAL REPORT | | | 15 | |
|
Management’s discussion and analysis |
Strategic business units overview
CIBC has three SBUs – Retail and Business Banking, Wealth Management and Capital Markets. These SBUs are supported by the following functional groups – Technology and Operations, Finance (including Treasury), Administration, Risk Management, and Internal Audit, as well as other support groups, which all form part of Corporate and Other. The expenses of these functional and support groups are generally allocated to the business lines within the SBUs. Corporate and Other also includes our International banking operations comprising mainly CIBC FirstCaribbean, strategic investments in the CIBC Mellon joint ventures, and other income statement and balance sheet items not directly attributable to the business lines. CIBC’s investment in The Bank of N.T. Butterfield & Son Limited was included in Corporate and Other results until it was sold on April 30, 2015.
In November 2015, the name of the Wholesale Banking SBU was changed to Capital Markets. This SBU comprises global markets, corporate and investment banking, and other.
Business unit allocations
Treasury activities impact the reported financial results of the SBUs. Each line of business within our SBUs is charged or credited with a market-based cost of funds on assets and liabilities, respectively, which impacts the revenue performance of the SBUs. Once the interest and liquidity risk inherent in our client-driven assets and liabilities is transfer priced into Treasury, it is managed within CIBC’s risk framework and limits. The residual financial results associated with Treasury activities are reported in Corporate and Other. Capital is attributed to the SBUs in a manner that is intended to consistently measure and align economic costs with the underlying benefits and risks associated with SBU activities. Earnings on unattributed capital remain in Corporate and Other. We review our transfer pricing methodologies on an ongoing basis to ensure they reflect changing market environments and industry practices.
To measure and report the results of operations of the lines of business within our Retail and Business Banking and Wealth Management SBUs, we use a Manufacturer/Customer Segment/Distributor Management Model. The model uses certain estimates and allocation methodologies in the preparation of segmented financial information. Under this model, internal payments for sales, renewals, trailer commissions and the recovery of distribution service costs are made among the lines of business and SBUs. Periodically, the sales, renewals and trailer commission rates paid to customer segments for certain products/services are revised and applied prospectively.
Non-interest expenses are attributed to the SBUs to which they relate based on appropriate criteria. Revenue, expenses, and other balance sheet resources related to certain activities are fully allocated to the lines of business within the SBUs.
The individual allowances and related provisions are reported in the respective SBUs. The collective allowances and related provisions are reported in Corporate and Other except for: (i) residential mortgages greater than 90 days delinquent; (ii) personal loans and scored small business loans greater than 30 days delinquent; and (iii) net write-offs for the card portfolio, which are all reported in the respective SBUs. All allowances and related provisions for CIBC FirstCaribbean are reported in Corporate and Other.
Revenue, taxable equivalent basis
The SBUs evaluate revenue on a TEB basis. In order to arrive at the TEB amount, the SBUs gross up tax-exempt revenue on certain securities to a TEB basis, being the amount of fully taxable revenue, which, were it to have incurred tax at the statutory income tax rate, would yield the same after-tax revenue. Simultaneously, an equivalent amount is booked as an income tax expense resulting in no impact on the net income of the SBUs. This measure enables comparability of revenue arising from both taxable and tax-exempt sources. The total TEB adjustments of the SBUs are offset in revenue and income tax expense in Corporate and Other.
| | |
| 16 | | CIBC2015 ANNUAL REPORT |
|
Management’s discussion and analysis |
Retail and Business Banking
Retail and Business Banking provides personal and business clients across Canada with financial advice, products and services through a strong team of advisors and relationship managers, in our banking centres or through remote channels such as mobile advisors, telephone, online or mobile banking.
Our business strategy
We are focused on being the number one Retail and Business Bank in Canada in client experience and profitable revenue growth. To deliver on our objectives, we are making banking easy, personalized, and flexible, which will support us in deepening client relationships, and acquiring and retaining clients.
2015 progress
We made good progress in 2015 against our strategy.
| | |
| Accelerating profitable revenue growth | | Enhancing the client experience |
• Introduced a new co-branded rewards Visa card with TELUS, strengthening our credit card portfolio and providing more options for our clients. The card is available through CIBC, and in over 500 TELUS retail locations across Canada, with on-the-spot adjudication allowing TELUS customers to be approved in-store. • Introduced the new role of Banking Centre Leader, giving each of our over 1,000 banking centres across Canada a single leader responsible for building and deepening client relationships and strengthening ties in the community. • Began the transformation of our banking centres by leveraging digital technology to help clients complete day-to-day banking transactions through tablets and mobile devices in banking centres, while enhancing our focus on advice and relationships in our in-person interactions. • Expanded our client facing roles in Business Banking, adding more relationship managers to meet with clients and offer advice to help them meet their banking and financing needs. • Expanded our Imperial Service Direct offer, which connects clients with a dedicated financial advisor by phone. The offer enables CIBC to deliver financial advice and deepen relationships with clients who visit our banking centres infrequently, and prefer a remote offer to meet their needs. • Delivered on our stated objective of retaining 25% of the FirstLine mortgage portfolio, two years sooner than originally planned. This means thousands of clients who held a mortgage only with FirstLine have now moved to our CIBC brand where we can deepen our relationship with them going forward. • Continued our focus on meeting the full relationship needs of our business clients through the launch of eDeposit for Cash, an innovative service that allows business owners to deposit cash to their CIBC business account while it is still on their premises. | | • CIBC was the first among the Big 5 Canadian banks to make a mobile banking app available for the Apple Watch, giving Canadians a new way to bank and furthering CIBC’s innovation leadership for our clients. • Our bank earned continued external recognition for leadership in digital channels, earning the highest score among the Big 5 in the Forrester Research Inc. Mobile Banking Functionality Benchmark report, tied with one other bank. CIBC also earned the highest score in Forrester’s Benchmark report on Online Banking functionality among the Big 5. • Announced a partnership with MaRS Discovery District to create a new corporate innovation hub and join MaRS’ new FinTech cluster, continuing our focus on developing the next wave of banking innovations for our clients. • Became the first major Canadian bank to participate in suretap, enabling our clients to pay with their smartphone by adding any of our credit cards to the new suretap open mobile wallet. This is another step forward in providing our clients with innovative, flexible banking options. • Our retail advisors ranked us #1 inInvestment Executive magazine’s annual Report Card on Banks and Credit Unions in Canada. These results show that our retail advisory team sees the progress we are making in building a strong, innovative, relationship-oriented bank. • Announced our strategic partnership on the Union Pearson Express, the new express rail service between Union Station and Pearson Airport. This allows us to enhance the client experience, and CIBC’s profile, at Canada’s two busiest transportation hubs. • Enhanced CIBC Online Banking with new functionality, including online financial planning tools which allow clients to stay connected to their financial goals. |
Our focus for 2016
We will deliver on our objective to be the best retail and business bank in Canada by maintaining a strong focus on our clients, building on our leadership in innovation, and simplifying our bank to make it easier for clients to do business with us.
Clients want their bank to know them, and understand their needs. We will continue to deepen client relationships, including providing differentiated service to clients based on their relationship with CIBC and their banking preferences.
CIBC leads the market in delivering innovations to our clients in how they make payments and conduct their banking. Our focus is on continued innovation through digital channels that will deliver banking that meets the evolving personal and business needs of Canadians.
| | | | |
| CIBC2015 ANNUAL REPORT | | | 17 | |
|
Management’s discussion and analysis |
2015 financial review
| | | | | | | | |
Revenue(1) ($ billions) | | Net income ($ billions) | | Average loans and acceptances ($ billions) | | Average deposits ($ billions) | | Efficiency ratio(1) (%) |
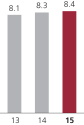 | | 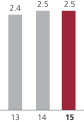 | | 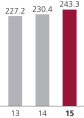 | | 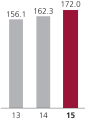 | | 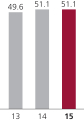 |
| | | | |
Personal banking • Total average loans and acceptances and average deposit growth of 8% (excluding FirstLine mortgages) • Leading mortgage market share growth • Increased the number of Mobile Sales Advisors by 30% in the year • Close to 50% of our clients now engaged with CIBC digitally, and growing • Product use count of new clients 12 months after joining up 40% since 2012 • Number of new sales originations through COMPASS surpassed 1 million | | Average loans and acceptances(2) ($ billions) 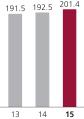
| | Average deposits ($ billions) 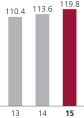
|
| | |
Business banking • Total average loans and acceptances and average deposit growth of 9% • Leading market share growth in both business deposits and business loans (excluding commercial mortgages) • Successful growth of the Business Investment Growth Account (BIGA) launched October 2014 | | Average loans and acceptances ($ billions) 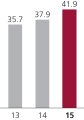
| | Average deposits ($ billions) 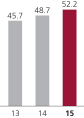
|
| (1) | Certain prior period information has been reclassified to conform to the presentation adopted in the current year. See “External reporting changes” for additional details. |
| (2) | Total average loans and acceptances includes FirstLine mortgages. |
| | |
| 18 | | CIBC2015 ANNUAL REPORT |
|
Management’s discussion and analysis |
Results(1)
| | | | | | | | | | | | |
| $ millions, for the year ended October 31 | | 2015 | | | 2014 (2) | | | 2013 (2) | |
Revenue | | | | | | | | | | | | |
Personal banking | | $ | 6,722 | | | $ | 6,349 | | | $ | 6,021 | |
Business banking | | | 1,627 | | | | 1,530 | | | | 1,529 | |
Other | | | 91 | | | | 384 | | | | 586 | |
Total revenue | | | 8,440 | | | | 8,263 | | | | 8,136 | |
Provision for credit losses | | | 707 | | | | 731 | | | | 930 | |
Non-interest expenses | | | 4,312 | | | | 4,225 | | | | 4,038 | |
Income before income taxes | | | 3,421 | | | | 3,307 | | | | 3,168 | |
Income taxes | | | 897 | | | | 824 | | | | 791 | |
Net income | | $ | 2,524 | | | $ | 2,483 | | | $ | 2,377 | |
Net income attributable to: | | | | | | | | | | | | |
Equity shareholders (a) | | $ | 2,524 | | | $ | 2,483 | | | $ | 2,377 | |
Efficiency ratio | | | 51.1 | % | | | 51.1 | % | | | 49.6 | % |
Return on equity (3) | | | 56.1 | % | | | 64.1 | % | | | 62.5 | % |
Charge for economic capital (3) (b) | | $ | (541 | ) | | $ | (479 | ) | | $ | (478 | ) |
Economic profit (3) (a+b) | | $ | 1,983 | | | $ | 2,004 | | | $ | 1,899 | |
Average assets ($ billions) | | $ | 242.9 | | | $ | 229.9 | | | $ | 226.9 | |
Average loans and acceptances ($ billions) | | $ | 243.3 | | | $ | 230.4 | | | $ | 227.2 | |
Average deposits ($ billions) | | $ | 172.0 | | | $ | 162.3 | | | $ | 156.1 | |
Full-time equivalent employees | | | 21,532 | | | | 21,864 | | | | 21,781 | |
| (1) | For additional segmented information, see Note 28 to the consolidated financial statements. |
| (2) | Certain prior period information has been reclassified to conform to the presentation adopted in the current year. See “External reporting changes” for additional details. |
| (3) | For additional information, see the “Non-GAAP measures” section. |
Financial overview
Net income was up $41 million or 2% from 2014, primarily due to higher revenue and a lower provision for credit losses, partially offset by higher non-interest expenses and income taxes.
Revenue
Revenue was up $177 million or 2% from 2014.
Personal banking revenue was up $373 million or 6%, primarily due to volume growth, higher fees, and a gain arising from accounting adjustments on credit card-related balance sheet amounts, shown as an item of note.
Business banking revenue was up $97 million or 6%, primarily due to volume growth and higher fees, partially offset by narrower spreads.
Other was down $293 million or 76%, as the prior year included the gain relating to the Aeroplan transactions with Aimia and TD, shown as an item of note. The current year included lower cards revenue as a result of the Aeroplan transactions, as well as lower revenue from our exited FirstLine mortgage broker business.
Provision for credit losses
Provision for credit losses was down $24 million or 3% from 2014, as the prior year included a charge resulting from operational changes in the processing of write-offs, shown as an item of note. Lower loan losses in the card portfolio in the current year reflect credit improvements, as well as the impact of an initiative to enhance account management practices, and the sold Aeroplan portfolio. This was partially offset by higher losses in the oil and gas sector within the business lending portfolio.
Non-interest expenses
Non-interest expenses were up $87 million or 2% from 2014, primarily due to higher spending on strategic initiatives. The prior year included costs relating to the development of our enhanced travel rewards program and to the Aeroplan transactions, shown as an item of note.
Income taxes
Income taxes were up $73 million or 9% from 2014, primarily due to higher income, the impact of changes in the proportion of income subject to varying rates of income tax, and a lower income tax rate applicable to the gain related to the Aeroplan transactions in the prior year.
Average assets
Average assets were up $13.0 billion or 6% from 2014 due to growth in CIBC-brand mortgages, partially offset by attrition in the exited FirstLine mortgage broker business. Excluding exited FirstLine mortgages and the sold Aeroplan portfolio, average assets grew by 11%.
Voluntary agreement on the reduction of credit card interchange fees
In recent years, the Canadian federal government has held discussions with various stakeholders on the fees paid by merchants to accept credit card payments from their clients, including fees set by payment networks known as interchange fees.
On November 4, 2014, an agreement was announced between the Canadian federal government, VISA and MasterCard for the voluntary reduction of interchange fee rates to an average effective rate of 1.50% for the next five years.
The agreement went into effect in April 2015, and the impact is included in the personal banking financial results.
| | | | |
| CIBC2015 ANNUAL REPORT | | | 19 | |
|
Management’s discussion and analysis |
Wealth Management
Wealth Management provides integrated advice and investment solutions to meet the needs of institutional, retail, and high net worth clients. Our asset management, retail brokerage and private wealth management businesses combine to create an integrated offer, delivered through more than 1,500 advisors across Canada and the U.S.
Our business strategy
Our growth strategy is supported by three strategic priorities:
| 1. | Enhance the client experience and strengthen relationships |
| 3. | Pursue strategic growth opportunities |
2015 progress
We made good progress in 2015 against our strategy.
| | | | |
| Enhance the client experience and strengthen relationships | | Attract new clients | | Pursue strategic growth opportunities |
• We launched new planning capabilities which will help us deliver comprehensive and individually tailored financial plans to our clients. • InCIBC Wood Gundy, we continued to invest in our strong technology platform to significantly streamline the new client onboarding and account opening process. • We launched new client segmentation initiatives including Financial Fluency seminars for young clients and a program for female clients called CIRCLE. • CIBC Investor’s Edgewas recognized in theMoneySense Best Discount Brokerages Review as first in the Fees and Commissions category for its $6.95 flat-fee trading. | | • We had a strong year with $15 billion in net flows driven by all of our Wealth Management businesses. • Our Canadian asset management business achieved its 6th consecutive record for long-term mutual funds net sales of $5.5 billion. • Strong partnership with Retail and Business Banking helped drive CIBC Investor’s Edge new account openings up 36% versus last year. | | • We completed our integration ofAtlantic
Trust, a U.S. private wealth management
firm as part of our strategic plan to grow our
North American business. • To complement our organic growth
momentum, we seek acquisitions and
investments that align to our risk profile. |
Our focus for 2016
Our strategic priorities for 2016 continue to focus on deepening relationships with our clients and elevating business momentum by:
| • | | Enhancing the client experience |
| • | | Optimizing our business platform |
2015 financial review
| | | | | | |
Revenue ($ billions) | | Net income ($ millions) | | Assets under administration
and management(1)(2) ($ billions) | | Mutual funds ($ billions) |
| | | |
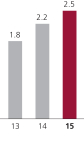 | | 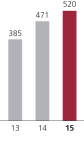 | | 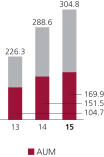 | | 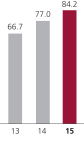 |
| (1) | Certain prior period information has been restated/reclassified to conform to the presentation adopted in the current year. See “External reporting changes” for additional details. |
| (2) | AUM amounts are included in the amounts reported under AUA. |
| | |
| 20 | | CIBC2015 ANNUAL REPORT |
|
Management’s discussion and analysis |
| | |
Retail brokerage • 17% growth in AUM; AUA up slightly
• Both CIBC Wood Gundy, our full service brokerage, and CIBC Investor’s Edge, our discount
brokerage, made solid progress in the 2015 J.D. Power Canadian Investor Satisfaction Surveys
• CIBC Investor’s Edge was recognized in the MoneySense Best Discount Brokerages Review as
first in the Fees and Commissions category | | Assets under administration and
management(1)(2) ($ billions) 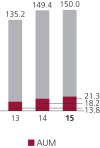
|
| |
Asset management • 8% growth in AUM • Record net sales of long-term mutual funds of $5.5 billion • Several ongoing improvements to product offer were implemented in the year to deliver superior results for our clients | | Assets under administration and management(1)(2) ($ billions) 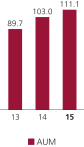
|
| |
Private wealth management • 21% growth in AUA • New initiatives to help clients build, protect, and transfer family wealth, with a focus on women and multi-generational families • Completed our integration of Atlantic Trust, a U.S. private wealth management firm, as part of our strategic plan to grow our North American business | | Assets under administration and management(2) ($ billions) 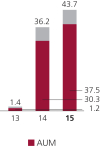
|
| (1) | Certain prior period information has been restated/reclassified to conform to the presentation adopted in the current year. See “External reporting changes” for additional details. |
| (2) | AUM amounts are included in the amounts reported under AUA. |
| | | | |
| CIBC2015 ANNUAL REPORT | | | 21 | |
|
Management’s discussion and analysis |
Results(1)
| | | | | | | | | | | | |
| $ millions, for the year ended October 31 | | 2015 | | | 2014 | | | 2013 | |
Revenue | | | | | | | | | | | | |
Retail brokerage | | $ | 1,230 | | | $ | 1,185 | | | $ | 1,060 | |
Asset management | | | 862 | | | | 742 | | | | 621 | |
Private wealth management | | | 379 | | | | 275 | | | | 122 | |
Total revenue | | | 2,471 | | | | 2,202 | | | | 1,803 | |
Provision for (reversal of) credit losses | | | (1 | ) | | | – | | | | 1 | |
Non-interest expenses | | | 1,784 | | | | 1,582 | | | | 1,301 | |
Income before income taxes | | | 688 | | | | 620 | | | | 501 | |
Income taxes | | | 168 | | | | 149 | | | | 116 | |
Net income | | $ | 520 | | | $ | 471 | | | $ | 385 | |
Net income attributable to: | | | | | | | | | | | | |
Non-controlling interests | | $ | – | | | $ | 2 | | | $ | – | |
Equity shareholders (a) | | | 520 | | | | 469 | | | | 385 | |
Efficiency ratio | | | 72.2 | % | | | 71.8 | % | | | 72.2 | % |
Return on equity (2) | | | 22.5 | % | | | 22.4 | % | | | 20.4 | % |
Charge for economic capital (2) (b) | | $ | (276 | ) | | $ | (255 | ) | | $ | (231 | ) |
Economic profit (2) (a+b) | | $ | 244 | | | $ | 214 | | | $ | 154 | |
Average assets ($ billions) | | $ | 4.8 | | | $ | 4.4 | | | $ | 4.0 | |
Average loans ($ billions) | | $ | 2.1 | | | $ | 1.9 | | | $ | 1.8 | |
Average deposits ($ billions) | | $ | 9.0 | | | $ | 8.5 | | | $ | 8.1 | |
AUA ($ billions) (3) | | $ | 304.8 | | | $ | 288.6 | | | $ | 226.3 | |
AUM ($ billions) (3) | | $ | 169.9 | | | $ | 151.5 | | | $ | 104.7 | |
Full-time equivalent employees | | | 4,350 | | | | 4,169 | | | | 3,840 | |
| (1) | For additional segmented information, see Note 28 to the consolidated financial statements. |
| (2) | For additional information, see the “Non-GAAP measures” section. |
| (3) | Certain prior period information has been restated/reclassified to conform to the presentation adopted in the current year. See “External reporting changes” for additional details. |
Financial overview
Net income was up $49 million or 10% from 2014, primarily due to higher revenue, partially offset by higher non-interest expenses.
Revenue
Revenue was up $269 million or 12% from 2014.
Retail brokeragerevenue was up $45 million or 4%, primarily due to higher investment management and custodial fees driven by higher AUM and AUA, partially offset by lower commission revenue.
Asset managementrevenue was up $120 million or 16%, primarily due to higher AUM, driven largely by record net sales of long-term mutual funds and market appreciation, and a higher contribution from our equity-accounted investment in ACI.
Private wealth management revenue was up $104 million or 38%, primarily due to higher AUM, the inclusion of a full year of Atlantic Trust results in the current year versus ten months in the prior year, and annual performance fees earned in Atlantic Trust.
Non-interest expenses
Non-interest expenses were up $202 million or 13% from 2014, primarily due to higher performance-based compensation and other employee-related costs, and the inclusion of a full year of Atlantic Trust results in the current year.
Income taxes
Income taxes were up $19 million or 13% from 2014, primarily due to higher income.
Assets under administration
AUA were up $16.2 billion or 6% from 2014, mainly due to strong net flows. AUM amounts are included in the amounts reported under AUA.
| | |
| 22 | | CIBC2015 ANNUAL REPORT |
|
Management’s discussion and analysis |
Capital Markets
Capital Markets provides integrated credit and global markets products, investment banking advisory services and top-ranked research to corporate, government and institutional clients around the world. In November 2015, the name of this SBU was changed to Capital Markets from Wholesale Banking. This SBU comprises global markets, corporate and investment banking, and other.
Our business strategy
Our goal is to be the leading Capital Markets franchise in Canada with global capabilities aligned to the needs of our clients. We are focused on developing deep client relationships and earning our clients’ trust through unparalleled execution and innovation, and strong collaboration across CIBC.
2015 progress
We made good progress in 2015 against our strategy.
| | | | |
| Deepening client relationships and strengthening our platform in Canada | | Targeted international growth aligned to core sectors and clients | | Continuing to collaborate and innovate to deliver solutions for clients across CIBC |
• We held leadership positions in syndicated loans, debt and equity underwriting, M&A advisory, equity trading, commodities and foreign exchange. • We continued to add value and strengthen service through enhanced client coverage and the delivery of strategic solutions and award winning research. • We had record attendance at our annual Whistler conference where more than 100 leading companies discussed their business and growth strategies with institutional investors. | | • We helped clients grow globally through expanded lending and advisory mandates, particularly in the areas of energy, utilities and infrastructure finance. • We continued to expand our suite of capital markets products to support our client’s businesses, particularly in the areas of foreign exchange, fixed income, commodities and equity derivatives in key regions globally. • We continued to invest in our U.S. platform with a focus on energy and infrastructure. | | • IntroducedCIBC Global Money Transfer, an innovative no-fee service allowing retail clients to send money overseas easily and affordably, online or in branch. • IntroducedCIBC Foreign Cash Online allowing retail clients to order foreign currencies online for delivery to their home, branch or the airport. • We continued to enhance our leading e-business capabilities to meet client trading needs across asset classes. |
Our focus for 2016
To achieve our goals, we are focused on three strategic priorities in 2016:
| • | | Strengthen and expand leadership positions in Canada |
| • | | Build a North American platform and expand coverage in key sectors globally |
| • | | Deliver innovation to clients across CIBC |
2015 financial review
| | | | | | |
Revenue ($ billions) | | Net income ($ millions) | | Economic capital(1) ($ billions) | | Average value-at-risk (VaR) ($ millions) |
| | | |
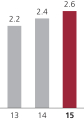 | | 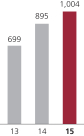 | | 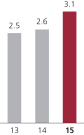 | | 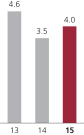 |
| (1) | For additional information, see the “Non-GAAP measures” section. |
As a leading wholesale bank in Canada and active in core Canadian industries in the rest of the world, Capital Markets acted as:
| • | | Lead financial advisor to Shred-it Inc. on its sale to Stericycle Inc. for US$2.3 billion; |
| • | | Sole bookrunner on the inaugural $1.0 billion senior unsecured notes offering for CPPIB Capital Inc.; |
| • | | Joint bookrunner for a US$1.15 billion Class A Limited Voting Share offering for Brookfield Asset Management Inc.; |
| • | | Lead Manager on the $1.3 billion re-opening of the Province of Ontario’s debentures due December 2, 2046; |
| • | | Co-lead arranger and co-underwriter for a $1.8 billion and US$593 million senior secured credit facility, in addition to joint bookrunner on a $950 million bought deal of subscription receipts and extendible convertible debentures in support of DH Corporation’s acquisition of Fundtech; |
| • | | Financial advisor to Veresen Inc. on the acquisition of a 50% interest in the Ruby Pipeline from Global Infrastructure Partners for US$1.4 billion; |
| • | | Exclusive financial advisor to Calloway REIT on the $1.2 billion acquisition of interests in 24 properties as well as the SmartCentres leasing and development platform, and sole bookrunner on Calloway REIT’s $230 million equity offering to partially finance this acquisition; |
| • | | Joint bookrunner for a US$1.0 billion multi-tranche debt offering for Indiana Toll Road Concession Company, LLC.; and |
| • | | Joint bookrunner on a $750 million issue of 10-year investment grade bonds for Husky Energy Inc. |
| | | | |
| CIBC2015 ANNUAL REPORT | | | 23 | |
|
Management’s discussion and analysis |
| | |
Global markets • Canada Derivatives House Of The Year 2015GlobalCapital Americas Derivatives Awards • Leader in Canadian Equity Trading – #1 in volume, value and number of trades TSX and ATS Market Share report as at October 31, 2015 • 2015 Greenwich Quality Leader in Canadian Foreign Exchange Services Greenwich Associates Global Foreign Exchange Services Study • 2015 Greenwich Share Leader in Overall Canadian Fixed-Income Market Share Greenwich Associates Canadian Fixed-Income Investors Study • 2015 Greenwich Share Leader in Canadian Equity Research/Advisory Portfolio Managers Vote Share Greenwich Associates Canadian Equity Investors Study | | Revenue – Global markets
($ millions) 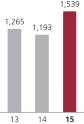
|
| |
Corporate and investment banking • #1 in Canada for Investment Grade Loan Market Share Brendan Wood International Investment and Corporate Banking World Watch, 2015 • #1 in Canada for High Yield Loan Market Share Brendan Wood International Investment and Corporate Banking World Watch, 2015 • #1 in Canada in Structured Products Market Share Brendan Wood International Investment and Corporate Banking World Watch, 2015 • #2 in Canada in Equity Capital Markets Market Share Brendan Wood International Investment and Corporate Banking World Watch, 2015 • #2 in Canada in Investment Banking Market Share Brendan Wood International Investment and Corporate Banking World Watch, 2015 | | Revenue – Corporate and
investment banking ($ millions) 
|
| | |
| 24 | | CIBC2015 ANNUAL REPORT |
|
Management’s discussion and analysis |
Results(1)
| | | | | | | | | | | | |
| $ millions, for the year ended October 31 | | 2015 | | | 2014 | | | 2013 | |
Revenue | | | | | | | | | | | | |
Global markets | | $ | 1,539 | | | $ | 1,193 | | | $ | 1,265 | |
Corporate and investment banking | | | 1,107 | | | | 1,120 | | | | 919 | |
Other | | | (4 | ) | | | 111 | | | | 56 | |
Total revenue (2) | | | 2,642 | | | | 2,424 | | | | 2,240 | |
Provision for credit losses | | | 17 | | | | 43 | | | | 44 | |
Non-interest expenses | | | 1,329 | | | | 1,219 | | | | 1,317 | |
Income before income taxes | | | 1,296 | | | | 1,162 | | | | 879 | |
Income taxes (2) | | | 292 | | | | 267 | | | | 180 | |
Net income | | $ | 1,004 | | | $ | 895 | | | $ | 699 | |
Net income attributable to: | | | | | | | | | | | | |
Equity shareholders (a) | | $ | 1,004 | | | $ | 895 | | | $ | 699 | |
Efficiency ratio | | | 50.3 | % | | | 50.3 | % | | | 58.8 | % |
Return on equity (3) | | | 36.9 | % | | | 37.4 | % | | | 32.4 | % |
Charge for economic capital(3) (b) | | $ | (326 | ) | | $ | (294 | ) | | $ | (269 | ) |
Economic profit(3) (a+b) | | $ | 678 | | | $ | 601 | | | $ | 430 | |
Average assets ($ billions) | | $ | 142.8 | | | $ | 122.5 | | | $ | 121.3 | |
Full-time equivalent employees | | | 1,342 | | | | 1,304 | | | | 1,273 | |
| (1) | For additional segmented information, see Note 28 to the consolidated financial statements. |
| (2) | Revenue and income taxes are reported on a TEB basis. Accordingly, revenue and income taxes include a TEB adjustment of $482 million (2014: $421 million; 2013: $357 million). The equivalent amounts are offset in the revenue and income taxes of Corporate and Other. |
| (3) | For additional information, see the “Non-GAAP measures” section. |
Financial overview
Net income was up $109 million or 12% from 2014, primarily due to higher revenue and a lower provision for credit losses, partially offset by higher non-interest expenses.
Revenue
Revenue was up $218 million or 9% from 2014.
Global markets revenue was up $346 million or 29%, as the prior year included a charge relating to the incorporation of FVA into the valuation of our uncollateralized derivatives, shown as an item of note. The current year included higher revenue from foreign exchange, equity derivatives, interest rate and commodities trading.
Corporate and investment banking revenue was down $13 million or 1%, as the prior year included a gain within an equity-accounted investment in our merchant banking portfolio, partially offset by a gain on sale of an investment in our merchant banking portfolio in the current year, both shown as items of note. Higher revenue from corporate banking was offset by lower investment portfolio gains.
Other revenue was down $115 million or 104%, as the prior year included a gain on the sale of an equity investment in our exited European leveraged finance portfolio, shown as an item of note.
Provision for credit losses
Provision for credit losses was down $26 million or 60% from 2014, as the prior year included loan losses in our exited U.S. leveraged finance portfolio, shown as an item of note. The current year included lower losses in our corporate lending portfolio.
Non-interest expenses
Non-interest expenses were up $110 million or 9% from 2014, primarily due to higher performance-based compensation and other employee-related costs, and higher allocated infrastructure costs.
Income taxes
Income taxes were up $25 million or 9% from 2014, primarily due to higher income, partially offset by the impact of changes in the proportion of income subject to varying rates of tax in different jurisdictions.
Average assets
Average assets were up $20.3 billion or 17% from 2014, primarily due to higher loan balances in corporate banking and U.S. real estate finance and higher derivatives valuation.
Canadian federal budget
The 2015 Canadian federal budget, released on April 21, 2015, contained new rules for “synthetic equity arrangements” which would eliminate the tax-deductibility of Canadian inter-corporate dividends for Canadian corporations in certain circumstances effective November 1, 2015. A revised draft of the rules was released on July 31, 2015. The proposed rules, if enacted, would be effective November 1, 2015, with a set of transition rules that would apply between November 1, 2015 and April 30, 2017. CIBC continues to evaluate the impact on Capital Markets.
| | | | |
| CIBC2015 ANNUAL REPORT | | | 25 | |
|
Management’s discussion and analysis |
Structured credit run-off business
The results of the structured credit run-off business are included in the Capital Markets SBU.
Results
| | | | | | | | | | | | |
| $ millions, for the year ended October 31 | | 2015 | | | 2014 | | | 2013 | |
Net interest expense | | $ | (17 | ) | | $ | (30 | ) | | $ | (50 | ) |
Non-interest income (loss) | | | (2 | ) | | | 19 | | | | 95 | |
Total revenue (loss) | | | (19 | ) | | | (11 | ) | | | 45 | |
Non-interest expenses | | | 10 | | | | 4 | | | | 159 | |
Loss before income taxes | | | (29 | ) | | | (15 | ) | | | (114 | ) |
Income taxes | | | (8 | ) | | | (4 | ) | | | (30 | ) |
Net loss | | $ | (21 | ) | | $ | (11 | ) | | $ | (84 | ) |
Net loss for the year was $21 million (US$17 million), compared with a net loss of $11 million (US$10 million) in 2014.
The net loss for the year was mainly due to net interest expenses and a loss due to a decrease in the value of gross receivables related to purchased protection from financial guarantors (on loan assets that are carried at amortized cost) resulting from an increase in the MTM of the underlying positions. These were partially offset by gains on unhedged positions and a reduction in credit valuation adjustment (CVA) relating to financial guarantors. During the year, there were no terminations.
Position summary
The following table summarizes our positions within the structured credit run-off business:
| | | | | | | | | | | | | | | | | | | | | | | | | | | | | | | | | | | | | | | | |
US$ millions, as at October 31, 2015 | | | Investment and loans (1) | | | Written credit derivatives,
liquidity and credit facilities | | | Credit protection purchased from | |
| | | | Financial guarantors | | | Other counterparties | |
| | | Notional | | | Fair value of
trading, AFS
and FVO
securities | | | Fair value of
securities
classified as loans | | | Carrying value of
securities
classified as loans | | | Notional | | | Fair value of
written credit
derivatives | | | Notional | | | Fair value net of CVA | | | Notional | | | Fair value
net of CVA | |
USRMM – CDO | | $ | – | | | $ | – | | | $ | – | | | $ | – | | | $ | 168 | | | $ | 118 | | | $ | – | | | $ | – | | | $ | 168 | | | $ | 118 | |
CLO | | | 601 | | | | – | | | | 579 | | | | 579 | | | | 414 | | | | 4 | | | | 937 | | | | 7 | | | | – | | | | – | |
Corporate debt | | | – | | | | – | | | | – | | | | – | | | | 3,397 | | | | – | | | | – | | | | – | | | | 3,397 | | | | 1 | |
Other | | | 456 | | | | 305 | | | | 18 | | | | 17 | | | | 280 | | | | 26 | | | | 10 | | | | 2 | | | | – | | | | – | |
Unmatched | | | – | | | | – | | | | – | | | | – | | | | – | | | | – | | | | – | | | | – | | | | 382 | | | | – | |
| | | $ | 1,057 | | | $ | 305 | | | $ | 597 | | | $ | 596 | | | $ | 4,259 | | | $ | 148 | | | $ | 947 | | | $ | 9 | | | $ | 3,947 | | | $ | 119 | |
October 31, 2014 | | $ | 1,969 | | | $ | 369 | | | $ | 1,415 | | | $ | 1,417 | | | $ | 5,679 | | | $ | 192 | | | $ | 2,352 | | | $ | 27 | | | $ | 4,656 | | | $ | 154 | |
| (1) | Excluded from the table above are AFS equity securities that we obtained in consideration for commutation of our U.S. residential mortgage market (USRMM) contracts with financial guarantors with a carrying value of US$22 million (2014: US$23 million). |
USRMM – collateralized debt obligation (CDO)
Our net USRMM position, consisting of a written credit derivative, amounted to US$168 million. This position was hedged through protection purchased from a large U.S.-based diversified multinational insurance and financial services company with which we have market-standard collateral arrangements.
Collateralized loan obligation (CLO)
CLO positions consist of senior tranches of CLOs backed by diversified pools of primarily U.S. (69%) and European-based (28%) senior secured leveraged loans. As at October 31, 2015, approximately 72% of the total notional amount of the CLO tranches was rated equivalent to AAA, 26% was rated between the equivalent of AA+, and the remainder was the equivalent of A or lower. As at October 31, 2015, approximately 24% of the underlying collateral was rated equivalent to BB- or higher, 58% was rated between the equivalent of B+ and B-, 6% was rated equivalent to CCC+ or lower, with the remainder unrated. The CLO positions have a weighted-average life of 1.7 years and average subordination of 32%.
Corporate debt
Corporate debt exposure consists of a large matched super senior derivative, where CIBC has purchased and sold credit protection on the same reference portfolio. The reference portfolio consists of highly diversified, predominantly investment grade corporate credit. Claims on these contracts do not occur until cumulative credit default losses from the reference portfolio exceed 30% during the remaining14-month term of the contract. On this reference portfolio, we have sold protection to an investment dealer.
| | |
| 26 | | CIBC2015 ANNUAL REPORT |
|
Management’s discussion and analysis |
Other
Our significant positions in the Investments and loans section within Other, as at October 31, 2015, include:
| • | | Variable rate Class A-1/A-2 notes classified as trading securities with a notional value of US$221 million and a fair value of US$214 million, tracking notes classified as AFS with a notional value of US$4 million and a fair value of US$2 million, and loans with a notional value of US$54 million and fair value and carrying value of nil. These notes were originally received in exchange for our non-bank sponsored asset-backed commercial paper (ABCP) in January 2009, upon the ratification of the Montreal Accord restructuring; |
| • | | US$106 million notional value of CDOs consisting of trust preferred securities (TruPs) collateral, which are Tier I Innovative Capital Instruments issued by U.S. regional banks and insurers. These securities are classified as FVO securities and had a fair value of US$85 million; and |
| • | | US$19 million notional value of an asset-backed security (ABS) classified as a loan, with fair value of US$18 million and carrying value of US$17 million. |
Our significant positions in the written credit derivatives, liquidity and credit facilities section within Other, as at October 31, 2015, include:
| • | | US$216 million notional value of written credit derivatives with a fair value of US$26 million on inflation-linked notes, and CDO tranches with collateral consisting of non-U.S. residential mortgage-backed securities and TruPs; and |
| • | | US$44 million of undrawn Margin Funding Facility related to the Montreal Accord restructuring. |
Unmatched
The underlying in our unmatched position is a reference portfolio of corporate debt.
Credit protection purchased from financial guarantors and other counterparties
The following table presents the notional amounts and fair values of credit protection purchased from financial guarantors and other counterparties by counterparty credit quality, based on external credit ratings (Standard & Poor’s Ratings Services (S&P) and/or Moody’s Investors Service, Inc. (Moody’s)), and the underlying referenced assets.
| | | | | | | | | | | | | | | | | | | | | | | | | | | | | | | | | | | | | | | | |
| | | | | Notional amounts of referenced assets | | | | | Credit protection purchased
from financial guarantors
and other counterparties | |
| US$ millions, as at October 31, 2015 | | | | CLO | | | Corporate debt | | | CDO – USRMM | | | Other | | | Unmatched | | | Total notional | | | | | Fair value before CVA | | | CVA | | | Fair value net of CVA | |
Financial guarantors (1) | | | | | | | | | | | | | | | | | | | | | | | | | | | | | | | | | | | | | | | | |
Investment grade | | | | $ | 599 | | | $ | – | | | $ | – | | | $ | 10 | | | $ | – | | | $ | 609 | | | | | $ | 8 | | | $ | (1 | ) | | $ | 7 | |
Unrated | | | | | 338 | | | | – | | | | – | | | | – | | | | – | | | | 338 | | | | | | 3 | | | | (1 | ) | | | 2 | |
| | | | | | 937 | | | | – | | | | – | | | | 10 | | | | – | | | | 947 | | | | | | 11 | | | | (2 | ) | | | 9 | |
Other counterparties (1) | | | | | | | | | | | | | | | | | | | | | | | | | | | | | | | | | | | | | | | | |
Investment grade | | | | | – | | | | – | | | | 168 | | | | – | | | | – | | | | 168 | | | | | | 118 | | | | – | | | | 118 | |
Unrated | | | | | – | | | | 3,397 | | | | – | | | | – | | | | 382 | | | | 3,779 | | | | | | 1 | | | | – | | | | 1 | |
| | | | | $ | – | | | $ | 3,397 | | | $ | 168 | | | $ | – | | | $ | 382 | | | $ | 3,947 | | | | | $ | 119 | | | $ | – | | | $ | 119 | |
Total | | | | $ | 937 | | | $ | 3,397 | | | $ | 168 | | | $ | 10 | | | $ | 382 | | | $ | 4,894 | | | | | $ | 130 | | | $ | (2 | ) | | $ | 128 | |
October 31, 2014 | | | | $ | 2,370 | | | $ | 3,952 | | | $ | 212 | | | $ | 30 | | | $ | 444 | | | $ | 7,008 | | | | | $ | 188 | | | $ | (7 | ) | | $ | 181 | |
| (1) | In cases where more than one credit rating agency provides ratings and those ratings differ, we use the lowest rating. |
The unrated other counterparty is a Canadian conduit. The conduit is in compliance with collateral posting arrangements and has posted collateral exceeding current market exposure. The fair value of the collateral as at October 31, 2015 was US$230 million relative to nil net exposure.
Lehman Brothers bankruptcy proceedings
In 2013, we recognized a US$150 million charge (US$110 million after-tax) in respect of the full settlement of the U.S. Bankruptcy Court adversary proceeding brought by the Estate of Lehman Brothers Holdings, Inc. challenging the reduction to zero of our unfunded commitment on a variable funding note. In 2008, we recognized a US$841 million gain on the variable funding note.
| | | | |
| CIBC2015 ANNUAL REPORT | | | 27 | |
|
Management’s discussion and analysis |
Corporate and Other
Corporate and Other includes the following functional groups – Technology and Operations, Finance (including Treasury), Administration, Risk Management, and Internal Audit, as well as other support groups. The expenses of these functional and support groups are generally allocated to the business lines within the SBUs. Corporate and Other also includes our International banking operations comprising mainly CIBC FirstCaribbean, strategic investments in the CIBC Mellon joint ventures, and other income statement and balance sheet items not directly attributable to the business lines. CIBC’s investment in The Bank of N.T. Butterfield & Son Limited was included in Corporate and Other results until it was sold on April 30, 2015.
Results(1)
| | | | | | | | | | | | |
| $ millions, for the year ended October 31 | | 2015 | | | 2014 | | | 2013 | |
Revenue | | | | | | | | | | | | |
International banking | | $ | 678 | | | $ | 601 | | | $ | 593 | |
Other | | | (375 | ) | | | (127 | ) | | | (67 | ) |
Total revenue (2) | | | 303 | | | | 474 | | | | 526 | |
Provision for credit losses | | | 48 | | | | 163 | | | | 146 | |
Non-interest expenses | | | 1,436 | | | | 1,486 | | | | 952 | |
Loss before income taxes | | | (1,181 | ) | | | (1,175 | ) | | | (572 | ) |
Income taxes (2) | | | (723 | ) | | | (541 | ) | | | (461 | ) |
Net loss | | $ | (458 | ) | | $ | (634 | ) | | $ | (111 | ) |
Net income (loss) attributable to: | | | | | | | | | | | | |
Non-controlling interests | | $ | 14 | | | $ | (5 | ) | | $ | (2 | ) |
Equity shareholders | | | (472 | ) | | | (629 | ) | | | (109 | ) |
Full-time equivalent employees | | | 16,977 | | | | 17,087 | | | | 16,145 | |
| (1) | For additional segmented information, see Note 28 to the consolidated financial statements. |
| (2) | TEB adjusted. See footnote 2 in the “Capital Markets” section for additional details. |
Financial overview
Net loss was $458 million compared with a net loss of $634 million in 2014, primarily due to a lower provision for credit losses and lower non-interest expenses, partially offset by lower revenue.
Revenue
Revenue was down $171 million or 36% from 2014.
International banking revenue was up $77 million or 13% from 2014, primarily due to favourable foreign exchange rates.
Otherrevenue was down $248 million from 2014, primarily due to lower treasury revenue and a higher TEB adjustment. The prior year included the gain relating to the Aeroplan transactions with Aimia and TD, shown as an item of note.
Provision for credit losses
Provision for credit losses was down $115 million or 71%, as the prior year included loan losses relating to CIBC FirstCaribbean, partially offset by a reduction in the collective allowance, including lower estimated credit losses relating to the Alberta floods, both shown as items of note. Excluding items of note, the current year still had lower losses in CIBC FirstCaribbean, partially offset by an increase in the collective allowance versus a reduction in the prior year.
Non-interest expenses
Non-interest expenses were down $50 million or 3% from 2014, as the prior year included a goodwill impairment charge relating to CIBC FirstCaribbean, while the current year included cumulative restructuring charges primarily relating to employee severance, shown as items of note.
Income taxes
Income tax benefit was up $182 million, primarily due to no income tax recovery booked in the prior year in respect of the CIBC FirstCaribbean goodwill impairment charge and loan losses, and a higher TEB adjustment in the current year.
| | |
| 28 | | CIBC2015 ANNUAL REPORT |
|
Management’s discussion and analysis |
Financial condition
Review of condensed consolidated balance sheet
| | | | | | | | |
| $ millions, as at October 31 | | 2015 | | | 2014 | |
Assets | | | | | | | | |
Cash and deposits with banks | | $ | 18,637 | | | $ | 13,547 | |
Securities | | | | | | | | |
Trading | | | 46,181 | | | | 47,061 | |
AFS | | | 28,534 | | | | 12,228 | |
FVO | | | 267 | | | | 253 | |
| | | | 74,982 | | | | 59,542 | |
Securities borrowed or purchased under resale agreements | | | 33,334 | | | | 36,796 | |
Loans and acceptances | | | | | | | | |
Residential mortgages | | | 169,258 | | | | 157,526 | |
Personal | | | 36,517 | | | | 35,458 | |
Credit card | | | 11,804 | | | | 11,629 | |
Business and government | | | 75,072 | | | | 65,287 | |
Allowance for credit losses | | | (1,670 | ) | | | (1,660 | ) |
| | | | 290,981 | | | | 268,240 | |
Derivative instruments | | | 26,342 | | | | 20,680 | |
Other assets | | | 19,033 | | | | 16,098 | |
| | | $ | 463,309 | | | $ | 414,903 | |
Liabilities and equity | | | | | | | | |
Deposits | | | | | | | | |
Personal | | $ | 137,378 | | | $ | 130,085 | |
Business and government | | | 178,850 | | | | 148,793 | |
Bank | | | 10,785 | | | | 7,732 | |
Secured borrowings | | | 39,644 | | | | 38,783 | |
| | | | 366,657 | | | | 325,393 | |
Obligations related to securities lent or sold short or under repurchase agreements | | | 20,149 | | | | 23,764 | |
Derivative instruments | | | 29,057 | | | | 21,841 | |
Acceptances | | | 9,796 | | | | 9,212 | |
Other liabilities | | | 12,223 | | | | 10,932 | |
Subordinated indebtedness | | | 3,874 | | | | 4,978 | |
Equity | | | 21,553 | | | | 18,783 | |
| | | $ | 463,309 | | | $ | 414,903 | |
Assets
Total assets as at October 31, 2015 were up $48.4 billion or 12% from 2014, of which approximately $12 billion was the result of appreciation of the U.S. dollar.
Cash and deposits with banks increased by $5.1 billion or 38%, mainly due to higher short-term placements in treasury.
Securities increased by $15.4 billion or 26%, primarily due to an increase in AFS securities, as a result of treasury activities, including the purchase of government securities, mortgage-backed securities and U.S. agency securities. Further details on the composition of securities are provided in the “Supplementary annual financial information” section and Note 4 to the consolidated financial statements.
Securities borrowed or purchased under resale agreements decreased by $3.5 billion or 9%, mainly due to treasury activities, as the proceeds were used to purchase the AFS securities discussed above. This was partially offset by client-driven activity in Capital Markets.
Loans and acceptances increased by $22.7 billion or 8%. Business and government loans and acceptances were up $9.8 billion or 15%, largely due to an increase in our domestic lending portfolio and the impact of foreign exchange. Residential mortgages were up $11.7 billion or 7%, primarily due to growth in CIBC brand mortgages, partially offset by attrition in the exited FirstLine mortgage broker business. Personal loans were up $1.1 billion or 3%, due to volume growth. Further details on the composition of loans and acceptances are provided in the “Supplementary annual financial information” section and Note 5 to the consolidated financial statements.
Derivative instruments increased by $5.7 billion or 27%, largely driven by an increase in foreign exchange derivative and interest rate derivative valuations.
Other assets increased by $2.9 billion or 18%, primarily due to an increase in collateral pledged for derivatives, defined benefit pension assets and broker receivables.
| | | | |
| CIBC2015 ANNUAL REPORT | | | 29 | |
|
Management’s discussion and analysis |
Liabilities
Total liabilities as at October 31, 2015 were up $45.6 billion or 12% from 2014, of which approximately $12 billion was the result of appreciation of the U.S. dollar.
Deposits increased by $41.3 billion or 13%, primarily due to domestic retail volume growth, the impact of foreign exchange and higher wholesale funding. Further details on the composition of deposits are provided in the “Supplementary annual financial information” section and Note 10 to the consolidated financial statements.
Obligations related to securities lent or sold short or under repurchase agreements decreased by $3.6 billion or 15%, primarily due to client-driven activities.
Derivative instruments increased by $7.2 billion or 33%, largely driven by an increase in foreign exchange derivative and interest rate derivative valuations.
Other liabilities increased by $1.3 billion or 12%, primarily due to an increase in broker payables and collateral received for derivatives.
Subordinated indebtedness decreased by $1.1 billion or 22%, primarily due to a redemption during the year. See the “Capital management and planning” section for further details.
Equity
Equity as at October 31, 2015 was up $2.8 billion or 15% from 2014, primarily due to a net increase in retained earnings and accumulated other comprehensive income (AOCI) foreign currency translation adjustments. During the year, CIBC redeemed and issued preferred shares. See the “Capital management and planning” section for further details.
Capital resources
Our capital strength protects our depositors and creditors from risks inherent in our businesses, allows us to absorb unexpected losses, and enables us to take advantage of attractive business opportunities. It also enables us to maintain a favourable credit standing and to raise additional capital or other funding on attractive terms. Our objective is to maintain a strong and efficient capital base. Capital needs to be monitored and rebalanced continually; we manage and monitor our capital to maximize risk-adjusted return to shareholders and to maintain a sufficient capital buffer to ensure that we meet regulatory requirements.
Regulatory capital requirements
Our regulatory capital requirements are determined in accordance with guidelines issued by OSFI, which are based upon the risk-based capital standards developed by the Basel Committee on Banking Supervision (BCBS).
Regulatory capital consists of CET1, Tier 1 and Tier 2 capital. OSFI mandated all institutions to have established a target CET1 ratio of 7%, comprised of the 2019 all-in minimum ratio plus a conservation buffer, beginning in 2013. For the Tier 1 and Total capital ratios, the all-in targets are 8.5% and 10.5%, respectively, beginning in 2014. These targets may be higher for certain institutions if OSFI feels the circumstances warrant it. “All-in” is defined by OSFI as capital calculated to include all of the regulatory adjustments that will be required by 2019, but retaining the phase-out rules for non-qualifying capital instruments. Certain deductions from CET1 capital are phased in at 20% per year from 2014 for the determination of capital under the transitional rules. Amounts not yet deducted from capital under OSFI’s transitional rules are risk weighted, creating a difference between RWAs on a transitional and all-in basis.
OSFI has released its guidance on domestic systemically important banks (D-SIBs) and the associated capital surcharge. CIBC is considered to be aD-SIB in Canada along with the Bank of Montreal, the Bank of Nova Scotia, the National Bank of Canada, the Royal Bank of Canada, and the Toronto-Dominion Bank. D-SIBs will be subject to a 1% CET1 surcharge commencing January 1, 2016.
Capital adequacy requirements are applied on a consolidated basis. The consolidation basis applied to our financial statements is described in Note 1 to the consolidated financial statements, except for our insurance subsidiaries (CIBC Reinsurance Company Limited and CIBC Life Insurance Company Limited), which are excluded from the regulatory scope of consolidation. CIBC Life Insurance Company Limited is subject to OSFI’s Minimum Continuing Capital Surplus Requirements for life insurance companies.
A comparison of the BCBS transitional capital ratio requirements and the OSFI all-in target capital ratio requirements is as follows:
| | |
| Transitional basis (BCBS) | | All-in basis (OSFI) |
| |
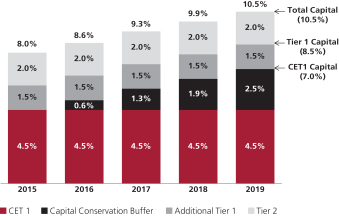 | | 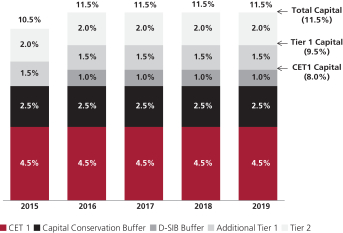 |
| | |
| 30 | | CIBC2015 ANNUAL REPORT |
|
Management’s discussion and analysis |
The tiers of regulatory capital indicate increasing quality/permanence and the ability to absorb losses. The major components of our regulatory capital are summarized as follows:
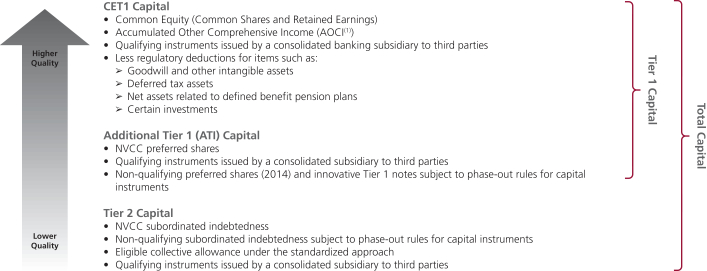
| (1) | Excluding AOCI relating to cash flow hedges and changes to FVO liabilities attributable to changes in own credit risk. |
Risk-weighted assets
The following table provides a summary of permissible regulatory capital approaches and those adopted by CIBC:
| | | | |
| Risk category | | Permissible regulatory capital approaches | | Approach adopted by CIBC |
| Credit risk | | Basel provides three approaches for calculating credit risk capital
requirements – standardized, foundation and advanced internal
ratings-based (AIRB). OSFI expects financial institutions in
Canada with assets in excess of $5 billion to use the AIRB
approach for all material portfolios and credit businesses. Basel provides two approaches for calculating credit risk capital
requirements for securitization positions in the banking book –
standardized and internal ratings-based (IRB) approaches. | | We have adopted the AIRB approach for the majority of our
credit portfolios. Under this methodology, we utilize our own
internal estimates to determine probability of default (PD), loss
given default (LGD), maturity, and exposure at default (EAD) for
lending products and securities. We use the IRB approach for securitization exposures which
comprises several calculation approaches (Ratings-Based,
Supervisory Formula, Internal Assessment Approach). Some portfolios deemed immaterial remain on the standardized
approach. |
| Market risk | | Market risk capital requirements can be determined under the
standardized or internal models approaches. The latter involves
the use of internal VaR models to measure market risk and
determine the appropriate capital requirement. The stressed VaR
and incremental risk charge (IRC) also form part of the internal
models approach. | | We use the internal models approach to calculate market risk
capital. Our internal market risk models comprise VaR, stressed
VaR, and IRC. We also use the IRB approach for trading book
securitization positions. |
| Operational risk | | Operational risk capital requirements can be determined under
the basic indicator approach, standardized approach or
advanced measurement approach (AMA). | | We use AMA to calculate the operational risk capital. |
| | | | |
| CIBC2015 ANNUAL REPORT | | | 31 | |
|
Management’s discussion and analysis |
Regulatory capital and ratios
The components of our regulatory capital and ratios under Basel III (all-in basis) are presented in the table below:
| | | | | | | | |
| $ millions, as at October 31 | | 2015 | | | 2014 | |
Common Equity Tier 1 (CET1) capital: instruments and reserves | | | | | | | | |
Directly issued qualifying common share capital plus related stock surplus | | $ | 7,889 | | | $ | 7,857 | |
Retained earnings | | | 11,433 | | | | 9,626 | |
AOCI (and other reserves) | | | 1,038 | | | | 105 | |
Common share capital issued by subsidiaries and held by third parties (amount allowed in group CET1) | | | 94 | | | | 82 | |
CET1 capital before regulatory adjustments | | | 20,454 | | | | 17,670 | |
CET1 capital: regulatory adjustments | | | | | | | | |
Prudential valuation adjustments | | | 50 | | | | 52 | |
Goodwill (net of related tax liabilities) | | | 1,824 | | | | 1,627 | |
Other intangibles other than mortgage-servicing rights (net of related tax liabilities) | | | 1,080 | | | | 862 | |
Deferred tax assets excluding those arising from temporary differences (net of related tax liabilities) | | | 62 | | | | 73 | |
Defined benefit pension fund net assets (net of related tax liabilities) | | | 385 | | | | 86 | |
Significant investments in the common stock of banking, financial and insurance entities that are outside the scope of regulatory consolidation, net of eligible short positions (amount above 10% threshold) | | | – | | | | 264 | |
Other | | | 224 | | | | 99 | |
Total regulatory adjustments to CET1 | | | 3,625 | | | | 3,063 | |
CET1 capital | | | 16,829 | | | | 14,607 | |
Additional Tier 1 (AT1) capital: instruments | | | | | | | | |
Directly issued qualifying AT1 instruments plus related stock surplus (1) | | | 1,000 | | | | 1,031 | |
Directly issued capital instruments subject to phase out from AT1 (2) | | | 1,679 | | | | 1,651 | |
Additional Tier 1 Instruments issued by subsidiaries and held by third parties (amount allowed in AT1) | | | 12 | | | | 11 | |
AT1 capital before regulatory adjustments | | | 2,691 | | | | 2,693 | |
AT1 capital: regulatory adjustments | | | | | | | | |
Other deductions from Tier 1 capital as determined by OSFI | | | – | | | | – | |
Total regulatory adjustments to AT1 capital | | | – | | | | – | |
AT1 capital | | | 2,691 | | | | 2,693 | |
Tier 1 capital (T1 = CET1 + AT1) | | | 19,520 | | | | 17,300 | |
Tier 2 capital: instruments and provisions | | | | | | | | |
Directly issued qualifying Tier 2 instruments plus related stock surplus (3) | | | 1,000 | | | | 1,000 | |
Directly issued capital instruments subject to phase out from Tier 2 | | | 2,828 | | | | 3,605 | |
Tier 2 instruments issued by subsidiaries and held by third parties (amount allowed in Tier 2) | | | 16 | | | | 14 | |
Collective allowances | | | 70 | | | | 70 | |
Tier 2 capital before regulatory adjustments | | | 3,914 | | | | 4,689 | |
Total regulatory adjustments to Tier 2 capital | | | – | | | | – | |
Tier 2 capital (T2) | | | 3,914 | | | | 4,689 | |
Total capital (TC = T1 + T2) | | $ | 23,434 | | | $ | 21,989 | |
CET1 capital RWA(4) | | $ | 156,107 | | | $ | 141,250 | |
Tier 1 capital RWA(4) | | $ | 156,401 | | | $ | 141,446 | |
Total capital RWA(4) | | $ | 156,652 | | | $ | 141,739 | |
Capital ratios(4) | | | | | | | | |
CET1 ratio | | | 10.8 | % | | | 10.3 | % |
Tier 1 capital ratio | | | 12.5 | % | | | 12.2 | % |
Total capital ratio | | | 15.0 | % | | | 15.5 | % |
| (1) | Comprises non-cumulative Class A Preferred Shares Series 27, 29, 39, 41 (issued in 2015) and 43 (issued in 2015), which are treated as NVCC in accordance with OSFI’s capital adequacy guidelines. We redeemed all of our Class A Preferred Shares Series 27 on January 31, 2015 and all of our Class A Preferred Shares Series 29 on April 30, 2015. See the “Capital management and planning” section for additional information. |
| (2) | Comprises CIBC Tier 1 Notes – Series A due June 30, 2108 and Series B due June 30, 2108 (together, the Tier 1 Notes). The adoption of IFRS 10 “Consolidated Financial Statements” required CIBC to deconsolidate CIBC Capital Trust, which resulted in the removal of Capital Trust securities issued by CIBC Capital Trust from the consolidated balance sheet and instead recognize the senior deposit notes issued by CIBC to CIBC Capital Trust within Business and government deposits. |
| (3) | Comprises Debentures due on October 28, 2024 which are treated as NVCC in accordance with OSFI’s capital adequacy guidelines. |
| (4) | There are three different levels of RWAs for the calculation of the CET1, Tier 1 and Total capital ratios arising from the option CIBC has chosen for the phase-in of the CVA capital charge. |
The components of our regulatory capital and ratios on a transitional basis are presented in the table below:
| | | | | | | | |
| $ millions, as at October 31 | | 2015 | | | 2014 | |
CET1 capital | | $ | 19,147 | | | $ | 17,496 | |
Tier 1 capital | | | 20,671 | | | | 18,720 | |
Total capital | | | 24,538 | | | | 23,281 | |
RWA | | | 163,867 | | | | 155,148 | |
CET1 ratio | | | 11.7 | % | | | 11.3 | % |
Tier 1 ratio | | | 12.6 | % | | | 12.1 | % |
Total capital ratio | | | 15.0 | % | | | 15.0 | % |
Assets-to-capital multiple (1) | | | n/a | | | | 17.7 | x |
| (1) | Replaced with the Basel III leverage ratio beginning in 2015. |
| | |
| 32 | | CIBC2015 ANNUAL REPORT |
|
Management’s discussion and analysis |
The components of our RWAs and corresponding minimum total capital requirements are presented in the table below:
| | | | | | | | | | | | | | | | |
| $ millions, as at October 31 | | 2015 | | | 2014 | |
| | | RWA (All-in
basis) | | | Minimum
total capital
required (1) | | | RWA (All-in basis) | | | Minimum
total capital
required (1) | |
Credit risk | | | | | | | | | | | | | | | | |
Standardized approach | | | | | | | | | | | | | | | | |
Corporate | | $ | 3,614 | | | $ | 289 | | | $ | 3,521 | | | $ | 282 | |
Sovereign | | | 753 | | | | 60 | | | | 510 | | | | 41 | |
Banks | | | 327 | | | | 26 | | | | 275 | | | | 22 | |
Real estate secured personal lending | | | 2,213 | | | | 177 | | | | 1,959 | | | | 156 | |
Other retail | | | 649 | | | | 52 | | | | 598 | | | | 48 | |
Trading book | | | 10 | | | | 1 | | | | 12 | | | | 1 | |
| | | 7,566 | | | | 605 | | | | 6,875 | | | | 550 | |
AIRB approach | | | | | | | | | | | | | | | | |
Corporate | | | 58,917 | | | | 4,713 | | | | 50,425 | | | | 4,034 | |
Sovereign (2) | | | 2,081 | | | | 166 | | | | 1,628 | | | | 130 | |
Banks | | | 4,088 | | | | 327 | | | | 3,300 | | | | 264 | |
Real estate secured personal lending | | | 10,477 | | | | 838 | | | | 9,253 | | | | 740 | |
Qualifying revolving retail | | | 16,106 | | | | 1,288 | | | | 15,455 | | | | 1,237 | |
Other retail | | | 7,272 | | | | 582 | | | | 6,486 | | | | 519 | |
Equity | | | 725 | | | | 58 | | | | 713 | | | | 57 | |
Trading book | | | 2,930 | | | | 234 | | | | 2,074 | | | | 166 | |
Securitization | | | 2,011 | | | | 161 | | | | 1,887 | | | | 151 | |
Adjustment for scaling factor | | | 6,266 | | | | 501 | | | | 5,456 | | | | 436 | |
| | | 110,873 | | | | 8,868 | | | | 96,677 | | | | 7,734 | |
Other credit RWA | | | 12,381 | | | | 990 | | | | 14,940 | | | | 1,195 | |
Total credit risk (before adjustment for CVA phase-in) (3) | | | 130,820 | | | | 10,463 | | | | 118,492 | | | | 9,479 | |
Market risk (Internal Models and IRB Approach) | | | | | | | | | | | | | | | | |
VaR | | | 719 | | | | 58 | | | | 678 | | | | 54 | |
Stressed VaR | | | 2,051 | | | | 164 | | | | 1,759 | | | | 141 | |
Incremental risk charge | | | 1,606 | | | | 128 | | | | 1,582 | | | | 127 | |
Securitization and other | | | 32 | | | | 3 | | | | 27 | | | | 2 | |
Total market risk | | | 4,408 | | | | 353 | | | | 4,046 | | | | 324 | |
Operational risk (AMA) | | | 18,194 | | | | 1,456 | | | | 17,320 | | | | 1,386 | |
Total RWA before adjustment for CVA phase-in | | $ | 153,422 | | | $ | 12,272 | | | $ | 139,858 | | | $ | 11,189 | |
CVA adjustment (3) | | | | | | | | | | | | | | | | |
CET1 RWA | | $ | 2,685 | | | $ | 215 | | | $ | 1,392 | | | $ | 111 | |
Tier 1 RWA | | | 2,979 | | | | 238 | | | | 1,588 | | | | 127 | |
Total RWA | | | 3,230 | | | | 258 | | | | 1,881 | | | | 150 | |
Total RWA after adjustment for CVA phase-in (3) | | | | | | | | | | | | | | | | |
CET1 capital RWA | | $ | 156,107 | | | $ | 12,487 | | | $ | 141,250 | | | $ | 11,300 | |
Tier 1 capital RWA | | | 156,401 | | | | 12,510 | | | | 141,446 | | | | 11,316 | |
Total capital RWA | | | 156,652 | | | | 12,530 | | | | 141,739 | | | | 11,339 | |
| (1) | Refers to the minimum standard established by the BCBS before the application of the capital conservation buffer and any other capital buffers including but not limited to the capital surcharge for global/domestic systemically important banks that may be established by regulators from time to time. It is calculated by multiplying RWA by 8%. |
| (2) | Includes residential mortgages insured by Canadian Mortgage and Housing Corporation (CMHC), an agency of the Government of Canada, and government guaranteed student loans. |
| (3) | As a result of the option that CIBC chose for calculating the CVA capital charge, the calculation of CET1, Tier 1 and Total capital ratios are based on different RWAs. The charge will be phased-in during 2014 to 2019 and relates to bilateral over-the-counter (OTC) derivatives included in the credit risk RWA. |
CET1 ratio (All-in basis)
The CET1 ratio at October 31, 2015 increased 0.5% from October 31, 2014. CET1 capital increased sufficiently to counteract the impact of an increase in RWAs. The increase in CET1 capital was the result of internal capital generation (net income less dividends and share repurchases) and higher AOCI, partially offset by an increase in regulatory capital deductions. CET1 Capital RWAs at October 31, 2015 increased $14.9 billion from October 31, 2014, primarily due to increased exposures, foreign exchange movements and capital model parameter updates.
We hold regulatory capital against the underlying exposures associated with our credit card securitization trust, CARDS II Trust, as we provide non-contractual support to the trust. Applying this treatment resulted in a reduction of our 2015 Basel III CET1, Tier 1 and Total capital ratios by approximately 0.12%, 0.13% and 0.14%, respectively (2014: 0.11%, 0.13% and 0.16%, respectively).
| | | | |
| CIBC2015 ANNUAL REPORT | | | 33 | |
|
Management’s discussion and analysis |
Movement in regulatory capital and CET1 capital RWAs
Changes in regulatory capital (all-in basis) under Basel III are presented in the table below:
| | | | | | | | |
| $ millions, for the year ended October 31 | | 2015 | | | 2014 | |
Balance at beginning of year | | $ | 21,989 | | | $ | 19,961 | |
Issue of common shares | | | 30 | | | | 96 | |
Issue of preferred shares | | | 600 | | | | 400 | |
Issue of subordinated indebtedness | | | – | | | | 1,000 | |
Purchase of common shares for cancellation | | | (2 | ) | | | (65 | ) |
Redemption of preferred shares (1) | | | (631 | ) | | | (606 | ) |
Net income attributable to equity shareholders | | | 3,576 | | | | 3,218 | |
Preferred and common share dividends | | | (1,753 | ) | | | (1,654 | ) |
Premium on purchase of common shares for cancellation | | | (9 | ) | | | (250 | ) |
Change in AOCI balances included in regulatory capital | | | | | | | | |
Net foreign currency translation adjustments | | | 722 | | | | 269 | |
Net change in AFS securities | | | (164 | ) | | | 6 | |
Net change in cash flow hedges | | | (4 | ) | | | 13 | |
Net change in post-employment defined benefit plans | | | 374 | | | | (143 | ) |
Change in shortfall of allowance to expected losses | | | (93 | ) | | | 105 | |
Goodwill and other intangible assets | | | (415 | ) | | | (148 | ) |
Redemption of subordinated debt (2) | | | (447 | ) | | | – | |
Other, including change in regulatory adjustments (3) | | | (339 | ) | | | (213 | ) |
Balance at end of year | | $ | 23,434 | | | $ | 21,989 | |
| (1) | During the year, we redeemed a total of $631 million (2014: $1,075 million) of preferred shares which reduced Tier 1 capital. Due to the application of the cap on inclusion of non-qualifying capital instruments, of the 2014 redemptions, $469 million did not impact regulatory capital. See the “Capital management and planning” section for further information on redemption of preferred shares. |
| (2) | Due to the application of the cap on inclusion of non-qualifying capital instruments, $653 million of the $1.1 billion of subordinated debentures redeemed in April 2015 did not impact regulatory capital. |
| (3) | For 2014, includes the impact of $84 million to retained earnings and $349 million to AOCI as a result of the adoption of International Accounting Standard (IAS) 19 “Employee Benefits” and IFRS 10 “Consolidated Financial Statements”. |
The following tables show the movement in CET1 capital RWAs (all-in basis) relating to credit, market and operational risks.
Credit risk
| | | | | | | | | | | | | | | | |
| $ millions, for the year ended October 31 | | 2015 | | | 2014 | |
| | | Credit risk | | | Of which
counterparty
credit risk (1) | | | Credit risk | | | Of which
counterparty
credit risk (1) | |
Balance at beginning of year | | $ | 119,884 | | | $ | 5,068 | | | $ | 115,101 | | | $ | 5,521 | |
Book size (2) | | | 7,892 | | | | 1,010 | | | | 3,039 | | | | (488 | ) |
Book quality (3) | | | 1,667 | | | | 158 | | | | (1,242 | ) | | | (658 | ) |
Model updates (4) | | | (524 | ) | | | – | | | | 2,947 | | | | 89 | |
Methodology and policy (5) | | | 292 | | | | 292 | | | | 770 | | | | 1,083 | |
Acquisitions and disposals | | | – | | | | – | | | | (2,024 | ) | | | – | |
Foreign exchange movements | | | 4,507 | | | | 347 | | | | 2,629 | | | | 146 | |
Other | | | (213 | ) | | | 1,023 | | | | (1,336 | ) | | | (625 | ) |
Balance at end of year (6) | | $ | 133,505 | | | $ | 7,898 | | | $ | 119,884 | | | $ | 5,068 | |
Market risk
| | | | | | | | |
| $ millions, for the year ended October 31 | | 2015 | | | 2014 | |
Balance at beginning of year | | $ | 4,046 | | | $ | 3,460 | |
Movement in risk levels (7) | | | 444 | | | | 508 | |
Model updates (4) | | | 364 | | | | 5 | |
Methodology and policy (5) | | | – | | | | – | |
Acquisitions and disposals | | | – | | | | – | |
Foreign exchange movements | | | (446 | ) | | | 73 | |
Other | | | – | | | | – | |
Balance at end of year | | $ | 4,408 | | | $ | 4,046 | |
Operational risk
| | | | | | | | |
| $ millions, for the year ended October 31 | | 2015 | | | 2014 | |
Balance at beginning of year | | $ | 17,320 | | | $ | 18,186 | |
Movement in risk levels (8) | | | 874 | | | | (173 | ) |
Methodology and policy (5) | | | – | | | | (525 | ) |
Acquisitions and disposals | | | – | | | | (168 | ) |
Balance at end of year | | $ | 18,194 | | | $ | 17,320 | |
| (1) | Comprises derivatives and repo-style transactions. |
| (2) | Relates to net increase/decrease in the underlying exposures. |
| (3) | Relates to changes in credit risk mitigation and credit quality of the borrower/counterparty. |
| (4) | Relates to internal model or parameter changes. |
| (5) | Relates to regulatory changes implemented on an industry-wide basis (i.e., Basel III) and any capital methodology changes implemented within CIBC for our portfolios. |
| (6) | Includes $2,685 million (2014: $1,392 million) of CET1 CVA RWAs relating to bilateral OTC derivatives. |
| (7) | Relates to changes in open positions and market data. |
| (8) | Relates to changes in loss experience and business environment and internal control factors. |
| | |
| 34 | | CIBC2015 ANNUAL REPORT |
|
Management’s discussion and analysis |
Movement in CET1 capital RWAs
Credit risk
The increase in credit risk RWA mainly reflects the organic growth in our retail and capital markets portfolios through the year, as well as increases due to the appreciation of the U.S. dollar. The increase due to book quality reflects the impact of various downgrades experienced during the year. Model updates include refinements and normal course updates to our underlying AIRB models and parameters, such as, PD, LGD and EAD. Methodology and policy updates reflect regulatory changes in capital methodologies and includes the phased-in implementation of the CVA capital charge.
Market risk
The overall increase in market risk RWAs is primarily driven by the movement in risk levels, which includes changes in open positions and the market rates affecting these positions.
Operational risk
The movement in risk levels reflects the changes in loss experience, changes in the business environment and internal control factors.
Basel III leverage ratio
The Basel III capital reforms included a non-risk-based capital metric, the leverage ratio, to supplement risk-based capital requirements. On January 12, 2014, the BCBS issued the full text of its leverage ratio framework.
The leverage ratio is defined as the Capital Measure (Tier 1 capital) divided by the Exposure Measure. The Exposure Measure includes the sum of:
| (i) | On-balance sheet assets less Tier 1 capital regulatory adjustments; |
| (ii) | Derivative exposures as specified under the rules; |
| (iii) | Securities financing transaction exposures with a limited form of netting under certain conditions; and |
| (iv) | Other off-balance sheet exposures (commitments, direct credit substitutes, letters of credit, and securitization exposures). |
Items deducted from Tier 1 capital will be excluded from the Exposure Measure.
On October 30, 2014, OSFI issued the final “Leverage Requirements Guideline” outlining the implementation of the Basel III leverage ratio framework in Canada effective November 2014. The Basel III leverage ratio replaces the assets-to-capital multiple test. Federally regulated deposit-taking institutions are expected to have Basel III leverage ratios that meet or exceed 3%.
The BCBS required banks to disclose their leverage ratio beginning in 2015. The document states that the BCBS will continue to assess whether a minimum requirement of 3% for the leverage ratio is appropriate. Any final adjustments to the rule will be made by 2017, for implementation on January 1, 2018. Information on CIBC’s leverage ratio is included in the table below.
| | | | | | | | | | |
| $ millions, as at | | | | 2015 Oct. 31 | | | 2015 Jul. 31 | |
Transitional basis | | | | | | | | | | |
Tier 1 capital | | A | | $ | 20,671 | | | $ | 20,416 | |
Leverage ratio exposure | | B | | | 503,504 | | | | 494,297 | |
Leverage ratio | | A/B | | | 4.1 | % | | | 4.1 | % |
All-in basis | | | | | | | | | | |
Tier 1 capital | | C | | $ | 19,520 | | | $ | 19,284 | |
Leverage ratio exposure | | D | | | 502,552 | | | | 493,475 | |
Leverage ratio | | C/D | | | 3.9 | % | | | 3.9 | % |
Leverage ratio (All-in basis)
The leverage ratio was comparable with July 31, 2015. An increase in Tier 1 capital, which primarily resulted from internal capital generation and higher AOCI, was offset by higher leverage exposures, mainly driven by an increase in on-balance sheet exposures.
Continuous enhancement to risk-based capital requirements
The BCBS has published a number of proposals for changes to the existing risk-based capital requirements, and continues to do so with the objective of clarifying and increasing the capital requirements for certain business activities. Since the start of the fiscal year, the BCBS has published the following proposals.
A consultative document, “Review of the Credit Valuation Adjustment Risk Framework”, was issued by the BCBS in July 2015. The document proposes a framework that considers the market risk exposure component of CVA along with its associated hedges. The regulatory capital requirement for CVA risk would be based on exposure models used to determine accounting CVA, subject to conditions. The conditions are intended to reduce potential variability from RWA calculations or other discrepancies in financial reporting practices across banks and jurisdictions. The document did not specify an implementation date.
In June 2015, the BCBS issued “Interest rate risk in the banking book”, a consultative document. This document proposes changes to the regulatory capital treatment and supervision of interest rate risk in the banking book, which would apply to large internationally active banks on a consolidated basis. The changes aim to promote sufficient capital to cover potential losses from exposures to changes in interest rates, and to limit incentives for capital arbitrage between the banking and trading books. There are two options presented in the document: a standardized Pillar 1 approach for minimum capital requirements, and an enhanced Pillar 2 approach. The timeline for implementation has not been provided at this point.
During December 2014, the BCBS finalized revisions to the securitization framework, which aim to strengthen the capital standards for securitization exposures, with an effective date of January 2018.
The BCBS has announced its intention to improve the consistency and comparability of bank capital ratios by reducing excessive variability in RWA calculations, and issued two consultative documents in December 2014 to promote this objective. “Revisions to the standardized approach for credit risk” proposes to reduce reliance on external credit ratings, increase risk sensitivity, reduce national discretion, strengthen the link between the standardized approach and the internal ratings-based approach, and enhance comparability across banks. “Capital floors: the design of a framework based on standardized approaches” focuses on the concept of the capital floor, which is designed to mitigate model risk and measurement errors stemming from internal models, to address excessive variability in RWA calculations between banks.
| | | | |
| CIBC2015 ANNUAL REPORT | | | 35 | |
|
Management’s discussion and analysis |
The BCBS continues to review operational risk capital frameworks to provide an optimal balance between simplicity, comparability, and risk sensitivity. After further consultation with industry participants, BCBS is considering a new standardized approach which would potentially affect current methods used to calculate operational risk capital.
CIBC will continue to monitor and prepare for developments in these areas.
Revised Pillar 3 disclosure requirements
In January 2015, the BCBS issued the final standard for “Revised Pillar 3 disclosure requirements”. The document sets out the first phase of a two-phase project by the BCBS to replace existing Pillar 3 disclosure requirements for credit (including counterparty credit), market, operational, interest rate and securitization risks. Pillar 3 aims to promote market discipline through regulatory disclosure requirements, in order to improve comparability and consistency of disclosures and increase transparency and confidence about a bank’s exposure to risk and the overall adequacy of its regulatory capital.
CIBC continues to monitor the requirements and prepare for developments in this area.
Taxpayer Protection and Bank Recapitalization Regime
The Department of Finance published a consultation paper on August 1, 2014 on the Taxpayer Protection and Bank Recapitalization (bail-in) regime. The overarching policy objective is to preserve financial stability while protecting taxpayers in the event of a large bank (D-SIB) failure. The bail-in regime is designed to enable the expedient conversion, in whole or in part, of certain bank liabilities (bail-in debt) into common equity, thus ensuring that the D-SIB emerges from conversion as adequately capitalized. Bail-in debt includes long-term senior unsecured debt that is tradable and transferable, and has an original term to maturity of over 400 days. Consumer deposits are excluded. The rules would not be applied retroactively to liabilities outstanding as of the implementation date.
Upon the determination by the Superintendent of Financial Institutions that the bank has ceased, or is about to cease, to be viable, all or a portion of the bail-in debt may be converted into common equity. In addition, all capital instruments that meet the Basel III requirements for absorption of loss at the point of non-viability must be converted into common equity.
The conversion formula has yet to be determined, but it will be set in advance through regulation or guidance. The proposal specifies that the hierarchy of claims between bail-in debt holders and capital providers (including NVCC subordinated debenture holders and preferred shareholders) would be respected such that the bail-in debt holders would receive economic entitlements more favourable than capital providers.
A Higher Loss Absorbency (HLA) requirement of 17%-23% of RWA was proposed as a measure to ensure that D-SIBs can withstand severe but plausible losses and emerge from a conversion as adequately capitalized with a buffer above target capital requirements. This requirement would be met through the sum of a bank’s capital instruments (common equity and NVCC instruments) and bail-in debt. A phase-in period for meeting the HLA requirement will be provided in order to allow for a smooth transition for affected market participants.
The 2015 Canadian federal budget, released on April 21, 2015, confirmed the Government of Canada’s intention to implement a Taxpayer Protection and Bank Recapitalization (bail-in) regime. Although the budget paper did not include details of implementation, the key features noted were largely consistent with the August 1, 2014 consultation paper.
Capital management and planning
Basel establishes a framework for a bank’s Internal Capital Adequacy Assessment Process (ICAAP) which includes oversight by the Board of Directors (the Board). Our capital management policy, established by the Board, is reviewed and re-approved each year in support of the ICAAP. The policy includes specific guidelines that relate to capital strength, capital mix, dividends and return of capital, and the unconsolidated capital adequacy of regulated entities. The key guidelines relate to capital strength and mix – the former being the overriding guideline, while the latter specifically relates to cost. CIBC’s guideline on dividends and return of capital is intended to balance the need for retaining capital for strength and growth, while providing an adequate return to our shareholders.
The guidelines are not intended to be inflexible, but to provide guidance on expectations under a typical operating environment, and to flag circumstances when actual results vary significantly from the guidelines. In certain cases, the guidelines are also guiding principles used in the creation of the annual Capital Plan.
Capital needs to be monitored and rebalanced continually: retained earnings grow, term instruments mature or are redeemed, share options are exercised, and the environment changes. Furthermore, capital needs may change in relation to CIBC’s appetite for risk. Capital planning is a crucial element in our ability to achieve our desired strategic objectives; accordingly, the policy and guidelines, which provide the guidance for prudent and sound capital management practices, govern the annual Capital Plan. Each year a Capital Plan and three-year outlook are established, which encompass all of the associated elements of capital: forecasts of sources and uses, maturities, redemptions, new issuances, corporate initiatives and business growth. The annual Capital Plan establishes targets for the coming year and action plans to achieve those targets. The Capital Plan also relates the level of capital to our level of risk, both in a normal and a stressed environment. There is a comprehensive process to monitor and report the capital position against the targets.
We perform a sensitivity analysis and stress testing of our regulatory capital metrics with respect to changes in asset levels and profit levels in accordance with enterprise-wide stress testing scenarios discussed further below.
Capital initiatives
The following main capital initiatives were undertaken in 2015:
Normal course issuer bid
On September 16, 2015, we announced that the Toronto Stock Exchange had accepted the notice of CIBC’s intention to commence a normal course issuer bid (NCIB). Purchases under this bid will terminate upon the earlier of (i) CIBC purchasing up to a maximum of 8 million common shares, (ii) CIBC providing a notice of termination, or (iii) September 17, 2016. We purchased and cancelled 115,900 common shares under this bid at an average price of $96.69 for a total amount of $11 million.
Our previous NCIB expired on September 8, 2015. No common shares were purchased under this bid. See Note 15 to the consolidated financial statements for additional information.
Dividends
On December 2, 2015, the Board approved an increase in our quarterly common share dividend from $1.12 per share to $1.15 per share for the quarter ending January 31, 2016.
Our quarterly common share dividend was increased from $1.09 per share to $1.12 per share for the quarter ended October 31, 2015, from $1.06 per share to $1.09 per share for the quarter ended July 31, 2015, from $1.03 per share to $1.06 per share for the quarter ended April 30, 2015, and from $1.00 per share to $1.03 per share for the quarter ended January 31, 2015.
| | |
| 36 | | CIBC2015 ANNUAL REPORT |
|
Management’s discussion and analysis |
Common and preferred share dividends are declared quarterly at the discretion of the Board. The declaration and payment of dividends is governed by Section 79 of theBank Act (Canada), the terms of the preferred shares, and the terms of the Tier 1 notes issued by CIBC Capital Trust, as explained in Notes 15 and 16 to the consolidated financial statements.
Preferred shares
On April 30, 2015, we redeemed all 13,232,342 Class A Preferred Shares Series 29 with a par value and redemption price of $25.00 per share for cash.
On March 11, 2015 we issued 12 million Non-cumulative Rate Reset Class A Preferred Shares Series 43 (NVCC) (Series 43 shares) with a par value of $25.00 per share, for gross proceeds of $300 million. See “Outstanding share data” section below and Note 15 to the consolidated financial statements for further details.
On January 31, 2015, we redeemed all of our 12 million Class A Preferred Shares Series 27 with a par value and redemption price of $25.00 per share for cash.
On December 16, 2014, we issued 12 million Non-cumulative Rate Reset Class A Preferred Shares Series 41 (NVCC) (Series 41 shares) with a par value of $25.00 per share, for gross proceeds of $300 million. See “Outstanding share data” section below and Note 15 to the consolidated financial statements for further details.
Subordinated debt
Subsequent to year end, on November 2, 2015, we redeemed all $1.5 billion of our 3.15% Debentures (subordinated indebtedness) due November 2, 2020. In accordance with their terms, the Debentures were redeemed at 100% of their principal amount, plus accrued and unpaid interest thereon.
On June 23, 2015, we purchased and cancelled $15 million (US$12 million) of our Floating Rate Debenture Notes Due 2084.
On April 30, 2015, we redeemed all $1.1 billion of our 4.11% Debentures (subordinated indebtedness) due April 30, 2020. In accordance with their terms, the Debentures were redeemed at 100% of their principal amount, plus accrued and unpaid interest thereon.
On January 14, 2015, we purchased and cancelled $25 million (US$21 million) of our Floating Rate Debenture Notes Due 2084.
Enterprise-wide stress testing
We perform enterprise-wide stress testing on a regular basis and the results are an integral part of our ICAAP, as defined by Pillar II of the Basel III Accord, wherein we identify and measure our risks on an ongoing basis in order to ensure that the capital available is sufficient to cover all risks across CIBC, including the impacts of stress testing. We maintain a process which determines plausible but stressed economic scenarios, and then apply these stress scenarios to our bank-wide exposures to determine the impact on the consolidated statement of income, RWA requirements, and consequently, key capital ratios. This helps us analyze the potential risks within our portfolios and establish prudent capital levels in excess of the regulatory minimum requirements. All of the elements of capital are monitored throughout the year and the Capital Plan is adjusted as appropriate.
Management determines the range of scenarios to be tested. Macroeconomic stress test scenarios are designed to be both severe and plausible and designed to be consistent with OSFI’s stress testing framework to ensure that they are comprehensive.
The following diagram summarizes the enterprise-wide stress testing process including the development of scenarios, identification of risk drivers and linkages to our other bank-wide ICAAP processes. The process includes syndication with our economists and the businesses to ensure scenarios are relevant to our businesses and there is a consistent interpretation of the scenarios across CIBC.
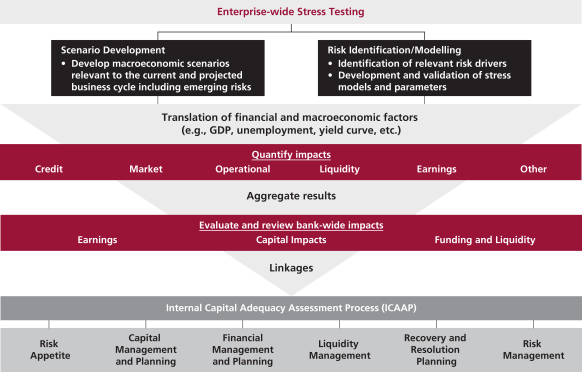
Stress test scenarios are designed to capture a wide range of macroeconomic and financial variables that are relevant to assess the impact on our specific portfolios. This includes, for example, GDP, unemployment, house prices, interest rates and equity prices.
The stress testing process is comprehensive using a bottom-up analysis of each of our portfolios. Our stress testing approach combines the use of statistical models and expert judgment to ensure the results are reasonable in estimating the impacts of the stress scenarios.
| | | | |
| CIBC2015 ANNUAL REPORT | | | 37 | |
|
Management’s discussion and analysis |
Stress testing methodologies and results are subject to a detailed review and challenge from both the businesses and Risk Management. Stress testing results are presented for review to the Risk Management Committee (RMC) and are also shared with the Board and OSFI. The results of our enterprise-wide stress testing are used to highlight any vulnerabilities and ensure we remain well capitalized against regulatory and management constraints.
A key objective of the enterprise-wide stress tests is to identify and foster discussion of management actions that would be taken to mitigate the impact of stress scenarios. Stress testing is also integrated into our recovery and resolution planning process.
Additional information on stress testing is provided in the “Management of risk” section.
Outstanding share data
The table below provides a summary of our outstanding shares, NVCC capital instruments, and the maximum number of common shares issuable on conversion/exercise:
| | | | | | | | | | | | | | | | |
| | | Shares outstanding | | | Minimum
conversion
price per
common share | | | Maximum number
of common shares
issuable on
conversion/exercise | |
| As at November 27, 2015 | | Number
of shares | | | $ millions | | | |
Common shares (1) | | | 397,362,212 | | | $ | 7,820 | | | | | | | | | |
Preferred Shares(2)(3) | | | | | | | | | | | | | | | | |
Series 39 (NVCC) | | | 16,000,000 | | | $ | 400 | | | $ | 5.00 | | | | 80,000,000 | |
Series 41 (NVCC) | | | 12,000,000 | | | | 300 | | | | 5.00 | | | | 60,000,000 | |
Series 43 (NVCC) | | | 12,000,000 | | | | 300 | | | | 5.00 | | | | 60,000,000 | |
Subordinated Debt(3)(4) | | | | | | | | | | | | | | | | |
3% Debentures due October 28, 2024 (NVCC) | | | n/a | | | | 1,000 | | | | 5.00 | | | | 300,000,000 | |
Stock options outstanding | | | | | | | | | | | | | | | 4,044,988 | |
Total | | | | | | $ | 2,000 | | | | | | | | 504,044,988 | |
| (1) | Net of treasury shares. |
| (2) | Upon the occurrence of a Trigger Event, each share is convertible into a number of common shares, determined by dividing the par value of $25.00 plus declared and unpaid dividends by the average common share price (as defined in the relevant prospectus supplement) subject to a minimum price per share (subject to adjustment in certain events as defined in the relevant prospectus supplement). Preferred shareholders do not have the right to convert their shares into common shares. |
| (3) | The maximum number of common shares issuable on conversion excludes the impact of declared but unpaid dividends and accrued interest. |
| (4) | Upon the occurrence of a Trigger Event, the debentures are convertible into a number of common shares, determined by dividing 150% of the par value plus accrued and unpaid interest by the average common share price (as defined in the relevant prospectus supplement) subject to a minimum price per common share (subject to adjustment in certain events as defined in the relevant prospectus supplement). |
The occurrence of a “Trigger Event”, as described in the capital adequacy guidelines, would result in conversion of all of the outstanding NVCC instruments described above, which would represent a dilution impact of 56% based on the number of CIBC common shares outstanding as at October 31, 2015.
Non-cumulative Rate Reset Class A Preferred Shares Series 39 (NVCC)
For the initial five year period to the earliest redemption date of July 31, 2019, the Non-cumulative Rate Reset Class A Preferred Shares Series 39 (NVCC) (Series 39 shares) pay quarterly cash dividends, if declared, at a rate of 3.90%. On July 31, 2019, and on July 31 every five years thereafter, the dividend rate will reset to be equal to the then current five-year Government of Canada bond yield plus 2.32%.
Holders of the Series 39 shares will have the right to convert their shares on a one-for-one basis into Non-cumulative Floating Rate Class A Preferred Shares Series 40 (NVCC) (Series 40 shares), subject to certain conditions, on July 31, 2019 and on July 31 every five years thereafter. Holders of the Series 40 shares will be entitled to receive a quarterly floating rate dividend, if declared, equal to the three-month Government of Canada Treasury Bill yield plus 2.32%. Holders of the Series 40 shares may convert their shares on a one-for-one basis into Series 39 shares, subject to certain conditions, on July 31, 2024 and on July 31 every five years thereafter.
Subject to regulatory approval and certain provisions of the shares, we may redeem all or any part of the then outstanding Series 39 shares at par on July 31, 2019, and on July 31 every five years thereafter; we may redeem all or any part of the then outstanding Series 40 shares at par on July 31, 2024, and on July 31 every five years thereafter.
Non-cumulative Rate Reset Class A Preferred Shares Series 41 (NVCC)
For the initial five year period to the earliest redemption date of January 31, 2020, the Series 41 shares pay quarterly cash dividends, if declared, at a rate of 3.75%. On January 31, 2020, and on January 31 every five years thereafter, the dividend rate will reset to be equal to the then current five-year Government of Canada bond yield plus 2.24%.
Holders of the Series 41 shares will have the right to convert their shares on a one-for-one basis into Non-cumulative Floating Rate Class A Preferred Shares Series 42 (NVCC) (Series 42 shares), subject to certain conditions, on January 31, 2020 and on January 31 every five years thereafter. Holders of the Series 42 shares will be entitled to receive a quarterly floating rate dividend, if declared, equal to the three-month Government of Canada Treasury Bill yield plus 2.24%. Holders of the Series 42 shares may convert their shares on a one-for-one basis into Series 41 shares, subject to certain conditions, on January 31, 2025 and on January 31 every five years thereafter.
Subject to regulatory approval and certain provisions of the shares, we may redeem all or any part of the then outstanding Series 41 shares at par on January 31, 2020 and on January 31 every five years thereafter; we may redeem all or any part of the then outstanding Series 42 shares at par on January 31, 2025 and on January 31 every five years thereafter.
Non-cumulative Rate Reset Class A Preferred Shares Series 43 (NVCC)
For the initial five year period to the earliest redemption date of July 31, 2020, the Series 43 shares pay quarterly cash dividends, if declared, at a rate of 3.60%. On July 31, 2020, and on July 31 every five years thereafter, the dividend rate will reset to be equal to the then current five-year Government of Canada bond yield plus 2.79%.
Holders of the Series 43 shares will have the right to convert their shares on a one-for-one basis into Non-cumulative Floating Rate Class A Preferred Shares Series 44 (NVCC) (Series 44 shares), subject to certain conditions, on July 31, 2020 and on July 31 every five years thereafter. Holders of the Series 44 shares will be entitled to receive a quarterly floating rate dividend, if declared, equal to the three-month Government of Canada Treasury Bill yield plus 2.79%. Holders of the Series 44 shares may convert their shares on a one-for-one basis into Series 43 shares, subject to certain conditions, on July 31, 2025 and on July 31 every five years thereafter.
| | |
| 38 | | CIBC2015 ANNUAL REPORT |
|
Management’s discussion and analysis |
Subject to regulatory approval and certain provisions of the shares, we may redeem all or any part of the then outstanding Series 43 shares at par on July 31, 2020 and on July 31 every five years thereafter; we may redeem all or any part of the then outstanding Series 44 shares at par on July 31, 2025 and on July 31 every five years thereafter.
Off-balance sheet arrangements
We enter into off-balance sheet arrangements in the normal course of our business. We consolidate all of our sponsored trusts that securitize our own assets with the exception of the commercial mortgage securitization trust.
CIBC-sponsored conduits
We manage and administer a single-seller conduit and several CIBC-sponsored multi-seller conduits in Canada. Our multi-seller conduits acquire direct or indirect ownership or security interests in pools of financial assets from our clients and finance the acquisitions by issuing ABCP to investors. Our single-seller conduit acquires financial assets and finances these acquisitions through a credit facility provided by a syndicate of financial institutions. The sellers to the conduits may continue to service the assets and may be exposed to credit losses realized on these assets, typically through the provision of over-collateralization or another form of retained interest. The conduits may obtain credit enhancement from third-party providers.
We generally provide the multi-seller conduits with commercial paper backstop liquidity facilities, securities distribution, and provide both the single and multi-seller conduits with accounting, cash management, and operations services. The liquidity facilities for our managed and administered multi-seller conduits require us to provide funding, subject to the satisfaction of certain conditions with respect to the conduits, for ABCP not placed with external investors. We also may purchase ABCP issued by our multi-seller conduits for market making purposes.
We are required to maintain certain short-term and/or long-term debt ratings with respect to the liquidity facilities that we provide to our own sponsored multi-seller conduits. If we are downgraded below the level specified under the terms of those facilities, we must provide alternative satisfactory liquidity arrangements, such as procuring an alternative liquidity provider that meets the minimum rating requirements.
We may also act as the counterparty to derivative contracts entered into by a multi-seller conduit in order to convert the yield of the underlying assets to match the needs of the multi-seller conduit’s investors or to mitigate the interest rate, basis, and currency risk within the conduit.
We earn fees for providing services related to the non-consolidated single-seller and multi-seller conduits, such as backstop liquidity facilities, distribution, transaction structuring, and conduit administration. These fees totalled $27 million in 2015 (2014: $21 million). All fees earned in respect of activities with the conduits are on a market basis.
As at October 31, 2015, the underlying collateral for various asset types in our multi-seller conduits amounted to $4.0 billion (2014: $2.7 billion). The estimated weighted-average life of these assets was 1.2 years (2014: 1.1 years). Our holdings of commercial paper issued by our non-consolidated sponsored multi-seller conduits that offer commercial paper to external investors were $59 million (2014: $4 million). Our committed backstop liquidity facilities to these conduits were $4.9 billion (2014: $4.0 billion). We also provided credit facilities of $40 million (2014: $30 million) to these conduits.
We participated in a syndicated facility for a three-year commitment of $575 million to our single-seller conduit that provides funding to franchisees of a major Canadian retailer. Our portion of the commitment was $105 million (2014: $105 million). As at October 31, 2015, we funded $94 million (2014: $81 million) through the issuance of bankers’ acceptances and prime loans.
We engage one or more of the four major rating agencies, Moody’s, DBRS Limited (DBRS), S&P, and Fitch Ratings, Inc. (Fitch), to opine on the credit ratings of ABS issued by our sponsored securitization vehicles. In the event that ratings differ between rating agencies we use the lower rating.
Our on- and off-balance sheet amounts related to the structured entities (SEs) that are not consolidated are set out in the table below. For additional details on our SEs, see Note 6 to the consolidated financial statements.
| | | | | | | | | | | | | | | | | | | | | | | | |
| $ millions, as at October 31 | | 2015 | | | 2014 | |
| | | Investment
and loans (1) | | | Liquidity, credit
facilities and
commitments | | | Written
credit
derivatives (2) | | | Investment
and loans (1) | | | Liquidity, credit
facilities and
commitments | | | Written credit
derivatives (2) | |
Single-seller and multi-seller conduits | | $ | 153 | | | $ | 3,972 | (3) | | $ | – | | | $ | 85 | | | $ | 2,708 | (3) | | $ | – | |
Third-party structured vehicles – continuing | | | 3,490 | | | | 985 | | | | – | | | | 2,372 | | | | 833 | | | | – | |
Pass-through investment structures | | | 605 | | | | – | | | | – | | | | 2,019 | | | | – | | | | – | |
Commercial mortgage securitization trust | | | 13 | | | | – | | | | – | | | | 10 | | | | – | | | | – | |
CIBC Capital Trust | | | 7 | | | | 75 | | | | – | | | | 7 | | | | 72 | | | | – | |
CIBC-managed investment funds | | | – | | | | – | | | | – | | | | 20 | | | | – | | | | – | |
CIBC-structured CDO vehicles | | | 9 | | | | 27 | | | | 23 | | | | 28 | | | | 35 | | | | 64 | |
Third-party structured vehicles – run-off | | | 1,449 | | | | 57 | | | | 827 | | | | 2,436 | | | | 84 | | | | 1,597 | |
| (1) | Excludes securities issued by, retained interest in, and derivatives with entities established by CMHC, Federal National Mortgage Association, Federal Home Loan Mortgage Corporation, Government National Mortgage Association, Federal Home Loan Banks, Federal Farm Credit Bank, and Student Loan Marketing Association. $1.0 billion (2014: $1.9 billion) of the exposures related toCIBC-structured vehicles and third-party structured vehicles – run-off were hedged. |
| (2) | Disclosed amounts reflect the outstanding notional of written credit derivatives. The negative fair value recorded on the consolidated balance sheet was $214 million (2014: $241 million). Notional of $0.8 billion (2014: $1.5 billion) was hedged with credit derivatives protection from third parties. The fair value of these hedges net of CVA was $159 million (2014: $182 million). An additional notional of $52 million (2014: $52 million) was hedged through a limited recourse note. Accumulated fair value losses were $1 million (2014: $4 million) on unhedged written credit derivatives. |
| (3) | Excludes an additional $0.9 billion (2014: $1.3 billion) relating to our backstop liquidity facilities provided to the multi-seller conduits as part of their commitment to fund purchases of additional assets and $59 million (2014: $4 million) relating to our direct investments in the multi-seller conduits which we consider investment exposure. |
| | | | |
| CIBC2015 ANNUAL REPORT | | | 39 | |
|
Management’s discussion and analysis |
Other financial transactions
We are the sponsor of several mutual and pooled funds, in the form of trusts. We are the administrator of these funds. In addition, we may act in other capacities, including custodian, trustee, and broker. We earn fees at market rates from these trusts. We do not guarantee either principal or returns to investors in these funds, except in very limited circumstances. We act as a trustee of a number of personal trusts and have a fiduciary responsibility to act in the best interests of the beneficiaries of the trusts. We earn a fee for acting as a trustee. We also participate in transactions to modify the cash flows of trusts managed by third-party asset managers to create investments with specific risk profiles, or to assist clients in the efficient management of other risks. Typically, these involve the use of derivative products, which transfer the risks and returns to or from a trust.
Derivatives
We participate in derivatives transactions, as a market maker facilitating the needs of our clients or as a principal to manage the risks associated with our funding, investing and trading strategies. Since 2008, we have ceased activities in the following areas:
| • | | Credit derivative contracts with clients to enable them to create synthetic exposures to meet their needs; and |
| • | | Intermediation trades that assume credit risks of clients through credit derivatives, and in turn offset these risks by entering into credit derivative contracts with third-party financial institutions. |
All derivatives are recorded at fair value on our consolidated balance sheet. See Notes 12 and 24 to the consolidated financial statements for details on derivative contracts and the risks associated with them.
Credit-related arrangements
Credit-related arrangements are generally off-balance sheet instruments and are typically entered into to meet the financing needs of clients. In addition, there are certain exposures for which we could be obligated to extend credit that are not recorded on the consolidated balance sheet. For additional details of these arrangements, see the “Liquidity risk” section and Note 22 to the consolidated financial statements.
Guarantees
A guarantee is a contract that requires the issuer to make specified payments to reimburse the holder for a loss it incurs because a specified debtor failed to make payment when due in accordance with the original or modified terms of a debt instrument. Guarantees include standby and performance letters of credit and credit derivatives protection sold, as discussed in Notes 22 and 12 to the consolidated financial statements, respectively.
| | |
| 40 | | CIBC2015 ANNUAL REPORT |
|
Management’s discussion and analysis |
Management of risk
We have provided certain disclosures required under IFRS 7 “Financial Instruments – Disclosures” related to the nature and extent of risks arising from financial instruments in the MD&A, as permitted by that IFRS standard. These disclosures are included in the sections “Risk overview”, “Credit risk”, “Market risk”, “Liquidity risk”, “Operational risk”, “Reputation and legal risk”, and “Regulatory compliance risk”. These disclosures have been shaded and form an integral part of the consolidated financial statements.
| | |
| 41 | | Risk overview |
| 42 | | Risk governance structure |
| 43 | | Risk management structure |
| 44 | | Risk management process |
| 44 | | Risk appetite statement |
| 45 | | Risk policies and limits |
| 45 | | Risk identification and measurement |
| 46 | | Stress testing |
| 46 | | Risk treatment/mitigation |
| |
| 47 | | Top and emerging risks |
| |
48 | | Risks arising from business activities |
| |
49 | | Credit risk |
49 | | Governance and management |
49 | | Policies |
50 | | Process and control |
| | |
| 50 | | Risk measurement |
| 52 | | Exposure to credit risk |
| 55 | | Credit quality of portfolios |
| 57 | | Credit quality performance |
| 58 | | Exposure to certain countries and regions |
| 60 | | Selected exposures in certain selected activities |
60 | | Settlement risk |
| |
61 | | Market risk |
61 | | Governance and management |
61 | | Policies |
61 | | Process and control |
61 | | Risk measurement |
62 | | Trading activities |
65 | | Non-trading activities |
66 | | Pension risk |
| | |
| 67 | | Liquidity risk |
67 | | Governance and management |
67 | | Policies |
67 | | Process and control |
67 | | Risk measurement |
68 | | Liquid and encumbered assets |
70 | | Funding |
72 | | Contractual obligations |
| |
73 | | Other risks |
73 | | Strategic risk |
73 | | Insurance risk |
74 | | Operational risk |
75 | | Technology, information and cyber security risk |
75 | | Reputation and legal risk |
75 | | Regulatory compliance risk |
75 | | Environmental risk |
Risk overview
CIBC faces a wide variety of risks across all of its areas of business. Identifying and understanding risks and their impacts allows CIBC to frame its risk appetite and risk management practices. Defining acceptable levels of risk, and establishing sound principles, policies and practices for managing risks, is fundamental to achieving success in CIBC’s overall strategic imperative of delivering consistent and sustainable performance over the long term while remaining within our risk appetite.
Our risk appetite defines tolerance levels for various risks. This is the foundation for our risk management culture, and our risk management framework.
Our risk management framework includes:
| | • | | Board-approved risk appetite statements at the CIBC and SBU level; |
| | • | | Risk policies, procedures and limits to align activities with our risk appetite; |
| | • | | Regular risk reports to identify and communicate risk levels; |
| | • | | An independent control framework to identify and test compliance with key controls; |
| | • | | Stress testing to consider potential impacts of changes in the business environment on capital, liquidity and earnings; |
| | • | | Proactive consideration of risk mitigation options in order to optimize results; and |
| | • | | Oversight through our risk-focused committees and governance structure. |
Managing risk is a shared responsibility at CIBC. Business units and risk management professionals work in collaboration to ensure that business strategies and activities are consistent with our risk appetite. CIBC’s approach to enterprise-wide risk management aligns with the three lines of defence model:
| | (i) | CIBC’s lines of business and functional and support groups are responsible for all risks associated with their activities – this is the first line of defence; |
| | (ii) | As the second line of defence, CIBC’s Risk Management, Compliance and other oversight functions are responsible for independent oversight of the enterprise-wide risks inherent in CIBC’s business activities; and |
| | (iii) | As the third line of defence, CIBC’s internal audit function provides an independent assessment of the design and operating effectiveness of risk management controls, processes and systems. |
We continuously monitor our risk profile against our defined risk appetite and related limits, taking actions as needed to maintain an appropriate balance of risk and return. Monitoring our risk profile includes forward-looking analysis of sensitivity to local and global market factors, economic conditions, and political and regulatory environments that influence our overall risk profile.
Regular and transparent risk reporting and discussion at senior management committees facilitate communication of risks and discussion of risk management strategies across the organization.
| | | | |
| CIBC2015 ANNUAL REPORT | | | 41 | |
|
Management’s discussion and analysis |
Risk governance structure
There were changes made during the year to our risk governance structure. The current structure is illustrated below:
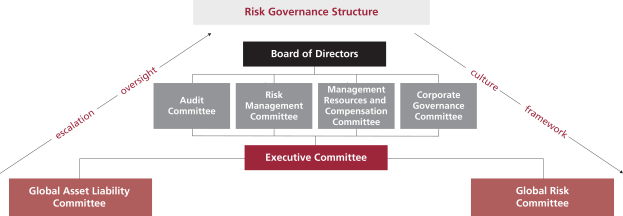
Board of Directors (the Board): The Board oversees the enterprise-wide risk management program through approval of our risk appetite and supporting risk management policies and limits. The Board accomplishes its mandate through its Audit, Risk Management, Management Resources and Compensation, and Corporate Governance committees, described below.
Audit Committee: The Audit Committee reviews the overall adequacy and the effectiveness of internal controls and the control environment, including controls over the risk management process.
Risk Management Committee (RMC): This committee assists the Board in fulfilling its responsibilities for defining CIBC’s risk appetite and overseeing CIBC’s risk profile and performance against the defined risk appetite. This includes oversight of policies, procedures and limits related to the identification, measurement, monitoring and controlling of CIBC’s principal business risks.
Management Resources and Compensation Committee (MRCC): This committee is responsible for assisting the Board in fulfilling its governance and supervisory responsibilities for strategic oversight of CIBC’s human capital, including organization effectiveness, succession planning and compensation, and the alignment of compensation with CIBC’s strategy of consistent and sustainable performance, its risk appetite and control framework.
Corporate Governance Committee: The primary function of the Corporate Governance Committee is to assist the Board in fulfilling its corporate governance oversight responsibilities.
Executive Committee (ExCo):The ExCo, led by the CEO, and including the executives reporting directly to the CEO, is responsible for setting business strategy and for monitoring, evaluating and managing risks across CIBC. The ExCo is supported by the following committees:
| | • | | Global Asset Liability Committee (GALCO): This committee, which comprises members from the ExCo and senior Treasury and Risk Management executives, provides oversight regarding capital management and liquidity management. It also provides strategic direction regarding structural interest rate risk and structural foreign exchange risk postures, approval of funds transfer pricing policies/parameters and approval of wholesale funding plans. GALCO is supported by four subcommittees – Liquidity Risk Management Committee, Asset Liability Management Committee, Capital Management Committee, and Funds Transfer Pricing Committee – that are composed of senior executives with business and oversight responsibilities for the respective activities. |
| | • | | Global Risk Committee (GRC): This committee, which comprises the ExCo and senior leaders from the lines of business, Risk Management and other infrastructure groups, provides a forum for discussion and oversight of risk appetite, risk profile and risk-mitigation strategies. Key activities include reviewing, and providing input regarding CIBC’s risk appetite statements; monitoring risk profile against risk appetite, reviewing, and evaluating business activities in the context of risk appetite; and identifying, reviewing, and advising on current and emerging risk issues and associated mitigation plans. |
| | |
| 42 | | CIBC2015 ANNUAL REPORT |
|
Management’s discussion and analysis |
Risk management structure
The Risk Management group, led by our Chief Risk Officer, is responsible for setting risk strategies and for providing independent oversight of the businesses. Risk Management works to identify, assess, mitigate, monitor and control the risks associated with business activities and strategies, and is responsible for providing an effective challenge to the lines of business.
There were changes made during the year to the Risk Management structure. The current structure is illustrated below.
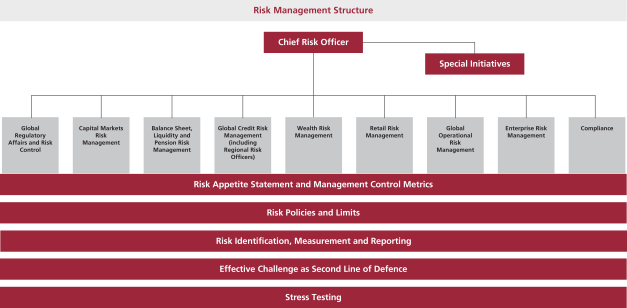
The Risk Management group performs several important activities including:
| • | | Developing CIBC’s risk appetite and associated management control metrics; |
| • | | Setting risk strategy to manage risks in alignment with our risk appetite and business strategy; |
| • | | Establishing and communicating risk policies, procedures and limits to control risks in alignment with risk strategy; |
| • | | Measuring, monitoring and reporting on risk levels; |
| • | | Identifying and assessing emerging and potential strategic risks; |
| • | | Deciding on transactions that fall outside of risk limits delegated to business lines; and |
| • | | Ensuring compliance with applicable regulatory and anti-money laundering requirements. |
The ten key groups within Risk Management, independent of the originating businesses, contribute to our management of risk:
| • | | Global Regulatory Affairs and Risk Control – This team provides expertise in risk, controls and regulatory reporting, and oversees regulatory interactions across CIBC to ensure coordinated communication and the effective development of and adherence to action plans. |
| • | | Capital Markets Risk Management – This unit provides independent oversight of the measurement, monitoring and control of market risks (both trading and non-trading), and trading credit risk for non-corporate counterparties across CIBC’s portfolios. |
| • | | Balance Sheet, Liquidity and Pension Risk Management – This unit has primary global accountability for providing an effective challenge and sound risk oversight to the treasury/liquidity management function within CIBC. |
| • | | Global Credit Risk Management – This unit includes our regional Chief Risk Officers, and is responsible for the adjudication and oversight of credit risks associated with our commercial and wholesale activities globally, management of the risks in our investment portfolios, as well as management of special loan portfolios. |
| • | | Wealth Risk Management – This unit is responsible for the independent governance and oversight of the wealth management business/activities in CIBC globally. |
| • | | Retail Risk Management – This unit oversees the management of credit risk in the retail lines of business (residential mortgages, credit cards, personal loans and lines of credit, small business loans). |
| • | | Global Operational Risk Management – This team has global accountability for the identification, measurement and monitoring of all operational risks, including locations, people, insurance, technology, subsidiaries/affiliates and vendors. |
| • | | Enterprise Risk Management – This unit is responsible for enterprise-wide analysis, including enterprise-wide stress testing and reporting, risk policy and governance, risk systems and models, as well as economic capital methodologies. |
| • | | Compliance – This unit provides timely and proactive advice and independent oversight of CIBC’s compliance with applicable regulatory andanti-money laundering requirements. |
| • | | Special Initiatives – This unit is responsible for assisting in the design, delivery and implementation of new initiatives aligned with Risk Management’s strategic plan, while enhancing internal client partnerships and efficiency. |
| | | | |
| CIBC2015 ANNUAL REPORT | | | 43 | |
|
Management’s discussion and analysis |
Risk management process
Our risk management process is illustrated below:
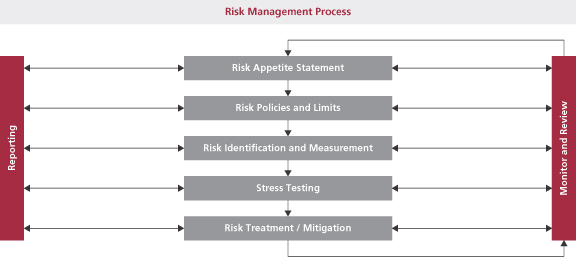
Risk appetite statement
CIBC’s risk appetite statement defines the amount of risk we are willing to assume in pursuit of our strategic and financial objectives. Our guiding principle is to practice sound risk management, supported by strong capital and funding positions, as we pursue our client-focused strategy. In defining our risk appetite, we take into consideration our vision, mission, values, and strategy, along with our risk capacity (defined by regulatory constraints). It defines how we conduct business, which is to be consistent with the following objectives:
| • | | Safeguarding our reputation and brand; |
| • | | Engaging in client-oriented businesses that we understand; |
| • | | Maintaining a balance between risk and returns; |
| • | | Retaining a conservative attitude towards tail and event risk; |
| • | | Meeting regulatory expectations and/or having plans in place to address any issues in a timely manner; and |
| • | | Achieving/maintaining an AA rating. |
Our CIBC risk appetite statement contains metrics with targets and limits that define our risk tolerance levels. In addition, we have SBU risk appetite statements that are integrated with the overall CIBC risk appetite statement that further articulate our business level risk tolerances.
Our CIBC risk appetite statement is reviewed annually in conjunction with our strategic, financial and capital planning cycle to ensure alignment and is approved annually by the Board. To help ensure CIBC stays within its risk appetite, the Board, Risk Management Committee of the Board, and senior management regularly receive and review reporting on our risk profile against the risk appetite targets and limits.
All strategic business decisions, as well as day-to-day business decisions, are governed by our risk appetite framework. Strategic decisions are evaluated through a due diligence process to ensure that the risk exposure is within our risk appetite; these decisions require approval from the ExCo and/or the Board before implementation. Day-to-day activities and decisions are governed by our framework of risk tolerance limits, policies, standards and procedures that support our risk appetite statement.
Risk culture
At CIBC, we strive to achieve a consistent and effective risk culture throughout the organization, promoted through both formal and informal channels. Each year, all employees are required to complete formal training on risk appetite, reputation risk, code of conduct, anti-money laundering and other key risk topics. By taking this mandatory training, all employees develop a basic knowledge of risk management in support of our risk culture. In addition to this mandatory training, we communicate all material related to risk culture (i.e., risk appetite statement, risk management priorities, principles, policies and procedures) through our internal website and internal news releases.
Risk input into compensation
At each year end, Risk Management provides an assessment of consolidated CIBC, Retail and Business Banking, Wealth Management and Capital Markets with respect to adherence to risk appetite. Risk Management also provides assessments on specific risk incidents which may directly impact individual compensation awards and/or performance ratings.
The MRCC oversees the performance rating and compensation process. The Committee is responsible for assisting the Board in fulfilling its governance and supervisory responsibilities for the strategic oversight of CIBC’s human capital and overseeing CIBC’s compensation policies, processes and practices. The Committee’s key compensation-related responsibilities include:
| • | | Establishing the compensation governance process; |
| • | | Reviewing an assessment of CIBC’s business performance against CIBC’s risk appetite, control environment, and the underlying risks associated with business performance; |
| • | | Approving and recommending for Board approval incentive compensation funding and allocations, based on an assessment of business performance and risk; |
| • | | Evaluating any discretionary adjustments that may be recommended by the CEO to better align pay and performance; |
| • | | Approving individual compensation for employees with compensation above a certain threshold; |
| • | | Approving and recommending for Board approval individual compensation for the ExCo and other key officers, including any discretionary adjustments to business multipliers and/or individual compensation recommendations; and |
| • | | Approving and recommending for Board approval new material incentive compensation plans or changes to existing material plans. |
| | |
| 44 | | CIBC2015 ANNUAL REPORT |
|
Management’s discussion and analysis |
Risk policies and limits
Our risk policies and limits framework is intended to ensure that risks are appropriately identified, measured, monitored and controlled in accordance with our risk appetite. For most risks, we have developed an overarching framework document that sets out the key principles for managing the associated risks and our key risk policies and limits. This framework is supported by standards, guidelines, processes, procedures and controls that govern day-to-day activities in our businesses. Oversight is provided by management committees, as well as the Board/Board Committees.
Key risk policies and limits are illustrated below.
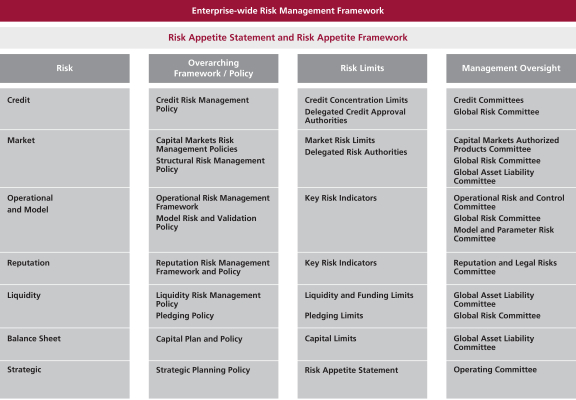
Risk identification and measurement
Risk identification and measurement are important elements of our risk management framework. Risk identification is a continuous process, generally achieved through:
| • | | Regular assessment of risks associated with lending and trading credit exposures; |
| • | | Ongoing monitoring of trading and non-trading portfolios; |
| • | | Assessment of risks in new business activities and processes; |
| • | | Assessment of risks in complex and unusual business transactions; and |
| • | | Regular monitoring of the overall risk profile considering market developments and trends, and external and internal events. |
Risk Management has developed a “Risk Register” to list all material risks facing CIBC. The inventory is based on the risks inherent in CIBC’s businesses, and updated through various processes, illustrated in the chart below, to reflect changes in the nature of the risks we are facing. The Risk Register is used as an input for our ICAAP, either explicitly in the economic and regulatory capital calculations, or implicitly through the buffer of actual capital over economic capital and regulatory capital.
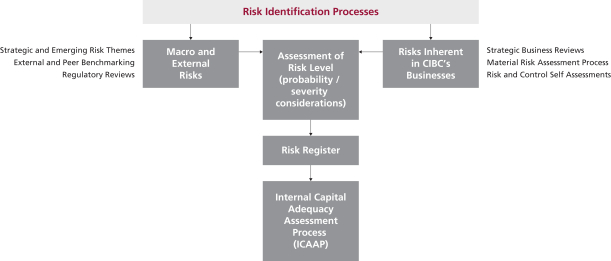
| | | | |
| CIBC2015 ANNUAL REPORT | | | 45 | |
|
Management’s discussion and analysis |
The decision to register a new risk is based on a risk assessment through our risk identification processes and includes criteria such as materiality, measurability and probability. Furthermore, the decision to hold capital for a new risk is also based on whether the risk is being mitigated, and whether capital is deemed to be a suitable mitigant.
We have enterprise-wide methodologies, models and techniques in place to measure both the quantitative and qualitative aspects of risks, appropriate for the various types of risks we face. These methodologies, models and techniques are subject to independent assessment and review to ensure that the underlying logic remains sound, that model risks have been identified and managed, that use of the models continues to be appropriate and outputs are valid.
Risk is usually measured in terms of expected loss, unexpected loss, and economic capital.
Expected loss
Expected loss represents the loss that is statistically expected to occur in the normal course of business in a given period of time.
In respect of credit risk, the parameters used to measure expected loss are PD, LGD, and EAD. These parameters are updated regularly and are based on our historical experience and benchmarking of credit exposures.
For trading market risks, VaR is a statistical technique used to measure risk. VaR is an estimate of the loss in market value for a given level of confidence that we would expect to incur in our trading portfolio due to an adverse one-day movement in market rates and prices. We also use stressed VaR to replicate our VaR over a period when relevant market factors are in distress.
For trading credit risks associated with market value based products, we use models to estimate exposure relative to the value of the portfolio of trades with each counterparty, giving consideration to market rates and prices.
Unexpected loss and economic capital
Unexpected loss is the statistical estimate of the amount by which actual losses might exceed expected losses over a specified time horizon, computed at a given confidence level. We use economic capital to estimate the level of capital needed to protect us against unexpected losses. Economic capital allows us to assess performance on a risk-adjusted basis.
We also use techniques such as sensitivity analysis and stress testing to help ensure that the risks remain within our risk appetite and that our capital is adequate to cover those risks. Our stress testing program includes evaluation of the potential effects of various economic and market scenarios on our risk profile, earnings and capital. Refer to the “Capital resources” section for additional details.
Model risk mitigation policies
We have policies, procedures, standards and controls that surround the introduction, independent review, usage and parameter selection of pricing and hedge ratio models, risk models (VaR, economic and regulatory capital), retail credit scoring models (e.g., application and behavioural scorecards), credit models for the calculation of loss severity, and models for monitoring of scorecard performance.
A model review and validation is the independent and ongoing documentary evidence that risk quantification and pricing models, rating or scoring systems and parameters are sound and CIBC can rely on its output. The following procedures provide evidence of this review:
| • | | Review of model documentation; |
| • | | Comprehensive, systematic testing of the model implementation with respect to pricing, hedge ratio, and parameter estimation routines (as applicable); |
| • | | Replication of the risk quantification process helps determine whether the model implementation is faithful to the model specifications; |
| • | | Review of the appropriateness and robustness of the model/parameter concepts and assumptions; |
| • | | Accuracy testing to assess the calibration and accuracy of the risk components including, for example, the discriminative power of rating systems and the reasonableness of capital parameters; |
| • | | Sensitivity testing is conducted to analyze the sensitivity of model/parameter outputs to model/parameter assumptions and key inputs; |
| • | | Scenario and stress testing of the model outputs to key inputs; |
| • | | Back-testing by comparing actual results with model-generated risk measures; |
| • | | Benchmarking to other models and comparable internal and external data; |
| • | | Reviewing the internal usage of the model/parameter applications to ensure consistency of application; |
| • | | Maintaining an inventory of regulatory models and parameters and reporting their status to the Model and Parameter Risk Committee; |
| • | | Maintaining a Risk Register to ensure that all material risks are captured to support the end-to-end validation of ICAAP methods; and |
| • | | A comprehensive report that identifies the conditions for valid application of the model and summarizing these findings for the Model and Parameter Risk Committee. |
Stress testing
Stress testing supplements our other risk management tools by providing an estimate of tail risk (i.e., low probability, high severity events). Results of stress testing are interpreted in the context of our risk appetite, including metrics for capital adequacy. Enterprise-wide stress testing, capital planning and financial planning processes are integrated for a comprehensive information system. See the “Financial condition” section for detailed discussion on our enterprise-wide stress testing.
Risk treatment/mitigation
Risk treatment/mitigation is the implementation of options for modifying risk levels. CIBC pursues risk mitigation options in order to control its risk profile in the context of risk appetite. CIBC’s objective is to proactively consider risk mitigation options in order to optimize results.
Discussions regarding potential risk mitigation strategies are held between Risk Management and the lines of business, and at the GRC or GALCO and at the RMC for governance and oversight, as appropriate. In evaluating possible strategies, considerations include costs and benefits, residual risks (i.e., risks that are retained), secondary risks (i.e., those caused by the risk mitigation actions), and appropriate monitoring and review to track results.
Risk controls
Our risk management framework also includes a comprehensive set of risk controls, designed to ensure that risks are being appropriately identified and managed. Our risk controls are part of CIBC’s overall Control Framework, developed based on the Committee of Sponsoring Organizations of the Treadway Commission’s (COSO) widely accepted “Internal Control – Integrated Framework”. The Control Framework also draws on elements of the OSFI Supervisory Framework and Corporate Governance Guidelines.
The Board, primarily through the RMC, approves certain risk limits and delegates specific transactional approval authorities to the CEO. The RMC must approve transactions that exceed delegated authorities. Onward delegation of authority by the CEO to business units is controlled to ensure decision-making
| | |
| 46 | | CIBC2015 ANNUAL REPORT |
|
Management’s discussion and analysis |
authorities are restricted to those individuals with the necessary experience levels. In addition, CIBC has rigorous processes to identify, evaluate and remediate
risk control deficiencies in a timely manner. Regular reporting is provided to the RMC to evidence compliance with risk limits. Risk limits are reviewed annually by the RMC, and the delegation of authority to the CEO is reviewed and approved annually by the Board.
Top and emerging risks
We monitor and review top and emerging risks that may affect our future results, and take action to mitigate potential risks if required. We performin-depth analyses, which can include stress testing our exposures relative to the risks, and provide updates and related developments to the Board on a regular basis. This section describes the main top and emerging risks that we consider with potential negative implications, as well as regulatory and accounting developments that are material for CIBC.
Technology, information and cyber security risk
Financial institutions like CIBC are evolving their business processes to leverage innovative technologies and the internet to improve client experience and streamline operations. At the same time, cyber threats and the associated financial, reputation and business interruption risks have also increased.
These risks continue to be actively managed by us through strategic risk reviews, enterprise-wide technology and information security programs, with the goal of maintaining overall cyber resilience that prevents, detects and responds to threats such as data breaches, unauthorized access and denial of service attacks.
Given the importance of electronic financial systems, including secure online and mobile banking provided by CIBC to its clients, CIBC continues to develop controls and processes to protect our systems and client information from damage and unauthorized disclosure. CIBC monitors the changing environment globally, including cyber threats and mitigation strategies. In addition, we benchmark against best practices and provide regular updates to the Board.
Despite our commitment to information and cyber security, CIBC and its related third parties may not be able to fully mitigate all risks associated with the increased complexity and high rate of change in the threat landscape. However, CIBC continuously monitors its risk posture for changes and continues to refine security protection approaches to minimize the impact of any incidents that may occur.
Disintermediation risk
Canadian banking clients are increasingly shifting their service transactions from branches to digital platforms. As such, competitive pressure from digital disruptors, both global technology leaders and smaller financial technology entrants, is increasing and the risk of disintermediation is growing due to the level of sophistication of these non-traditional competitors.
CIBC manages disintermediation risk through strategic risk reviews as well as investment in emerging channels, in data and analytics capabilities, and in technology and innovation in general, to meet our clients’ changing expectations, while working to reduce our cost structure and simplify operations.
Geo-political risk
The level of geo-political risk escalates at certain points in time. While the specific impact on the global economy would depend on the nature of the event, in general, any major event could result in instability and volatility, leading to widening spreads, declining equity valuations, flight to safe-haven currencies and increased purchases of gold. In the short run, market shocks could hurt the net income of our trading and non-trading market risk positions. Although Canada is unlikely to be directly subject to geo-political risk, the indirect impact of reduced economic growth, as well as potential impacts on commodity prices, could have serious negative implications for general economic and banking activities.
While it is impossible to predict where new geo-political disruption will occur, we do pay particular attention to markets and regions with existing or recent historical instability to assess the impact of these environments on the markets and businesses in which we operate.
Commodity prices
Commodity prices remain at low levels, due to decreased world demand. Lower commodity prices have placed pressure on corporate margins, which, in turn, have resulted in reduced Canadian tax revenues. There is growing concern that the slowdown in China will affect commodity prices for a longer period of time, resulting in potential stress for some companies in that sector.
So far, our overall commodity exposure continues to perform within our risk appetite. However, we have experienced some losses in our oil and gas portfolio as prices have remained weak. Clients in our oil and gas portfolio are currently being assessed on the basis of our enhanced risk metrics, and our portfolio is being monitored in a prudent manner. We continue to run our enterprise statistical stress tests at lower oil prices to determine potential direct losses, and have also conducted stress tests to assess the secondary impacts of lower oil prices on our retail portfolio for the affected regions, where we could see higher losses if unemployment continues to trend negatively.
Canadian consumer debt and the housing market
As a consequence of historically low interest rates, Canadians have increased debt levels at a pace that has exceeded growth in their income. Most of the increase in household debt levels has been driven by higher levels of mortgage debt, which is tied to the Canadian housing market. While interest rates are expected to remain relatively low in the foreseeable future, concerns remain that an external shock could affect the ability of Canadians to repay their loans, potentially triggering a correction in the housing market, which in turn could result in credit losses to banks.
Currently, we qualify all variable rate mortgage borrowers using the Bank of Canada 5-year fixed benchmark rate, which is typically higher than the variable rate by approximately two percentage points. If there were an interest rate increase, our variable rate borrowers should be able to withstand some increase in the interest rate. We believe the risk of a severe housing crash that generates significant losses for mortgage portfolios is unlikely, but the risk associated with high levels of consumer debt would be a concern should the economy falter and unemployment rates increase. For additional details on our credit risk mitigation strategies and real estate secured lending, see the “Real estate secured personal lending” section in Credit risk.
China economic policy risk
China’s economy continues to be on a slower growth trajectory, with third quarter GDP coming in at 6.9% according to official statistics. The Chinese government’s intervention in financial markets, including a currency devaluation, has led to heightened concern among international investors over economic conditions in China. While additional monetary and fiscal stimulus is likely to be required to shore up economic activity, short-term growth objectives may be tempered by the longer-term attempts to foster a more sustainable service-oriented and consumer-driven economy.
We continue to monitor economic policy both within the country and the region for signs of stress or directional change and have taken a prudent stance in addressing our tolerance for exposure to the country. We currently have little direct exposure to China, but any negative impact from the Chinese economic slowdown may affect clients that export to China or sell into a market where prices have been pushed down by weakness in Chinese demand, and may raise the credit risk associated with our exposure to trading counterparties.
| | | | |
| CIBC2015 ANNUAL REPORT | | | 47 | |
|
Management’s discussion and analysis |
European sovereign debt crisis
With the recent arrangement reached between Greece and the Eurozone leaders, the immediate danger of Greece exiting the Eurozone has been averted. While the European Central Bank’s quantitative easing programme has reduced the pressure on peripheral bond yields and improved credit markets, growth in the Eurozone remains slow. The European Central Bank has indicated that it will consider expanding its asset-purchase programme, should the Eurozone’s recovery be threatened by a slowdown in emerging markets.
We actively monitor and assess both the business and geo-political environment in Europe for adverse developments. Key to this is maintaining an active presence in the region to ensure that we are able to respond to both qualitative and quantitative data in a robust and timely manner. For additional details on our European credit risk exposure, see the “Exposure to certain countries and regions” section.
Regulatory developments
See the “Capital resources”, “Liquidity risk” and “Accounting and control matters” sections for additional information on regulatory developments.
Accounting developments
See the “Accounting and control matters” section and Note 32 to the consolidated financial statements for additional information on accounting developments.
Risks arising from business activities
The chart below shows our business activities and related risk measures based upon regulatory RWAs and economic capital as at October 31, 2015:
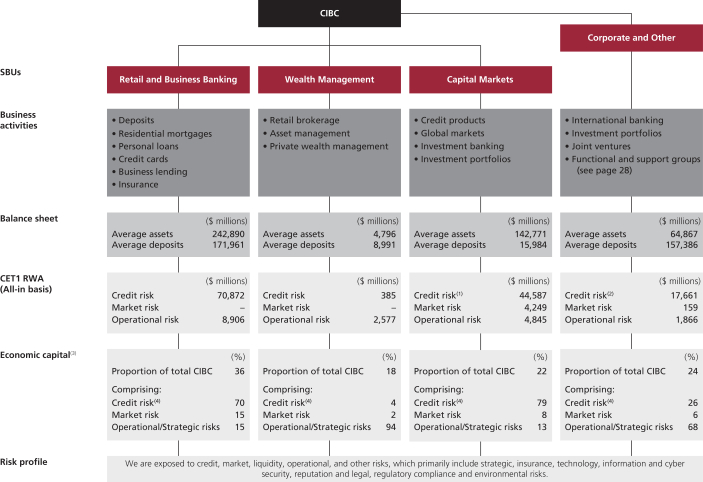
| (1) | Includes counterparty credit risk of $7,404 million, which comprises derivatives and repo-style transactions. |
| (2) | Includes counterparty credit risk of $494 million, which comprises derivatives and repo-style transactions. |
| (3) | For additional information, see the “Non-GAAP measures” section. |
| (4) | Includes investment risk. |
| | |
| 48 | | CIBC2015 ANNUAL REPORT |
|
Management’s discussion and analysis |
Credit risk
Credit risk is the risk of financial loss due to a borrower or counterparty failing to meet its obligations in accordance with contractual terms.
Credit risk arises mainly from our Retail and Business Banking and our Capital Markets lending businesses. Other sources of credit risk include our trading activities, including our OTC derivatives, debt securities, and our repo-style transaction activity. In addition to losses on the default of a borrower or counterparty, unrealized gains or losses may occur due to changes in the credit spread of the counterparty, which could impact the carrying or fair value of our assets.
Governance and management
Credit risk is managed through the three lines of defence model. Front line businesses are responsible for originating and managing the risk – this is the first line of defence.
The second line of defence is Risk Management, which provides enterprise-wide adjudication. Adjudication and portfolio management decisions are based on our risk appetite, as reflected in our policies, standards, and limits. Credit approval authorities are controlled to ensure decisions are made by qualified personnel. In addition to Risk Management, Compliance and other oversight functions provide independent oversight of the management of credit risk in our credit portfolios.
Internal Audit provides the third line of defence, by providing independent assessment of the design and operating effectiveness of the risk management controls, processes and systems.
Senior management reports to the GRC and RMC at least quarterly on material credit risk matters, including material credit transactions, compliance with limits, portfolio trends, impaired loans and credit loss provisioning levels. Provision for credit losses is reviewed by the RMC and the Audit Committee quarterly.
Policies
Credit concentration limits
At a bank-wide level, credit exposures are managed to promote alignment to our risk appetite statement, to maintain the target business mix and to ensure that there is no undue concentration of risk. We set limits to control borrower concentrations by risk rating band for large exposures (i.e., risk rated credits). Direct loan sales, credit derivative hedges, or structured transactions may also be used to reduce concentrations. We also have a set of portfolio concentration limits in place to control exposures by country, industry, product and activity. Further, our policies require limits to be established as appropriate for new initiatives and implementation of strategies involving material levels of credit risk. Concentration limits represent the maximum exposure levels we wish to hold on our books. In the normal course, it is expected that exposures will be held at levels below the maximums. The credit concentration limits are reviewed and approved by the RMC at least annually.
Credit concentration limits are also applied to our retail lending portfolios to mitigate concentration risk. We not only have concentration limits to individual borrowers and geographic regions, but also to different types of credit facilities, such as, unsecured credits, rental occupancy purpose credits, condominium secured credits and mortgages with a second or third charge where we are behind another lender. In addition, we limit the maximum insured mortgage exposure to private insurers in order to reduce counterparty risk.
Credit risk mitigation
We may mitigate credit risk by obtaining a pledge of collateral, which improves recoveries in the event of a default. Our credit risk management policies include verification of the collateral and its value and ensuring that we have legal certainty with respect to the assets pledged. Valuations are updated periodically depending on the nature of the collateral, legal environment, and the creditworthiness of the counterparty. The main types of collateral include: (i) cash or marketable securities for securities lending and repurchase transactions; (ii) cash or marketable securities taken as collateral in support of our OTC derivatives activity; (iii) charges over operating assets such as inventory, receivables and real estate properties for lending to small business and commercial borrowers; and (iv) mortgages over residential properties for retail lending.
In certain circumstances we may use third-party guarantees to mitigate risk. We also obtain insurance to reduce the risk in our real estate secured lending portfolios, the most material of which relates to the portion of our residential mortgage portfolio that is insured by CMHC, an agency of the Government of Canada.
We mitigate the credit risk of OTC derivatives with counterparties by employing the International Swaps and Derivatives Association (ISDA) Master Agreement, as well as Credit Support Annexes (CSAs) or similar agreements.
ISDA Master Agreements facilitate cross transaction payments, prescribe close-out netting processes, and define the counterparties’ contractual trading relationship. In addition, the agreements formalize non-transaction specific terms. Master Agreements serve to mitigate our credit risk by outlining default and termination events, which enable parties to close out of all outstanding transactions in the case of a negative credit event on either party’s side. The mechanism for calculating termination costs in the event of a close out are outlined in the Master Agreement; this allows for the efficient calculation of a single net obligation of one party to another.
CSAs are often included in ISDA Master Agreements. They mitigate counterparty credit risk by providing for the exchange of collateral between parties when a party’s exposure to the other exceeds agreed upon thresholds, subject to a minimum transfer amount. CSAs also designate acceptable collateral types, and set out rules for re-hypothecation and interest calculation on collateral.
Consistent with global initiatives to improve resilience in the financial system, we will clear derivatives through central counterparties (CCPs) where feasible. Credit derivatives may be used to reduce industry sector concentrations and single-name exposure.
| | | | |
| CIBC2015 ANNUAL REPORT | | | 49 | |
|
Management’s discussion and analysis |
Forbearance policy
We employ forbearance techniques to manage client relationships and to minimize credit losses due to default, foreclosure or repossession. In certain circumstances, it may be necessary to modify a loan for economic or legal reasons related to a borrower’s financial difficulties and we may grant a concession in the form of below-market rates or terms that would not otherwise be considered, for the purpose of maximizing recovery of our exposure to the loan. In circumstances where the concession is considered below market, the modification is reported as a troubled debt restructuring (TDR). TDRs are subject to our normal quarterly impairment review which considers, amongst other factors, covenants and/or payment delinquencies. An appropriate level of loan loss provision by portfolio segment is then established.
In retail lending, forbearance techniques include interest capitalization, amortization amendments and debt consolidations. We have a set of eligibility criteria which allow our Client Account Management team to determine suitable remediation strategies and propose products based on each borrower’s situation. While these solutions often provide more favourable conditions than those originally provided and are intended to increase the ability of borrowers to service their obligation to CIBC overall, we consider these solutions to be at market and comparable to terms and conditions we would have offered to new clients with comparable credit ratings.
The solutions available to corporate and commercial clients vary based on the individual nature of the client’s situation and are undertaken selectively where it has been determined that the client has or is likely to have repayment difficulties servicing its obligations. Covenants often reveal changes in the client’s financial situation before there is a change in payment behaviour and typically allow for a right to reprice or accelerate payments. Solutions may be temporary in nature or may involve other special management options.
During the year, $28 million (2014: $100 million) of loans have undergone TDR.
Process and control
The credit approval process is centrally controlled, with all significant credit requests submitted to a credit adjudication group within Risk Management that is independent of the originating businesses. Approval authorities are a function of the risk and amount of credit requested. In certain cases, credit requests must be referred to the Credit Committee, a subcommittee of the GRC, or to the RMC for approval.
After initial approval, individual credit exposures continue to be monitored, with a formal risk assessment, including review of assigned ratings, documented at least annually. Higher risk-rated accounts are subject to closer monitoring and are reviewed at least quarterly. Collections and specialized loan workout groups handle the day-to-day management of high risk loans to maximize recoveries.
Risk measurement
Exposures subject to AIRB approach
Business and government portfolios (excluding scored small business) – risk-rating method
This section describes the portfolio rating categories. The portfolio comprises exposures to corporate, sovereign, and bank obligors. Our adjudication process and criteria includes assigning an obligor rating that reflects our estimate of the financial strength of the borrower, and a facility rating that reflects the security applicable to the exposure.
The obligor rating takes into consideration our financial assessment of the obligor, the industry, and the economic environment of the region in which the obligor operates. Where a guarantee from a third-party exists, both the obligor and the guarantor will be assessed. While our obligor rating is determined independently of external ratings for the obligor, our risk-rating methodology includes a review of those external ratings.
A mapping between our internal ratings and the ratings used by external ratings agencies is presented in the table below.
| | | | | | | | | | | | | | | | | | | | | | | | | | | | | | | | | | | | |
| Corporate and Banks | | | | | Sovereigns | |
Grade | | | PD bands | | |
| CIBC
rating |
| |
| S&P
equivalent |
| |
| Moody’s
equivalent |
| | | | Grade | | | PD bands | | |
| CIBC
rating |
| |
| S&P
equivalent |
| |
| Moody’s
equivalent |
|
Investment grade | | | 0.03% – 0.42% | | | | 10 – 47 | | | | AAA to BBB- | | | | Aaa to Baa3 | | | | | Investment grade | | | 0.01% – 0.42% | | | | 00 – 47 | | | | AAA to BBB- | | | | Aaa to Baa3 | |
Non-investment grade | | | 0.43% – 12.11% | | | | 51 – 67 | | | | BB+ to B- | | | | Ba1 to B3 | | | | | Non-investment grade | | | 0.43% – 12.11% | | | | 51 – 67 | | | | BB+ to B- | | | | Ba1 to B3 | |
Watch list | | | 12.12% – 99.99% | | | | 70 – 80 | | | | CCC+ to C | | | | Caa1 to Ca | | | | | Watch list | | | 12.12% – 99.99% | | | | 70 – 80 | | | | CCC+ to C | | | | Caa1 to Ca | |
Default | | | 100% | | | | 90 | | | | D | | | | C | | | | | Default | | | 100% | | | | 90 | | | | D | | | | C | |
We use quantitative modelling techniques to assist in the development of internal risk-rating systems. The risk-rating systems have been developed through analysis of internal and external credit risk data. The risk ratings are used for portfolio management, risk limit setting, product pricing, and in the determination of economic capital.
Our credit process is designed to ensure that we approve applications and extend credit only where we believe that our client has the ability to repay according to the agreed terms and conditions. Embedded in our credit policies and criteria is an assessment of risk exposure using the following three dimensions:
| | • | | PD – the probability that the obligor will default within the next 12 months. | |
| | • | | EAD – the estimate of the amount which will be drawn at the time of default. | |
| | • | | LGD – the expected severity of loss as the result of the default, expressed as a percentage of the EAD. | |
Our credit framework of policies and limits defines our appetite for exposure to any single name or group of related borrowers, which is a function of the internal risk rating. We generally extend new credit only to borrowers in the investment and non-investment grade categories noted above. Our credit policies are also defined to manage our exposure to concentration in borrowers in any particular industry or region.
A simplified risk-rating process (slotting approach) is used for uninsured Canadian commercial mortgages, which comprise non-residential mortgages and multi-family residential mortgages. These exposures are individually rated on our rating scale using a risk-rating methodology that considers the property’s key attributes, which include its loan-to-value (LTV) and debt service ratios, the quality of the property, and the financial strength of the owner/sponsor. All exposures are secured by a lien over the property. In addition, we have insured multi-family residential mortgages, which are not treated under the slotting approach, but are instead treated as sovereign exposures.
| | |
| 50 | | CIBC2015 ANNUAL REPORT |
|
Management’s discussion and analysis |
Retail portfolios
Retail portfolios are characterized by a large number of relatively small exposures. They comprise: real estate secured personal lending (residential mortgages and personal loans and lines secured by residential property); qualifying revolving retail exposures (credit cards and unsecured lines of credit); and other retail exposures (loans secured by non-residential assets, unsecured loans including student loans, and scored small business loans).
We use scoring models in the adjudication of new retail credit exposures, which are based on statistical methods of analyzing the unique characteristics of the borrower, to estimate future behaviour. In developing our models, we use internal historical information from previous borrowers, as well as information from external sources, such as credit bureaus. The use of credit scoring models allows for consistent assessment across borrowers. There are specific guidelines in place for each product, and our adjudication decision will take into account the characteristics of the borrower, any guarantors, and the quality and sufficiency of the collateral pledged (if any). The documentation required as part of the lending process will include satisfactory identification, proof of income, independent appraisal of the collateral, and registration of security, as appropriate.
Retail portfolios are managed as pools of homogeneous risk exposures, using external credit bureau scores and/or other behavioural assessments to group exposures according to similar credit risk profiles. These pools are assessed through statistical techniques, such as credit scoring and computer-based models. Characteristics used to group individual exposures vary by asset category; as a result, the number of pools, their size, and the statistical techniques applied to their management differ accordingly.
The following table maps the PD bands to various risk levels:
| | | | |
| Risk level | | PD bands | |
Exceptionally low | | | 0.01% – 0.20% | |
Very low | | | 0.21% – 0.50% | |
Low | | | 0.51% – 2.00% | |
Medium | | | 2.01% – 10.00% | |
High | | | 10.01% – 99.99% | |
Default | | | 100% | |
Back-testing
We monitor the three key risk parameters – PD, EAD, and LGD – on a monthly basis. Every quarter, the back-testing results are reported to OSFI and are presented to the business and Risk Management senior management for review and challenge. For each parameter, we identify any portfolios whose realized values are significantly above or significantly below expectations and then test to see if this deviation is explainable by changes in the economy. If the results indicate that a parameter model may be losing its predictive power, we prioritize that model for review and update.
Stress testing
As part of our regular credit portfolio management process, we conduct stress testing and scenario analyses on our portfolio to quantitatively assess the impact of various historical, as well as hypothetical, stressed conditions, versus limits determined in accordance with our risk appetite. Scenarios are selected to test our exposures to specific industries (e.g., oil and gas and real estate), products (e.g., mortgages and cards), or geographic regions (e.g., Europe and Caribbean). Results from stress testing are a key input into management decision making, including the determination of limits and strategies for managing our credit exposure. See the “Real estate secured personal lending” section for further discussion on our residential mortgage portfolio stress testing.
| | | | |
| CIBC2015 ANNUAL REPORT | | | 51 | |
|
Management’s discussion and analysis |
Exposure to credit risk
The following table presents the exposure to credit risk, which is measured as EAD for on- and off-balance sheet financial instruments. EAD represents the estimate of the amount which will be drawn at the time of default.
Net credit exposure increased by $63.6 billion in 2015, primarily due to business growth in our Canadian corporate and commercial lending portfolios, and the impact of the appreciation of the U.S. dollar.
| | | | | | | | | | | | | | | | | | | | | | | | |
| $ millions, as at October 31 | | | 2015 | | | | | | | | | 2014 | |
| | | AIRB
approach | | | Standardized approach | | | Total | | | AIRB
approach | | | Standardized
approach | | | Total | |
Business and government portfolios | |
Corporate | | | | | | | | | | | | | | | | | | | | | | | | |
Drawn | | $ | 64,578 | | | $ | 3,190 | | | $ | 67,768 | | | $ | 54,242 | | | $ | 3,166 | | | $ | 57,408 | |
Undrawn commitments | | | 37,496 | | | | 112 | | | | 37,608 | | | | 34,197 | | | | 340 | | | | 34,537 | |
Repo-style transactions | | | 31,447 | | | | 12 | | | | 31,459 | | | | 29,487 | | | | 18 | | | | 29,505 | |
Other off-balance sheet | | | 15,694 | | | | 462 | | | | 16,156 | | | | 8,335 | | | | 213 | | | | 8,548 | |
OTC derivatives | | | 7,481 | | | | – | | | | 7,481 | | | | 5,061 | | | | – | | | | 5,061 | |
| | | | 156,696 | | | | 3,776 | | | | 160,472 | | | | 131,322 | | | | 3,737 | | | | 135,059 | |
Sovereign | | | | | | | | | | | | | | | | | | | | | | | | |
Drawn | | | 37,498 | | | | 5,204 | | | | 42,702 | | | | 20,472 | | | | 4,067 | | | | 24,539 | |
Undrawn commitments | | | 4,812 | | | | – | | | | 4,812 | | | | 5,019 | | | | – | | | | 5,019 | |
Repo-style transactions | | | 7,410 | | | | – | | | | 7,410 | | | | 8,041 | | | | – | | | | 8,041 | |
Other off-balance sheet | | | 884 | | | | – | | | | 884 | | | | 443 | | | | – | | | | 443 | |
OTC derivatives | | | 3,666 | | | | – | | | | 3,666 | | | | 2,167 | | | | – | | | | 2,167 | |
| | | | 54,270 | | | | 5,204 | | | | 59,474 | | | | 36,142 | | | | 4,067 | | | | 40,209 | |
Banks | | | | | | | | | | | | | | | | | | | | | | | | |
Drawn | | | 12,889 | | | | 1,374 | | | | 14,263 | | | | 9,779 | | | | 1,156 | | | | 10,935 | |
Undrawn commitments | | | 877 | | | | – | | | | 877 | | | | 939 | | | | – | | | | 939 | |
Repo-style transactions | | | 33,800 | | | | – | | | | 33,800 | | | | 32,174 | | | | 5 | | | | 32,179 | |
Other off-balance sheet | | | 61,022 | | | | – | | | | 61,022 | | | | 59,826 | | | | – | | | | 59,826 | |
OTC derivatives | | | 5,153 | | | | 26 | | | | 5,179 | | | | 5,398 | | | | 22 | | | | 5,420 | |
| | | | 113,741 | | | | 1,400 | | | | 115,141 | | | | 108,116 | | | | 1,183 | | | | 109,299 | |
Total business and government portfolios (gross) | | | 324,707 | | | | 10,380 | | | | 335,087 | | | | 275,580 | | | | 8,987 | | | | 284,567 | |
Less: repo collateral | | | 64,407 | | | | – | | | | 64,407 | | | | 63,718 | | | | – | | | | 63,718 | |
Total business and government portfolios (net) | | | 260,300 | | | | 10,380 | | | | 270,680 | | | | 211,862 | | | | 8,987 | | | | 220,849 | |
Retail portfolios | | | | | | | | | | | | | | | | | | | | | | | | |
Real estate secured personal lending | | | | | | | | | | | | | | | | | | | | | | | | |
Drawn | | | 182,779 | | | | 2,602 | | | | 185,381 | | | | 171,841 | | | | 2,289 | | | | 174,130 | |
Undrawn commitments | | | 21,396 | | | | – | | | | 21,396 | | | | 21,699 | | | | – | | | | 21,699 | |
| | |
| 204,175
|
| | | 2,602 | | | | 206,777 | | | | 193,540 | | | | 2,289 | | | | 195,829 | |
Qualifying revolving retail | | | | | | | | | | | | | | | | | | | | | | | | |
Drawn | | | 20,435 | | | | – | | | | 20,435 | | | | 19,557 | | | | – | | | | 19,557 | |
Undrawn commitments | | | 44,983 | | | | – | | | | 44,983 | | | | 44,849 | | | | – | | | | 44,849 | |
Other off-balance sheet | | | 304 | | | | – | | | | 304 | | | | 275 | | | | – | | | | 275 | |
| | | | 65,722 | | | | – | | | | 65,722 | | | | 64,681 | | | | – | | | | 64,681 | |
Other retail | | | | | | | | | | | | | | | | | | | | | | | | |
Drawn | | | 9,268 | | | | 762 | | | | 10,030 | | | | 8,808 | | | | 697 | | | | 9,505 | |
Undrawn commitments | | | 1,888 | | | | 26 | | | | 1,914 | | | | 1,537 | | | | 44 | | | | 1,581 | |
Other off-balance sheet | | | 36 | | | | – | | | | 36 | | | | 31 | | | | – | | | | 31 | |
| | | | 11,192 | | | | 788 | | | | 11,980 | | | | 10,376 | | | | 741 | | | | 11,117 | |
Total retail portfolios | | | 281,089 | | | | 3,390 | | | | 284,479 | | | | 268,597 | | | | 3,030 | | | | 271,627 | |
Securitization exposures (1) | | | 15,876 | | | | – | | | | 15,876 | | | | 14,990 | | | | – | | | | 14,990 | |
Gross credit exposure | | | 621,672 | | | | 13,770 | | | | 635,442 | | | | 559,167 | | | | 12,017 | | | | 571,184 | |
Less: repo collateral | | | 64,407 | | | | – | | | | 64,407 | | | | 63,718 | | | | – | | | | 63,718 | |
Net credit exposure | | $ | 557,265 | | | $ | 13,770 | | | $ | 571,035 | | | $ | 495,449 | | | $ | 12,017 | | | $ | 507,466 | |
The portfolios are categorized based upon how we manage the business and the associated risks. Amounts provided are net of the CVA related to financial guarantors, derivative master netting agreements, and before allowance for credit losses and other risk mitigation. Non-trading equity exposures are not included in the table above as they have been deemed immaterial under the OSFI guidelines, and hence, are subject to 100% risk-weighting.
| | |
| 52 | | CIBC2015 ANNUAL REPORT |
|
Management’s discussion and analysis |
Exposures subject to the standardized approach
Exposures within CIBC FirstCaribbean and certain exposures to individuals for non-business purposes do not have sufficient historical data to support the AIRB approach for credit risk, and are subject to the standardized approach. The standardized approach utilizes a set of risk weightings defined by the regulators, as opposed to the more data intensive AIRB approach. A detailed breakdown of our standardized exposures before allowance for credit losses by risk-weight category is provided below.
| | | | | | | | | | | | | | | | | | | | | | | | | | | | | | | | | | | | |
| $ millions, as at October 31 | | Risk-weight category | | | 2015 | | | 2014 | |
| | | 0% | | | 20% | | | 35% | | | 50% | | | 75% | | | 100% | | | 150% | | | Total | | | Total | |
Corporate | | $ | – | | | $ | – | | | $ | – | | | $ | – | | | $ | – | | | $ | 3,753 | | | $ | 23 | | | $ | 3,776 | | | $ | 3,737 | |
| Sovereign | | | 4,157 | | | | 295 | | | | – | | | | 161 | | | | – | | | | 546 | | | | 45 | | | | 5,204 | | | | 4,067 | |
| Bank | | | – | | | | 1,265 | | | | – | | | | 102 | | | | – | | | | 33 | | | | – | | | | 1,400 | | | | 1,183 | |
| Real estate secured personal lending | | | – | | | | – | | | | – | | | | – | | | | 2,253 | | | | – | | | | 349 | | | | 2,602 | | | | 2,289 | |
Other retail | | | – | | | | – | | | | – | | | | – | | | | 711 | | | | – | | | | 77 | | | | 788 | | | | 741 | |
| | | $ | 4,157 | | | $ | 1,560 | | | $ | – | | | $ | 263 | | | $ | 2,964 | | | $ | 4,332 | | | $ | 494 | | | $ | 13,770 | | | $ | 12,017 | |
Counterparty credit exposures
We have counterparty credit exposure that arises from our OTC derivatives and our repo-style transactions. The nature of our derivatives exposure is further explained in Note 12 to the consolidated financial statements. Our repo-style transactions consist of our securities bought or sold under repurchase agreements, and our securities borrowing and lending activity.
The PD of our counterparties is estimated using models consistent with the models used for our direct lending activity. Due to the fluctuations in the market values of interest rates, exchanges rates, and equity and commodity prices, counterparty credit exposure cannot be quantified with certainty at the inception of the trade. Counterparty credit exposure is estimated using the current fair value of the exposure, plus an estimate of the maximum potential future exposure due to changes in the fair value. Credit risk associated with these counterparties is managed within the same process as our lending business, and for the purposes of credit adjudication, the exposure is aggregated with any exposure arising from our lending business. The majority of our counterparty credit exposure benefits from the credit risk mitigation techniques discussed above, including daily re-margining, and posting of collateral.
We are also exposed to wrong-way risk when the exposure to a particular counterparty is adversely correlated with the credit quality of that counterparty. When we are exposed to wrong-way risk with a derivative counterparty, our procedures subject those transactions to a more rigorous approval process. The exposure may be hedged with other derivatives to further mitigate the risk that can arise from these transactions.
We establish a CVA for expected future credit losses from each of our derivative counterparties. The expected future credit loss is a function of our estimates of the PD, the estimated loss in the event of default, and other factors such as risk mitigants.
Rating profile of OTC derivative MTM receivables
| | | | | | | | | | | | | | | | |
| $ billions, as at October 31 | | | 2015 | | | 2014 | |
| | | Exposure (1) | |
Investment grade | | $ | 7.59 | | | | 89.3 | % | | $ | 4.82 | | | | 87.5 | % |
Non-investment grade | | | 0.80 | | | | 9.4 | | | | 0.66 | | | | 12.0 | |
Watch list | | | 0.01 | | | | 0.1 | | | | 0.01 | | | | 0.2 | |
Default | | | – | | | | – | | | | – | | | | – | |
Unrated | | | 0.10 | | | | 1.2 | | | | 0.02 | | | | 0.3 | |
| | | $ | 8.50 | | | | 100.0 | % | | $ | 5.51 | | | | 100.0 | % |
| | (1) | MTM of the OTC derivative contracts is after the impact of master netting agreements, but before any collateral. |
Concentration of exposures
Concentration of credit risk exists when a number of obligors are engaged in similar activities, or operate in the same geographical areas or industry sectors, and have similar economic characteristics so that their ability to meet contractual obligations is similarly affected by changes in economic, political, or other conditions.
Geographic distribution
The following table provides a geographic distribution of our business and government exposures under the AIRB approach. The classification of geography is based upon the country of ultimate risk. Amounts are before allowance for credit losses and risk mitigation, and net of the CVA related to financial guarantors and $64.4 billion (2014: $63.7 billion) of collateral held for our repurchase agreement activities.
| | | | | | | | | | | | | | | | | | | | |
| $ millions, as at October 31, 2015 | | Canada | | | U.S. | | | Europe | | | Other | | | Total | |
Drawn | | $ | 63,894 | | | $ | 41,846 | | | $ | 3,882 | | | $ | 5,343 | | | $ | 114,965 | |
Undrawn commitments | | | 32,085 | | | | 7,589 | | | | 2,587 | | | | 924 | | | | 43,185 | |
Repo-style transactions | | | 3,227 | | | | 4,323 | | | | 496 | | | | 204 | | | | 8,250 | |
Other off-balance sheet | | | 51,269 | | | | 20,541 | | | | 5,082 | | | | 708 | | | | 77,600 | |
OTC derivatives | | | 9,050 | | | | 2,386 | | | | 3,642 | | | | 1,222 | | | | 16,300 | |
| | | $ | 159,525 | | | $ | 76,685 | | | $ | 15,689 | | | $ | 8,401 | | | $ | 260,300 | |
October 31, 2014 | | $ | 143,318 | | | $ | 49,852 | | | $ | 11,216 | | | $ | 7,476 | | | $ | 211,862 | |
| | | | |
| CIBC2015 ANNUAL REPORT | | | 53 | |
|
Management’s discussion and analysis |
Business and government exposure by industry groups
The following table provides an industry-wide breakdown of our business and government exposures under the AIRB approach. Amounts are before allowance for credit losses and risk mitigation, and net of the CVA related to financial guarantors and $64.4 billion (2014: $63.7 billion) of collateral held for our repurchase agreement activities.
| | | | | | | | | | | | | | | | | | | | | | | | | | | | |
| $ millions, as at October 31 | | Drawn | | | Undrawn commitments | | | Repo-style transactions | | | Other off- balance sheet | | | OTC derivatives | | | 2015 Total | | | 2014 Total | |
Commercial mortgages | | $ | 8,003 | | | $ | 63 | | | $ | – | | | $ | – | | | $ | – | | | $ | 8,066 | | | $ | 7,940 | |
Financial institutions | | | 35,789 | | | | 4,332 | | | | 7,849 | | | | 70,950 | | | | 8,959 | (1) | | | 127,879 | | | | 96,027 | |
Retail and wholesale | | | 3,811 | | | | 2,619 | | | | – | | | | 320 | | | | 56 | | | | 6,806 | | | | 6,178 | |
Business services | | | 4,647 | | | | 2,176 | | | | – | | | | 408 | | | | 81 | | | | 7,312 | | | | 7,105 | |
Manufacturing – capital goods | | | 1,959 | | | | 2,005 | | | | – | | | | 188 | | | | 376 | | | | 4,528 | | | | 3,650 | |
Manufacturing – consumer goods | | | 2,654 | | | | 1,259 | | | | – | | | | 73 | | | | 79 | | | | 4,065 | | | | 3,556 | |
Real estate and construction | | | 17,863 | | | | 5,133 | | | | – | | | | 888 | | | | 190 | | | | 24,074 | | | | 20,195 | |
Agriculture | | | 4,657 | | | | 1,472 | | | | – | | | | 65 | | | | 84 | | | | 6,278 | | | | 5,297 | |
Oil and gas (2) | | | 6,068 | | | | 9,473 | | | | – | | | | 784 | | | | 951 | | | | 17,276 | | | | 15,407 | |
Mining | | | 1,534 | | | | 2,672 | | | | – | | | | 495 | | | | 115 | | | | 4,816 | | | | 4,154 | |
Forest products | | | 555 | | | | 544 | | | | – | | | | 140 | | | | 44 | | | | 1,283 | | | | 1,232 | |
Hardware and software | | | 603 | | | | 471 | | | | – | | | | 30 | | | | 8 | | | | 1,112 | | | | 952 | |
Telecommunications and cable | | | 1,017 | | | | 768 | | | | – | | | | 326 | | | | 130 | | | | 2,241 | | | | 2,083 | |
Broadcasting, publishing and printing | | | 312 | | | | 189 | | | | – | | | | 171 | | | | 9 | | | | 681 | | | | 678 | |
Transportation | | | 2,405 | | | | 1,571 | | | | – | | | | 425 | | | | 598 | | | | 4,999 | | | | 4,322 | |
Utilities | | | 3,275 | | | | 4,786 | | | | – | | | | 1,946 | | | | 936 | | | | 10,943 | | | | 9,316 | |
Education, health, and social services | | | 1,909 | | | | 841 | | | | 47 | | | | 81 | | | | 93 | | | | 2,971 | | | | 2,873 | |
Governments | | | 17,904 | | | | 2,811 | | | | 354 | | | | 310 | | | | 3,591 | | | | 24,970 | | | | 20,897 | |
| | | $ | 114,965 | | | $ | 43,185 | | | $ | 8,250 | | | $ | 77,600 | | | $ | 16,300 | | | $ | 260,300 | | | $ | 211,862 | |
| | (1) | Includes $9 million (2014: $30 million) of fair value net of CVA with financial guarantors hedging our derivative contracts. |
| | (2) | See “Oil and gas exposure” table below for further details. |
As part of our risk mitigation strategy, we may use credit protection purchases as a hedge against customer or industry sector concentration. As at October 31, 2015, we had credit protection purchased totalling $386 million (2014: $423 million) related to our business and government loans.
Oil and gas exposure
The following table provides a breakdown of our exposure to the oil and gas industry under the AIRB approach. Of these exposures, 78% are investment grade based on our internal risk rating, which incorporates security pledged (equivalent to S&P/Moody’s rating of BBB-/Baa3 and higher).
| | | | | | | | | | | | | | | | | | | | |
| $ millions, as at October 31, 2015 | | Drawn | | | Undrawn
commitments | | | Other off-
balance sheet | | | OTC
derivatives | | | Total | |
Exploration and production | | $ | 4,247 | | | $ | 4,676 | | | $ | 284 | | | $ | 465 | | | $ | 9,672 | |
Midstream | | | 637 | | | | 1,820 | | | | 57 | | | | 337 | | | | 2,851 | |
Downstream | | | 93 | | | | 372 | | | | 32 | | | | 2 | | | | 499 | |
Integrated | | | 145 | | | | 2,023 | | | | 308 | | | | 117 | | | | 2,593 | |
Oil and gas services | | | 493 | | | | 293 | | | | 39 | | | | 1 | | | | 826 | |
Petroleum distribution | | | 453 | | | | 289 | | | | 64 | | | | 29 | | | | 835 | |
| | | $ | 6,068 | | | $ | 9,473 | | | $ | 784 | | | $ | 951 | | | $ | 17,276 | |
October 31, 2014 | | $ | 5,244 | | | $ | 8,436 | | | $ | 922 | | | $ | 805 | | | $ | 15,407 | |
| | |
| 54 | | CIBC2015 ANNUAL REPORT |
|
Management’s discussion and analysis |
Credit quality of portfolios
Credit quality of the risk-rated portfolios
The following table provides the credit quality of the risk-rated portfolios. Amounts provided are before allowance for credit losses, and after credit risk mitigation, CVA, and collateral on repurchase agreement activities.
The obligor grade is our assessment of the creditworthiness of the obligor, without respect to the collateral held in support of the exposure. The LGD estimate would reflect our assessment of the value of the collateral at the time of default of the obligor. For slotted exposures, the slotting category reflects our assessment of both the creditworthiness of the obligor, as well as the value of the collateral.
| | | | | | | | | | | | | | | | | | | | |
| $ millions, as at October 31 | | | | | | | | | | | 2015 | | | 2014 | |
| | | EAD | | | | | | | |
| Obligor grade | | Corporate | | | Sovereign | | | Banks | | | Total | | | Total | |
Investment grade | | $ | 72,615 | | | $ | 46,608 | | | $ | 83,758 | | | $ | 202,981 | | | $ | 163,098 | |
Non-investment grade | | | 45,244 | | | | 611 | | | | 2,040 | | | | 47,895 | | | | 39,924 | |
Watch list | | | 829 | | | | – | | | | – | | | | 829 | | | | 453 | |
Default | | | 525 | | | | – | | | | – | | | | 525 | | | | 448 | |
Total risk-rated exposure | | $ | 119,213 | | | $ | 47,219 | | | $ | 85,798 | | | $ | 252,230 | | | $ | 203,923 | |
| | | | | |
| LGD estimate | | Corporate | | | Sovereign | | | Banks | | | Total | | | Total | |
Less than 10% | | $ | 12,554 | | | $ | 38,859 | | | $ | 57,910 | | | $ | 109,323 | | | $ | 87,752 | |
10% – 25% | | | 32,548 | | | | 3,640 | | | | 17,586 | | | | 53,774 | | | | 49,824 | |
26% – 45% | | | 55,258 | | | | 3,411 | | | | 9,244 | | | | 67,913 | | | | 50,395 | |
46% – 65% | | | 18,351 | | | | 1,234 | | | | 555 | | | | 20,140 | | | | 14,717 | |
66% – 100% | | | 502 | | | | 75 | | | | 503 | | | | 1,080 | | | | 1,235 | |
| | | $ | 119,213 | | | $ | 47,219 | | | $ | 85,798 | | | $ | 252,230 | | | $ | 203,923 | |
Strong | | | | | | | | | | | | | | | 7,198 | | | | 7,071 | |
Good | | | | | | | | | | | | | | | 556 | | | | 462 | |
Satisfactory | | | | | | | | | | | | | | | 264 | | | | 376 | |
Weak | | | | | | | | | | | | | | | 47 | | | | 25 | |
Default | | | | | | | | | | | | | | | 5 | | | | 5 | |
Total slotted exposure | | | | | | | | | | | | | | $ | 8,070 | | | $ | 7,939 | |
Total business and government portfolios | | | | | | | | | | | | | | $ | 260,300 | | | $ | 211,862 | |
The total exposures increased by $48.4 billion from October 31, 2014, largely attributable to growth across virtually all of our lending and securities portfolios. The investment grade category increased by $39.9 billion from October 31, 2014, while the non-investment grade category was up $8.0 billion. The increase in watch list and default exposures was largely attributable to downgrades in the corporate and mid-market lending portfolios, primarily related to oil and gas borrowers.
Credit quality of the retail portfolios
The following table presents the credit quality of the retail portfolios. Amounts provided are before allowance for credit losses and after credit risk mitigation.
| | | | | | | | | | | | | | | | | | | | |
| $ millions, as at October 31 | | | | | | | | | 2015 | | | 2014 | |
| | | EAD | | | | | | | |
| Risk level | | Real estate secured personal lending | | | Qualifying revolving retail | | | Other retail | | | Total | | | Total | |
Exceptionally low | | $ | 171,768 | | | $ | 35,541 | | | $ | 1,381 | | | $ | 208,690 | | | $ | 203,940 | |
Very low | | | 10,130 | | | | 8,676 | | | | 1,118 | | | | 19,924 | | | | 16,245 | |
Low | | | 19,680 | | | | 13,214 | | | | 6,132 | | | | 39,026 | | | | 37,451 | |
Medium | | | 2,195 | | | | 7,042 | | | | 1,873 | | | | 11,110 | | | | 9,166 | |
High | | | 247 | | | | 1,212 | | | | 640 | | | | 2,099 | | | | 1,391 | |
Default | | | 155 | | | | 37 | | | | 48 | | | | 240 | | | | 404 | |
| | | $ | 204,175 | | | $ | 65,722 | | | $ | 11,192 | | | $ | 281,089 | | | $ | 268,597 | |
Securitization exposures
The following table provides details on our securitization exposures by credit ratings under the IRB approach.
| | | | | | | | |
| $ millions, as at October 31 | | 2015 | | | 2014 | |
| S&P rating equivalent | | EAD (1) | |
AAA to BBB- | | $ | 9,547 | | | $ | 9,020 | |
BB+ to BB- | | | – | | | | – | |
Below BB- | | | 13 | | | | 20 | |
Unrated | | | 6,036 | | | | 5,496 | |
| | | $ | 15,596 | | | $ | 14,536 | |
| | (1) | EAD under IRB approach is net of financial collateral of $280 million (2014: $454 million). |
Real estate secured personal lending
Real estate secured personal lending comprises residential mortgages and personal loans and lines secured by residential property (HELOC). This portfolio is low risk as we have a first charge on the majority of the properties, and second lien on only a small portion of the portfolio. We use the same lending criteria in the adjudication of both first lien and second lien loans.
Under theBank Act (Canada), banks are limited to providing residential real estate loans of no more than 80% of the collateral value. An exception is made for mortgage loans with a higher LTV ratio if they are insured by either CMHC or a private mortgage insurer. Mortgage insurance protects banks from the risk of default by the borrower, over the term of the coverage. Mortgage insurers are subject to regulatory capital requirements, which aim to ensure that they are well capitalized. If a private mortgage insurer becomes insolvent, the Government of Canada has, provided certain conditions are met, obligations in respect of policies underwritten by certain insolvent private mortgage insurers as more fully described in theProtection of Residential Mortgage or Hypothecary Insurance Act (PRMHIA). There is a possibility that losses could be incurred in respect of insured mortgages if, among other
| | | | |
| CIBC2015 ANNUAL REPORT | | | 55 | |
|
Management’s discussion and analysis |
things, CMHC or the applicable private mortgage insurer denies a claim, or further, if a private mortgage insurer becomes insolvent and either the conditions under the PRMHIA are not met or the Government of Canada denies the claim.
The following tables provide details on our residential mortgage and HELOC portfolios:
| | | | | | | | | | | | | | | | | | | | | | | | | | | | | | | | | | | | | | | | | | | | |
| | | Residential mortgages | | | | | HELOC (1) | | | | | Total | |
| $ billions, as at October 31, 2015 | | Insured | | | Uninsured | | | | | Uninsured | | | | | Insured (2) | | | Uninsured | |
Ontario | | $ | 49.0 | | | | 63 | % | | $ | 28.3 | | | | 37 | % | | | | $ | 9.8 | | | | 100 | % | | | | $ | 49.0 | | | | 56 | % | | $ | 38.1 | | | | 44 | % |
British Columbia and territories | | | 18.7 | | | | 55 | | | | 15.2 | | | | 45 | | | | | | 3.8 | | | | 100 | | | | | | 18.7 | | | | 50 | | | | 19.0 | | | | 50 | |
Alberta | | | 17.1 | | | | 71 | | | | 7.1 | | | | 29 | | | | | | 2.7 | | | | 100 | | | | | | 17.1 | | | | 64 | | | | 9.8 | | | | 36 | |
Quebec | | | 7.9 | | | | 66 | | | | 4.0 | | | | 34 | | | | | | 1.5 | | | | 100 | | | | | | 7.9 | | | | 59 | | | | 5.5 | | | | 41 | |
Central prairie provinces | | | 5.2 | | | | 72 | | | | 2.0 | | | | 28 | | | | | | 0.9 | | | | 100 | | | | | | 5.2 | | | | 65 | | | | 2.9 | | | | 35 | |
Atlantic provinces | | | 6.0 | | | | 74 | | | | 2.2 | | | | 26 | | | | | | 0.8 | | | | 100 | | | | | | 6.0 | | | | 67 | | | | 3.0 | | | | 33 | |
Canadian portfolio (2)(3) | | | 103.9 | | | | 64 | | | | 58.8 | | | | 36 | | | | | | 19.5 | | | | 100 | | | | | | 103.9 | | | | 57 | | | | 78.3 | | | | 43 | |
International portfolio (2) | | | – | | | | – | | | | 2.4 | | | | 100 | | | | | | – | | | | – | | | | | | – | | | | – | | | | 2.4 | | | | 100 | |
Total portfolio | | $ | 103.9 | | | | 63 | % | | $ | 61.2 | | | | 37 | % | | | | $ | 19.5 | | | | 100 | % | | | | $ | 103.9 | | | | 56 | % | | $ | 80.7 | | | | 44 | % |
October 31, 2014 | | $ | 102.3 | | | | 67 | % | | $ | 51.5 | | | | 33 | % | | | | $ | 19.6 | | | | 100 | % | | | | $ | 102.3 | | | | 59 | % | | $ | 71.1 | | | | 41 | % |
| (1) | We did not have any insured HELOCs as at October 31, 2015 and 2014. |
| (2) | Geographical location is based on the address of the property managed. |
| (3) | 82% (2014: 90%) of insurance on Canadian residential mortgages is provided by CMHC and the remaining by two private Canadian insurers, both rated at least AA (low) by DBRS. |
The average LTV ratios(1) for our uninsured Canadian and international residential mortgages and HELOCs originated during the year are provided in the following table. We did not acquire uninsured residential mortgages or HELOCs from a third-party for the years presented in the table below.
| | | | | | | | | | | | | | | | |
| For the year ended October 31 | | 2015 | | | 2014 | |
| | | Residential mortgages | | | HELOC | | | Residential mortgages | | | HELOC | |
Ontario | | | 65 | % | | | 70 | % | | | 65 | % | | | 70 | % |
British Columbia and territories | | | 61 | | | | 65 | | | | 61 | | | | 66 | |
Alberta | | | 68 | | | | 72 | | | | 68 | | | | 72 | |
Quebec | | | 67 | | | | 72 | | | | 67 | | | | 72 | |
Central prairie provinces | | | 69 | | | | 73 | | | | 69 | | | | 73 | |
Atlantic provinces | | | 72 | | | | 73 | | | | 71 | | | | 73 | |
Canadian portfolio (2) | | | 65 | % | | | 69 | % | | | 65 | % | | | 70 | % |
International portfolio | | | 68 | % | | | n/m | | | | 71 | % | | | n/m | |
| (1) | LTV ratios for newly originated residential mortgages and HELOCs are calculated based on weighted average. |
| (2) | Geographical location is based on the address of the property managed. |
The following table provides the average LTV ratios on our total Canadian residential mortgage portfolio:
| | | | | | | | |
| | | Insured | | | Uninsured | |
October 31, 2015 (1) | | | 60 | % | | | 59 | % |
October 31, 2014 (1) | | | 60 | % | | | 60 | % |
| (1) | LTV ratios for residential mortgages are calculated based on weighted average. The house price estimates for October 31, 2015 and 2014 are based on the Forward Sortation Area (FSA) level indices from the Teranet – National Bank National Composite House Price Index (Teranet) as of September 30, 2015 and 2014, respectively. Teranet is an independent estimate of the rate of change in Canadian home prices. |
The tables below summarize the remaining amortization profile of our total Canadian and international residential mortgages. The first table provides the remaining amortization periods based on the minimum contractual payment amounts. The second table provides the remaining amortization periods based upon current customer payment amounts, which incorporate payments larger than the minimum contractual amount and/or higher frequency of payments.
Contractual payment basis
| | | | | | | | | | | | | | | | | | | | | | | | | | | | | | | | |
| | | Less than 5 years | | | 5 – 10 years | | | 10 – 15 years | | | 15 – 20 years | | | 20 – 25 years | | | 25 – 30 years | | | 30 – 35 years | | | 35 years and above | |
Canadian portfolio | | | | | | | | | | | | | | | | | | | | | | | | | | | | | | | | |
October 31, 2015 | | | – | % | | | 1 | % | | | 3 | % | | | 7 | % | | | 26 | % | | | 56 | % | | | 7 | % | | | – | % |
October 31, 2014 | | | – | % | | | 1 | % | | | 3 | % | | | 9 | % | | | 23 | % | | | 48 | % | | | 16 | % | | | – | % |
International portfolio | | | | | | | | | | | | | | | | | | | | | | | | | | | | | | | | |
October 31, 2015 | | | 7 | % | | | 16 | % | | | 26 | % | | | 25 | % | | | 16 | % | | | 8 | % | | | 2 | % | | | – | % |
October 31, 2014 | | | 7 | % | | | 15 | % | | | 25 | % | | | 27 | % | | | 17 | % | | | 8 | % | | | 1 | % | | | – | % |
| | | | | | | | |
| Current customer payment basis | | | | | | | | | | | | | | | | | | | | | | | | | | | | | | | | |
| | | Less than 5 years | | | 5 – 10 years | | | 10 – 15 years | | | 15 – 20 years | | | 20 – 25 years | | | 25 – 30 years | | | 30 – 35 years | | | 35 years and above | |
Canadian portfolio | | | | | | | | | | | | | | | | | | | | | | | | | | | | | | | | |
October 31, 2015 | | | 2 | % | | | 6 | % | | | 9 | % | | | 13 | % | | | 33 | % | | | 34 | % | | | 3 | % | | | – | % |
October 31, 2014 | | | 3 | % | | | 6 | % | | | 10 | % | | | 14 | % | | | 28 | % | | | 31 | % | | | 8 | % | | | – | % |
International portfolio | | | | | | | | | | | | | | | | | | | | | | | | | | | | | | | | |
October 31, 2015 | | | 7 | % | | | 16 | % | | | 26 | % | | | 24 | % | | | 17 | % | | | 7 | % | | | 2 | % | | | 1 | % |
October 31, 2014 | | | 7 | % | | | 15 | % | | | 24 | % | | | 26 | % | | | 17 | % | | | 8 | % | | | 2 | % | | | 1 | % |
| | |
| 56 | | CIBC2015 ANNUAL REPORT |
|
Management’s discussion and analysis |
We have two types of condominium exposures in Canada: mortgages and developer loans. Both are primarily concentrated in the Toronto and Vancouver areas. As at October 31, 2015, our Canadian condominium mortgages were $18.5 billion (2014: $17.1 billion) of which 64% (2014: 70%) were insured. Our drawn developer loans were $1.0 billion (2014: $1.0 billion) or 1.4% of our business and government portfolio, and our related undrawn exposure was $1.9 billion (2014: $2.0 billion). The condominium developer exposure is diversified across 87 projects.
We stress test our mortgage and HELOC portfolio to determine the potential impact of different economic events. Our stress tests can use variables such as unemployment rates, debt service ratios and housing price changes, to model potential outcomes for a given set of circumstances. The stress testing involves variables that could behave differently in certain situations. Our main tests use economic variables in a similar range to historical events when Canada experienced economic downturns. Our results show that in an economic downturn, our strong capital position should be sufficient to absorb mortgage and HELOC losses.
Credit quality performance
As at October 31, 2015, total loans and acceptances after allowance for credit losses were $291.0 billion (2014: $268.2 billion). Consumer loans (comprising residential mortgages, credit cards and personal loans, including student loans) constitute 74% (2014: 76%) of the portfolio, and business and government loans (including acceptances) constitute the remainder of the portfolio.
Consumer loans were up by $13.0 billion or 6% from the prior year, primarily due to an increase in residential mortgages of $11.7 billion. Business and government loans (including acceptances) were up $9.8 billion or 15% from the prior year, mainly attributable to the financial institutions and real estate and construction sectors.
The following table provides details of our impaired loans and allowances for credit losses:
| | | | | | | | | | | | | | | | | | | | | | | | |
| $ millions, as at or for the year ended October 31 | | Business and government loans | | | Consumer loans | | | 2015 Total | | | Business and government loans | | | Consumer loans | | | 2014 Total | |
Gross impaired loans | | | | | | | | | | | | | | | | | | | | | | | | |
Balance at beginning of year | | $ | 700 | | | $ | 734 | | | $ | 1,434 | | | $ | 843 | | | $ | 704 | | | $ | 1,547 | |
Classified as impaired during the year | | | 207 | | | | 1,154 | | | | 1,361 | | | | 189 | | | | 1,250 | | | | 1,439 | |
Transferred to not impaired during the year | | | (17 | ) | | | (105 | ) | | | (122 | ) | | | (10 | ) | | | (103 | ) | | | (113 | ) |
Net repayments | | | (141 | ) | | | (254 | ) | | | (395 | ) | | | (196 | ) | | | (242 | ) | | | (438 | ) |
Amounts written-off | | | (174 | ) | | | (830 | ) | | | (1,004 | ) | | | (155 | ) | | | (903 | ) | | | (1,058 | ) |
Recoveries of loans and advances previously written-off | | | – | | | | – | | | | – | | | | – | | | | – | | | | – | |
Disposals of loans | | | – | | | | – | | | | – | | | | (18 | ) | | | – | | | | (18 | ) |
Foreign exchange and other | | | 84 | | | | 61 | | | | 145 | | | | 47 | | | | 28 | | | | 75 | |
Balance at end of year | | $ | 659 | | | $ | 760 | | | $ | 1,419 | | | $ | 700 | | | $ | 734 | | | $ | 1,434 | |
Allowance for impairment (1) | | | | | | | | | | | | | | | | | | | | | | | | |
Balance at beginning of year | | $ | 337 | | | $ | 307 | | | $ | 644 | | | $ | 323 | | | $ | 224 | | | $ | 547 | |
Amounts written-off | | | (174 | ) | | | (830 | ) | | | (1,004 | ) | | | (155 | ) | | | (903 | ) | | | (1,058 | ) |
Recoveries of amounts written-off in previous years | | | 10 | | | | 176 | | | | 186 | | | | 13 | | | | 179 | | | | 192 | |
Charge to income statement | | | 100 | | | | 662 | | | | 762 | | | | 162 | | | | 818 | | | | 980 | |
Interest accrued on impaired loans | | | (8 | ) | | | (15 | ) | | | (23 | ) | | | (14 | ) | | | (16 | ) | | | (30 | ) |
Disposals of loans | | | – | | | | – | | | | – | | | | – | | | | – | | | | – | |
Foreign exchange and other | | | 48 | | | | 33 | | | | 81 | | | | 8 | | | | 5 | | | | 13 | |
Balance at end of year | | $ | 313 | | | $ | 333 | | | $ | 646 | | | $ | 337 | | | $ | 307 | | | $ | 644 | |
Net impaired loans | | | | | | | | | | | | | | | | | | | | | | | | |
Balance at beginning of year | | $ | 363 | | | $ | 427 | | | $ | 790 | | | $ | 520 | | | $ | 480 | | | $ | 1,000 | |
Net change in gross impaired | | | (41 | ) | | | 26 | | | | (15 | ) | | | (143 | ) | | | 30 | | | | (113 | ) |
Net change in allowance | | | 24 | | | | (26 | ) | | | (2 | ) | | | (14 | ) | | | (83 | ) | | | (97 | ) |
Balance at end of year | | $ | 346 | | | $ | 427 | | | $ | 773 | | | $ | 363 | | | $ | 427 | | | $ | 790 | |
Net impaired loans as a percentage of net loans and acceptances | | | | | | | | | | | 0.27 | % | | | | | | | | | | | 0.29 | % |
| (1) | Includes collective allowance relating to personal, scored small business and mortgage impaired loans that are greater than 90 days delinquent, and individual allowance. |
Gross impaired loans
As at October 31, 2015, gross impaired loans were $1,419 million, down $15 million from the prior year. The decrease was primarily due to write-offs and lower new classifications in CIBC FirstCaribbean and in the real estate and construction sector in the U.S., partially offset by an increase in the oil and gas sector in Canada and the impact of U.S. dollar appreciation on our existing portfolio.
More than half of the gross impaired loans at the end of the current year related to CIBC FirstCaribbean, for which residential mortgages, business services (e.g., tourism and hotels), and in the real estate and construction sectors accounted for the majority.
Approximately one third of the gross impaired loans relate to Canada, in which there was an increase in the oil and gas sector due to the downgrading of two accounts in the sector. The level of gross impaired loans in the oil and gas sector is affected by oil prices. The remaining gross impaired loans in Canada were largely insured residential mortgages, where losses are minimal.
Less than 10% of the gross impaired loans relate to the U.S., in which the real estate and construction sector accounted for the majority, and experienced a decrease in the current year due to lower new classifications and write-offs.
Additional details on the geographic distribution and industry classification of impaired loans are provided in the “Supplementary annual financial information” section.
Allowance for impairment
Allowance for impairment was $646 million, up $2 million from the prior year.
The increase was mainly due to the impact of U.S. dollar appreciation on our existing portfolio, and the increase in the oil and gas portfolio in Canada resulting from the declining oil prices, partially offset by decreases in CIBC FirstCaribbean and the U.S. real estate and construction sector due to write-offs and lower new classifications. In line with declining gross impaired loans, allowance for impairment was down in the U.S. and CIBC FirstCaribbean.
| | | | |
| CIBC2015 ANNUAL REPORT | | | 57 | |
|
Management’s discussion and analysis |
Exposure to certain countries and regions
Over the past several years, a number of countries in Europe experienced credit concerns. The following tables provide our exposure to European countries, both within and outside the Eurozone.
We do not have material exposure to the countries in the Middle East and North Africa that have either experienced or may be at risk of unrest.
Direct exposures to certain countries and regions
Our direct exposures presented in the tables below comprise (A) funded – on-balance sheet loans (stated at amortized cost net of allowances, if any), deposits with banks (stated at amortized cost net of allowances, if any) and securities (stated at fair value); (B) unfunded – unutilized credit commitments, letters of credit, and guarantees (stated at notional amount net of allowances, if any) and sold credit default swap (CDS) contracts where we do not benefit from subordination (stated at notional amount less fair value); and (C) derivative MTM receivables (stated at fair value) and repo-style transactions (stated at fair value).
Of our total direct exposures to Europe, approximately 91% (2014: 90%) is to entities in countries with Aaa/AAA ratings from at least one of Moody’s or S&P.
The following table provides a summary of our positions in this business:
| | | | | | | | | | | | | | | | | | | | | | | | | | | | | | |
| | | Direct exposures | |
| | | Funded | | | | | Unfunded | |
| $ millions, as at October 31, 2015 | | Corporate | | | Sovereign | | | Bank | | | Total funded (A) | | | | | Corporate | | | Bank | | | Total unfunded
(B) | |
Austria | | $ | – | | | $ | 129 | | | $ | – | | | $ | 129 | | | | | $ | – | | | $ | 1 | | | $ | 1 | |
Belgium | | | 8 | | | | – | | | | 4 | | | | 12 | | | | | | – | | | | – | | | | – | |
Finland | | | 244 | | | | 1 | | | | – | | | | 245 | | | | | | 39 | | | | – | | | | 39 | |
France | | | 150 | | | | – | | | | 27 | | | | 177 | | | | | | 214 | | | | 12 | | | | 226 | |
Germany | | | 190 | | | | 391 | | | | 358 | | | | 939 | | | | | | 6 | | | | – | | | | 6 | |
Ireland | | | – | | | | – | | | | 8 | | | | 8 | | | | | | – | | | | 4 | | | | 4 | |
Italy | | | – | | | | – | | | | – | | | | – | | | | | | – | | | | – | | | | – | |
Luxembourg | | | – | | | | – | | | | – | | | | – | | | | | | 10 | | | | – | | | | 10 | |
Malta | | | – | | | | – | | | | – | | | | – | | | | | | – | | | | – | | | | – | |
Netherlands | | | 91 | | | | 15 | | | | 61 | | | | 167 | | | | | | 41 | | | | 1 | | | | 42 | |
Spain | | | – | | | | – | | | | – | | | | – | | | | | | – | | | | – | | | | – | |
Total Eurozone | | $ | 683 | | | $ | 536 | | | $ | 458 | | | $ | 1,677 | | | | | $ | 310 | | | $ | 18 | | | $ | 328 | |
Czech Republic | | $ | – | | | $ | – | | | $ | – | | | $ | – | | | | | $ | – | | | $ | – | | | $ | – | |
Denmark | | | – | | | | 13 | | | | – | | | | 13 | | | | | | – | | | | 53 | | | | 53 | |
Norway | | | – | | | | – | | | | 6 | | | | 6 | | | | | | 311 | | | | – | | | | 311 | |
Poland | | | – | | | | – | | | | 3 | | | | 3 | | | | | | – | | | | – | | | | – | |
Sweden | | | 414 | | | | 125 | | | | 83 | | | | 622 | | | | | | 89 | | | | – | | | | 89 | |
Switzerland | | | 191 | | | | – | | | | 36 | | | | 227 | | | | | | 99 | | | | – | | | | 99 | |
Turkey | | | – | | | | – | | | | 433 | | | | 433 | | | | | | – | | | | 43 | | | | 43 | |
United Kingdom | | | 729 | | | | 90 | | | | 590 | | | | 1,409 | | | | | | 3,455 | (1) | | | 489 | | | | 3,944 | |
Total non-Eurozone | | $ | 1,334 | | | $ | 228 | | | $ | 1,151 | | | $ | 2,713 | | | | | $ | 3,954 | | | $ | 585 | | | $ | 4,539 | |
Total Europe | | $ | 2,017 | | | $ | 764 | | | $ | 1,609 | | | $ | 4,390 | | | | | $ | 4,264 | | | $ | 603 | | | $ | 4,867 | |
October 31, 2014 | | $ | 1,433 | | | $ | 508 | | | $ | 997 | | | $ | 2,938 | | | | | $ | 2,727 | | | $ | 456 | | | $ | 3,183 | |
| (1) | Includes $215 million of exposure (notional value of $246 million and fair value of $31 million) on a CDS sold on a bond issue of a U.K. corporate entity, which is guaranteed by a financial guarantor. We currently hold the CDS sold as part of our structured credit run-off business. A payout on the CDS sold would be triggered by the bankruptcy of the reference entity, or a failure of the entity to make a principal or interest payment as it is due, as well as a failure of the financial guarantor to meet its obligation under the guarantee. |
| | |
| 58 | | CIBC2015 ANNUAL REPORT |
|
Management’s discussion and analysis |
| | | | | | | | | | | | | | | | | | | | | | | | | | | | | | | | | | |
| | | Direct exposures (continued) | |
| | | Derivative MTM receivables and repo-style transactions | | | | | Total direct exposure (A)+(B)+(C) | |
| $ millions, as at October 31, 2015 | | Corporate | | | Sovereign | | | Bank | | | Gross exposure (1) | | | | | Collateral held (2) | | | | | Net exposure
(C) | | | | |
Austria | | $ | – | | | $ | – | | | $ | 37 | | | $ | 37 | | | | | $ | 35 | | | | | $ | 2 | | | | | $ | 132 | |
Belgium | | | 5 | | | | 1 | | | | 19 | | | | 25 | | | | | | 19 | | | | | | 6 | | | | | | 18 | |
Finland | | | 5 | | | | – | | | | 16 | | | | 21 | | | | | | 16 | | | | | | 5 | | | | | | 289 | |
France | | | 25 | | | | 217 | | | | 439 | | | | 681 | | | | | | 653 | | | | | | 28 | | | | | | 431 | |
Germany | | | – | | | | – | | | | 1,605 | | | | 1,605 | | | | | | 1,575 | | | | | | 30 | | | | | | 975 | |
Ireland | | | – | | | | – | | | | 7 | | | | 7 | | | | | | 6 | | | | | | 1 | | | | | | 13 | |
Italy | | | – | | | | – | | | | 5 | | | | 5 | | | | | | – | | | | | | 5 | | | | | | 5 | |
Luxembourg | | | – | | | | – | | | | 38 | | | | 38 | | | | | | – | | | | | | 38 | | | | | | 48 | |
Malta | | | – | | | | – | | | | 2 | | | | 2 | | | | | | – | | | | | | 2 | | | | | | 2 | |
Netherlands | | | 107 | | | | – | | | | 79 | | | | 186 | | | | | | 78 | | | | | | 108 | | | | | | 317 | |
Spain | | | – | | | | – | | | | 6 | | | | 6 | | | | | | 5 | | | | | | 1 | | | | | | 1 | |
Total Eurozone | | $ | 142 | | | $ | 218 | | | $ | 2,253 | | | $ | 2,613 | | | | | $ | 2,387 | | | | | $ | 226 | | | | | $ | 2,231 | |
Czech Republic | | $ | – | | | $ | 1 | | | $ | – | | | $ | 1 | | | | | $ | – | | | | | $ | 1 | | | | | $ | 1 | |
Denmark | | | – | | | | – | | | | 22 | | | | 22 | | | | | | 17 | | | | | | 5 | | | | | | 71 | |
Norway | | | – | | | | – | | | | – | | | | – | | | | | | – | | | | | | – | | | | | | 317 | |
Poland | | | – | | | | – | | | | – | | | | – | | | | | | – | | | | | | – | | | | | | 3 | |
Sweden | | | 7 | | | | – | | | | 143 | | | | 150 | | | | | | 142 | | | | | | 8 | | | | | | 719 | |
Switzerland | | | – | | | | – | | | | 1,345 | | | | 1,345 | | | | | | 1,314 | | | | | | 31 | | | | | | 357 | |
Turkey | | | – | | | | – | | | | – | | | | – | | | | | | – | | | | | | – | | | | | | 476 | |
United Kingdom | | | 692 | | | | 26 | | | | 4,369 | | | | 5,087 | | | | | | 4,282 | | | | | | 805 | | | | | | 6,158 | |
Total non-Eurozone | | $ | 699 | | | $ | 27 | | | $ | 5,879 | | | $ | 6,605 | | | | | $ | 5,755 | | | | | $ | 850 | | | | | $ | 8,102 | |
Total Europe | | $ | 841 | | | $ | 245 | | | $ | 8,132 | | | $ | 9,218 | | | | | $ | 8,142 | | | | | $ | 1,076 | | | | | $ | 10,333 | |
October 31, 2014 | | $ | 325 | | | $ | 264 | | | $ | 8,498 | | | $ | 9,087 | | | | | $ | 8,516 | | | | | $ | 571 | | | | | $ | 6,692 | |
| (1) | The amounts shown are net of CVA. |
| (2) | Collateral on derivative MTM receivables was $1.1 billion (2014: $1.4 billion), collateral on repo-style transactions was $7.0 billion (2014: $7.1 billion), and both consist of cash and investment-grade debt securities. |
Indirect exposures to certain countries and regions
Our indirect exposures comprise securities (primarily CLOs classified as loans on our consolidated balance sheet), and written credit protection on securities in our structured credit run-off business where we benefit from subordination to our position. Our gross exposure before subordination is stated at carrying value for securities and notional, less fair value for derivatives where we have written protection.
| | | | |
| $ millions, as at October 31, 2015 | | Total indirect
exposure | |
Belgium | | $ | 3 | |
Finland | | | 8 | |
France | | | 68 | |
Germany | | | 35 | |
Greece | | | 7 | |
Ireland | | | 4 | |
Italy | | | 18 | |
Luxembourg | | | 53 | |
Netherlands | | | 83 | |
Spain | | | 41 | |
Total Eurozone | | $ | 320 | |
Denmark | | $ | 6 | |
Norway | | | 1 | |
Sweden | | | 9 | |
United Kingdom | | | 68 | |
Total non-Eurozone | | $ | 84 | |
Total exposure | | $ | 404 | |
October 31, 2014 | | $ | 951 | |
In addition to the indirect exposures above, we have indirect exposure to European counterparties when we have taken debt or equity securities issued by European entities as collateral for our securities lending and borrowing activity, from entities that are not in Europe. Our indirect exposure was $533 million (2014: $147 million).
| | | | |
| CIBC2015 ANNUAL REPORT | | | 59 | |
|
Management’s discussion and analysis |
Selected exposures in certain selected activities
In response to the recommendations of the Financial Stability Board, this section provides information on our other selected activities within our continuing and exited businesses that may be of particular interest to investors based on their risk characteristics and the current market environment.
U.S. real estate finance
In our U.S. real estate finance business, we operate a full-service platform which originates commercial mortgages to mid-market clients, under four programs.
The construction program offers floating-rate financing to properties under construction. The two interim programs offer fixed- and floating-rate financing, typically with an average term of one to three years for properties that are fully leased or with some leasing or renovation yet to be done. In addition, the interim programs provide operating lines to select borrowers. These programs provide feeder product for the group’s permanent fixed-rate loan program. Once the construction and interim phases are complete and the properties are income producing, borrowers are offered fixed-rate financing within the permanent program (typically with average terms of 10 years).
The following table provides a summary of our positions in this business:
| | | | | | | | |
| $ millions, as at October 31, 2015 | | Drawn | | | Undrawn | |
Construction program | | $ | 144 | | | $ | 41 | |
Interim program | | | 7,127 | | | | 412 | |
Permanent program | | | 329 | | | | – | |
Exposure, net of allowance | | $ | 7,600 | | | $ | 453 | |
Of the above: | | | | | | | | |
Net impaired | | $ | 67 | | | $ | – | |
On credit watch list | | | 46 | | | | – | |
Exposure, net of allowance, as at October 31, 2014 | | $ | 6,736 | | | $ | 449 | |
As at October 31, 2015, the allowance for credit losses for this portfolio was $27 million (2014: $47 million). During the year, the provision for credit losses was $14 million (2014: $13 million).
The business also maintains commercial mortgage-backed securities (CMBS) trading and distribution capabilities. As at October 31, 2015, there was no CMBS inventory (2014: nil).
European leveraged finance
In 2008, management made a decision to exit our European leveraged finance business where we participated or originated non-investment grade leveraged loans and syndicated the majority of the loans, earning a fee during the process.
The following table provides a summary of our positions in this business:
| | | | | | | | |
| $ millions, as at October 31, 2015 | | Drawn | | | Undrawn | |
Exposure, net of allowance | | $ | 220 | | | $ | 2 | |
Of the above: | | | | | | | | |
Net impaired | | $ | – | | | $ | – | |
On credit watch list | | | 197 | | | | 2 | |
Exposure, net of allowance, as at October 31, 2014 | | $ | 203 | | | $ | 12 | |
As at October 31, 2015, the allowance for credit losses for this portfolio was $38 million (2014: $36 million). During the year, the reversal of credit losses was $1 million (2014: reversal of credit losses was $1 million).
Settlement risk
Settlement risk is the risk that one party fails to deliver at the time of settlement on the terms of a contract between two parties. This risk can arise in general trading activities and from payment and settlement system participation.
Many global settlement systems offer significant risk reduction benefits through complex risk mitigation frameworks. Bilateral payment netting agreements may be put in place to mitigate risk by reducing the aggregate settlement amount between counterparties. Further, we participate in several North American payment and settlement systems, including a global foreign exchange multilateral netting system. We also use financial intermediaries to access some payment and settlement systems, and for certain trades, we may utilize an established clearing house to minimize settlement risk.
Transactions settled outside of payment and settlement systems or clearing houses require approval of credit facilities for counterparties, either as pre-approved settlement risk limits or payment-versus-payment arrangements.
| | |
| 60 | | CIBC2015 ANNUAL REPORT |
|
Management’s discussion and analysis |
Market risk
Market risk is the risk of economic financial loss in our trading and non-trading portfolios from adverse changes in underlying market factors, including interest rates, foreign exchange rates, equity market prices, commodity prices, credit spreads, and customer behaviour for retail products. Market risk arises in CIBC’s trading and treasury activities, and encompasses all market related positioning and market making activity.
The trading book consists of positions in financial instruments and commodities held to meet the near-term needs of our clients.
The non-trading book consists of positions in various currencies that are related to asset/liability management (ALM) and investment activities.
Governance and management
Market risk is managed through the three lines of defence model. Front line businesses are responsible for managing their risk – this is the first line of defence.
The second line of defence is Risk Management, which has a dedicated market risk manager for each trading business, supplemented by regional risk managers located in all of our major trading centres, facilitating comprehensive risk coverage. Compliance and other oversight functions also provide independent oversight for market and pension risks.
Internal Audit provides the third line of defence, with independent assessment of the design and operating effectiveness of risk management controls, processes and systems.
Senior management reports material risk matters to the GRC and RMC at least quarterly, including material transactions, limit compliance, and portfolio trends.
Policies
We have comprehensive policies for the management of market risk. These policies are related to the identification and measurement of various types of market risk, their inclusion in the trading book, and to the establishment of limits within which we monitor, manage, and report our overall exposures. Our policies also outline the requirements for the construction of valuation models, independent checking of the valuation of positions, the establishment of valuation adjustments, and alignment with accounting policies including MTM and mark-to-model methodologies.
Process and control
Market risk exposures are monitored daily against approved risk limits, and control processes are in place to monitor that only authorized activities are undertaken. We generate daily risk and limit-monitoring reports, based on the previous day’s positions. Summary market risk and limit compliance reports are produced and reviewed periodically with the GRC and RMC.
We have risk tolerance levels, expressed in terms of statistically based VaR measures, potential worst-case stress losses, and notional or other limits as appropriate. We use a multi-tiered approach to set limits on the amounts of risk that we can assume in our trading and non-trading activities, as follows:
| | • | | RMC limits control consolidated market risk; |
| | • | | Management limits control market risk for CIBC overall and are lower than the RMC limits to allow for a buffer in the event of extreme market moves and/or extraordinary client needs; |
| | • | | Tier 2 limits control market risk at the business unit level; |
| | • | | Tier 3 limits control market risk at the sub-business unit or desk level. Tier 3 limits are set on VaR and a variety of metrics including stress; and |
| | • | | Intraday limits are intended to accommodate client orders and related hedging only. |
Management limits are established by the CEO, consistent with the risk appetite statement approved by the RMC. Tier 2 and Tier 3 limits are approved at levels of management commensurate with risk assumed.
Risk measurement
We use the following measures for market risk:
| | • | | VaR enables the meaningful comparison of the risks in different businesses and asset classes. VaR is determined by the combined modelling of VaR for each of interest rate, credit spread, equity, foreign exchange, commodity, and debt specific risks, along with the portfolio effect arising from the interrelationship of the different risks (diversification effect): |
| | • | | Interest rate risk measures the impact of changes in interest rates and volatilities on cash instruments and derivatives; |
| | • | | Credit spread risk measures the impact of changes in credit spreads of provincial, municipal and agency bonds, sovereign bonds, corporate bonds, securitized products, and credit derivatives such as credit default swaps; |
| | • | | Equity risk measures the impact of changes in equity prices, volatilities, and dividend yields; |
| | • | | Foreign exchange risk measures the impact of changes in foreign exchange rates and volatilities; |
| | • | | Commodity risk measures the impact of changes in commodity prices and volatilities, including the basis between related commodities; |
| | • | | Debt specific risk measures the impact of changes in the volatility of the yield of a debt instrument as compared with the volatility of the yield of a representative bond index; and |
| | • | | Diversification effect reflects the risk reduction achieved across various financial instrument types, counterparties, currencies and regions. The extent of diversification benefit depends on the correlation between the assets and risk factors in the portfolio at a particular time. |
| | • | | Price sensitivity measures the change in value of a portfolio to a small change in a given underlying parameter, so that component risks may be examined in isolation, and the portfolio rebalanced accordingly to achieve a desired exposure; |
| | • | | Stressed VaR enables the meaningful comparison of the risks in different businesses and asset classes under stressful conditions. Changes to rates, prices, volatilities, and spreads over a ten day horizon from a stressful historical period are applied to current positions and determine stressed VaR; |
| | • | | IRC measures the required capital due to credit migration and default risk for debt securities held in the trading portfolios; |
| | • | | Back-testing validates the effectiveness of risk measurement through analysis of observed and theoretical profit and loss outcomes; and |
| | • | | Stress testing and scenario analyses provide insight into portfolio behaviour under extreme circumstances. |
| | | | |
| CIBC2015 ANNUAL REPORT | | | 61 | |
|
Management’s discussion and analysis |
The following table provides balances on the consolidated balance sheet which are subject to market risk. Certain differences between accounting and risk classifications are detailed in the footnotes below:
| | | | | | | | | | | | | | | | | | | | | | | | | | | | | | | | | | | | |
| $ millions, as at October 31 | | | | | 2015 | | | | | | 2014 | | | | |
| | | | | | Subject to market risk | | | | | | | | | Subject to market risk | | | | | | | |
| | | Consolidated
balance
sheet | | | Trading | | | Non-
trading | | | Not
subject to
market risk | | | Consolidated
balance
sheet | | | Trading | | | Non-
trading | | | Not
subject to
market risk | | | Non-traded risk
primary risk
sensitivity | |
Cash and non-interest-bearing deposits with banks | | $ | 3,053 | | | $ | – | | | $ | 1,770 | | | $ | 1,283 | | | $ | 2,694 | | | $ | – | | | $ | 1,573 | | | $ | 1,121 | | | | Foreign exchange | |
Interest-bearing deposits with banks | | | 15,584 | | | | 501 | | | | 15,083 | | | | – | | | | 10,853 | | | | 8 | | | | 10,845 | | | | – | | | | Interest rate | |
Securities | | | 74,982 | | | | 45,299 | (1) | | | 29,683 | | | | – | | | | 59,542 | | | | 45,638 | (1) | | | 13,904 | | | | – | | | | Equity, interest rate | |
Cash collateral on securities borrowed | | | 3,245 | | | | – | | | | 3,245 | | | | – | | | | 3,389 | | | | – | | | | 3,389 | | | | – | | | | Interest rate | |
Securities purchased under resale agreements | | | 30,089 | | | | – | | | | 30,089 | | | | – | | | | 33,407 | | | | – | | | | 33,407 | | | | – | | | | Interest rate | |
Loans | | | | | | | | | | | | | | | | | | | | | | | | | | | | | | | | | | | | |
Residential mortgages | | | 169,258 | | | | – | | | | 169,258 | | | | – | | | | 157,526 | | | | – | | | | 157,526 | | | | – | | | | Interest rate | |
Personal | | | 36,517 | | | | – | | | | 36,517 | | | | – | | | | 35,458 | | | | – | | | | 35,458 | | | | – | | | | Interest rate | |
Credit card | | | 11,804 | | | | – | | | | 11,804 | | | | – | | | | 11,629 | | | | – | | | | 11,629 | | | | – | | | | Interest rate | |
Business and government | | | 65,276 | | | | 5,658 | (2) | | | 59,618 | | | | – | | | | 56,075 | | | | 4,720 | (2) | | | 51,355 | | | | – | | | | Interest rate | |
Allowance for credit losses | | | (1,670 | ) | | | – | | | | (1,670 | ) | | | – | | | | (1,660 | ) | | | – | | | | (1,660 | ) | | | – | | | | Interest rate | |
Derivative instruments | | | 26,342 | | | | 22,457 | (3) | | | 3,885 | | | | – | | | | 20,680 | | | | 17,790 | (3) | | | 2,890 | | | | – | | |
| Interest rate,
foreign exchange |
|
Customers’ liability under acceptances | | | 9,796 | | | | – | | | | 9,796 | | | | – | | | | 9,212 | | | | – | | | | 9,212 | | | | – | | | | Interest rate | |
Other assets | | | 19,033 | | | | 1,381 | | | | 10,260 | | | | 7,392 | | | | 16,098 | | | | 1,506 | | | | 7,317 | | | | 7,275 | | |
| Interest rate, equity,
foreign exchange |
|
| | | $ | 463,309 | | | $ | 75,296 | | | $ | 379,338 | | | $ | 8,675 | | | $ | 414,903 | | | $ | 69,662 | | | $ | 336,845 | | | $ | 8,396 | | | | | |
Deposits | | $ | 366,657 | | | $ | 363 | (4) | | $ | 327,557 | | | $ | 38,737 | | | $ | 325,393 | | | $ | 371 | (4) | | $ | 289,087 | | | $ | 35,935 | | | | Interest rate | |
Obligations related to securities sold short | | | 9,806 | | | | 9,468 | | | | 338 | | | | – | | | | 12,999 | | | | 12,151 | | | | 848 | | | | – | | | | Interest rate | |
Cash collateral on securities lent | | | 1,429 | | | | – | | | | 1,429 | | | | – | | | | 903 | | | | – | | | | 903 | | | | – | | | | Interest rate | |
Obligations related to securities sold under repurchase agreements | | | 8,914 | | | | – | | | | 8,914 | | | | – | | | | 9,862 | | | | – | | | | 9,862 | | | | – | | | | Interest rate | |
Derivative instruments | | | 29,057 | | | | 24,655 | (3) | | | 4,402 | | | | – | | | | 21,841 | | | | 19,716 | (3) | | | 2,125 | | | | – | | |
| Interest rate,
foreign exchange |
|
Acceptances | | | 9,796 | | | | – | | | | 9,796 | | | | – | | | | 9,212 | | | | – | | | | 9,212 | | | | – | | | | Interest rate | |
Other liabilities | | | 12,223 | | | | 1,038 | | | | 5,138 | | | | 6,047 | | | | 10,932 | | | | 874 | | | | 4,232 | | | | 5,826 | | | | Interest rate | |
Subordinated indebtedness | | | 3,874 | | | | – | | | | 3,874 | | | | – | | | | 4,978 | | | | – | | | | 4,978 | | | | – | | | | Interest rate | |
| | | $ | 441,756 | | | $ | 35,524 | | | $ | 361,448 | | | $ | 44,784 | | | $ | 396,120 | | | $ | 33,112 | | | $ | 321,247 | | | $ | 41,761 | | | | | |
| (1) | Excludes securities in the structured credit run-off business of $565 million (2014: $759 million). These are considered non-trading for market risk purposes. |
| (2) | Excludes $333 million (2014: $180 million) of loans that are warehoused for future securitization purposes. These are considered non-trading for market risk purposes. |
| (3) | Excludes derivatives relating to the structured credit and other run-off businesses which are considered non-trading for market risk purposes. |
| (4) | Comprises FVO deposits which are considered trading for market risk purposes. |
Trading activities
We hold positions in traded financial contracts to meet client investment and risk management needs. Trading revenue (net interest income or non-interest income) is generated from these transactions. Trading instruments are recorded at fair value and include debt and equity securities, as well as interest rate, foreign exchange, equity, commodity, and credit derivative products.
Value-at-Risk
Our VaR methodology is a statistical technique that measures the potential overnight loss at a 99% confidence level. We use a full revaluation historical simulation methodology to compute VaR, stressed VaR and other risk measures.
Although a valuable guide to risk, VaR should always be viewed in the context of its limitations. For example:
| | • | | The use of historical data for estimating future events will not encompass all potential events, particularly those that are extreme in nature; |
| | • | | The use of a one-day holding period assumes that all positions can be liquidated or the risks offset in one day. This may not fully reflect the market risk arising at times of severe illiquidity, when a one-day period may be insufficient to liquidate or hedge all positions fully; |
| | • | | The use of a 99% confidence level does not take into account losses that might occur beyond this level of confidence; and |
| | • | | VaR is calculated on the basis of exposures outstanding at the close of business and assumes no management action to mitigate losses. |
The VaR table below presents market risks by type of risk and in aggregate. The risks are interrelated and the diversification effect reflects the reduction of risk due to portfolio effects among the trading positions. Our trading risk exposures to interest rates and credit spreads arise from activities in the global debt and derivative markets, particularly from transactions in the Canadian, U.S., and European markets. The primary instruments are government and corporate debt, and interest rate derivatives. The majority of the trading exposure to foreign exchange risk arises from transactions involving the Canadian dollar, U.S. dollar, Euro, pound sterling, Australian dollar, Chinese yuan, and Japanese yen, whereas the primary risks of losses in equities are in the U.S., Canadian, and European markets. Trading exposure to commodities arises primarily from transactions involving North American natural gas, crude oil products, and precious metals.
| | |
| 62 | | CIBC2015 ANNUAL REPORT |
|
Management’s discussion and analysis |
VaR by risk type – trading portfolio
| | | | | | | | | | | | | | | | | | | | | | | | | | | | | | | | |
| $ millions, as at or for the year ended October 31 | | | | | | | | | 2015 | | | | | | | | | | | | 2014 | |
| | | Year-end | | | Average | | | High | | | Low | | | Year-end | | | Average | | | High | | | Low | |
Interest rate risk | | $ | 1.6 | | | $ | 1.5 | | | $ | 3.3 | | | $ | 0.9 | | | $ | 2.0 | | | $ | 1.8 | | | $ | 3.8 | | | $ | 0.7 | |
Credit spread risk | | | 2.3 | | | | 2.8 | | | | 4.6 | | | | 1.7 | | | | 2.0 | | | | 1.5 | | | | 2.5 | | | | 0.9 | |
Equity risk | | | 2.0 | | | | 2.3 | | | | 6.3 | | | | 1.3 | | | | 1.7 | | | | 2.1 | | | | 9.1 | | | | 1.2 | |
Foreign exchange risk | | | 1.3 | | | | 0.9 | | | | 2.5 | | | | 0.4 | | | | 0.5 | | | | 0.8 | | | | 1.7 | | | | 0.3 | |
Commodity risk | | | 1.5 | | | | 1.6 | | | | 3.0 | | | | 0.6 | | | | 1.0 | | | | 1.1 | | | | 2.0 | | | | 0.6 | |
Debt specific risk | | | 1.7 | | | | 2.0 | | | | 3.0 | | | | 1.1 | | | | 1.9 | | | | 2.4 | | | | 3.5 | | | | 1.9 | |
Diversification effect (1) | | | (7.0 | ) | | | (7.1 | ) | | | n/m | | | | n/m | | | | (6.1 | ) | | | (6.2 | ) | | | n/m | | | | n/m | |
Total VaR (one-day measure) | | $ | 3.4 | | | $ | 4.0 | | | $ | 7.3 | | | $ | 2.7 | | | $ | 3.0 | | | $ | 3.5 | | | $ | 9.7 | | | $ | 2.1 | |
| | (1) | Total VaR is less than the sum of the VaR of the different market risk types due to risk offsets resulting from a portfolio diversification effect. |
| | n/m | Not meaningful. It is not meaningful to compute a diversification effect because the high and low may occur on different days for different risk types. |
Average total VaR for the year ended October 31, 2015 was up $0.5 million from the prior year. The increase was driven by an increase in credit spread, equity, foreign exchange, and commodity risks, partially offset by a decrease in interest rate and debt specific risks.
Stressed VaR
The stressed VaR measure is intended to replicate the VaR calculation that would be generated for our current portfolio if the values of the relevant market risk factors were sourced from a period of stressed market conditions. The model inputs are calibrated to historical data from a continuous12-month period of significant financial stress relevant to our current portfolio since December 2006. Our current stressed VaR period is from September 10, 2008 to September 8, 2009.
Stressed VaR by risk type – trading portfolio
| | | | | | | | | | | | | | | | | | | | | | | | | | | | | | | | |
| $ millions, as at or for the year ended October 31 | | | | | | 2015 | | | | | | | | | | | | 2014 | |
| | | Year-end | | | Average | | | High | | | Low | | | Year-end | | | Average | | | High | | | Low | |
Interest rate risk | | $ | 9.3 | | | $ | 6.7 | | | $ | 15.9 | | | $ | 2.5 | | | $ | 5.8 | | | $ | 6.4 | | | $ | 18.0 | | | $ | 0.5 | |
Credit spread risk | | | 10.9 | | | | 13.5 | | | | 19.0 | | | | 9.3 | | | | 14.1 | | | | 8.0 | | | | 14.2 | | | | 1.3 | |
Equity risk | | | 4.2 | | | | 2.4 | | | | 16.8 | | | | 1.1 | | | | 1.7 | | | | 2.8 | | | | 21.3 | | | | 0.7 | |
Foreign exchange risk | | | 3.4 | | | | 3.8 | | | | 11.0 | | | | 0.6 | | | | 7.3 | | | | 2.8 | | | | 13.9 | | | | 0.2 | |
Commodity risk | | | 2.1 | | | | 4.0 | | | | 10.1 | | | | 1.1 | | | | 3.1 | | | | 4.9 | | | | 14.7 | | | | 0.3 | |
Debt specific risk | | | 2.5 | | | | 3.7 | | | | 5.3 | | | | 2.0 | | | | 3.5 | | | | 3.5 | | | | 5.6 | | | | 0.7 | |
Diversification effect (1) | | | (20.8 | ) | | | (20.8 | ) | | | n/m | | | | n/m | | | | (17.1 | ) | | | (17.2 | ) | | | n/m | | | | n/m | |
Stressed total VaR (one-day measure) | | $ | 11.6 | | | $ | 13.3 | | | $ | 27.4 | | | $ | 8.7 | | | $ | 18.4 | | | $ | 11.2 | | | $ | 22.7 | | | $ | 3.1 | |
| | (1) | Stressed total VaR is less than the sum of the VaR of the different market risk types due to risk offsets resulting from a portfolio diversification effect. |
| | n/m | Not meaningful. It is not meaningful to compute a diversification effect because the high and low may occur on different days for different risk types. |
Average stressed total VaR for the year ended October 31, 2015 was up $2.1 million from the prior year. The increase was driven by an increase in our interest rate, credit spread, foreign exchange, and debt specific risks, partially offset by a reduction in equity and commodity risks.
Incremental risk charge
IRC is a measure of default and migration risk for debt securities held in the trading portfolios. Our IRC methodology is a statistical technique that measures the risk of issuer migration and default over a period of one year by simulating changes in issuer credit rating. Validation of the model included testing of the liquidity horizon, recovery rate, correlation, and probability of default and migration.
IRC – trading portfolio
| | | | | | | | | | | | | | | | | | | | | | | | | | | | | | | | |
| $ millions, as at or for the year ended October 31 | | | | | | | | | | | 2015 | | | | | | | | | | | | 2014 | |
| | | Year-end | | | Average | | | High | | | Low | | | Year-end | | | Average | | | High | | | Low | |
Default risk | | $ | 64.2 | | | $ | 94.6 | | | $ | 156.6 | | | $ | 63.4 | | | $ | 71.5 | | | $ | 81.6 | | | $ | 117.0 | | | $ | 62.6 | |
Migration risk | | | 27.3 | | | | 40.3 | | | | 50.9 | | | | 26.4 | | | | 45.7 | | | | 43.1 | | | | 66.7 | | | | 27.8 | |
IRC (one-year measure) | | $ | 91.5 | | | $ | 134.9 | | | $ | 202.4 | | | $ | 91.5 | | | $ | 117.2 | | | $ | 124.7 | | | $ | 171.5 | | | $ | 94.7 | |
Average IRC for the year ended October 31, 2015 was up $10.2 million from the prior year due to the changes in the composition of fixed income instruments in the trading portfolio.
Back-testing
To determine the reliability of the trading VaR model, outcomes are monitored regularly through a back-testing process to test the validity of the assumptions and the parameters used in the trading VaR calculation. The back-testing process includes calculating a hypothetical or static profit and loss and comparing that result with calculated VaR. Static profit and loss represents the change in value of the prior day’s closing portfolio due to each day’s price movements, on the assumption that the contents of the portfolio remained unchanged. The back-testing process is conducted on a daily basis at the consolidated CIBC level. Back-testing is also performed for business lines and individual portfolios.
Static profit and loss and trading losses in excess of the one-day VaR are investigated. The back-testing process, including the investigation of results, is performed by risk professionals who are independent of those responsible for development of the model.
Internal Audit also reviews our models, validation processes, and results of our back-testing. Based on our back-testing results, we are able to ensure that our VaR model continues to appropriately measure risk.
During the year, there were three negative back-testing breaches of the total VaR measure, in line with statistical expectations.
| | | | |
| CIBC2015 ANNUAL REPORT | | | 63 | |
|
Management’s discussion and analysis |
Trading revenue
Trading revenue (TEB) comprises both trading net interest income and non-interest income and excludes underwriting fees and commissions. Trading revenue (TEB) in the charts below excludes positions described in the “Structured credit run-off business” section of the MD&A and certain other exited portfolios.
During the year, trading revenue (TEB) was positive for 99% of the days. The largest gain of $31.1 million occurred on April 1, 2015, and was attributable to the normal course of business, notably within the equity derivatives business. The largest loss of $1.9 million occurred on October 30, 2015, driven by recognition of various month end valuation adjustments across the portfolio. Average daily trading revenue (TEB) was $4.5 million during the year, of which the TEB adjustment was $1.9 million.
Frequency distribution of daily 2015 trading revenue (TEB)
The histogram below presents the frequency distribution of daily trading revenue (TEB) for 2015.
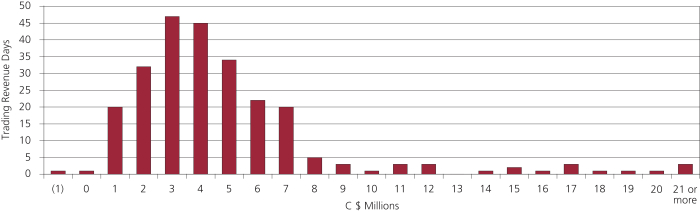
Trading revenue (TEB) versus VaR
The trading revenue (TEB) versus VaR graph below shows the current year’s daily trading revenue (TEB) against the close of business day VaR measures. Trading revenue distribution on which VaR is calculated is not on a TEB basis.
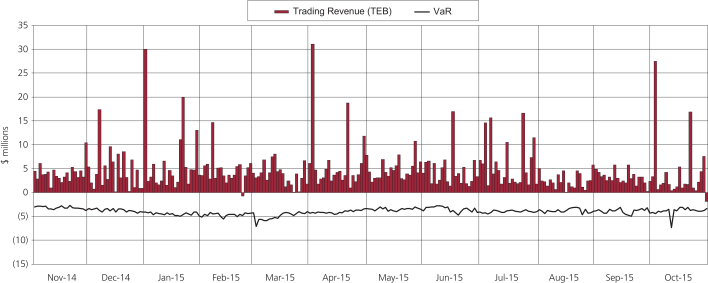
Stress testing and scenario analysis
Stress testing and scenario analyses are designed to add insight to possible outcomes of abnormal market conditions, and to highlight possible risk concentrations.
Our stress testing and scenario analysis measure the effect on portfolio values of a wide range of extreme moves in market risk factors. The methodology is a one-month stress test scenario and assumes that no actions are taken during the stress event to mitigate risk, reflecting the decreased liquidity that frequently accompanies market shocks.
Our scenario analysis approach simulates the impact on earnings of extreme market events up to a period of one month. Scenarios are developed using historical market data during periods of market disruption, or are based on the hypothetical occurrence of economic events, political events and natural disasters suggested and designed by economists, business leaders, and risk managers.
Among the historical scenarios are the 1994 period of U.S. Federal Reserve tightening, the 1998 Russian-led crisis, and the market events following the 2008 market crisis. The hypothetical scenarios include potential market crises originating in North America and Asia.
Below are our core stress test scenarios which we run daily to add insight into potential exposure levels under stress. Stress testing scenarios are periodically reviewed and amended as necessary to ensure they remain relevant.
Under worst-case stress test scenarios limit monitoring, limits are placed on the maximum acceptable loss for the aggregate portfolio, at the detailed portfolio level, and at specific asset class types.
| | |
| 64 | | CIBC2015 ANNUAL REPORT |
|
Management’s discussion and analysis |
Stress scenario list
| | | | |
| 1. Subprime crisis and Lehman collapse – 2008 | | 4. Tech bubble burst – 2000 | | 7. Domestic political instability |
| 2. U.S. Fed tightening – 1994 | | 5. U.S. sovereign debt default and downgrade | | 8. Real estate market crash |
| 3. Russian debt crisis – 1998 | | 6. Chinese hard landing | | |
Average stress testing results(1) for 2015 and 2014 for each of the 8 scenarios noted above from our trading positions are provided in the chart below:
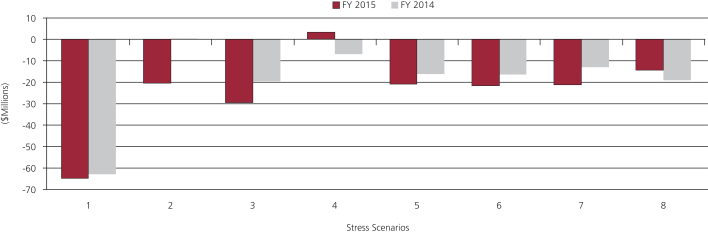
| (1) | The 2014 average stress testing is a blended value between two approaches as a result of the implementation of the full revaluation method of computing VaR in place of the parametric approach in the beginning of 2014. |
Non-exchange traded commodity derivatives
In the normal course of business, we trade non-exchange traded commodity derivative contracts. We control and manage our non-exchange traded commodity derivatives risk through the VaR and stress testing methodologies described above. We use modelling techniques or other valuation methodologies to determine the fair value of these contracts.
The following table provides the fair value, based upon maturity of non-exchange traded commodity contracts:
| | | | | | | | | | | | |
| $ millions, as at October 31, 2015 | | Positive | | | Negative | | | Net | |
Maturity less than 1 year | | $ | 419 | | | $ | 1,029 | | | $ | (610 | ) |
Maturity 1 – 3 years | | | 554 | | | | 1,175 | | | | (621 | ) |
Maturity 4 – 5 years | | | 82 | | | | 93 | | | | (11 | ) |
Maturity in excess of 5 years | | | 78 | | | | 28 | | | | 50 | |
| | | $ | 1,133 | | | $ | 2,325 | | | $ | (1,192 | ) |
Non-trading activities
Interest rate risk
Non-trading interest rate risk, which includes structural interest rate risk, consists primarily of risk inherent in ALM activities and the activities of domestic and foreign subsidiaries. Interest rate risk results from differences in the maturities or repricing dates of assets and liabilities, both on- and off-balance sheet, as well as from embedded optionality in retail products. This optionality arises predominantly from the prepayment exposures of mortgage products, mortgage commitments and some guaranteed investment certificates products with early redemption features. A variety of cash instruments and derivatives, primarily interest rate swaps, futures and options, are used to manage these risks.
The Board has oversight of the management of non-trading market risk, sets the market risk appetite and annually approves the market risk limits. GALCO and the Asset and Liability Management Committee regularly review structural market risk positions and provide senior management oversight.
In addition to Board-approved limits on earnings and economic value exposure, more granular management limits are in place to guide day-to-day management of this risk. The ALM group within Treasury is responsible for the ongoing management of structural market risk across the enterprise, with independent oversight and compliance with non-trading market risk policy provided by Capital Markets Risk Management.
ALM activities are designed to manage the effects of potential interest rate movements while balancing the cost of any hedging activities on the current net revenue. The net income sensitivity is a measure of the impact of potential changes in interest rates on the projected 12-month after-tax net income of a portfolio of assets, liabilities and off-balance sheet positions in response to prescribed parallel interest rate movements with interest rates floored at zero.
Our total non-trading interest rate risk exposure, as at October 31, 2015, is included in Note 17 to the consolidated financial statements. On- and off-balance sheet assets and liabilities are generally reported based on the earlier of their contractual repricing or maturity date; however, our disclosure includes the assumed interest rate sensitivity of certain assets and liabilities (including core deposits and credit card balances), reflecting how we manage interest rate risk. The interest rate position reported in Note 17 presents our risk exposure only at a point in time. The exposure can change depending on client preference for products and terms, including mortgage prepayment or other options exercised, and the nature of our management of the various and diverse portfolios that comprise the consolidated interest rate risk position.
The following table shows the potential impact over the next 12 months, adjusted for structural assumptions (excluding shareholders’ equity in the calculation of the present value of shareholders’ equity), estimated prepayments and early withdrawals, of an immediate and sustained 100 and 200 basis point increase or decrease in interest rates.
| | | | |
| CIBC2015 ANNUAL REPORT | | | 65 | |
|
Management’s discussion and analysis |
Interest rate sensitivity – non-trading (after-tax)
| | | | | | | | | | | | | | | | | | | | | | | | |
| $ millions, as at October 31 | | | | | | | | 2015 | | | | | | | | | 2014 | |
| | | CAD | | | USD | | | Other | | | CAD | | | USD | | | Other | |
100 basis point increase in interest rates | | | | | | | | | | | | | | | | | | | | | | | | |
Increase (decrease) in net income attributable to equity shareholders | | $ | 83 | | | $ | (5 | ) | | $ | – | | | $ | 124 | | | $ | (3 | ) | | $ | (3 | ) |
Increase (decrease) in present value of shareholders’ equity | | | (87 | ) | | | (128 | ) | | | (27 | ) | | | (125 | ) | | | (19 | ) | | | (30 | ) |
100 basis point decrease in interest rates | | | | | | | | | | | | | | | | | | | | | | | | |
Increase (decrease) in net income attributable to equity shareholders | | $ | (154 | ) | | $ | (8 | ) | | $ | – | | | $ | (186 | ) | | $ | 1 | | | $ | 4 | |
Increase (decrease) in present value of shareholders’ equity | | | (39 | ) | | | 92 | | | | 26 | | | | 80 | | | | 10 | | | | 31 | |
200 basis point increase in interest rates | | | | | | | | | | | | | | | | | | | | | | | | |
Increase (decrease) in net income attributable to equity shareholders | | $ | 154 | | | $ | (9 | ) | | $ | 1 | | | $ | 229 | | | $ | (6 | ) | | $ | (7 | ) |
Increase (decrease) in present value of shareholders’ equity | | | (188 | ) | | | (256 | ) | | | (54 | ) | | | (260 | ) | | | (39 | ) | | | (60 | ) |
200 basis point decrease in interest rates | | | | | | | | | | | | | | | | | | | | | | | | |
Increase (decrease) in net income attributable to equity shareholders | | $ | (244 | ) | | $ | (13 | ) | | $ | – | | | $ | (395 | ) | | $ | 3 | | | $ | 8 | |
Increase (decrease) in present value of shareholders’ equity | | | (279 | ) | | | 103 | | | | 45 | | | | (64 | ) | | | 17 | | | | 56 | |
Foreign exchange risk
Non-trading foreign exchange risk, also referred to as structural foreign exchange risk, arises primarily from our investments in foreign operations. This risk, predominantly in U.S. dollars, is managed using derivative hedges and by funding the investments in foreign currencies. We actively manage this risk to ensure that the potential impact on our capital ratios is within tolerances set by the RMC, while giving consideration to the impact on earnings.
Structural foreign exchange risk is managed by Treasury under the supervision of the ExCo, with the overall risk appetite established by the Board. Compliance with trading and non-trading market risk policy, as well as market risk limits, is monitored daily by Capital Markets Risk Management.
A 1% appreciation of the Canadian dollar would reduce our shareholders’ equity as at October 31, 2015 by approximately $47 million (2014: $44 million) on an after-tax basis.
Our non-functional currency denominated earnings are converted into the functional currencies through spot or forward foreign exchange transactions. Thus, there is no significant impact of exchange rate fluctuations on our consolidated statement of income, except for foreign functional currency earnings, which are translated at average monthly exchange rates as they arise.
We hedge certain foreign currency contractual expenses using derivatives which are accounted for as cash flow hedges. The net change in fair value of these hedging derivatives included in AOCI amounted to a gain of $21 million (2014: $8 million) on an after-tax basis. This amount will be released from AOCI to offset the hedged currency fluctuations as the expenses are incurred.
Derivatives held for ALM purposes
Where derivatives are held for ALM purposes, and when transactions meet the criteria specified under IFRS, we apply hedge accounting for the risks being hedged, as discussed in Notes 12 and 13 to the consolidated financial statements. Derivative hedges that do not qualify for hedge accounting treatment are referred to as economic hedges and are recorded at fair value on the consolidated balance sheet with changes in fair value recognized in the consolidated statement of income.
Economic hedges for other than FVO financial instruments may lead to income volatility because the hedged items are recorded either on a cost or amortized cost basis. This income volatility may not be representative of the overall risk.
Equity risk
Non-trading equity risk arises primarily in our strategy and corporate development activities and our merchant banking activities. The investments comprise public and private equities, investments in limited partnerships, and equity-accounted investments.
The following table provides the amortized cost and fair values of our non-trading equities:
| | | | | | | | | | |
| $ millions, as at October 31 | | Amortized cost | | | Fair value | |
| 2015 | | AFS securities | | $ | 273 | | | $ | 446 | |
| | | Equity-accounted investments in associates (1) | | | 1,504 | | | | 1,815 | |
| | | | | $ | 1,777 | | | $ | 2,261 | |
| 2014 | | AFS securities | | $ | 278 | | | $ | 630 | |
| | | Equity-accounted investments in associates (1) | | | 1,610 | | | | 2,203 | |
| | | | | $ | 1,888 | | | $ | 2,833 | |
| | (1) | Excludes our equity-accounted joint ventures. See Note 26 to the consolidated financial statements for further details. |
Pension risk
A number of defined benefit pension plans are operated globally. As at October 31, 2015, our consolidated defined benefit pension plans were in a net funded status surplus position of $463 million, compared with $61 million as at October 31, 2014. The change in the net funded status position of our pension plans is disclosed in Note 19 to the consolidated financial statements.
The MRCC has been delegated fiduciary responsibility from the Board for pension plans. Pension market risk arises primarily from movements in interest rates, credit spreads, equity prices and investments.
Our Canadian pension plans represent approximately 90% of our pension plans, the most significant of which is our principal Canadian pension plan (the CIBC Pension Plan). The estimated impact on our Canadian defined benefit obligations of a 100 bps change in the discount rate is disclosed in Note 19 to the consolidated financial statements.
The MRCC is responsible for setting an appropriate investment strategy for the CIBC Pension Plan through a Statement of Investment Objectives, Policies and Procedures. The target asset allocation for our principal plan is 60% in equities and 40% in fixed income securities.
Pension Risk Management ensures that the governance, management and operational frameworks of our pension plans align with their desired risk profiles.
The use of derivatives is permitted within the CIBC Pension Plan, in accordance with the derivatives policy that was approved by the Pension Benefits Management Committee and the MRCC of the Board, to manage risk at the discretion of the Pension Investment Committee. Risk reduction and mitigation strategies may include hedging of interest rate, currency, credit spread and/or equity risks. The derivatives policy also permits the use of derivatives to enhance plan returns.
The CIBC Pension Plan minimizes its foreign currency exposure by utilizing a passive currency overlay strategy to reduce the aggregate currency exposure from foreign equities. The fair value of derivatives used for the purposes of currency overlay is disclosed in Note 19 to the consolidated financial statements.
| | |
| 66 | | CIBC2015 ANNUAL REPORT |
|
Management’s discussion and analysis |
Liquidity risk
Liquidity risk is the risk of having insufficient cash or its equivalent to meet financial obligations as they come due. Common sources of liquidity risk inherent in banking services include unanticipated withdrawals of deposits, the inability to replace maturing debt, credit and liquidity commitments, and additional pledging or other collateral requirements.
Governance and management
Our liquidity risk management strategies seek to maintain sufficient liquid assets and diversified funding sources to consistently fund our balance sheet and contingent obligations, and maintain the strength of our enterprise under both normal and stressed conditions.
We manage liquidity risk in a manner that enables us to withstand a liquidity stress event without an adverse impact on the viability of our operations. Actual and anticipated inflows and outflows of funds generated from on- and off-balance sheet exposures are measured and monitored on a daily basis to ensure compliance with established limits.
Liquidity risk is managed using the three lines of defence model, with the ongoing management of liquidity risk the responsibility of the Treasurer, supported by guidance from GALCO.
The Treasurer is responsible for managing and coordinating the activities and processes required for measurement, reporting and monitoring of CIBC’s liquidity risk – this is the first line of defence.
The Balance Sheet, Liquidity and Pension Risk Management group provides independent oversight of liquidity risk as the second line of defence.
Internal Audit provides the third line of defence, with independent assessment of the design and operating effectiveness of liquidity risk management controls, processes and systems.
GALCO oversees CIBC’s liquidity risk management, ensuring liquidity risk framework, policies, methodologies and assumptions are regularly reviewed and, as appropriate, modified to ensure alignment with our operating environment and regulatory requirements. The Liquidity Risk Management Committee, a subcommittee of GALCO, also specifically monitors global liquidity risk, and includes senior management from Treasury, Risk Management and regional operations.
The RMC provides governance through review of CIBC’s liquidity management framework that includes the procedures, limits and independent monitoring structures, and approval of CIBC’s liquidity risk management policy and funding plan.
GALCO’s responsibilities include:
| • | | Ensuring that CIBC’s liquidity profile is managed consistent with the stated risk appetite and regulatory requirements; |
| • | | Monitoring the reporting and metrics related to liquidity risk exposure, such as the Liquidity Horizon, funding profile and key early warning indicators; |
| • | | Reviewing, on a periodic basis, the liquidity stress assumptions used to measure liquidity risk exposure; and |
| • | | Reviewing and approving the funding plan. |
RMC’s responsibilities include:
| • | | Recommending liquidity risk tolerance to CIBC’s Board through the risk appetite statement; |
| • | | Reviewing and approving the liquidity risk management policy, CIBC’s funding plan and the global contingency funding plan (CFP); and |
| • | | Reviewing the liquidity stress scenario used in the Liquidity Horizon metric. |
Policies
Our liquidity risk management policy requires a sufficient amount of available unencumbered liquid assets to meet anticipated liquidity needs in both normal and stressed conditions for a minimum time period as measured by CIBC’s Liquidity Horizon. CIBC subsidiaries possessing unique liquidity characteristics, due to distinct business or jurisdictional requirements, maintain local liquidity policies in alignment with CIBC’s liquidity risk management policy.
CIBC’s pledging policy sets out consolidated aggregate pledge limits for both financial and non-financial assets. Pledged assets are considered encumbered and therefore unavailable for liquidity purposes.
We maintain a detailed global CFP that documents liquidity management actions and governance in response to liquidity stress events.
Process and control
Measurement and management of liquidity risk is performed regionally and centralized in Treasury. Contractual and behavioural on- and off-balance sheet cash flows under normal and stressed conditions are modeled and used to determine liquidity levels to be maintained throughout the policy-prescribed time horizon.
The Balance Sheet, Liquidity and Pension Risk Management group’s role includes global accountability for the liquidity risk management of all CIBC legal entities and consolidated global exposure. They are responsible for ensuring that all liquidity risks incurred by CIBC are properly identified, analyzed, quantified and in alignment with CIBC’s risk appetite.
The RMC is regularly informed of current and prospective liquidity conditions and ongoing enhancement and implementation of monitoring measures and measurement tools.
Risk measurement
Our liquidity risk tolerance is defined by our risk appetite statement, which is approved annually by the Board, and forms the basis for the delegation of liquidity risk authority to senior management. We use both external regulatory-driven and internal liquidity risk metrics to measure our liquidity risk exposure. Internally, our liquidity position is measured using the Liquidity Horizon. The Liquidity Horizon measures the future point in time when projected cumulative cash outflows exceed cash inflows under a predefined liquidity stress scenario. Expected and potential anticipated inflows and outflows of funds generated from on- and off-balance sheet exposures are measured and monitored on a daily basis to ensure compliance with established limits. Contractual and behavioural on- and off-balance sheet cash flows under normal and stressed conditions are modeled and used to determine liquidity levels against the prescribed management target.
Our liquidity measurement system provides liquidity risk exposure reports that include the calculation of the Liquidity Horizon and regulatory reporting such as the LCR and Net Cumulative Cash Flow (NCCF). Our liquidity management framework also incorporates the monitoring of our unsecured wholesale funding position and funding capacity.
| | | | |
| CIBC2015 ANNUAL REPORT | | | 67 | |
|
Management’s discussion and analysis |
Risk appetite
CIBC’s risk appetite statement ensures prudent management of liquidity risk by outlining qualitative considerations and quantitative metrics. These include the LCR, and a minimum Liquidity Horizon that contemplates a severe combined CIBC-specific and market-wide stress scenario. Quantitative metrics are measured and managed to a set of GALCO-approved management limits, which are more stringent than the limits established by the RMC.
Stress testing
A key component of our liquidity risk management is the liquidity risk stress testing framework. Liquidity stress testing involves the application of name-specific and market-wide stress scenarios at multiple levels of severity to assess the amount of available liquidity required to satisfy anticipated obligations as they come due. The scenarios model potential liquidity and funding requirements in the event of unsecured wholesale funding and deposit run-off, expected contingent liquidity utilization, as well as liquid asset marketability.
Stress scenario assumptions are subject to periodic review, at least annually, by the RMC.
Liquid and encumbered assets
Our policy is to maintain a pool of high quality unencumbered liquid assets that are readily available to meet outflows determined under stressed conditions. Liquid assets include cash, high quality marketable securities and other assets that can be readily pledged at central banks and in repo markets or converted into cash in a timely fashion. We do not include encumbered assets which are composed of assets pledged as collateral and other assets that we consider restricted due to legal, operational, or other reasons.
Liquid assets from on- and off-balance sheet sources net of encumbrance constitute our unencumbered pool of liquid assets and are summarized in the following table:
| | | | | | | | | | | | | | | | | | | | | | | | | | | | | | | | |
| $ millions, as at October 31 | | | | | | | | | | | | | | | | | | | 2015 | | | 2014 | |
| | | Gross liquid assets | | | | | Encumbered liquid assets (1) | | | | | Unencumbered liquid assets | |
| | | | CIBC owned assets | | | | | | Third-party assets | | | | | | CIBC owned assets | | | | | | Third-party assets | | | | | | | |
Cash and due from banks | | $18,637 (2) | | (2) | | | | $ | – | | | | | $ | 460 | | | | | $ | – | | | | | $ | 18,177 | | | $ | 13,200 | |
Securities | | | 73,866 | (3) | | | | | 66,561 | (4) | | | | | 24,603 | | | | | | 32,952 | | | | | | 82,872 | | | | 70,495 | |
National Housing Act mortgage-backed securities | | | 55,554 | (5) | | | | | – | | | | | | 23,114 | | | | | | – | | | | | | 32,440 | | | | 32,718 | |
Mortgages | | | 11,962 | (6) | | | | | – | | | | | | 11,962 | | | | | | – | | | | | | – | | | | – | |
Credit cards | | | 4,782 | (7) | | | | | – | | | | | | 4,782 | | | | | | – | | | | | | – | | | | – | |
Other assets | | | 5,887 | (8) | | | | | – | | | | | | 5,460 | | | | | | – | | | | | | 427 | | | | 381 | |
| | | $ | 170,688 | | | | | $ | 66,561 | | | | | $ | 70,381 | | | | | $ | 32,952 | | | | | $ | 133,916 | | | $ | 116,794 | |
| | (1) | Excludes intraday pledges to the Bank of Canada related to the Large Value Transfer System as these are normally released at the end of the settlement cycle each day. | |
| | (2) | Includes cash, non-interest-bearing deposits and interest-bearing deposits with contractual maturities of less than 30 days. | |
| | (3) | Includes trading, AFS and FVO securities. Excludes securities in our structured credit run-off business, private debt and private equity securities of $1,116 million (2014: $1,340 million). | |
| | (4) | Includes $3,245 million (2014: $3,389 million) of cash collateral received on securities borrowed, $30,089 million (2014: $33,407 million) of securities purchased under resale agreements, $32,169 million (2014: $26,118 million) of securities borrowed against securities lent, and $1,058 million (2014: $2,285 million) of securities received for derivatives collateral. | |
| | (5) | Includes securitized and transferred residential mortgages under the Canada Mortgage Bond, and securitized mortgages that were not transferred to external parties. These are reported in Loans on our consolidated balance sheet. | |
| | (6) | Includes mortgages in the Covered Bond Programme. | |
| | (7) | Includes assets held in consolidated trusts supporting funding liabilities. | |
| | (8) | Includes $5,460 million (2014: $3,756 million) of cash pledged for derivatives collateral and $427 million (2014: $381 million) of gold and silver certificates. | |
In the course of CIBC’s day-to-day operations, securities and other assets are pledged to secure obligations, participate in clearing and settlement systems and for other collateral management purposes. For additional details, see Note 22 to the consolidated financial statements.
The table presented above represents the carrying value of CIBC’s liquid assets available for use in liquidity stress. The liquidity value of liquid assets is determined by applying asset haircut assumptions under a stress scenario which consider those haircuts applicable at central banks, such as the Bank of Canada and the Federal Reserve Bank of New York, historical observation, securities characteristics including type, issuer, credit ratings, currency and remaining term to maturity, and regulatory guidance.
Our unencumbered liquid assets increased by $17.1 billion or 15% from October 31, 2014, primarily due to an increase in unencumbered securities and interest-bearing deposits with banks as a result of normal operations and business initiatives.
Additionally, CIBC maintains eligibility to the Bank of Canada Emergency Lending Assistance (ELA) program and the Federal Reserve Bank’s Discount Window.
The following table summarizes unencumbered liquid assets held by CIBC (parent) and significant subsidiaries:
| | | | | | | | |
| $ millions, as at October 31 | | 2015 | | | 2014 | |
CIBC (parent) | | $ | 100,698 | | | $ | 98,979 | |
CIBC World Markets Inc. (1) | | | 16,005 | | | | 13,181 | |
Other subsidiaries | | | 17,213 | | | | 4,634 | |
| | | $ | 133,916 | | | $ | 116,794 | |
| (1) | Includes CIBC World Markets Inc. and CIBC World Markets Corp. |
| | |
| 68 | | CIBC2015 ANNUAL REPORT |
|
Management’s discussion and analysis |
Asset encumbrance
The following table provides a summary of our total encumbered and unencumbered assets:
| | | | | | | | | | | | | | | | | | | | | | | | | | | | | | | | |
| | | | | | | | | | | | | | Encumbered | | | | | Unencumbered | |
| $ millions, as at October 31 | | CIBC owned
assets | | | Third-party
assets | | | Total assets | | | Pledged as
collateral | | | Other | | | | | Available as
collateral | | | Other | |
2015 | | Cash and deposits with banks | | $ | 18,637 | | | $ | – | | | $ | 18,637 | | | $ | 16 | | | $ | 444 | | | | | $ | 18,177 | | | $ | – | |
| | Securities | | | 74,982 | | | | – | | | | 74,982 | | | | 24,603 | | | | – | | | | | | 49,263 | | | | 1,116 | |
| | Securities borrowed or purchased under resale agreements | | | | | | | 33,334 | | | | 33,334 | | | | 16,748 | | | | – | | | | | | 16,586 | | | | – | |
| | Loans, net of allowance | | | 281,185 | | | | – | | | | 281,185 | | | | 39,858 | | | | 76 | | | | | | 32,440 | | | | 208,811 | |
| | Other | | | | | | | | | | | | | | | | | | | | | | | | | | | | | | |
| | Derivative instruments | | | 26,342 | | | | – | | | | 26,342 | | | | – | | | | – | | | | | | – | | | | 26,342 | |
| | Customers’ liability under acceptances | | | 9,796 | | | | – | | | | 9,796 | | | | – | | | | – | | | | | | – | | | | 9,796 | |
| | Land, building and equipment | | | 1,897 | | | | – | | | | 1,897 | | | | – | | | | – | | | | | | – | | | | 1,897 | |
| | Goodwill | | | 1,526 | | | | – | | | | 1,526 | | | | – | | | | – | | | | | | – | | | | 1,526 | |
| | Software and other intangible assets | | | 1,197 | | | | – | | | | 1,197 | | | | – | | | | – | | | | | | – | | | | 1,197 | |
| | Investments in equity-accounted associates and joint ventures | | | 1,847 | | | | – | | | | 1,847 | | | | – | | | | – | | | | | | – | | | | 1,847 | |
| | | Other assets | | | 12,566 | | | | – | | | | 12,566 | | | | 5,460 | | | | – | | | | | | 427 | | | | 6,679 | |
| | | | | $ | 429,975 | | | $ | 33,334 | | | $ | 463,309 | | | $ | 86,685 | | | $ | 520 | | | | | $ | 116,893 | | | $ | 259,211 | |
2014 | | Cash and deposits with banks | | $ | 13,547 | | | $ | – | | | $ | 13,547 | | | $ | 8 | | | $ | 339 | | | | | $ | 13,200 | | | $ | – | |
| | Securities | | | 59,542 | | | | – | | | | 59,542 | | | | 19,004 | | | | – | | | | | | 39,198 | | | | 1,340 | |
| | Securities borrowed or purchased under resale agreements | | | – | | | | 36,796 | | | | 36,796 | | | | 14,404 | | | | – | | | | | | 22,392 | | | | – | |
| | Loans, net of allowance | | | 259,028 | | | | – | | | | 259,028 | | | | 39,159 | | | | 197 | | | | | | 32,718 | | | | 186,954 | |
| | Other | | | | | | | | | | | | | | | | | | | | | | | | | | | | | | |
| | Derivative instruments | | | 20,680 | | | | – | | | | 20,680 | | | | – | | | | – | | | | | | – | | | | 20,680 | |
| | Customers’ liability under acceptances | | | 9,212 | | | | – | | | | 9,212 | | | | – | | | | – | | | | | | – | | | | 9,212 | |
| | Land, building and equipment | | | 1,797 | | | | – | | | | 1,797 | | | | – | | | | – | | | | | | – | | | | 1,797 | |
| | Goodwill | | | 1,450 | | | | – | | | | 1,450 | | | | – | | | | – | | | | | | – | | | | 1,450 | |
| | Software and other intangible assets | | | 967 | | | | – | | | | 967 | | | | – | | | | – | | | | | | – | | | | 967 | |
| | Investments in equity-accounted associates and joint ventures | | | 1,923 | | | | – | | | | 1,923 | | | | – | | | | – | | | | | | – | | | | 1,923 | |
| | | Other assets | | | 9,961 | | | | – | | | | 9,961 | | | | 3,756 | | | | – | | | | | | 381 | | | | 5,824 | |
| | | | | $ | 378,107 | | | $ | 36,796 | | | $ | 414,903 | | | $ | 76,331 | | | $ | 536 | | | | | $ | 107,889 | | | $ | 230,147 | |
Restrictions on the flow of funds
Our subsidiaries are not subject to significant restrictions that would prevent transfers of funds, dividends or capital distributions, except that certain subsidiaries have separate regulatory capital and liquidity requirements, as established by applicable banking and securities regulators.
We monitor and manage our capital and liquidity requirements across these entities to ensure that resources are used efficiently and that each entity is in compliance with local regulatory and policy requirements.
Liquidity coverage ratio
In December 2010, the BCBS published the Basel III international framework for liquidity risk measurement, standards and monitoring, which included the LCR and net stable funding ratio (NSFR) as two minimum liquidity standards. In July 2014, OSFI published the “Public Disclosure Requirements for Domestic Systemically Important Banks on Liquidity Coverage Ratio”, which provided public disclosure guidance applicable to D-SIBs as it pertains to the LCR. In accordance with the calibration methodology contained in OSFI’s liquidity adequacy requirements (LAR) guidelines released in May 2014, CIBC reports the LCR monthly to OSFI, effective January 2015.
The LCR’s primary objective is to promote short-term resilience of a bank’s liquidity risk profile, ensuring that it has adequate unencumbered high quality liquid resources to meet its liquidity needs in a 30-day acute stress scenario. Canadian banks are required to achieve a minimum LCR value of 100%. CIBC is in compliance with this requirement. The ratio is calculated as follows:
| | |
Total High Quality Liquid Assets (HQLA) | | ³ 100% |
| Total net cash outflows over the next 30 calendar days | |
The LCR’s numerator consists of unencumbered HQLA, which follow an OSFI-defined set of eligibility criteria that considers fundamental and market-related characteristics, and relative ability to operationally monetize assets on a timely basis during a period of stress. CIBC’s centrally-managed liquid asset portfolio includes those liquid assets reported in the HQLA, such as central government treasury bills and bonds, central bank deposits and high-rated sovereign, agency, provincial, and corporate securities. Asset eligibility limitations inherent in the LCR metric do not necessarily reflect CIBC’s internal assessment of its ability to monetize its marketable assets under stress.
The ratio’s denominator reflects net cash outflows expected in the LCR’s stress scenario over the 30 calendar day period. Expected cash outflows represent LCR-defined withdrawal or draw-down rates applied against outstanding liabilities and off-balance sheet commitments, respectively. Significant contributors to CIBC’s LCR outflows include business and financial institution deposit run-off, draws on undrawn lines of credit and unsecured debt maturities. Cash outflows are partially offset by cash inflows, which are calculated at LCR-prescribed inflow rates, and include performing loan repayments and non-HQLA marketable assets.
| | | | |
| CIBC2015 ANNUAL REPORT | | | 69 | |
|
Management’s discussion and analysis |
The following table provides key quantitative information about LCR, as prescribed by OSFI:
| | | | | | | | | | |
| $ millions, for the three months ended October 31, 2015 | | Total unweighted value (1)(2) (average) | | | Total weighted value (1)(3) (average) | |
| HQLA | | | | | | | | | | |
| 1 | | HQLA | | | n/a | | | $ | 97,663 | |
Cash outflows | | | | | | | | |
| 2 | | Retail deposits and deposits from small business customers, of which: | | $ | 120,583 | | | | 8,012 | |
| 3 | | Stable deposits | | | 57,874 | | | | 1,741 | |
| 4 | | Less stable deposits | | | 62,709 | | | | 6,271 | |
| 5 | | Unsecured wholesale funding, of which: | | | 110,591 | | | | 65,099 | |
| 6 | | Operational deposits (all counterparties) and deposits in networks of cooperative banks | | | 39,119 | | | | 9,526 | |
| 7 | | Non-operational deposits (all counterparties) | | | 46,765 | | | | 30,866 | |
| 8 | | Unsecured debt | | | 24,707 | | | | 24,707 | |
| 9 | | Secured wholesale funding | | | n/a | | | | 2,839 | |
| 10 | | Additional requirements, of which: | | | 63,934 | | | | 17,636 | |
| 11 | | Outflows related to derivative exposures and other collateral requirements | | | 9,650 | | | | 6,009 | |
| 12 | | Outflows related to loss of funding on debt products | | | 2,196 | | | | 2,196 | |
| 13 | | Credit and liquidity facilities | | | 52,088 | | | | 9,431 | |
| 14 | | Other contractual funding obligations | | | 2,000 | | | | 2,000 | |
| 15 | | Other contingent funding obligations | | | 215,920 | | | | 3,861 | |
| 16 | | Total cash outflows | | | n/a | | | | 99,447 | |
Cash inflows | | | | | | | | |
| 17 | | Secured lending (e.g. reverse repos) | | | 42,425 | | | | 8,147 | |
| 18 | | Inflows from fully performing exposures | | | 13,441 | | | | 6,843 | |
| 19 | | Other cash inflows | | | 2,327 | | | | 2,327 | |
| 20 | | Total cash inflows | | $ | 58,193 | | | $ | 17,317 | |
| | | | | | | | | Total adjusted value | |
| 21 | | Total HQLA | | | n/a | | | $ | 97,663 | |
| 22 | | Total net cash outflows | | | n/a | | | $ | 82,130 | |
| 23 | | LCR | | | n/a | | | | 118.9 | % |
| $ millions, for the three months ended July 31, 2015 | | | | | | | Total adjusted value | |
| 21 | | Total HQLA | | | n/a | | | $ | 86,620 | |
| 22 | | Total net cash outflows | | | n/a | | | $ | 71,998 | |
| 23 | | LCR | | | n/a | | | | 120.7 | % |
| (1) | Calculated based on a simple average of the three month end figures within the quarter. |
| (2) | Unweighted inflow and outflow values are calculated as outstanding balances maturing or callable within 30 days of various categories or types of liabilities, off-balance sheet items or contractual receivables. |
| (3) | Weighted values are calculated after the application of haircuts (for HQLA) and inflow and outflow rates prescribed by OSFI. |
| n/a | Not applicable as per the LCR common disclosure template. |
Our average LCR as at October 31, 2015 is lower compared with the average as at July 31, 2015, as a result of increases in contractual and contingent lending obligations, partially offset by larger holdings of HQLA. Multiple other factors that are part of normal business operations also impact the LCR.
CIBC considers the impact of its business decisions on the LCR and other liquidity risk metrics that it regularly monitors as part of a robust liquidity risk management function. Variables that can impact the ratio month-over-month include, but are not limited to, items such as wholesale funding activities and maturities, strategic balance sheet initiatives, and transactions and environmental considerations affecting collateral. Furthermore, CIBC reports the LCR to OSFI in multiple currencies, and thus measures the extent of potential currency mismatch under the ratio. CIBC predominantly operates in major currencies with deep and fungible foreign exchange markets.
Reporting of the LCR is calibrated centrally by CIBC’s Treasury function, in conjunction with CIBC’s SBUs and other functional and support groups.
Funding
CIBC’s funding strategy includes maintaining a diverse funding mix of client-sourced retail deposits and wholesale funding including asset securitization, covered bonds and unsecured debt. We have ongoing access to a range of active short- and long-term unsecured and secured funding sources to assist with meeting our funding requirements, and regularly monitor wholesale funding reliance and concentrations, including by type and counterparty, to approved internal limits consistent with our desired liquidity risk profile. Personal deposits continue to be a significant source of funding and totalled $137.4 billion as at October 31, 2015 (2014: $130.1 billion).
| | |
| 70 | | CIBC2015 ANNUAL REPORT |
|
Management’s discussion and analysis |
The following table provides the contractual maturities at carrying values of CIBC’s wholesale funding sources:
| | | | | | | | | | | | | | | | | | | | | | | | | | | | | | | | |
| $ millions, as at October 31, 2015 | | Less than
1 month | | | 1 – 3
months | | | 3 – 6
months | | | 6 – 12
months | | | Less than
1 year total | | | 1 – 2 years | | | Over
2 years | | | Total | |
Deposits from banks | | $ | 5,558 | | | $ | 65 | | | $ | 37 | | | $ | 3 | | | $ | 5,663 | | | $ | – | | | $ | – | | | $ | 5,663 | |
Certificates of deposit and commercial paper | | | 5,536 | | | | 11,731 | | | | 13,276 | | | | 10,396 | | | | 40,939 | | | | 1,307 | | | | – | | | | 42,246 | |
Bearer deposit notes and bankers acceptances | | | 1,267 | | | | 2,536 | | | | 2,328 | | | | 422 | | | | 6,553 | | | | – | | | | – | | | | 6,553 | |
Asset-backed commercial paper | | | – | | | | – | | | | – | | | | – | | | | – | | | | – | | | | – | | | | – | |
Senior unsecured medium-term notes | | | 1,500 | | | | 4,621 | | | | 500 | | | | 6,707 | | | | 13,328 | | | | 11,469 | | | | 10,089 | | | | 34,886 | |
Senior unsecured structured notes | | | – | | | | – | | | | 16 | | | | 510 | | | | 526 | | | | – | | | | – | | | | 526 | |
Covered bonds/Asset-backed securities | | | | | | | | | | | | | | | | | | | | | | | | | | | | | | | | |
Mortgage securitization | | | – | | | | 849 | | | | 970 | | | | 1,963 | | | | 3,782 | | | | 2,658 | | | | 16,460 | | | | 22,900 | |
Covered bonds | | | – | | | | 2,627 | | | | 660 | | | | – | | | | 3,287 | | | | 1,152 | | | | 7,523 | | | | 11,962 | |
Cards securitization | | | – | | | | 1,000 | | | | – | | | | 600 | | | | 1,600 | | | | 2,391 | | | | 791 | | | | 4,782 | |
Subordinated liabilities | | | 1,500 | | | | – | | | | – | | | | – | | | | 1,500 | | | | – | | | | 2,374 | | | | 3,874 | |
Other | | | – | | | | – | | | | – | | | | – | | | | – | | | | – | | | | – | | | | – | |
| | | $ | 15,361 | | | $ | 23,429 | | | $ | 17,787 | | | $ | 20,601 | | | $ | 77,178 | | | $ | 18,977 | | | $ | 37,237 | | | $ | 133,392 | |
Of which: | | | | | | | | | | | | | | | | | | | | | | | | | | | | | | | | |
Secured | | $ | – | | | $ | 4,476 | �� | | $ | 1,630 | | | $ | 2,563 | | | $ | 8,669 | | | $ | 6,201 | | | $ | 24,774 | | | $ | 39,644 | |
Unsecured | | | 15,361 | | | | 18,953 | | | | 16,157 | | | | 18,038 | | | | 68,509 | | | | 12,776 | | | | 12,463 | | | | 93,748 | |
| | | $ | 15,361 | | | $ | 23,429 | | | $ | 17,787 | | | $ | 20,601 | | | $ | 77,178 | | | $ | 18,977 | | | $ | 37,237 | | | $ | 133,392 | |
October 31, 2014 | | $ | 10,148 | | | $ | 13,033 | | | $ | 11,410 | | | $ | 15,327 | | | $ | 49,918 | | | $ | 25,354 | | | $ | 40,484 | | | $ | 115,756 | |
The following table provides a summary, in Canadian dollar equivalents, of CIBC’s wholesale funding sources by currency:
| | | | | | | | | | | | | | | | |
| $ billions, as at October 31 | | 2015 | | | 2014 (1) | |
CAD | | $ | 61.5 | | | | 46 | % | | $ | 60.3 | | | | 52 | % |
USD | | | 60.1 | | | | 45 | | | | 47.4 | | | | 41 | |
Other | | | 11.8 | | | | 9 | | | | 8.1 | | | | 7 | |
| | | $ | 133.4 | | | | 100 | % | | $ | 115.8 | | | | 100 | % |
| (1) | Reclassified to conform to the presentation adopted in the current year. |
Our funding and liquidity levels remained stable over the year ended October 31, 2015 and we do not anticipate any events, commitments or demands that will materially impact our liquidity risk position.
Funding plan
Our three-year funding plan is updated at least quarterly, or in response to material changes in underlying assumptions. The plan incorporates projected asset and liability growth from our ongoing operations, and the output from our liquidity position forecasting.
Credit ratings
Access to wholesale funding sources and the cost of funds are dependent on various factors including credit ratings. On May 20, 2015, DBRS revised the outlook for the big six Canadian banks, including CIBC, to negative from stable, citing regulations that seek to limit government support in the event of a bank failure. Moody’s and S&P made similar changes to the outlook on the senior debt ratings of the big six Canadian banks, including CIBC, in 2014. For additional information on these regulations, see “Taxpayer Protection and Bank Recapitalization Regime” in the “Capital resources” section. We do not expect a material impact on our funding costs or ability to access funding as a result of these rating changes.
Our funding and liquidity levels remained stable and sound over the year.
Our credit ratings are summarized in the table below:
| | | | | | | | | | | | | | | | | | | | | | | | | | | | | | | | | | | | | | | | | | | | | | | | | | | | |
| | | Short-term debt | | | | | Senior debt | | | | | Subordinated debt | | | | | Subordinated debt – NVCC (1) | | | | | Preferred Shares – NVCC (1) | | | | |
| As at October 31 | | 2015 | | | 2014 | | | | | 2015 | | | 2014 | | | | | 2015 | | | 2014 | | | | | 2015 | | | 2014 | | | | | 2015 | | | 2014 | | | Outlook | |
DBRS | | | R-1(H) | | | | R-1(H) | | | | | | AA | | | | AA | | | | | | AA(L) | | | | AA(L) | | | | | | A(L) | | | | A(L) | | | | | | pfd-2 | | | | Pfd-2 | | | | Negative | (2) |
Fitch | | | F1+ | | | | F1+ | | | | | | AA- | | | | AA- | | | | | | A+ | | | | A+ | | | | | | A+ | | | | n/a | | | | | | n/a | | | | n/a | | | | Stable | |
Moody’s | | | P-1 | | | | P-1 | | | | | | Aa3 | | | | Aa3 | | | | | | A3 | | | | A3 | | | | | | Baa1 | | | | Baa1 | | | | | | Baa2 | | | | Baa2 | | | | Negative | (3) |
S&P | | | A-1 | | | | A-1 | | | | | | A+ | | | | A+ | | | | | | BBB+ | | | | BBB+ | | | | | | BBB | | | | BBB | | | | | | P-3(H) | | | | P-3(H) | | | | Negative | (3) |
| (1) | Comprises instruments which are treated as NVCC in accordance with OSFI’s capital adequacy guidelines. |
| (2) | Negative outlook applies to short-term debt, senior debt, and subordinated debt ratings. |
| (3) | Negative outlook only applies to senior debt rating. |
Additional collateral requirements for rating downgrades
We are required to deliver collateral to certain derivative counterparties in the event of a downgrade to our current credit risk rating. The collateral requirement is based on MTM exposure, collateral valuations, and collateral arrangement thresholds as applicable. The following table presents the additional collateral requirements (cumulative) for rating downgrades:
| | | | | | | | |
| $ billions, as at October 31 | | 2015 | | | 2014 (1) | |
One-notch downgrade | | $ | 0.1 | | | $ | 0.1 | |
Two-notch downgrade | | | 0.2 | | | | 0.3 | |
Three-notch downgrade | | | 0.5 | | | | 0.6 | |
| (1) | Restated to conform to the methodology adopted in the current year. |
| | | | |
| CIBC2015 ANNUAL REPORT | | | 71 | |
|
Management’s discussion and analysis |
Other regulatory liquidity standards
In May 2014, OSFI published the final LAR guideline. The LAR guideline is driven by the BCBS’ global liquidity requirements, which include the LCR, NSFR and other liquidity monitoring tools. It is further supplemented by the OSFI-designed supervisory tool known as the NCCF metric. The NCCF was originally introduced in 2010 and the LAR guideline contains updated assumptions and parameters for use in the measurement of the metric reported to OSFI beginning January 2015. OSFI will use the LAR and associated metrics to assess individual banks’ liquidity adequacy. Additional liquidity monitoring tools, including intraday liquidity reporting, are expected to be required by January 1, 2017.
On October 31, 2014, the BCBS published its final NSFR guideline. In February 2015, OSFI provided a revised Basel III monitoring template which incorporated the final BCBS NSFR guideline. OSFI is expected to engage in directed and public consultations prior to issuance of their final NSFR reporting template. NSFR reporting will become effective January 1, 2018, and disclosed publicly in the first quarter of 2018 in accordance with NSFR disclosure requirements released in June 2015.
Consistent with the requirements above, we submit LCR and NCCF reports to OSFI on a monthly basis and the NSFR report on a quarterly basis. We provide the LCR and NSFR reports to the BCBS twice annually.
Contractual obligations
Contractual obligations give rise to commitments of future payments affecting our short- and long-term liquidity and capital resource needs. These obligations include financial liabilities, credit and liquidity commitments, and other contractual obligations.
Assets and liabilities
The following table provides the contractual maturity profile of our on-balance sheet assets and liabilities at their carrying values. Contractual maturities provide input for determining a behavioural balance sheet, which constitutes a key component of CIBC’s liquidity risk management framework.
| | | | | | | | | | | | | | | | | | | | | | | | | | | | | | | | | | | | | | | | |
| $ millions, as at October 31, 2015 | | Less than 1 month | | | 1 – 3
months | | | 3 – 6
months | | | 6 – 9
months | | | 9 – 12
months | | | 1 – 2
years | | | 2 – 5 years | | | Over 5 years | | | No
specified maturity | | | Total | |
Assets | | | | | | | | | | | | | | | | | | | | | | | | | | | | | | | | | | | | | | | | |
Cash and non-interest-bearing deposits with banks | | $ | 3,053 | | | $ | – | | | $ | – | | | $ | – | | | $ | – | | | $ | – | | | $ | – | | | $ | – | | | $ | – | | | $ | 3,053 | |
Interest-bearing deposits with banks | | | 15,584 | | | | – | | | | – | | | | – | | | | – | | | | – | | | | – | | | | – | | | | – | | | | 15,584 | |
Securities | | | 1,951 | | | | 2,478 | | | | 1,841 | | | | 2,013 | | | | 2,105 | | | | 6,139 | | | | 11,524 | | | | 13,999 | | | | 32,932 | | | | 74,982 | |
Cash collateral on securities borrowed | | | 3,245 | | | | – | | | | – | | | | – | | | | – | | | | – | | | | – | | | | – | | | | – | | | | 3,245 | |
Securities purchased under resale agreements | | | 14,671 | | | | 10,031 | | | | 2,350 | | | | 2,990 | | | | 47 | | | | – | | | | – | | | | – | | | | – | | | | 30,089 | |
Loans | | | | | | | | | | | | | | | | | | | | | | | | | | | | | | | | | | | | | | | | |
Residential mortgages | | | 1,691 | | | | 3,825 | | | | 11,392 | | | | 11,749 | | | | 9,222 | | | | 27,459 | | | | 96,115 | | | | 7,287 | | | | 518 | | | | 169,258 | |
Personal | | | 289 | | | | 510 | | | | 926 | | | | 1,004 | | | | 948 | | | | 106 | | | | 302 | | | | 2,806 | | | | 29,626 | | | | 36,517 | |
Credit card | | | 246 | | | | 496 | | | | 744 | | | | 744 | | | | 744 | | | | 2,975 | | | | 5,855 | | | | – | | | | – | | | | 11,804 | |
Business and government | | | 3,659 | | | | 2,133 | | | | 2,650 | | | | 2,892 | | | | 2,773 | | | | 9,805 | | | | 20,937 | | | | 12,709 | | | | 7,718 | | | | 65,276 | |
Allowance for credit losses | | | – | | | | – | | | | – | | | | – | | | | – | | | | – | | | | – | | | | – | | | | (1,670 | ) | | | (1,670 | ) |
Derivative instruments | | | 1,222 | | | | 2,169 | | | | 1,105 | | | | 1,086 | | | | 507 | | | | 2,896 | | | | 6,796 | | | | 10,561 | | | | – | | | | 26,342 | |
Customers’ liability under acceptances | | | 8,447 | | | | 1,285 | | | | 56 | | | | 7 | | | | 1 | | | | – | | | | – | | | | – | | | | – | | | | 9,796 | |
Other assets | | | – | | | | – | | | | – | | | | – | | | | – | | | | – | | | | – | | | | – | | | | 19,033 | | | | 19,033 | |
| | | $ | 54,058 | | | $ | 22,927 | | | $ | 21,064 | | | $ | 22,485 | | | $ | 16,347 | | | $ | 49,380 | | | $ | 141,529 | | | $ | 47,362 | | | $ | 88,157 | | | $ | 463,309 | |
October 31, 2014 | | $ | 52,085 | | | $ | 23,935 | | | $ | 12,040 | | | $ | 16,828 | | | $ | 13,010 | | | $ | 59,688 | | | $ | 116,665 | | | $ | 42,929 | | | $ | 77,723 | | | $ | 414,903 | |
Liabilities | | | | | | | | | | | | | | | | | | | | | | | | | | | | | | | | | | | | | | | | |
Deposits (1) | | $ | 29,810 | | | $ | 29,894 | | | $ | 25,658 | | | $ | 25,195 | | | $ | 14,870 | | | $ | 26,465 | | | $ | 39,724 | | | $ | 6,613 | | | $ | 168,428 | | | $ | 366,657 | |
Obligations related to securities sold short | | | 9,806 | | | | – | | | | – | | | | – | | | | – | | | | – | | | | – | | | | – | | | | – | | | | 9,806 | |
Cash collateral on securities lent | | | 1,429 | | | | – | | | | – | | | | – | | | | – | | | | – | | | | – | | | | – | | | | – | | | | 1,429 | |
Obligations related to securities sold under repurchase agreements | | | 8,204 | | | | 560 | | | | 150 | | | | – | | | | – | | | | – | | | | – | | | | – | | | | – | | | | 8,914 | |
Derivative instruments | | | 1,109 | | | | 2,351 | | | | 1,591 | | | | 1,251 | | | | 628 | | | | 4,533 | | | | 7,639 | | | | 9,955 | | | | – | | | | 29,057 | |
Acceptances | | | 8,447 | | | | 1,285 | | | | 56 | | | | 7 | | | | 1 | | | | – | | | | – | | | | – | | | | – | | | | 9,796 | |
Other liabilities | | | – | | | | – | | | | – | | | | – | | | | – | | | | – | | | | – | | | | – | | | | 12,223 | | | | 12,223 | |
Subordinated indebtedness | | | 1,500 | | | | – | | | | – | | | | – | | | | – | | | | – | | | | 40 | | | | 2,334 | | | | – | | | | 3,874 | |
Equity | | | – | | | | – | | | | – | | | | – | | | | – | | | | – | | | | – | | | | – | | | | 21,553 | | | | 21,553 | |
| | | $ | 60,305 | | | $ | 34,090 | | | $ | 27,455 | | | $ | 26,453 | | | $ | 15,499 | | | $ | 30,998 | | | $ | 47,403 | | | $ | 18,902 | | | $ | 202,204 | | | $ | 463,309 | |
October 31, 2014 (2) | | $ | 50,440 | �� | | $ | 21,358 | | | $ | 22,918 | | | $ | 22,225 | | | $ | 15,617 | | | $ | 31,822 | | | $ | 45,606 | | | $ | 25,289 | | | $ | 179,628 | | | $ | 414,903 | |
| | (1) | Comprises $137.4 billion (2014: $130.1 billion) of personal deposits of which $132.7 billion (2014: $125.8 billion) are in Canada and $4.7 billion (2014: $4.3 billion) are in other countries; $218.5 billion (2014: $187.6 billion) of business and government deposits and secured borrowings of which $158.9 billion (2014: $145.2 billion) are in Canada and $59.6 billion (2014: $42.4 billion) are in other countries; and $10.8 billion (2014: $7.7 billion) of bank deposits of which $4.0 billion (2014: $2.9 billion) are in Canada and $6.8 billion (2014: $4.8 billion) are in other countries. | |
| | (2) | Restated to conform to the presentation adopted in the current year. | |
The changes in the contractual maturity profile were primarily due to the natural migration of maturities and also reflect the impact of our regular business activities.
| | |
| 72 | | CIBC2015 ANNUAL REPORT |
|
Management’s discussion and analysis |
Credit-related commitments
The following table provides the contractual maturity of notional amounts of credit-related commitments. Since a significant portion of commitments are expected to expire without being drawn upon, the total of the contractual amounts is not representative of future liquidity requirements.
| | | | | | | | | | | | | | | | | | | | | | | | | | | | | | | | | | | | | | | | |
| $ millions, as at October 31, 2015 | | Less than 1 month | | | 1 – 3
months | | | 3 – 6
months | | | 6 – 9 months | | | 9 – 12
months | | | 1 – 2
years | | | 2 – 5 years | | | Over
5 years | | | No specified
maturity (1) | | | Total | |
Securities lending (2) | | $ | 22,753 | | | $ | 7,797 | | | $ | 1,619 | | | $ | – | | | $ | – | | | $ | – | | | $ | – | | | $ | – | | | $ | – | | | $ | 32,169 | |
Unutilized credit commitments | | | 533 | | | | 5,338 | | | | 1,771 | | | | 1,576 | | | | 1,559 | | | | 7,693 | | | | 31,640 | | | | 1,505 | | | | 124,034 | | | | 175,649 | |
Backstop liquidity facilities | | | 64 | | | | 4,097 | | | | 135 | | | | 262 | | | | 808 | | | | 562 | | | | – | | | | 13 | | | | – | | | | 5,941 | |
Standby and performance letters of credit | | | 1,386 | | | | 2,539 | | | | 2,021 | | | | 2,469 | | | | 1,374 | | | | 645 | | | | 679 | | | | 42 | | | | – | | | | 11,155 | |
Documentary and commercial letters of credit | | | 101 | | | | 139 | | | | 51 | | | | 15 | | | | 7 | | | | 12 | | | | 2 | | | | – | | | | – | | | | 327 | |
Other | | | 278 | | | | – | | | | – | | | | – | | | | – | | | | – | | | | – | | | | – | | | | – | | | | 278 | |
| | | $ | 25,115 | | | $ | 19,910 | | | $ | 5,597 | | | $ | 4,322 | | | $ | 3,748 | | | $ | 8,912 | | | $ | 32,321 | | | $ | 1,560 | | | $ | 124,034 | | | $ | 225,519 | |
October 31, 2014 | | $ | 27,668 | | | $ | 10,723 | | | $ | 3,010 | | | $ | 3,877 | | | $ | 2,094 | | | $ | 7,386 | | | $ | 28,636 | | | $ | 2,177 | | | $ | 114,888 | | | $ | 200,459 | |
| | (1) | Includes $97.1 billion (2014: $91.1 billion) of personal, home equity and credit card lines, which are unconditionally cancellable at our discretion. | |
| | (2) | Excludes securities lending of $1.4 billion (2014: $903 million) for cash because it is reported on the consolidated balance sheet. | |
Other contractual obligations
The following table provides the contractual maturities of other contractual obligations affecting our funding needs:
| | | | | | | | | | | | | | | | | | | | | | | | | | | | | | | | | | | | |
| $ millions, as at October 31, 2015 | | Less than 1 month | | | 1 – 3
months | | | 3 – 6
months | | | 6 – 9
months | | | 9 – 12
months | | | 1 – 2 years | | | 2 – 5 years | | | Over
5 years | | | Total | |
Operating leases | | $ | 36 | | | $ | 72 | | | $ | 108 | | | $ | 108 | | | $ | 107 | | | $ | 411 | | | $ | 925 | | | $ | 1,094 | | | $ | 2,861 | |
Purchase obligations (1) | | | 68 | | | | 202 | | | | 183 | | | | 213 | | | | 219 | | | | 674 | | | | 936 | | | | 449 | | | | 2,944 | |
Pension contributions (2) | | | 5 | | | | 10 | | | | 15 | | | | 15 | | | | 14 | | | | – | | | | – | | | | – | | | | 59 | |
Underwriting commitments | | | 687 | | | | – | | | | – | | | | – | | | | – | | | | – | | | | – | | | | – | | | | 687 | |
Investment commitments | | | 1 | | | | – | | | | – | | | | – | | | | – | | | | 8 | | | | 8 | | | | 126 | | | | 143 | |
| | | $ | 797 | | | $ | 284 | | | $ | 306 | �� | | $ | 336 | | | $ | 340 | | | $ | 1,093 | | | $ | 1,869 | | | $ | 1,669 | | | $ | 6,694 | |
October 31, 2014 (3) | | $ | 245 | | | $ | 215 | | | $ | 714 | | | $ | 288 | | | $ | 249 | | | $ | 969 | | | $ | 2,057 | | | $ | 1,788 | | | $ | 6,525 | |
| | (1) | Obligations that are legally binding agreements whereby we agree to purchase products or services with specific minimum or baseline quantities defined at fixed, minimum or variable prices over a specified period of time are defined as purchase obligations. Purchase obligations are included through to the termination date specified in the respective agreements, even if the contract is renewable. Many of the purchase agreements for goods and services include clauses that would allow us to cancel the agreement prior to expiration of the contract within a specific notice period. However, the amount above includes our obligations without regard to such termination clauses (unless actual notice of our intention to terminate the agreement has been communicated to the counterparty). The table excludes purchases of debt and equity instruments that settle within standard market timeframes. | |
| | (2) | Includes estimated minimum funding contributions for our funded defined benefit pension plans in Canada, the U.S., the U.K., and the Caribbean. Estimated minimum funding contributions are included only for the next annual period as the minimum contributions are affected by various factors, such as market performance and regulatory requirements, and therefore are subject to significant variability. | |
| | (3) | Restated to conform to the methodology adopted in the current year. | |
Other risks
Strategic risk
Strategic risk is the risk of ineffective or improper implementation of business strategies, including mergers and acquisitions. It includes the potential financial loss due to the failure of organic growth initiatives or failure to respond appropriately to changes in the business environment.
Oversight of strategic risk is the responsibility of the ExCo and the Board. At least annually, the CEO outlines the process and presents the strategic business plan to the Board for review and approval. The Board reviews the plan in light of management’s assessment of emerging market trends, the competitive environment, potential risks and other key issues.
One of the tools for measuring, monitoring and controlling strategic risk is attribution of economic capital against this risk. Our economic capital models include a strategic risk component for those businesses utilizing capital to fund an acquisition or a significant organic growth strategy.
Insurance risk
Insurance risk is the risk of a potential loss due to actual experience being different from that assumed in the design and pricing of an insurance product. Unfavourable actual experience could emerge due to adverse fluctuations in timing, size and frequency of actual claims (e.g. mortality, morbidity), policyholder behaviour (e.g. cancellation of coverage), or associated expenses.
Insurance contracts provide financial compensation to the beneficiary in the event of insured risk in exchange for premiums. We are exposed to insurance risk in our life insurance business and in our life reinsurance business within the respective subsidiaries.
Senior management of the insurance and reinsurance subsidiaries have primary responsibility for managing insurance risk with oversight by Risk Management. The insurance and reinsurance subsidiaries also have their own boards of directors, as well as independent Appointed Actuaries who provide additional input to risk management oversight. Processes and oversight are in place to manage the risk to our insurance business. Underwriting risk on business assumed is managed through risk policies that limit exposure to an individual life, to certain types of business and to countries.
Our risk governance practices ensure strong independent oversight and control of risk within the insurance businesses. The subsidiaries’ boards outline the internal risk and control structure to manage insurance risk which includes risk, capital and control policies, processes as well as limits and governance. Senior management of the insurance and reinsurance subsidiaries and Risk Management attend the subsidiaries’ board meetings.
| | | | |
| CIBC2015 ANNUAL REPORT | | | 73 | |
|
Management’s discussion and analysis |
Operational risk
Operational risk is the risk of loss resulting from inadequate or failed internal processes, people, and systems, or from external events.
Operational risks driven by people and processes are mitigated through human resources policies and practices, and operational procedural controls, respectively. Operational risks driven by systems are managed through controls over technology development and change management.
The GRC provides oversight on operational risk matters and our internal control framework within the parameters and strategic objectives established by the ExCo. The ExCo is accountable to the Board and its Audit Committee and the RMC for maintaining a strong risk culture and internal control environment.
Operational risk management approach
We have a comprehensive operational risk management framework that supports and governs the processes of identifying, assessing, managing, measuring, monitoring, and reporting operational risks. We mitigate operational losses by consistently applying and utilizing control-based approaches as well as risk-specific assessment tools. The transparency of information, timely escalation of key risk issues and clear accountability for issue resolution are major pillars of our approach. We also regularly review our risk governance structure to ensure that there is clarity and ownership of key risk areas.
We use the three lines of defence model to manage operational risk. Business lines are our first line of defence and have primary responsibility for the day-to-day management of operational risk inherent in their products and activities. Functionally independent governance groups, representing our second line of defence, are responsible for maintaining a robust operational risk management framework and providing operational risk oversight. Our third line of defence is Internal Audit who independently opine on the design and operating effectiveness of the controls that support our operational risk management program.
Managing operational risk
We utilize various risk assessment tools to identify and assess operational risk exposures, including business process mapping, risk and control self-assessments, scenario analyses, audit findings, internal and external loss event analyses, key risk indicators, and change management approval processes (including approval of new initiatives and products), as well as comparative analyses.
In conducting risk assessments, we bring together subject matter experts from across the organization to share expertise and to identify improvements to risk identification, measurement, and control processes. Our operational risk management framework also requires risk assessments to undergo rigorous independent reviews and challenges from governance groups in their respective areas of expertise.
We continuously monitor our operational risk profile to ensure that any adverse changes are addressed in a timely manner. Tools such as key risk indicators are used to identify changes in our operational risk profile before the risks become acute. The risk monitoring processes support a comprehensive risk reporting program to both senior management and the Board.
Our primary tool for mitigating operational risk exposure is a robust internal control environment. The internal control framework highlights key internal controls across the bank which are subjected to ongoing testing and review to ensure that they are effective in mitigating our operational risk exposures. In addition, we maintain a corporate insurance program to provide additional protection from loss and a global business continuity management program to mitigate business continuity risks in the event of a disaster.
Assessment of material, or potential material losses
The occurrence of a material, or potential material loss results in an investigation to determine the root causes of the loss and the effectiveness of existing mitigating controls, as well as the identification of any additional mitigating actions.
Examples of operational losses for which an investigation may occur include, but are not limited to: large dollar losses (either absolute value or relative to losses generally experienced by the business line); losses that are inconsistent with the business line’s historical experience; or losses in excess of the business line’s expected loss. A near miss event is an operational risk event that does not ultimately lead to a loss due to various circumstances (e.g., fortuitous circumstances).
The analysis of material operational risk events is performed by the first line of defence and the outputs of the analysis are subjected to formal independent challenge by our second line of defence. The analysis of material operational risk events forms one component of our ongoing operational risk reporting to senior management and the Board.
We did not experience any material operational risk loss events during the year; total operational risk losses in 2015 were within our defined risk appetite. See Note 23 to our consolidated financial statements for a description of our significant legal proceedings and provisions recognized.
Risk measurement
We use the AMA, a risk-sensitive method prescribed by BCBS, to quantify our operational risk exposure in the form of operational risk regulatory capital. We determine operational risk capital using both a scenario based and a loss distribution approach that uses outputs from our risk assessment tools, including actual internal loss experiences, loss scenarios based on internal/external loss data and management expertise, audit findings and the results of risk and control self-assessments.
Under AMA, we are permitted to recognize the risk mitigating impact of insurance in the measures of operational risk used for regulatory minimum capital requirements. Although our current insurance policies are tailored to provide earnings protection from potential high-severity losses, we do not reflect mitigation through insurance or any other risk transfer mechanism in our AMA model.
We attribute operational risk capital at the line of business level. Capital represents the “worst-case loss” within a 99.9% confidence level and is determined for each loss event type and production/infrastructure/corporate governance line of business. The aggregate risk of CIBC is less than the sum of the individual parts, as the likelihood that all business groups across all regions will experience a worst-case loss in every loss category in the same year is extremely low. To adjust for the fact that all risks are not 100% correlated, we incorporate a portfolio effect to ensure that the aggregated risk is representative of the total bank-wide risk. The process for determining correlations considers both internal and external historical correlations and takes into account the uncertainty surrounding correlation estimates.
Our AMA model was approved in 2008. In fiscal 2015, we developed a second generation AMA model, which has received regulatory approval for capital reporting commencing fiscal 2016. For regulated subsidiaries, the basic indicator or standardized approaches are adopted as agreed with local regulators.
| | |
| 74 | | CIBC2015 ANNUAL REPORT |
|
Management’s discussion and analysis |
Back-testing
The results of the capital calculations are internally back-tested each quarter. The back-testing exercise assesses the model’s performance against internal and external loss data. The internal loss data is compared to the model output at a loss type and line of business level to identify areas in which the actual loss experience differs from the predicted results. External loss data are grouped into major themes and compared against the scenarios used in the model to ensure that the model addresses all relevant fat tailed events (i.e., stress scenarios). Gaps identified through back-testing are reflected in revisions to the relevant parameters of the model. The overall methodology is also independently validated by the Model Validation group in Risk Management to ensure that the assumptions applied are reasonable. The validation exercise includes modelling the relevant internal loss data using alternative methods and comparing the results to the model. Gaps identified through the validation exercise are incorporated into revisions to the model.
Technology, information and cyber security risk
We are also exposed to cyber threats and the associated financial, reputation and business interruption risks. For additional information on these risks and our mitigation strategies, see the “Top and emerging risks” section.
Reputation and legal risk
Our reputation and financial soundness are of fundamental importance to us and to our clients, shareholders and employees.
Reputation risk is the risk of negative publicity regarding our business conduct or practices which, whether true or not, could significantly harm our reputation as a leading financial institution, or could materially and adversely affect our business, operations or financial condition.
Legal risk is the potential for civil litigation or criminal or regulatory proceedings being commenced against CIBC that, once adjudicated, could materially and adversely affect our business, operations or financial condition.
The RMC, together with the Reputation and Legal Risks Committee and GRC, provides oversight of the management of reputation and legal risks. The identification, consideration and prudent, proactive management of potential reputation and legal risks is a key responsibility of CIBC and all of our employees.
Our Global Reputation and Legal Risks Policy sets standards for safeguarding our reputation and minimizing exposure to reputation and legal risks. The policy is supplemented by business procedures for identifying and escalating transactions to the Reputation and Legal Risks Committee that could pose material reputation risk and/or legal risk.
Regulatory compliance risk
Regulatory compliance risk refers to the risk of regulatory sanctions arising from CIBC’s failure to comply with regulatory requirements that govern its activities.
Our regulatory compliance philosophy is to manage regulatory compliance risk through the promotion of a strong risk and compliance culture, and the integration of sound controls within the business and infrastructure groups. The foundation of this approach is a comprehensive Regulatory Compliance Management (RCM) framework. The RCM framework, owned by the Chief Compliance Officer and approved by the Audit Committee of the Board, maps regulatory requirements to internal policies, procedures and controls that govern regulatory compliance.
Our Compliance department is responsible for the development and maintenance of a comprehensive regulatory compliance program, including oversight of the RCM framework. The department is independent of business management and reported regularly to the Audit Committee of the Board during fiscal 2015, and commencing December 2015 now reports directly to the Risk Management Committee of the Board.
Primary responsibility for compliance with all applicable regulatory requirements rests with senior management of the business and infrastructure groups, and extends to all employees. The Compliance department’s activities support those groups, with particular emphasis on regulatory requirements that govern the relationship between CIBC and its clients, that help protect the integrity of the capital markets, or that relate to money laundering and terrorist financing.
See the “Regulatory developments” section for further details.
Environmental risk
Environmental risk is the risk of financial loss or damage to reputation associated with environmental issues, whether arising from our credit and investment activities or related to our own operations. Our corporate environmental policy, originally approved by the Board in 1993 and most recently updated and approved by the RMC in 2013, commits CIBC to responsible conduct in all activities to protect and conserve the environment; safeguard the interests of all stakeholders from unacceptable levels of environmental risk; and support the principles of sustainable development.
The policy is addressed by an integrated Corporate Environmental Management Program which is under the overall management of the Environmental Risk Management (ERM) group in Risk Management. Environmental evaluations are integrated into our credit and investment risk assessment processes, with environmental risk management standards and procedures in place for all sectors. In addition, environmental and social risk assessments in project finance, project-related corporate loans and related bridge loans are required in accordance with our commitment to the Equator Principles, a voluntary set of guidelines for financial institutions based on the screening criteria of the International Finance Corporation, which we adopted in 2003. We also conduct ongoing research and benchmarking on environmental issues such as climate change and biodiversity protection as they may pertain to responsible lending practices. We are also a signatory to and participant in the Carbon Disclosure Project’s climate change program, which promotes corporate disclosure to the investment community on greenhouse gas emissions and climate change management.
The ERM group works closely with our main business units and functional and support groups to ensure that high standards of environmental responsibility are applied to the banking services that we provide to our clients, the relationships we have with our stakeholders, and to the way we manage our facilities. An executive-level Environmental Management Committee is in place to provide input on environmental strategy and oversight of CIBC’s environmental initiatives.
| | | | |
| CIBC2015 ANNUAL REPORT | | | 75 | |
|
Management’s discussion and analysis |
Accounting and control matters
Critical accounting policies and estimates
A summary of significant accounting policies is presented in Note 1 to the consolidated financial statements. Certain accounting policies require us to make judgments and estimates, some of which may relate to matters that are uncertain. Changes in the judgments and estimates required in the critical accounting policies discussed below could have a material impact on our financial results. We have established control procedures to ensure accounting policies are applied consistently and processes for changing methodologies are well controlled.
Valuation of financial instruments
Debt and equity trading securities, trading business and government loans, obligations related to securities sold short, derivative contracts, AFS securities and FVO financial instruments are carried at fair value. FVO financial instruments include certain debt securities, structured deposits and business and government deposits. Retail mortgage interest rate commitments are also designated as FVO financial instruments.
Fair value is defined as the price that would be received to sell an asset or paid to transfer a liability at the measurement date in an orderly arm’s-length transaction between market participants in the principal market under current market conditions (i.e., the exit price). Fair value measurements are categorized into levels within a fair value hierarchy based on the nature of the valuation inputs (Level 1, 2 or 3). We have an established and well-documented process for determining fair value. Fair value is based on unadjusted quoted prices in an active market for the same instrument, where available (Level 1). If active market prices or quotes are not available for an instrument, fair value is then based on valuation models in which the significant inputs are observable (Level 2) or in which one or more of the significant inputs are non-observable (Level 3). Estimating fair value requires the application of judgment. The type and level of judgment required is largely dependent on the amount of observable market information available. For instruments valued using internally developed models that use significant non-observable market inputs and are therefore classified within Level 3 of the hierarchy, the judgment used to estimate fair value is more significant than when estimating the fair value of instruments classified within Levels 1 and 2. To ensure that valuations are appropriate, a number of policies and controls are put in place. Independent validation of fair value is performed at least on a monthly basis. Valuation inputs are verified to external sources such as exchange quotes, broker quotes or other management-approved independent pricing sources.
The following table presents amounts, in each category of financial instruments, which are fair valued using valuation techniques based on Level 3 inputs, for the structured credit run-off business and total consolidated CIBC. For further details of the valuation of and sensitivity associated with Level 3 financial assets and liabilities, see Note 2 to the consolidated financial statements.
| | | | | | | | | | | | | | | | | | | | | | | | |
| $ millions, as at October 31 | | | | | | | | 2015 | | | | | | | | | 2014 | |
| | | Structured credit
run-off business | | | Total CIBC | | | Total CIBC (1) | | | Structured credit run-off business | | | Total CIBC | | | Total CIBC (1) | |
Assets | | | | | | | | | | | | | | | | | | | | | | | | |
Trading securities and loans | | $ | 565 | | | $ | 611 | | | | 1.2 | % | | $ | 759 | | | $ | 759 | | | | 1.5 | % |
AFS securities | | | 32 | | | | 2,041 | | | | 7.2 | | | | 21 | | | | 1,230 | | | | 10.1 | |
FVO securities | | | 111 | | | | 111 | | | | 41.6 | | | | 107 | | | | 107 | | | | 42.3 | |
Derivative instruments | | | 165 | | | | 192 | | | | 0.7 | | | | 204 | | | | 226 | | | | 1.1 | |
| | | $ | 873 | | | $ | 2,955 | | | | 2.7 | % | | $ | 1,091 | | | $ | 2,322 | | | | 2.7 | % |
Liabilities | | | | | | | | | | | | | | | | | | | | | | | | |
Deposits and other liabilities (2) | | $ | 280 | | | $ | 474 | | | | 17.8 | % | | $ | 454 | | | $ | 729 | | | | 27.0 | % |
Derivative instruments | | | 244 | | | | 297 | | | | 1.0 | | | | 270 | | | | 305 | | | | 1.4 | |
| | | $ | 524 | | | $ | 771 | | | | 1.9 | % | | $ | 724 | | | $ | 1,034 | | | | 2.8 | % |
| (1) | Represents the percentage of Level 3 assets and liabilities over total assets and liabilities for each reported category that are carried on the consolidated balance sheet at fair value. |
| (2) | Includes FVO deposits and bifurcated embedded derivatives. |
Note 2 to the consolidated financial statements presents the valuation methods used to determine fair value showing separately those financial instruments that are carried at fair value on the consolidated balance sheet and those that are not.
In order to reflect the observed market practice of pricing collateralized derivatives, our valuation approach uses OIS curves as the discount rate.
In the fourth quarter of 2014, in order to reflect the trend toward pricing market cost of funding in the valuation of uncollateralized derivatives, we amended our valuation approach through the adoption of FVA, which employs an estimated market cost of funding curve as the discount rate in place of LIBOR. The impact reduced the fair value of uncollateralized derivative assets incremental to the reduction in fair value for credit risk already reflected through the CVA. In contrast, the impact on uncollateralized derivative liabilities reduced their fair value in a manner that subsumed previously recognized valuation adjustments related to our own credit. As a result, the adoption of FVA resulted in a one-time net decrease in net income. As market practices continue to evolve in regard to derivative valuation, further adjustments may be required in the future. Just as is the case for OIS, FVA are considered integral to our valuation process and are accordingly excluded from the table below that presents our fair value adjustments.
Fair value adjustments
We apply judgment in establishing valuation adjustments that take into account various factors that may have an impact on the valuation of financial instruments that are carried at fair value on the consolidated balance sheet. Such factors include, but are not limited to, the bid-offer spread, illiquidity due to lack of market depth and other market risks, parameter uncertainty, model risk, credit risk, and future administration costs.
The establishment of fair value adjustments and the determination of the amount of write-downs involve estimates that are based on accounting processes and judgments by management. We evaluate the adequacy of the fair value adjustments and the amount of write-downs on an ongoing basis. The levels of fair value adjustments and the amount of the write-downs could change as events warrant and may not reflect ultimate realizable amounts.
| | |
| 76 | | CIBC2015 ANNUAL REPORT |
|
Management’s discussion and analysis |
The following table summarizes our valuation adjustments:
| | | | | | | | |
| $ millions, as at October 31 | | 2015 | | | 2014 | |
Securities | | | | | | | | |
Market risk | | $ | 1 | | | $ | 2 | |
Derivatives | | | | | | | | |
Market risk | | | 68 | | | | 45 | |
Creditrisk | | | 99 | | | | 97 | |
Administration costs | | | 6 | | | | 5 | |
Total valuation adjustments | | $ | 174 | | | $ | 149 | |
Impairment of AFS securities
AFS securities include debt and equity securities.
AFS securities are measured at fair value, with the difference between the fair value and the amortized cost included in AOCI. Only equities that do not have a reliably measurable fair value are carried at cost. We have determined that all of our equity securities have reliable fair values.
AFS securities are subject to quarterly reviews to assess whether or not there is an impairment. The assessment of impairment depends on whether the instrument is debt or equity in nature. AFS debt securities are identified as impaired when there is objective observable evidence concerning the inability to collect the contractual principal or interest. Factors that are reviewed for impairment assessment include, but are not limited to, operating performance and future expectations, liquidity and capital adequacy, external credit ratings, deterioration in underlying asset quality, industry valuation levels for comparable entities, and any changes in market and economic outlook.
For AFS equity instruments, objective evidence of impairment exists if there has been a significant or prolonged decline in the fair value of the investment below its cost. In making the impairment assessment we also consider whether there have been significant adverse changes in the technological, market, economic, or legal environments in which the issuer operates or if the issuer is experiencing significant financial difficulty.
Realized gains and losses on disposal and write-downs to reflect impairment in the value of AFS securities are recorded in the consolidated statement of income. Previously recognized impairment losses for debt securities (but not equity securities) are reversed if a subsequent increase in fair value can be objectively identified and is related to an event occurring after the impairment loss was recognized. Once an AFS equity security is impaired, all subsequent declines in fair value are charged directly to income.
Allowance for credit losses
We establish and maintain an allowance for credit losses that is considered the best estimate of probable credit-related losses existing in our portfolio of on- and off-balance sheet financial instruments, giving due regard to current conditions.
The allowance for credit losses consists of individual and collective components.
Individual allowances
The majority of our business and government loan portfolios are assessed on an individual loan basis. Individual allowances are established when impaired loans are identified within the individually assessed portfolios. A loan is classified as impaired when we are of the opinion that there is no longer reasonable assurance of the full and timely collection of principal and interest. The individual allowance is the amount required to reduce the carrying value of an impaired loan to its estimated realizable amount. This is determined by discounting the expected future cash flows at the effective interest rate inherent in the loan.
Individual allowances are not established for portfolios that are collectively assessed, including most retail portfolios.
Collective allowances
Consumer and certain small business allowances
Residential mortgages, credit card loans, personal loans, and certain small business loan portfolios consist of large numbers of homogeneous balances of relatively small amounts, for which we take a portfolio approach to establish the collective allowance. As it is not practical to review each individual loan, we utilize a formula basis, by reference to historical ratios of write-offs to current accounts and balances in arrears. For residential mortgages, personal loans and certain small business loans, this historical loss experience enables CIBC to determine appropriate PD and LGD parameters, which are used in the calculation of the portion of the collective allowance for current accounts. The PDs determined by this process that correspond to the risk levels in our retail portfolios are disclosed in “Exposures subject to AIRB approach” in the “Credit risk” section. For credit card loans, non-current residential mortgages, personal loans and certain small business loans, the historical loss experience enables CIBC to calculate flows to write-off in our models that determine the collective allowance that pertain to these loans.
We also consider estimates of the time periods over which losses that are present would be identified and a provision taken, our view of current economic and portfolio trends, and evidence of credit quality improvements or deterioration. On a regular basis, the parameters that affect the allowance calculation are updated, based on our experience and the economic environment.
Business and government allowances
For groups of individually assessed loans for which no objective evidence of impairment has been identified on an individual basis, a collective allowance is provided for losses which we estimate are inherent in the portfolio at the reporting date, but not yet specifically identified from an individual assessment of the loan.
The methodology for determining the appropriate level of the collective allowance incorporates a number of factors, including the size of the portfolios, expected loss rates, and relative risk profiles. We also consider estimates of the time periods over which losses that are present would be identified and a provision taken, our view of current economic and portfolio trends, and evidence of credit quality improvements or deterioration. On a regular basis, the parameters that affect the collective allowance calculation are updated, based on our experience and the economic environment. Expected loss rates for business loan portfolios are based on the risk rating of each credit facility and on the PD factors associated with each risk rating, as well as estimates of LGD. The PD factors reflect our historical loss experience and are supplemented by data derived from defaults in the public debt markets. Our risk-rating method and categories are disclosed in “Exposures subject to AIRB approach” in the “Credit risk” section. Historical loss experience is adjusted based on observable data to reflect the effects of current conditions. LGD estimates are based on our experience over past years.
| | | | |
| CIBC2015 ANNUAL REPORT | | | 77 | |
|
Management’s discussion and analysis |
The collective allowance(1) of $1,084 million (2014: $1,061 million), which represents our best estimate of losses inherent but not specifically provided for in our loan portfolios, was selected from within the range based on a qualitative analysis of the economic environment and credit trends, as well as the risk profile of the loan portfolios. A uniform 10% increase in the PDs or loss severity across all portfolios would cause the collective allowance(1) to increase by approximately $108 million.
| (1) | Related to credit card loans, personal loans that are less than 30 days delinquent, and mortgage and business and government loans that are less than 90 days delinquent. |
Securitizations and structured entities
Securitization of our own assets
Under IFRS 10 “Consolidated Financial Statements”, judgment is exercised in determining whether an investor controls an investee including assessing whether the investor has: (i) power over the investee; (ii) exposure, or rights, to variable returns from its involvement with the investee; and (iii) the ability to affect those returns through its power over the investee.
We sponsor several SEs that have purchased and securitized our own assets including Cards II Trust, Broadway Trust and Crisp Trust, which we consolidate under IFRS 10.
We also securitize our own mortgage assets through a government-sponsored securitization program. We sell these securitized assets to a government-sponsored securitization vehicle that we do not consolidate, as well as to other third parties. IAS 39 “Financial Instruments: Recognition and Measurement” provides guidance on when to derecognize financial assets. A financial asset is derecognized when the contractual rights to receive cash flows from the asset have expired, or when we have transferred the rights to receive cash flows from the asset such that:
| • | | We have transferred substantially all the risks and rewards of the asset; or |
| • | | We have neither transferred nor retained substantially all the risks and rewards of the asset, but have transferred control of the asset. |
We have determined that our securitization activities related to residential mortgages and cards receivables are accounted for as secured borrowing transactions because we have not met the aforementioned criteria.
In addition, we sell and derecognize commercial mortgages through a pass-through arrangement with a trust that securitizes these mortgages into ownership certificates held by various external investors. We continue to perform special servicing of the mortgages in exchange for a market-based fee and do not consolidate the trust. We also sell certain U.S. commercial mortgages to third-parties that qualify for derecognition because we have transferred substantially all the risks and rewards of the mortgages and have no continuous involvement after the transfer.
Securitization of third-party assets
We also sponsor several SEs that purchase pools of third-party assets. We consider a number of factors in determining whether CIBC controls these SEs. We monitor the extent to which we support these SEs, through direct investment in the debt issued by the SEs and through the provision of liquidity protection to the other debtholders, to assess whether we should consolidate these entities.
IFRS 10 also requires that we reconsider our consolidation assessment if facts and circumstances relevant to the entity indicate that there are changes to one or more of the three elements of control described above, for example, when any of the parties gains or loses decision-making power to direct relevant activities of the investee, when there is a change in the parties’ exposure or rights to variable returns from its involvement with the investee, or where there is a change in whether CIBC is deemed to be acting as a principal or an agent.
Specifically, in relation to our multi-seller conduits, we would reconsider our consolidation assessment if our level of interest in the ABCP issued by conduits changes significantly, or in the rare event that the liquidity facility we provide to the conduits is drawn or amended.
A significant increase in our holdings of the outstanding commercial paper issued by the conduits would become more likely in a scenario in which the market for bank-sponsored ABCP suffered a significant deterioration such that the conduits were unable to roll their ABCP.
For additional information on the securitizations of our own assets and third-party assets, see the “Off-balance sheet arrangements” section and Note 6 to the consolidated financial statements.
Asset impairment
Goodwill
As at October 31, 2015, we had goodwill of $1,526 million (2014: $1,450 million). Goodwill is not amortized, but is tested, at least annually, for impairment by comparing the recoverable amount of the cash-generating unit (CGU) to which goodwill has been allocated, with the carrying amount of the CGU including goodwill. Any deficiency is recognized as impairment of goodwill. The recoverable amount of a CGU is defined as the higher of its estimated fair value less cost to sell and its value in use. Goodwill is also required to be tested for impairment whenever there are indicators that it may be impaired.
Estimation of the recoverable amount is an area of significant judgment. Recoverable amounts are estimated using internally developed models which require the use of significant assumptions including forecasted earnings, discount rates, growth rates, forecasted regulatory capital requirements, and price-earnings multiples. Reductions in the estimated recoverable amount could arise from various factors, such as, reductions in forecasted cash flows, an increase in the assumed level of required capital, and any adverse changes to the discount rate or terminal growth rates either in isolation or in any combination thereof. Where our estimated recoverable amount is not significantly in excess of the carrying amount of the CGU, additional judgment is required, and reductions in the recoverable amount are more likely to give rise to a deficiency which would result in an impairment charge.
The recoverable amount of CIBC FirstCaribbean is based on a value in use calculation that is estimated using a five-year cash flow projection approved by management of CIBC FirstCaribbean and an estimate of the capital required to be maintained in the region to support ongoing operations. During the second quarter of 2014, we revised our expectations concerning the extent and timing of the recovery of economic conditions in the Caribbean region. We identified this change in expectation as an indicator of impairment and therefore estimated the recoverable amount of CIBC FirstCaribbean based on forecasts which were adjusted to reflect management’s belief that the economic recovery expected in the Caribbean region would occur over a longer period of time than previously forecasted, and that estimated realizable values of underlying collateral for non-performing loans would be lower than previously expected. We determined that the carrying amount of the CIBC FirstCaribbean CGU exceeded our estimate of its recoverable amount and, as a result, we recognized a goodwill impairment charge of $420 million (US$383 million) during the three months ended April 30, 2014, which reduced the carrying amount of the goodwill relating to CIBC FirstCaribbean to $344 million (US$314 million) as at April 30, 2014. We also performed our annual impairment test as of August 1, 2014 based on an updated five-year forecast which continued to reflect the challenging economic conditions and an expected, but delayed, recovery in those conditions within the Caribbean region. No additional impairment loss was recognized during the fourth quarter of 2014.
During the second quarter of 2015, we observed a change in certain forward-looking assumptions which reduced the interest income projections that were reflected in the five-year forecast used in our 2014 annual impairment test. While this caused us to revise our five-year forecast and re-estimate the recoverable amount of the CIBC FirstCaribbean CGU as at April 30, 2015, no impairment resulted. We also performed our annual impairment test as of August 1, 2015 based on an updated five-year forecast prepared by management of CIBC FirstCaribbean during the fourth quarter of 2015, which also did
| | |
| 78 | | CIBC2015 ANNUAL REPORT |
|
Management’s discussion and analysis |
not result in an impairment charge. In both of our 2015 impairment tests the forecast for CIBC FirstCaribbean reflected the currently challenging, but improving, economic conditions which continue to persist in the Caribbean region, as well as an expected further recovery in those conditions during the forecast period.
Economic conditions in the Caribbean region remain challenging and we continue to monitor our investment. Reductions in the estimated recoverable amount of our CIBC FirstCaribbean CGU could result in additional goodwill impairment charges in future periods. As at October 31, 2015, the carrying amount of goodwill relating to CIBC FirstCaribbean was $410 million (US$314 million).
Other intangible assets and long-lived assets
As at October 31, 2015, we had other intangible assets with an indefinite life of $142 million (2014: $138 million). Acquired intangible assets are separately recognized if the benefits of the intangible assets are obtained through contractual or other legal rights, or if the intangible assets can be sold, transferred, licensed, rented, or exchanged. Determining the useful lives of intangible assets requires judgment and fact-based analysis.
Intangible assets with an indefinite life are not amortized but are assessed for impairment by comparing the recoverable amount to the carrying amount. An impairment test is required at least annually, or whenever there are indicators that these assets may be impaired.
Long-lived assets and other identifiable intangible assets with a definite life are amortized over their estimated useful lives. These assets are tested for impairment whenever events or changes in circumstances indicate that the carrying amount is higher than the recoverable amount. The recoverable amount is defined as the higher of the estimated fair value less cost to sell and value in use.
Determining the recoverable amount of intangible assets and long-lived assets is an area of judgment as we estimate the future cash flows expected to result from the use of the asset and, where appropriate, cash flows arising from the asset’s eventual disposition.
For additional details, see Note 8 to the consolidated financial statements.
Income taxes
We are subject to income tax laws in the various jurisdictions where we operate, and the tax laws in those jurisdictions are potentially subject to different interpretations by us and the relevant taxation authority. We use judgment in the estimation of income taxes and deferred income tax assets and liabilities. As a result, management judgment is applied in the interpretation of the relevant tax laws and in estimating the provision for current and deferred income taxes. Deferred tax assets or liabilities are determined for each temporary difference based on the tax rates that are expected to be in effect in the period that the assets are realized or the liabilities are settled. Deferred tax liabilities are generally recognized for all taxable temporary differences unless the temporary differences relate to our net investments in foreign operations and will not reverse in the foreseeable future.
We are required to assess whether it is probable that our deferred income tax assets will be realized prior to their expiration and, based on all the available evidence, determine if any portion of our deferred income tax assets should not be recognized. The factors used to assess the probability of realization are our past experience of income and capital gains, forecast of future net income before income taxes, available tax planning strategies that could be implemented to realize the deferred income tax assets, and the remaining expiration period of tax loss carryforwards. In addition, for deductible temporary differences arising from our net investments in foreign operations, we must consider whether the temporary difference will reverse in the foreseeable future. Although realization is not assured, we believe, based on all the available evidence, it is probable that the recognized deferred income tax assets will be realized.
Income tax accounting impacts all our reporting segments. For further details on our income taxes, see Note 20 to the consolidated financial statements.
Contingent liabilities and provision
Legal proceedings and other contingencies
In the ordinary course of its business, CIBC is a party to a number of legal proceedings, including regulatory investigations, in which claims for substantial monetary damages are asserted against CIBC and its subsidiaries. Legal provisions are established if, in the opinion of management, it is both probable that an outflow of economic benefits will be required to resolve the matter, and a reliable estimate can be made of the amount of the obligation. If the reliable estimate of probable loss involves a range of potential outcomes within which a specific amount within the range appears to be a better estimate, that amount is accrued. If no specific amount within the range of potential outcomes appears to be a better estimate than any other amount, the mid-point in the range is accrued. In some instances, however, it is not possible either to determine whether an obligation is probable or to reliably estimate the amount of loss, in which case no accrual can be made.
While there is inherent difficulty in predicting the outcome of legal proceedings, based on current knowledge and in consultation with legal counsel, we do not expect the outcome of these matters, individually or in aggregate, to have a material adverse effect on our consolidated financial statements. However, the outcome of these matters, individually or in aggregate, may be material to our operating results for a particular reporting period. We regularly assess the adequacy of CIBC’s litigation accruals and make the necessary adjustments to incorporate new information as it becomes available.
The provisions disclosed in Note 23 to the consolidated financial statements included all of CIBC’s accruals for legal matters as at October 31, 2015, including amounts related to the significant legal proceedings described in that note and to other legal matters.
CIBC considers losses to be reasonably possible when they are neither probable nor remote. It is reasonably possible that CIBC may incur losses in addition to the amounts recorded when the loss accrued is the mid-point of a range of reasonably possible losses, or the potential loss pertains to a matter in which an unfavourable outcome is reasonably possible but not probable.
CIBC believes the estimate of the aggregate range of reasonably possible losses, in excess of the amounts accrued, for its significant legal proceedings, where it is possible to make such an estimate, is from nil to approximately $1.2 billion as at October 31, 2015. This estimated aggregate range of reasonably possible losses is based upon currently available information for those significant proceedings in which CIBC is involved, taking into account CIBC’s best estimate of such losses for those cases for which an estimate can be made. CIBC’s estimate involves significant judgment, given the varying stages of the proceedings and the existence of multiple defendants in many of such proceedings whose share of the liability has yet to be determined. The range does not include potential punitive damages and interest. The matters underlying the estimated range as at October 31, 2015, consist of the significant legal matters disclosed in Note 23 to the consolidated financial statements. The matters underlying the estimated range will change from time to time, and actual losses may vary significantly from the current estimate. For certain matters, CIBC does not believe that an estimate can currently be made as many of them are in preliminary stages and certain matters have no specific amount claimed. Consequently, these matters are not included in the range.
A description of significant ongoing matters to which CIBC is a party can be found in Note 23 to the consolidated financial statements.
| | | | |
| CIBC2015 ANNUAL REPORT | | | 79 | |
|
Management’s discussion and analysis |
Restructuring
During the year, we recorded cumulative restructuring charges of $296 million ($225 million after-tax) in Corporate and Other, which includes $85 million ($62 million after-tax) recorded in the first quarter and $211 million ($163 million after-tax) recorded in the fourth quarter. The charges primarily relate to employee severance and include Program Clarity, a bank-wide priority focused on simplifying our bank. The charge recorded in the fourth quarter also includes restructuring costs related to CIBC FirstCaribbean, which include charges related to the sale by CIBC FirstCaribbean of its Belize banking operations that is expected to close in the first quarter of 2016. As at October 31, 2015, the remaining provision relating to these restructuring charges was $244 million. While this amount represents our best estimate as at October 31, 2015 of the amount required to settle the obligation, uncertainty exists with respect to when the obligation will be settled and the amounts ultimately paid, as this will largely depend upon individual facts and circumstances.
For further details on our restructuring provision, see Note 23 to the consolidated financial statements.
Post-employment and other long-term benefit plan assumptions
We sponsor a number of benefit plans to eligible employees, including registered and supplemental pension plans, and post-retirement medical and dental plans (other post-employment benefit plans). We also continue to sponsor a long-term disability income replacement plan and associated medical and dental benefits (collectively, other long-term benefit plans). The long-term disability plan was closed to new claims effective June 1, 2004.
The calculation of net defined benefit plan expense and obligations depends on various actuarial assumptions such as discount rates, health-care cost trend rates, turnover of employees, projected salary increases, retirement age, and mortality rates. The actuarial assumptions used for determining the net defined benefit expense for a fiscal year are set at the beginning of the annual reporting period, are reviewed in accordance with accepted actuarial practice and are approved by management.
The discount rate assumption used in measuring the net defined benefit expense and defined benefit obligations reflects market yields, as of the measurement date, on high quality debt instruments with a currency and term to maturity that match the currency and expected timing of benefit payments. Our discount rate is estimated by developing a yield curve based on high quality corporate bonds. While there is a deep market of high quality corporate bonds denominated in Canadian dollars with short and medium terms to maturity, there is not a deep market in bonds with terms to maturity that match the timing of all the expected benefit payments for all of our Canadian plans. As a result, for our Canadian pension, other post-employment and other long-term benefit plans, we estimate the yields of high quality corporate bonds with longer term maturities by extrapolating current yields on bonds with short- and medium-term durations along the yield curve. Judgment is required in constructing the yield curve, and as a result, different methodologies applied in constructing the yield curve can give rise to different discount rates.
For further details of our annual pension and other post-employment expense and obligations, see Note 19 and Note 1 to the consolidated financial statements.
Financial instruments
As a financial institution, our assets and liabilities primarily comprise financial instruments, which include deposits, securities, loans, derivatives, acceptances, repurchase agreements, subordinated debt, and preferred shares.
We use these financial instruments for both trading and non-trading activities. Trading activities primarily include the purchase and sale of securities, transacting in foreign exchange and derivative instruments in the course of facilitating client trades and taking proprietary trading positions with the objective of income generation. Non-trading activities generally include the business of lending, investing, funding, and ALM.
The use of financial instruments may either introduce or mitigate exposures to market, credit and/or liquidity risks. See the “Management of risk” section for details on how these risks are managed.
Financial instruments are accounted for according to their classification. For details on the accounting for these instruments, see Note 2 to the consolidated financial statements.
For significant assumptions made in determining the valuation of financial and other instruments, see the “Valuation of financial instruments” section above.
Accounting developments
Transition to IFRS 9
IFRS 9 “Financial Instruments” (IFRS 9) replaces IAS 39 “Financial Instruments: Recognition and Measurement” and is effective for annual periods beginning on or after January 1, 2018, which for us would have been on November 1, 2018. Early application is permitted if an entity applies all the requirements of the standard. During 2015, OSFI issued a final advisory that requires D-SIBs to adopt IFRS 9 for their annual period beginning on November 1, 2017, one year earlier than required by the IASB. As a D-SIB, we will publish our first interim consolidated financial statements under IFRS 9 for the quarter ended January 31, 2018, except for the “own credit” provisions of IFRS 9, which we voluntarily early adopted as of November 1, 2014. IFRS 9 is required to be applied on a retrospective basis, with certain exceptions.
The transition to IFRS 9 represents a significant initiative for CIBC, for which we have established a transition program that is supported by a formal governance structure with an enterprise view and a dedicated project team. The project’s Steering Committee is co-chaired by senior stakeholders from our Risk Management and Finance groups, and is composed of individuals from the impacted SBUs as well as functional groups, such as Information Technology and Internal Audit. The Steering Committee is responsible for:
| • | | Ensuring the strategic alignment of IFRS 9 with CIBC’s overall strategies; |
| • | | Ensuring key milestones are met; |
| • | | Providing direction and guidance on a holistic basis; and |
| • | | Reviewing and resolving key issues and risks. |
To assist the Steering Committee in meeting its responsibilities, our transition program structure has three work streams that correspond to the three sections of the new financial instruments standard: (1) Classification and measurement of financial instruments; (2) Impairment; and (3) Hedge accounting. Each work stream is composed of stakeholders from the impacted SBUs and functional groups, who are subject matter experts in the relevant policies, processes or technologies that are expected to be impacted by the transition.
Classification and measurement
The IFRS 9 classification and measurement model requires that all debt instrument financial assets that do not meet a “solely payment of principal and interest” (SPPI) test, including those that contain embedded derivatives, be classified at initial recognition as Fair value through profit or loss. The intent of the SPPI test is to ensure that debt instruments that contain non-basic lending features, such as conversion options and equity linked pay-outs are measured at fair value through profit and loss. Subsequent measurement of instruments classified as Fair value through profit or loss under IFRS 9 operates in a similar manner to Trading under IAS 39.
| | |
| 80 | | CIBC2015 ANNUAL REPORT |
|
Management’s discussion and analysis |
For debt instrument financial assets that meet the SPPI test, classification at initial recognition will be determined based on what business model those instruments are managed under. Debt instruments that are managed on a “hold for trading” or “fair value” basis will be classified as fair value through profit or loss. Debt instruments that are managed on a “hold to collect and for sale” basis will be classified as Fair value through OCI (FV-OCI for debt). Debt instruments that are managed on a “hold to collect” basis will be classified as Amortized cost. Subsequent measurement of instruments classified at FV-OCI and Amortized cost classifications under IFRS 9 operate in a similar manner to AFS for debt securities and Loans and receivables, respectively, under existing IAS 39, except for the impairment provisions which are discussed below.
For those debt instrument financial assets that would otherwise be classified as FV-OCI or Amortized cost, an irrevocable designation can be made at initial recognition to instead measure the debt instrument at Fair value through profit or loss option under the fair value option (FVO) if doing so eliminates or significantly reduces an accounting mismatch and if certain OSFI requirements are met.
All equity instrument financial assets are required to be classified at initial recognition as fair value through profit or loss unless an irrevocable designation is made to classify the instrument as Fair value through OCI (FV-OCI for equities). Unlike AFS for equity securities under IAS 39, the FV-OCI for equities category results in all realized and unrealized gains and losses being recognized in OCI with no recycling to profit and loss. Only dividends continue to be recognized in profit and loss.
The classification and measurement of financial liabilities remain essentially unchanged from the current IAS 39 requirements, except that changes in fair value of FVO liabilities attributable to changes in own credit risk are to be presented in OCI, rather than profit and loss, which we early adopted as of November 1, 2014.
Derivatives will continue to be measured at fair value through profit or loss under IFRS 9.
Impairment
The new impairment guidance sets out an expected credit loss (ECL) model applicable to all debt instrument financial assets classified as Amortized cost or FV-OCI. In addition, the ECL model applies to loan commitments and financial guarantees that are not measured at fair value through profit and loss.
The application of the ECL methodology to non-impaired financial instruments requires entities to recognize 12 months of expected credit losses from the date the financial instrument is first recognized, and to recognize lifetime expected credit losses if the credit risk on that financial instrument has increased significantly since initial recognition. In assessing whether credit risk has increased significantly, entities are required to compare the risk of a default occurring on the financial instrument as at the reporting date, with the risk of a default occurring on the financial instrument as at the date of initial recognition. In subsequent reporting periods, if the credit risk of the financial instrument improves such that there is no longer a significant increase in credit risk since initial recognition, then entities shall revert to recognizing 12 months of expected credit losses. In contrast, under the incurred loss methodology inherent in IAS 39, allowances are provided for non-impaired loans for losses that are incurred but not yet identified, while impairment losses are generally only recognized for AFS debt securities when objective evidence of impairment has been identified.
The ECL model under IFRS 9 also requires that lifetime expected credit losses be recognized for financial assets that are assessed as credit-impaired, which for loans is similar to the requirements of IAS 39 to recognize impaired loans at their estimated realizable value. This occurs when one or more events have occurred after the initial recognition of the loan and the loss event or events have a detrimental impact on the estimated future cash flows of that loan.
We are currently designing the application of the ECL methodology to our loan and debt security portfolios which includes defining when a significant increase in credit risk of a financial asset has occurred, defining a credit impaired financial asset, determining the measurement of both 12-month and life time credit losses and determining the set of forward-looking information factors to be incorporated in our methodology and how those factors will be quantified. Our design takes into account that interpretations concerning the application of ECL continue to evolve.
Hedge accounting
The IFRS 9 hedge accounting guidance is intended to better align the accounting with risk management activities. However, IFRS 9 allows the existing hedge accounting requirements under IAS 39 to continue in place of the hedge accounting requirements under IFRS 9, pending the completion of the IASB’s project on macro hedge accounting.
Future accounting policy changes
For details on other future accounting policy changes, see Note 32 to the consolidated financial statements.
Regulatory developments
Dodd-Frank Wall Street Reform and Consumer Protection Act
The Dodd-Frank Wall Street Reform and Consumer Protection Act (the “Dodd-Frank Act”) was enacted in the U.S. in July 2010. The Dodd-Frank Act contains many broad reforms impacting the financial services industry. These reforms impact every financial institution in the U.S. and many financial institutions that operate outside the U.S. CIBC is subject to a number of specific requirements, including, among other things, mandatory clearing, trade reporting and registration of OTC derivative trading activities, heightened capital, liquidity and prudential standards, and restrictions on proprietary trading and private equity fund activities. CIBC has devoted resources necessary to ensure that we implement the requirements in compliance with all new regulations under the Dodd-Frank Act. We continually monitor developments to prepare for rulemakings that have the potential to impact our operations in the U.S. and elsewhere. Although these reforms have increased our cost of regulatory compliance and have restricted our ability to engage in certain activities in the U.S. and elsewhere, we do not expect costs and restrictions associated with the new regulations to have a material impact on our financial results.
The Foreign Account Tax Compliance Act
The Foreign Account Tax Compliance Act (FATCA) is U.S. legislation, the intent of which is to discourage tax evasion by U.S. taxpayers who have placed assets in financial accounts outside of the U.S. – either directly or indirectly through foreign entities such as trusts and corporations.
Under the FATCA regulations, non-U.S. financial institutions are required to identify and report accounts owned or controlled by U.S. taxpayers, including citizens of the U.S. worldwide (U.S. Accounts). In addition, identification and reporting will also be required on accounts of financial institutions that do not comply with FATCA regulations. The Government of Canada has signed an Intergovernmental Agreement (IGA) with the U.S., to facilitate FATCA information reporting by Canadian financial institutions. Under the provisions of the Canada-United States Enhanced Tax Information Exchange Agreement Implementation Act, Canadian financial institutions must report information on certain U.S. Accounts directly to the Canada Revenue Agency. The provisions of FATCA and the related Canadian legislation came into effect on July 1, 2014. Other countries in which CIBC operates have signed, or are in the process of negotiating and signing, IGAs with the U.S. Many Organisation for Economic Co-operation and Development (OECD) nations plan to implement automatic exchange of information agreements in respect of those countries’ tax residents, commencing as early as 2016. CIBC will meet all obligations imposed under FATCA and other tax information exchange regimes, in accordance with local law.
| | | | |
| CIBC2015 ANNUAL REPORT | | | 81 | |
|
Management’s discussion and analysis |
Principles for Effective Risk Data Aggregation and Risk Reporting
In January 2013, the BCBS published “Principles for Effective Risk Data Aggregation and Risk Reporting”. The Principles outline BCBS’s expectations to enhance risk data governance oversight and to improve risk data aggregation and reporting practices, thereby facilitating timely, consistent, and accurate decision making. It is expected that we will be subject to greater reporting scrutiny and may incur increased operating costs as a result of the Principles. We have an enterprise-wide Risk Data Aggregation initiative underway to be compliant with the Principles.
For a discussion of other regulatory developments, see the “Capital Markets”, “Capital resources”, and “Management of risk” sections.
Related-party transactions
We have various processes in place to ensure that the relevant related-party information is identified and reported to the Corporate Governance Committee (CGC) of the Board on a quarterly basis, as required by theBank Act (Canada). The CGC has the responsibility for reviewing our policies and practices in identifying transactions with our related parties that may materially affect us, and reviewing the associated procedures for promoting compliance with theBank Act (Canada).
In the ordinary course of business, we provide banking services and enter into transactions with related parties on terms similar to those offered to unrelated parties. Related parties include key management personnel(1) and their affiliates(2). Related parties also include associated companies and joint ventures accounted for under the equity method, and post-employment benefit plans for CIBC employees. Loans to these related parties are made in the ordinary course of business and on substantially the same terms as for comparable transactions with unrelated parties. We offer a subsidy on annual fees and preferential interest rates on credit card balances to senior officers which is the same offer extended to all employees of CIBC. In addition, CIBC offers deferred share and other plans to non-employee directors, executives, and certain other key employees. Details of our compensation of key management personnel and our investments in equity-accounted associates and joint ventures are disclosed in Notes 25, 18, 19 and 26 to the consolidated financial statements.
| (1) | Key management personnel are defined as those persons having authority and responsibility for planning, directing and controlling the activities of CIBC directly or indirectly and comprise the members of the Board (referred to as directors); and ExCo and certain named officers per theBank Act (Canada) (collectively referred to as senior officers). Board members who are also ExCo members are included as senior officers. |
| (2) | Affiliates include spouses, children under 18, and supported family members (dependants) of directors and senior officers. The term also includes entities over which directors, senior officers, and their dependants have significant influence. Significant influence can be exerted by one or more of these factors: greater than 10% voting interest; entities in which they have a management contract; entities in which they have positions of management authority/senior positions; entities in which they are a general partner; trusts in which they are trustees or substantial beneficiaries. |
Policy on the Scope of Services of the Shareholders’ Auditors
The “Policy on the Scope of Services of the Shareholders’ Auditors” sets out the parameters for the engagement of the shareholders’ auditors by CIBC that are consistent with applicable law, including the U.S. Sarbanes-Oxley Act of 2002 and Securities and Exchange Commission rules. The policy requires the Audit Committee’s pre-approval of all work performed by the shareholders’ auditors and prohibits CIBC from engaging the shareholders’ auditors for “prohibited” services. The Audit Committee is also accountable for the oversight of the work of the shareholders’ auditors and for an annual assessment of the engagement team’s qualifications, independence and performance. The Audit Committee is also responsible for conducting a periodic comprehensive review of the external auditor at least every five years. The Audit Committee’s oversight activities over the shareholders’ auditors are disclosed in our Management Proxy Circular.
Controls and procedures
Disclosure controls and procedures
CIBC’s management, with the participation of the President and Chief Executive Officer and the Chief Financial Officer, has evaluated the effectiveness of CIBC’s disclosure controls and procedures as at October 31, 2015 (as defined in the rules of the SEC and the Canadian Securities Administrators). Based on that evaluation, the President and Chief Executive Officer and the Chief Financial Officer have concluded that such disclosure controls and procedures were effective.
Management’s annual report on internal control over financial reporting
CIBC’s management is responsible for establishing and maintaining adequate internal control over financial reporting for CIBC.
Internal control over financial reporting is a process designed by, or under the supervision of, the President and Chief Executive Officer and the Chief Financial Officer and effected by the Board, management and other personnel to provide reasonable assurance regarding the reliability of financial reporting and the preparation of financial statements for external purposes in accordance with IFRS as issued by the International Accounting Standards Board (IASB). CIBC’s internal control over financial reporting includes those policies and procedures that (i) pertain to the maintenance of records, that, in reasonable detail, accurately and fairly reflect the transactions and dispositions of the assets of CIBC; (ii) provide reasonable assurance that transactions are recorded as necessary to permit preparation of financial statements in accordance with IFRS as issued by the IASB, and that receipts and expenditures of CIBC are being made only in accordance with authorizations of CIBC’s management and directors; and (iii) provide reasonable assurance regarding prevention or timely detection of unauthorized acquisition, use or disposition of CIBC’s assets that could have a material effect on the financial statements.
All internal control systems, no matter how well designed, have inherent limitations. Therefore, even those systems determined to be effective can provide only reasonable assurance with respect to financial statement preparation and presentation.
CIBC’s management has used the Internal Control – Integrated Framework that was published in 2013 by the Committee of Sponsoring Organizations of the Treadway Commission (COSO’s 2013 Framework) as the basis to evaluate the effectiveness of CIBC’s internal control over financial reporting.
As at October 31, 2015, management assessed the effectiveness of CIBC’s internal control over financial reporting and concluded that such internal control was effective and that there were no material weaknesses in CIBC’s internal control over financial reporting that have been identified by management.
Ernst & Young LLP, the external auditors, have audited the consolidated financial statements of CIBC for the year ended October 31, 2015, and have also issued a report on internal control over financial reporting under Auditing Standard No. 5 of the Public Company Accounting Oversight Board (United States). This report is located on page 94 of this Annual Report.
Changes in internal control over financial reporting
There have been no changes in CIBC’s internal control over financial reporting during the year ended October 31, 2015, that have materially affected, or are reasonably likely to materially affect, its internal control over financial reporting.
| | |
| 82 | | CIBC2015 ANNUAL REPORT |
|
Management’s discussion and analysis |
Supplementary annual financial information
Average balance sheet, net interest income and margin
| | | | | | | | | | | | | | | | | | | | | | | | | | | | | | | | | | | | | | |
| | | | | Average balance | | | Interest | | | Average rate | |
| $ millions, for the year ended October 31 | | 2015 | | | 2014 | | | 2013 | | | 2015 | | | 2014 | | | 2013 | | | 2015 | | | 2014 | | | 2013 | |
Domestic assets (1) | | | | | | | | | | | | | | | | | | | | | | | | | | | | | | | | | | | | |
Cash and deposits with banks | | $ | 2,369 | | | $ | 2,210 | | | $ | 2,903 | | | $ | 16 | | | $ | 11 | | | $ | 25 | | | | 0.68 | % | | | 0.50 | % | | | 0.86 | % |
Securities | | Trading | | | 43,061 | | | | 45,051 | | | | 42,367 | | | | 1,248 | | | | 1,248 | | | | 1,195 | | | | 2.90 | | | | 2.77 | | | | 2.82 | |
| | AFS | | | 6,231 | | | | 9,232 | | | | 12,934 | | | | 98 | | | | 162 | | | | 199 | | | | 1.57 | | | | 1.75 | | | | 1.54 | |
| | FVO | | | 58 | | | | 48 | | | | 47 | | | | 4 | | | | 4 | | | | 3 | | | | 6.90 | | | | 8.33 | | | | 6.38 | |
Securities borrowed or purchased under resale agreements | | | 26,361 | | | | 19,905 | | | | 21,752 | | | | 241 | | | | 275 | | | | 301 | | | | 0.91 | | | | 1.38 | | | | 1.38 | |
Loans | | Residential mortgages | | | 159,689 | | | | 150,893 | | | | 146,977 | | | | 4,159 | | | | 4,241 | | | | 4,338 | | | | 2.60 | | | | 2.81 | | | | 2.95 | |
| | Personal and credit card | | | 46,234 | | | | 45,289 | | | | 47,912 | | | | 3,224 | | | | 3,183 | | | | 3,467 | | | | 6.97 | | | | 7.03 | | | | 7.24 | |
| | | Business and government | | | 36,343 | | | | 30,839 | | | | 27,356 | | | | 1,244 | | | | 1,171 | | | | 1,158 | | | | 3.42 | | | | 3.80 | | | | 4.23 | |
Total loans | | | 242,266 | | | | 227,021 | | | | 222,245 | | | | 8,627 | | | | 8,595 | | | | 8,963 | | | | 3.56 | | | | 3.79 | | | | 4.03 | |
Other interest-bearing assets | | | 578 | | | | 443 | | | | 413 | | | | 10 | | | | 10 | | | | 1 | | | | 1.73 | | | | 2.26 | | | | 0.24 | |
Derivative instruments | | | 14,504 | | | | 9,189 | | | | 8,720 | | | | – | | | | – | | | | – | | | | – | | | | – | | | | – | |
Customers’ liability under acceptances | | | 10,256 | | | | 10,013 | | | | 10,431 | | | | – | | | | – | | | | – | | | | – | | | | – | | | | – | |
Other non-interest-bearing assets | | | 13,776 | | | | 11,555 | | | | 11,386 | | | | – | | | | – | | | | – | | | | – | | | | – | | | | – | |
Total domestic assets | | | 359,460 | | | | 334,667 | | | | 333,198 | | | | 10,244 | | | | 10,305 | | | | 10,687 | | | | 2.85 | | | | 3.08 | | | | 3.21 | |
Foreign assets (1) | | | | | | | | | | | | | | | | | | | | | | | | | | | | | | | | | | | | |
Cash and deposits with banks | | | 23,473 | | | | 13,274 | | | | 7,523 | | | | 60 | | | | 14 | | | | 13 | | | | 0.26 | | | | 0.11 | | | | 0.17 | |
Securities | | Trading | | | 4,006 | | | | 1,681 | | | | 1,266 | | | | 39 | | | | 38 | | | | 42 | | | | 0.97 | | | | 2.26 | | | | 3.32 | |
| | AFS | | | 12,809 | | | | 13,921 | | | | 12,734 | | | | 129 | | | | 175 | | | | 190 | | | | 1.01 | | | | 1.26 | | | | 1.49 | |
| | FVO | | | 208 | | | | 232 | | | | 256 | | | | 6 | | | | 1 | | | | 2 | | | | 2.88 | | | | 0.43 | | | | 0.78 | |
Securities borrowed or purchased under resale agreements | | | 11,407 | | | | 10,469 | | | | 9,472 | | | | 69 | | | | 45 | | | | 46 | | | | 0.60 | | | | 0.43 | | | | 0.49 | |
Loans | | Residential mortgages | | | 2,324 | | | | 2,146 | | | | 2,191 | | | | 132 | | | | 124 | | | | 123 | | | | 5.68 | | | | 5.78 | | | | 5.61 | |
| | Personal and credit card | | | 739 | | | | 727 | | | | 780 | | | | 70 | | | | 64 | | | | 63 | | | | 9.47 | | | | 8.80 | | | | 8.08 | |
| | | Business and government | | | 23,464 | | | | 19,919 | | | | 17,653 | | | | 733 | | | | 687 | | | | 633 | | | | 3.12 | | | | 3.45 | | | | 3.59 | |
Total loans | | | 26,527 | | | | 22,792 | | | | 20,624 | | | | 935 | | | | 875 | | | | 819 | | | | 3.52 | | | | 3.84 | | | | 3.97 | |
Other interest-bearing assets | | | 92 | | | | 71 | | | | 78 | | | | 1 | | | | 24 | | | | 12 | | | | 1.09 | | | | 33.80 | | | | 15.38 | |
Derivative instruments | | | 13,812 | | | | 10,874 | | | | 15,080 | | | | – | | | | – | | | | – | | | | – | | | | – | | | | – | |
Other non-interest-bearing assets | | | 3,530 | | | | 3,500 | | | | 3,315 | | | | – | | | | – | | | | – | | | | – | | | | – | | | | – | |
Total foreign assets | | | 95,864 | | | | 76,814 | | | | 70,348 | | | | 1,239 | | | | 1,172 | | | | 1,124 | | | | 1.29 | | | | 1.53 | | | | 1.60 | |
Total assets | | $ | 455,324 | | | $ | 411,481 | | | $ | 403,546 | | | $ | 11,483 | | | $ | 11,477 | | | $ | 11,811 | | | | 2.52 | % | | | 2.79 | % | | | 2.93 | % |
Domestic liabilities (1) | | | | | | | | | | | | | | | | | | | | | | | | | | | | | | | | | | | | |
Deposits | | Personal | | $ | 125,982 | | | $ | 120,339 | | | $ | 113,770 | | | $ | 1,032 | | | $ | 1,129 | | | $ | 1,138 | | | | 0.82 | % | | | 0.94 | % | | | 1.00 | % |
| | Business and government | | | 106,439 | | | | 99,318 | | | | 96,106 | | | | 1,080 | | | | 1,271 | | | | 1,335 | | | | 1.01 | | | | 1.28 | | | | 1.39 | |
| | Bank | | | 1,548 | | | | 847 | | | | 639 | | | | 7 | | | | 4 | | | | 3 | | | | 0.45 | | | | 0.47 | | | | 0.47 | |
| | | Secured borrowings | | | 38,758 | | | | 43,525 | | | | 50,815 | | | | 581 | | | | 717 | | | | 987 | | | | 1.50 | | | | 1.65 | | | | 1.94 | |
Total deposits | | | 272,727 | | | | 264,029 | | | | 261,330 | | | | 2,700 | | | | 3,121 | | | | 3,463 | | | | 0.99 | | | | 1.18 | | | | 1.33 | |
Derivative instruments | | | 15,461 | | | | 8,788 | | | | 8,492 | | | | – | | | | – | | | | – | | | | – | | | | – | | | | – | |
Acceptances | | | 10,256 | | | | 10,013 | | | | 10,435 | | | | – | | | | – | | | | – | | | | – | | | | – | | | | – | |
Obligations related to securities sold short | | | 10,724 | | | | 13,134 | | | | 13,003 | | | | 221 | | | | 314 | | | | 327 | | | | 2.06 | | | | 2.39 | | | | 2.51 | |
Obligations related to securities lent or sold under repurchase agreements | | | 9,743 | | | | 8,191 | | | | 5,164 | | | | 90 | | | | 109 | | | | 80 | | | | 0.92 | | | | 1.33 | | | | 1.55 | |
Other liabilities | | | 9,459 | | | | 8,670 | | | | 9,766 | | | | 10 | | | | 10 | | | | 14 | | | | 0.11 | | | | 0.12 | | | | 0.14 | |
Subordinated indebtedness | | | 4,138 | | | | 3,974 | | | | 4,308 | | | | 179 | | | | 176 | | | | 191 | | | | 4.33 | | | | 4.43 | | | | 4.43 | |
Total domestic liabilities | | | 332,508 | | | | 316,799 | | | | 312,498 | | | | 3,200 | | | | 3,730 | | | | 4,075 | | | | 0.96 | | | | 1.18 | | | | 1.30 | |
Foreign liabilities(1) | | | | | | | | | | | | | | | | | | | | | | | | | | | | | | | | | | | | |
Deposits | | Personal | | | 7,163 | | | | 6,707 | | | | 6,356 | | | | 68 | | | | 71 | | | | 63 | | | | 0.95 | | | | 1.06 | | | | 0.99 | |
| | Business and government | | | 63,798 | | | | 44,317 | | | | 40,260 | | | | 190 | | | | 112 | | | | 120 | | | | 0.30 | | | | 0.25 | | | | 0.30 | |
| | Bank | | | 10,519 | | | | 6,995 | | | | 5,512 | | | | 31 | | | | 31 | | | | 29 | | | | 0.29 | | | | 0.44 | | | | 0.53 | |
| | | Secured borrowings | | | 115 | | | | 458 | | | | 425 | | | | 1 | | | | 2 | | | | 4 | | | | 0.87 | | | | 0.44 | | | | 0.94 | |
Total deposits | | | 81,595 | | | | 58,477 | | | | 52,553 | | | | 290 | | | | 216 | | | | 216 | | | | 0.36 | | | | 0.37 | | | | 0.41 | |
Derivative instruments | | | 14,723 | | | | 10,401 | | | | 14,684 | | | | – | | | | – | | | | – | | | | – | | | | – | | | | – | |
Acceptances | | | – | | | | – | | | | – | | | | – | | | | – | | | | – | | | | – | | | | – | | | | – | |
Obligations related to securities sold short | | | 721 | | | | 585 | | | | 244 | | | | 9 | | | | 13 | | | | 7 | | | | 1.25 | | | | 2.22 | | | | 2.87 | |
Obligations related to securities lent or sold under repurchase agreements | | | 3,469 | | | | 4,522 | | | | 5,078 | | | | 20 | | | | 18 | | | | 22 | | | | 0.58 | | | | 0.40 | | | | 0.43 | |
Other liabilities | | | 1,911 | | | | 1,640 | | | | 1,205 | | | | 47 | | | | 39 | | | | 36 | | | | 2.46 | | | | 2.38 | | | | 2.99 | |
Subordinated indebtedness | | | 262 | | | | 250 | | | | 243 | | | | 2 | | | | 2 | | | | 2 | | | | 0.76 | | | | 0.80 | | | | 0.82 | |
Total foreign liabilities | | | 102,681 | | | | 75,875 | | | | 74,007 | | | | 368 | | | | 288 | | | | 283 | | | | 0.36 | | | | 0.38 | | | | 0.38 | |
Total liabilities | | | 435,189 | | | | 392,674 | | | | 386,505 | | | | 3,568 | | | | 4,018 | | | | 4,358 | | | | 0.82 | | | | 1.02 | | | | 1.13 | |
Shareholders’ equity | | | 19,951 | | | | 18,636 | | | | 16,873 | | | | – | | | | – | | | | – | | | | – | | | | – | | | | – | |
Non-controlling interests | | | 184 | | | | 171 | | | | 168 | | | | – | | | | – | | | | – | | | | – | | | | – | | | | – | |
Total liabilities and equity | | $ | 455,324 | | | $ | 411,481 | | | $ | 403,546 | | | $ | 3,568 | | | $ | 4,018 | | | $ | 4,358 | | | | 0.78 | % | | | 0.98 | % | | | 1.08 | % |
Net interest income and margin | | | | | | | | | | | | | | $ | 7,915 | | | $ | 7,459 | | | $ | 7,453 | | | | 1.74 | % | | | 1.81 | % | | | 1.85 | % |
Additional disclosures: Non-interest-bearing deposit liabilities | | | | | | | | | | | | | | | | | | | | | | | | | | | | | | | | | | | | |
Domestic | | $ | 37,202 | | | $ | 34,888 | | | $ | 32,779 | | | | | | | | | | | | | | | | | | | | | | | | | |
Foreign | | $ | 4,844 | | | $ | 4,070 | | | $ | 3,395 | | | | | | | | | | | | | | | | | | | | | | | | | |
| (1) | Classification as domestic or foreign is based on domicile of debtor or customer. |
| | | | |
| CIBC2015 ANNUAL REPORT | | | 83 | |
|
Management’s discussion and analysis |
Volume/rate analysis of changes in net interest income
| | | | | | | | | | | | | | | | | | | | | | | | | | |
| $ millions | | | | 2015/2014 | | | 2014/2013 | |
| | | | | Increase (decrease) due to change in: | | | Increase (decrease) due to change in: | |
| | | | | Average balance | | | Average rate | | | Total | | | Average balance | | | Average rate | | | Total | |
Domestic assets(1) | | | | | | | | | | | | | | | | | | | | | | | | |
Cash and deposits with banks | | $ | 1 | | | $ | 4 | | | $ | 5 | | | $ | (6 | ) | | $ | (8 | ) | | $ | (14 | ) |
Securities | | Trading | | | (55 | ) | | | 55 | | | | – | | | | 76 | | | | (23 | ) | | | 53 | |
| | AFS | | | (53 | ) | | | (11 | ) | | | (64 | ) | | | (57 | ) | | | 20 | | | | (37 | ) |
| | FVO | | | 1 | | | | (1 | ) | | | – | | | | – | | | | 1 | | | | 1 | |
Securities borrowed or purchased under resale agreements | | | 89 | | | | (123 | ) | | | (34 | ) | | | (26 | ) | | | – | | | | (26 | ) |
Loans | | Residential mortgages | | | 247 | | | | (329 | ) | | | (82 | ) | | | 116 | | | | (213 | ) | | | (97 | ) |
| | Personal and credit card | | | 66 | | | | (25 | ) | | | 41 | | | | (190 | ) | | | (94 | ) | | | (284 | ) |
| | | Business and government | | | 209 | | | | (136 | ) | | | 73 | | | | 147 | | | | (134 | ) | | | 13 | |
Total loans | | | 522 | | | | (490 | ) | | | 32 | | | | 73 | | | | (441 | ) | | | (368 | ) |
Other interest-bearing assets | | | 3 | | | | (3 | ) | | | – | | | | – | | | | 9 | | | | 9 | |
Change in domestic interest income | | | 508 | | | | (569 | ) | | | (61 | ) | | | 60 | | | | (442 | ) | | | (382 | ) |
Foreign assets(1) | | | | | | | | | | | | | | | | | | | | | | | | |
Cash and deposits with banks | | | 11 | | | | 35 | | | | 46 | | | | 10 | | | | (9 | ) | | | 1 | |
Securities | | Trading | | | 53 | | | | (52 | ) | | | 1 | | | | 14 | | | | (18 | ) | | | (4 | ) |
| | AFS | | | (14 | ) | | | (32 | ) | | | (46 | ) | | | 18 | | | | (33 | ) | | | (15 | ) |
| | FVO | | | – | | | | 5 | | | | 5 | | | | – | | | | (1 | ) | | | (1 | ) |
Securities borrowed or purchased under resale agreements | | | 4 | | | | 20 | | | | 24 | | | | 5 | | | | (6 | ) | | | (1 | ) |
Loans | | Residential mortgages | | | 10 | | | | (2 | ) | | | 8 | | | | (3 | ) | | | 4 | | | | 1 | |
| | Personal and credit card | | | 1 | | | | 5 | | | | 6 | | | | (4 | ) | | | 5 | | | | 1 | |
| | | Business and government | | | 122 | | | | (76 | ) | | | 46 | | | | 81 | | | | (27 | ) | | | 54 | |
Total loans | | | 133 | | | | (73 | ) | | | 60 | | | | 74 | | | | (18 | ) | | | 56 | |
Other interest-bearing assets | | | 7 | | | | (30 | ) | | | (23 | ) | | | (1 | ) | | | 13 | | | | 12 | |
Change in foreign interest income | | | 194 | | | | (127 | ) | | | 67 | | | | 120 | | | | (72 | ) | | | 48 | |
Total change in interest income | | $ | 702 | | | $ | (696 | ) | | $ | 6 | | | $ | 180 | | | $ | (514 | ) | | $ | (334 | ) |
Domestic liabilities(1) | | | | | | | | | | | | | | | | | | | | | | | | |
Deposits | | Personal | | $ | 53 | | | $ | (150 | ) | | $ | (97 | ) | | $ | 66 | | | $ | (75 | ) | | $ | (9 | ) |
| | Business and government | | | 91 | | | | (282 | ) | | | (191 | ) | | | 45 | | | | (109 | ) | | | (64 | ) |
| | Bank | | | 3 | | | | – | | | | 3 | | | | 1 | | | | – | | | | 1 | |
| | | Secured borrowings | | | (79 | ) | | | (57 | ) | | | (136 | ) | | | (142 | ) | | | (128 | ) | | | (270 | ) |
Total deposits | | | 68 | | | | (489 | ) | | | (421 | ) | | | (30 | ) | | | (312 | ) | | | (342 | ) |
Obligations related to securities sold short | | | (58 | ) | | | (35 | ) | | | (93 | ) | | | 3 | | | | (16 | ) | | | (13 | ) |
Obligations related to securities lent or sold under repurchase agreements | | | 21 | | | | (40 | ) | | | (19 | ) | | | 47 | | | | (18 | ) | | | 29 | |
Other liabilities | | | 1 | | | | (1 | ) | | | – | | | | (2 | ) | | | (2 | ) | | | (4 | ) |
Subordinated indebtedness | | | 7 | | | | (4 | ) | | | 3 | | | | (15 | ) | | | - | | | | (15 | ) |
Change in domestic interest expense | | | 39 | | | | (569 | ) | | | (530 | ) | | | 3 | | | | (348 | ) | | | (345 | ) |
Foreign liabilities(1) | | | | | | | | | | | | | | | | | | | | | | | | |
Deposits | | Personal | | | 5 | | | | (8 | ) | | | (3 | ) | | | 3 | | | | 5 | | | | 8 | |
| | Business and government | | | 49 | | | | 29 | | | | 78 | | | | 12 | | | | (20 | ) | | | (8 | ) |
| | Bank | | | 16 | | | | (16 | ) | | | – | | | | 8 | | | | (6 | ) | | | 2 | |
| | | Secured borrowings | | | (1 | ) | | | – | | | | (1 | ) | | | – | | | | (2 | ) | | | (2 | ) |
Total deposits | | | 69 | | | | 5 | | | | 74 | | | | 23 | | | | (23 | ) | | | - | |
Obligations related to securities sold short | | | 3 | | | | (7 | ) | | | (4 | ) | | | 10 | | | | (4 | ) | | | 6 | |
Obligations related to securities lent or sold under repurchase agreements | | | (4 | ) | | | 6 | | | | 2 | | | | (2 | ) | | | (2 | ) | | | (4 | ) |
Other liabilities | | | 6 | | | | 2 | | | | 8 | | | | 13 | | | | (10 | ) | | | 3 | |
Change in foreign interest expense | | | 74 | | | | 6 | | | | 80 | | | | 44 | | | | (39 | ) | | | 5 | |
Total change in interest expense | | $ | 113 | | | $ | (563 | ) | | $ | (450 | ) | | $ | 47 | | | $ | (387 | ) | | $ | (340 | ) |
Change in total net interest income | | $ | 589 | | | $ | (133 | ) | | $ | 456 | | | $ | 133 | | | $ | (127 | ) | | $ | 6 | |
| (1) | Classification as domestic or foreign is based on domicile of debtor or customer. |
| | |
| 84 | | CIBC2015 ANNUAL REPORT |
|
Management’s discussion and analysis |
Analysis of net loans and acceptances
| | | | | | | | | | | | | | | | | | | | | | | | | | | | | | | | | | | | | | | | | | | | | | |
| | | Canada(1) | | | | | U.S.(1) | |
| $ millions, as at October 31 | | 2015 | | | 2014 | | | 2013 | | | 2012 | | | | | 2011 | | | | | 2015 | | | 2014 | | | 2013 | | | 2012 | | | | | 2011 | |
Residential mortgages | | $ | 166,616 | | | $ | 155,198 | | | $ | 148,664 | | | $ | 147,841 | | | | | $ | 148,268 | | | | | $ | – | | | $ | 1 | | | $ | 1 | | | $ | 1 | | | | | $ | 1 | |
Student | | | 110 | | | | 151 | | | | 210 | | | | 287 | | | | | | 384 | | | | | | – | | | | – | | | | – | | | | – | | | | | | – | |
Personal | | | 35,412 | | | | 34,342 | | | | 33,257 | | | | 33,891 | | | | | | 33,202 | | | | | | 51 | | | | 94 | | | | 93 | | | | 109 | | | | | | 132 | |
Credit card | | | 11,279 | | | | 11,078 | | | | 14,097 | | | | 14,418 | | | | | | 14,970 | | | | | | 37 | | | | 40 | | | | 32 | | | | 33 | | | | | | 24 | |
Total net consumer loans | | | 213,417 | | | | 200,769 | | | | 196,228 | | | | 196,437 | | | | | | 196,824 | | | | | | 88 | | | | 135 | | | | 126 | | | | 143 | | | | | | 157 | |
Non-residential mortgages | | | 7,120 | | | | 6,947 | | | | 6,979 | | | | 7,095 | | | | | | 7,055 | | | | | | 333 | | | | 240 | | | | 236 | | | | – | | | | | | 2 | |
Financial institutions | | | 4,137 | | | | 2,640 | | | | 2,356 | | | | 2,384 | | | | | | 2,124 | | | | | | 667 | | | | 659 | | | | 403 | | | | 435 | | | | | | 427 | |
Retail and wholesale | | | 3,667 | | | | 3,515 | | | | 3,086 | | | | 2,827 | | | | | | 2,652 | | | | | | 310 | | | | 257 | | | | 158 | | | | 113 | | | | | | 43 | |
Business services | | | 5,011 | | | | 4,728 | | | | 4,191 | | | | 3,694 | | | | | | 3,508 | | | | | | 814 | | | | 418 | | | | 284 | | | | 226 | | | | | | 221 | |
Manufacturing-capital goods | | | 1,505 | | | | 1,308 | | | | 1,081 | | | | 1,072 | | | | | | 1,079 | | | | | | 181 | | | | 221 | | | | 189 | | | | 188 | | | | | | 129 | |
Manufacturing-consumer goods | | | 2,626 | | | | 2,329 | | | | 1,914 | | | | 1,736 | | | | | | 1,289 | | | | | | 22 | | | | 14 | | | | 36 | | | | 62 | | | | | | 50 | |
Real estate and construction | | | 8,644 | | | | 7,201 | | | | 5,794 | | | | 4,956 | | | | | | 4,118 | | | | | | 7,206 | | | | 6,394 | | | | 5,611 | | | | 4,156 | | | | | | 3,215 | |
Agriculture | | | 4,828 | | | | 4,263 | | | | 3,933 | | | | 3,689 | | | | | | 3,585 | | | | | | 50 | | | | 6 | | | | 1 | | | | 1 | | | | | | – | |
Oil and gas | | | 4,138 | | | | 3,633 | | | | 2,969 | | | | 2,856 | | | | | | 2,884 | | | | | | 1,469 | | | | 1,276 | | | | 988 | | | | 781 | | | | | | 413 | |
Mining | | | 761 | | | | 602 | | | | 383 | | | | 319 | | | | | | 285 | | | | | | 305 | | | | 266 | | | | 223 | | | | 65 | | | | | | 78 | |
Forest products | | | 566 | | | | 470 | | | | 434 | | | | 426 | | | | | | 416 | | | | | | 11 | | | | 41 | | | | 35 | | | | 44 | | | | | | 52 | |
Hardware and software | | | 280 | | | | 339 | | | | 468 | | | | 464 | | | | | | 244 | | | | | | 167 | | | | 118 | | | | 98 | | | | – | | | | | | 73 | |
Telecommunications and cable | | | 510 | | | | 514 | | | | 413 | | | | 238 | | | | | | 213 | | | | | | 44 | | | | 26 | | | | 26 | | | | 14 | | | | | | 12 | |
Publishing, printing, and broadcasting | | | 244 | | | | 208 | | | | 290 | | | | 356 | | | | | | 405 | | | | | | – | | | | 5 | | | | – | | | | – | | | | | | – | |
Transportation | | | 1,449 | | | | 1,033 | | | | 870 | | | | 736 | | | | | | 701 | | | | | | 183 | | | | 221 | | | | 247 | | | | 332 | | | | | | 353 | |
Utilities | | | 1,621 | | | | 1,282 | | | | 1,170 | | | | 1,082 | | | | | | 674 | | | | | | 845 | | | | 804 | | | | 816 | | | | 492 | | | | | | 246 | |
Education, health and social services | | | 2,128 | | | | 2,017 | | | | 1,956 | | | | 1,933 | | | | | | 1,754 | | | | | | – | | | | – | | | | – | | | | 25 | | | | | | 46 | |
Governments | | | 541 | | | | 578 | | | | 613 | | | | 727 | | | | | | 785 | | | | | | – | | | | – | | | | – | | | | – | | | | | | – | |
Others | | | – | | | | – | | | | – | | | | – | | | | | | – | | | | | | 69 | | | | 165 | | | | 210 | | | | 730 | | | | | | 845 | |
Collective allowance allocated to business and government loans | | | (218 | ) | | | (192 | ) | | | (192 | ) | | | (211 | ) | | | | | (205 | ) | | | | | (50 | ) | | | (43 | ) | | | (28 | ) | | | (38 | ) | | | | | (54 | ) |
Total net business and government loans, including acceptances | | | 49,558 | | | | 43,415 | | | | 38,708 | | | | 36,379 | | | | | | 33,566 | | | | | | 12,626 | | | | 11,088 | | | | 9,533 | | | | 7,626 | | | | | | 6,151 | |
Total net loans and acceptances | | $ | 262,975 | | | $ | 244,184 | | | $ | 234,936 | | | $ | 232,816 | | | | | $ | 230,390 | | | | | $ | 12,714 | | | $ | 11,223 | | | $ | 9,659 | | | $ | 7,769 | | | | | $ | 6,308 | |
| (1) | Classification by country is based on domicile of debtor or customer. |
Analysis of net loans and acceptances (continued)
| | | | | | | | | | | | | | | | | | | | | | | | | | | | | | | | | | | | | | | | | | | | | | |
| | | Other(1) | | | | | Total | |
| $ millions, as at October 31 | | 2015 | | | 2014 | | | 2013 | | | 2012 | | | | | 2011 | | | | | 2015 | | | 2014 | | | 2013 | | | 2012 | | | | | 2011 | |
Residential mortgages | | $ | 2,406 | | | $ | 2,118 | | | $ | 2,113 | | | $ | 2,143 | | | | | $ | 2,191 | | | | | $ | 169,022 | | | $ | 157,317 | | | $ | 150,778 | | | $ | 149,985 | | | | | $ | 150,460 | |
Student | | | – | | | | 1 | | | | 1 | | | | 1 | | | | | | 1 | | | | | | 110 | | | | 152 | | | | 211 | | | | 288 | | | | | | 385 | |
Personal | | | 476 | | | | 410 | | | | 429 | | | | 568 | | | | | | 637 | | | | | | 35,939 | | | | 34,846 | | | | 33,779 | | | | 34,568 | | | | | | 33,971 | |
Credit card | | | 150 | | | | 125 | | | | 126 | | | | 119 | | | | | | 118 | | | | | | 11,466 | | | | 11,243 | | | | 14,255 | | | | 14,570 | | | | | | 15,112 | |
Total net consumer loans | | | 3,032 | | | | 2,654 | | | | 2,669 | | | | 2,831 | | | | | | 2,947 | | | | | | 216,537 | | | | 203,558 | | | | 199,023 | | | | 199,411 | | | | | | 199,928 | |
Non-residential mortgages | | | 245 | | | | 228 | | | | 239 | | | | 273 | | | | | | 291 | | | | | | 7,698 | | | | 7,415 | | | | 7,454 | | | | 7,368 | | | | | | 7,348 | |
Financial institutions | | | 3,291 | | | | 2,155 | | | | 1,065 | | | | 1,099 | | | | | | 1,003 | | | | | | 8,095 | | | | 5,454 | | | | 3,824 | | | | 3,918 | | | | | | 3,554 | |
Retail and wholesale | | | 548 | | | | 499 | | | | 333 | | | | 326 | | | | | | 351 | | | | | | 4,525 | | | | 4,271 | | | | 3,577 | | | | 3,266 | | | | | | 3,046 | |
Business services | | | 1,370 | | | | 1,098 | | | | 772 | | | | 932 | | | | | | 1,032 | | | | | | 7,195 | | | | 6,244 | | | | 5,247 | | | | 4,852 | | | | | | 4,761 | |
Manufacturing-capital goods | | | 293 | | | | 248 | | | | 202 | | | | 243 | | | | | | 217 | | | | | | 1,979 | | | | 1,777 | | | | 1,472 | | | | 1,503 | | | | | | 1,425 | |
Manufacturing-consumer goods | | | 119 | | | | 88 | | | | 249 | | | | 225 | | | | | | 268 | | | | | | 2,767 | | | | 2,431 | | | | 2,199 | | | | 2,023 | | | | | | 1,607 | |
Real estate and construction | | | 1,124 | | | | 890 | | | | 777 | | | | 791 | | | | | | 572 | | | | | | 16,974 | | | | 14,485 | | | | 12,182 | | | | 9,903 | | | | | | 7,905 | |
Agriculture | | | 40 | | | | 37 | | | | 40 | | | | 65 | | | | | | 94 | | | | | | 4,918 | | | | 4,306 | | | | 3,974 | | | | 3,755 | | | | | | 3,679 | |
Oil and gas | | | 324 | | | | 321 | | | | 71 | | | | 16 | | | | | | – | | | | | | 5,931 | | | | 5,230 | | | | 4,028 | | | | 3,653 | | | | | | 3,297 | |
Mining | | | 446 | | | | 384 | | | | 537 | | | | 280 | | | | | | 109 | | | | | | 1,512 | | | | 1,252 | | | | 1,143 | | | | 664 | | | | | | 472 | |
Forest products | | | – | | | | 38 | | | | 30 | | | | 29 | | | | | | 32 | | | | | | 577 | | | | 549 | | | | 499 | | | | 499 | | | | | | 500 | |
Hardware and software | | | 12 | | | | 14 | | | | 22 | | | | 22 | | | | | | 22 | | | | | | 459 | | | | 471 | | | | 588 | | | | 486 | | | | | | 339 | |
Telecommunications and cable | | | 388 | | | | 162 | | | | 234 | | | | 148 | | | | | | 60 | | | | | | 942 | | | | 702 | | | | 673 | | | | 400 | | | | | | 285 | |
Publishing, printing, and broadcasting | | | 79 | | | | 89 | | | | 4 | | | | 37 | | | | | | 41 | | | | | | 323 | | | | 302 | | | | 294 | | | | 393 | | | | | | 446 | |
Transportation | | | 899 | | | | 803 | | | | 893 | | | | 430 | | | | | | 387 | | | | | | 2,531 | | | | 2,057 | | | | 2,010 | | | | 1,498 | | | | | | 1,441 | |
Utilities | | | 785 | | | | 631 | | | | 318 | | | | 467 | | | | | | 272 | | | | | | 3,251 | | | | 2,717 | | | | 2,304 | | | | 2,041 | | | | | | 1,192 | |
Education, health and social services | | | 32 | | | | 26 | | | | 24 | | | | 23 | | | | | | 23 | | | | | | 2,160 | | | | 2,043 | | | | 1,980 | | | | 1,981 | | | | | | 1,823 | |
Governments | | | 1,611 | | | | 1,079 | | | | 943 | | | | 922 | | | | | | 901 | | | | | | 2,152 | | | | 1,657 | | | | 1,556 | | | | 1,649 | | | | | | 1,686 | |
Others | | | 711 | | | | 1,431 | | | | 2,403 | | | | 3,011 | | | | | | 3,109 | | | | | | 780 | | | | 1,596 | | | | 2,613 | | | | 3,741 | | | | | | 3,954 | |
Collective allowance allocated to business and government loans | | | (57 | ) | | | (42 | ) | | | (40 | ) | | | (23 | ) | | | | | (20 | ) | | | | | (325 | ) | | | (277 | ) | | | (260 | ) | | | (272 | ) | | | | | (279 | ) |
Total net business and government loans, including acceptances | | | 12,260 | | | | 10,179 | | | | 9,116 | | | | 9,316 | | | | | | 8,764 | | | | | | 74,444 | | | | 64,682 | | | | 57,357 | | | | 53,321 | | | | | | 48,481 | |
Total net loans and acceptances | | $ | 15,292 | | | $ | 12,833 | | | $ | 11,785 | | | $ | 12,147 | | | | | $ | 11,711 | | | | | $ | 290,981 | | | $ | 268,240 | | | $ | 256,380 | | | $ | 252,732 | | | | | $ | 248,409 | |
| (1) | Classification by country is based on domicile of debtor or customer. |
| | | | |
| CIBC2015 ANNUAL REPORT | | | 85 | |
|
Management’s discussion and analysis |
Summary of allowance for credit losses
| | | | | | | | | | | | | | | | | | | | |
| $ millions, as at or for the year ended October 31 | | 2015 | | | 2014 | | | 2013 | | | 2012 | | | 2011 | |
Balance at beginning of year | | $ | 1,736 | | | $ | 1,758 | | | $ | 1,916 | | | $ | 1,851 | | | $ | 1,950 | |
Provision for credit losses | | | 771 | | | | 937 | | | | 1,121 | | | | 1,291 | | | | 1,144 | |
Write-offs | | | | | | | | | | | | | | | | | | | | |
Domestic (1) | | | | | | | | | | | | | | | | | | | | |
Residential mortgages | | | 14 | | | | 19 | | | | 15 | | | | 18 | | | | 16 | |
Student | | | 1 | | | | 3 | | | | 3 | | | | 6 | | | | 5 | |
Personal and credit card | | | 781 | | | | 857 | | | | 1,030 | | | | 1,118 | | | | 1,141 | |
Other business and government | | | 42 | | | | 63 | | | | 137 | | | | 93 | | | | 103 | |
Foreign (1) | | | | | | | | | | | | | | | | | | | | |
Residential mortgages | | | 18 | | | | 8 | | | | 9 | | | | 2 | | | | 1 | |
Personal and credit card | | | 16 | | | | 16 | | | | 9 | | | | 13 | | | | 14 | |
Other business and government | | | 132 | | | | 92 | | | | 245 | | | | 98 | | | | 55 | |
Total write-offs | | | 1,004 | | | | 1,058 | | | | 1,448 | | | | 1,348 | | | | 1,335 | |
Recoveries | | | | | | | | | | | | | | | | | | | | |
Domestic (1) | | | | | | | | | | | | | | | | | | | | |
Personal and credit card | | | 171 | | | | 177 | | | | 172 | | | | 158 | | | | 132 | |
Other business and government | | | 8 | | | | 11 | | | | 6 | | | | 8 | | | | 10 | |
Foreign (1) | | | | | | | | | | | | | | | | | | | | |
Personal and credit card | | | 5 | | | | 2 | | | | 3 | | | | 3 | | | | 1 | |
Other business and government | | | 2 | | | | 2 | | | | 3 | | | | 1 | | | | 2 | |
Total recoveries | | | 186 | | | | 192 | | | | 184 | | | | 170 | | | | 145 | |
Net write-offs | | | 818 | | | | 866 | | | | 1,264 | | | | 1,178 | | | | 1,190 | |
Interest income on impaired loans | | | (23 | ) | | | (30 | ) | | | (37 | ) | | | (47 | ) | | | (48 | ) |
Foreign exchange and other | | | 96 | | | | (63 | ) | | | 22 | | | | (1 | ) | | | (5 | ) |
Balance at end of year | | $ | 1,762 | | | $ | 1,736 | | | $ | 1,758 | | | $ | 1,916 | | | $ | 1,851 | |
Comprises: | | | | | | | | | | | | | | | | | | | | |
Loans | | $ | 1,670 | | | $ | 1,660 | | | $ | 1,698 | | | $ | 1,860 | | | $ | 1,803 | |
Undrawn credit facilities | | | 92 | | | | 76 | | | | 60 | | | | 56 | | | | 48 | |
Ratio of net write-offs during year to average loans outstanding during year | | | 0.30 | % | | | 0.35 | % | | | 0.52 | % | | | 0.49 | % | | | 0.51 | % |
| (1) | Classification as domestic or foreign is based on domicile of debtor or customer. |
Allowance for credit losses on impaired loans as a percentage of gross impaired loans
| | | | | | | | | | | | | | | | | | | | | | | | | | | | | | | | | | | | | | | | |
| | | Allowance for credit losses(1) | | | Allowance as a % of gross impaired loans | |
| $ millions, as at October 31 | | 2015 | | | 2014 | | | 2013 | | | 2012 | | | 2011 | | | 2015 | | | 2014 | | | 2013 | | | 2012 | | | 2011 | |
Domestic (2) | | | | | | | | | | | | | | | | | | | | | | | | | | | | | | | | | | | | | | | | |
Residential mortgages | | $ | 21 | | | $ | 22 | | | $ | 24 | | | $ | 18 | | | $ | 15 | | | | 9.3 | % | | | 10.2 | % | | | 11.4 | % | | | 8.0 | % | | | 5.0 | % |
Personal loans | | | 99 | | | | 96 | | | | 105 | | | | 159 | | | | 156 | | | | 91.7 | | | | 80.0 | | | | 77.8 | | | | 84.6 | | | | 73.6 | |
Business and government | | | 77 | | | | 38 | | | | 61 | | | | 97 | | | | 88 | | | | 42.8 | | | | 60.3 | | | | 63.5 | | | | 47.3 | | | | 56.1 | |
Total domestic | | | 197 | | | | 156 | | | | 190 | | | | 274 | | | | 259 | | | | 38.4 | | | | 39.1 | | | | 43.1 | | | | 44.3 | | | | 38.6 | |
Foreign (2) | | | | | | | | | | | | | | | | | | | | | | | | | | | | | | | | | | | | | | | | |
Residential mortgages | | | 167 | | | | 146 | | | | 65 | | | | 27 | | | | 18 | | | | 48.0 | | | | 45.9 | | | | 23.8 | | | | 11.0 | | | | 8.1 | |
Personal loans | | | 46 | | | | 43 | | | | 30 | | | | 25 | | | | 25 | | | | 58.2 | | | | 53.8 | | | | 34.9 | | | | 31.6 | | | | 31.6 | |
Business and government | | | 236 | | | | 299 | | | | 262 | | | | 395 | | | | 300 | | | | 49.3 | | | | 46.9 | | | | 35.1 | | | | 42.8 | | | | 31.7 | |
Total foreign | | | 449 | | | | 488 | | | | 357 | | | | 447 | | | | 343 | | | | 49.6 | | | | 47.1 | | | | 32.3 | | | | 35.8 | | | | 27.5 | |
Total allowance | | $ | 646 | | | $ | 644 | | | $ | 547 | | | $ | 721 | | | $ | 602 | | | | 45.5 | % | | | 44.9 | % | | | 35.4 | % | | | 38.6 | % | | | 31.4 | % |
| (1) | Comprises individual allowance, and collective allowance related to personal, scored small business, and mortgage impaired loans that are greater than 90 days delinquent. |
| (2) | Classification as domestic or foreign is based on domicile of debtor or customer. |
| | |
| 86 | | CIBC2015 ANNUAL REPORT |
|
Management’s discussion and analysis |
Allowance on non-impaired loans as a percentage of net loans and acceptances
| | | | | | | | | | | | | | | | | | | | | | | | | | | | | | | | | | | | | | | | |
| | | Allowance for credit losses (1) | | | Allowance as a % of net loans and acceptances | |
| $ millions, as at October 31 | | 2015 | | | 2014 | | | 2013 | | | 2012 | | | 2011 | | | 2015 | | | 2014 | | | 2013 | | | 2012 | | | 2011 | |
Domestic (2) | | | | | | | | | | | | | | | | | | | | | | | | | | | | | | | | | | | | | | | | |
Residential mortgages | | $ | 26 | | | $ | 21 | | | $ | 63 | | | $ | 19 | | | $ | 14 | | | | – | % | | | – | % | | | – | % | | | – | % | | | – | % |
Personal loans | | | 316 | | | | 315 | | | | 313 | | | | 278 | | | | 300 | | | | 0.9 | | | | 0.9 | | | | 0.9 | | | | 0.8 | | | | 0.9 | |
Credit cards | | | 334 | | | | 384 | | | | 512 | | | | 582 | | | | 631 | | | | 3.0 | | | | 3.5 | | | | 3.6 | | | | 4.0 | | | | 4.2 | |
Business and government | | | 208 | | | | 183 | | | | 179 | | | | 186 | | | | 174 | | | | 0.4 | | | | 0.4 | | | | 0.5 | | | | 0.5 | | | | 0.5 | |
Total domestic | | | 884 | | | | 903 | | | | 1,067 | | | | 1,065 | | | | 1,119 | | | | 0.3 | | | | 0.4 | | | | 0.5 | | | | 0.5 | | | | 0.5 | |
Foreign (2) | | | | | | | | | | | | | | | | | | | | | | | | | | | | | | | | | | | | | | | | |
Residential mortgages | | | 22 | | | | 20 | | | | 8 | | | | 7 | | | | 2 | | | | 0.9 | | | | 0.9 | | | | 0.4 | | | | 0.3 | | | | 0.1 | |
Personal loans | | | 7 | | | | 6 | | | | 3 | | | | 5 | | | | 5 | | | | 1.3 | | | | 1.2 | | | | 0.6 | | | | 0.7 | | | | 0.6 | |
Credit cards | | | 4 | | | | 2 | | | | 5 | | | | 1 | | | | 1 | | | | 2.1 | | | | 1.2 | | | | 3.2 | | | | 0.7 | | | | 0.7 | |
Business and government | | | 107 | | | | 85 | | | | 68 | | | | 61 | | | | 74 | | | | 0.4 | | | | 0.4 | | | | 0.4 | | | | 0.4 | | | | 0.5 | |
Total foreign | | | 140 | | | | 113 | | | | 84 | | | | 74 | | | | 82 | | | | 0.5 | | | | 0.5 | | | | 0.4 | | | | 0.4 | | | | 0.5 | |
Total allowance | | $ | 1,024 | | | $ | 1,016 | | | $ | 1,151 | | | $ | 1,139 | | | $ | 1,201 | | | | 0.4 | % | | | 0.4 | % | | | 0.4 | % | | | 0.5 | % | | | 0.5 | % |
| (1) | Comprises the collective allowance related to credit card loans, and personal loans, mortgage and business and government loans that are less than 90 days delinquent. Excludes allowance on undrawn credit facilities. |
| (2) | Classification as domestic or foreign is based on domicile of debtor or customer. |
Net loans and acceptances by geographic location(1)
| | | | | | | | | | | | | | | | | | | | |
| $ millions, as at October 31 | | 2015 | | | 2014 | | | 2013 | | | 2012 | | | 2011 | |
Canada | | | | | | | | | | | | | | | | | | | | |
Atlantic provinces | | $ | 13,598 | | | $ | 13,307 | | | $ | 13,124 | | | $ | 13,228 | | | $ | 13,115 | |
Quebec | | | 23,093 | | | | 21,802 | | | | 21,257 | | | | 20,591 | | | | 19,602 | |
Ontario | | | 125,584 | | | | 114,940 | | | | 109,390 | | | | 108,861 | | | | 110,157 | |
Prairie provinces | | | 12,877 | | | | 12,136 | | | | 11,829 | | | | 11,440 | | | | 9,093 | |
Alberta, Northwest Territories and Nunavut | | | 41,197 | | | | 38,859 | | | | 37,953 | | | | 38,300 | | | | 38,433 | |
British Columbia and Yukon | | | 47,478 | | | | 44,012 | | | | 42,421 | | | | 41,435 | | | | 41,074 | |
Collective allowance allocated to Canada (2) | | | (852 | ) | | | (872 | ) | | | (1,038 | ) | | | (1,039 | ) | | | (1,084 | ) |
Total Canada | | | 262,975 | | | | 244,184 | | | | 234,936 | | | | 232,816 | | | | 230,390 | |
U.S. | | | 12,714 | | | | 11,223 | | | | 9,659 | | | | 7,769 | | | | 6,308 | |
Other countries | | | 15,292 | | | | 12,833 | | | | 11,785 | | | | 12,147 | | | | 11,711 | |
Total net loans and acceptances | | $ | 290,981 | | | $ | 268,240 | | | $ | 256,380 | | | $ | 252,732 | | | $ | 248,409 | |
| (1) | Classification by country is based on domicile of debtor or customer. |
| (2) | Comprises the collective allowance related to credit card loans, personal loans that are less than 30 days delinquent, and mortgage and business and government loans that are less than 90 days delinquent. |
| | | | |
| CIBC2015 ANNUAL REPORT | | | 87 | |
|
Management’s discussion and analysis |
Net impaired loans
| | | | | | | | | | | | | | | | | | | | | | | | | | | | | | | | | | | | | | | | | | |
| | | Canada (1) | | | | | U.S. (1) | |
| $ millions, as at October 31 | | 2015 | | | 2014 | | | 2013 | | | 2012 | | | 2011 | | | | | 2015 | | | 2014 | | | 2013 | | | 2012 | | | 2011 | |
Gross impaired loans | | | | | | | | | | | | | | | | | | | | | | | | | | | | | | | | | | | | | | | | | | |
Residential mortgages | | $ | 225 | | | $ | 216 | | | $ | 210 | | | $ | 226 | | | $ | 302 | | | | | $ | – | | | $ | – | | | $ | – | | | $ | – | | | $ | – | |
Student | | | 5 | | | | 7 | | | | 9 | | | | 12 | | | | 17 | | | | | | – | | | | – | | | | – | | | | – | | | | – | |
Personal | | | 103 | | | | 113 | | | | 126 | | | | 176 | | | | 195 | | | | | | – | | | | 1 | | | | 4 | | | | – | | | | – | |
Total gross impaired consumer loans | | | 333 | | | | 336 | | | | 345 | | | | 414 | | | | 514 | | | | | | – | | | | 1 | | | | 4 | | | | – | | | | – | |
Non-residential mortgages | | | 4 | | | | 4 | | | | 1 | | | | – | | | | 4 | | | | | | – | | | | – | | | | – | | | | – | | | | – | |
Financial institutions | | | – | | | | 1 | | | | – | | | | 1 | | | | 1 | | | | | | – | | | | – | | | | – | | | | – | | | | – | |
Retail, wholesale and business services | | | 26 | | | | 31 | | | | 54 | | | | 38 | | | | 47 | | | | | | – | | | | – | | | | 34 | | | | 58 | | | | 51 | |
Manufacturing – consumer and capital goods | | | 8 | | | | 4 | | | | 6 | | | | 11 | | | | 16 | | | | | | – | | | | – | | | | – | | | | 3 | | | | 5 | |
Real estate and construction | | | 9 | | | | 10 | | | | 9 | | | | 23 | | | | 24 | | | | | | 94 | | | | 135 | | | | 159 | | | | 183 | | | | 211 | |
Agriculture | | | 1 | | | | 2 | | | | 4 | | | | 7 | | | | 15 | | | | | | – | | | | – | | | | – | | | | – | | | | – | |
Resource-based industries | | | 126 | | | | 4 | | | | 13 | | | | 55 | | | | 4 | | | | | | 1 | | | | – | | | | – | | | | – | | | | – | |
Telecommunications, media and technology | | | 2 | | | | 4 | | | | 6 | | | | 62 | | | | 39 | | | | | | – | | | | – | | | | – | | | | – | | | | – | |
Transportation | | | 1 | | | | 1 | | | | 1 | | | | 6 | | | | 5 | | | | | | – | | | | – | | | | 38 | | | | 90 | | | | 3 | |
Utilities | | | – | | | | – | | | | – | | | | – | | | | – | | | | | | 10 | | | | 20 | | | | – | | | | – | | | | – | |
Other | | | 3 | | | | 2 | | | | 2 | | | | 2 | | | | 2 | | | | | | – | | | | – | | | | – | | | | – | | | | – | |
Total gross impaired – business and government loans | | | 180 | | | | 63 | | | | 96 | | | | 205 | | | | 157 | | | | | | 105 | | | | 155 | | | | 231 | | | | 334 | | | | 270 | |
Total gross impaired loans | | | 513 | | | | 399 | | | | 441 | | | | 619 | | | | 671 | | | | | | 105 | | | | 156 | | | | 235 | | | | 334 | | | | 270 | |
Other past due loans (2) | | | 337 | | | | 342 | | | | 378 | | | | 401 | | | | 553 | | | | | | – | | | | – | | | | – | | | | 11 | | | | – | |
Total gross impaired and other past due loans | | $ | 850 | | | $ | 741 | | | $ | 819 | | | $ | 1,020 | | | $ | 1,224 | | | | | $ | 105 | | | $ | 156 | | | $ | 235 | | | $ | 345 | | | $ | 270 | |
Allowance for credit losses (3) | | | | | | | | | | | | | | | | | | | | | | | | | | | | | | | | | | | | | | | | | | |
Residential mortgages | | $ | 21 | | | $ | 22 | | | $ | 24 | | | $ | 18 | | | $ | 15 | | | | | $ | – | | | $ | – | | | $ | – | | | $ | – | | | $ | – | |
Student | | | – | | | | – | | | | – | | | | – | | | | 5 | | | | | | – | | | | – | | | | – | | | | – | | | | – | |
Personal | | | 99 | | | | 96 | | | | 105 | | | | 159 | | | | 151 | | | | | | – | | | | 1 | | | | 1 | | | | – | | | | – | |
Total allowance – consumer loans | | | 120 | | | | 118 | | | | 129 | | | | 177 | | | | 171 | | | | | | – | | | | 1 | | | | 1 | | | | – | | | | – | |
Non-residential mortgages | | | 1 | | | | 1 | | | | – | | | | – | | | | 3 | | | | | | – | | | | – | | | | – | | | | – | | | | – | |
Financial institutions | | | – | | | | – | | | | – | | | | – | | | | 1 | | | | | | – | | | | – | | | | – | | | | – | | | | – | |
Retail, wholesale and business services | | | 19 | | | | 20 | | | | 31 | | | | 26 | | | | 32 | | | | | | – | | | | – | | | | 20 | | | | 38 | | | | 19 | |
Manufacturing – consumer and capital goods | | | 6 | | | | 3 | | | | 6 | | | | 8 | | | | 8 | | | | | | – | | | | – | | | | – | | | | 3 | | | | 4 | |
Real estate and construction | | | 7 | | | | 7 | | | | 6 | | | | 10 | | | | 11 | | | | | | 27 | | | | 47 | | | | 36 | | | | 90 | | | | 72 | |
Agriculture | | | – | | | | – | | | | 1 | | | | 4 | | | | 5 | | | | | | – | | | | – | | | | – | | | | – | | | | – | |
Resource-based industries | | | 39 | | | | 2 | | | | 9 | | | | 25 | | | | 3 | | | | | | – | | | | – | | | | – | | | | – | | | | – | |
Telecommunications, media and technology | | | 2 | | | | 3 | | | | 5 | | | | 16 | | | | 18 | | | | | | – | | | | – | | | | – | | | | – | | | | – | |
Transportation | | | 1 | | | | 1 | | | | 1 | | | | 6 | | | | 5 | | | | | | – | | | | – | | | | 2 | | | | 55 | | | | 3 | |
Utilities | | | – | | | | – | | | | – | | | | – | | | | – | | | | | | 6 | | | | 13 | | | | – | | | | – | | | | – | |
Other | | | 2 | | | | 1 | | | | 2 | | | | 2 | | | | 2 | | | | | | – | | | | – | | | | – | | | | – | | | | – | |
Total allowance – business and government loans | | | 77 | | | | 38 | | | | 61 | | | | 97 | | | | 88 | | | | | | 33 | | | | 60 | | | | 58 | | | | 186 | | | | 98 | |
Total allowance | | $ | 197 | | | $ | 156 | | | $ | 190 | | | $ | 274 | | | $ | 259 | | | | | $ | 33 | | | $ | 61 | | | $ | 59 | | | $ | 186 | | | $ | 98 | |
Net impaired loans | | | | | | | | | | | | | | | | | | | | | | | | | | | | | | | | | | | | | | | | | | |
Residential mortgages | | $ | 204 | | | $ | 194 | | | $ | 186 | | | $ | 208 | | | $ | 287 | | | | | $ | – | | | $ | – | | | $ | – | | | $ | – | | | $ | – | |
Student | | | 5 | | | | 7 | | | | 9 | | | | 12 | | | | 12 | | | | | | – | | | | – | | | | – | | | | – | | | | – | |
Personal | | | 4 | | | | 17 | | | | 21 | | | | 17 | | | | 44 | | | | | | – | | | | – | | | | 3 | | | | – | | | | – | |
Total net impaired consumer loans | | | 213 | | | | 218 | | | | 216 | | | | 237 | | | | 343 | | | | | | – | | | | – | | | | 3 | | | | – | | | | – | |
Non-residential mortgages | | | 3 | | | | 3 | | | | 1 | | | | – | | | | 1 | | | | | | – | | | | – | | | | – | | | | – | | | | – | |
Financial institutions | | | – | | | | 1 | | | | – | | | | 1 | | | | – | | | | | | – | | | | – | | | | – | | | | – | | | | – | |
Retail, wholesale and business services | | | 7 | | | | 11 | | | | 23 | | | | 12 | | | | 15 | | | | | | – | | | | – | | | | 14 | | | | 20 | | | | 32 | |
Manufacturing – consumer and capital goods | | | 2 | | | | 1 | | | | – | | | | 3 | | | | 8 | | | | | | – | | | | – | | | | – | | | | – | | | | 1 | |
Real estate and construction | | | 2 | | | | 3 | | | | 3 | | | | 13 | | | | 13 | | | | | | 67 | | | | 88 | | | | 123 | | | | 93 | | | | 139 | |
Agriculture | | | 1 | | | | 2 | | | | 3 | | | | 3 | | | | 10 | | | | | | – | | | | – | | | | – | | | | – | | | | – | |
Resource-based industries | | | 87 | | | | 2 | | | | 4 | | | | 30 | | | | 1 | | | | | | 1 | | | | – | | | | – | | | | – | | | | – | |
Telecommunications, media and technology | | | – | | | | 1 | | | | 1 | | | | 46 | | | | 21 | | | | | | – | | | | – | | | | – | | | | – | | | | – | |
Transportation | | | – | | | | – | | | | – | | | | – | | | | – | | | | | | – | | | | – | | | | 36 | | | | 35 | | | | – | |
Utilities | | | – | | | | – | | | | – | | | | – | | | | – | | | | | | 4 | | | | 7 | | | | – | | | | – | | | | – | |
Other | | | 1 | | | | 1 | | | | – | | | | – | | | | – | | | | | | – | | | | – | | | | – | | | | – | | | | – | |
Total net impaired – business and government loans | | | 103 | | | | 25 | | | | 35 | | | | 108 | | | | 69 | | | | | | 72 | | | | 95 | | | | 173 | | | | 148 | | | | 172 | |
Total net impaired loans | | $ | 316 | | | $ | 243 | | | $ | 251 | | | $ | 345 | | | $ | 412 | | | | | $ | 72 | | | $ | 95 | | | $ | 176 | | | $ | 148 | | | $ | 172 | |
| (1) | Classification by country is based on domicile of debtor or customer. |
| (2) | Represents loans where repayment of principal or payment of interest is contractually in arrears between 90 and 180 days. |
| (3) | Comprises individual allowance, and collective allowance related to personal, scored small business, and mortgage impaired loans that are greater than 90 days delinquent. |
| | |
| 88 | | CIBC2015 ANNUAL REPORT |
|
Management’s discussion and analysis |
Net impaired loans (continued)
| | | | | | | | | | | | | | | | | | | | | | | | | | | | | | | | | | | | | | | | | | |
| | | Other(1) | | | | | Total | |
| $ millions, as at October 31 | | 2015 | | | 2014 | | | 2013 | | | 2012 | | | 2011 | | | | | 2015 | | | 2014 | | | 2013 | | | 2012 | | | 2011 | |
Gross impaired loans | | | | | | | | | | | | | | | | | | | | | | | | | | | | | | | | | | | | | | | | | | |
Residential mortgages | | $ | 348 | | | $ | 318 | | | $ | 273 | | | $ | 246 | | | $ | 222 | | | | | $ | 573 | | | $ | 534 | | | $ | 483 | | | $ | 472 | | | $ | 524 | |
Student | | | – | | | | – | | | | – | | | | – | | | | – | | | | | | 5 | | | | 7 | | | | 9 | | | | 12 | | | | 17 | |
Personal | | | 79 | | | | 79 | | | | 82 | | | | 79 | | | | 79 | | | | | | 182 | | | | 193 | | | | 212 | | | | 255 | | | | 274 | |
Total gross impaired consumer loans | | | 427 | | | | 397 | | | | 355 | | | | 325 | | | | 301 | | | | | | 760 | | | | 734 | | | | 704 | | | | 739 | | | | 815 | |
Non-residential mortgages | | | 34 | | | | 60 | | | | 85 | | | | 101 | | | | 71 | | | | | | 38 | | | | 64 | | | | 86 | | | | 101 | | | | 75 | |
Financial institutions | | | 5 | | | | 5 | | | | – | | | | 1 | | | | 3 | | | | | | 5 | | | | 6 | | | | – | | | | 2 | | | | 4 | |
Retail, wholesale and business services | | | 141 | | | | 168 | | | | 174 | | | | 191 | | | | 213 | | | | | | 167 | | | | 199 | | | | 262 | | | | 287 | | | | 311 | |
Manufacturing – consumer and capital goods | | | 47 | | | | 44 | | | | 52 | | | | 54 | | | | 56 | | | | | | 55 | | | | 48 | | | | 58 | | | | 68 | | | | 77 | |
Real estate and construction | | | 139 | | | | 184 | | | | 179 | | | | 210 | | | | 269 | | | | | | 242 | | | | 329 | | | | 347 | | | | 416 | | | | 504 | |
Agriculture | | | 3 | | | | 6 | | | | 11 | | | | 12 | | | | 23 | | | | | | 4 | | | | 8 | | | | 15 | | | | 19 | | | | 38 | |
Resource-based industries | | | 2 | | | | 1 | | | | 1 | | | | 1 | | | | 3 | | | | | | 129 | | | | 5 | | | | 14 | | | | 56 | | | | 7 | |
Telecommunications, media and technology | | | – | | | | 5 | | | | 5 | | | | 9 | | | | 9 | | | | | | 2 | | | | 9 | | | | 11 | | | | 71 | | | | 48 | |
Transportation | | | 2 | | | | 8 | | | | 7 | | | | 8 | | | | 28 | | | | | | 3 | | | | 9 | | | | 46 | | | | 104 | | | | 36 | |
Utilities | | | 1 | | | | 1 | | | | 1 | | | | 1 | | | | – | | | | | | 11 | | | | 21 | | | | 1 | | | | 1 | | | | – | |
Other | | | – | | | | – | | | | 1 | | | | 1 | | | | – | | | | | | 3 | | | | 2 | | | | 3 | | | | 3 | | | | 2 | |
Total gross impaired – business and government loans | | | 374 | | | | 482 | | | | 516 | | | | 589 | | | | 675 | | | | | | 659 | | | | 700 | | | | 843 | | | | 1,128 | | | | 1,102 | |
Total gross impaired loans | | | 801 | | | | 879 | | | | 871 | | | | 914 | | | | 976 | | | | | | 1,419 | | | | 1,434 | | | | 1,547 | | | | 1,867 | | | | 1,917 | |
Other past due loans(2) | | | 3 | | | | 8 | | | | 7 | | | | 7 | | | | 11 | | | | | | 340 | | | | 350 | | | | 385 | | | | 419 | | | | 564 | |
Total gross impaired and other past due loans | | $ | 804 | | | $ | 887 | | | $ | 878 | | | $ | 921 | | | $ | 987 | | | | | $ | 1,759 | | | $ | 1,784 | | | $ | 1,932 | | | $ | 2,286 | | | $ | 2,481 | |
Allowance for credit losses(3) | | | | | | | | | | | | | | | | | | | | | | | | | | | | | | | | | | | | | | | | | | |
Residential mortgages | | $ | 167 | | | $ | 146 | | | $ | 65 | | | $ | 27 | | | $ | 18 | | | | | $ | 188 | | | $ | 168 | | | $ | 89 | | | $ | 45 | | | $ | 33 | |
Student | | | – | | | | – | | | | – | | | | – | | | | – | | | | | | – | | | | – | | | | – | | | | – | | | | 5 | |
Personal | | | 46 | | | | 42 | | | | 29 | | | | 25 | | | | 25 | | | | | | 145 | | | | 139 | | | | 135 | | | | 184 | | | | 176 | |
Total allowance – consumer loans | | | 213 | | | | 188 | | | | 94 | | | | 52 | | | | 43 | | | | | | 333 | | | | 307 | | | | 224 | | | | 229 | | | | 214 | |
Non-residential mortgages | | | 17 | | | | 31 | | | | 32 | | | | 24 | | | | 26 | | | | | | 18 | | | | 32 | | | | 32 | | | | 24 | | | | 29 | |
Financial institutions | | | 3 | | | | 3 | | | | – | | | | 1 | | | | 1 | | | | | | 3 | | | | 3 | | | | – | | | | 1 | | | | 2 | |
Retail, wholesale and business services | | | 65 | | | | 67 | | | | 60 | | | | 63 | | | | 69 | | | | | | 84 | | | | 87 | | | | 111 | | | | 127 | | | | 120 | |
Manufacturing – consumer and capital goods | | | 43 | | | | 42 | | | | 41 | | | | 37 | | | | 37 | | | | | | 49 | | | | 45 | | | | 47 | | | | 48 | | | | 49 | |
Real estate and construction | | | 68 | | | | 91 | | | | 62 | | | | 70 | | | | 40 | | | | | | 102 | | | | 145 | | | | 104 | | | | 170 | | | | 123 | |
Agriculture | | | 3 | | | | 4 | | | | 5 | | | | 3 | | | | 12 | | | | | | 3 | | | | 4 | | | | 6 | | | | 7 | | | | 17 | |
Resource-based industries | | | 1 | | | | – | | | | – | | | | – | | | | 1 | | | | | | 40 | | | | 2 | | | | 9 | | | | 25 | | | | 4 | |
Telecommunications, media and technology | | | – | | | | – | | | | 1 | | | | 9 | | | | 9 | | | | | | 2 | | | | 3 | | | | 6 | | | | 25 | | | | 27 | |
Transportation | | | 2 | | | | – | | | | 2 | | | | 1 | | | | 7 | | | | | | 3 | | | | 1 | | | | 5 | | | | 62 | | | | 15 | |
Utilities | | | 1 | | | | 1 | | | | 1 | | | | 1 | | | | – | | | | | | 7 | | | | 14 | | | | 1 | | | | 1 | | | | – | |
Other | | | – | | | | – | | | | – | | | | – | | | | – | | | | | | 2 | | | | 1 | | | | 2 | | | | 2 | | | | 2 | |
Total allowance – business and government loans | | | 203 | | | | 239 | | | | 204 | | | | 209 | | | | 202 | | | | | | 313 | | | | 337 | | | | 323 | | | | 492 | | | | 388 | |
Total allowance | | $ | 416 | | | $ | 427 | | | $ | 298 | | | $ | 261 | | | $ | 245 | | | | | $ | 646 | | | $ | 644 | | | $ | 547 | | | $ | 721 | | | $ | 602 | |
Net impaired loans | | | | | | | | | | | | | | | | | | | | | | | | | | | | | | | | | | | | | | | | | | |
Residential mortgages | | $ | 181 | | | $ | 172 | | | $ | 208 | | | $ | 219 | | | $ | 204 | | | | | $ | 385 | | | $ | 366 | | | $ | 394 | | | $ | 427 | | | $ | 491 | |
Student | | | – | | | | – | | | | – | | | | – | | | | – | | | | | | 5 | | | | 7 | | | | 9 | | | | 12 | | | | 12 | |
Personal | | | 33 | | | | 37 | | | | 53 | | | | 54 | | | | 54 | | | | | | 37 | | | | 54 | | | | 77 | | | | 71 | | | | 98 | |
Total net impaired consumer loans | | | 214 | | | | 209 | | | | 261 | | | | 273 | | | | 258 | | | | | | 427 | | | | 427 | | | | 480 | | | | 510 | | | | 601 | |
Non-residential mortgages | | | 17 | | | | 29 | | | | 53 | | | | 77 | | | | 45 | | | | | | 20 | | | | 32 | | | | 54 | | | | 77 | | | | 46 | |
Financial institutions | | | 2 | | | | 2 | | | | – | | | | – | | | | 2 | | | | | | 2 | | | | 3 | | | | – | | | | 1 | | | | 2 | |
Retail, wholesale and business services | | | 76 | | | | 101 | | | | 114 | | | | 128 | | | | 144 | | | | | | 83 | | | | 112 | | | | 151 | | | | 160 | | | | 191 | |
Manufacturing – consumer and capital goods | | | 4 | | | | 2 | | | | 11 | | | | 17 | | | | 19 | | | | | | 6 | | | | 3 | | | | 11 | | | | 20 | | | | 28 | |
Real estate and construction | | | 71 | | | | 93 | | | | 117 | | | | 140 | | | | 229 | | | | | | 140 | | | | 184 | | | | 243 | | | | 246 | | | | 381 | |
Agriculture | | | – | | | | 2 | | | | 6 | | | | 9 | | | | 11 | | | | | | 1 | | | | 4 | | | | 9 | | | | 12 | | | | 21 | |
Resource-based industries | | | 1 | | | | 1 | | | | 1 | | | | 1 | | | | 2 | | | | | | 89 | | | | 3 | | | | 5 | | | | 31 | | | | 3 | |
Telecommunications, media and technology | | | – | | | | 5 | | | | 4 | | | | – | | | | – | | | | | | – | | | | 6 | | | | 5 | | | | 46 | | | | 21 | |
Transportation | | | – | | | | 8 | | | | 5 | | | | 7 | | | | 21 | | | | | | – | | | | 8 | | | | 41 | | | | 42 | | | | 21 | |
Utilities | | | – | | | | – | | | | – | | | | – | | | | – | | | | | | 4 | | | | 7 | | | | – | | | | – | | | | – | |
Other | | | – | | | | – | | | | 1 | | | | 1 | | | | – | | | | | | 1 | | | | 1 | | | | 1 | | | | 1 | | | | – | |
Total net impaired – business and government loans | | | 171 | | | | 243 | | | | 312 | | | | 380 | | | | 473 | | | | | | 346 | | | | 363 | | | | 520 | | | | 636 | | | | 714 | |
Total net impaired loans | | $ | 385 | | | $ | 452 | | | $ | 573 | | | $ | 653 | | | $ | 731 | | | | | $ | 773 | | | $ | 790 | | | $ | 1,000 | | | $ | 1,146 | | | $ | 1,315 | |
| (1) | Classification by country is based on domicile of debtor or customer. |
| (2) | Represents loans where repayment of principal or payment of interest is contractually in arrears between 90 and 180 days. |
| (3) | Comprises individual allowance, and collective allowance related to personal, scored small business, and mortgage impaired loans that are greater than 90 days delinquent. |
| | | | |
| CIBC2015 ANNUAL REPORT | | | 89 | |
|
Management’s discussion and analysis |
Deposits
| | | | | | | | | | | | | | | | | | | | | | | | | | | | | | | | | | | | |
| | | Average balance | | | Interest | | | Rate | |
| $ millions, for the year ended October 31 | | 2015 | | | 2014 | | | 2013 | | | 2015 | | | 2014 | | | 2013 | | | 2015 | | | 2014 | | | 2013 | |
Deposits in domestic bank offices (1) | | | | | | | | | | | | | | | | | | | | | | | | | | | | | | | | | | | | |
Payable on demand | | | | | | | | | | | | | | | | | | | | | | | | | | | | | | | | | | | | |
Personal | | $ | 9,252 | | | $ | 8,490 | | | $ | 7,938 | | | $ | 14 | | | $ | 15 | | | $ | 18 | | | | 0.15 | % | | | 0.18 | % | | | 0.23 | % |
Business and government | | | 33,735 | | | | 30,043 | | | | 26,834 | | | | 121 | | | | 107 | | | | 95 | | | | 0.36 | | | | 0.36 | | | | 0.35 | |
Bank | | | 2,083 | | | | 1,780 | | | | 1,328 | | | | 2 | | | | 6 | | | | 3 | | | | 0.10 | | | | 0.34 | | | | 0.23 | |
Payable after notice | | | | | | | | | | | | | | | | | | | | | | | | | | | | | | | | | | | | |
Personal | | | 80,328 | | | | 72,928 | | | | 68,320 | | | | 454 | | | | 461 | | | | 433 | | | | 0.57 | | | | 0.63 | | | | 0.63 | |
Business and government | | | 25,128 | | | | 21,606 | | | | 18,383 | | | | 243 | | | | 242 | | | | 199 | | | | 0.97 | | | | 1.12 | | | | 1.08 | |
Bank | | | 97 | | | | 19 | | | | 13 | | | | 1 | | | | – | | | | – | | | | 1.03 | | | | – | | | | – | |
Payable on a fixed date | | | | | | | | | | | | | | | | | | | | | | | | | | | | | | | | | | | | |
Personal | | | 38,996 | | | | 41,028 | | | | 39,379 | | | | 589 | | | | 673 | | | | 705 | | | | 1.51 | | | | 1.64 | | | | 1.79 | |
Business and government | | | 50,604 | | | | 50,060 | | | | 52,371 | | | | 749 | | | | 928 | | | | 1,029 | | | | 1.48 | | | | 1.85 | | | | 1.96 | |
Bank | | | 937 | | | | 427 | | | | 279 | | | | 5 | | | | 4 | | | | 3 | | | | 0.53 | | | | 0.94 | | | | 1.08 | |
Secured borrowings | | | 38,758 | | | | 43,525 | | | | 50,815 | | | | 581 | | | | 717 | | | | 989 | | | | 1.50 | | | | 1.65 | | | | 1.95 | |
Total domestic | | | 279,918 | | | | 269,906 | | | | 265,660 | | | | 2,759 | | | | 3,153 | | | | 3,474 | | | | 0.99 | | | | 1.17 | | | | 1.31 | |
Deposits in foreign bank offices | | | | | | | | | | | | | | | | | | | | | | | | | | | | | | | | | | | | |
Payable on demand | | | | | | | | | | | | | | | | | | | | | | | | | | | | | | | | | | | | |
Personal | | | 701 | | | | 567 | | | | 467 | | | | 3 | | | | 3 | | | | 3 | | | | 0.43 | | | | 0.53 | | | | 0.64 | |
Business and government | | | 3,801 | | | | 3,089 | | | | 2,709 | | | | 4 | | | | 3 | | | | 6 | | | | 0.11 | | | | 0.10 | | | | 0.22 | |
Bank | | | 6 | | | | 6 | | | | 43 | | | | – | | | | 1 | | | | – | | | | – | | | | 16.67 | | | | – | |
Payable after notice | | | | | | | | | | | | | | | | | | | | | | | | | | | | | | | | | | | | |
Personal | | | 2,369 | | | | 2,040 | | | | 1,911 | | | | 33 | | | | 38 | | | | 36 | | | | 1.39 | | | | 1.86 | | | | 1.88 | �� |
Business and government | | | 766 | | | | 673 | | | | 562 | | | | 1 | | | | 1 | | | | 1 | | | | 0.13 | | | | 0.15 | | | | 0.18 | |
Payable on a fixed date | | | | | | | | | | | | | | | | | | | | | | | | | | | | | | | | | | | | |
Personal | | | 1,499 | | | | 1,993 | | | | 2,111 | | | | 7 | | | | 10 | | | | 6 | | | | 0.47 | | | | 0.50 | | | | 0.28 | |
Business and government | | | 56,203 | | | | 38,164 | | | | 35,507 | | | | 152 | | | | 102 | | | | 125 | | | | 0.27 | | | | 0.27 | | | | 0.35 | |
Bank | | | 8,944 | | | | 5,610 | | | | 4,488 | | | | 30 | | | | 24 | | | | 26 | | | | 0.34 | | | | 0.43 | | | | 0.58 | |
Secured borrowings | | | 115 | | | | 458 | | | | 425 | | | | 1 | | | | 2 | | | | 2 | | | | 0.87 | | | | 0.44 | | | | 0.47 | |
Total foreign | | | 74,404 | | | | 52,600 | | | | 48,223 | | | | 231 | | | | 184 | | | | 205 | | | | 0.31 | | | | 0.35 | | | | 0.43 | |
Total deposits | | $ | 354,322 | | | $ | 322,506 | | | $ | 313,883 | | | $ | 2,990 | | | $ | 3,337 | | | $ | 3,679 | | | | 0.84 | % | | | 1.03 | % | | | 1.17 | % |
| (1) | Deposits by foreign depositors in our domestic bank offices amounted to $7.4 billion (2014: $6.0 billion; 2013: $4.5 billion). |
Short-term borrowings
| | | | | | | | | | | | |
| $ millions, as at or for the year ended October 31 | | 2015 | | | 2014 | | | 2013 | |
Amounts outstanding at end of year | | | | | | | | | | | | |
Obligations related to securities sold short | | $ | 9,806 | | | $ | 12,999 | | | $ | 13,327 | |
Obligations related to securities lent or sold under repurchase agreements | | | 10,343 | | | | 10,765 | | | | 6,986 | |
Total short-term borrowings | | $ | 20,149 | | | $ | 23,764 | | | $ | 20,313 | |
Obligations related to securities sold short | | | | | | | | | | | | |
Average balance | | $ | 11,445 | | | $ | 13,719 | | | $ | 13,247 | |
Maximum month-end balance | | | 13,248 | | | | 14,833 | | | | 14,407 | |
Average interest rate | | | 2.01 | % | | | 2.38 | % | | | 2.52 | % |
Obligations related to securities lent or sold under repurchase agreements | | | | | | | | | | | | |
Average balance | | $ | 13,212 | | | $ | 12,713 | | | $ | 10,242 | |
Maximum month-end balance | | | 14,766 | | | | 14,652 | | | | 12,030 | |
Average interest rate | | | 0.83 | % | | | 1.00 | % | | | 1.00 | % |
Fees paid to the shareholders’ auditors
| | | | | | | | | | | | |
| $ millions, for the year ended October 31 | | 2015 | | | 2014 | | | 2013 | |
Audit fees (1) | | $ | 15.9 | | | $ | 14.2 | | | $ | 13.4 | |
Audit-related fees (2) | | | 3.2 | | | | 2.0 | | | | 3.2 | |
Tax fees (3) | | | 0.4 | | | | 0.1 | | | | 0.5 | |
All other fees (4) | | | 0.3 | | | | 0.1 | | | | 0.4 | |
Total | | $ | 19.8 | | | $ | 16.4 | | | $ | 17.5 | |
| (1) | For the audit of CIBC’s annual financial statements and services normally provided by the principal auditor in connection with CIBC’s statutory and regulatory filings. Audit fees also include the audit of internal controls over financial reporting under standards of the Public Company Accounting Oversight Board (United States). |
| (2) | For the assurance and related services that are reasonably related to the performance of the audit or review of CIBC’s financial statements, including various agreed upon procedures and translation of financial reports. |
| (3) | For tax compliance services. |
| (4) | Includes fees for non-audit services. |
| | |
| 90 | | CIBC2015 ANNUAL REPORT |