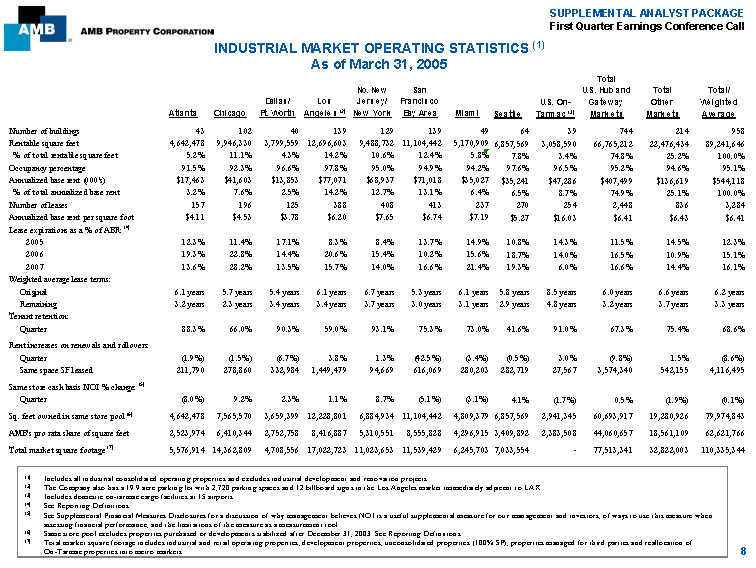
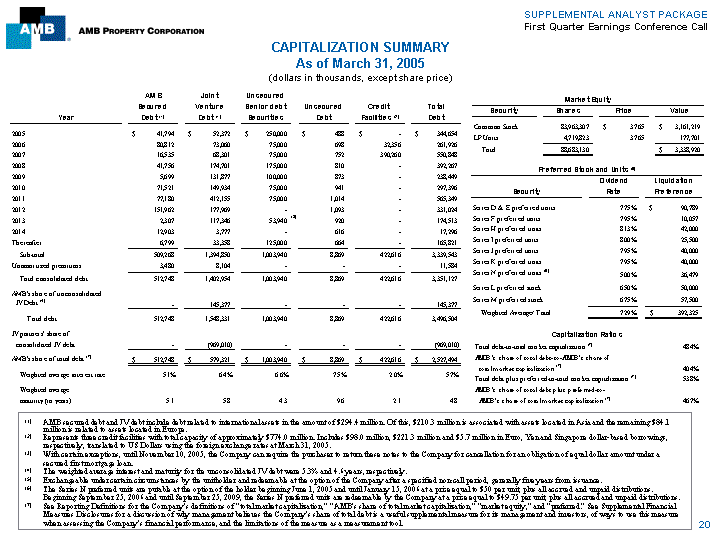
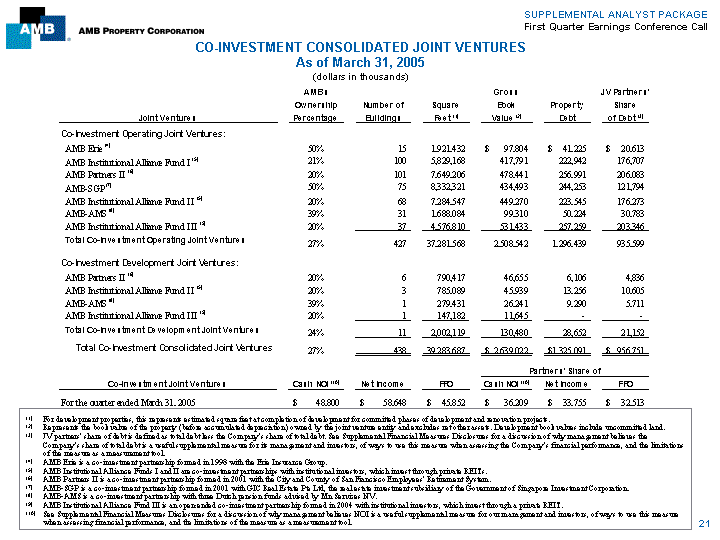
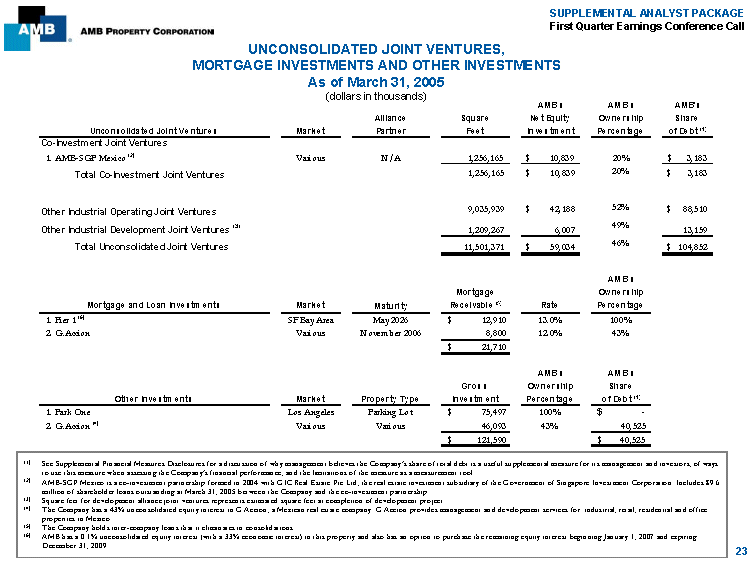
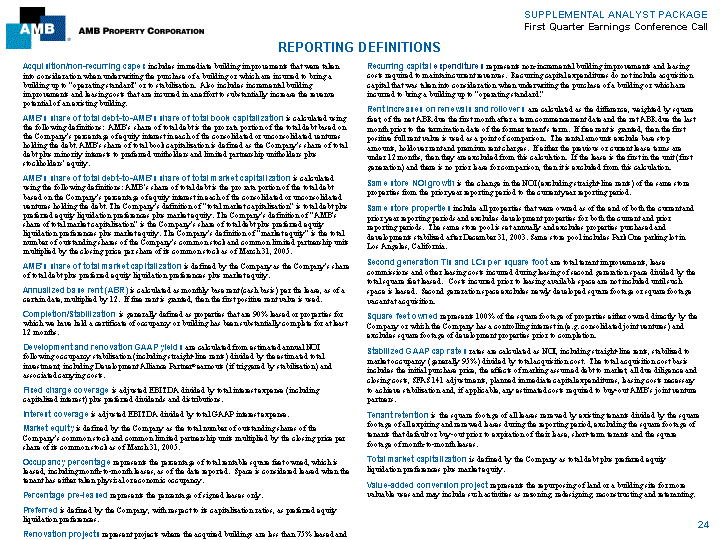
| SUPPLEMENTAL ANALYST PACKAGE First Quarter Earnings Conference Call INDUSTRIAL MARKET OPERATING STATISTICS (1) As of March 31, 2005 Total No. NewSanU.S. Hub andTotalTotal/ Dallas/LosJersey/ FranciscoU.S. On-GatewayOtherWeighted Atlanta Chicago Ft. Worth Angeles(2)New York Bay Area Miami Seattle Tarmac(3)MarketsMarketsAverage Number of buildings4310240139129139496439744214958 Rentable square feet4,642,478 9,946,330 3,799,559 12,696,603 9,488,732 11,104,442 5,170,909 6,857,569 3,058,590 66,765,212 22,476,434 89,241,646 % of total rentable square feet5.2%11.1%4.3%14.2%10.6%12.4%5.8%7.8%3.4%74.8%25.2%100.0% Occupancy percentage91.5%92.3%96.6%97.8%95.0%94.9%94.2% 97.6%96.5%95.2%94.6%95.1% Annualized base rent (000’s)$17,463 $41,603 $13,853 $77,071 $68,937 $71,018 $35,027 $35,241 $47,286 $407,499 $136,619 $544,118 % of total ann ualized base rent3.2%7.6%2.5%14.2%12.7%13.1%6.4%6.5%8.7%74.9%25.1%100.0% Number of leases 157 196 125 388 408 413 237 270 254 2,448 836 3,284 Annualized base rent per square foot$4.11 $4.53 $3.78 $6.20 $7.65 $6.74 $7.19 $5.27 $16.03 $6.41 $6.43 $6.41 Lease expirations as a % of ABR: (4) 200512.3%11.4%17.1%8.3%8.4%13.7%14.9% 10.8%14.3%11.5%14.5%12.3% 200619.3%22.8%14.4%20.6%15.4%10.2%15.6% 18.7%14.0%16.5%10.9%15.1% 200713.6%28.2%13.5%15.7%14.0%16.6%21.4% 19.3%6.0%16.6%14.4%16.1% Weighted average lease t erms: Original6.1 years 5.7 years 5.4 years 6.1 years 6.7 years 5.3 years 6.1 years 5.8 years 8.5 years6.0 years6.6 years6.2 years Remaining3.2 years 2.3 years 3.4 years 3.4 years 3.7 years 3.0 years 3.1 years 2.9 years 4.8 years3.2 years3.7 years3.3 years Tenant retention: Quarter88.3%66.0%90.3%59.0%93.1%75.3%73.0% 41. 6%91.0%67.3%75.4%68.6% Rent increases on renewals and rollovers: Quarter(1.9%)(1.5%)(6.7%)3.8% 1.3%(42.5%)(3.4%) (0.5%)3.0% (9.8%)1.5% (8.6%) Same space SF leased211,790278,860332,984 1,449,47994,669616,069280,203 282,71927,5673,574,340542,1554,116,495 Same store cash basis NOI % change: (5) Quarter(8.0%)9.2%2.3%1.1%8.7%(5.1%)(3.1%)4.1%(1.7%)0.5%(1.9%)(0.1%) Sq. feet owned in same store pool (6) 4,642,478 7,565,570 3,659,399 12,228,801 6,884,934 11,104,442 4,809,379 6,857,569 2,941,345 60,693,917 19,280,926 79,974,843 AMB’s pro rata share of square feet2,523,974 6,410,344 2,752,758 8,416,887 5,310,551 8,555,828 4,296,915 3,409,892 2,383,508 44,060,657 18,561,109 62,621,766 Total market square footage (7) 5,576,914 14,362,809 4,708,556 17,022,723 11,023,653 11,539,429 6,245,703 7,033,554 — 77,513,341 32,822,003 110,335,344 (1) Includes all industrial consolidated operating properties and excludes industrial development and renovation projects. (2) The Company also has a 19.9 acre parking lot with 2,720 parking spaces and 12 billboard signs in the Los Angeles market immediately adjacent to LAX. (3) Includes domestic on-tarmac cargo facilities at 15 airports. (4) See Reporting Definitions. (5) See Supplemental Financial Measures Disclosures for a discussion of why management believes NOI is a useful supplemental measure for our management and investors, of ways to use this measure when assessing financial performance, and the limitations of the measure as a measurement tool. (6) Same store pool excludes properties purchased or developments stabilized after December 31, 2003. See Reporting Definitions. (7) Total market square footage includes industrial and retail operating properties, development properties, unconsolidated properties (100% SF), properties managed for third parties and reallocation of On-Tarmac properties into metro markets.8 |
