Exhibit 99.1
1 March 2019
2 ● Certain statements and other information included in this presentation may constitute "forward - looking statements" within the meaning of Section 27 A of the Securities Act of 1933 (the "Securities Act"), Section 21 E of the Securities Exchange Act of 1934 and the United States Private Securities Litigation Reform Act of 1995 . Words such as "will," "expects," "believes" and similar expressions are sometimes used to identify these forward - looking statements (although not all forward - looking statements include such words) . These forward - looking statements, which may include, without limitation, projections regarding our future performance and financial condition, are made on the basis of management's current views and assumptions with respect to future events . Any forward - looking statement is not a guarantee of future performance and actual results could differ materially from those reflected in the forward - looking statement . ● The statements and information in the presentation speak only as of the date they are being made, and we undertake no obligation to update or revise any forward - looking statements, whether as a result of new information, future events or otherwise . We operate in a changing environment . New risks emerge from time to time and it is not possible for us to predict all risks that may affect us . For more information regarding these risks and uncertainties as well as certain additional risks that we face, you should refer to the Risk Factors detailed in Item 3 . D of our Annual Report on Form 20 - F for the year ended December 31 , 2016 and subsequent reports and registration statements filed or furnished by our company from time to time with the U . S . Securities and Exchange Commission . ● This presentation has been provided for informational purposes only and does not constitute an offer to sell, or a solicitation of an offer to buy, any securities . The offering of any securities that may be made by our company in the aftermath of this presentation will be made in Israel only and not to U . S . persons (as defined in Rule 902 (k) under the Securities Act), in an overseas directed offering (as defined in Rule 903 (b)(i)(ii) under the Securities Act), and will be intended to be exempt from registration under the Securities Act pursuant to the exemption provided by Regulation S thereunder . The sale of any such securities will not be registered under the Securities Act, and any such securities may not be offered or sold in the United States and/or to U . S . persons without registration under the Securities Act or an applicable exemption from the registration requirements of the Securities Act . Safe Harbor Statement
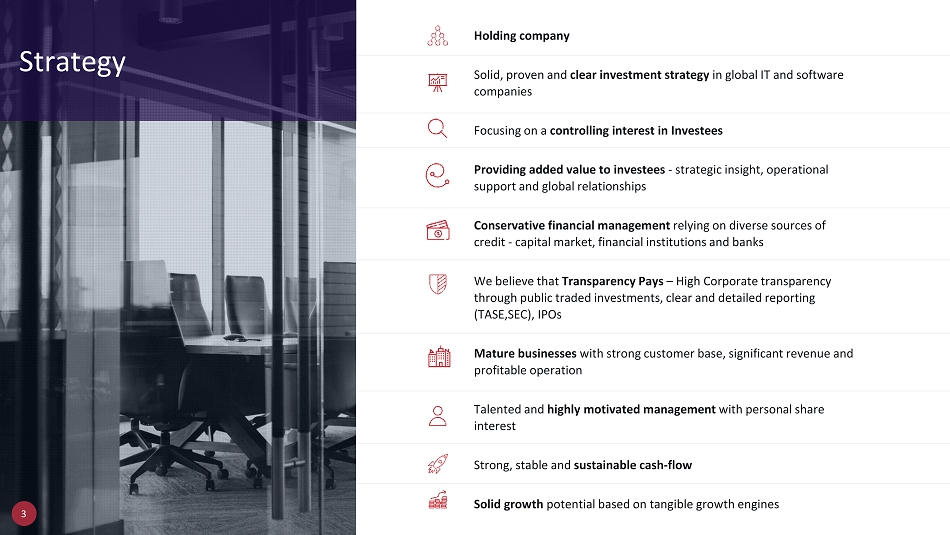
3 H olding company Solid, proven and clear investment strategy in global IT and software companies Focusing on a controlling interest in Investees Providing added value to investees - strategic insight, operational support and global relationships Conservative financial management relying on diverse sources of credit - capital market, financial institutions and banks We believe that Transparency Pays – High Corporate transparency through public traded investments, clear and detailed reporting (TASE,SEC), IPOs Mature businesses with strong customer base, significant revenue and profitable operation Talented and highly motivated management with personal share interest Strong, stable and sustainable cash - flow Solid growth potential based on tangible growth engines Strategy
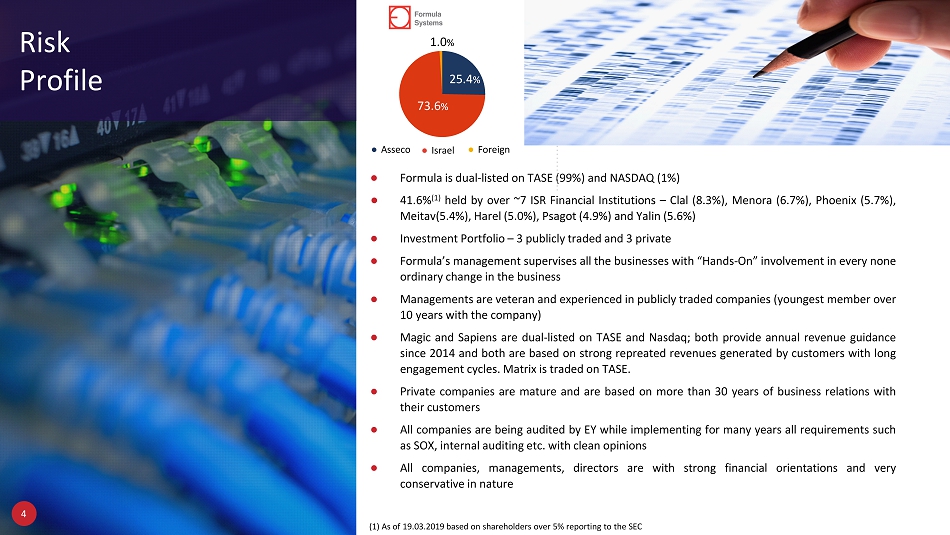
4 ● Formula is dual - listed on TASE (99%) and NASDAQ (1%) ● 41 . 6 % ( 1 ) held by over ~ 7 ISR Financial Institutions – Clal ( 8 . 3 % ), Menora ( 6 . 7 % ), Phoenix ( 5 . 7 % ), Meitav( 5 . 4 % ), Harel ( 5 . 0 % ), Psagot ( 4 . 9 % ) and Yalin ( 5 . 6 % ) ● Investment Portfolio – 3 publicly traded and 3 private ● Formula’s management supervises all the businesses with “Hands - On” involvement in every none ordinary change in the business ● Managements are veteran and experienced in publicly traded companies (youngest member over 10 years with the company) ● Magic and Sapiens are dual - listed on TASE and Nasdaq ; both provide annual revenue guidance since 2014 and both are based on strong repreated revenues generated by customers with long engagement cycles . Matrix is traded on TASE . ● Private companies are mature and are based on more than 30 years of business relations with their customers ● All companies are being audited by EY while implementing for many years all requirements such as SOX, internal auditing etc . with clean opinions ● All companies, managements, directors are with strong financial orientations and very conservative in nature Risk Profile 1.0 % ● Asseco ● Israel ● Foreign ϳϯ .6 % 25.4 % (1) As of 19.03.2019 based on shareholders over 5% reporting to the SEC
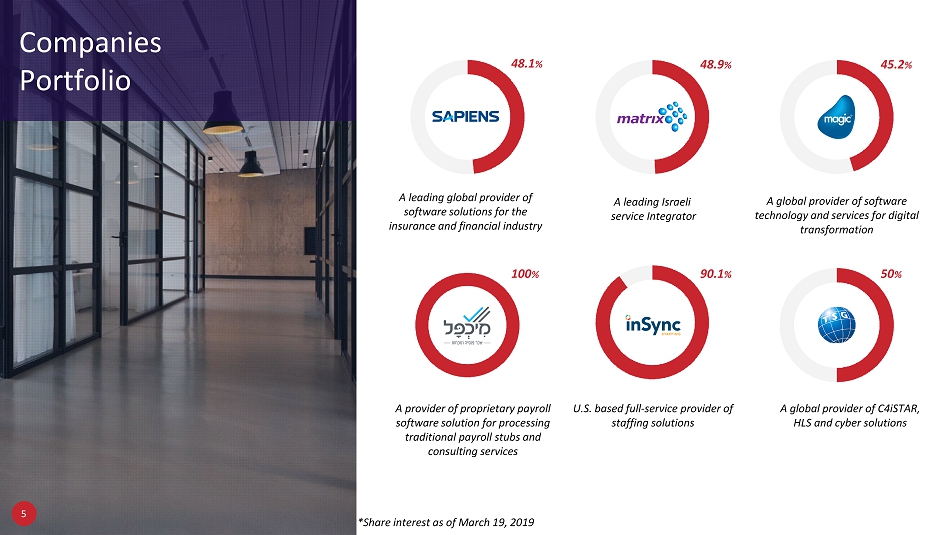
A leading Israeli service Integrator A leading global provider of software solutions for the insurance and financial industry A global provider of software technology and services for digital transformation A provider of proprietary payroll software solution for processing traditional payroll stubs and consulting services U.S. based full - service provider of staffing solutions A global provider of C 4 iSTAR, HLS and cyber solutions *Share interest as of March 19, 2019 48.1 % 48.9 % 45.2 % 100 % 90.1 % 50 % Companies Portfolio 5
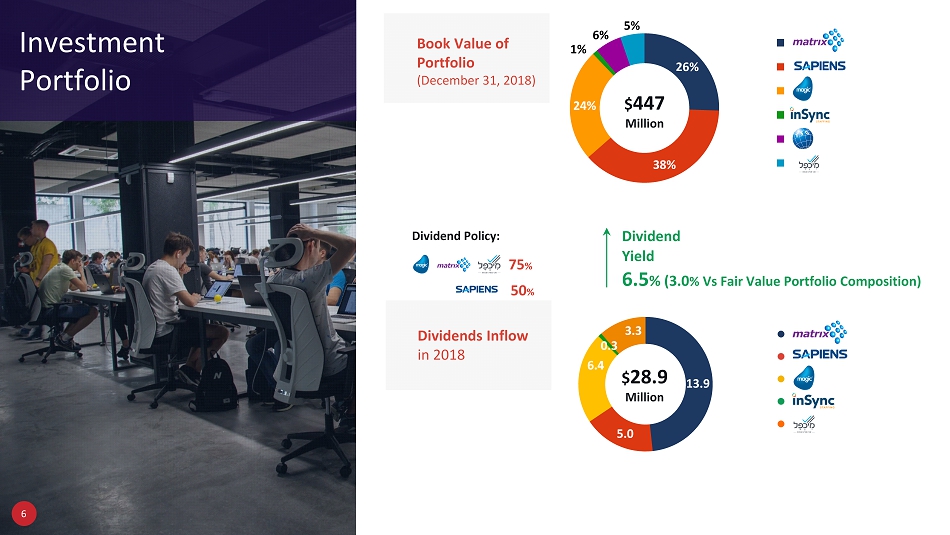
Dividend Yield 6.5 % ( 3.0 % Vs Fair Value Portfolio Composition) 6 Book Value of Portfolio (December 31, 2018) $ 447 Million 35 % 24 % 22 % 9 % $ 28.9 Million 14 5 7 3 1 Investment Portfolio Dividends Inflow in 2018 ● ● ● ● ● 75 % Dividend Policy: 50 % 1.4 6.4 0.3 13.9 5.0 3.3 26% 38 % 24% 1% 6% 5%

Private Companies Matrix $114,133 $386,510 Sapiens $169,867 $340,318 Magic $ 108,829 $ 186,957 Total Traded $392,829 $913,785 Michpal $23,485 $23,485 TSG $ 25,625 $25,625 Inysnc $ 4 , 946 $4,946 Total Private $54,056 $54,056 Total Portfolio $446,885 $967,841 Other assets $4,203 $4,203 $451,088 $972,044 Gross Debt ($115,129) ($115,129) Cash $ ϯ 1,411 $ ϯ 1,411 Net Debt ($83,718) ($83,718) Net Assets $367,370 $888,326 Equity per share $24.02 $58.08 Share price N/A $43.68 LTV 18.6 % 8.6 % Book Value December 31, 2018 Traded Portfolio 7 39 % 34 % 2 % 3 % 1 % $ 972 Million Book Value (December 31, 2018) $ 451 Million Fair Value Composition (March 19, 2019) $ 521 Million ( 1 ) Quoted prices in TASE as of March 19 , 2019 ( 2 ) Privately held companies are conservatively presented at book value as of December 31 , 2018 ( 3 ) Presented as of December 31 , 2018 ( 4 ) Based on outstanding ordinary shares as of March 19 , 2019 : 15,294,267 (as of December 31 , 2018 : 14,748,782 ) (3) (3) Fair Value March 19 , 2019 (2) (1) (3) 35 % 40 % 19 % (4) ( 1 )
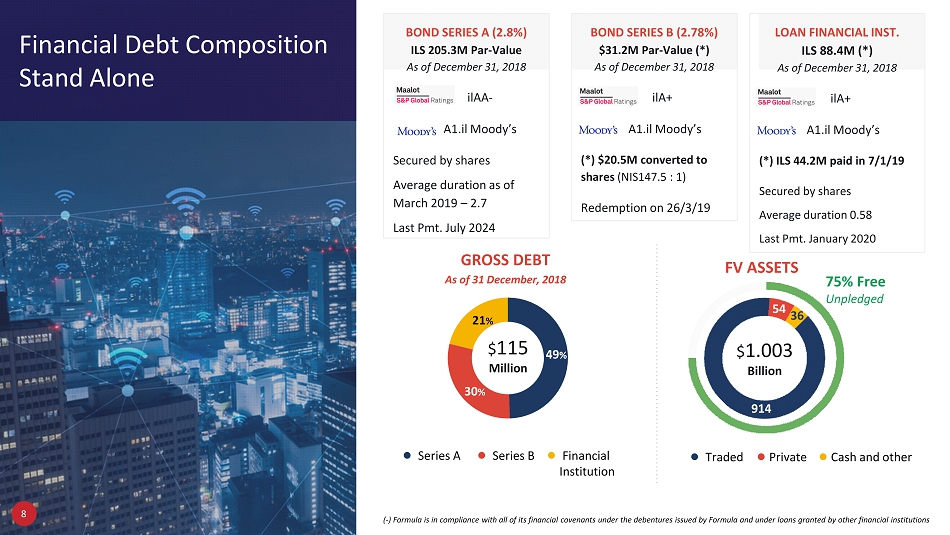
BOND SERIES A ( 2.8 %) ILS 205.3 M Par - Value As of December 31 , 2018 ilAA - A 1 .il Moody ’ s Secured by shares Average duration as of March 2019 – 2.7 Last Pmt. July 2024 8 Financial Debt C omposition Stand Alone BOND SERIES B (2.78 %) $31.2M Par - Value (*) As of December 31, 2018 ilA+ A1.il Moody’s (*) $20.5M converted to shares (NIS 147.5 : 1 ) Redemption on 26/3/19 LOAN FINANCIAL INST. ILS 88.4 M (*) As of December 31 , 2018 ilA+ A 1 .il Moody ’ s (*) ILS 44.2 M paid in 7 / 1 / 19 Secured by shares Average duration 0.58 Last Pmt. January 2020 ( - ) Formula is in compliance with all of its financial covenants under the debentures issued by Formula and under loans granted by other fin ancial institutions 49 % $ 115 Million 30 % 21 % $ 1.003 Billion ● Series A ● Series B ● Financial Institution ● Traded ● Private ● Cash and other 75% Free Unpledged GROSS DEBT As of 31 December, 2018 FV ASSETS 914 54 36
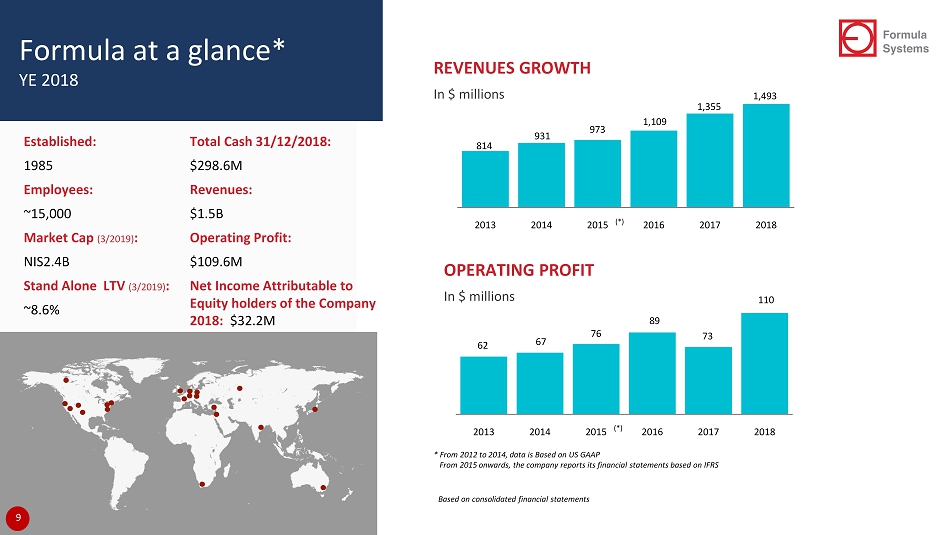
OPERATING PROFIT In $ millions Formula at a glance* YE 2018 Based on consolidated financial statements Established: 1985 Employees: ~15,000 Market Cap (3/2019) : NIS2.4B Stand Alone LTV (3/2019) : ~8.6% REVENUES GROWTH In $ millions * From 2012 to 2014 , data is Based on US GAAP From 2015 onwards, the company reports its financial statements based on IFRS Total Cash 31/12/2018: $298.6M Revenues: $1.5B Operating Profit: $ 109.6M Net Income Attributable to Equity holders of the Company 2018: $32.2M (*) (*) 9 814 931 973 1,109 1,355 1,493 2013 2014 2015 2016 2017 2018 62 67 76 89 73 110 2013 2014 2015 2016 2017 2018
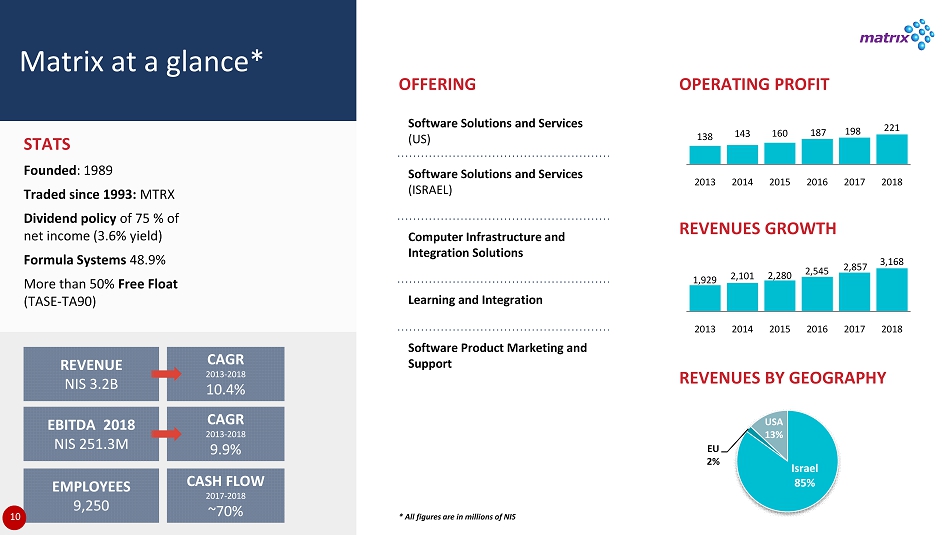
Matrix at a glance* * All figures are in millions of NIS STATS Founded : 1989 Traded since 1993 : MTRX Dividend policy of 75 % of net income ( ϯ . ϲ % yield) Formula Systems 48.9 % More than 50 % Free Float (TASE - TA 90 ) OFFERING REVENUE NIS ϯ . Ϯ B CAGR 2013 - 2018 10.4% EBITDA 201 ϴ NIS 25 ϭ .3 M CAGR 2013 - 2018 9.9 % EMPLOYEES ϵ , ϮϱϬ CASH FLOW 2017 - 2018 ~70% OPERATING PROFIT REVENUES GROWTH REVENUES BY GEOGRAPHY Software Solutions and Services (US) Software Solutions and Services (ISRAEL) Computer Infrastructure and Integration Solutions Learning and Integration Software Product Marketing and Support 1,929 2,101 2,280 2,545 2,857 3,168 2013 2014 2015 2016 2017 2018 138 143 160 187 198 221 2013 2014 2015 2016 2017 2018 Israel 85% EU 2 % USA 13% 10
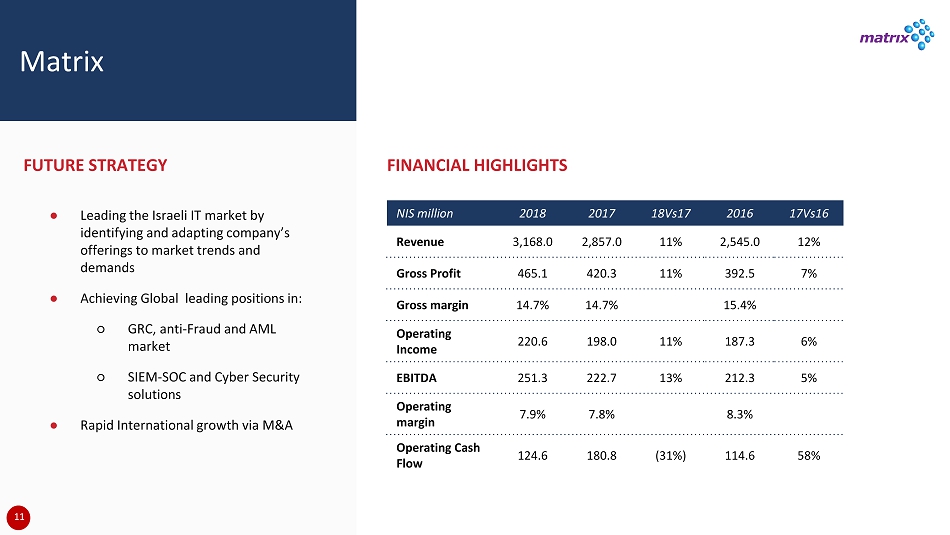
Matrix NIS million 2018 2017 18Vs17 2016 17Vs16 Revenue 3,168.0 2,857.0 11% 2,545.0 12% Gross Profit 465.1 420.3 11% 392.5 7% Gross margin 14.7% 14.7% 15.4 % Operating Income 220.6 198.0 11% 187.3 6% EBITDA 251.3 222.7 13% 212.3 5% Operating margin 7.9% 7.8% 8.3 % Operating Cash Flow 124.6 180.8 (31%) 114.6 58% FINANCIAL HIGHLIGHTS FUTURE STRATEGY ● Leading the Israeli IT market by identifying and adapting company ’ s offerings to market trends and demands ● Achieving Global leading positions in: ○ GRC, anti - Fraud and AML market ○ SIEM - SOC and Cyber Security solutions ● Rapid International growth via M&A 11
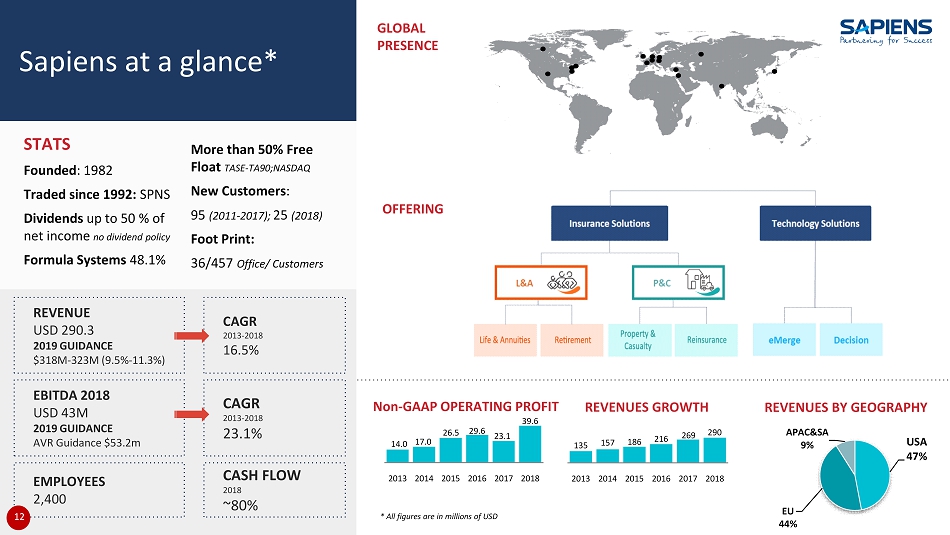
Sapiens at a glance* * All figures are in millions of USD STATS Founded : 1982 Traded since 1992 : SPNS Dividends up to 50 % of net income no dividend policy Formula Systems 48.1 % OFFERING REVENUE USD 290.3 2019 GUIDANCE $ 318 M - 323 M ( 9.5 % - 11.3 %) CAGR 2013 - 2018 16.5 % EBITDA 2018 USD 43M 2019 GUIDANCE AVR Guidance $53.2m CAGR 201 ϯ - 2018 23.1 % EMPLOYEES 2, 4 00 CASH FLOW 2018 ~80% Non - GAAP OPERATING PROFIT REVENUES GROWTH REVENUES BY GEOGRAPHY More than 50 % Free Float TASE - TA 90 ;NASDAQ New Customers : 95 ( 2011 - 2017 ); Ϯϱ ( 2018 ) Foot Print: 36 / 457 Office/ Customers GLOBAL PRESENCE 135 157 186 216 269 290 2013 2014 2015 2016 2017 2018 14.0 17.0 26.5 29.6 23.1 39.6 2013 2014 2015 2016 2017 2018 USA 47% EU 44 % APAC&SA 9 % 12
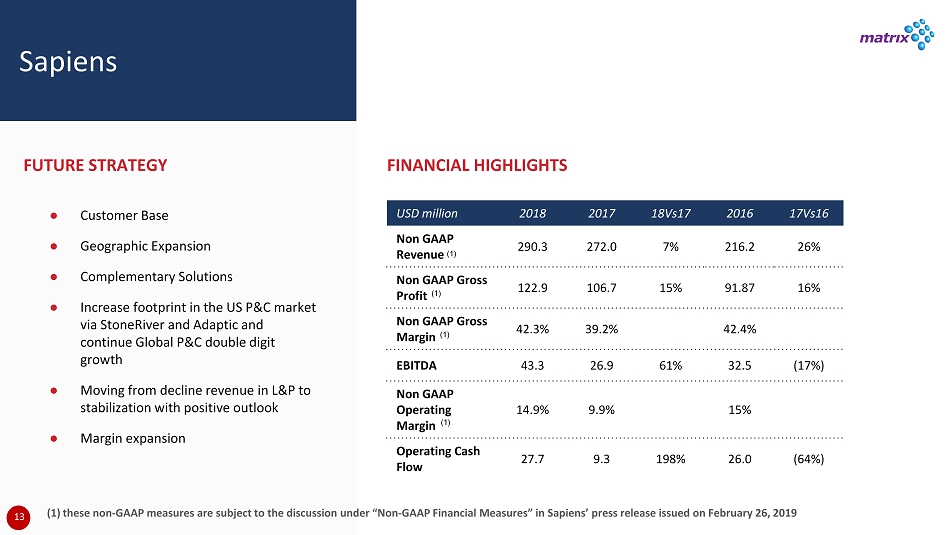
Sapiens USD million 2018 2017 18Vs17 2016 17Vs16 Non GAAP Revenue 290.3 272.0 7% 216.2 26% Non GAAP Gross Profit 122.9 106.7 15% 91.87 16% Non GAAP Gross Margin 42.3% 39.2% 42.4% EBITDA 43.3 26.9 61% 32.5 (17%) Non GAAP Operating Margin 14.9% 9.9% 15 % Operating Cash Flow 27.7 9.3 198% 26.0 ( 64%) FINANCIAL HIGHLIGHTS FUTURE STRATEGY ● Customer Base ● Geographic Expansion ● Complementary Solutions ● Increase footprint in the US P&C market via StoneRiver and Adaptic and continue Global P&C double digit growth ● Moving from decline revenue in L&P to stabilization with positive outlook ● Margin expansion 13 ( 1 ) these non - GAAP measures are subject to the discussion under “ Non - GAAP Financial Measures ” in Sapiens ’ press release issued on February 26 , 2019 (1) (1) (1) ( 1 )

Magic at a glance * STATS Founded : 1983 Traded since 1991 : MGIC Dividend policy of ϳϱ % of net income (~ 3 . 6 % yield) OUR BUSINESS NON - GAAP OPERATING PROFIT Formula Systems 45.2% More than 50% Free Float TASE - TA90; NASDAQ Foot Print: 24/’000 Office/ Customers Repeated: 80% ENTERPRISE APPLICATION DEVELOPMENT IT & PROFESSIONAL SERVICES INTEGRATION PLATFORMS Robust application development and integration platforms that enable enterprises and ISVs to go digital REVENUES GROWTH REVENUES BY GEOGRAPHY * All figures are in millions of USD REVENUE USD 284.4 2019 GUIDANCE $313M - 319M (10% - 12%) CAGR 2013 - 2018 14.4% EBITDA 2018 USD 40.7 M CAGR 201 ϯ - 2018 11.7 % EMPLOYEES 2, 2 00 CASH FLOW 2017 - 2018 ~ 70 % 145.0 164.3 176.0 201.6 258.1 294.4 2013 2014 2015 2016 2017 2018 22.7 25.9 27.2 28.2 35.1 39.5 2013 2014 2015 2016 2017 2018 ISR 37 % EU 10 % Japan 3% USA 48 % ROW 2 % 14
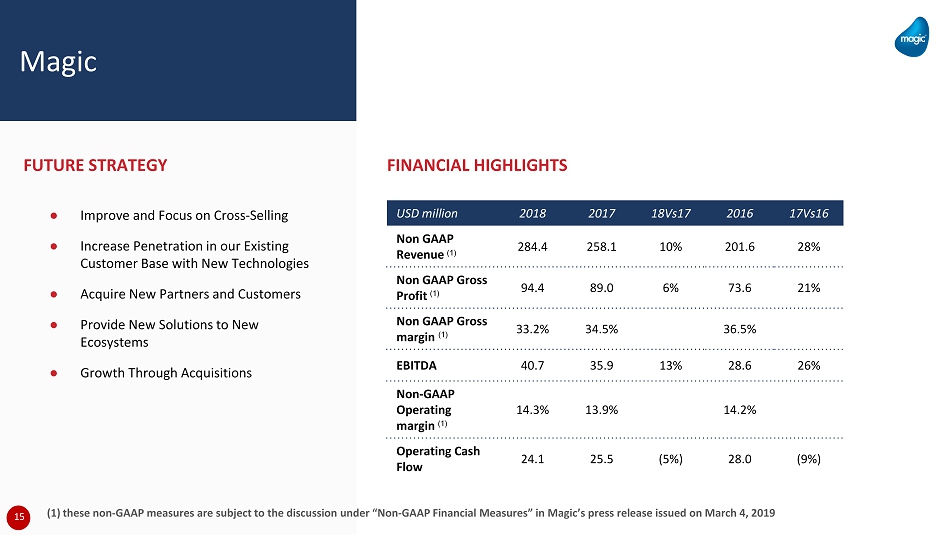
Magic USD million 2018 2017 18Vs17 2016 17Vs16 Non GAAP Revenue 284.4 258.1 10% 201.6 28% Non GAAP Gross Profit 94.4 89.0 6% 73.6 21% Non GAAP Gross margin 33.2% 34.5% 36.5% EBITDA 40.7 35.9 13% 28.6 26% Non - GAAP Operating margin 14.3% 13.9% 14.2 % Operating Cash Flow 24.1 25.5 (5%) 28.0 (9%) FINANCIAL HIGHLIGHTS FUTURE STRATEGY ● Improve and Focus on Cross - Selling ● Increase Penetration in our Existing Customer Base with New Technologies ● Acquire New Partners and Customers ● Provide New Solutions to New Ecosystems ● Growth Through Acquisitions 15 ( 1 ) these non - GAAP measures are subject to the discussion under “ Non - GAAP Financial Measures ” in Magic ’ s press release issued on March 4 , 2019 (1) (1) (1) ( 1 )
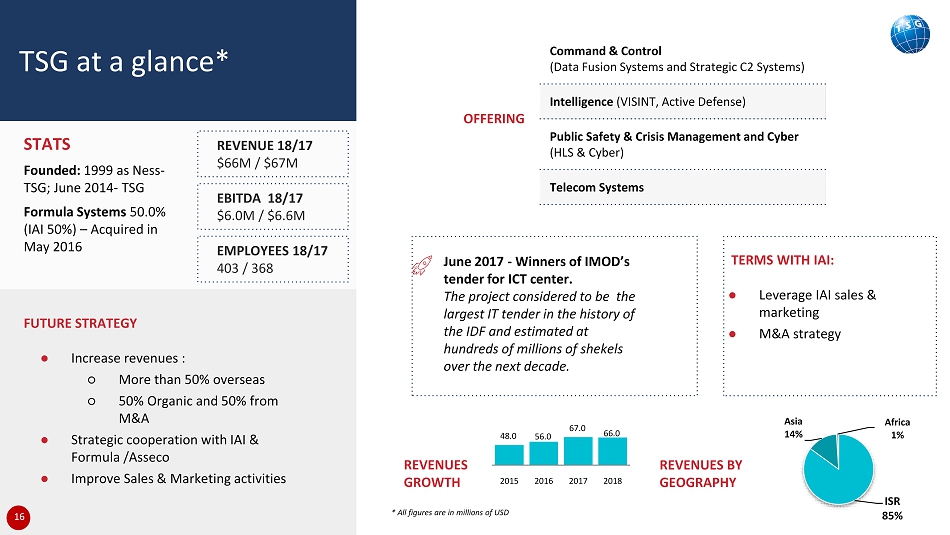
TSG at a glance* STATS Founded: 1999 as Ness - TSG; June 2014 - TSG Formula Systems 50.0% (IAI 50%) – Acquired in May 2016 OFFERING REVENUE 18/17 $ 66M / $67M EBITDA 18 / 17 $ 6.0 M / $ 6.6 M EMPLOYEES 18/17 403 / 368 REVENUES GROWTH REVENUES BY GEOGRAPHY Command & Control (Data Fusion Systems and Strategic C2 Systems) Intelligence (VISINT, Active Defense) Public Safety & Crisis Management and Cyber (HLS & Cyber) Telecom Systems FUTURE STRATEGY ● Increase revenues : ○ More than 50 % overseas ○ 50 % Organic and 50 % from M&A ● Strategic cooperation with IAI & Formula /Asseco ● Improve Sales & Marketing activities June 2017 - Winners of IMOD’s tender for ICT center. The project considered to be the largest IT tender in the history of the IDF and estimated at hundreds of millions of shekels over the next decade. TERMS WITH IAI: ● Leverage IAI sales & marketing ● M&A strategy * All figures are in millions of USD 48.0 56.0 67.0 66.0 2015 2016 2017 2018 ISR 85 % Asia 14% Africa 1% 16
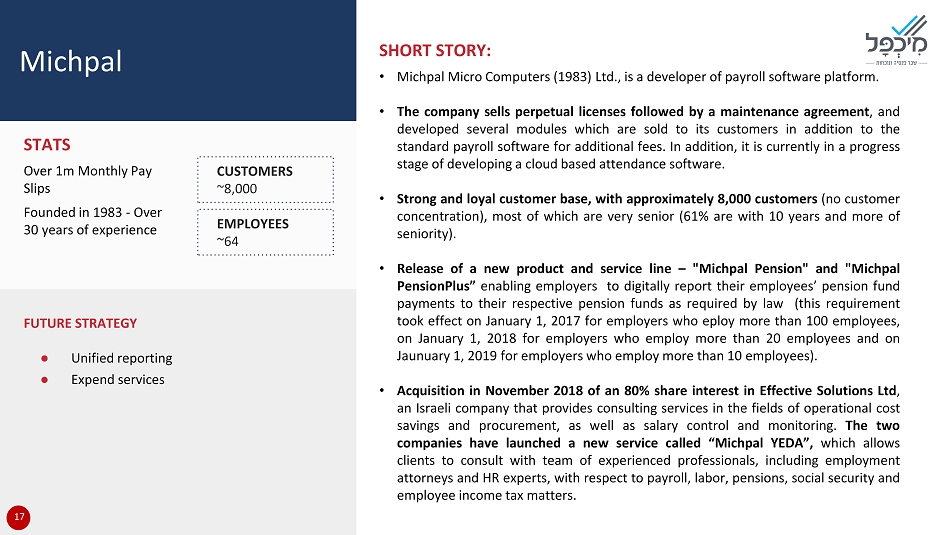
Michpal STATS Over 1m Monthly Pay Slips Founded in 1983 - Over 30 years of experience CUSTOMERS ~8,000 EMPLOYEES ~64 FUTURE STRATEGY ● Unified reporting ● Expend services SHORT STORY: • Michpal Micro Computers ( 1983 ) Ltd . , is a developer of payroll software platform . • The company sells perpetual licenses followed by a maintenance agreement , and developed several modules which are sold to its customers in addition to the standard payroll software for additional fees . In addition, it is currently in a progress stage of developing a cloud based attendance software . • Strong and loyal customer base, with approximately 8 , 000 customers (no customer concentration), most of which are very senior ( 61 % are with 10 years and more of seniority) . • Release of a new product and service line – "Michpal Pension" and "Michpal PensionPlus” enabling employers to digitally report their employees’ pension fund payments to their respective pension funds as required by law (this requirement took effect on January 1 , 2017 for employers who eploy more than 100 employees, on January 1 , 2018 for employers who employ more than 20 employees and on Jaunuary 1 , 2019 for employers who employ more than 10 employees ) . • Acquisition in November 2018 of an 80 % share interest in Effective Solutions Ltd , an Israeli company that provides consulting services in the fields of operational cost savings and procurement, as well as salary control and monitoring . The two companies have launched a new service called “Michpal YEDA”, which allows clients to consult with team of experienced professionals, including employment attorneys and HR experts, with respect to payroll, labor, pensions, social security and employee income tax matters . 17
inSync FUTURE STRATEGY Cross - selling SHORT STORY: InSync is a U.S. based full - service provider of consulting and staffing solutions for IT, engineering and other professional staff (i.e. accounting and finance, administrative, customer service, healthcare, human resources, manufacturing, marketing/sales, and operations). InSync currently supports more than 50 VMS program customers with employees in over 40 states. 18
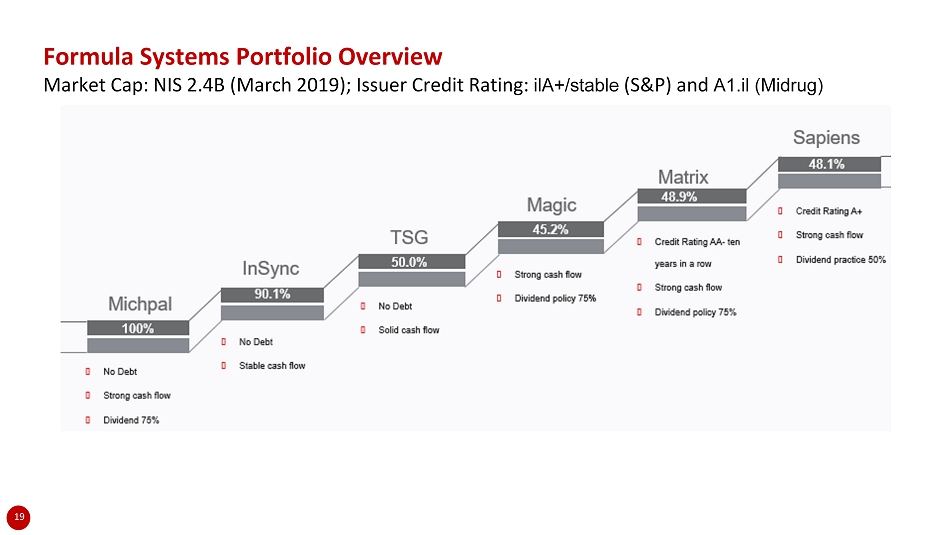
Formula Systems Portfolio Overview Market Cap: NIS 2.4B (March 2019); Issuer Credit Rating: ilA +/stable (S&P) and A1.il ( Midrug ) 19
20 Thank You! 20