UNITED STATES
SECURITIES AND EXCHANGE COMMISSION
WASHINGTON, D.C. 20549
☒ ANNUAL REPORT PURSUANT TO SECTION 13 OR 15(d) OF THE SECURITIES EXCHANGE ACT OF 1934
For the fiscal year ended December 31, 2024
or
☐ TRANSITION REPORT PURSUANT TO SECTION 13 OR 15(d) OF THE SECURITIES EXCHANGE ACT OF 1934
For the transition period from __________ to __________
Commission File Number 000-29480
| | |
|
| HERITAGE FINANCIAL CORPORATION |
| (Exact name of registrant as specified in its charter) |
|
| | | | | | | | | | | | | | |
| Washington | | 91-1857900 |
(State or other jurisdiction of
incorporation or organization) | | (I.R.S. Employer
Identification No.) |
| | | |
| 201 Fifth Avenue SW, | Olympia | WA | | 98501 |
| (Address of principal executive offices) | | (Zip Code) |
(360) 943-1500
(Registrant’s telephone number, including area code)
Securities registered pursuant to Section 12(b) of the Act:
| | | | | | | | |
| Title of each class | Trading Symbol(s) | Name of each exchange on which registered |
| Common stock, no par value | HFWA | Nasdaq Stock Market LLC |
Securities registered pursuant to Section 12(g) of the Act:
None
Indicate by check mark if the registrant is a well-known seasoned issuer, as defined in Rule 405 of the Securities Act.
Yes ☒ No ☐
Indicate by check mark if the registrant is not required to file reports pursuant to Section 13 or Section 15(d) of the Act.
Yes ☐ No ☒
Indicate by check mark whether the registrant (1) has filed all reports required to be filed by Section 13 or 15(d) of the Securities Exchange Act of 1934 during the preceding 12 months (or for such shorter period that the registrant was required to file such reports), and (2) has been subject to such filing requirements for the past 90 days.
Yes ☒ No ☐
Indicate by check mark whether the registrant has submitted electronically every Interactive Data File required to be submitted pursuant to Rule 405 of Regulation S-T (§232.405 of this chapter) during the preceding 12 months (or for such shorter period that the registrant was required to submit such files).
Yes ☒ No ☐
Indicate by check mark whether the registrant is a large accelerated filer, an accelerated filer, a non-accelerated filer, smaller reporting company, or an emerging growth company. See the definitions of "large accelerated filer", "accelerated filer", "smaller reporting company," and "emerging growth company" in Rule 12b-2 of the Exchange Act
| | | | | | | | | | | |
| Large accelerated filer | ☐ | Accelerated filer | ☒ |
| Non-accelerated filer | ☐ | Smaller reporting company | ☐ |
| | Emerging growth company | ☐ |
If an emerging growth company, indicate by check mark if the registrant has elected not to use the extended transition period for complying with any new or revised financial accounting standards pursuant to Section 13(a) of the Exchange Act. ☐
Indicate by check mark whether the registrant has filed a report on and attestation to its management's assessment of the effectiveness of its internal control over financial reporting under Section 404(b) of the Sarbanes-Oxley Act (15 U.S.C 7262(b)) by the registered public accounting firm that prepared or issued its audit report. ☒
If securities are registered pursuant to Section 12(b) of the Act, indicate by check mark whether the financial statements of the registrant included in the filing reflect the correction of an error to previously issued financial statements. ☐
Indicate by check mark whether any of those error corrections are restatements that required a recovery analysis of incentive-based compensation received by any of the registrant’s executive officers during the relevant recovery period pursuant to §240.10D-1(b). ☐
Indicate by check mark whether the registrant is a shell company (as defined in Rule 12b-2 of the Exchange Act).
Yes ☐ No ☒
The aggregate market value of the voting and non-voting common equity held by non-affiliates of the registrant as of June 30, 2024, based on the closing price of its common stock on such date, on the Nasdaq Global Select Market, of $18.03 per share, and 33,923,887 shares held by non-affiliates was $611,647,683. The registrant had 33,990,827 shares of common stock outstanding as of February 18, 2025.
DOCUMENTS INCORPORATED BY REFERENCE
Portions of the registrant’s definitive Proxy Statement for the 2025 Annual Meeting of Shareholders are incorporated by reference into Part III of this Annual Report on Form 10-K where indicated. The 2025 Proxy Statement will be filed with the U.S. Securities and Exchange Commission within 120 days after the end of the fiscal year to which this report relates.
HERITAGE FINANCIAL CORPORATION AND SUBSIDIARIES
FORM 10-K
December 31, 2024
TABLE OF CONTENTS
| | | | | | | | | | | |
| | | Page |
| |
| |
| | |
| ITEM 1. | | |
| ITEM 1A. | | |
| ITEM 1B. | | |
| ITEM 1C | | |
| ITEM 2. | PROPERTIES | |
| ITEM 3. | | |
| ITEM 4. | | |
| | |
| ITEM 5. | | |
| ITEM 6. | | |
| ITEM 7. | | |
| | |
| | |
| | | |
| | | |
| | | |
| | | |
| | | |
| | |
| | | |
| | | |
| | | |
| | | |
| | | |
| | |
| | |
| ITEM 7A. | | |
| ITEM 8. | | |
| | |
| | |
| | |
| | |
| | |
| | |
| | | | | | | | | | | |
| | |
| NOTE 1. | | |
| NOTE 2. | | |
| NOTE 3. | | |
| NOTE 4. | | |
| | | |
| NOTE 5. | | |
| NOTE 6. | | |
| NOTE 7. | | |
| NOTE 8. | | |
| NOTE 9. | | |
| | | |
| NOTE 10. | | |
| NOTE 11. | | |
| NOTE 12. | | |
| NOTE 13. | | |
| NOTE 14. | | |
| NOTE 15. | | |
| | | |
| NOTE 16. | | |
| NOTE 17. | | |
| NOTE 18. | | |
| NOTE 19. | | |
| NOTE 20. | | |
| NOTE 21. | | |
| | | |
| ITEM 9. | | |
| ITEM 9A. | | |
| ITEM 9B. | | |
| ITEM 9C. | | |
| | |
| ITEM 10. | | |
| ITEM 11. | | |
| ITEM 12. | | |
| ITEM 13. | | |
| ITEM 14. | | |
| | |
| ITEM 15. | | |
| ITEM 16. | | |
| | |
Glossary of Acronyms, Abbreviations, and Terms
The acronyms, abbreviations, and terms listed below are used in various sections of this Annual Report on Form 10-K. As used throughout this report, the terms "Heritage," “we,” “our,” “us” or the "Company" refer to Heritage Financial Corporation and its consolidated subsidiaries, unless the context otherwise requires.
| | | | | |
| ACL | Allowance for Credit Losses |
| AOCI | Accumulated Other Comprehensive Income (Loss), Net |
| ASC | Accounting Standards Codification |
| ASU | Accounting Standards Update |
| Bank | Heritage Bank |
| BHCA | Bank Holding Company Act |
| Board | Heritage Financial Corporation Board of Directors |
| BOLI | Bank Owned Life Insurance |
| BTFP | Bank Term Funding Program |
| CECL | Current Expected Credit Loss |
| CMO | Collateralized Mortgage Obligation |
| CRA | Community Reinvestment Act |
| CRE | Commercial Real Estate |
| Deferred Compensation Plan | Heritage Financial Corporation Deferred Compensation Plan, as Amended |
| DEI | Diversity, Equity, and Inclusion |
| DFI | Division of Banks of the Washington State Department of Financial Institutions |
| Dodd-Frank Act | Dodd–Frank Wall Street Reform and Consumer Protection Act |
| Economic Growth Act | Economic Growth, Regulatory Relief and Consumer Protection Act of 2018 |
| Equity Plan | Heritage Financial Corporation 2023 Omnibus Equity Plan |
| Exchange Act | Securities Exchange Act of 1934, as Amended |
| FASB | Financial Accounting Standards Board |
| FDIC | Federal Deposit Insurance Corporation |
| Federal Reserve | Board of Governors of the Federal Reserve System |
| FHLB | Federal Home Loan Bank |
| Fintech | Financial Technology |
| FOMC | Federal Open Market Committee within the Federal Reserve System |
| Form 10-K | Company's Annual Report on Form 10-K |
| FRB | Federal Reserve Bank |
| GAAP | U.S. Generally Accepted Accounting Principles |
| LIHTC | Low-Income Housing Tax Credit |
| MBS | Mortgage-Backed Security |
| OFAC | Office of Foreign Assets Control of the U.S. Department of the Treasury |
| OCC | Office of the Comptroller of the Currency |
| PCD | Purchased Credit Deteriorated; loans purchased with evidence of credit deterioration since origination for which it is probable that not all contractually required payments will be collected; accounted for under FASB ASC 326 |
| PCAOB | Public Company Accounting Oversight Board |
| Plan | Heritage Financial Corporation 401(k) Profit Sharing Plan and Trust |
| Proxy Statement | Definitive Proxy Statement for the Annual Meeting of Shareholders to be Held on May 5, 2025 |
| Related Party | Certain Directors, Executive Officers and Their Affiliates |
| ROU | Right-of-Use |
| Salary Continuation Plan | Salary Continuation Plan Agreement Master Plan Document |
| SBA | Small Business Administration |
| SEC | Securities and Exchange Commission |
| SM | Special Mention |
| SOFR | Secured Overnight Financing Rate |
| SOX | Sarbanes-Oxley Act (15 U.S.C 7262(b)), as Amended |
| | | | | |
| SS | Substandard |
| TDR | Troubled Debt Restructured |
| Unfunded Commitments | Off-balance sheet credit exposures such as loan commitments, standby letters of credit, financial guarantees, and other similar instruments |
| USDA | United States Department of Agriculture |
CAUTIONARY NOTE REGARDING FORWARD-LOOKING STATEMENTS
This Form 10-K contains “forward-looking statements” within the meaning of the Private Securities Litigation Reform Act of 1995. Such statements often include words such as “believes,” “expects,” “anticipates,” “estimates,” “forecasts,” “intends,” “plans,” “targets,” “potentially,” “probably,” “projects,” “outlook” or similar expressions or future or conditional verbs such as “may,” “will,” “should,” “would” and “could,” as well as the negative of such words. Forward-looking statements are not historical facts but instead represent management’s current expectations and forecasts regarding future events, many of which are inherently uncertain and outside of our control. Actual results may differ, possibly materially, from those currently expected or projected in these forward-looking statements. These statements relate to our financial condition, results of operations, beliefs, plans, objectives, goals, expectations, assumptions and statements about future performance or business. The Company cautions readers not to place undue reliance on any forward-looking statements. Moreover, you should treat these statements as speaking only as of the date they are made and based only on information then actually known to the Company. The Company does not undertake and specifically disclaims any obligation to revise any forward-looking statements to reflect the occurrence of anticipated or unanticipated events or circumstances after the date of such statements whether as a result of new information, future events or otherwise. These forward-looking statements are subject to known and unknown risks and uncertainties. Factors that could cause our actual results to differ materially from those described in the forward-looking statements include, but are not limited to:
•potential adverse impacts to economic conditions nationally or in our local market areas, other markets where we have lending relationships, or other aspects of our business operations or financial markets including, without limitation, as a result of credit quality deterioration, pronounced and sustained reductions in real estate market values, employment levels and labor shortages, a potential recession or slowed economic growth;
•changes in the interest rate environment, which could adversely affect our revenues and expenses, the value of assets and obligations, and the availability and cost of capital and liquidity;
•the level and impact of inflation and the current and future monetary policies of the Federal Reserve in response thereto;
•legislative or regulatory changes that adversely affect our business, including changes in banking, securities, and tax law, in regulatory policies and principles, or the interpretation and prioritization of regulatory capital or other rules;
•effects on the U.S. economy resulting from the implementation of policies proposed by the new presidential administration, including tariffs, mass deportations and tax regulations;
•credit and interest rate risks associated with our business, customers, borrowings, repayment, investment, and deposit practices;
•fluctuations in deposits and deposit concentrations;
•liquidity issues, including our ability to borrow funds or raise additional capital, if necessary;
•fluctuations in the value of our investment securities;
•credit risks and risks from concentrations (by type of geographic area, collateral and industry) within our loan portfolio;
•disruptions, security breaches, insider fraud, cybersecurity incidents or other adverse events, failures or interruptions in, or attacks on, our information technology systems or on the third party vendors who perform critical processing functions for our business, including sophisticated attacks using artificial intelligence and similar tools;
•rapid technological change in the financial services industry;
•increased competition in the financial services industry from non-banks such as credit unions and Fintech companies, including digital asset service providers;
•our ability to adapt successfully to technological changes to compete effectively in the marketplace, including as a result of competition from other commercial banks, credit unions, securities brokerage firms, insurance companies, and Fintech companies;
•the credit risks of lending activities, including changes in the level and trend of loan delinquencies, write-offs and changes in our ACL on loans and provision for credit losses on loans that may be affected by deterioration in the housing and CRE markets, which may lead to increased losses and nonperforming assets in our loan portfolio, and may result in our ACL on loans no longer being adequate to cover actual losses, or require us to increase our ACL on loans;
•the impact of changing levels of inflation and the current and future monetary policies of the Federal Reserve in response thereto;
•the relative differences between short-term and long-term interest rates, deposit interest rates, our net interest margin and funding sources;
•the impact of repricing and competitors' pricing initiatives on loan and deposit products;
•fluctuations in the demand for loans;
•the effects of recent developments and events in the financial services industry, including the large-scale deposit withdrawals over a short period of time that resulted in prior bank failures;
•the extensive regulatory framework that applies to us;
•results of examinations by the bank regulators, including the possibility that any such regulatory authority may, among other things, initiate an enforcement action against the Company or the Bank which could require us to increase our ACL on loans, write down assets, change our regulatory capital position, affect our ability to borrow funds or maintain or increase deposits or
impose additional requirements on us, any of which could affect our ability to continue our growth through mergers, acquisitions or similar transactions and adversely affect our liquidity and earnings;
•the quality and composition of our securities portfolio and the impact of any adverse changes with respect thereto, including market liquidity within the securities markets;
•the concentration of large deposits from certain customers, who have balances above current FDIC insurance limits;
•our ability to attract and retain deposits;
•the overall health of local and national real estate markets;
•the level of nonperforming assets on our balance sheet;
•effects of and potential changes to critical accounting policies and judgments, including the use of estimates in determining the fair value of certain of our assets, which estimates may prove to be incorrect and result in significant declines in valuation;
•the commencement, costs, effects and outcome of litigation and other legal proceedings and regulatory actions against us or to which we may become subject, including settlements and judgments;
•the effects of climate change, severe weather events, natural disasters, pandemics, epidemics and other public health crises, acts of war or terrorism, and other external events on our business and the businesses of our customers;
•the impact of bank failures or adverse developments at other banks and related negative publicity about the banking industry in general on investor and depositor sentiment regarding the stability and liquidity of banks;
•the composition of our executive management team and our ability to attract and retain key personnel;
•our ability to control operating costs and expenses;
•the effectiveness of our risk management framework;
•difficulties in reducing risk associated with our loans;
•staffing fluctuations in response to product demand or the implementation of corporate strategies that affect our workforce and potential associated charges;
•our ability to implement our business strategies and manage our growth;
•future goodwill impairment due to changes in our business, market conditions or other factors;
•our ability to successfully integrate any assets, liabilities, customers, systems and management personnel we may acquire into our operations and our ability to realize related revenue synergies and cost savings within expected time frames or at all, and any goodwill charges related thereto and costs or difficulties relating to integration matters, including but not limited to customer and employee retention, which might be greater than expected;
•risks related to acquiring assets in or entering markets in which we have not previously operated and may not be familiar;
•changes in consumer spending, borrowing and savings habits;
•our ability to pay dividends on our common stock;
•other economic, competitive, governmental, regulatory and technological factors affecting our operations, pricing, products and services;
•our success at managing the risks involved in the foregoing items; and
•other risks described elsewhere in this Form 10-K and in our other reports filed with or furnished to the SEC, which are available on our website at www.hf-wa.com and on the SEC's website at www.sec.gov.
PART I
ITEM 1. BUSINESS
Overview
Heritage Financial Corporation is a bank holding company that was incorporated in the State of Washington in August 1997. We are primarily engaged in the business of planning, directing, and coordinating the business activities of our wholly-owned subsidiary and single reportable segment, Heritage Bank.
Heritage Bank is headquartered in Olympia, Washington and conducts business from its 50 branch offices located throughout Washington State, the greater Portland, Oregon area, Eugene, Oregon and Boise, Idaho as of December 31, 2024. Heritage Bank also does business under the Whidbey Island Bank name on Whidbey Island, Washington. The deposits of the Bank are insured by the FDIC.
Our business consists primarily of commercial lending and deposit relationships with small and medium-sized businesses and their owners in our market areas and attracting deposits from the general public. We also make real estate construction and land development loans and consumer loans.
Business Strategy
We are committed to being the leading commercial community bank in the Pacific Northwest by continuously improving customer satisfaction, employee empowerment, community investment and shareholder value. Our commitment defines our relationships, sets expectations for our actions and directs decision-making in these four fundamental areas. We seek to achieve our business goals through the following strategies:
Expand geographically as opportunities present themselves. We are committed to continuing the controlled expansion of our franchise through strategic acquisitions designed to increase our market share and enhance franchise value. We believe that consolidation across the community bank landscape will continue to take place and further believe that, with our capital and liquidity positions, our approach to credit management, and our extensive acquisition experience, we are well-positioned to take advantage of acquisitions or other business opportunities in our market areas. In markets where we wish to enter or expand our business, we also periodically consider opening de novo branches, typically in conjunction with hiring commercial lending and
deposit teams. In the past, we have successfully integrated acquired institutions and opened de novo branches. We continue to be disciplined and opportunistic as it pertains to future acquisitions and de novo branching, focusing on the Pacific Northwest markets we know and understand.
Focus on asset quality. A strong credit culture is a high priority for us. We have a well-developed credit approval structure that has enabled us to maintain a standard of asset quality that we believe has moderate and manageable risk while at the same time allowing us to achieve our lending objectives. We continue to focus on loan types and markets that we know well and where we have a historical record of success. We focus on loan relationships that are well-diversified in both size and industry types. With respect to commercial business lending, which is our predominant lending activity, we view ourselves as cash-flow lenders obtaining additional support from realistic collateral values, personal guarantees and other secondary sources of repayment. We have a problem loan resolution process that is focused on quick detection and implementing feasible solutions and subject our loans to periodic internal loan reviews.
Maintain a strong balance sheet. In addition to our focus on underwriting, we believe the strength of our balance sheet provides us with the flexibility to manage through a variety of scenarios including additional growth-related activities. As of December 31, 2024, our on-balance sheet liquidity position was $117.1 million in cash and cash equivalents and $1.47 billion in total investment securities. See also Item 7. Management's Discussion and Analysis of Financial Condition and Results of Operations — Liquidity and Capital Resources of this Form 10-K. As of December 31, 2024, the regulatory capital ratios of the Bank were in excess of the levels required for “well-capitalized” status, and our consolidated common equity tier 1 capital ratio, leverage ratio, Tier 1 capital ratio, and total capital ratio were 12.0%, 10.0%, 12.4% and 13.3%, respectively.
Focus on deposit growth. Our strategic focus is to continuously grow deposits with emphasis on total relationship banking with our business and retail customers. We continue to seek to increase our market share in the communities we serve by providing exceptional customer service, focusing on relationship development with local businesses and strategic branch expansion. Our primary focus is to maintain a high level of non-maturity deposits to internally fund our loan growth with a low reliance on maturity (certificate) deposits. At December 31, 2024, our non-maturity deposits were 82.8% of our total deposits. Our technology-based products, including online personal financial management, business cash management and business remote deposit products enable us to compete effectively with banks of all sizes. Our retail and commercial management teams are well-seasoned and have strong ties to the communities we serve with a strong focus on relationship building and customer service.
Emphasize business relationships with a focus on commercial lending. We continue to market primarily commercial business loans and the deposit balances that accompany these relationships. Our seasoned lending staff has extensive knowledge and experience, and can add value through a focused advisory role that we believe strengthens our customer relationships and develops loyalty. We currently have, and will seek to maintain, a diversified portfolio of lending relationships without significant concentrations in any industry.
Recruit and retain highly competent personnel to execute our strategies. Our compensation and staff development programs are aligned with our strategies to grow our loans and non-maturity deposits while maintaining our focus on asset quality. Our incentive systems are designed to achieve balanced, high quality asset growth while maintaining appropriate mechanisms to reduce or eliminate incentive payments when appropriate. Our equity compensation programs and retirement benefits are designed to build and encourage employee ownership at all levels of the Company and we align employee performance objectives with corporate growth strategies and shareholder value. We have a strong corporate culture, which is supported by our commitment to internal development and promotion from within as well as the retention of management and officers in key roles.
There have been no material changes to our business strategy during the years ended December 31, 2024 and 2023.
History
The Bank was established in 1927 as a federally-chartered mutual savings bank. In 1992, the Bank converted to a state-chartered mutual savings bank under the name "Heritage Savings Bank". Through the mutual holding company reorganization of the Bank and subsequent conversion of the mutual holding company, the Bank became a stock savings bank and a wholly-owned subsidiary of the Company effective August 1997. Effective September 1, 2004, Heritage Savings Bank switched its charter from a state-chartered savings bank to a state-chartered commercial bank and changed its legal name from "Heritage Savings Bank" to "Heritage Bank". The following table lists major acquisitions completed by the Company:
| | | | | | | | | | | | | | | | | | | | | | | | | | |
| Type of Transaction | | Date of Transaction | | Acquired Holding Company Name | | Acquired Bank Name | | Total Assets Acquired
(in millions) |
| Acquisition | | June 1998 | | North Pacific Bancorporation | | North Pacific Bank | | $ | 85 | |
| Acquisition | | March 1999 | | Washington Independent Bancshares, Inc. | | Central Valley Bank | | 61 | |
| Acquisition | | June 2006 | | Western Washington Bancorporation | | Washington State Bank, N.A. | | 57 | |
| FDIC Assisted Purchase | | August 2010 | | n/a | | Cowlitz Bank | | 345 | |
| FDIC Assisted Purchase | | November 2010 | | n/a | | Pierce Commercial Bank | | 211 | |
| Acquisition | | January 2013 | | n/a | | Northwest Commercial Bank | | 65 | |
| Acquisition | | July 2013 | | Valley Community Bancshares, Inc. | | Valley Bank | | 237 | |
| Merger | | May 2014 | | Washington Banking Company | | Whidbey Island Bank | | 1,657 | |
| | | | | | | | | | | | | | | | | | | | | | | | | | |
| Acquisition | | January 2018 | | Puget Sound Bancorp, Inc. | | Puget Sound Bank | | 571 | |
| Acquisition | | July 2018 | | Premier Commercial Bancorp | | Premier Community Bank | | 387 | |
Description of Business
Retail Banking
We offer a full range of products and services to customers for personal and business banking needs designed to attract both short-term and long-term deposits. Deposits are our primary source of funds. Our personal and business banking customers have the option of selecting from a variety of account types. The major categories of deposit accounts that we offer are described below. These accounts, with the exception of noninterest demand accounts, generally earn interest at rates established by management based on competitive market factors and management’s desire to increase or decrease certain types or maturities of deposits.
Noninterest Demand Deposits. Deposits are noninterest bearing and may be charged service fees based on activity and balances.
Interest Bearing Demand Deposits. Deposits are interest bearing and may be charged service fees based on activity and balances. Interest bearing demand deposits pay interest, but require a higher minimum balance to avoid service charges.
Money Market Accounts. Deposits pay an interest rate that is tiered depending on the balance maintained in the account. Minimum opening balances vary.
Savings Accounts. Deposits are interest bearing provided that a minimum balance is maintained to avoid service charges.
Certificate of Deposit Accounts. Deposits require a minimum deposit of $2,500 and have maturities ranging from three months to five years. Jumbo certificate of deposit accounts are offered in amounts of $100,000 or more for terms of seven days to one year.
Our personal checking accounts feature an array of benefits and options, including online banking, online statements, mobile banking with mobile deposit, VISA debit cards and access to more than 40,000 surcharge free Automated Teller Machines through the MoneyPass network.
We also offer investment advice through a Wealth Management department that provides objective advice from trusted advisers.
Lending Activities
Our lending activities are conducted through the Bank. While our focus is on commercial business lending, we also originate real estate construction and land development loans and consumer loans. Our loans are originated under policies that are reviewed and approved annually by our Board. In addition, we have established internal lending guidelines that are updated as needed. These policies and guidelines address underwriting standards, structure and rate considerations and compliance with laws, regulations and internal lending limits. We conduct post-approval reviews on selected loans and routinely perform internal loan reviews of our loan portfolio to confirm credit quality, proper documentation and compliance with laws and regulations. Loan repayments are considered one of the primary sources of funding for the Company.
Commercial Business Lending
At December 31, 2024, we had $3.76 billion, or 78.3% of our loans receivable, in commercial business loans. We offer different types of commercial business loans, including lines of credit, term equipment financing and term owner-occupied and non-owner occupied CRE loans. We also originate loans that are guaranteed by the U.S. SBA, for which the Bank is a “preferred lender,” the USDA and the Federal Agricultural Mortgage Corporation. Before extending credit to a business, we review and analyze the borrower’s management ability, financial history, including cash flow of the borrower and all guarantors, and anticipated liquidation value of the collateral. Emphasis is placed on having a comprehensive understanding of the borrower’s global cash flow and performing necessary financial due diligence.
We originate CRE loans within our primary market areas, with a focus on loans secured by owner-occupied properties. Our underwriting standards require that non-owner occupied and owner-occupied CRE loans not exceed 75% and 80%, respectively, of the lower of appraised value at origination or cost of the underlying collateral. Cash flow debt coverage covenant requirements typically range from 1.15 times to 1.25 times, depending on the type of property. Actual debt service coverage is usually higher than required covenant thresholds, as loan sizing requires sensitized coverage using an "underwriting" interest rate that is higher than the note rate.
CRE loans typically involve a greater degree of risk than residential real estate loans. Payments on loans secured by CRE properties are dependent on successful operation and management of the properties and repayment of these loans may be affected by adverse conditions in the real estate market or the broader economy. We seek to minimize these risks by determining the financial condition of the borrower and any tenants, the quality and value of the collateral and the strength of management of the property securing the loan. We also generally obtain personal guarantees from the owners of the collateral after a thorough review of personal financial statements. In addition, we reviewed over 65% of our CRE loan portfolio during the year ended December 31, 2024 for various performance related criteria and stress-test loans for potential changes in interest rates, occupancy and collateral values.
The Company may enter into non-hedging interest rate swap contracts with commercial customers to accommodate their business needs. For additional information, see Note (7) Derivative Financial Instruments of the Notes to Consolidated Financial Statements included in Item 8. Financial Statements And Supplementary Data of this Form 10-K.
Real Estate Construction and Land Development
At December 31, 2024, we had $479.4 million, or 9.9% of our loans receivable, in real estate construction and land development loans, including residential construction loans and commercial and multifamily construction loans.
We originate residential construction loans to builders for the construction of pre-sold homes and speculative residential properties. Because of the higher risks present in the residential construction industry, our lending to builders is limited to those who have demonstrated a favorable record of performance and who are building in markets that our management understands. We further endeavor to limit our construction lending risk through adherence to strict underwriting guidelines and procedures. Speculative construction loans are short term in nature and have a variable rate of interest. We require builders to have tangible equity in each construction project, have prompt and thorough documentation of all draw requests and permit us to inspect the project prior to paying any draw requests.
Commercial and multifamily construction loans also have a higher risk because of the construction element and lease-up elements, if such properties are not pre-leased. As a result, this type of construction loan is made only to strong borrowers with sufficient equity into the project and additional resources they can draw on if needed. The Company performs due diligence to gain comfort that the experience of the general contractor is sufficient to finish the project on budget and on time. Project feasibility is also important and our lenders ensure the project is economically viable. Commercial and multifamily construction loans are monitored through cost reviews, regulatory-compliant appraisals, sufficient equity, engineering inspections and controlled disbursements.
Residential Real Estate Loans, Originations and Sales
At December 31, 2024, residential real estate loans totaled $403.0 million, or 8.4% of our loans receivable. The majority of our residential real estate loans are secured by single-family residences located in our primary market areas. Our underwriting standards require that residential real estate loans generally are owner-occupied and do not exceed 80% of the lower of appraised value at origination or cost of the underlying collateral. Terms typically range from 15 to 30 years. As part of our asset/liability management strategy, we have historically sold originated residential real estate loans in the secondary market with no recourse and servicing released. In January 2024, we ceased the origination of residential real estate loans. We have and may buy pools of mortgage loans or otherwise acquire mortgage loans from other originators.
Consumer
At December 31, 2024, we had $164.7 million, or 3.4% of our loans receivable, in consumer loans. We originate consumer loans and lines of credit that are both secured and unsecured.
For additional information, see Item 1A. Risk Factors—Credit Risks this Form 10-K.
Supervision and Regulation
General
FDIC-insured institutions, like the Bank, their holding companies and affiliates are extensively regulated under federal and state law. As a result, our growth and earnings performance may be affected not only by management decisions and general economic conditions, but also by the requirements of federal and state statutes and by the regulations and policies of various banking agencies, including the DFI, the Federal Reserve, the FDIC and the Consumer Financial Protection Bureau (“CFPB”). Furthermore, taxation laws administered by the Internal Revenue Service and state taxing authorities, accounting rules developed by the FASB and PCAOB, securities laws administered by the SEC and state securities authorities, and anti-money and sanctions laundering laws enforced by the U.S. Department of the Treasury (“Treasury”) have an impact on our business. The effect of these statutes, regulations, regulatory policies and accounting rules are significant to our operations and results.
Federal and state banking laws impose a comprehensive system of supervision, regulation and enforcement on the operations of FDIC-insured institutions, their holding companies and affiliates that is intended primarily for the protection of the FDIC-insured deposits and depositors of banks, rather than shareholders. These laws, and the regulations of the banking agencies issued under them, affect, among other things, the scope of our business, the kinds and amounts of investments that the Company and the Bank may make, required capital levels relative to assets, the nature and amount of collateral for loans, the establishment of branches, the ability of the Company or the Bank to merge, consolidate and acquire, dealings with our insiders and affiliates and the payment of dividends.
In reaction to the global financial crisis and particularly following the passage of the Dodd-Frank Act, we experienced heightened regulatory requirements and scrutiny. Although the reforms primarily targeted large banking organizations and systemically important financial institutions, their influence filtered down in varying degrees to community banks over time and caused our compliance and risk management processes, and the costs thereof, to increase. The Economic Growth Act eliminated questions about the applicability of certain Dodd-Frank Act reforms to community bank systems, including relieving them of any requirement to engage in mandatory stress tests, maintain a risk committee or comply with the Volcker Rule’s complicated prohibitions on proprietary trading and ownership of private funds. These reforms have been favorable to our operations. It is anticipated that the Trump Administration and the current U.S. Congress likely will not increase the regulatory burden on community banking organizations and may seek to reduce and streamline certain prudential and regulatory requirements
applicable to community banking organizations at a federal level based on statements made by relevant congressional leaders and the acting leaders of certain federal banking agencies. At this time, however, it is not possible to predict with any certainty the actual impact that the Trump Administration may have on the banking industry or the operations of the Company or the Bank.
The supervisory framework for U.S. banking organizations subjects banks and bank holding companies to regular examination by their respective banking agencies, which results in examination reports and ratings that are not publicly available and that can impact the conduct and growth of their businesses. These examinations consider not only compliance with applicable laws and regulations, but also capital levels, asset quality and risk, management ability and performance, earnings, liquidity and various other factors. The banking agencies generally have broad discretion to impose restrictions and limitations on the operations of a regulated entity where the agencies determine, among other things, that such operations are unsafe or unsound, fail to comply with applicable law or are otherwise inconsistent with laws and regulations. The approach to supervision adopted by each banking agency may have significant impacts on the operations and results of the Company and the Bank, as well as the banking industry in general. Based on recent statements made by congressional leaders and the acting leaders of certain federal banking agencies, there may be changes in the supervisory processes and approach made by the Trump Administration banking agencies, but it is not possible at this time to predict the specific changes (or the timing of any such changes) that may be made.
The following is a summary of the material elements of the supervisory and regulatory framework applicable to the Company and the Bank. It does not describe all of the statutes, regulations and regulatory policies that apply, nor does it restate all of the requirements of those that are described. The descriptions are qualified in their entirety by reference to the particular statutory and regulatory provision.
The Role of Capital
Regulatory capital represents the net assets of a banking organization available to absorb losses. FDIC-insured institutions, such as banks, as well as their holding companies (i.e., banking organizations) are required to hold more capital than other businesses, which directly affects our earnings capabilities. Although capital has historically been one of the key measures of the financial health of both bank holding companies and banks, its role became fundamentally more important in the wake of the global financial crisis, as the banking regulators recognized that the amount and quality of capital held by banking organizations prior to that crisis was insufficient to absorb losses during periods of severe stress.
Capital Levels. Banking organizations have been required to hold minimum levels of capital based on guidelines established by the banking agencies since 1983. The minimums have been expressed in terms of ratios of “capital” divided by “total assets.” Beginning in 1989, the capital guidelines for U.S. banking organizations have been based upon international capital accords (known as “Basel” accords) adopted by the Basel Committee on Banking Supervision, a committee of central banks and bank supervisors that acts as the primary global standard-setter for prudential regulation, as implemented by the U.S. federal banking agencies on an interagency basis. These accords recognized that bank assets for the purpose of the capital ratio calculations needed to be risk weighted (the theory being that riskier assets should require more capital) and that off-balance sheet exposures needed to be factored in the calculations. Following the global financial crisis, the Group of Governors and Heads of Supervision, the oversight body of the Basel Committee on Banking Supervision, announced agreement on a strengthened set of capital requirements for banking organizations around the world, known as the Basel III accords, to address deficiencies recognized in connection with the global financial crisis.
The Basel III Rule. The U.S. federal bank regulatory agencies adopted the U.S. Basel III regulatory capital reforms, and, at the same time, effected changes required by the Dodd-Frank Act, in regulations that were effective (with certain phase-ins) in 2015 (the “Basel III Rule”). The Basel III Rule established capital standards for banking organizations that are meaningfully more stringent than those established previously and are still in effect today.
The Basel III Rule is applicable to all banking organizations that are subject to minimum capital requirements, including national banks, state banks and savings and loan associations, as well as to most bank and savings and loan holding companies. The Company and the Bank are each subject to the Basel III Rule.
Risk-Weighting Assets. Three of the required capital ratios imposed under the Basel III Rule, as discussed immediately below, are calculated using a denominator of total “risk-weighted” assets. In the calculation of so-called “risk weights,” which was introduced in the Basel I accord, bank assets were divided into four basic risk-weighted categories of 0%, 20%, 50%, and 100%. The Basel III accords required a more complex, detailed and calibrated assessment of risk in the calculation of risk weightings. Although it uses the same technique introduced by the Basel I accord in assigning assets to risk-weight categories, it significantly increases the number of categories and adds conditions to the assignment of certain risk weights. Risk weights were established as high as 250% for certain commercial real estate exposures, and higher for certain derivatives.
The assignment of risk weights is likely to continue to be under review by the federal banking agencies as they seek to implement certain remaining elements of the Basel III accords. In July 2023, the Biden Administration banking agencies proposed wide-ranging and significant changes to the Basel III Rules (the “Basel III Endgame Proposal”), which would have, among other requirements, imposed structural changes to the calculation of capital requirements and risk-weighted assets. The Basel III Endgame Proposal would have primarily impacted the capital requirements applicable to banking organizations with $100 billion or more in total assets, and as a general matter, would not have impacted the Company. The Basel III Endgame Proposal has not been, and is not expected to be, adopted in its proposed form. The Trump Administration banking agencies may change or issue their own version of this proposal.
Minimum Capital Ratios. The Basel III Rule also increased the required quantity and quality of capital. Not only did it increase most of the required minimum capital ratios in effect prior to January 1, 2015, but, in requiring that forms of capital be of higher quality to absorb loss, it introduced the concept of Common Equity Tier 1 Capital, which consists primarily of common stock, related surplus (net of Treasury stock), retained earnings, and Common Equity Tier 1 minority interests subject to certain
regulatory adjustments. The Basel III Rule also changed the definition of capital by establishing more stringent criteria that instruments must meet to be considered Additional Tier 1 Capital (primarily non-cumulative perpetual preferred stock that meets certain requirements) and Tier 2 Capital (primarily other types of preferred stock and subordinated debt, subject to limitations). The Basel III Rule also constrained the inclusion of minority interests, mortgage-servicing assets, and deferred tax assets in capital and required deductions from Common Equity Tier 1 Capital if such assets exceeded a percentage of a banking organization’s Common Equity Tier 1 Capital.
The Basel III Rule requires banking organizations to maintain minimum capital ratios as follows:
•A ratio of Common Equity Tier 1 Capital equal to 4.5% of risk-weighted assets;
•A ratio of Tier 1 Capital equal to 6% of risk-weighted assets;
•A ratio of Total Capital (Tier 1 plus Tier 2) equal to 8% of risk-weighted assets; and
•A leverage ratio of Tier 1 Capital to total quarterly average assets equal to 4% in all circumstances.
In addition, banking organizations that want to make capital distributions (including for dividends and repurchases of stock) and pay discretionary bonuses to executive officers without restriction also must maintain 2.5% in Common Equity Tier 1 Capital attributable to a capital conservation buffer. The purpose of the conservation buffer is to ensure that banking institutions maintain a buffer of capital that can be used to absorb losses during periods of financial and economic stress. Factoring in the conservation buffer increases the minimum ratios depicted above to 7% for Common Equity Tier 1 Capital, 8.5% for Tier 1 Capital and 10.5% for Total Capital.
Well-Capitalized Requirements. The ratios described above are minimum standards in order for banking organizations to be considered “adequately capitalized.” Banking agencies uniformly encourage banking organizations to hold more capital and be “well-capitalized” and, to that end, federal law and regulations provide various incentives for banking organizations to maintain regulatory capital at levels in excess of minimum regulatory requirements. For example, a banking organization that is well-capitalized may: (i) qualify for exemptions from prior notice or application requirements otherwise applicable to certain types of activities; (ii) qualify for expedited processing of other required notices or applications; and (iii) accept, roll-over or renew brokered deposits. Higher capital levels also could be required if warranted by the particular circumstances or risk profiles of individual banking organizations. For example, the Federal Reserve’s capital guidelines contemplate that additional capital may be required to take adequate account of, among other things, interest rate risk, or the risks posed by concentrations of credit, nontraditional activities or securities trading activities. Further, any banking organization experiencing or anticipating significant growth would be expected to maintain capital ratios, including tangible capital positions (i.e., Tier 1 Capital less all intangible assets), well above the minimum levels.
Under the capital regulations of the Federal Reserve for the Company and the FDIC for the Bank, in order to be well capitalized, a banking organization, like the Company and the Bank, must maintain:
•A Common Equity Tier 1 Capital ratio to risk-weighted assets of 6.5% or more;
•A ratio of Tier 1 Capital to total risk-weighted assets of 8% or more;
•A ratio of Total Capital to total risk-weighted assets of 10% or more; and
•A leverage ratio of Tier 1 Capital to total adjusted average quarterly assets of 5% or greater.
It is possible under the Basel III Rule to be well-capitalized while remaining out of compliance with the capital conservation buffer discussed above.
As of December 31, 2024: (i) the Bank was not subject to a directive from the FDIC or the DFI to increase its capital and (ii) the Bank was well-capitalized, as defined by FDIC regulations. As of December 31, 2024, the Company had regulatory capital in excess of the Federal Reserve’s requirements and met the Basel III Rule requirements to be well-capitalized. As of December 31, 2024, we were also in compliance with the capital conservation buffer.
Prompt Corrective Action. The concept of a banking organization being “well-capitalized” is part of a regulatory enforcement regime that provides the federal banking agencies with broad power to take “prompt corrective action” to resolve the problems of depository institutions based on the capital level of each particular institution. The extent of the banking agencies’ powers depends on whether the institution in question is “adequately capitalized,” “undercapitalized,” “significantly undercapitalized” or “critically undercapitalized,” in each case as defined by regulation. Depending upon the capital category to which a banking organization is assigned, the banking agencies’ corrective powers include: (i) requiring the institution to submit a capital restoration plan; (ii) limiting the institution’s asset growth and restricting its activities; (iii) requiring the institution to issue additional capital stock (including additional voting stock) or to sell itself; (iv) restricting transactions between the institution and its affiliates; (v) restricting the interest rate that the institution may pay on deposits; (vi) ordering a new election of directors of the institution; (vii) requiring that senior executive officers or directors be dismissed; (viii) prohibiting the institution from accepting deposits from correspondent banks; (ix) requiring the institution to divest certain subsidiaries; (x) prohibiting the payment of principal or interest on subordinated debt; and (xi) ultimately, appointing a receiver for the institution.
Community Bank Capital Simplification. Community banking organizations have long raised concerns with federal banking agencies about the regulatory burden, complexity, and costs associated with certain provisions of the Basel III Rule. In response, the U.S. Congress provided an “off-ramp” for institutions, like us, with total consolidated assets of less than $10 billion as part of the Economic Growth Act. Section 201 of the Economic Growth Act specifically instructed the federal banking regulators to establish a single “Community Bank Leverage Ratio” (“CBLR”) of between 8% and 10%. Under the final rule, a community banking organization is eligible to elect to comply with its capital requirements under the CBLR framework if it has: (i) less than
$10 billion in total consolidated assets; (ii) limited amounts of certain assets and off-balance sheet exposures; and (iii) a CBLR greater than 9%. We may elect the CBLR framework at any time, but have not elected to use the CBLR framework as of December 31, 2024.
Supervision and Regulation of the Company
General. The Company, as the sole shareholder of the Bank, is a bank holding company. As a bank holding company, we are registered with, and subject to regulation, supervision and enforcement by, the Federal Reserve under the BHCA. We are legally obligated to act as a source of financial and managerial strength to the Bank and to commit resources to support the Bank in circumstances where we might not otherwise do so. Under the BHCA, we are subject to periodic examination by the Federal Reserve and are required to file with the Federal Reserve periodic reports of our operations and such additional information regarding us and the Bank as the Federal Reserve may require.
Acquisitions, Activities and Financial Holding Company Election. The primary purpose of a bank holding company is to control and manage banks. The BHCA generally requires the prior approval of the Federal Reserve for any merger involving a bank holding company or any acquisition by a bank holding company of another bank or bank holding company. Subject to certain conditions (including deposit concentration limits established by the BHCA), the Federal Reserve may allow a bank holding company to acquire banks located in any state of the United States. In approving interstate acquisitions, the Federal Reserve is required to give effect to applicable state law limitations on the aggregate amount of deposits that may be held by the acquiring bank holding company and its FDIC-insured institution affiliates in the state in which the target bank is located (provided that those limits do not discriminate against out-of-state institutions or their holding companies) and state laws that require that the target bank have been in existence for a minimum period of time (not to exceed five years) before being acquired by an out-of-state bank holding company. Furthermore, in accordance with the Dodd-Frank Act, bank holding companies must be well-capitalized and well-managed in order to effect interstate mergers or acquisitions. For a discussion of the capital requirements, see “–The Role of Capital” above.
The BHCA generally prohibits us from acquiring direct or indirect ownership or control of more than 5% of the voting shares of any company that is not a bank and from engaging in any business other than that of banking, managing and controlling banks or furnishing services to banks and their subsidiaries. This general prohibition is subject to a number of exceptions. The principal exception allows bank holding companies to engage in, and to own shares of companies engaged in, certain businesses found by the Federal Reserve prior to November 11, 1999 to be “so closely related to banking... as to be a proper incident thereto.” This authority permits us to engage in a variety of banking-related businesses, including the ownership and operation of a savings association, or any entity engaged in consumer finance, equipment leasing, the operation of a computer service bureau (including software development) and mortgage banking and brokerage services. The BHCA does not place territorial restrictions on the domestic activities of nonbank subsidiaries of bank holding companies. In addition to approval from the Federal Reserve, prior approval for acquisitions may be required from other agencies, such as the DFI or other agencies that regulate the target company of an acquisition.
Additionally, bank holding companies that meet certain eligibility requirements prescribed by the BHCA and elect to operate as financial holding companies may engage in, or own shares in companies engaged in, a wider range of nonbanking activities, including securities and insurance underwriting and sales, merchant banking and any other activity that the Federal Reserve, in consultation with the Secretary of the Treasury, determines by regulation or order is financial in nature or incidental to any such financial activity or that the Federal Reserve determines by order to be complementary to any such financial activity, as long as the activity does not pose a substantial risk to the safety or soundness of FDIC-insured institutions or the financial system generally. We have not currently elected to operate as a financial holding company.
Change in Control. Federal law also prohibits any person or company from acquiring “control” of an FDIC-insured depository institution or its holding company without prior notice to the appropriate federal bank regulator. “Control” is conclusively presumed to exist upon the acquisition of 25% or more of the outstanding voting securities of a bank or bank holding company, but may arise under certain circumstances between 10% and 24.99% ownership.
Capital Requirements. We are required to maintain consolidated capital in accordance with Federal Reserve capital adequacy requirements. For a discussion of capital requirements, see “–The Role of Capital” above.
Dividend Payments. Our ability to pay dividends to our shareholders may be affected by both general corporate law considerations and policies of the Federal Reserve applicable to bank holding companies. As a Washington corporation, we are subject to the limitations of Washington corporate law, which does not allow us to pay dividends if, after that payment, the Company would not be able to pay its liabilities as they become due in the usual course of business or its total assets would be less than its total liabilities.
As a general matter, the Federal Reserve has indicated that the board of directors of a bank holding company should eliminate, defer or significantly reduce dividends to shareholders if: (i) the company’s net income available to shareholders for the past four quarters, net of dividends previously paid during that period, is not sufficient to fully fund the dividends; (ii) the prospective rate of earnings retention is inconsistent with the company’s capital needs and overall current and prospective financial condition; or (iii) the company will not meet, or is in danger of not meeting, its minimum regulatory capital adequacy ratios. The Federal Reserve also possesses enforcement powers over bank holding companies and their nonbank subsidiaries to prevent or remedy actions that represent unsafe or unsound practices or violations of applicable statutes and regulations. Among these powers is the ability to proscribe the payment of dividends by banks and bank holding companies. In addition, under the Basel III Rule, banking organizations that want to pay unrestricted dividends must maintain 2.5% in Common Equity Tier 1 Capital attributable to the capital conservation buffer. See “–The Role of Capital” above.
Incentive Compensation. There have been a number of developments in recent years focused on incentive compensation plans sponsored by bank holding companies and their subsidiary banks, reflecting recognition by the federal banking agencies and the U.S. Congress that flawed incentive compensation practices in the financial industry were one of many factors contributing to the global financial crisis. The result was interagency guidance on sound incentive compensation practices for banking organizations.
The interagency guidance recognized three core principles. Effective incentive plans should: (i) provide employees incentives that appropriately balance risk and reward; (ii) be compatible with effective controls and risk-management; and (iii) be supported by strong corporate governance, including active and effective oversight by the organization’s board of directors. Much of the guidance is directed at large banking organizations and, because of the size and complexity of their operations, the regulators expect those organizations to maintain systematic and formalized policies, procedures and systems for ensuring that the incentive compensation arrangements for all executive and non-executive employees covered by this guidance are identified and reviewed, and appropriately balance risks and rewards. Under the interagency guidance, smaller banking organizations, like us, that use incentive compensation arrangements are expected to implement less extensive, formalized and detailed policies, procedures and systems than those of the larger banks.
In May 2024, certain of the federal banking and other financial services agencies released a proposed rule regarding certain incentive-based compensation arrangements at certain financial institutions with at least $1 billion in assets, as required under Section 956 of the Dodd-Frank Act. This proposal was largely based on an earlier 2016 proposal. The Federal Reserve and the SEC, however, did not join this proposal, signaling potential interagency misalignment and raising doubts regarding the likelihood of the proposed rule being finalized in its current form. The FDIC has indicated that the agencies will continue to coordinate to reach consensus, but it is not yet clear whether this initiative will continue during the Trump Administration.
Monetary Policy. The monetary policy of the Federal Reserve has a significant effect on the operating results of bank holding companies and their subsidiaries. Among the tools available to the Federal Reserve to affect the money supply are open market transactions in U.S. government securities and changes in the discount rate on bank borrowings. These means are used in varying combinations to influence overall growth and distribution of bank loans, investments and deposits, and their use may affect interest rates charged on loans or paid on deposits, which may impact our business and the operations of the Company and the Bank.
Federal Securities Regulation. Our common stock is registered with the SEC under the Securities Act of 1933, as amended, and the Exchange Act. Consequently, we are subject to the information, proxy solicitation, insider trading and other restrictions and requirements of the SEC under the Exchange Act.
Corporate Governance. The Dodd-Frank Act addressed many investor protection, corporate governance and executive compensation matters that affect most U.S. publicly traded companies. It increased shareholder influence over boards of directors by requiring companies to give shareholders a nonbinding vote on executive compensation and so-called “golden parachute” payments, and authorizing the SEC to promulgate rules that would allow shareholders to nominate and solicit voters for their own candidates using a company’s proxy materials. The Dodd-Frank Act also directed the Federal Reserve, together with the federal banking and financial services agencies, to promulgate rules prohibiting excessive compensation paid to executives of bank holding companies, regardless of whether such companies are publicly traded. As discussed in the “Incentive Compensation” section above, the federal banking agencies and financial services agencies have proposed rules regarding incentive-based compensation arrangements for certain financial institutions, but no rule has been adopted at this time.
Supervision and Regulation of the Bank
General. The Bank is a Washington state-chartered bank. The deposit accounts of the Bank are insured by the FDIC’s Deposit Insurance Fund (“DIF”) to the maximum extent provided under federal law and FDIC regulations, currently $250,000 per insured depositor category. As a Washington state-chartered FDIC-insured bank, the Bank is subject to the examination, supervision, reporting and enforcement requirements of the DFI, the chartering authority for Washington banks, and the FDIC, designated by federal law as the primary federal regulator of insured state banks that, like the Bank, are not members of the Federal Reserve System (nonmember banks).
Deposit Insurance. As an FDIC-insured institution, the Bank is required to pay deposit insurance premium assessments to the FDIC. The FDIC has adopted a risk-based assessment system whereby FDIC-insured institutions pay insurance premiums at rates based on their risk classification. For institutions like the Bank that are not considered large and highly complex banking organizations, the risk-based assessment is based on examination ratings and financial ratios. The total base assessment rates, effective as of January 1, 2023, currently range from 2.5 basis points to 32 basis points. However, the maximum rate is 18 basis points for FDIC-insured institutions in the top two categories of examination composite ratings.
At least semi-annually, the FDIC updates its loss and income projections for the DIF and, if needed, increases or decreases the assessment rates, following notice and comment on proposed rulemaking. For this purpose, the reserve ratio is the DIF balance divided by estimated insured deposits. In response to the global financial crisis, the Dodd-Frank Act increased the minimum reserve ratio from 1.15% to 1.35% of the estimated amount of total insured deposits. In its October 2024 semiannual update, the FDIC stated that the reserve ratio likely will reach the statutory minimum by the September 30, 2028 deadline and that no adjustments to the base assessment rates are currently projected.
In addition, because the total cost of the failures of Silicon Valley Bank and Signature Bank to the DIF was approximately $24.1 billion, the FDIC adopted a special assessment for banking organizations having assets of $5 billion or more, at an annual rate of 13.4 basis points beginning with the first quarterly assessment period of 2024, and with an invoice payment date of June 28, 2024. The FDIC will continue to collect special assessments for an anticipated total of eight quarterly assessment periods. The special assessment amount for each FDIC-insured institution will be determined at a quarterly rate of 3.36 basis points,
multiplied by an institution’s estimated uninsured deposits, reported for the quarter that ended December 31, 2022, adjusted to exclude the first $5 billion in estimated uninsured deposits of the institution (or of the banking organization as a whole for multi-bank holding companies, such as the Company). Although the Company and the Bank are subject to the FDIC’s special assessment as a banking organization with assets of $5 billion or more, the Company does not have to pay the special assessment based on its amount of uninsured deposits.
Supervisory Assessments. All Washington banks are required to pay supervisory assessments to the DFI to fund the operations of that agency as well as other examination fees. The amount of the assessment is calculated on the basis of the Bank’s total assets. During the year ended December 31, 2024, the Bank paid supervisory assessments to the DFI totaling approximately $0.2 million.
Capital Requirements. Banks are generally required to maintain capital levels in excess of other businesses. For a discussion of capital requirements, see “–The Role of Capital” above.
Liquidity Requirements. Liquidity is a measure of the ability and ease with which bank assets may be converted to meet financial obligations such as deposits or other funding sources. Banks are required to implement liquidity risk management frameworks that ensure they maintain sufficient liquidity, including a cushion of unencumbered, high quality liquid assets, to withstand a range of stress events. The level and speed of deposit outflows contributing to the failures of Silicon Valley Bank, Signature Bank and First Republic Bank in the first half of 2023 was unprecedented and contributed to acute liquidity and funding strain. These events have further underscored the importance of liquidity risk management and contingency funding planning by insured depository institutions like the Bank, as highlighted in a 2023 addendum to existing interagency guidance on funding and liquidity risk management.
The primary role of liquidity risk management is to: (i) prospectively assess the need for funds to meet obligations; and (ii) ensure the availability of cash or collateral to fulfill those needs at the appropriate time by coordinating the various sources of funds available to the institution under normal and stressed conditions. The Basel III Rule includes a liquidity framework that requires the largest insured institutions to measure their liquidity against specific liquidity tests. One test, referred to as the Liquidity Coverage Ratio is designed to ensure that the banking organization has an adequate stock of unencumbered high-quality liquid assets that can be converted easily and immediately in private markets into cash to meet liquidity needs for a 30-calendar day liquidity stress scenario. The other test, known as the Net Stable Funding Ratio, is designed to promote more medium- and long-term funding of the assets and activities of FDIC-insured institutions over a one-year horizon. These tests provide an incentive for banks and holding companies to increase their holdings in Treasury securities and other sovereign debt as a component of assets, increase the use of long-term debt as a funding source and rely on stable funding like core deposits (in lieu of brokered deposits).
Although these tests do not apply to the Bank, we continue to review our liquidity risk management policies in light of regulatory requirements and industry developments. For instance, in July 2024, the FDIC released a request for information on deposits, soliciting information on whether and to what extent certain types of deposits may behave differently from each other (particularly during periods of economic or financial stress), the results of which may impact liquidity monitoring and risk management requirements, including for FDIC-insured institutions like the Bank going forward.
Dividend Payments. The Bank pays dividends to the Company. Under the Washington Commercial Bank Act, Washington state-chartered banks may not declare or pay any dividend in an amount greater than its retained earnings, without approval from the DFI. Under the prompt corrective action requirements, the payment of dividends by any FDIC-insured institution is affected by the requirement to maintain adequate capital pursuant to applicable capital adequacy guidelines and regulations, and an FDIC-insured institution generally is prohibited from paying any dividends if, following payment thereof, the institution would be undercapitalized. As described above, the Bank exceeded its capital requirements under applicable guidelines as of December 31, 2024. Notwithstanding the availability of funds for dividends, however, the FDIC and the DFI may prohibit the payment of dividends by the Bank if either or both determine such payment would constitute an unsafe or unsound practice. In addition, under the Basel III Rule, banking organizations that want to pay unrestricted dividends must maintain 2.5% in Common Equity Tier 1 Capital attributable to the capital conservation buffer. See “–The Role of Capital” above.
State Bank Investments, Activities and Acquisitions. The Bank is permitted to make investments and engage in activities directly or through subsidiaries as authorized by Washington law. However, under federal law and FDIC regulations, FDIC-insured state banks are prohibited, subject to certain exceptions, from making or retaining equity investments of a type, or in an amount, that are not permissible for a national bank. Federal law and FDIC regulations also prohibit FDIC-insured state banks and their subsidiaries, subject to certain exceptions, from engaging as principal in any activity that is not permitted for a national bank unless the bank meets, and continues to meet, its minimum regulatory capital requirements and the FDIC determines that the activity would not pose a significant risk to the DIF. These restrictions have not had, and are not currently expected to have, a material impact on the operations of the Bank.
The Bank may be required to seek approval from the DFI, the FDIC and other banking or financial services agencies before engaging in certain acquisitions or mergers under applicable state and federal law. In 2024, each of the OCC and the FDIC separately released updated policy statements—and in the case of the OCC, a final rule—regarding how each banking agency reviews applications submitted pursuant to the Bank Merger Act based on statutory factors. The acting leader of the Trump Administration’s FDIC has indicated that the FDIC may seek to reverse the FDIC’s 2024 policy statement.
Insider Transactions. The Bank is subject to certain restrictions imposed by federal law on “covered transactions” between the Bank and its “affiliates.” The Company is an affiliate of the Bank for purposes of these restrictions, and covered transactions subject to the restrictions include extensions of credit to the Company, investments in the stock or other securities of the Company and the acceptance of the stock or other securities of the Company as collateral for loans made by the Bank. The
Dodd-Frank Act enhanced the requirements for certain transactions with affiliates, including an expansion of the definition of “covered transactions” and an increase in the amount of time for which collateral requirements regarding covered transactions must be maintained.
Certain limitations and reporting requirements are also placed on extensions of credit by the Bank to its directors and officers, to directors and officers of the Company and its subsidiaries, to principal shareholders of the Company and to “related interests” of such directors, officers and principal shareholders under state and federal law. In addition, federal law and regulations may affect the terms on which any person who is a director or officer of the Company or the Bank, or a principal shareholder of the Company, may obtain credit from banks with which the Bank maintains a correspondent relationship.
Safety and Soundness Standards/Risk Management. The federal banking agencies have adopted operational and managerial standards to promote the safety and soundness of FDIC-insured institutions. The standards apply to internal controls, information systems, internal audit systems, loan documentation, credit underwriting, interest rate exposure, asset growth, compensation, fees and benefits, asset quality and earnings.
In general, the safety and soundness standards prescribe the goals to be achieved in each area, and each institution is responsible for establishing its own procedures to achieve those goals. While regulatory standards do not have the force of law, if an institution operates in an unsafe and unsound manner, the FDIC-insured institution’s primary federal banking agency may require the institution to submit a plan for achieving and maintaining compliance. If an FDIC-insured institution fails to submit an acceptable compliance plan, or fails in any material respect to implement a compliance plan that has been accepted by its primary federal banking agency, the agency is required to issue an order directing the institution to cure the deficiency. Until the deficiency cited in the regulator’s order is cured, the agency may restrict the FDIC-insured institution’s rate of growth, require the FDIC-insured institution to increase its capital, restrict the rates that the institution pays on deposits or require the institution to take any action that the agency deems appropriate under the circumstances. Noncompliance with safety and soundness may also constitute grounds for other enforcement action by the federal banking agencies, including cease and desist orders and civil money penalty assessments.
During the past decade, the banking agencies have increasingly emphasized the importance of sound risk management processes and strong internal controls when evaluating the activities of the FDIC-insured institutions they supervise. Properly managing risk has been identified as critical to the conduct of safe and sound banking activities and has become even more important as new technologies, product innovation, and the size and speed of financial transactions have changed the nature of banking markets. The agencies have identified a spectrum of risks facing a banking institution including, but not limited to, credit, market, liquidity, operational, legal and reputational risk. The Bank is expected to have active board and senior management oversight; adequate policies, procedures and limits; adequate risk measurement, monitoring and management information systems; and comprehensive internal controls. The federal banking agencies also have released specific risk management guidance on certain topics, including third-party relationships, in response to the proliferation of relationships between banking organizations and financial technology companies (although the guidance applies more broadly).
Privacy and Cybersecurity. The Bank is subject to many U.S. federal and state laws and regulations governing requirements for maintaining policies and procedures to protect non-public confidential information of its customers. These laws require the Bank to periodically disclose its privacy policies and practices relating to sharing such information and permit consumers to opt out of their ability to share information with unaffiliated third parties under certain circumstances. They also impact the Bank’s ability to share certain information with affiliates and non-affiliates for marketing and/or non-marketing purposes, or to contact customers with marketing offers. In addition, the Bank is required to implement a comprehensive information security program that includes administrative, technical, and physical safeguards to ensure the security and confidentiality of customer records and information. These security and privacy policies and procedures are in effect across all businesses and geographic locations.
The Bank and the Company also are subject to a number of federal and state laws and regulations requiring notifications and disclosures regarding certain cybersecurity incidents. The Bank must also consider and address cybersecurity considerations as part of its risk management processes.
Branching Authority. Washington state-chartered banks, such as the Bank, have the authority under Washington Commercial Bank Act to establish branches anywhere in the State of Washington, subject to receipt of approval from the DFI and FDIC, as appropriate. The establishment of new interstate branches has historically been permitted only in those states the laws of which expressly authorize such expansion. The Dodd-Frank Act permits well-capitalized and well-managed banks to establish new interstate branches or the acquisition of individual branches of a bank in another state (rather than the acquisition of an out-of-state bank in its entirety) without impediments. Federal law permits state banks to merge with banks in other states subject to: (i) regulatory approval; (ii) federal and state deposit concentration limits; and (iii) state law limitations requiring the merging bank to have been in existence for a minimum period of time (not to exceed five years) prior to the merger.
Federal Home Loan Bank System. The Bank is a member of a FHLB, which serves as a central credit facility for its members. The FHLB is funded primarily from proceeds from the sale of obligations of the FHLB system. It makes loans to member banks in the form of FHLB advances. All advances from the FHLB are required to be fully collateralized as determined by the FHLB.
Community Reinvestment Act Requirements. The CRA requires the Bank to have a continuing and affirmative obligation in a safe and sound manner to help meet the credit needs of the entire community, including low- and moderate-income neighborhoods. The FDIC regularly assesses the Bank’s record of meeting the credit needs of its communities in dedicated examinations. The Bank’s CRA ratings derived from these examinations can have significant impacts on the activities in which the Bank and the Company may engage. For example, a low CRA rating may impact the review of applications for acquisitions by the Bank.
On October 24, 2023, the federal banking agencies issued a final rule to strengthen and modernize the CRA regulations (the “CRA Rule”). Elements of the CRA Rule were originally intended to become effective on April 1, 2024 (while other elements had much later effective dates). However, the effective date of the CRA Rule was paused because of a preliminary injunction issued in connection with ongoing litigation claiming that the federal banking agencies exceeded their statutory authority in promulgating the CRA Rule. Despite this lawsuit, management of the Bank are continuing to assess the impact of the CRA Rule on the Bank’s CRA lending and investment activities in their respective markets.
The CRA Rule is designed to update how CRA activities qualify for consideration, where CRA activities are considered, and how CRA activities are evaluated. More specifically, the federal banking agencies described the goals of the CRA Rule as follows: (i) to expand access to credit, investment, and basic banking services in low- and moderate-income communities; (ii) to adapt to changes in the banking industry, including mobile and internet banking, by modernizing assessment areas while maintaining a focus on branch-based areas; (iii) to provide greater clarity, consistency, and transparency in the application of the regulations through the use of standardized metrics as part of CRA evaluation and clarifying eligible CRA activities focused on low- and moderate-income communities and underserved rural communities; (iv) to tailor CRA rules and data collection to bank size and business model; and (v) to maintain a unified approach among the regulators.
Anti-Money Laundering/Countering the Financing of Terrorism/Sanctions. The Bank Secrecy Act (“BSA”) is the common name for a series of laws and regulations enacted in the United States to combat money laundering and the financing of terrorism. They are designed to deny terrorists and criminals the ability to obtain access to the U.S. financial system and have significant implications for FDIC-insured institutions and other businesses involved in the transfer of money. The so-called Anti-Money Laundering / Countering the Financing of Terrorism (“AML/CFT”) regime under the BSA provides a foundation to promote financial transparency and deter and detect those who seek to misuse the U.S. financial system to launder criminal proceeds, finance terrorist acts, or move funds for other illicit purposes. The laws mandate financial services companies to have policies and procedures with respect to measures designed to address: (i) customer identification programs; (ii) money laundering; (iii) terrorist financing; (iv) identifying and reporting suspicious activities and currency transactions; (v) currency crimes; and (vi) cooperation between FDIC-insured institutions and law enforcement authorities. The Bank must also comply with stringent economic and trade sanctions regimes administered and enforced by the Office of Foreign Assets Control.
Concentrations in Commercial Real Estate. Concentration risk exists when FDIC-insured institutions deploy too many assets to any one industry or segment. A concentration in CRE is one example of regulatory concern. The interagency Concentrations in Commercial Real Estate Lending, Sound Risk Management Practices guidance (“CRE Guidance”) provides supervisory criteria, including the following numerical indicators, to assist bank examiners in identifying banks with potentially significant commercial real estate loan concentrations that may warrant greater supervisory scrutiny: (i) CRE loans exceeding 300% of capital and increasing 50% or more in the preceding three years; or (ii) construction and land development loans exceeding 100% of capital. The CRE Guidance does not limit banks’ levels of CRE activities, but rather guides institutions in developing risk management practices and levels of capital that are commensurate with the level and nature of their CRE concentrations. On December 18, 2015, and again in recent years, the federal banking agencies have issued statements to reinforce prudent risk-management practices related to CRE lending, having observed substantial growth in many CRE asset and lending markets, increased competitive pressures, rising CRE concentrations in banks, and an easing of CRE underwriting standards. The federal banking agencies reminded FDIC-insured institutions to maintain underwriting discipline and exercise prudent risk-management practices to identify, measure, monitor, and manage the risks arising from CRE lending. In addition, FDIC-insured institutions must maintain capital commensurate with the level and nature of their CRE concentration risk. As of December 31, 2024, the Bank did not exceed these guidelines.
Consumer Financial Services. The historical structure of federal consumer protection regulation applicable to all providers of consumer financial products and services changed significantly on July 21, 2011, when the CFPB commenced operations to supervise and enforce consumer protection laws. The CFPB has broad rulemaking authority for a wide range of consumer protection laws that apply to all providers of consumer products and services, including the Bank, as well as the authority to prohibit “unfair, deceptive or abusive” acts and practices. The CFPB has examination and enforcement authority over providers with more than $10 billion in assets. FDIC-insured institutions with $10 billion or less in assets, like the Bank, continue to be examined by their applicable bank regulators.
Because abuses in connection with residential mortgages were a significant factor contributing to the global financial crisis, many initial rules issued by the CFPB, as required by the Dodd-Frank Act, addressed mortgage and mortgage-related products, their underwriting, origination, servicing and sales. The Dodd-Frank Act significantly expanded underwriting requirements applicable to loans secured by 1-4 family residential real property and augmented federal law combating predatory lending practices. In addition to numerous disclosure requirements, the Dodd Frank Act and the CFPB’s rules imposed new standards for mortgage loan originations on all lenders, including banks and savings associations, in an effort to strongly encourage lenders to verify a borrower’s ability to repay, while also establishing a presumption of compliance for certain “qualified mortgages.”
Over the last several years, the CFPB has taken an aggressive approach to the regulation (and supervision, where applicable) of providers of consumer financial products and services. For example, the CFPB has taken, or attempted to take, a proactive, multi-front approach to protect consumers from excessive overdraft and non-sufficient funds fees, including through proposed or final rules, interpretive opinions and enforcement actions. Given the increased number and expansive nature of its regulatory initiatives, the CFPB has been subject to lawsuits brought by the banking industry and other providers of consumer financial products and services. The CFPB’s approach may change under the Trump Administration, but it remains unclear exactly what changes will occur or how quickly. In addition, certain rules that the Biden Administration CFPB finalized may be subject to reversal by either the U.S. Congress or the new CFPB administration.
The CFPB’s rules have not had a significant impact on the Bank’s operations, except for higher compliance costs. The Bank must also comply with certain state consumer protection laws and requirements in the states in which it operates.
Website Access to Company Reports
We post reports required to be filed with the SEC on our website, www.hf-wa.com, as soon as reasonably practicable after filing them. Copies of the required reports are available free of charge through our website.
Code of Ethics
We have adopted a Code of Ethics that applies to our directors, officers and employees, as well as those engaged by the Company, but who are not employees, such as contractors and those engaged through external agencies. We have posted a copy of our Code of Ethics at www.hf-wa.com in the section titled Overview: Governance Documents. In accordance with SEC rules, significant changes or waivers of the Code of Ethics will be posted on our website at www.hf-wa.com in the section titled Overview: Governance Documents.
Competition
We compete for loans and deposits with other commercial banks, credit unions and other providers of financial services, including finance companies, online-only banks, mutual funds, insurance companies, and, more recently, with Fintech companies that rely on technology to provide financial services. Many of our competitors have substantially greater resources than we do. Particularly in times of high or rising interest rates, we also face significant competition for investors’ funds from short-term money market securities and other corporate and government securities.
We compete for loans principally through the range and quality of the services we provide, interest rates and loan fees, and robust delivery channels for our products and services. We actively solicit deposit-related customers and compete for deposits by offering depositors high touch service on a variety of savings and checking accounts and cash management and other services.
Human Capital
Our Culture and Our People
The Company's success depends on the success of its people, and we are dedicated to fostering employee empowerment through robust human capital and talent management. Our strong culture, built upon a clear mission and values, unites employees at all levels of the Company towards a common goal, enabling them to reach their full potential.
Inclusive Workplace
We recognize and appreciate the importance of creating an environment where all employees feel valued, included, and empowered to do their best work. Recognizing the unique perspectives each employee brings, we value their contributions to making us the leading commercial community bank in the Pacific Northwest.
We focus on inclusion and belonging with a DEI Officer certified by the National Diversity Council (“NDC”) as well as a dedicated Diversity Council comprised of employees and members of management across different functional areas. Both our Chief Executive Officer and Chief Human Resources Officer serve as executive sponsors to this council.
Our executive management team and Board have undergone instructor-led, customized DEI training. In 2023, the NDC recognized our community outreach and corporate social responsibility efforts, rating us among the best companies for diversity.
The objectives of the Company's DEI plan include:
•Workforce Diversity: Recruit from a diverse, qualified group of potential applicants to secure a high-performing workforce drawn from all segments of the communities we serve.
•Workplace Inclusion: Promote a culture and develop long-term strategies that encourage collaboration, inclusion, flexibility and fairness to enable individuals to contribute to their full potential.
In 2023, our recruiting team achieved certification as “Diversity and Inclusion Recruiters” after completing the Advanced Internet Recruitment Strategies program. All hiring managers are assigned "Interviewing and Selection" training to address and mitigate unconscious bias in hiring decisions. This initiative has resulted in an enhanced diversity representation across the organization, with 43% of new hires in 2024 coming from underrepresented minority groups, compared to 37% in 2023.
Additionally, the Company continues to collaborate with an external consultant to provide inclusive leadership training to its managers. This training, offering insights into diversity, inclusion, and identity, has been incorporated into the mandatory curriculum for new managers. Additional "Lunch & Learn" sessions are open to all employees and members of management, encouraging ongoing discussions and skills development in these areas.
Demographics
As of December 31, 2024, the Company employed 733 full-time and 28 part-time employees across Washington, Oregon, and Idaho. The Company also had six employees who were working remotely in other states. No employees are represented by a collective bargaining agreement. During 2024, we hired 130 regular full-time and part-time employees. Voluntary workforce
turnover (rolling 12-month attrition) was 14.9% for the period ended December 31, 2024, compared to 16.6% for the period ended December 31, 2023. At the end of 2024, our average overall tenure was 7.5 years and the average tenure of management was 9.7 years.
As of December 31, 2024, the Company’s individual contributors were 70.1% female and 29.9% male; managers were 72.3% female and 27.7% male; director-level employees (not members of the Board) were 54.2% female and 45.8% male; and executives were 22.2% female and 77.8% male, with the Company’s total workforce being 69.5% female and 30.5% male.
As of December 31, 2024, the Company’s individual contributors were 29.4% members of underrepresented minority groups and 70.6% white; managers were 23.5% members of underrepresented minority groups and 76.5% white; director-level employees (not members of the Board) were 8.3% members of underrepresented minority groups and 91.7% white; and executives were 100% white, with the Company’s total workforce being 27.1% members of underrepresented minority groups and 72.9% white.
Communication and Listening
The Company strives to maintain an environment of open communication, facilitating access to senior management through initiatives like quarterly virtual “All Banker Calls,” monthly updates for Company leaders and orientation sessions led by the Chief Executive Officer and the Chief Human Resources Officer for new hires. To further enhance our “listening culture,” we utilize a survey platform to allow employees to share feedback directly with leadership, including an annual employee engagement survey and periodic pulse surveys. Survey results, shared with employees, executive leadership and the Board, guide actions at both the corporate and departmental levels. In recognition of our commitment to employee engagement, the Company earned a spot among the top 100 Best Places to Work in Washington and Oregon by the Puget Sound and Portland Business Journals based on the 2024 employee engagement survey. The company received similar recognition in 2023.
Our commitment to open communication extends to providing employees with avenues for confidential and anonymous reporting. We offer a whistleblower hotline/website, enabling employees to report financial and workplace concerns to key leadership, including the Board Chair, Audit Committee Chair, Chief Executive Officer, Chief Operations Officer, Chief Risk Officer and Chief Human Resources Officer. Additionally, our Company intranet hosts an "Idea Bank," allowing employees to submit new ideas or recommendations directly to executive management.
Talent Development and Succession
Developing employees for future growth and professional development is a vital corporate activity crucial to our long-term success. The Company views its employees as our most important assets, which makes training and professional development a worthy investment. We offer an array of learning opportunities through virtual and in-house courses via “Heritage Bank University.” Additionally, we sponsor courses from external providers such as Blanchard, Risk Management Association, Archbright, Jennifer Brown Consulting, Washington Bankers Association, Oregon Bankers Association and the Pacific Coast Banking School.
We offer situational leadership training for leaders that focuses on communication and employee engagement and endorse coaching using the tools from this program. All employees are required to complete an extensive series of quarterly digital training courses focused on bank regulatory compliance, ethics, workplace safety, security, fraud awareness and prevention and other interpersonal or leadership topics. An interactive leadership roadmap is available to assist future leaders in their career development. For the past 10 years, Heritage Bank University has been recognized as a “Champion of Learning” by The Association for Talent Development for its commitment to employee learning.
In 2024, we launched two new Leadership Certificate Programs: The Leadership Essentials Certificate is designed for employees interested in developing their leadership skills and preparing for leadership and management in the future, while the Leadership in Action Certificate is for current supervisors and managers interested in deepening their applied leadership skills. Since the launch of these programs in April 2024, 33 Heritage Bankers have received their Leadership Certification through one of these programs.
The Company leverages an online succession planning tool to further identify next-generation leaders and establish development plans for these individuals. Over time, we expect this process to increase generational representation across all levels, including leadership positions. As of December 31, 2024, the Company’s generational representation consisted of 17% Baby Boomers (born 1945 to 1964), 37% Gen X-ers (born 1965 to 1980), 35% Millennials (born 1981 to 1996), and 10% Gen Z-ers (born 1997 to 2010). Management and the Board review leadership succession annually.
Recognition and appreciation
We host “Celebrate Great,” an active internal peer recognition platform enabling managers and employees to express appreciation and recognize their co-workers and teams. Throughout 2024, more than 3,700 e-cards were posted on Celebrate Great, with 32 individuals or teams receiving “Bravo” awards and 11 employees receiving “Standing Ovation” awards for their exceptional work. The Company celebrates employees achieving milestone anniversaries or upon retirement with a personalized yearbook and special gift.
Compensation, Benefits and Pay Equity
Offering competitive compensation and benefit programs is critical to attracting and retaining top talent in our highly competitive market areas. Employees are generally eligible for a base pay review at least once per year, as well as upon promotion or transfer. Our hiring practices prioritize pay transparency, with job postings disclosing the pay range minimum and maximum, as well as the applicable benefits package, and we do not request salary history from job applicants. We collaborate with a third party consultant periodically to evaluate hiring, promotion and other pay practices to ensure continued equity and fairness.
Incentive plan goals and results are aligned with strategic Company objectives and are approved by the Compensation Committee of the Board. Further alignment is achieved by having similar corporate performance metrics cascade through most executive, management, and employee annual incentive plans.
Employees working a minimum of 20 hours per week are eligible for most benefit plans, including a 401(k) Plan with an employer matching contribution, medical, dental and vision insurance, life and long-term disability insurance, public transit passes, paid parking and paid time off. Further, full-time employees enjoy up to 11 paid holidays each year and receive an annual floating holiday to be used at their discretion. Employees also accrue up to 12 days of paid sick time per year for personal use or to care for a family member. Both full-time and part-time employees accrue vacation time ranging from two and five weeks, dependent on factors such as position and tenure.
Employee Wellness and Wellbeing
Our corporate culture places a strong emphasis on the wellbeing of our employees, recognizing its pivotal role in cultivating a vibrant and productive workforce. To support holistic wellbeing, we offer a range of resources.
Through our Employee Assistance Program, employees receive counseling and referral services to address challenges both at work and at home. This includes mental health counseling, financial planning, basic legal advice and dependent/elder care referrals, all at no cost to them or their household members. Additional wellness benefits are available through the Company's medical insurance plans. Moreover, enrolled members can take advantage of mental health apps, weight loss and fitness programs, smoking cessation programs and various online resources, all provided at no extra cost.
To alleviate workplace stress and burnout, the Company hosts a "no meetings week" at the start of each quarter. This dedicated time allows managers and employees to engage in purposeful planning, catch up on tasks, and reduce stress. By incorporating these breaks, employees can participate in strategic planning, creative thinking, and collaborative efforts without the constraints of scheduled meetings, ultimately contributing to a more innovative and healthier work environment.
Community Involvement
As a community bank, we are committed to supporting the communities where we operate, and we actively encourage and support our employees to do the same. In 2022, the Company implemented an annual volunteer event, during which the Bank closes for half a day, providing employees with a paid opportunity to volunteer in teams at various community organizations within our operating footprint. Our 2024 volunteer day event involved over 550 employees volunteering approximately 1,665 hours to more than 60 organizations in Washington, Oregon and Idaho. To further facilitate community involvement, employees receive a minimum of eight additional hours of paid time off each year specifically to use for volunteer activities of their choice.
The Bank also participated in a 2024 EcoChallenge, where 41 teams of employees engaged in friendly competition by undertaking environmentally sustainable actions and practices. Challenges involved activities such as reducing waste, conserving energy and adopting eco-friendly lifestyle habits. The collective efforts of the EcoChallenge resulted in 21,887 actions, contributing to a heightened awareness of environmental responsibility, fostering a sense of community engagement, and reinforcing a shared commitment to sustainability.
ITEM 1A. RISK FACTORS
Investing in the Company’s common stock involves a high degree of risk. The material risks and uncertainties that management believes affect the Company are described below. Before you decide to invest, you should carefully review and consider the risks described below, together with all other information included in this Form 10-K and other reports and documents the Company files with the SEC. Any of the following risks, as well as risks that the Company does not know or currently deems immaterial, could have a material adverse effect on the Company’s business, reputation, financial condition, results of operations and growth prospects.
Market and Interest Rate Risks
The Company’s business is subject to interest rate risk, and fluctuations in interest rates or monetary policy may adversely affect the Company’s business, financial condition, results of operations and growth prospects.
Fluctuations in interest rates may negatively affect the Company’s business and weaken demand for some of its products. The Company’s earnings and cash flows are primarily dependent on net interest income, which is the difference between the interest income that the Company earns on interest earning assets such as loans and investment securities, and the interest expense that the Company pays on interest-bearing liabilities such as deposits and borrowings. Changes in interest rates also affect the Company’s ability to fund operations with customer deposits and the fair value of securities in the Company’s investment portfolio. Any change in general market interest rates, including changes in federal fiscal and monetary policies, could have a material adverse effect on the Company’s business, financial condition, results of operations and growth prospects. The Company’s interest earning assets and interest-bearing liabilities may react in different degrees to changes in market interest rates. Interest rates on some types of assets and liabilities may fluctuate prior to changes in broader market interest rates, while rates on other types of assets and liabilities may lag behind. The result of these changes to rates may cause differing spreads on interest earning assets and interest-bearing liabilities.
The Company could also be prevented from altering the interest rates charged on loans or from maintaining the interest rates offered on deposits and money market savings accounts due to “price” competition from other banks and financial institutions with which the Company competes. The Company does not know what market rates will be throughout 2025, including the frequency and significance with which the target range for the federal funds rate may be changed in 2025. If the Company fails to
offer interest at a sufficient level to keep its non-maturity interest-bearing deposits, core deposits may be reduced, which would require the Company to obtain funding in other ways or risk slowing future asset growth.
The Company could recognize additional losses on securities held in the Company’s securities portfolio, particularly if interest rates increase or economic and market conditions deteriorate.
Factors beyond the Company’s control can influence and cause potential adverse changes to the fair value of securities in the Company’s portfolio. These factors include, but are not limited to, changes in interest rates, rating agency downgrades or the Company’s own analysis of the value of the securities, defaults by the issuers or individual mortgagors with respect to the underlying securities and instability in the credit markets. The foregoing factors, as well as changing economic and market conditions or other factors, could cause write-downs and realized or unrealized losses in future periods and declines in other comprehensive income, which could have a material adverse effect on the Company’s business, financial condition, results of operations and growth prospects. The process for determining whether a write-down is required usually requires complex, subjective judgments, which could subsequently prove to have been wrong, about the future financial performance and liquidity of the issuer, the fair value of any collateral underlying the security and whether and the extent to which the principal and interest on the security will ultimately be paid in accordance with its payment terms. Decreases in the fair value of investment securities available for sale resulting from increases in interest rates could have an adverse effect on stockholders’ equity, specifically AOCI, which is increased or decreased by the amount of change in the estimated fair value of our securities available for sale, net of deferred income taxes. Increases in interest rates generally decrease the fair value of securities available for sale, adversely impacting stockholders’ equity. In recent periods, the company has realized losses on the sale of investment securities in connection with strategic balance sheet repositioning transactions. The Company could recognize impairment loss for any security that has declined in fair value below its amortized cost basis if management has the intent to sell the security, or if it is more likely than not that it will be required to sell the security before recovery of its amortized cost basis.
The Company cannot guarantee that its stock repurchase program will be fully implemented or that it will enhance long-term shareholder value.
On April 24, 2024, the Board approved the repurchase of up to 5% of the Company's outstanding common shares, or 1,734,492 shares. This stock repurchase program supersedes the previous stock repurchase program, authorized in March 2020, which allowed for the repurchase of up to 5% of the Company's outstanding common shares, or 1,799,054 shares. The number, timing and price of shares repurchased will depend on business and market conditions, regulatory requirements, availability of funds and other factors, including opportunities to deploy the Company's capital. The Company may, in its discretion, begin, suspend or terminate repurchases at any time prior to the stock repurchase program’s expiration, without any prior notice. Even if fully implemented, the stock repurchase program may not enhance long-term shareholder value.
Credit Risks
The Company’s business depends on its ability to manage credit risk.
The Company’s banking business requires it to manage credit risk; however, default risk may arise from events or circumstances that are difficult to detect, such as fraud, or difficult to predict, such as catastrophic events affecting certain industries. As a lender, the Company is exposed to the risk that its borrowers will be unable to repay their loans according to their terms, and that the collateral securing repayment of their loans, if any, may not be sufficient to ensure repayment. In addition, there are risks inherent in making any loan, including risks with respect to the period of time over which the loan may be repaid, proper loan underwriting, changes in economic and industry conditions and those inherent in dealing with specific borrowers, including the risk that a borrower may not provide information to the Company about its business in a timely manner, may present inaccurate or incomplete information to the Company or risks relating to the value of collateral.
To manage credit risk, the Company must maintain disciplined and prudent underwriting standards and ensure that the Company’s bankers follow those standards. The weakening of these standards for any reason, such as an attempt to attract higher yielding loans, a lack of discipline or diligence by the Company’s employees in underwriting and monitoring loans, the Company’s inability to adequately adapt policies and procedures to changes in economic or any other conditions affecting borrowers and the quality of the Company’s loan portfolio may result in loan defaults, foreclosures and charge-offs and may necessitate that the Company significantly increase its allowance for credit losses, each of which could adversely affect net income. As a result, the Company’s inability to successfully manage credit risk could have a material adverse effect on the Company’s business, financial condition, results of operations and growth prospects.
The Company’s high concentration of large loans to certain borrowers may increase the Company’s credit risk.
The Company has developed relationships with certain individuals and businesses that have resulted in a concentration of large loans to a small number of borrowers. As of December 31, 2024, the Company’s 10 largest borrowing relationships accounted for approximately 6.5% of the total loan portfolio. The Company has established an informal, internal limit on loans to one borrower, principal or guarantor, but the Company may, under certain circumstances, consider going above this internal limit in situations where management’s understanding of the industry, the borrower’s business and the credit quality of the borrower are commensurate with the increased size of the loan. Along with other risks inherent in these loans, such as the deterioration of the underlying businesses or property securing these loans, this high concentration of borrowers presents a risk to the Company’s lending operations. If any one of these borrowers becomes unable to repay its loan obligations as a result of business, economic or market conditions, the Company’s nonaccruing loans and provision for loan losses could increase significantly, which could have a material adverse effect on the Company’s business, financial condition, results of operations and growth prospects.
The Company’s allowance for credit losses may prove to be insufficient to absorb potential losses in its loan portfolio.
Lending money is a substantial part of our business. Every loan carries a certain risk that it will not be repaid in accordance with its terms or that any underlying collateral will not be sufficient to assure repayment. This risk is affected by, among other things:
•the cash flow of the borrower, guarantors and/or the project being financed;
•the changes and uncertainties as to the future value of the collateral, in the case of a collateralized loan;
•the character and creditworthiness of a particular borrower or guarantor;
•changes in economic and industry conditions; and
•the duration of the loan.
The ACL on loans is a valuation account that is deducted from the amortized cost of loans receivable to present the net amount expected to be collected. Loans are charged-off through the ACL on loans when management believes the uncollectibility of a loan balance is considered probable. Subsequent recoveries, if any, are recorded to the ACL on loans. The Company records the changes in the ACL on loans through earnings as a "Provision for (reversal of) credit losses" on the Consolidated Statements of Income.
The determination of the appropriate level of ACL on loans inherently involves a high degree of subjectivity and requires us to make significant estimates of current credit risks and future trends, all of which may undergo material changes. If our estimates are incorrect, the ACL on loans may not be sufficient to cover expected losses in our loan portfolio, resulting in the need for increases in our ACL on loans through the provision for credit losses. Management also recognizes that significant new growth in loan segments and new loan products can result in loans segments comprised of unseasoned loans that may not perform in a historical or projected manner and will increase the risk that our ACL on loans may be insufficient to absorb losses without significant additional provisions.
Deterioration in economic conditions affecting borrowers, new information regarding existing loans, identification of additional problem loans and other factors, both within and outside of our control, may require an increase in the ACL on loans. If current conditions in the housing and real estate markets weaken, we expect we will experience increased delinquencies and credit losses. Bank regulatory agencies also periodically review our ACL on loans and may require an increase in the provision for credit losses or the recognition of further loan charge-offs, based on their judgments about information available to them at the time of their examination. In addition, if charge-offs in future periods exceed the ACL on loans, we will need additional provisions to increase the ACL on loans. Any increases in the allowance for credit losses will result in a decrease in net income and, most likely, capital, and may have a material negative effect on our financial condition and results of operations.
A decline in the business and economic conditions in the Company’s market areas could have a material adverse effect on the Company’s business, financial condition, results of operations and growth prospects.
The Company’s business activities and credit exposure, including real estate collateral for many of its loans, are concentrated in the states of Washington, Oregon and Idaho, although the Company also pursues business opportunities nationally. Adverse economic developments in our market areas, among other things, could affect the volume of loan originations, increase the level of nonperforming assets, increase the rate of foreclosure losses on loans, reduce the value of the Company’s loans and affect the Company’s business, financial condition, results of operations and growth prospects. Any regional or local economic downturn that affects the Company’s market areas or existing or prospective borrowers or property values in such areas may affect the Company and the Company’s profitability more significantly and more adversely than the Company’s competitors whose operations are less geographically concentrated.
Negative changes in the economy affecting real estate values and liquidity, as well as environmental factors, could impair the value of collateral securing the Company’s real estate loans and result in loan and other losses.
At December 31, 2024, approximately 79.1% of the Company’s total loan portfolio was comprised of loans with real estate as the primary component of collateral. The repayment of such loans is highly dependent on the ability of the borrowers to meet their loan repayment obligations to us, which can be adversely affected by economic downturns and other factors. The market value of real estate can fluctuate significantly in a short period of time as a result of interest rates and market conditions in the area in which the real estate is located and some of these values have been negatively affected by the recent rise in prevailing interest rates. Additionally, the repayment of commercial real estate loans generally is dependent, in large part, on sufficient income from the properties securing the loans to cover operating expenses and debt service. Adverse changes affecting real estate values, including decreases in office occupancy due to the shift to remote and hybrid working environments following the COVID-19 pandemic, could increase the credit risk associated with the Company’s loan portfolio, significantly impair the value of property pledged as collateral on loans and affect the Company’s ability to sell the collateral upon foreclosure without a loss or additional losses or the Company’s ability to sell those loans on the secondary market. If real estate values decline, it is also more likely that the Company would be required to increase the Company’s allowance for credit losses, which would have a material adverse effect on the Company’s business, financial condition, results of operations and growth prospects.
Many of the Company’s loans are to commercial borrowers, which have a higher degree of risk than other types of loans.
Commercial and industrial loans represented 17.5% of the Company’s total loan portfolio at December 31, 2024. These loans can be larger in size and involve greater risks than other types of lending. Because payments on such loans are often dependent on the successful operation of the business involved, repayment is often more sensitive than other types of loans to the general business climate and economy. A challenging business and economic environment generally, or in certain specific industries, may increase the Company’s risk related to commercial loans. Cumulative effects of inflation, labor shortages or employee turnover, supply chain constraints and the threat of new tariffs, mass deportations and changes in tax regulations implemented by the new Presidential administration may adversely affect commercial and industrial loans, especially if general economic conditions worsen. The Company’s commercial and industrial loans are primarily made based on the identified cash flow of the
borrower and secondarily on the collateral underlying the loans. Most often, this collateral consists of accounts receivable, inventory and equipment. Inventory and equipment may depreciate over time, be difficult to appraise and fluctuate in value based on the success of the business and economic trends. If the cash flow from business operations is reduced, the borrower’s ability to repay the loan may be impaired. Due to the larger average size of each commercial loan as compared with other loans such as residential loans, as well as collateral that is generally less readily-marketable, losses recorded on a small number of commercial loans could have a material adverse effect on the Company’s business, financial condition, results of operations and growth prospects.
Nonperforming assets take significant time and resources to resolve and adversely affect the Company’s net interest income.
The Company’s nonperforming assets adversely affect net interest income in various ways. The Company does not record interest income on nonaccrual loans or foreclosed assets, thereby adversely affecting net income and returns on assets and equity. When the Company takes collateral in foreclosure and similar proceedings, the Company is required to mark the collateral to its then-fair market value, which may result in a loss. These nonperforming loans and foreclosed assets also increase the Company’s risk profile and the level of capital the Company’s regulators believe is appropriate for it to maintain in light of such risks. The resolution of nonperforming assets requires significant time commitments from management, which increase the Company’s loan administration costs and adversely affects its efficiency ratio and can be detrimental to the performance of their other responsibilities. If the Company experiences increases in nonperforming assets, net interest income may be negatively impacted and the Company’s loan administration costs could increase, each of which could have a material adverse effect on the Company’s business, financial condition, results of operations and growth prospects.
Liquidity and Funding Risks
Liquidity risks could affect the Company’s operations and jeopardize its business, financial condition, results of operations and growth prospects.
Liquidity is essential to the Company’s business. Generally, liquidity risk is the risk of being unable to fund obligations to creditors, including, in the case of financial institutions, obligations to depositors, as such obligations become due and/or fund the acquisition of assets, as they come due, and is inherent in the Company’s operations. An inability to raise funds through deposits, borrowings, the sale of loans or investment securities, and from other sources could have a substantial negative effect on our liquidity. The Company’s most important source of funds consists of customer deposits, which can decrease for a variety of reasons, including when customers perceive alternative investments, such as bonds, treasuries or stocks, as providing a better risk/return trade off. The Company’s future growth will largely depend on its ability to maintain and grow a strong deposit base.
Additionally, uninsured deposits have historically been viewed by the FDIC as less stable than insured deposits. According to statements made by the FDIC staff and the leadership of the federal banking agencies, customers with larger uninsured deposit account balances often are small- to mid-sized businesses that rely upon deposit funds for payment of operational expenses and, as a result, are more likely to closely monitor the financial condition and performance of their depository institutions. As a result, in the event of financial distress, uninsured depositors historically have been more likely to withdraw their deposits. If a significant portion of our deposits were to be withdrawn within a short period of time such that additional sources of funding would be required to meet withdrawal demands, the Company may be unable to obtain funding at favorable terms, which may have an adverse effect on our net interest margin. Moreover, obtaining adequate funding to meet our deposit obligations may be more challenging during periods of higher prevailing interest rates, such as the present period. Our ability to attract depositors during a time of actual or perceived distress or instability in the marketplace may be limited. Further, interest rates paid for borrowings generally exceed the interest rates paid on deposits. This spread may be exacerbated by higher prevailing interest rates. In addition, because our available for sale securities lose value when interest rates rise, after-tax proceeds resulting from the sale of such assets may be diminished during periods when interest rates are elevated. Under such circumstances, we may be required to access funding from sources such as the FRB’s discount window in order to manage our liquidity risk.
Other primary sources of funds consist of cash from operations, investment security maturities and sales and proceeds from the issuance and sale of the Company’s equity and debt securities to investors. Additional liquidity is provided by the ability to borrow from the FRB and the FHLB. The Company may also borrow from third party lenders from time to time. The Company’s access to funding sources in amounts adequate to finance or capitalize the Company’s activities or on terms that are acceptable to the Company could be impaired by factors that affect the Company directly or the financial services industry or economy in general, such as disruptions in the financial markets or negative views and expectations about the prospects for the financial services industry. Economic conditions and a loss of confidence in financial institutions may increase the Company’s cost of funding and limit access to certain customary sources of capital, including inter-bank borrowings and borrowings from the discount window of the FRB. Any decline in available funding could adversely impact the Company’s ability to continue to implement its strategic plan, including originating loans and investing in securities, or to fulfill obligations such as paying expenses, repaying borrowings or meeting deposit withdrawal demands, any of which could have a material adverse effect on the Company’s business, financial condition, results of operations and growth prospects.
The Company may not be able to maintain a strong core deposit base or other low cost funding sources.
The Company depends primarily on core deposits from its customers, which consist of noninterest demand deposits, interest bearing demand deposits, money market accounts, savings accounts and certificates of deposit as its primary source of funding for lending activities. The Company’s future growth will largely depend on its ability to maintain and grow this core deposit base. Deposit and account balances can decrease when customers perceive alternative investments, such as the stock market or real estate, as providing a better risk/return trade off. If customers move money out of bank deposit accounts and into investments (or
similar deposit products at other institutions that may provide a higher rate of return), the Company could lose a relatively low-cost source of funds, increasing funding costs and reducing net interest income. The Company supplements its core deposit funding with non-core, short-term funding sources, including brokered deposits, FHLB advances and borrowings from the FRB. If the Company is unable to pledge sufficient qualifying collateral to secure funding from the FHLB, it may lose access to this source of liquidity. If the Company is unable to access any of these types of funding sources or if its costs related to them increases, its liquidity and ability to support demand for loans could be materially adversely affected.
The Company’s liquidity is largely dependent on dividends from the Bank.
The Company is a legal entity separate and distinct from the Bank. A substantial portion of the Company’s cash flow, including cash flow to pay principal and interest on the Company’s debt, comes from dividends the Company receives from the Bank. Federal and state laws and regulations limit the amount of dividends that the Bank may pay to the Company. In the event the Bank is unable to pay dividends to the Company, it may not be able to service its debt, which could have a material adverse effect on the Company’s business, financial condition, results of operations and growth prospects.
The Company may need to raise additional capital in the future, and failure to maintain sufficient capital would adversely affect its business, financial condition, results of operations, growth prospects and ability to maintain regulatory compliance with capital requirements.
The Company faces significant capital and other regulatory requirements as a financial institution. The Company may need to raise additional capital in the future to provide sufficient capital resources and liquidity to meet its commitments and business needs, including possible acquisition financing. In addition, the Company, on a consolidated basis, and the Bank, on a stand-alone basis, must meet certain regulatory capital requirements and maintain sufficient liquidity. Regulatory capital requirements could increase from current levels, which could require the Company to raise additional capital or contract the Company’s operations. The Company’s ability to raise additional capital depends on conditions in the capital markets, economic conditions and a number of other factors, including investor perceptions regarding the banking industry, market conditions, governmental activities, the Company’s credit ratings, its ability to maintain a listing on Nasdaq and its financial condition and performance. Accordingly, the Company cannot provide assurances that it will be able to raise additional capital if needed or on terms acceptable to the Company. If the Company fails to maintain capital to meet regulatory requirements, or is unable to raise capital to meet its business needs, its business, financial condition, results of operations and growth prospects would be materially and adversely affected.
The Company may be adversely affected by changes in the actual or perceived soundness or condition of other financial institutions.
Financial services institutions that deal with each other are interconnected as a result of trading, investment, liquidity management, clearing, counterparty, reputational and other relationships. Concerns about, or a default by, one institution could lead to significant liquidity problems and losses or defaults by other institutions, as the commercial and financial soundness of many financial institutions is closely related as a result of these credit, trading, clearing and other relationships. Even the perceived lack of creditworthiness of, or questions about, a counterparty may lead to market-wide liquidity problems and losses or defaults by various institutions. For example, certain community banks experienced deposit outflows following the bank failures in 2023. This systemic risk may adversely affect financial intermediaries with which the Company interacts on a daily basis or key funding providers such as the FHLB, any of which could have a material adverse effect on the Company’s access to liquidity or otherwise have a material adverse effect on its business, financial condition, results of operations and growth prospects.
Operational, Strategic and Reputational Risks
The Company may not be successful in implementing its organic growth strategy, which could have a material adverse effect on the Company’s business, financial condition, results of operations and growth prospects.
Part of the Company’s business strategy is to focus on organic growth, which includes leveraging the Company’s business lines across the Company’s entire customer base, enhancing brand awareness and building the Company’s infrastructure. The Company may not be successful in generating organic growth if as a result of numerous factors, including delays in introducing and implementing new products and services and other impediments resulting from regulatory oversight or lack of qualified personnel at the Company’s office locations. In addition, the success of the Company’s organic growth strategy will depend on maintaining sufficient regulatory capital levels, the Company’s ability to raise additional capital to implement its business plan and on favorable economic conditions in the Company’s primary market areas. Failure to adequately manage the risks associated with the Company’s anticipated organic growth could have a material adverse effect on the Company’s business, financial condition, results of operations and growth prospects.
In addition to the Company’s organic growth strategy, it intends to expand business by acquiring other banks and financial services companies, but may not be successful in doing so, either because of an inability to find suitable acquisition candidates, constrained capital resources or otherwise.
While a key element of the Company’s business strategy is to grow the Company’s banking franchise and increase the Company’s market share through organic growth, the Company has historically supplemented its organic growth through acquisitions of other financial institutions. The Company intends to continue to take advantage of opportunities to acquire other financial institutions, whether in whole or in part, however, the Company may not be able to identify suitable acquisition targets, or may not succeed in seizing such opportunities when they arise or in integrating any such companies within the Company’s existing business framework following acquisition. In addition, even if suitable targets are identified, the Company expects to compete for such businesses with other potential bidders, some of which may have greater financial resources than the
Company, which may adversely affect the Company’s ability to make acquisitions at attractive prices. The Company’s ability to execute on acquisition opportunities may require the Company to raise additional capital and to increase the Company’s capital position to support the growth of the Company’s franchise. It will also depend on market conditions over which the Company has no control. Moreover, most acquisitions require the approval of the Company’s bank regulators, and the Company may not be able to obtain such approvals on acceptable terms, or at all. Acquiring other financial institutions involve risks commonly associated with acquisitions, including:
•potential exposure to unknown or contingent liabilities of the banks and businesses the Company acquires;
•exposure to potential asset and credit quality issues of the acquired bank or related business;
•difficulty and expense of integrating the operations, culture and personnel of banks and businesses the Company acquires, including higher than expected deposit attrition;
•potential disruption to the Company’s business;
•potential restrictions on the Company’s business resulting from the regulatory approval process;
•an inability to realize the expected revenue increases, costs savings, gains in market share or other anticipated benefits;
•potential diversion of the Company’s management’s time and attention; and
•the possible loss of key employees and customers of the banks and businesses the Company acquires.
The occurrence of fraudulent activity, breaches or failures of the Company’s information security controls or cybersecurity related incidents could have a material adverse effect on the Company’s business, financial condition, results of operations and growth prospects.
As a financial institution, the Company is susceptible to fraudulent activity, information security breaches and cybersecurity-related incidents that may be committed against the Company, its customers or third parties with whom it interacts, which may result in financial losses or increased costs to the Company or its customers, disclosure or misuse of the Company’s information or its customer information, misappropriation of assets, privacy breaches against the Company’s customers, litigation or damage to the Company’s reputation. Such fraudulent activity may take many forms, including check fraud, electronic fraud, wire fraud, phishing, social engineering and other dishonest acts. Information security breaches and cybersecurity-related incidents may include fraudulent or unauthorized access to systems used by the Company or its customers, denial or degradation of service attacks and malware or other cyber-attacks.
In recent periods, there continues to be a rise in electronic fraudulent activity, security breaches and cyber-attacks within the financial services industry, especially in the commercial banking sector, due to insider fraud or cyber criminals targeting commercial bank accounts and as a result of increasingly sophisticated methods of conducting cyber-attacks, including those employing artificial intelligence. Consistent with industry trends, the Company has also experienced an increase in attempted electronic fraudulent activity, security breaches and cybersecurity related incidents in recent periods. During 2024, the Company is not aware of having experienced any misappropriation, loss or other unauthorized disclosure of confidential or personally identifiable information having a material impact on the Company as a result of a direct cyber security breach or other act on the Bank; however, some of the Company’s customers and third party vendors may have been affected by such breaches, which could increase their risks of identity theft and other fraudulent activity that could involve customer accounts at the Bank.
Information pertaining to the Company and its customers is maintained, and transactions are executed, on networks and systems maintained by the Company and certain third party partners, such as the Company’s online banking, mobile banking, record-keeping or accounting systems. The secure maintenance and transmission of confidential information, as well as execution of transactions over these systems, are essential to protect the Company and the Company’s customers against fraud and security breaches and to maintain the confidence of the Company’s customers. Breaches of information security also may occur through intentional or unintentional acts by those having access to the Company’s systems or the confidential information of the Company’s customers, including employees. In addition, increases in criminal activity levels and sophistication, advances in computer capabilities, new discoveries, vulnerabilities in third party technologies (including browsers and operating systems) or other developments could result in a compromise or breach of the technology, processes and controls that the Company uses to prevent fraudulent transactions and to protect data about us, our customers and underlying transactions, as well as the technology used by our customers to access our systems. The Company’s third party partners’ inability to anticipate, or failure to adequately mitigate, breaches of security could result in a number of negative events, including losses to the Company or its customers, loss of business or customers, damage to the Company’s reputation, the incurrence of additional expenses, disruption to the Company’s business, additional regulatory scrutiny or penalties or the Company’s exposure to civil litigation and possible financial liability, any of which could have a material adverse effect on the Company’s business, financial condition, results of operations and growth prospects.
Issues with the use of artificial intelligence in our marketplace may result in reputational harm or liability, or could otherwise adversely affect the Company’s business.
Artificial intelligence, including generative artificial intelligence, is or may be enabled by or integrated into the Company’s products or those developed by its third party partners. As with many developing technologies, artificial intelligence presents risks and challenges that could affect its further development, adoption, and use, and therefore our business. Artificial intelligence algorithms may be flawed, for example datasets may contain biased information or otherwise be insufficient, and inappropriate or controversial data practices could impair the acceptance of artificial intelligence solutions and result in burdensome new regulations. If the analyses of those products incorporating artificial intelligence assist in producing for the Company or its third party partners are deficient, biased or inaccurate, the Company could be subject to competitive harm, potential legal liability and brand or reputational harm. The use of artificial intelligence may also present ethical issues. If the Company or its third party partners offer artificial intelligence enabled products that are controversial because of their purported or real impact on human rights, privacy, or other issues, the Company may experience competitive harm, potential legal liability and brand or reputational
harm. In addition, the Company expects that governments will continue to assess and implement new laws and regulations concerning the use of artificial intelligence, which may affect or impair the usability or efficiency of products and services and those developed by the Company’s third party partners.
The Company depends on information technology and telecommunications systems, and any systems failures, interruptions or data breaches involving these systems could adversely affect the Company’s operations and financial condition.
The Company’s business is highly dependent on the successful and uninterrupted functioning of its information technology and telecommunications systems, third party servicers, accounting systems, mobile and online banking platforms and financial intermediaries. The risks resulting from use of these systems result from a variety of factors, both internal and external. The Company is vulnerable to the impact of failures of its systems to operate as needed or intended. Such failures could include those resulting from human error, unexpected transaction volumes, intentional attacks or overall design or performance issues.
The Company outsources to third parties many of its major systems, such as data processing and mobile and online banking. The failure of these systems, or the termination of a third party software license or service agreement on which any of these systems is based, could interrupt the Company’s operations. Because the Company’s information technology and telecommunications systems interface with and depend on third party systems, the Company could experience service denials if demand for such services exceeds capacity or such third party systems fail or experience interruptions. A system failure or service denial could result in a deterioration of the Company’s ability to process loans or gather deposits and provide customer service, compromise the Company’s ability to operate effectively, result in potential noncompliance with applicable laws or regulations, damage the Company’s reputation, result in a loss of customer business or subject the Company to additional regulatory scrutiny and possible financial liability, any of which could have a material adverse effect on its business, financial condition, results of operations and growth prospects. In addition, failures of third parties to comply with applicable laws and regulations, or fraud or misconduct on the part of employees of any of these third parties, could disrupt the Company’s operations or adversely affect its reputation.
It may be difficult for the Company to replace some of its third party vendors, particularly vendors providing the Company’s core banking and information services, in a timely manner if they are unwilling or unable to provide the Company with these services in the future for any reason and even if the Company is able to replace them, it may be at higher cost or result in the loss of customers. Any such events could have a material adverse effect on the Company’s business, financial condition, results of operations and growth prospects.
The Company has a continuing need for technological change, and may not have the resources to effectively implement new technologies or may experience operational challenges when implementing new technologies.
The financial services industry is undergoing rapid technological changes with frequent introductions of new technology-driven products and services. In addition to better serving customers, the effective use of technology increases efficiency and enables financial institutions to reduce costs. The Company’s future success will depend in part upon its, and its third party partners’, ability to address the needs of the Company’s customers by using technology to provide products and services that will satisfy customer demands for convenience as well as to create additional efficiencies in operations. The widespread adoption of new technologies, including mobile banking services, artificial intelligence, digital assets and payment systems, could require the Company in the future to make substantial expenditures to modify or adapt the Company’s existing products and services as it grows and develops new products to satisfy the Company’s customers’ expectations, remain competitive and comply with regulatory rules and guidance. The Company may experience operational challenges as it implements these new technology enhancements, which could result in the Company not fully realizing the anticipated benefits from such new technology or require the Company to incur significant costs to remedy any such challenges in a timely manner. Many of the Company’s larger competitors have substantially greater resources to invest in technological improvements. As a result, they may be able to offer additional or superior products to those that the Company will be able to offer, which would put the Company at a competitive disadvantage. Accordingly, a risk exists that the Company will not be able to effectively implement new technology-driven products and services or be successful in marketing such products and services to the Company’s customers.
In addition, the implementation of technological changes and upgrades to maintain current systems and integrate new ones may also cause service interruptions, transaction processing errors and system conversion delays and may cause the Company to fail to comply with applicable laws. The Company expects that new technologies and business processes applicable to the financial services industry will continue to emerge, and these new technologies and business processes may be better than those the Company currently uses. Because the pace of technological change is high and the Company’s industry is intensely competitive, it may not be able to sustain the Company’s investment in new technology as critical systems and applications become obsolete or as better ones become available. A failure to successfully keep pace with technological change affecting the financial services industry and failure to avoid interruptions, errors and delays could have a material adverse effect on the Company’s business, financial condition, results of operations and growth prospects.
The Company’s use of third party vendors and its other ongoing third party business relationships is subject to increasing regulatory requirements and attention.
The Company’s use of third party vendors for certain information systems is subject to increasingly demanding regulatory requirements and attention by the Company’s federal bank regulators. Recent regulations require the Company to enhance its due diligence, ongoing monitoring and control over the Company’s third party vendors and other ongoing third party business relationships. In certain cases, the Company may be required to renegotiate the Company’s agreements with these vendors to meet these enhanced requirements, which could increase costs. The Company expects that regulators will hold the Company responsible for deficiencies in oversight and control of its third party relationships and in the performance of the parties with
which the Company has these relationships. As a result, if the Company’s regulators conclude that it has not exercised adequate oversight and control over the Company’s third party vendors or other ongoing third party business relationships or that such third parties have not performed appropriately, the Company could be subject to enforcement actions, including civil money penalties or other administrative or judicial penalties or fines, as well as requirements for customer remediation, any of which could have a material adverse effect on the Company’s business, financial condition, results of operations and growth prospects.
The Company is highly dependent on its management team and employees, and the loss of any of these individuals, or the inability to attract and retain qualified personnel, could harm the Company’s ability to implement its strategic plan and impair the Company’s relationships with customers.
The Company’s success is dependent, to a large degree, upon the continued service and skills of the Company’s executive management team and its employees. The loss of any of the members of the Company’s executive management team or any other key personnel, including successful individuals employed by banks or other businesses that the Company may acquire, to a new or existing competitor or otherwise, could have an adverse impact on the Company’s ability to retain valuable relationships and some of its customers could choose to use the services of a competitor instead of the Company’s services. As such, the Company needs to continue to attract and retain key personnel and to recruit qualified individuals who fit the Company’s culture to succeed existing key personnel and ensure the continued growth and successful operation of the Company’s business. Leadership changes may occur from time to time, and the Company cannot predict whether significant retirements or resignations will occur or whether the Company will be able to recruit additional qualified personnel.
Competition for high quality personnel is strong and the Company may not be successful in attracting or retaining the personnel it requires, and means the cost of hiring, incentivizing and retaining skilled personnel may continue to increase. In particular, many of the Company’s competitors are significantly larger with greater financial resources and may be able to offer more attractive compensation packages and broader career opportunities. Additionally, the Company may incur significant expenses and expend significant time and resources on training, integration, and business development before the Company is able to determine whether a new employee will be profitable or effective in their role. The loss of the services of any senior executive or other key personnel, the inability to recruit and retain qualified personnel in the future or the failure to develop and implement a viable succession plan could have a material adverse effect on the Company’s business, financial condition, results of operations and growth prospects.
The Company faces intense competition from other banks and non-bank financial services companies that could hurt its business.
The Company competes with national commercial banks, regional banks, private banks, mortgage companies, online lenders, savings banks, credit unions, non-bank financial services companies and other financial institutions, including investment advisory and wealth management firms, Fintech companies and digital asset service providers and securities brokerage firms, operating within or near the areas the Company serves. Many of the Company’s non-bank competitors are not subject to the same extensive regulations that govern the Company’s activities and may have greater flexibility in competing for business. The financial services industry could become even more competitive as a result of legislative, regulatory and technological changes and continued consolidation.
While the Company does not offer products relating to digital assets, including cryptocurrencies, stablecoins and other similar assets, there has been a significant increase in digital asset adoption globally over the past several years. Certain characteristics of digital asset transactions, such as the speed with which such transactions can be conducted, the ability to transact without the involvement of regulated intermediaries, the ability to engage in transactions across multiple jurisdictions, and the anonymous nature of the transactions, are appealing to certain consumers notwithstanding the various risks posed by such transactions. Accordingly, digital asset service providers—which, at present are not subject to the same degree of scrutiny and oversight as banking organizations and other financial institutions—are becoming active competitors to more traditional financial institutions. The process of eliminating banks as intermediaries, known as “disintermediation,” could result in the loss of fee income, as well as the loss of customer deposits and the related income generated from using those deposits to fund loans and investment securities. The loss of these revenue streams and the lower cost deposits as a source of funds could have a material adverse effect on the Company’s business, financial condition, results of operations and growth prospects.
The Company’s dividend policy may change.
Although the Company has historically paid dividends to its shareholders and currently intends to maintain or increase its dividend levels in future quarters, the Company has no obligation to continue doing so and may change its dividend policy at any time without notice to the Company’s shareholders. Holders of the Company’s common shares are only entitled to receive such cash dividends as the Board, in its discretion, may declare out of funds legally available for such payments. Further, consistent with the Company’s strategic plans, growth initiatives, capital availability, projected liquidity needs, and other factors, the Company has made, and will continue to make, capital management decisions and policies that could adversely impact the amount of dividends paid to the Company’s common shareholders.
The Company’s ability to declare and pay dividends is also dependent on federal regulatory considerations, including guidelines of the Federal Reserve regarding capital adequacy and dividends. It is the policy of the Federal Reserve that bank holding companies should generally pay dividends on capital stock only out of earnings, and only if prospective earnings retention is consistent with the organization’s expected future needs, asset quality and financial condition. The Company is a separate and distinct legal entity from its subsidiaries, including the Bank. The Company receives substantially all of its revenue from dividends from the Bank, which it uses as the principal source of funds to pay dividends. Various federal and state laws and regulations limit the amount of dividends that the Bank may pay to the Company. If the Bank does not receive regulatory approval or if its
earnings are not sufficient to make dividend payments to the Company while maintaining adequate capital levels, the Company’s ability to pay dividends could be materially and adversely impacted.
Future issuances of common stock could result in dilution, which could cause the Company’s common stock price to decline.
The Company is generally not restricted from issuing additional shares of common stock up to the amount authorized in its Articles of Incorporation. Currently, there are 50,000,000 shares of common stock authorized in the Company’s Articles of Incorporation, which may be increased by a vote of the holders of a majority of the Company’s shares of common stock. The Company may issue additional shares of common stock in the future pursuant to current or future equity compensation plans, upon conversions of preferred stock or debt, or in connection with future acquisitions or financings. If the Company chooses to raise capital by selling shares of common stock for any reason, the issuance would have a dilutive effect on the holders of the Company’s common stock and could have a material negative effect on the market price of the Company’s common stock.
The Company may issue shares of preferred stock in the future, which could make it difficult for another company to acquire the Company or could otherwise adversely affect holders of the Company’s common stock, which could depress the price of the Company’s common stock.
Although there are currently no shares of the Company’s preferred stock issued and outstanding, the Company’s Articles of Incorporation authorize it to issue up to 2,500,000 shares of one or more series of preferred stock. The Board also has the power, without shareholder approval, to set the terms of any series of preferred stock that may be issued, including voting rights, dividend rights, preferences over the Company’s common shares with respect to dividends or in the event of a dissolution, liquidation or winding up, and other terms. If the Company issues preferred stock in the future that has a preference over the Company’s common stock with respect to the payment of dividends or upon the Company’s liquidation, dissolution or winding up, or if the Company issues preferred stock with voting rights that dilute the voting power of the Company’s common stock, the rights of the holders of the Company’s common stock or the market price of its common stock could be adversely affected. In addition, the ability of the Board to issue shares of preferred stock without any action on the part of the Company’s shareholders may impede a takeover of the Company and prevent a transaction perceived to be favorable to the Company’s shareholders.
The Company’s business and operations may be adversely affected by weak economic conditions and global trade.
The Company’s businesses and operations are sensitive to general business and economic conditions. If the U.S. economy weakens, the Company’s growth and profitability from its lending, deposit and investment operations could be constrained. Uncertainty about the federal fiscal policymaking process, the medium- and long-term fiscal outlook of the federal government, potential imposition of tariffs and changes in future tax rates is a concern for businesses, consumers and investors. In addition, economic conditions in foreign countries and weakening global trade due to increased anti-globalization sentiment and tariff activity could affect the stability of global financial markets, which could hinder the economic growth of the U.S. Adverse economic conditions and government policy responses to such conditions could have a material adverse effect on the Company’s business, financial condition, results of operations and growth prospects.
Severe weather, natural disasters, pandemics, acts of war or terrorism or other adverse external events could significantly impact the Company’s business.
Severe weather, natural disasters, effects of climate change, widespread disease or pandemics, acts of war or terrorism, civil unrest or other adverse external events could have a significant impact on the Company’s ability to conduct business. In addition, such events could affect the stability of the Company’s deposit base, impair the ability of borrowers to repay outstanding loans, impair the value of collateral securing loans, cause significant property damage, result in loss of revenue or cause the Company to incur additional expenses. The occurrence of any of these events in the future could have a material adverse effect on the Company’s business, financial condition, results of operations and growth prospects.
Legal, Accounting and Compliance Risks
The Company’s risk management framework may not be effective in mitigating risks or losses to the Company.
The Company’s risk management framework is comprised of various processes, systems and strategies, and is designed to manage the types of risk to which the Company is subject, including, among others, credit, market, liquidity, interest rate and compliance risk. The Company’s risk management framework also includes financial or other modeling methodologies that involve management assumptions and judgment. The Company’s risk management framework may not be effective under all circumstances, and may not adequately mitigate any risk or loss. If the Company’s framework is not effective, the Company could suffer unexpected losses and its business, reputation, financial condition, results of operations and growth prospects could be materially and adversely affected. The Company may also be subject to potentially adverse regulatory consequences.
The Company’s accounting estimates and risk management processes and controls rely on analytical and forecasting techniques and models and assumptions, which may not accurately predict future events.
The Company’s accounting policies and methods are fundamental to the way it records and reports its financial condition and results of operations. Management must exercise judgment in selecting and applying many of these accounting policies and methods so they comply with GAAP and reflect management’s judgment of the most appropriate manner to report the Company’s financial condition and results of operations. In some cases, management must select the accounting policy or method to apply from two or more alternatives, any of which may be reasonable under the circumstances, yet which may result in the Company’s reporting materially different results than would have been reported under a different alternative. Certain accounting policies are critical to presenting the Company’s financial condition and results of operations. They require management to make difficult, subjective or complex judgments about matters that are uncertain. Materially different amounts
could be reported under different conditions or using different assumptions or estimates. If the Company’s underlying assumptions or estimates prove to be incorrect, it could have a material adverse effect on its business, financial condition, results of operations and growth prospects.
The Company’s risk management processes, internal controls, disclosure controls and corporate governance policies and procedures are based in part on certain assumptions and can provide only reasonable (not absolute) assurances that the objectives of the system are met. Any failure or circumvention of the Company’s controls, processes and procedures or failure to comply with applicable regulations could necessitate changes in those controls, processes and procedures, which may increase the Company’s compliance costs, divert management attention from its business or subject the Company to regulatory enforcement actions and increased regulatory scrutiny. Any of these could have a material adverse effect on the Company’s business, financial condition, results of operations and growth prospects.
Changes in accounting policies or standards could materially impact the Company’s financial statements.
From time to time, FASB, PCAOB or the SEC may change the financial accounting and reporting standards that govern the preparation of the Company’s financial statements. Such changes may result in the Company becoming subject to new or changing accounting and reporting standards. In addition, the agencies and other entities that interpret the accounting standards (such as banking regulators or outside auditors) may change their interpretations or positions on how these standards should be applied. In addition, trends in financial and business reporting, including environmental, social and governance related disclosures, could require the Company to incur additional reporting expense. These changes may be beyond the Company’s control, can be hard to predict and can materially impact how the Company records and reports its financial condition and results of operations. In some cases, the Company could be required to apply a new or revised standard retroactively, or apply an existing standard differently, in each case resulting in the Company’s needing to revise or restate prior period financial statements.
The obligations associated with being a public company require significant resources and management attention, which divert time and attention from the Company’s business operations.
As a public company, the Company is subject to the reporting requirements of the Exchange Act and SOX. The Exchange Act requires, among other things, that the Company file annual, quarterly and current reports with respect to its business and financial condition with the SEC. SOX requires, among other things, that the Company establish and maintain effective internal controls and procedures for financial reporting. Compliance with these reporting requirements and other rules and regulations, including periodic revisions to and additional rules and regulations of the SEC, could increase the Company’s legal and financial compliance costs and make some activities more time consuming and costly. Further, the need to maintain the corporate infrastructure demanded of a public company is expensive and may divert management’s attention from implementing the Company’s strategic plan, which could prevent the Company from successfully implementing the Company’s growth initiatives and improving its business, results of operations and financial condition.
The financial reporting resources the Company has put in place may not be sufficient to ensure the accuracy of the additional information the Company is required to disclose as a publicly listed company.
As a public company, the Company is subject to heightened financial reporting standards under GAAP and SEC rules, including extensive levels of disclosure. Complying with these standards requires consistent monitoring of and periodic enhancements to the design and operation of the Company’s internal control over financial reporting as well as additional financial reporting and accounting staff with appropriate training and experience in GAAP and SEC rules and regulations. If the Company is unable to meet the demands required of the Company as a public company, the Company may be unable to report its financial results accurately, or report them within the timeframes required by law or stock exchange regulations and could be subject to sanctions or investigations by the SEC or other regulatory authorities. If material weaknesses or other deficiencies occur, the Company’s ability to report its financial results accurately and timely could be impaired, which could result in late filings of the Company’s annual and quarterly reports under the Exchange Act, restatements of its consolidated financial statements, a decline in stock price, suspension or delisting of the Company’s common stock, and could have a material adverse effect on the Company’s business, financial condition, results of operations and growth prospects. Even if the Company is able to report its financial statements accurately and in a timely manner, any disclosure of material weaknesses in the Company’s future filings with the SEC could cause the Company’s reputation to be harmed and the Company’s stock price to decline significantly.
Litigation and regulatory actions, including possible enforcement actions, could subject the Company to significant fines, penalties, judgments or other requirements resulting in increased expenses or restrictions on the Company’s business.
The Company’s business is subject to increased litigation and regulatory risks because of a number of factors, including the highly regulated nature of the financial services industry and the focus of state and federal prosecutors on banks and the financial services industry generally. In the normal course of business, from time to time, the Company has in the past and may in the future be named as a defendant in various legal actions, including arbitrations, class actions and other litigation, arising in connection with the Company’s current or prior business activities. Legal actions could include claims for substantial compensatory or punitive damages or claims for indeterminate amounts of damages. The Company may also, from time to time, be the subject of subpoenas, requests for information, reviews, investigations and proceedings (both formal and informal) by governmental agencies regarding the Company’s current or prior business activities. Any such legal or regulatory actions may subject the Company to substantial compensatory or punitive damages, significant fines, penalties, obligations to change the Company’s business practices or other requirements resulting in increased expenses, diminished income and damage to the Company’s reputation. The Company’s involvement in any such matters, whether tangential or otherwise and even if the matters are ultimately determined in the Company’s favor, could also cause significant harm to the Company’s reputation and divert
management attention from the operation of the Company’s business. Further, any settlement, enforcement action or adverse judgment in connection with any formal or informal proceeding or investigation by government agencies may result in litigation, investigations or proceedings as other litigants and government agencies begin independent reviews of the same activities. As a result, the outcome of legal and regulatory actions could have a material adverse effect on the Company’s business, reputation, financial condition, results of operations and growth prospects.
The Company is subject to extensive regulation, and the regulatory framework that applies to the Company, together with any future legislative or regulatory changes, may significantly affect its operations.
The banking industry is highly regulated and supervised under both federal and state laws and regulations that are intended primarily for the protection of depositors, customers, the federal deposit insurance fund and the banking system as a whole, and not for the protection of the Company’s shareholders. The Company is subject to supervision and regulation by the Federal Reserve, and the Bank is subject to supervision and regulation by the FDIC and the DFI. The laws and regulations applicable to the Company govern a variety of matters, including permissible types, amounts and terms of loans and investments the Company may make, the maximum interest rate that may be charged, the types of deposits the Company may accept and the amount of reserves the Company must hold on such deposits, maintenance of adequate capital and liquidity, changes in the control of the Company and the Bank, restrictions on dividends and the establishment of new offices. The Company must obtain approval from its regulators before engaging in certain activities, and there is the risk that such approvals may not be obtained, either in a timely manner or at all. The Company’s regulators also have the ability to compel it to take certain actions, or restrict it from taking certain actions, such as actions that the Company’s regulators deem to constitute an unsafe or unsound banking practice. The Company’s failure to comply with any applicable laws or regulations, or regulatory policies and interpretations of such laws and regulations, could result in the imposition of enforcement actions or sanctions by regulatory agencies, civil money penalties or damage to the Company’s reputation, all of which could have a material adverse effect on its business, financial condition, results of operations and growth prospects.
While the Company endeavors to maintain safe banking practices and controls beyond the regulatory requirements applicable to the Company, its internal controls may not match those of larger banking institutions that are subject to increased regulatory oversight. Financial institutions generally have also been subjected to increased scrutiny from regulatory authorities, which has resulted, and may continue to result in, increased costs of doing business, and may in the future, result in decreased revenues and net income, reduce the Company’s ability to compete effectively, to attract and retain customers, or make it less attractive for the Company to continue providing certain products and services. Any future changes in federal and state laws and regulations, as well as the interpretation and implementation of such laws and regulations, could affect the Company in substantial and unpredictable ways, including those listed above or other ways that could have a material adverse effect on the Company’s business, financial condition, results of operations and growth prospects.
There is uncertainty surrounding potential legal, regulatory and policy changes by new presidential administrations in the United States that may directly affect financial institutions and the global economy.
Changes in federal policy and at regulatory agencies occur over time through policy and personnel changes following elections and changes in federal administration, including the change in the presidential administration which occurred in January 2025. These changes typically impact the level of oversight and focus on the financial services industry. The nature, timing and economic and political effects of potential changes to the current legal and regulatory framework affecting financial institutions remain highly uncertain, and may take time to be implemented. Uncertainty surrounding future changes may adversely affect our operating environment and therefore our business, financial condition, results of operations and growth prospects.
Banking regulators periodically examine the Company’s business, and the Company may be required to remediate adverse examination findings.
The Federal Reserve, FDIC and DFI periodically examine the Company and the Bank, including their operations and compliance with laws and regulations. If, as a result of an examination, a banking agency were to determine that the Company’s financial condition, capital resources, asset quality, asset concentrations, earnings prospects, management, liquidity, sensitivity to market risk or other aspects of any of the Company’s operations had become unsatisfactory, or that the Company was in violation of any law or regulation, they may take a number of different remedial actions as they deem appropriate. These actions include the power to enjoin “unsafe or unsound” practices, to require affirmative action to correct any conditions resulting from any violation or practice, to issue an administrative order that can be judicially enforced, to direct an increase in the Company’s capital, to restrict the Company’s growth, to assess civil monetary penalties, to fine or remove officers and directors and, if it is concluded that such conditions cannot be corrected or there is an imminent risk of loss to depositors, to terminate the Company’s deposit insurance and place the Company into receivership or conservatorship. Any regulatory action against the Company could have a material adverse effect on its business, reputation, financial condition, results of operations and growth prospects.
Regulations relating to privacy, information security and data protection could increase the Company’s costs, affect or limit how the Company collects and use personal information and adversely affect its business opportunities.
The Company is subject to various privacy, information security and data protection laws, including requirements concerning security breach notification, and the Company could be negatively affected by these laws. Various state and federal banking regulators and states have also enacted data security breach notification requirements with varying levels of individual, consumer, regulatory or law enforcement notification in certain circumstances in the event of a security breach. Legislators and regulators are also increasingly adopting or revising privacy, information security and data protection laws, including with respect to the use of artificial intelligence by financial institutions and their service providers, that potentially could have a significant impact on the Company’s current and planned privacy, data protection and information security-related practices, the Company’s collection, use, sharing, retention and safeguarding of consumer or employee information and some of the Company’s current or
planned business activities. This could also increase the Company’s costs of compliance and business operations and could reduce income from certain business initiatives.
The Federal Reserve may require the Company to commit capital resources to support the Bank.
A bank holding company is required by law to act as a source of financial and managerial strength to a subsidiary bank and to commit resources to support such subsidiary bank. Under the “source of strength” doctrine, the Federal Reserve may require a bank holding company to make capital injections into a troubled subsidiary bank and may charge the bank holding company with engaging in unsafe and unsound practices for failure to commit resources to a subsidiary bank. A capital injection may be required at times when the holding company may not have the resources to provide it and therefore may be required to borrow the funds or raise capital, which could result in a material adverse effect on its business, financial condition, results of operations and growth prospects, and could negatively impact the price of its common stock.
The level of the Company’s commercial real estate portfolio may subject the Company to heightened regulatory scrutiny.
The federal banking regulators have issued the Concentrations in Commercial Real Estate Lending, Sound Risk Management Practices guidance, or CRE Guidance, which provides supervisory criteria, including the following numerical indicators, to assist bank examiners in identifying banks with potentially significant commercial real estate loan concentrations that may warrant greater supervisory scrutiny: (i) commercial real estate loans exceeding 300% of capital and increasing 50% or more in the preceding three years; or (ii) construction and land development loans exceeding 100% of capital. The CRE Guidance does not limit the Bank’s levels of commercial real estate lending activities, but rather, guides institutions in developing risk management practices and levels of capital that are commensurate with the level and nature of their commercial real estate concentrations. The federal bank agencies expect FDIC-insured institutions to maintain underwriting discipline and exercise prudent risk-management practices to identify, measure, monitor, and manage the risks arising from CRE lending. In addition, FDIC-insured institutions must maintain capital commensurate with the level and nature of their CRE concentration risk. As of December 31, 2024, the Bank did not exceed these guidelines.
If the goodwill that the Company recorded in connection with the Company’s recent acquisitions becomes impaired, it could have a negative impact on its financial condition and results of operations.
As of December 31, 2024, the Company had goodwill of $240.9 million, or 27.9% of the Company’s total stockholders’ equity. The excess purchase price over the fair value of net assets acquired in certain mergers and acquisitions, or goodwill, is evaluated for impairment at least annually and on an interim basis if specific events suggest potential impairment. In testing for impairment, the Company conducts a qualitative assessment, and also estimates the fair value of net assets based on analyses of its market value, discounted cash flows and peer values. Consequently, the determination of the fair value of goodwill is sensitive to market-based economics and other key assumptions. Variability in market conditions or in key assumptions could result in impairment of goodwill, which is recorded as a non-cash adjustment to income. An impairment of goodwill could have a material adverse effect on the Company’s business, financial condition, results of operations and growth prospects.
ITEM 1B. UNRESOLVED STAFF COMMENTS
The Company has no unresolved staff comments from the SEC as it relates to the Company's financial information as reported in this Form 10-K.
ITEM 1C. CYBERSECURITY
Risk Management and Strategy
Enterprise Risk Management and Technology Risk Management. The Company's Enterprise Risk Management program and team plays a pivotal role in overseeing the organization's risk posture, specifically focusing on the implementation of a holistic risk management program for overseeing the assessment and appropriate control of information and cybersecurity risks. Annually, the Information and Cyber Security Policy and Program and Risk Assessments are presented for approval to the Board to ensure the program is representative and supportive of the Bank’s risk appetite and security testing expectations. Risks identified are subject to rigorous controls, ensuring both design and operational effectiveness and adherence to regulatory requirements. Instances where a risk is identified as inadequately controlled are promptly reported to Management requiring formal remediation activities that are tracked and reported to the Risk and Technology Committee of the Board, until measures are implemented to reduce the risk to an acceptable level
Identification of risks is a multifaceted process, encompassing diverse activities such as the execution of formal risk assessments, as described above, management self-disclosures, monitoring of regulatory and interagency authorities, engagement with professional and industry forums, internal and external audits, collaboration with third-party professional services, policy reviews and walkthroughs, adherence to best practice frameworks, leveraging subject matter expertise and industry experience, and maintaining a collaborative relationship with third party service providers/vendors. The dedicated Technology Risk Management team operates a continuous risk management framework, utilizing information gathered daily, weekly, monthly, quarterly and annually to provide insights into the state of controlled risk within the organization. Security testing and assurance activities are performed internally and are outsourced to independent audit and security firms based on factors such as resource capacity, subject matter expertise, regulatory requirements, and the prevailing rate and condition of risk.
Daily operational activities are in place to ensure the achievement and implementation of security requirements, including the management of the Bank’s security architecture, monitoring for potential security events or incidents, and the reporting and
response to detected threats in our technology environments. The Information and Cyber Security Policy and Program establishes the additional policies and standards the Bank is required to implement in support of these practices and processes. Additionally, we maintain a compliant and comprehensive Security Incident Response Plan, incorporating accessible resources such as insurance providers, digital and cyber forensic experts and law enforcement, along with documentation of regulatory notification requirements. Our practices are interdependent with third party vendors, and we collaborate appropriately with these partners on notification and investigation processes to ensure complete visibility into security risks and events.
From time-to-time, we have identified cybersecurity threats that require us to make changes to our processes and to implement additional safeguards. While none of these identified threats or incidents have materially affected us, it is possible that threats and incidents we identify in the future could have a material adverse effect on our business strategy, reputation, results of operations and financial condition. During the reporting period, the Company had not experienced any material cybersecurity events or incidents. Although third party service providers that the Bank engages have encountered cybersecurity events or incidents during the year ended December 31, 2024, the Bank’s investigation of each event or incident has shown that these occurrences have not resulted in a material impact on our systems, computing environments, customers, or data.
Governance
Board Oversight: The Board provides active oversight of cybersecurity threats in accordance with the Board-approved Information and Cyber Security Policy and Program. These policies and programs aim to achieve a controlled risk environment while meeting regulatory, legislative, and compliance requirements, including but not limited to the Gramm-Leach-Bliley Act (GLBA), Health Insurance Portability and Accountability Act (HIPAA), Information Technology Sarbanes-Oxley Act (IT SOX) Compliance, and Payment Card Industry Data Security Standard (PCI-DSS) Compliance.
Direct oversight of information and cybersecurity risks is delegated to the Risk and Technology Committee of the Board. The Risk and Technology Committee meets at least quarterly and receives reports detailing current risks, maturity and functioning of associated processes and controls, and emerging or anticipated risks and threats. Additionally, the Risk and Technology Committee Chair provides a verbal summarized report to the full Board following each quarterly meeting, and as needed on an interim basis to address developing risk. All Risk and Technology Committee reports are available to the full Board for review. In the event critical matters arise between scheduled meetings, the Chief Risk Officer promptly notifies the Board and Risk and Technology Committee.
To further ensure independence and effectiveness, the Board has delegated authority for the Information and Cybersecurity Policy and Program, including the referenced reports, to the Technology Risk Management Director. This position fulfills the role and responsibilities of a Chief Information Security Officer and reports to the Chief Risk Officer who in turn reports independently to the Chair of the Risk and Technology Committee. Additional layers of oversight are integrated into the program through the Director of Internal Audit, who conducts independent audits of critical information technology and cybersecurity activities. The results of these audits are reported to the Board's Audit and Finance Committee, providing an extra layer of assurance and accountability. The Director of Internal Audit reports independently to the Chair of the Board's Audit and Finance Committee.
Management's Role in Assessing and Managing Cybersecurity Risks. Management's role in assessing and managing material risks from cybersecurity threats is integral to the Company's governance framework. As discussed above, the Information and Cyber Security Policy and Program outline specific roles and responsibilities delegated to management and the Enterprise Risk Management Program, which includes the Technology Risk Management team, and responsibilities assigned to various employees and the Risk and Technology Committee.
The Technology Risk Management Director, a seasoned information and cyber security expert with significant experience in financial institutions, oversees the Technology Risk Management function. This expert conducts comprehensive assessments of cybersecurity risks inherent in the industry and the Company's business activities, evaluating controls implemented to address identified risks.
The Technology Risk Management Director is responsible for maintaining the Company's information and cyber security risk management framework. This framework establishes standards and processes for the continuous assessment of material cybersecurity risks, covering identification, measurement, mitigation activities, monitoring and reporting of the risk posture at any given time. Additionally, the Director ensures oversight and compliance with the Security Incident Response Plan, providing guidance during security incidents, whether within the Company or involving service provider/vendor engagements.
The Company’s information technology department, including a dedicated security operations group, plays a crucial role in implementing practices aligned with the Information and Cyber Security Policy and Program requirements. Responsibilities include the maintenance and monitoring of systems, network(s), and application access and error logs, identification of unauthorized access attempts, adherence to access controls standards, configuration management, and the implementation of controls to mitigate risks related to information availability, integrity, and confidentiality.
Business activities, products, and services are managed by experts in their respective fields, with employees receiving training to detect and prevent material cybersecurity threats. Business leaders are expected to understand specific threats within their areas of responsibility and adhere to established processes and standards to control such threats.
To facilitate a transparent and collaborative approach to managing cybersecurity risk, an executive management level committee has been established. Chaired by the Chief Risk Officer and administered by the Technology and Risk Management Director, the committee ensures continual awareness of the information and cybersecurity risk posture, emerging threats, known threat actors, and vulnerabilities. Its purpose is to foster a security culture within the Company through active participation in planning and managing threat and security risk activities.
All committee activities are reported to the Risk and Technology Committee through committee minutes and formal activity reports provided by the Technology and Risk Management Director. The Risk and Technology Committee provides similar reports to the full Board quarterly, as well as on an as-needed basis. Results of cybersecurity-related audits are also reported to the Board's Audit and Finance Committee.
ITEM 2. PROPERTIES
The main office of the Company and the Bank is located at 201 Fifth Avenue SW, in downtown Olympia, Washington. In addition to this main office, which includes a full-service banking office, the Company has three administrative office locations in Tacoma, Everett and Burlington, Washington. The Bank's branch network at December 31, 2024 was comprised of 50 branches located throughout Washington, Oregon and Idaho. The Company leases 24 properties and owns 29 properties at December 31, 2024. In the opinion of management, all properties are adequately covered by insurance, are in good state of repair and are adequate to meet our present and immediately foreseeable needs.
ITEM 3. LEGAL PROCEEDINGS
Neither the Company nor any of its subsidiaries is a party, and no property of these entities is subject, to any material pending legal proceedings, other than ordinary routine litigation incidental to their businesses.
ITEM 4. MINE SAFETY DISCLOSURES
Not applicable.
PART II
ITEM 5. MARKET FOR THE REGISTRANT'S COMMON EQUITY, RELATED STOCKHOLDER MATTERS AND ISSUER PURCHASES OF EQUITY SECURITIES
Market Information
Our common stock is traded on the Nasdaq Global Select Market under the symbol "HFWA".
Shareholders
At February 18, 2025, we had approximately 1,039 shareholders of record (which does not include the number of beneficial owners of stock in nominee or street name through various brokerage firms).
Dividends
The Company has historically paid cash dividends to its common shareholders. On January 22, 2025, the Board declared a regular quarterly dividend of $0.24 per common share payable on February 20, 2025 to shareholders of record at the close of business on February 6, 2025. Payments of future cash dividends, if any, will be at the discretion of our Board, taking into account various factors, including our business, operating results, financial condition, capital requirements, current and anticipated cash needs, plans for expansion, any legal or contractual limitation on our ability to pay dividends and other relevant factors. It is management's expectation based on current projections that cash dividends will continue for the foreseeable future, however, no assurances can be given that any dividends will be paid or that, if paid, such dividends will not be reduced in amount in future periods. The payment of dividends on the Company's common stock depends substantially upon receipt by the Company of dividends from the Bank, which is the Company’s predominant source of income.
Dividend Restrictions
As a Washington corporation, the Company is subject to certain restrictions on dividends under corporate law. In general, these restrictions do not allow us to pay dividends if, after payment of such dividends, we would not be able to pay our liabilities as they become due in the usual course of business, or our total assets would be less than total liabilities.
The FDIC and the DFI have the authority under their supervisory powers to prohibit the payment of dividends by the Bank to the Company. Additionally, current guidance from the Federal Reserve provides, among other things, that dividends per share on the Company’s common stock generally should not exceed earnings per share, measured over the previous four fiscal quarters. Current regulations allow the Company and the Bank to pay dividends on their common stock if the Company’s or the Bank’s regulatory capital would not be reduced below the statutory capital requirements set by the Federal Reserve and the FDIC. See “Supervision And Regulation—Supervision and Regulation of the Company—Dividend Payments” and “Supervision And Regulation—Supervision and Regulation of the Bank—Dividend Payments” above, for additional detail regarding restrictions on the payment of dividends by the Company and the Bank.
The Company also has certain contractual restrictions on its ability to pay dividends. The Company has acquired debt securities through transactions. Under the terms of the securities, the Company may be prohibited, under certain circumstances, from paying dividends on shares of its common stock. None of these circumstances existed through the date of filing of this Form 10-K. See Note (9) Junior Subordinated Debentures of the Notes to Consolidated Financial Statements included in Item 8. Financial Statements and Supplementary Data of this Form 10-K for additional information regarding dividend restrictions.
Purchases of Equity Securities by the Issuer
The following table sets forth information about the Company’s purchases of its outstanding common stock during the quarter ended December 31, 2024:
| | | | | | | | | | | | | | | | | | | | | | | |
| Period | Total number of shares purchased (1) | | Average price paid per share (1) | | Total number of shares purchased as part of publicly announced programs | | Maximum number of shares that may yet be purchased under the program |
| October 1, 2024—October 31, 2024 | — | | | — | | | — | | | 1,155,452 | |
| November 1, 2024— November 30, 2024 | 20,000 | | | 25.44 | | | 20,000 | | | 1,135,452 | |
| December 1, 2024—December 31, 2024 | 145,498 | | | 26.50 | | | 144,930 | | | 990,522 | |
| Total | 165,498 | | | $ | 26.37 | | | 164,930 | | | 990,522 | |
(1) Of the common shares repurchased by the Company between October 1, 2024 and December 31, 2024, 568 shares represented the cancellation of stock to pay withholding taxes on vested restricted stock awards or units and were not repurchased pursuant to the publicly announced stock repurchase program.
On April 24, 2024, the Board approved the repurchase of up to 5% of the Company's outstanding common shares, or 1,734,492 shares. This stock repurchase program supersedes the previous stock repurchase program, authorized in March 2020, which allowed for the repurchase of up to 5% of the Company's outstanding common shares, or 1,799,054 shares.
Performance Graph
The following graph shows the five-year comparison of the cumulative total return to shareholders of the Company’s common stock as compared to the Nasdaq Composite Index and the S&P U.S. SmallCap Banks Index during the five-year period beginning December 31, 2019 and ending December 31, 2024. Total return includes appreciation or depreciation in market value of the Company’s common stock as well as actual cash and stock dividends paid to common shareholders. The Nasdaq Composite Index is a broad equity market index comprised of all domestic and international common stocks listed on the Nasdaq Stock Market ("Nasdaq"). The S&P U.S. SmallCap Banks Index is comparative peer index comprised of banks and related holding companies within the same market capitalization range as the Company. The graph assumes the value of the investment in Company’s common stock and each index was $100 on December 31, 2019, and all dividends were reinvested.
.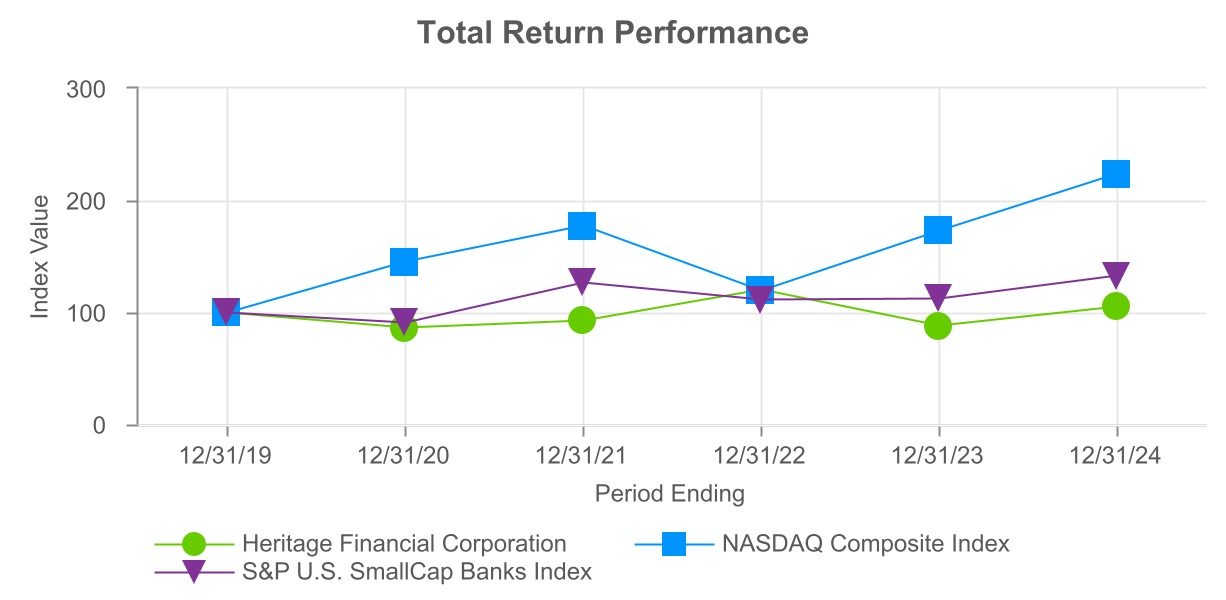
| | | | | | | | | | | | | | | | | | | | | | | | | | | | | | | | | | | |
| | Years Ended December 31, |
| Index | 2019 | | 2020 | | 2021 | | 2022 | | 2023 | | 2024 |
| Heritage Financial Corporation | $ | 100 | | | $ | 85.94 | | | $ | 92.71 | | | $ | 119.90 | | | $ | 87.66 | | | $ | 105.05 | |
| Nasdaq Composite Index | 100 | | | 144.92 | | | 177.06 | | | 119.45 | | | 172.77 | | | 223.87 | |
| S&P U.S. SmallCap Banks Index | 100 | | | 90.82 | | | 126.43 | | | 111.47 | | | 112.03 | | | 132.44 | |
*Information for the graph was provided by S&P Global Market Intelligence.
ITEM 6. [RESERVED]
ITEM 7. MANAGEMENT'S DISCUSSION AND ANALYSIS OF FINANCIAL CONDITION AND RESULTS OF OPERATIONS
The following is a discussion and analysis of our financial condition and results of operations and should be read in conjunction with our financial statements and notes thereto included in Item 8 Financial Statements and Supplementary Data of this Form 10-K. In addition to historical information, this discussion contains forward‑looking statements that involve risks, uncertainties and assumptions that could cause actual results to differ materially from management’s expectations. Factors that could cause such differences are discussed in the sections of this Form 10-K entitled “Cautionary Note Regarding Forward Looking Statements” and Item 1A. Risk Factors.
Management’s discussion focuses on 2024 results compared to 2023 results. For a discussion of 2023 results compared to 2022 results, refer to Part II, Item 7 Management’s Discussion and Analysis of Financial Condition and Results of Operations of the Company’s Annual Report on Form 10-K for the fiscal year ended December 31, 2023, filed with the SEC on February 27, 2024.
Overview
Heritage Financial Corporation is a bank holding company which primarily engages in the business activities of our wholly-owned financial institution subsidiary, Heritage Bank. We provide financial services to our customers in our market areas with an ongoing strategic focus on our commercial banking relationships, market expansion and asset quality. The Company’s business activities generally are limited to passive investment activities and oversight of its investment in the Bank. Accordingly, the information set forth in this report relates primarily to the Bank’s operations.
Our business consists primarily of commercial lending and deposit relationships with small- to medium-sized businesses and their owners in our market areas, as well as attracting deposits from the general public. We also make real estate construction and land development loans, consumer loans and residential real estate loans on single family properties located primarily in our markets.
Our core profitability depends primarily on our net interest income. Net interest income is the difference between interest income, which is the income that we earn on interest earning assets, consisting primarily of loans and investment securities, and interest expense, which is the amount we pay on our interest bearing liabilities, consisting primarily of deposits and borrowings. Management manages the repricing characteristics of the Company's interest earning assets and interest bearing liabilities to protect net interest income from changes in market interest rates and changes in the shape of the yield curve. Like most financial institutions, our net interest income is significantly affected by general and local economic conditions, particularly changes in market interest rates, and by governmental policies and actions of regulatory agencies. Net interest income is additionally affected by changes in the volume and mix of interest earning assets, interest earned on these assets, the volume and mix of interest bearing liabilities and interest paid on these liabilities.
Our net income is affected by many factors, including the provision for credit losses on loans. The provision for credit losses on loans is dependent on changes in the loan portfolio and management’s assessment of the collectability of the loan portfolio, as well as prevailing economic and market conditions. Management believes that the ACL on loans reflects the amount that is appropriate to provide for current expected credit losses in our loan portfolio based on the CECL methodology.
Net income is also affected by noninterest income and noninterest expense. Noninterest income primarily consists of gains or losses on the sale of investment securities, service charges and other fees, card revenue and other income. Noninterest expense primarily consists of compensation and employee benefits, occupancy and equipment, data processing and professional services expense. Compensation and employee benefits consist primarily of the salaries and wages paid to our employees, payroll taxes, expenses for retirement and other employee benefits. Occupancy and equipment expenses are the fixed and variable costs of buildings and equipment and consist primarily of lease expenses, depreciation charges, maintenance and utilities. Data processing expense consists primarily of processing and network services related to the Bank’s core operating system, including the account processing system, electronic payments processing of products and services, internet and mobile banking channels and software-as-a-service providers. Professional services expense consists primarily of third-party service providers such as auditors, consultants and lawyers.
Results of operations may also be significantly affected by general and local economic and competitive conditions, changes in accounting, tax and regulatory rules, governmental policies and actions of regulatory authorities, including changes resulting from inflation and the governmental actions taken to address this issue, as well as changes in policies driven by the new presidential administration. Net income is also impacted by growth of operations through organic growth or acquisitions. See also "Cautionary Note Regarding Forward-Looking Statements."
Results of Operations
Net income was $43.3 million, or $1.24 per diluted common share, for the year ended December 31, 2024 down from $61.8 million, or $1.75 per diluted common share, for the year ended December 31, 2023. Net income decreased $18.5 million, or 30.0%, compared to the year ended December 31, 2023 due primarily to a decrease in net interest income of $15.8 million to $209.4 million from $225.2 million and an increase in losses on sales of investment securities of $10.5 million to $22.7 million from $12.2 million, largely as a result of investment portfolio repositioning, which decreased noninterest income. These decreases were partially offset by a decrease in noninterest expense of $8.3 million. During the year ended December 31, 2024, the company also restructured its BOLI portfolio, incurring additional tax expense of $2.4 million and other costs of $508,000 related to the surrender of certain BOLI policies.
Net Interest Income and Margin Overview
One of the Company's key sources of revenue is net interest income. Several factors affect net interest income, including, but not limited to: the volume, pricing, mix and maturity of interest earning assets and interest bearing liabilities; the volume of noninterest earning assets, noninterest bearing demand deposits, other noninterest bearing liabilities and stockholders' equity; market interest rate fluctuations; and asset quality.
Market rates impact the results of the Company's net interest income, including the significant changes in the federal funds target rate that have been made by the Federal Reserve since 2022 in response to inflationary pressures. The following table provides the federal funds target rate history and changes since December 31, 2021:
| | | | | | | | | | | | | | |
| Change Date | | Rate (%) | | Rate Change (%) |
| December 31, 2021 | | 0.00% - 0.25% | | N/A |
| March 17, 2022 | | 0.25% - 0.50% | | 0.25 | % |
| May 5, 2022 | | 0.75% - 1.00% | | 0.50 | % |
| June 16, 2022 | | 1.50% - 1.75% | | 0.75 | % |
| July 28, 2022 | | 2.25% - 2.50% | | 0.75 | % |
| September 22, 2022 | | 3.00% - 3.25% | | 0.75 | % |
| November 3, 2022 | | 3.75% - 4.00% | | 0.75 | % |
| December 15, 2022 | | 4.25% - 4.50% | | 0.50 | % |
| February 2, 2023 | | 4.50% - 4.75% | | 0.25 | % |
| March 23, 2023 | | 4.75% - 5.00% | | 0.25 | % |
| May 4, 2023 | | 5.00% - 5.25% | | 0.25 | % |
| July 27, 2023 | | 5.25% - 5.50% | | 0.25 | % |
| September 19, 2024 | | 4.75% - 5.00% | | (0.50) | % |
| November 8, 2024 | | 4.50% - 4.75% | | (0.25) | % |
| December 19, 2024 | | 4.25% - 4.50% | | (0.25) | % |
Average Balances, Yields and Rates Paid
The following table provides relevant net interest income information for the periods indicated:
| | | | | | | | | | | | | | | | | | | | | | | | | | | | | | | | | | | | | | | | | | | | | | | | | | | | | |
| | Year Ended December 31, |
| | 2024 | | 2023 | | 2022 |
| | Average Balance(1) | | Interest
Earned/
Paid | | Average
Yield/
Rate | | Average Balance(1) | | Interest
Earned/
Paid | | Average
Yield/
Rate | | Average Balance(1) | | Interest
Earned/
Paid | | Average
Yield/
Rate |
| | (Dollars in thousands) |
| Interest Earning Assets: | | | | | | | | | | | | | | | | | |
Loans receivable, net (2)(3) | $ | 4,485,531 | | | $ | 247,472 | | | 5.52 | % | | $ | 4,155,722 | | | $ | 217,284 | | | 5.23 | % | | $ | 3,852,604 | | | $ | 174,275 | | | 4.52 | % |
| Taxable securities | 1,653,295 | | | 54,972 | | | 3.32 | | | 1,937,603 | | | 58,509 | | | 3.02 | | | 1,646,058 | | | 40,627 | | | 2.47 | |
Nontaxable securities (3) | 18,425 | | | 651 | | | 3.53 | | | 63,051 | | | 1,854 | | | 2.94 | | | 135,004 | | | 3,488 | | | 2.58 | |
| Interest earning deposits | 125,036 | | | 6,617 | | | 5.29 | | | 129,807 | | | 6,818 | | | 5.25 | | | 913,374 | | | 9,067 | | | 0.99 | |
| Total interest earning assets | 6,282,287 | | | 309,712 | | | 4.93 | % | | 6,286,183 | | | 284,465 | | | 4.53 | % | | 6,547,040 | | | 227,457 | | | 3.47 | % |
| Noninterest earning assets | 850,759 | | | | | | | 853,841 | | | | | | | 774,415 | | | | | |
| Total assets | $ | 7,133,046 | | | | | | | $ | 7,140,024 | | | | | | | $ | 7,321,455 | | | | | |
| Interest Bearing Liabilities: | | | | | | | | | | | | | | | | | |
| Certificates of Deposit | $ | 857,079 | | | $ | 36,922 | | | 4.31 | % | | $ | 491,653 | | | $ | 14,554 | | | 2.96 | % | | $ | 313,712 | | | $ | 1,407 | | | 0.45 | % |
| Savings accounts | 451,528 | | | 920 | | | 0.20 | | | 543,096 | | | 701 | | | 0.13 | | | 646,565 | | | 381 | | | 0.06 | |
| Interest bearing demand and money market accounts | 2,640,487 | | | 37,227 | | | 1.41 | | | 2,771,981 | | | 24,095 | | | 0.87 | | | 3,036,031 | | | 4,984 | | | 0.16 | |
| Total interest bearing deposits | 3,949,094 | | | 75,069 | | | 1.90 | | | 3,806,730 | | | 39,350 | | | 1.03 | | | 3,996,308 | | | 6,772 | | | 0.17 | |
| Junior subordinated debentures | 21,910 | | | 2,139 | | | 9.76 | | | 21,615 | | | 2,074 | | | 9.60 | | | 21,322 | | | 1,156 | | | 5.42 | |
| | | | | | | | | | | | | | | | | | | | | | | | | | | | | | | | | | | | | | | | | | | | | | | | | | | | | |
| | Year Ended December 31, |
| | 2024 | | 2023 | | 2022 |
| | Average Balance(1) | | Interest
Earned/
Paid | | Average
Yield/
Rate | | Average Balance(1) | | Interest
Earned/
Paid | | Average
Yield/
Rate | | Average Balance(1) | | Interest
Earned/
Paid | | Average
Yield/
Rate |
| | (Dollars in thousands) |
| Securities sold under agreement to repurchase | — | | | — | | | — | | | 32,976 | | | 153 | | | 0.46 | | | 46,209 | | | 138 | | | 0.30 | |
| Borrowings | 456,448 | | | 23,140 | | | 5.07 | | | 369,665 | | | 17,733 | | | 4.80 | | | 137 | | | 6 | | | 4.38 | |
| Total interest bearing liabilities | 4,427,452 | | | 100,348 | | | 2.27 | % | | 4,230,986 | | | 59,310 | | | 1.40 | % | | 4,063,976 | | | 8,072 | | | 0.20 | % |
| Noninterest bearing demand deposits | 1,669,301 | | | | | | | 1,899,317 | | | | | | | 2,326,178 | | | | | |
| Other noninterest bearing liabilities | 182,121 | | | | | | | 191,679 | | | | | | | 119,359 | | | | | |
| Stockholders’ equity | 854,172 | | | | | | | 818,042 | | | | | | | 811,942 | | | | | |
| Total liabilities and stock-holders’ equity | $ | 7,133,046 | | | | | | | $ | 7,140,024 | | | | | | | $ | 7,321,455 | | | | | |
| Net interest income and spread | | | $ | 209,364 | | | 2.66 | % | | | | $ | 225,155 | | | 3.13 | % | | | | $ | 219,385 | | | 3.27 | % |
| Net interest margin | | | | | 3.33 | % | | | | | | 3.58 | % | | | | | | 3.35 | % |
(1) Average balances are calculated using daily balances. Average yield/rate is annualized.
(2) Average loans receivable, net includes loans held for sale and loans classified as nonaccrual, which carry a zero yield. Interest earned on loans receivable, net includes the amortization of net deferred loan fees of $3.6 million, $3.3 million and $7.4 million for the years ended December 31, 2024, 2023 and 2022, respectively.
(3) Yields on tax-exempt loans and securities have not been stated on a tax-equivalent basis.
The following tables provide the changes in net interest income for the periods indicated due to changes in average asset and liability balances (volume), changes in average yields/rates (rate) and changes attributable to the combined effect of volume and rates allocated proportionately to the absolute value of changes due to volume and changes due to rates:
| | | | | | | | | | | | | | | | | | | |
| Year Ended December 31, 2024 Compared to 2023 |
| | Increase (Decrease) Due to changes in |
| | Volume | | Yield/Rate | | Total | | |
| | (Dollars in thousands) |
| Interest Earning Assets: | | | | | | | |
| Loans receivable, net | $ | 17,806 | | | $ | 12,382 | | | $ | 30,188 | | | |
| Taxable securities | (9,099) | | | 5,562 | | | (3,537) | | | |
| Nontaxable securities | (1,518) | | | 315 | | | (1,203) | | | |
| Interest earning deposits | (252) | | | 51 | | | (201) | | | |
| Total interest income | 6,937 | | | 18,310 | | | 25,247 | | | |
| Interest Bearing Liabilities: | | | | | | | |
| Certificates of deposit | 13,871 | | | 8,497 | | | 22,368 | | | |
| Savings accounts | (134) | | | 353 | | | 219 | | | |
| Interest bearing demand and money market accounts | (1,193) | | | 14,325 | | | 13,132 | | | |
| Total interest bearing deposits | 12,544 | | | 23,175 | | | 35,719 | | | |
| Junior subordinated debentures | 28 | | | 37 | | | 65 | | | |
| Securities sold under agreement to repurchase | (77) | | | (76) | | | (153) | | | |
| Borrowings | 4,354 | | | 1,053 | | | 5,407 | | | |
| Total interest expense | 16,849 | | | 24,189 | | | 41,038 | | | |
| Net interest income | $ | (9,912) | | | $ | (5,879) | | | $ | (15,791) | | | |
| | | | | | | | | | | | | | | | | | | |
| Year Ended December 31, 2023 Compared to 2022 |
| | Increase (Decrease) Due to changes in |
| | Volume | | Yield/Rate | | Total | | |
| | (Dollars in thousands) |
| Interest Earning Assets: | | | | | | | |
| Loans receivable, net | $ | 14,429 | | | $ | 28,580 | | | $ | 43,009 | | | |
| Taxable securities | 7,907 | | | 9,975 | | | 17,882 | | | |
| Nontaxable securities | (2,063) | | | 429 | | | (1,634) | | | |
| Interest earning deposits | (13,339) | | | 11,090 | | | (2,249) | | | |
| Total interest income | 6,934 | | | 50,074 | | | 57,008 | | | |
| Interest Bearing Liabilities: | | | | | | | |
| Certificates of deposit | 1,209 | | | 11,938 | | | 13,147 | | | |
| Savings accounts | (70) | | | 390 | | | 320 | | | |
| Interest bearing demand and money market accounts | (470) | | | 19,581 | | | 19,111 | | | |
| Total interest bearing deposits | 669 | | | 31,909 | | | 32,578 | | | |
| Junior subordinated debentures | 16 | | | 902 | | | 918 | | | |
| Securities sold under agreement to repurchase | (46) | | | 61 | | | 15 | | | |
| Borrowings | 17,727 | | | — | | | 17,727 | | | |
| Total interest expense | 18,366 | | | 32,872 | | | 51,238 | | | |
| Net interest income | $ | (11,432) | | | $ | 17,202 | | | $ | 5,770 | | | |
Total interest income increased $25.2 million, or 8.9%, to $309.7 million for the year ended December 31, 2024 compared to $284.5 million for the year ended December 31, 2023. The increase was primarily due to a 40 basis point increase in the yield on interest earning assets to 4.93% for the year ended December 31, 2024, compared to 4.53% for the year ended December 31, 2023 following increases in market interest rates and secondarily due to a change in the mix of earning assets to higher yielding loan balances.
Total interest expense increased $41.0 million, or 69.2%, to $100.3 million for the year ended December 31, 2024 compared to $59.3 million for the year ended December 31, 2023 due primarily to increased costs of interest bearing deposits resulting from competitive rate pressures as well as customers transferring balances from non-maturity deposits to higher rate certificates of deposits and an increase in borrowing balances and rates. The total cost of interest bearing liabilities increased 87 basis points to 2.27% for the year ended December 31, 2024, compared to 1.40% for the year ended December 31, 2023.
The net interest margin decreased 25 basis points to 3.33% for the year ended December 31, 2024 compared to 3.58% for the year ended December 31, 2023. The decrease in net interest margin was due primarily to increases in the average cost of interest bearing liabilities as a result of upward market pressure related to deposit rates and an increase in borrowing balances and rates. This was partially offset by increases in average yields on total interest earning assets as a result of increases in market interest rates.
Provision for Credit Losses Overview
The aggregate of the provision for (reversal of) credit losses on loans and on unfunded commitments is presented in the Consolidated Statements of Income as the "Provision for (reversal of) credit losses." The ACL on unfunded commitments is included in the Consolidated Statements of Financial Condition within "Accrued expenses and other liabilities."
The following table presents the provision for (reversal of) credit losses for the periods indicated:
| | | | | | | | | | | | | | | | | | | | | | | |
| Year Ended December 31, | | Change |
| 2024 | | 2023 | | $ | | % |
| (Dollars in thousands) |
| Provision for credit losses on loans | $ | 6,983 | | | $ | 4,736 | | | $ | 2,247 | | | 47.4 | % |
| Reversal of provision for credit losses on unfunded commitments | (701) | | | (456) | | | (245) | | | 53.7 | |
| Provision for credit losses | $ | 6,282 | | | $ | 4,280 | | | $ | 2,002 | | | 46.8 | % |
The provision for credit losses on loans recognized during the year ended December 31, 2024 was due primarily to growth in balances of collectively evaluated loans. The ACL on loans to loans receivable decreased to 1.09% at December 31, 2024, compared to 1.11% at December 31, 2023 due to changes in the loan mix as loan growth occurred in segments requiring a lower calculated reserve as a percentage of loans. The reversal of provision for credit losses on unfunded commitments recognized during the year ended December 31, 2024 was due primarily to an increase in utilization rates on lines of credit and a decrease in the unfunded exposure on construction loans.
Noninterest Income Overview
The following table presents the change in the key components of noninterest income for the periods indicated:
| | | | | | | | | | | | | | | | | | | | | | | |
| Year Ended December 31, | | Change |
| 2024 | | 2023 | | $ | | % |
| (Dollars in thousands) |
| Service charges and other fees | $ | 11,285 | | | $ | 10,966 | | | $ | 319 | | | 2.9 | % |
| Card revenue | 7,752 | | | 8,340 | | | (588) | | | (7.1) | |
| Loss on sale of investment securities, net | (22,742) | | | (12,231) | | | (10,511) | | | 85.9 | |
| Gain on sale of loans, net | 26 | | | 343 | | | (317) | | | (92.4) | |
| Interest rate swap fees | 409 | | | 230 | | | 179 | | | 77.8 | |
| Bank owned life insurance income | 2,967 | | | 2,934 | | | 33 | | | 1.1 | |
| Gain on sale of other assets, net | 1,552 | | | 2 | | | 1,550 | | | 77,500.0 | |
| Other income | 6,224 | | | 8,079 | | | (1,855) | | | (23.0) | |
| Total noninterest income | $ | 7,473 | | | $ | 18,663 | | | $ | (11,190) | | | (60.0) | % |
Noninterest income decreased $11.2 million, or 60.0%, during the year ended December 31, 2024 compared to the same period in 2023. This decline was primarily driven by a pre-tax loss of $22.7 million incurred on the sale of investment securities available for sale during the year ended December 31, 2024, compared to a pre-tax loss of $12.2 million incurred during the same period in 2023. The loss on the sale of investment securities in 2024 was a consequence of strategically repositioning the Company's investment portfolio, involving the sale of $296.4 million in investment securities, with the aim of enhancing future earnings. Card revenue declined due to lower deposit transaction volumes. The decrease in other income during the year ended December 31, 2024 was primarily due to a one-time sale of Visa Inc. Class B common stock of $1.6 million and a $610,000 gain on sale of the Ellensburg branch recognized during the year ended December 31, 2023. Gain on sale of loans, net declined as the Company is no longer originating mortgage loans for sale.
These decreases were partially offset by an increase in the gain on sale of other assets, net due to a $1.5 million gain on the sale of an administrative building recognized during the year ended December 31, 2024 and an increase in service charges due primarily to an increase in service charge income on commercial deposit accounts.
Noninterest Expense Overview
The following table presents changes in the key components of noninterest expense for the periods indicated:
| | | | | | | | | | | | | | | | | | | | | | | |
| Year Ended December 31, | | Change |
| 2024 | | 2023 | | $ | | % |
| (Dollars in thousands) |
| Compensation and employee benefits | $ | 98,527 | | | $ | 100,083 | | | $ | (1,556) | | | (1.6) | % |
| Occupancy and equipment | 19,289 | | | 19,156 | | | 133 | | | 0.7 | |
| Data processing | 14,899 | | | 17,116 | | | (2,217) | | | (13.0) | |
| Marketing | 988 | | | 1,930 | | | (942) | | | (48.8) | |
| Professional services | 2,515 | | | 4,227 | | | (1,712) | | | (40.5) | |
| State/municipal business and use tax | 4,889 | | | 4,059 | | | 830 | | | 20.4 | |
| Federal deposit insurance premium | 3,260 | | | 3,312 | | | (52) | | | (1.6) | |
| | | | | | | |
| Amortization of intangible assets | 1,640 | | | 2,434 | | | (794) | | | (32.6) | |
| Other expense | 12,289 | | | 14,306 | | | (2,017) | | | (14.1) | |
| Total noninterest expense | $ | 158,296 | | | $ | 166,623 | | | $ | (8,327) | | | (5.0) | % |
Noninterest expense decreased $8.3 million, or 5.0%, during the year ended December 31, 2024 compared to the same period in 2023. Compensation and employee benefits decreased $1.6 million due primarily to a decrease in the average number of full-time equivalent employees to 751 as of December 31, 2024, compared to 803 as of December 31, 2023, in connection with expense management initiatives. These expense management initiatives also impacted data processing expense, which decreased primarily due to a decline in ongoing costs resulting from prior technology-related contract renewals and terminations and decreased marketing and other expense. Professional services expense decreased during the year ended December 31, 2024 due primarily to a $1.5 million expense related to renewal of the core vendor contract recognized during the prior year. Amortization of intangible assets decreased due to the full amortization of the core deposit intangible related to a prior acquisition. This was offset partially by an increase in state/municipal business and use tax expense due primarily to an increase in gross revenue.
Income Tax Expense Overview
The following table presents the income tax expense and related metrics and the change for the periods indicated:
| | | | | | | | | | | | | | | | | | | | | | | | | |
| Year Ended December 31, | | 2024 Compared to 2023 Change |
| 2024 | | 2023 | | | | $ | | % |
| (Dollars in thousands) |
| Income before income taxes | $ | 52,259 | | | $ | 72,915 | | | | | $ | (20,656) | | | (28.3) | % |
| Income tax expense | $ | 9,001 | | | $ | 11,160 | | | | | $ | (2,159) | | | (19.3) | % |
| Effective income tax rate | 17.2 | % | | 15.3 | % | | | | 1.9 | % | | 12.4 | % |
Income tax expense decreased during the year ended December 31, 2024 primarily due to lower pre-tax income. This decrease was partially offset by additional tax expense of $2.4 million related to the surrender of certain BOLI policies as part of a BOLI restructuring which occurred in the fourth quarter of 2024. The effective income tax rate increased due primarily to the additional tax expense related to the surrender of BOLI policies.
Financial Condition Overview
The table below provides a comparison of changes in key components of the Company's financial condition for the periods indicated:
| | | | | | | | | | | | | | | | | | | | | | | |
| December 31, | | Change |
| 2024 | | 2023 | | $ | | % |
| (Dollars in thousands) |
| Assets | | | | | | | |
| Cash and cash equivalents | $ | 117,100 | | | $ | 224,973 | | | $ | (107,873) | | | (47.9) | % |
| Investment securities available for sale, at fair value, net | 764,394 | | | 1,134,353 | | | (369,959) | | | (32.6) | |
| Investment securities held to maturity, at amortized cost, net | 703,285 | | | 739,442 | | | (36,157) | | | (4.9) | |
| | | | | | | |
| Loans receivable, net | 4,749,655 | | | 4,287,628 | | | 462,027 | | | 10.8 | |
| | | | | | | |
| Premises and equipment, net | 71,580 | | | 74,899 | | | (3,319) | | | (4.4) | |
| Federal Home Loan Bank stock, at cost | 21,538 | | | 4,186 | | | 17,352 | | | 414.5 | |
| Bank owned life insurance | 111,699 | | | 125,655 | | | (13,956) | | | (11.1) | |
| Accrued interest receivable | 19,483 | | | 19,518 | | | (35) | | | (0.2) | |
| Prepaid expenses and other assets | 303,452 | | | 318,571 | | | (15,119) | | | (4.7) | |
| Other intangible assets, net | 3,153 | | | 4,793 | | | (1,640) | | | (34.2) | |
| Goodwill | 240,939 | | | 240,939 | | | — | | | — | |
| Total assets | $ | 7,106,278 | | | $ | 7,174,957 | | | $ | (68,679) | | | (1.0) | % |
| | | | | | | |
| Liabilities and Stockholders' Equity | | | | | | | |
| Total deposits | 5,684,613 | | | 5,599,872 | | | $ | 84,741 | | | 1.5 | |
| Borrowings | 383,000 | | | 500,000 | | | (117,000) | | | (23.4) | |
| Junior subordinated debentures | 22,058 | | | 21,765 | | | 293 | | | 1.3 | |
| | | | | | | |
| Accrued expenses and other liabilities | 153,080 | | | 200,059 | | | (46,979) | | | (23.5) | |
| Total liabilities | 6,242,751 | | | 6,321,696 | | | (78,945) | | | (1.2) | |
| | | | | | | | | | | | | | | | | | | | | | | |
| December 31, | | Change |
| 2024 | | 2023 | | $ | | % |
| Common stock | 531,674 | | | 549,748 | | | (18,074) | | | (3.3) | |
| Retained earnings | 387,097 | | | 375,989 | | | 11,108 | | | 3.0 | |
| Accumulated other comprehensive loss, net | (55,244) | | | (72,476) | | | 17,232 | | | (23.8) | |
| Total stockholders' equity | 863,527 | | | 853,261 | | | 10,266 | | | 1.2 | |
| Total liabilities and stockholders' equity | $ | 7,106,278 | | | $ | 7,174,957 | | | $ | (68,679) | | | (1.0) | % |
Total assets decreased due primarily to decreases in investment securities and cash and cash equivalents offset partially by an increase in loans receivable. Total liabilities decreased due primarily to a decrease in borrowings and accrued expenses and other liabilities offset partially by an increase in deposits. Total stockholders' equity increased due primarily to net income as well as an increase in AOCI as a result of a decrease in other comprehensive income (loss), net of tax, which was positively impacted by the fair value of our investment securities available for sale as well as the sale of securities at a loss. The changes are discussed in more detail in the sections below.
Investment Activities Overview
Our investment policy is established by the Board and monitored by the Risk Committee of the Board. It is designed primarily to provide and maintain liquidity, generate a favorable return on investments without incurring undue interest rate and credit risk, and complements the Company's lending activities. The policy permits investment in various types of liquid assets permissible under applicable regulations. Investment in sub-investment grade bonds is not permitted under the policy.
The following table provides information regarding our investment securities at the dates indicated:
| | | | | | | | | | | | | | | | | | | | | | | | | | | | | | | | | | | |
| | December 31, 2024 | | December 31, 2023 | | Change |
| | Balance | | % of
Total | | Balance | | % of
Total | | $ | | % |
| | (Dollars in thousands) |
| Investment securities available for sale, at fair value: |
| U.S. government and agency securities | $ | 12,544 | | | 0.9 | % | | $ | 13,750 | | | 0.7 | % | | $ | (1,206) | | | (8.8) | % |
| Municipal securities | 50,942 | | | 3.5 | | | 79,525 | | | 4.2 | | | (28,583) | | | (35.9) | |
Residential CMO and MBS(1) | 369,331 | | | 25.2 | | | 512,049 | | | 27.3 | | | (142,718) | | | (27.9) | |
Commercial CMO and MBS(1) | 309,741 | | | 21.0 | | | 504,258 | | | 27.0 | | | (194,517) | | | (38.6) | |
| Corporate obligations | 11,770 | | | 0.8 | | | 7,613 | | | 0.4 | | | 4,157 | | | 54.6 | |
| Other asset-backed securities | 10,066 | | | 0.7 | | | 17,158 | | | 0.9 | | | (7,092) | | | (41.3) | |
| Total | 764,394 | | | 52.1 | | | 1,134,353 | | | 60.5 | | | (369,959) | | | (32.6) | |
| | | | | | | | | | | |
| Investment securities held to maturity, at amortized cost: |
| U.S. government and agency securities | $ | 151,216 | | | 10.3 | % | | $ | 151,075 | | | 8.1 | % | | $ | 141 | | | 0.1 | |
Residential CMO and MBS(1) | 244,309 | | | 16.6 | | | 267,204 | | | 14.3 | | | (22,895) | | | (8.6) | |
Commercial CMO and MBS(1) | 307,760 | | | 21.0 | | | 321,163 | | | 17.1 | | | (13,403) | | | (4.2) | |
| Total | 703,285 | | | 47.9 | | | 739,442 | | | 39.5 | | | (36,157) | | | (4.9) | |
| | | | | | | | | | | |
| Total investment securities | $ | 1,467,679 | | | 100.0 | % | | $ | 1,873,795 | | | 100.0 | % | | $ | (406,116) | | | (21.7) | % |
(1) U.S. government agency and government-sponsored enterprise CMO and MBS obligations.
Total investment securities decreased $406.1 million to $1.47 billion at December 31, 2024 from $1.87 billion at December 31, 2023 due to sales of investment securities available for sale in connection with a strategic repositioning of the Company's investment portfolio, as well as maturities and repayments of $165.7 million, offset partially by purchases of investment securities available for sale.
During the year ended December 31, 2024, the Company incurred a pre-tax loss of $22.7 million on the sale of investment securities available for sale due to the aforementioned strategic repositioning of its investment portfolio. The Company sold $296.4 million in investment securities with an estimated weighted average book yield of 2.23% and purchased $33.1 million of investment securities with an estimated weighted average book yield of 6.05%. The remaining proceeds were used for other balance sheet initiatives such as the funding of higher yielding loan growth.
The following table provides the weighted average yield of the Company's investment portfolio at December 31, 2024 calculated based upon the fair values of our investment securities available for sale and held to maturity, and excluding any income tax benefits of tax-exempt bonds:
| | | | | | | | | | | | | | | | | | | | | | | | | | | | | | | | | | | | | | | | | | | | | | | | | | | | | | | | | | | |
| | In one year or less | | After one year through five years | | After five years through ten years | | After ten years | | Total |
| | Fair
Value | | Yield | | Fair
Value | | Yield | | Fair
Value | | Yield | | Fair
Value | | Yield | | Fair
Value | | Yield |
| | (Dollars in thousands) | | | | |
| Investment securities available for sale: |
| U.S. government and agency securities | $ | — | | | — | % | | $ | 4,688 | | | 3.04 | % | | $ | 1,374 | | | 1.43 | % | | $ | 6,482 | | | 2.32 | % | | $ | 12,544 | | | 2.47 | % |
| Municipal securities | — | | | — | | | 1,423 | | | 4.37 | | | 18,273 | | | 3.26 | | | 31,246 | | | 2.93 | | | 50,942 | | | 3.07 | |
Residential CMO and MBS(1) | 14 | | | 1.59 | | | 530 | | | 3.14 | | | 30,452 | | | 3.98 | | | 338,335 | | | 3.51 | | | 369,331 | | | 3.54 | |
Commercial CMO and MBS(1) | 18,767 | | | 3.35 | | | 174,725 | | | 3.87 | | | 102,478 | | | 1.98 | | | 13,771 | | | 4.95 | | | 309,741 | | | 3.21 | |
| Corporate obligations | — | | | — | | | — | | | — | | | 11,770 | | | 8.32 | | | — | | | — | | | 11,770 | | | 8.32 | |
| Other asset-backed securities | — | | | — | | | — | | | — | | | 1,435 | | | 6.44 | | | 8,631 | | | 5.92 | | | 10,066 | | | 5.99 | |
| Total | $ | 18,781 | | | 3.35 | % | | $ | 181,366 | | | 3.85 | % | | $ | 165,782 | | | 2.91 | % | | $ | 398,465 | | | 3.53 | % | | $ | 764,394 | | | 3.46 | % |
| | | | | | | | | | | | | | | | | | | |
| Investment securities held to maturity: |
| U.S. government and agency securities | $ | — | | | — | % | | $ | — | | | — | % | | $ | 78,092 | | | 2.08 | % | | $ | 44,250 | | | 2.17 | % | | $ | 122,342 | | | 2.11 | % |
Residential CMO and MBS(1) | — | | | — | | | — | | | — | | | 34,292 | | | 3.34 | | | 191,454 | | | 4.03 | | | 225,746 | | | 3.92 | |
Commercial CMO and MBS(1) | — | | | — | | | 137,045 | | | 3.03 | | | 125,435 | | | 1.75 | | | 12,884 | | | 3.79 | | | 275,364 | | | 2.45 | |
| Total | $ | — | | | — | % | | $ | 137,045 | | | 3.03 | % | | $ | 237,819 | | | 2.07 | % | | $ | 248,588 | | | 3.63 | % | | $ | 623,452 | | | 2.89 | % |
(1) U.S. government agency and government-sponsored enterprise CMO and MBS obligations.
Loan Portfolio Overview
Changes by loan type
The Company originates a wide variety of loans with a focus on commercial business loans. In addition to originating loans, the Company may also acquire loans through pool purchases, participation purchases and syndicated loan purchases. The following table provides information about our loan portfolio by type of loan at the dates indicated:
| | | | | | | | | | | | | | | | | | | | | | | | | | | | | | | | | | | |
| | December 31, 2024 | | December 31, 2023 | | Change |
| | Amortized Cost | | % of Loans Receivable | | Amortized Cost | | % of Loans Receivable | | $ | | % |
| | (Dollars in thousands) |
| Commercial business: |
| Commercial and industrial | $ | 842,672 | | | 17.5 | % | | $ | 718,291 | | | 16.6 | % | | $ | 124,381 | | | 17.3 | % |
| Owner-occupied CRE | 1,003,243 | | | 20.9 | | | 958,620 | | | 22.1 | | | 44,623 | | | 4.7 | |
| Non-owner occupied CRE | 1,909,107 | | | 39.9 | | | 1,697,574 | | | 39.1 | | | 211,533 | | | 12.5 | |
| Total commercial business | 3,755,022 | | | 78.3 | | | 3,374,485 | | | 77.8 | | | 380,537 | | | 11.3 | |
| Residential real estate | 402,954 | | | 8.4 | | | 375,342 | | | 8.7 | | | 27,612 | | | 7.4 | |
| Real estate construction and land development: |
| Residential | 83,890 | | | 1.7 | | | 78,610 | | | 1.8 | | | 5,280 | | | 6.7 | |
| Commercial and multifamily | 395,553 | | | 8.2 | | | 335,819 | | | 7.7 | | | 59,734 | | | 17.8 | |
| Total real estate construction and land development | 479,443 | | | 9.9 | | | 414,429 | | | 9.5 | | | 65,014 | | | 15.7 | |
| Consumer | 164,704 | | | 3.4 | | | 171,371 | | | 4.0 | | | (6,667) | | | (3.9) | |
| Total | $ | 4,802,123 | | | 100.0 | % | | $ | 4,335,627 | | | 100.0 | % | | $ | 466,496 | | | 10.8 | % |
Loans receivable increased $466.5 million, or 10.8%, to $4.80 billion at December 31, 2024 from $4.34 billion at December 31, 2023. New loans funded in the year ended December 31, 2024 totaled $626.2 million and loan prepayments were $176.7 million.
Non-owner occupied CRE loans increased $211.5 million, or 12.5%, due primarily to new loan production during the year ended December 31, 2024 and advances on outstanding commitments. Commercial and industrial loans increased $124.4 million, or 17.3%, due primarily to new loan production of $232.5 million during the year ended December 31, 2024, offset by pay downs on outstanding balances. Commercial and multifamily construction loans increased $59.7 million, or 17.8%, during the year ended December 31, 2024 due primarily to new loan commitments of $149.3 million and advances on new and outstanding commitments. Residential real estate loans increased $27.6 million, or 7.4%, due primarily to loan purchases during the year ended December 31, 2024.
Owner-occupied CRE and non-owner occupied CRE loans increased $256.2 million to $2.91 billion at December 31, 2024 compared to $2.66 billion at December 31, 2023. The following table provides information about owner occupied CRE and non-owner occupied CRE loans by collateral type at the dates indicated:
| | | | | | | | | | | | | | | | | | | | | | | | | | | | | | | | | | | |
| December 31, 2024 | | December 31, 2023 | | Change |
| Amortized Cost | | % of CRE Loans | | Amortized Cost | | % of CRE Loans | | $ | | % |
| (Dollars in thousands) |
| Owner occupied and non-owner occupied CRE loans by collateral type: |
| Office | $ | 565,892 | | | 19.4 | % | | $ | 555,822 | | | 20.9 | % | | $ | 10,070 | | | 1.8 | % |
| Industrial | 513,615 | | | 17.6 | | | 418,651 | | | 15.8 | | | 94,964 | | | 22.7 | |
| Multi-family | 414,728 | | | 14.2 | | | 305,499 | | | 11.5 | | | 109,229 | | | 35.8 | |
| Retail store / shopping center | 304,562 | | | 10.5 | | | 285,926 | | | 10.8 | | | 18,636 | | | 6.5 | |
| Mini-storage | 161,390 | | | 5.5 | | | 171,778 | | | 6.5 | | | (10,388) | | | (6.0) | |
| Mixed use property | 156,627 | | | 5.4 | | | 154,674 | | | 5.8 | | | 1,953 | | | 1.3 | |
| Warehouse | 139,341 | | | 4.8 | | | 149,176 | | | 5.6 | | | (9,835) | | | (6.6) | |
| Motel / hotel | 165,420 | | | 5.7 | | | 142,172 | | | 5.4 | | | 23,248 | | | 16.4 | |
| Single purpose | 125,430 | | | 4.3 | | | 123,344 | | | 4.6 | | | 2,086 | | | 1.7 | |
| Recreational / school | 68,416 | | | 2.3 | | | 67,791 | | | 2.6 | | | 625 | | | 0.9 | |
| Other | 296,929 | | | 10.3 | | | 281,361 | | | 10.5 | | | 15,568 | | | 5.5 | |
| Total | $ | 2,912,350 | | | 100.0 | % | | $ | 2,656,194 | | | 100.0 | % | | $ | 256,156 | | | 9.6 | % |
Office loans represented the largest segment of owner-occupied and non-owner occupied CRE loans totaling $565.9 million, or 19.4% of the total owner-occupied CRE and non-owner occupied CRE at December 31, 2024. Of this total, $291.5 million, or 51.5%, were owner-occupied CRE loans which have a lower risk profile as there is less tenant rollover risk, 81.0% have recourse to the owners and 24.6% of loans are borrowers in the health care and social assistance sectors, who are less likely to reduce office space. The average individual loan balance of owner-occupied CRE and non-owner occupied CRE was $1.3 million at December 31, 2024. See also Item 1. Business - Commercial Business Lending of this Form 10-K for CRE underwriting standards.
Composition of loans receivable by contractual maturity and interest type
The following table presents the amortized cost of the loan portfolio by segment and contractual maturity at December 31, 2024:
| | | | | | | | | | | | | | | | | | | | | | | | | | | | | |
| | In one year or less | | After one year through five years | | After five years through 15 years | | After 15 years | | Total |
| | (Dollars in thousands) |
| Commercial business: |
| Commercial and industrial | $ | 386,322 | | | $ | 89,566 | | | $ | 177,223 | | | $ | 189,561 | | | $ | 842,672 | |
| Owner-occupied CRE | 176,517 | | | 151,374 | | | 309,289 | | | 366,063 | | | 1,003,243 | |
| Non-owner occupied CRE | 429,078 | | | 421,088 | | | 528,591 | | | 530,350 | | | 1,909,107 | |
| Total commercial business | 991,917 | | | 662,028 | | | 1,015,103 | | | 1,085,974 | | | 3,755,022 | |
| Residential real estate | 8,500 | | | 7,361 | | | 16,333 | | | 370,760 | | | 402,954 | |
| Real estate construction and land development: |
| Residential | 72,972 | | | 4,525 | | | 3,761 | | | 2,632 | | | 83,890 | |
| Commercial and multifamily | 266,160 | | | 3,149 | | | 75,766 | | | 50,478 | | | 395,553 | |
| Total real estate construction and land development | 339,132 | | | 7,674 | | | 79,527 | | | 53,110 | | | 479,443 | |
| Consumer | 147,734 | | | 11,827 | | | 2,144 | | | 2,999 | | | 164,704 | |
| Total | $ | 1,487,283 | | | $ | 688,890 | | | $ | 1,113,107 | | | $ | 1,512,843 | | | $ | 4,802,123 | |
The following table presents the amortized cost of the loan portfolio by segment and interest rate type that are due after one year, at December 31, 2024:
| | | | | | | | | | | | | | | | | |
| | Have predetermined interest rates(1) | | Have floating or adjustable interest rates(1) | | Total |
| | (Dollars in thousands) |
| Commercial business: | | | | | |
| Commercial and industrial | $ | 361,541 | | | $ | 94,809 | | | $ | 456,350 | |
| Owner-occupied CRE | 484,091 | | | 342,635 | | | 826,726 | |
| Non-owner occupied CRE | 935,642 | | | 544,387 | | | 1,480,029 | |
| Total commercial business | 1,781,274 | | | 981,831 | | | 2,763,105 | |
| Residential real estate | 333,827 | | | 60,627 | | | 394,454 | |
| Real estate construction and land development: | | | | | |
| Residential | 9,783 | | | 1,135 | | | 10,918 | |
| Commercial and multifamily | 76,018 | | | 53,375 | | | 129,393 | |
| Total real estate construction and land development | 85,801 | | | 54,510 | | | 140,311 | |
| Consumer | 16,882 | | | 88 | | | 16,970 | |
| Total | $ | 2,217,784 | | | $ | 1,097,056 | | | $ | 3,314,840 | |
(1) Includes $285.7 million of commercial business loans with floating or adjustable interest rates in which the Company entered into non-hedge interest rate swap contracts with the borrower and a third-party. Under these derivative contract arrangements, the Company effectively earns a variable rate of interest based on the one-month SOFR plus a margin, except for interest rate swap contracts on construction loans that earn fixed rates until the end of the construction period and the variable rate swap becomes effective.
Loans classified as nonaccrual, performing modified loans and nonperforming assets
The following tables provide information about our nonaccrual loans, performing modified loans and nonperforming assets at the dates indicated:
| | | | | | | | | | | | | | | | | | | | | | | |
| | | | | Change |
| December 31, 2024 | | December 31, 2023 | | $ | | % |
| (Dollars in thousands) |
Nonaccrual loans:(1) | | | | | | | |
| Commercial business | $ | 3,919 | | | $ | 4,468 | | | $ | (549) | | | (12.3) | % |
| | | | | | | |
| | | | | | | |
| Consumer | 160 | | | — | | | 160 | | | 100.0 | |
| Total nonaccrual loans | 4,079 | | | 4,468 | | | (389) | | | (8.7) | |
| Accruing loans past due 90 days or more | 1,195 | | | 1,293 | | | (98) | | | (7.6) | |
| Total nonperforming loans | 5,274 | | | 5,761 | | | (487) | | | (8.5) | |
| Other real estate owned | — | | | — | | | — | | | — |
| Total nonperforming assets | $ | 5,274 | | | $ | 5,761 | | | $ | (487) | | | (8.5) | % |
| | | | | | | |
| Credit quality ratios: | | | | | | | |
| Nonaccrual loans to loans receivable | 0.08 | % | | 0.10 | % | | (0.02) | % | | (20.0) | % |
| Nonperforming loans to loans receivable | 0.11 | | | 0.13 | | | (0.02) | | | (15.4) | |
| Nonperforming assets to total assets | 0.07 | | | 0.08 | | | (0.01) | | | (12.5) | |
| | | | | | | |
(1) At December 31, 2024 and December 31, 2023, $1.0 million, and $3.2 million, respectively, of nonaccrual loans were guaranteed by government agencies.
| | | | | | | | | | | | | | | | | | | | | | | |
| Year Ended December 31, | | Change |
| 2024 | | 2023 | | $ | | % |
| (Dollars in thousands) |
| Modified loans: | | | | | | | |
| Commercial business | $ | 21,162 | | | $ | 19,969 | | | $ | 1,193 | | | 6.0 | % |
| | | | | | | |
| Real estate construction and land development | 28,030 | | | 9,643 | | | 18,387 | | | 190.7 | |
| Consumer | 44 | | | 41 | | | 3 | | | 7.3 | |
| Total performing modified loans | $ | 49,236 | | | $ | 29,653 | | | $ | 19,583 | | | 66.0 | % |
The following table provides the changes in nonaccrual loans during the periods indicated:
| | | | | | | | | | | | | | | | | | | | | | | |
| Year Ended December 31, | | Change |
| 2024 | | 2023 | | $ | | % |
| (Dollars in thousands) |
| Balance, beginning of period | $ | 4,468 | | | $ | 5,906 | | | $ | (1,438) | | | (24.3) | % |
| Additions | 6,292 | | | 3,057 | | | 3,235 | | | 105.8 | |
| Net principal payments, sales and transfers to accruing status | (1,175) | | | (1,508) | | | 333 | | | (22.1) | |
| Payoffs | (2,733) | | | (2,987) | | | 254 | | | (8.5) | |
| Charge-offs | (2,773) | | | — | | | (2,773) | | | 100.0 | |
| | | | | | | |
| Balance, end of period | $ | 4,079 | | | $ | 4,468 | | | $ | (389) | | | (8.7) | % |
Nonaccrual loans decreased $0.4 million, or 8.7%, due primarily to ongoing collection efforts. Additions during the year ended December 31, 2024 were due primarily to one $5.0 million owner occupied CRE loan of which $2.5 million was charged off. Payoffs during the year ended December 31, 2024 were due primarily to the payoff of one commercial and industrial loan relationship.
Allowance for Credit Losses on Loans Overview
The following table provides information regarding changes in our ACL on loans for the years indicated:
| | | | | | | | | | | | | | | | | |
| | At or For the Years Ended December 31, |
| | 2024 | | 2023 | | 2022 |
| | (Dollars in thousands) |
| ACL on loans at the beginning of the period | $ | 47,999 | | | $ | 42,986 | | | $ | 42,361 | |
| Charge-offs: | | | | | |
| Commercial business | (2,953) | | | (719) | | | (316) | |
| Residential real estate | — | | | — | | | (30) | |
| | | | | |
| Consumer | (538) | | | (586) | | | (547) | |
| Total charge-offs | (3,491) | | | (1,305) | | | (893) | |
| Recoveries: | | | | | |
| Commercial business | 855 | | | 1,372 | | | 929 | |
| Residential real estate | — | | | — | | | 3 | |
| Real estate construction and land development | — | | | — | | | 384 | |
| Consumer | 122 | | | 210 | | | 765 | |
| Total recoveries | 977 | | | 1,582 | | | 2,081 | |
| Net (charge-offs) recoveries | (2,514) | | | 277 | | | 1,188 | |
| Provision for (reversal of) credit losses on loans | 6,983 | | | 4,736 | | | (563) | |
| ACL on loans at the end of period | $ | 52,468 | | | $ | 47,999 | | | $ | 42,986 | |
| | | | | |
| | | | | | | | | | | | | | | | | |
| | At or For the Years Ended December 31, |
| | 2024 | | 2023 | | 2022 |
| | (Dollars in thousands) |
| Credit quality ratios: | | | | | |
| ACL on loans to: | | | | | |
| Loans receivable | 1.09 | % | | 1.11 | % | | 1.06 | % |
| Nonaccrual loans | 1286.30 | | | 1074.28 | | | 727.84 | |
| Nonaccrual loans to loans receivable | 0.08 | % | | 0.10 | % | | 0.15 | % |
| | | | | |
| Balances at the end of the period: | | | | | |
| Loans receivable | $ | 4,802,123 | | | $ | 4,335,627 | | | $ | 4,050,858 | |
| Nonaccrual loans | 4,079 | | | 4,468 | | | 5,906 | |
| | | | | |
Average balances outstanding during the period:(1) | | | | | |
| Commercial business | $ | 3,522,065 | | | $ | 3,289,564 | | | $ | 3,188,238 | |
| Residential real estate | 399,857 | | | 369,297 | | | 250,780 | |
| Real estate construction and land development | 446,713 | | | 362,919 | | | 242,528 | |
| Consumer | 167,830 | | | 179,454 | | | 212,306 | |
| Total | $ | 4,536,465 | | | $ | 4,201,234 | | | $ | 3,893,852 | |
| | | | | |
| Net charge-offs (recoveries) during the period to average balances outstanding during the period: |
| 2024 | | 2023 | | 2022 |
| Commercial business | 0.06 | % | | (0.02) | % | | (0.02) | % |
| Residential real estate | — | | | — | | | 0.01 | |
| Real estate construction and land development | — | | | — | | | (0.16) | |
| Consumer | 0.25 | | | 0.21 | | | (0.10) | |
| Total | 0.06 | % | | (0.01) | % | | (0.03) | % |
(1) Average balances exclude the ACL on loans and loans held for sale, but include loans classified as nonaccrual.
The provision for credit losses on loans of $7.0 million recognized during the year ended December 31, 2024 was due primarily to growth in balances of collectively evaluated loans and secondarily to $2.5 million in charge-offs. The ACL on loans to loans receivable decreased to 1.09% as December 31, 2024, compared to 1.11% at December 31, 2023 due to changes in the loan mix as loan growth occurred in segments requiring a lower calculated reserve as a percentage of loans as well as a reduction in the baseline loss rates applied and weighted average life of the residential real estate and real estate construction and land development segments which contributed to a decrease in the ACL as a % of loans in these loan segments.
The following table presents the ACL on loans by loan portfolio segment at the indicated dates:
| | | | | | | | | | | | | | | | | | | | | | | | | | | | | | | | | | | |
| | December 31, 2024 | | December 31, 2023 |
| | ACL on Loans | | ACL as a % of Loans in Loan Category | | % of Loans in Loan Category to
Total Loans | | ACL on Loans | | ACL as a % of Loans in Loan Category | | % of Loans in Loan Category to
Total Loans |
| | (Dollars in thousands) |
| Commercial business | $ | 38,293 | | | 1.02 | % | | 78.3 | % | | $ | 31,303 | | | 0.93 | % | | 77.8 | % |
| Residential real estate | 3,464 | | | 0.86 | | | 8.4 | | | 3,473 | | | 0.93 | | | 8.7 | |
| Real estate construction and land development | 8,656 | | | 1.81 | | | 9.9 | | | 10,876 | | | 2.62 | | | 9.5 | |
| Consumer | 2,055 | | | 1.25 | | | 3.4 | | | 2,347 | | | 1.37 | | | 4.0 | |
| Total ACL on loans | $ | 52,468 | | | 1.09 | % | | 100.0 | % | | $ | 47,999 | | | 1.11 | % | | 100.0 | % |
Deposits Overview
The following table summarizes the Company's deposits at the dates indicated:
| | | | | | | | | | | | | | | | | | | | | | | | | | | | | | | | | | | |
| | December 31, 2024 | | December 31, 2023 | | Change |
| | Balance | | % of Total | | Balance | | % of Total | | $ | | % |
| | (Dollars in thousands) |
| Noninterest demand deposits | $ | 1,654,955 | | | 29.1 | % | | $ | 1,715,847 | | | 30.6 | % | | $ | (60,892) | | | (3.5) | % |
| Interest bearing demand deposits | 1,464,129 | | | 25.8 | | | 1,608,745 | | | 28.7 | | | (144,616) | | | (9.0) | |
| Money market accounts | 1,166,901 | | | 20.5 | | | 1,094,351 | | | 19.5 | | | 72,550 | | | 6.6 | |
| Savings accounts | 421,377 | | | 7.4 | | | 487,956 | | | 8.7 | | | (66,579) | | | (13.6) | |
| Total non-maturity deposits | 4,707,362 | | | 82.8 | | | 4,906,899 | | | 87.5 | | | (199,537) | | | (4.1) | |
| Certificates of deposit | 977,251 | | | 17.2 | | | 692,973 | | | 12.5 | | | 284,278 | | | 41.0 | |
| Total deposits | $ | 5,684,613 | | | 100.0 | % | | $ | 5,599,872 | | | 100.0 | % | | $ | 84,741 | | | 1.5 | % |
Total deposits increased $84.7 million, or 1.5%, to $5.68 billion at December 31, 2024, compared to $5.60 billion at December 31, 2023. Certificates of deposit increased $284.3 million, or 41.0%, to $977.3 million from $693.0 million and money market accounts increased $72.6 million, or 6.6%, to $1.17 billion from $1.09 billion primarily due to transfers from lower yielding non-maturity deposit accounts as customers moved balances to higher yielding accounts.
Total deposits include uninsured deposits of approximately $2.27 billion and $2.10 billion at December 31, 2024 and 2023, respectively, calculated in accordance with FDIC guidelines. Uninsured deposits included $267.8 million and $256.4 of fully collateralized deposits as of December 31, 2024 and December 31, 2023. The Bank does not hold any foreign deposits.
The following table provides the estimated uninsured portion of certificates of deposit that are in excess of the FDIC insurance limit, by remaining time until maturity at December 31, 2024, by account, with a maturity of:
| | | | | |
| |
| | (Dollars in thousands) |
| Three months or less | $ | 141,310 | |
| Over three months through six months | 172,544 | |
| Over six months through twelve months | 54,050 | |
| Over twelve months | 4,880 | |
| Total | $ | 372,784 | |
Stockholders' Equity Overview
The Company’s stockholders' equity to assets ratio was 12.2% and 11.9% at December 31, 2024 and 2023, respectively. The following table provides the changes to stockholders' equity during the periods indicated:
| | | | | | | | | | | | | | | | | | | | | | | |
| Year Ended December 31, | | Change |
| 2024 | | 2023 | | $ | | % |
| (Dollars in thousands) |
| Balance, beginning of period | $ | 853,261 | | | $ | 797,893 | | | $ | 55,368 | | | 6.9 | % |
| Net income | 43,258 | | | 61,755 | | | (18,497) | | | (30.0) | |
| Dividends declared | (32,150) | | | (31,112) | | | (1,038) | | | 3.3 | |
| Other comprehensive income (loss), net of tax | 17,232 | | | 27,374 | | | (10,142) | | | (37.0) | |
| Common stock repurchased | (22,418) | | | (6,974) | | | (15,444) | | | 221.5 | |
| Stock-based compensation expense | 4,344 | | | 4,325 | | | 19 | | | 0.4 | |
| Balance, end of period | $ | 863,527 | | | $ | 853,261 | | | $ | 10,266 | | | 1.2 | % |
Stockholders' equity increased for the year ended December 31, 2024 primarily as a result of net income and an increase in AOCI as a result of a decrease in other comprehensive income (loss), net of tax, which was positively impacted by the fair value of our investment securities available for sale and losses recognized on investment sales. AOCI has no effect on our regulatory capital ratios as the Company opted to exclude it from its common equity tier 1 capital. Cash dividends and stock repurchases partially offset the increase in stockholders' equity during the year ended December 31, 2024.
On April 24, 2024, the Board authorized the repurchase of up to 5% of the Company's outstanding common shares, or 1,734,492 shares in total, under a new stock repurchase program. The stock repurchase program does not obligate the Company to repurchase any shares of its common stock, and other than repurchases that have been completed to date, there is no assurance that the Company will make any repurchases in the future. Under the stock repurchase program, the Company may
repurchase shares of common stock from time to time in open market or privately negotiated transactions. The number, timing and price of shares repurchased will depend on business and market conditions, regulatory requirements, availability of funds and other factors, including opportunities to deploy the Company's capital. The Company may, in its discretion, begin, suspend or terminate repurchases at any time prior to the stock repurchase program’s expiration, without any prior notice. The stock repurchase program authorized in April 2024 superseded the previous stock repurchase program authorized in March 2020, which allowed for the repurchase of up to 5% of the Company's outstanding common shares, or 1,799,054 shares. At the time the April 2024 stock repurchase program was authorized, 3,910 shares remained available for purchase under the March 2020 stock repurchase program.
The Company repurchased 1,051,760 and 330,424 shares of its common stock under the Company's stock repurchase plan during the years ended December 31, 2024 and December 31, 2023, respectively. The Company also repurchased 31,850 and 32,792 shares during the years ended December 31, 2024 and December 31, 2023, respectively, which represented the cancellation of stock to pay withholding taxes on vested restricted stock awards or units. As of December 31, 2024, 990,522 shares remained available for future repurchases under the April 2024 stock repurchase program.
Liquidity and Capital Resources
Liquidity
Liquidity refers to the Company’s ability to provide funds at an acceptable cost to meet loan demand and deposit withdrawals, as well as contingency plans to meet unanticipated funding needs or loss of funding sources. These objectives can be met from either our assets or liabilities.
Asset liquidity sources consist of the repayments and maturities of loans, sales of loans, maturities of investment securities and sales of investment securities available for sale. These activities are generally included as investing activities in the Consolidated Statements of Cash Flows. Net cash used by investing activities was $85.9 million during the year ended December 31, 2024. Net increases in loan balances from both loan originations and purchases used $464.6 million of cash, while investment securities sales and maturities, net of purchases provided $406.2 million in cash.
Liquidity may also be affected by liabilities as a result of changes in deposits and borrowings. These activities are included in financing activities in the Consolidated Statements of Cash Flows. During the year ended December 31, 2024, financing activities used $86.5 million of funds resulting primarily from a decrease in short-term borrowings of $117.0 million, $31.8 million in dividend payments and $22.4 million in repurchases of common stock, offset partially by an increase in deposits of $84.7 million.
At December 31, 2024, we had outstanding loan commitments of $1.18 billion, primarily relating to undisbursed loans in process and unused credit lines as discussed in Note (18) Commitments and Contingencies of the Notes to Consolidated Financial Statements included in Item 8. Financial Statements and Supplementary Data of this Form 10-K. Loan commitments represent potential growth in the loan portfolio and lending activities. The current level of commitments is proportionally consistent with our historical experience and does not represent a departure from traditional operations. As of December 31, 2024, we had $17.8 million of purchase obligations under contracts with our key vendors to provide services, mainly information technology related contracts. In addition, as of December 31, 2024, we had $27.6 million of commitments under operating lease agreements.
We maintain sufficient cash and cash equivalents and investment securities to meet short-term liquidity needs and also actively monitor our long-term liquidity position to ensure the availability of capital resources for contractual obligations, strategic loan growth objectives and to fund operations. Our funding strategy has been to acquire non-maturity deposits from our retail accounts, acquire noninterest bearing demand deposits from our commercial customers and use our borrowing availability to fund growth in assets. We may also acquire brokered deposits when the cost of funds is advantageous compared to other funding sources. Borrowings may be used on a short-term basis to compensate for reductions in other sources of funds (such as deposit inflows at less than projected levels). Borrowings may also be used on a longer-term basis to support expanded lending activities and match the maturity of repricing intervals of assets. While maturities and scheduled amortization of loans are a predictable source of funds, deposit flows and loan prepayments are greatly influenced by the level of interest rates, economic conditions and competition so we adhere to internal management targets assigned to the loan to deposit ratio, liquidity ratio, net short-term non-core funding ratio and non-core liabilities to total assets ratio to ensure an appropriate liquidity position.
We maintain credit facilities with the FHLB, which provide for advances that in the aggregate would equal the lesser of 45% of the Bank’s assets or adjusted qualifying collateral (subject to a sufficient level of ownership of FHLB stock). At December 31, 2024, under these credit facilities based on pledged loan collateral, the Bank had $976.3 million of available credit capacity. The Bank had $383.0 million in outstanding borrowings from the FHLB at December 31, 2024, and none at December 31, 2023. In addition, the Bank has access to the FRB Discount Window and had access to the BTFP at December 31, 2023 and 2024, until the FRB ceased making new loans under the BTFP on March 11, 2024. Based on pledged investment collateral, the Bank had available lines of credit from the FRB of approximately $360.1 million as of December 31, 2024. The Bank had no outstanding borrowings from the FRB at December 31, 2024 and $500.0 million in outstanding borrowings under the BTFP at December 31, 2023. At December 31, 2024, the Bank also had uncommitted federal funds line of credit agreements with other financial institutions totaling $145.0 million. No balances were outstanding under these agreements as of either December 31, 2024 or 2023. Availability of lines of credit is subject to federal funds balances available for loan and continued borrower eligibility. These lines of credit are intended to support short-term liquidity needs and the agreements may restrict consecutive day usage. Management believes it has adequate resources and funding potential to meet our foreseeable liquidity requirements.
The following table summarizes the Company's available liquidity as of the dates indicated:
| | | | | | | | | | | |
| December 31,
2024 | | December 31,
2023 |
| (Dollars in thousands) |
| On-balance sheet liquidity | | | |
| Cash and cash equivalents | $ | 117,100 | | | $ | 224,973 | |
Unencumbered investment securities available for sale (1) | 746,163 | | | 756,258 | |
| Total on-balance sheet liquidity | $ | 863,263 | | | $ | 981,231 | |
| Off-balance sheet liquidity | | | |
| FRB borrowing availability | $ | 360,104 | | | $ | 319,492 | |
FHLB borrowing availability (2) | 976,288 | | | 1,417,518 | |
| Fed funds line borrowing availability with correspondent banks | 145,000 | | | 145,000 | |
| Total off-balance sheet liquidity | $ | 1,481,392 | | | $ | 1,882,010 | |
| Total available liquidity | $ | 2,344,655 | | | $ | 2,863,241 | |
(1) Investment securities available for sale at fair value.
(2) Includes FHLB borrowing availability of $1.36 billion at December 31, 2024 based on pledged assets, however, maximum credit capacity is 45% of the Bank's total assets one quarter in arrears or $3.22 billion.
Capital Resources
The Company pays dividends to its shareholders. The primary source of the Company's liquidity is dividends from the Bank to the Company. The Bank is subject to strict regulatory capital ratios, and may not be able to issue dividends to the Company in an amount sufficient to maintain our current or anticipated dividend practices. We expect to continue our current practice of paying quarterly cash dividends on our common stock subject to our Board's discretion to modify or terminate this practice at any time and for any reason without prior notice. No assurances can be given that any dividends will be paid on our common stock in future periods or that, if paid, such dividends will not be reduced in amount. Our current quarterly common stock dividend rate is $0.24 per share, as approved by our Board on January 22, 2025. We believe this dividend rate per share enables us to balance our multiple objectives of managing and investing in the Bank and returning a substantial portion of our cash to our shareholders. Assuming continued payment during 2025 at this rate, our average total dividend paid each quarter would be approximately $8.2 million based on the current number of our outstanding shares (assuming no increases or decreases in the number of shares).
From time to time, our Board has authorized stock repurchase plans. In general, stock repurchase plans allow us to proactively manage our capital position and return excess capital to shareholders. Shares purchased under such stock repurchase plans may also provide us with shares of common stock necessary to satisfy obligations related to stock compensation awards. The Company's current stock repurchase program authorizes us to repurchase up to 5% of the Company's outstanding common shares, or 1,734,492 in total, of which 990,522 shares remained available for future repurchases as of December 31, 2024. The actual timing, number and value of shares repurchased under the stock repurchase program will depend on a number of factors, including constraints specified pursuant to any trading plan that may be adopted under Rule 10b5-1 of the SEC, price, general business and market conditions, and alternative investment opportunities. See Item 5 Market for Registrant’s Common Equity, Related Stockholder Matters and Issuer Purchases of Equity Securities of this Form 10-K for additional information relating to stock repurchases.
Management believes that the Company's capital sources are adequate to meet all of the Company's reasonably foreseeable short-term and intermediate-term requirements.
Critical Accounting Estimates
Critical accounting estimates are those estimates made in accordance with generally accepted accounting principles that involve a significant level of estimation uncertainty and have had or are reasonably likely to have a material impact on the Company's financial condition or results of operations. The Company considers its critical accounting estimates to be as follows:
ACL on Loans
Management's estimate of the ACL on loans relies on the identification, stratification and separate estimates of loss for both loans individually evaluated for loss and loans collectively evaluated for loss. The estimate of loss for loans collectively evaluated for loss in particular involves a significant level of estimation uncertainty due to its complexity and the quantity of relevant inputs, including: management's determination of baseline loss rate multipliers based on a third party forecast of economic conditions, estimates of the reasonable and supportable forecast period, estimates of the baseline loss rate lookback period, estimates of the reversion period from the reasonable and supportable forecast period to the baseline loss rate and estimates of the prepayment rate and related lookback period. Additionally, management considers other qualitative risk factors to further adjust the estimated ACL on loans through a qualitative allowance.
Management's estimates for these inputs are based on past events and current conditions, are inherently subjective and are susceptible to significant revision as new or different information becomes available. While management utilizes its best judgment and information available at the time of evaluation to recognize credit losses on loans, future additions to the allowance
may be necessary based on declines in local and national economic conditions or other factors. In addition, various regulatory agencies, as an integral part of their examination process, periodically review the Company’s ACL on loans. Such agencies may require the Company make adjustments to the allowance based on their interpretation of information available to them at the time of their examinations. Unanticipated changes in any of these inputs could have a significant impact on our financial condition and results of operations.
For additional information regarding the ACL on loans, its relation to the provision for credit losses and its risk related to asset quality and lending activity, see Item 1A. Risk Factors—The Company’s allowance for credit losses may prove to be insufficient to absorb potential losses in its loan portfolio, as well as Note (1) Description of Business, Basis of Presentation, Significant Accounting Policies and Recently Issued Accounting Pronouncements and Note (4) Allowance for Credit Losses on Loans of the Notes to Consolidated Financial Statements included in Item 8. Financial Statements And Supplementary Data of this Form 10-K.
Goodwill
Goodwill is tested for impairment at the reporting unit level on an annual basis as of December 31 each year, and more frequently if events or circumstances indicate that there may be impairment. Goodwill impairment is determined by comparing the fair value of a reporting unit to its carrying amount. If the fair value of the reporting unit is less than its carrying value, the difference is the amount of impairment and goodwill is written down to the fair value of the reporting unit. The Company has a single reporting unit.
In testing goodwill, the Company may assess qualitative factors to determine whether it is more likely than not that the fair value of the reporting unit is less than its carrying amount. In this qualitative assessment, the Company evaluates events and circumstances which may include, but are not limited to: the general economic environment; banking industry and market conditions; a significant adverse change in legal factors; significant decline in our stock price and market capitalization; unanticipated competition; the testing for recoverability of a significant asset group within the reporting unit; and an adverse action or assessment by a regulator.
If the quantitative impairment test is required or the decision to bypass the qualitative assessment is elected, the Company performs the goodwill impairment test by comparing the fair value of a reporting unit with its carrying amount, including goodwill. The determination of the fair value of a reporting unit is a subjective process that involves the use of estimates and judgments about economic and industry factors and the growth and earnings prospects of the Bank. Variability in the market and changes in assumptions or subjective measurements used to estimate fair value are reasonably possible and may have a material impact on our consolidated financial statements or results of operations.
The Company performed its annual goodwill impairment test during the fourth quarter of 2024 which consisted of a qualitative assessment and determined that it is more likely than not that the fair value of the reporting unit exceeded the carrying value, such that the Company's goodwill was not considered impaired for the year ended December 31, 2024. Changes in the economic environment, operations of the reporting unit or other adverse events, could result in future impairment charges which could have a material adverse impact on the Company’s operating results.
For additional information regarding goodwill, see Note (1) Description of Business, Basis of Presentation, Significant Accounting Policies and Recently Issued Accounting Pronouncements and Note (6) Goodwill and Other Intangible Assets of the Notes to Consolidated Financial Statements included in Item 8. Financial Statements And Supplementary Data.
ITEM 7A. QUANTITATIVE AND QUALITATIVE DISCLOSURES ABOUT MARKET RISK
Like other financial institutions, the Company is subject to direct and indirect market risk. Market risk represents the risk of loss due to changes in market values of assets and liabilities. We incur direct market risk in the normal course of business through our exposure to market interest rates, equity prices and credit spreads. Our primary market risk is interest rate risk, which is the risk of loss of net interest income or net interest margin resulting from changes in market interest rates. Interest rate risk results primarily from the traditional banking activities in which the Company engages, such as gathering deposits and extending loans. Many factors, including economic and financial conditions, movements in interest rates and consumer preferences, affect the difference between the interest earned on our assets and the interest paid on our liabilities.
Our Asset/Liability Management Committee is responsible for developing, monitoring and reviewing asset/liability processes, interest rate risk exposures, strategies and tactics and reporting to the Risk and Technology Committee of the Board. It is the responsibility of the Board to establish policies and interest rate limits and to approve these policies and interest rate limits annually. It is the responsibility of management to execute the approved policies, develop and implement risk management strategies and to report to the Board on a regular basis. We maintain an asset/liability management policy that provides guidelines for controlling exposure to interest rate risk. The policy guidelines direct management to assess the impact of changes in interest rates upon both earnings and capital. These guidelines establish limits for interest rate risk sensitivity.
Net interest income simulation
We use an income simulation model as the primary tool to assess the direction and magnitude of changes in net interest income resulting from changes in interest rates. Modeling the sensitivity of net interest income is highly dependent on numerous assumptions incorporated into the modeling process. Key assumptions in the model include prepayment speeds on loans and investment securities, repricing betas on non-maturity deposits, and repricing on investment securities, loans, and borrowings. In order to measure the interest rate risk sensitivity as of December 31, 2024, this simulation model uses a “static balance sheet” assumption, meaning the size and mix of the balance sheet remains the same as maturing cash flows from assets and liabilities
are reinvested into the same categories at the current level of interest rates. The simulation also assumes an instantaneous and sustained uniform change in market interest rates at all maturities.
The following table summarizes the estimated effect on net interest income over a 12 month period measured against a flat rate (no interest rate change) scenario for the periods indicated:
| | | | | | | | | | | | | | | | | | | | | | | |
| December 31, 2024 | | December 31, 2023 |
| $ Change in Net Interest Income | | % Change in Net Interest Income | | $ Change in Net Interest Income | | % Change in Net Interest Income |
| Change in Interest Rates (Basis Points) | (Dollars in thousands) |
| +300(shock) | $ | (8,112) | | | (3.5) | % | | $ | (6,343) | | | (2.8) | % |
| +200(shock) | (218) | | | (0.1) | | | 1,438 | | | 0.6 | |
| +100(shock) | 658 | | | 0.3 | | | 1,644 | | | 0.7 | |
| +0(flat) | — | | | — | | | — | | | — | |
| -100(shock) | (72) | | | — | | | 1,861 | | | 0.8 | |
| -200(shock) | (2,624) | | | (1.1) | | | 1,549 | | | 0.7 | |
| -300(shock) | (8,195) | | | (3.6) | | | (1,233) | | | (0.6) | |
The Company’s balance sheet sensitivity to changes in market rates remains somewhat neutral, meaning results are similar in the rates up and down scenarios over a twelve month time horizon. Current results are similar to prior year results when the Company's modeled balance sheet results first shifted from an asset sensitive position to more of a neutral position. The simulation results are within the Board-established policy limits for all listed scenarios. Additionally, for all of the various interest rate scenarios modeled and measured by management as presented in the preceding table, the results at December 31, 2024 were well within established risk tolerances as established by policy.
The simulation results noted above do not incorporate any management actions that might moderate the negative consequences of interest rate deviations. In addition, the simulation results noted above contain various assumptions such as a static balance sheet, and the rate that deposit interest rates change as market interest rates change. Therefore, these simulation results do not likely reflect actual results, but continue to serve as estimates of interest rate risk.
As with any method of measuring interest rate risk, certain shortcomings are inherent in the method of analysis presented in the preceding table. For example, although certain of the Company’s assets and liabilities may have similar maturities or repricing time frames, they may react in different degrees to changes in market interest rates. In addition, the interest rates on certain of the Company’s asset and liability categories may precede, or lag behind, changes in market interest rates. Also, the actual rates of prepayments on loans and investments could vary significantly from the assumptions utilized in deriving the results as presented in the preceding table. Further, a change in Treasury rates accompanied by a change in the shape of the treasury yield curve could result in different estimations from those presented herein. Accordingly, the results in the preceding table should not be relied upon as indicative of actual results in the event of changing market interest rates.
Liquidity risk
Economic conditions have made liquidity risk, primarily funding liquidity risk, a more prevalent concern among financial institutions in recent years. In general, liquidity risk is the risk of being unable to fund obligations to creditors, including, in the case of financial institutions, obligations to depositors, as such obligations become due and/or fund the acquisition of assets. Liquidity refers to our ability to fund operations, meet depositor withdrawals, provide for our customers’ credit needs and meet maturing obligations and existing commitments as they come due. Our liquidity principally depends on cash flows from the Bank’s operating activities, investment in and maturity of assets, changes in balances of deposits and borrowings and our ability to borrow funds. To manage liquidity risk, the Bank has several sources of liquidity in place to maximize funding availability and increase the diversification of funding sources, including credit facilities with the FHLB, access to the FRB Discount Window and uncommitted federal funds line of credit agreements with other financial institutions. These sources of liquidity are described in more detail in Item 7. Management’s Discussion and Analysis of Financial Condition and Results of Operations and in Note (10) Other Borrowings of the Notes to Consolidated Financial Statements included in Item 8. Financial Statements And Supplementary Data of this Form 10-K. The criteria for evaluating the use of these sources include volume concentration (percentage of liabilities), cost, volatility and the fit with the current asset/liability management plan.
Other market risks
In addition to the foregoing, the Company is also subject to operational risks, such as the risk of loss due to human behavior, inadequate or failed internal systems and controls or external influences such as market conditions, fraudulent activities, disasters and other security risks. The Company’s management engages in ongoing monitoring of and efforts to strengthen its system of internal controls, enterprise risk management, operating processes and employee awareness to improve oversight of the Company’s operational risk. The Company is also subject to compliance risks, including the risk of regulatory sanctions, reputational impact or financial loss resulting from failure to comply with rules and regulations issued by the various banking agencies and standards of good banking practice, and to strategic/operation risks, including the risk of loss due to impairment of reputation, failure to fully develop and execute business plans, failure to assess current and new opportunities in business and other events not identified in the risk types mentioned previously. Mitigation of the various risk elements that represent
compliance, strategic and/or reputation risk is achieved through initiatives to help management better understand and report on various indicators and causes of these risks, including those related to the development of new products and business initiatives.
ITEM 8. FINANCIAL STATEMENTS AND SUPPLEMENTARY DATA
REPORT OF INDEPENDENT REGISTERED PUBLIC ACCOUNTING FIRM
Shareholders and the Board of Directors of Heritage Financial Corporation
Olympia, Washington
Opinions on the Financial Statements and Internal Control over Financial Reporting
We have audited the accompanying Consolidated Statements of Financial Condition of Heritage Financial Corporation and Subsidiaries (the "Company") as of December 31, 2024 and 2023, the related Consolidated Statements of Income, Comprehensive Income (Loss), Stockholders’ Equity, and Cash Flows, for each of the years in the three-year period ended December 31, 2024, and the related notes (collectively referred to as the "financial statements"). We also have audited the Company’s internal control over financial reporting as of December 31, 2024, based on criteria established in the 2013 Internal Control – Integrated Framework issued by the Committee of Sponsoring Organizations of the Treadway Commission (“COSO”).
In our opinion, the financial statements referred to above present fairly, in all material respects, the financial position of the Company as of December 31, 2024 and 2023, and the results of its operations and its cash flows for each of the years in the three-year period ended December 31, 2024 in conformity with accounting principles generally accepted in the United States of America. Also in our opinion, the Company maintained, in all material respects, effective internal control over financial reporting as of December 31,2024, based on criteria established in the 2013 Internal Control – Integrated Framework issued by COSO.
Basis for Opinions
The Company’s management is responsible for these financial statements, for maintaining effective internal control over financial reporting, and for its assessment of the effectiveness of internal control over financial reporting, included in the accompanying Management’s Report on Internal Control over Financial Reporting. Our responsibility is to express an opinion on the Company’s financial statements and an opinion on the Company’s internal control over financial reporting based on our audits. We are a public accounting firm registered with the Public Company Accounting Oversight Board (United States) ("PCAOB") and are required to be independent with respect to the Company in accordance with the U.S. federal securities laws and the applicable rules and regulations of the Securities and Exchange Commission and the PCAOB.
We conducted our audits in accordance with the standards of the PCAOB. Those standards require that we plan and perform the audits to obtain reasonable assurance about whether the financial statements are free of material misstatement, whether due to error or fraud, and whether effective internal control over financial reporting was maintained in all material respects.
Our audits of the financial statements included performing procedures to assess the risks of material misstatement of the financial statements, whether due to error or fraud, and performing procedures that respond to those risks. Such procedures included examining, on a test basis, evidence regarding the amounts and disclosures in the financial statements. Our audits also included evaluating the accounting principles used and significant estimates made by management, as well as evaluating the overall presentation of the financial statements. Our audit of internal control over financial reporting included obtaining an understanding of internal control over financial reporting, assessing the risk that a material weakness exists, and testing and evaluating the design and operating effectiveness of internal control based on the assessed risk. Our audits also included performing such other procedures as we considered necessary in the circumstances. We believe that our audits provide a reasonable basis for our opinions.
Definition and Limitations of Internal Control Over Financial Reporting
A company’s internal control over financial reporting is a process designed to provide reasonable assurance regarding the reliability of financial reporting and the preparation of financial statements for external purposes in accordance with generally accepted accounting principles. A company’s internal control over financial reporting includes those policies and procedures that (1) pertain to the maintenance of records that, in reasonable detail, accurately and fairly reflect the transactions and dispositions of the assets of the company; (2) provide reasonable assurance that transactions are recorded as necessary to permit preparation of financial statements in accordance with generally accepted accounting principles, and that receipts and expenditures of the company are being made only in accordance with authorizations of management and directors of the company; and (3) provide reasonable assurance regarding prevention or timely detection of unauthorized acquisition, use, or disposition of the company’s assets that could have a material effect on the financial statements.
Because of its inherent limitations, internal control over financial reporting may not prevent or detect misstatements. Also, projections of any evaluation of effectiveness to future periods are subject to the risk that controls may become inadequate because of changes in conditions, or that the degree of compliance with the policies or procedures may deteriorate.
Critical Audit Matter
The critical audit matter communicated below is a matter arising from the current period audit of the financial statements that was communicated or required to be communicated to the audit committee and that: (1) relates to accounts or disclosures that are material to the financial statements and (2) involved our especially challenging, subjective, or complex judgments. The communication of the critical audit matter does not alter in any way our opinion on the financial statements, taken as a whole,
and we are not, by communicating the critical audit matter below, providing a separate opinion on the critical audit matter or on the accounts or disclosures to which it relates.
Allowance for Credit Losses on Loans – Qualitative Allowance
As described in Note (1) Description of Business, Basis of Presentation, Significant Accounting Policies and Recently Issued Accounting Pronouncements and Note (4) Allowance for Credit Losses on Loans to the consolidated financial statements, the Company’s consolidated allowance for credit losses (“ACL”) on loans was $52.5 million at December 31, 2024 and provision for credit losses on loans was $7.0 million for the year then ended. The evaluation of ACL on loans is inherently subjective as it requires estimates that are susceptible to significant revision as more information becomes available. While management utilizes its best judgment and information available to recognize estimated losses on loans, future additions to the allowance may be necessary based on further declines in local and national economic conditions.
The Company primarily uses a historic loss, open pool credit loss methodology to calculate the ACL on loans, which the Company has applied to identified loan segments with similar risk characteristics. The allowance for collectively evaluated loans is comprised of the baseline loss allowance, the macroeconomic allowance, and the qualitative allowance. The baseline loss allowance begins with the baseline loss rates calculated using average quarterly historical loss information for an economic cycle.
The baseline loss rates are applied to each loan’s estimated cash flows over the life of the loan under the remaining life method to determine the baseline loss estimate for each loan. The Company uses macroeconomic scenarios from an independent third party. These scenarios are based on past events, current conditions, the likelihood of future events occurring and include consideration of the forecasted direction of the economic and business environment and its likely impact on the estimated allowance as compared to the historical losses over the reasonable and supportable time frame. Management also considers other qualitative risk factors to further adjust the estimated ACL on loans through a qualitative allowance. Qualitative adjustments primarily relate to certain segments of the loan portfolio deemed by management to be of a higher-risk profile where management believes the quantitative component of the Company’s ACL model may not have fully captured the associated impact to the ACL. Qualitative adjustments also relate to heightened uncertainty as to future macroeconomic conditions and the related impact on the loan segments.
The subjective nature of the qualitative risk factor adjustments requires significant judgment by management both in the selection of qualitative factors to apply, if any, and the magnitude of the adjustment once selected. The audit procedures over the qualitative allowance utilized in management’s methodology involved especially challenging and subjective auditor judgment. Therefore, we identified auditing the ACL qualitative allowance as a critical audit matter.
Our audit procedures to address this critical audit matter primarily included the following:
•Tested the operating effectiveness of controls over application of the qualitative factors, including:
◦The Company’s ACL committee’s review and approval of the qualitative risk factor adjustments used to derive the qualitative allowance for the ACL on loans, and the relevance and reliability of the data used therein.
◦Management’s controls over the completeness and accuracy of the data utilized in the qualitative allowance for the ACL on loans.
•Substantively tested management’s application of the macroeconomic sensitive model and related factors including:
◦Evaluated the reasonableness of management’s judgments used in the determination of the qualitative risk factor adjustments by loan segment and the resulting allocation to the qualitative allowance for the ACL on loans.
◦Evaluated the reliability and relevance of data used as a basis for the qualitative risk factor adjustments.
◦Tested the completeness and accuracy of the data utilized in management’s ACL methodology to derive the qualitative allowance for the ACL on loans.
/s/ Crowe LLP
We have served as the Company's auditor since 2012.
Denver, Colorado
February 27, 2025
HERITAGE FINANCIAL CORPORATION AND SUBSIDIARIES
CONSOLIDATED STATEMENTS OF FINANCIAL CONDITION
(Dollars in thousands, except share data)
| | | | | | | | | | | |
| December 31, 2024 | | December 31, 2023 |
| ASSETS | | | |
| Cash on hand and in banks | $ | 58,821 | | | $ | 55,851 | |
| Interest earning deposits | 58,279 | | | 169,122 | |
| Cash and cash equivalents | 117,100 | | | 224,973 | |
| Investment securities available for sale, at fair value, net (amortized cost of $835,592 and $1,227,787, respectively) | 764,394 | | | 1,134,353 | |
| Investment securities held to maturity, at amortized cost, net (fair value of $623,452 and $662,450, respectively) | 703,285 | | | 739,442 | |
| Total investment securities | 1,467,679 | | | 1,873,795 | |
| | | |
| Loans receivable | 4,802,123 | | | 4,335,627 | |
| Allowance for credit losses on loans | (52,468) | | | (47,999) | |
| Loans receivable, net | 4,749,655 | | | 4,287,628 | |
| | | |
| Premises and equipment, net | 71,580 | | | 74,899 | |
| Federal Home Loan Bank stock, at cost | 21,538 | | | 4,186 | |
| Bank owned life insurance | 111,699 | | | 125,655 | |
| Accrued interest receivable | 19,483 | | | 19,518 | |
| Prepaid expenses and other assets | 303,452 | | | 318,571 | |
| Other intangible assets, net | 3,153 | | | 4,793 | |
| Goodwill | 240,939 | | | 240,939 | |
| Total assets | $ | 7,106,278 | | | $ | 7,174,957 | |
| LIABILITIES AND STOCKHOLDERS' EQUITY | | | |
| Non-interest bearing deposits | $ | 1,654,955 | | | $ | 1,715,847 | |
| Interest bearing deposits | 4,029,658 | | | 3,884,025 | |
| Total deposits | 5,684,613 | | | 5,599,872 | |
| Borrowings | 383,000 | | | 500,000 | |
| Junior subordinated debentures | 22,058 | | | 21,765 | |
| | | |
| Accrued expenses and other liabilities | 153,080 | | | 200,059 | |
| Total liabilities | 6,242,751 | | | 6,321,696 | |
| Commitments and contingencies (Note 18) | | | |
| Stockholders’ equity: | | | |
| Preferred stock, no par value, 2,500,000 shares authorized; no shares issued and outstanding, respectively | — | | | — | |
| Common stock, no par value, 50,000,000 shares authorized; 33,990,827 and 34,906,233 shares issued and outstanding, respectively | 531,674 | | | 549,748 | |
| Retained earnings | 387,097 | | | 375,989 | |
| Accumulated other comprehensive loss, net | (55,244) | | | (72,476) | |
| Total stockholders’ equity | 863,527 | | | 853,261 | |
| Total liabilities and stockholders’ equity | $ | 7,106,278 | | | $ | 7,174,957 | |
See accompanying Notes to Consolidated Financial Statements.
HERITAGE FINANCIAL CORPORATION AND SUBSIDIARIES
CONSOLIDATED STATEMENTS OF INCOME
(Dollars in thousands, except shares and per share data)
| | | | | | | | | | | | | | | | | |
| Year Ended December 31, |
| 2024 | | 2023 | | 2022 |
| INTEREST INCOME: | | | | | |
| Interest and fees on loans | $ | 247,472 | | | $ | 217,284 | | | $ | 174,275 | |
| Taxable interest on investment securities | 54,972 | | | 58,509 | | | 40,627 | |
| Nontaxable interest on investment securities | 651 | | | 1,854 | | | 3,488 | |
| Interest on interest earning deposits | 6,617 | | | 6,818 | | | 9,067 | |
| Total interest income | 309,712 | | | 284,465 | | | 227,457 | |
| INTEREST EXPENSE: | | | | | |
| Deposits | 75,069 | | | 39,350 | | | 6,772 | |
| Junior subordinated debentures | 2,139 | | | 2,074 | | | 1,156 | |
| Securities sold under agreement to repurchase | — | | | 153 | | | 138 | |
| Borrowings | 23,140 | | | 17,733 | | | 6 | |
| Total interest expense | 100,348 | | | 59,310 | | | 8,072 | |
| Net interest income | 209,364 | | | 225,155 | | | 219,385 | |
| Provision for (reversal of) credit losses | 6,282 | | | 4,280 | | | (1,426) | |
| Net interest income after provision for (reversal of) credit losses | 203,082 | | | 220,875 | | | 220,811 | |
| NONINTEREST INCOME: | | | | | |
| Service charges and other fees | 11,285 | | | 10,966 | | | 10,390 | |
| Card revenue | 7,752 | | | 8,340 | | | 8,885 | |
| Loss on sale of investment securities, net | (22,742) | | | (12,231) | | | (256) | |
| Gain on sale of loans, net | 26 | | | 343 | | | 633 | |
| Interest rate swap fees | 409 | | | 230 | | | 402 | |
| Bank owned life insurance income | 2,967 | | | 2,934 | | | 3,747 | |
| Gain on sale of other assets, net | 1,552 | | | 2 | | | 469 | |
| Other income | 6,224 | | | 8,079 | | | 5,321 | |
| Total noninterest income | 7,473 | | | 18,663 | | | 29,591 | |
| NONINTEREST EXPENSE: | | | | | |
| Compensation and employee benefits | 98,527 | | | 100,083 | | | 92,092 | |
| Occupancy and equipment | 19,289 | | | 19,156 | | | 17,465 | |
| Data processing | 14,899 | | | 17,116 | | | 15,905 | |
| Marketing | 988 | | | 1,930 | | | 1,643 | |
| Professional services | 2,515 | | | 4,227 | | | 2,497 | |
| State/municipal business and use taxes | 4,889 | | | 4,059 | | | 3,634 | |
| Federal deposit insurance premium | 3,260 | | | 3,312 | | | 2,015 | |
| | | | | |
| Amortization of intangible assets | 1,640 | | | 2,434 | | | 2,750 | |
| Other expense | 12,289 | | | 14,306 | | | 12,965 | |
| Total noninterest expense | 158,296 | | | 166,623 | | | 150,966 | |
| Income before income taxes | 52,259 | | | 72,915 | | | 99,436 | |
| Income tax expense | 9,001 | | | 11,160 | | | 17,561 | |
| Net income | $ | 43,258 | | | $ | 61,755 | | | $ | 81,875 | |
| Basic earnings per share | $ | 1.26 | | | $ | 1.76 | | | $ | 2.33 | |
| Diluted earnings per share | $ | 1.24 | | | $ | 1.75 | | | $ | 2.31 | |
| Dividends declared per share | $ | 0.92 | | | $ | 0.88 | | | $ | 0.84 | |
| Average number of basic shares outstanding | 34,465,323 | | | 35,022,247 | | | 35,103,465 | |
| Average number of diluted shares outstanding | 34,899,036 | | | 35,258,189 | | | 35,463,896 | |
See accompanying Notes to Consolidated Financial Statements.
HERITAGE FINANCIAL CORPORATION AND SUBSIDIARIES
CONSOLIDATED STATEMENTS OF COMPREHENSIVE INCOME (LOSS)
(Dollars in thousands)
| | | | | | | | | | | | | | | | | |
| Year Ended December 31, |
| 2024 | | 2023 | | 2022 |
| Net income | $ | 43,258 | | | $ | 61,755 | | | $ | 81,875 | |
| Change in fair value of investment securities available for sale, net of tax of $(290), $4,850 and $(30,372), respectively | (217) | | | 18,075 | | | (108,977) | |
| Amortization of net unrealized gain for the reclassification of investment securities available for sale to held to maturity, net of tax of $(73), $(69) and $(130), respectively | (260) | | | (248) | | | (469) | |
| Reclassification adjustment for net loss from sale of investment securities available for sale included in income, net of tax benefit of $5,033, $2,684 and $56, respectively | 17,709 | | | 9,547 | | | 200 | |
| Other comprehensive income (loss) | 17,232 | | | 27,374 | | | (109,246) | |
| Comprehensive income (loss) | $ | 60,490 | | | $ | 89,129 | | | $ | (27,371) | |
See accompanying Notes to Consolidated Financial Statements.
HERITAGE FINANCIAL CORPORATION AND SUBSIDIARIES
CONSOLIDATED STATEMENTS OF STOCKHOLDERS' EQUITY
(Dollars in thousands, except shares and per share data)
| | | | | | | | | | | | | | | | | | | | | | | | | | | | | |
| Year Ended December 31, 2024 |
| Number of
common
shares | | Common
stock | | Retained
earnings | | AOCI | | Total
stockholders’
equity |
| Balance at December 31, 2023 | 34,906,233 | | | $ | 549,748 | | | $ | 375,989 | | | $ | (72,476) | | | $ | 853,261 | |
| Restricted stock units vested | 168,204 | | | | | | | | | — | |
| Stock-based compensation expense | | | 4,344 | | | | | | | 4,344 | |
| Common stock repurchased | (1,083,610) | | | (22,418) | | | | | | | (22,418) | |
| Net income | | | | | 43,258 | | | | | 43,258 | |
| Other comprehensive income, net of tax | | | | | | | 17,232 | | | 17,232 | |
| Cash dividends declared on common stock ($0.92 per share) | | | | | (32,150) | | | | | (32,150) | |
| Balance at December 31, 2024 | 33,990,827 | | | $ | 531,674 | | | $ | 387,097 | | | $ | (55,244) | | | $ | 863,527 | |
| | | | | | | | | | | | | | | | | | | | | | | | | | | | | |
| Year Ended December 31, 2023 |
| Number of
common
shares | | Common
stock | | Retained
earnings | | AOCI | | Total
stockholders’
equity |
| Balance at December 31, 2022 | 35,106,697 | | | $ | 552,397 | | | $ | 345,346 | | | $ | (99,850) | | | $ | 797,893 | |
| Restricted stock units vested | 162,752 | | | | | | | | | — | |
| Stock-based compensation expense | | | 4,325 | | | | | | | 4,325 | |
| Common stock repurchased | (363,216) | | | (6,974) | | | | | | | (6,974) | |
| Net income | | | | | 61,755 | | | | | 61,755 | |
| Other comprehensive income, net of tax | | | | | | | 27,374 | | | 27,374 | |
| Cash dividends declared on common stock ($0.88 per share) | | | | | (31,112) | | | | | (31,112) | |
| Balance at December 31, 2023 | 34,906,233 | | | $ | 549,748 | | | $ | 375,989 | | | $ | (72,476) | | | $ | 853,261 | |
| | | | | | | | | | | | | | | | | | | | | | | | | | | | | |
| Year Ended December 31, 2022 |
| Number of
common
shares | | Common
stock | | Retained
earnings | | AOCI | | Total
stockholders’
equity |
| Balance at December 31, 2021 | 35,105,779 | | | $ | 551,798 | | | $ | 293,238 | | | 9,396 | | | $ | 854,432 | |
| Restricted stock units vested | 127,952 | | | | | | | | | — | |
| Stock-based compensation expense | | | 3,795 | | | | | | | 3,795 | |
| Common stock repurchased | (127,034) | | | (3,196) | | | | | | | (3,196) | |
| Net income | | | | | 81,875 | | | | | 81,875 | |
| Other comprehensive loss, net of tax | | | | | | | (109,246) | | | (109,246) | |
| Cash dividends declared on common stock ($0.84 per share) | | | | | (29,767) | | | | | (29,767) | |
| Balance at December 31, 2022 | 35,106,697 | | | $ | 552,397 | | | $ | 345,346 | | | $ | (99,850) | | | $ | 797,893 | |
See accompanying Notes to Consolidated Financial Statements.
HERITAGE FINANCIAL CORPORATION AND SUBSIDIARIES
CONSOLIDATED STATEMENTS OF CASH FLOWS
(Dollars in thousands)
| | | | | | | | | | | | | | | | | |
| Year Ended December 31, |
| 2024 | | 2023 | | 2022 |
| Cash flows from operating activities: | | | | | |
| Net income | $ | 43,258 | | | $ | 61,755 | | | $ | 81,875 | |
| Adjustments to reconcile net income to net cash provided by operating activities: | | | | | |
| Depreciation, amortization and accretion | 1,591 | | | 3,170 | | | 341 | |
| Provision for (reversal of) credit losses | 6,282 | | | 4,280 | | | (1,426) | |
| Stock-based compensation expense | 4,344 | | | 4,325 | | | 3,795 | |
| Amortization of intangible assets | 1,640 | | | 2,434 | | | 2,750 | |
| Origination of mortgage loans held for sale | (1,318) | | | (14,833) | | | (15,190) | |
| Proceeds from sale of mortgage loans held for sale | 1,344 | | | 15,176 | | | 17,299 | |
| Deferred income tax (benefit) expense | (15,291) | | | (13,204) | | | 871 | |
| Bank owned life insurance income | (2,967) | | | (2,934) | | | (3,747) | |
| Valuation adjustment on interest rate swaps | — | | | — | | | (66) | |
| | | | | |
| Gain on sale of mortgage loans held for sale, net | (26) | | | (343) | | | (633) | |
| Loss (gain) on sale of investment securities, net | 22,742 | | | 12,231 | | | 256 | |
| Gain on sale of premises and equipment | (1,480) | | | — | | | (403) | |
| Gain on sale of branch | — | | | (610) | | | — | |
| Other | 4,364 | | | 38,076 | | | 8,734 | |
| Net cash provided by operating activities | 64,483 | | | 109,523 | | | 94,456 | |
| Cash flows from investing activities: | | | | | |
| Loan originations and purchases, net of payments | (464,585) | | | (280,664) | | | (225,149) | |
| Maturities and repayments of investment securities available for sale | 130,488 | | | 178,855 | | | 181,487 | |
| Maturities and repayments of investment securities held to maturity | 35,236 | | | 26,063 | | | 28,296 | |
| Purchase of investment securities available for sale | (33,132) | | | (178,396) | | | (790,871) | |
| Purchase of investment securities held to maturity | — | | | — | | | (412,835) | |
| Proceeds from sales of investment securities available for sale | 273,633 | | | 219,700 | | | 30,390 | |
| Purchase of premises and equipment | (3,459) | | | (10,376) | | | (4,016) | |
| | | | | |
| | | | | |
| Proceeds from sales of assets held for sale | 7,459 | | | — | | | 2,102 | |
| Proceeds from redemption of Federal Home Loan Bank stock | 47,552 | | | 50,318 | | | 2,002 | |
| Purchases of Federal Home Loan Bank stock | (64,904) | | | (45,588) | | | (2,985) | |
| Proceeds from sales of premises and equipment | 81 | | | 78 | | | 106 | |
| Purchases of bank owned life insurance | (18,531) | | | (1,382) | | | (230) | |
| Proceeds from bank owned life insurance death benefit | 1,157 | | | 20 | | | 2,114 | |
| Proceeds from surrender of bank owned life insurance | 29,790 | | | — | | | — | |
| Capital contributions to tax credit partnerships | (26,688) | | | (38,248) | | | (18,190) | |
| Net cash paid related to branch divestiture | — | | | (13,826) | | | — | |
| Net cash used by investing activities | (85,903) | | | (93,446) | | | (1,207,779) | |
| Cash flows from financing activities: | | | | | |
| Net increase (decrease) in deposits | 84,741 | | | (310,303) | | | (469,450) | |
| Proceeds from borrowings | 1,458,743 | | | 1,889,700 | | | 50,050 | |
| Repayment of borrowings | (1,575,743) | | | (1,389,700) | | | (50,050) | |
| Common stock cash dividends paid | (31,776) | | | (30,820) | | | (29,491) | |
| Net decrease in securities sold under agreement to repurchase | — | | | (46,597) | | | (4,242) | |
| Repurchase of common stock | (22,418) | | | (6,974) | | | (3,196) | |
| Net cash (used) provided by financing activities | (86,453) | | | 105,306 | | | (506,379) | |
| | | | | | | | | | | | | | | | | |
| Year Ended December 31, |
| 2024 | | 2023 | | 2022 |
| Net (decrease) increase in cash and cash equivalents | (107,873) | | | 121,383 | | | (1,619,702) | |
| Cash and cash equivalents at beginning of period | 224,973 | | | 103,590 | | | 1,723,292 | |
| Cash and cash equivalents at end of period | $ | 117,100 | | | $ | 224,973 | | | $ | 103,590 | |
| | | | | |
| Supplemental disclosures of cash flow information: | | | | | |
| Cash paid for interest | $ | 112,222 | | | $ | 46,135 | | | $ | 7,709 | |
| Cash paid for income taxes, net of refunds | 1,505 | | | 2,974 | | | 5,035 | |
| | | | | |
| Supplemental non-cash disclosures of cash flow information: | | | | | |
| | | | | |
| Investment in LIHTC partnerships and related funding commitment | 100 | | | 37,007 | | | 85,888 | |
| Loans received from return of NMTC equity method investment | — | | | — | | | 15,596 | |
| ROU assets obtained in exchange for new operating lease liabilities | 3,504 | | | 6,880 | | | 2,869 | |
| Transfers of premises and equipment classified as held for sale to prepaid expenses and other assets from premises and equipment, net | — | | | 5,974 | | | 910 | |
| Transfer of bank owned life insurance to prepaid expenses and other assets due to surrender of policies | 4,507 | | | — | | | — | |
| Transfer of bank owned life insurance to prepaid expenses and other assets due to death benefit accrued, but not received | — | | | 700 | | | — | |
| Transfer of deposits to deposits held for sale | — | | | — | | | 17,420 | |
| | | | | |
See accompanying Notes to Consolidated Financial Statements.
HERITAGE FINANCIAL CORPORATION AND SUBSIDIARIES
NOTES TO CONSOLIDATED FINANCIAL STATEMENTS
For the Years Ended December 31, 2024, 2023 and 2022
(1)Description of Business, Basis of Presentation, Significant Accounting Policies and Recently Issued Accounting Pronouncements
(a) Description of Business
The Company is primarily engaged in the business of planning, directing and coordinating the business activities of its wholly-owned subsidiary, the Bank. The Bank is headquartered in Olympia, Washington and conducts business from its 50 branch offices located throughout Washington State, the greater Portland, Oregon area, Eugene, Oregon, and Boise, Idaho. The Bank’s business consists primarily of commercial lending and deposit relationships with small and medium-sized businesses and their owners in its market areas and attracting deposits from the general public. The Bank also makes real estate construction and land development loans, consumer loans and originates home equity loans on residential properties primarily located in its market areas. The Bank's deposits are insured by the FDIC, subject to applicable limitations.
(b) Basis of Presentation
The accompanying audited Consolidated Financial Statements have been prepared in accordance with GAAP for annual financial information and pursuant to the rules and regulations of the SEC. To prepare the audited Consolidated Financial Statements in conformity with GAAP, management makes estimates and assumptions based on available information. These estimates and assumptions affect the amounts reported in the financial statements and the disclosures provided. Management believes that the judgments, estimates, and assumptions used in the preparation of the Consolidated Financial Statements were appropriate based on the facts and circumstances at the time. Actual results, however, could differ significantly from those estimates. Material estimates that are particularly susceptible to significant change relate to management's estimate of the ACL on investment securities, management's estimate of the ACL on loans, management's estimate of the ACL on unfunded commitments, management's evaluation of goodwill impairment and management's estimate of the fair value of financial instruments.
The accompanying Consolidated Financial Statements include the accounts of the Company and its wholly-owned subsidiary, the Bank. All significant intercompany balances and transactions among the Company and the Bank have been eliminated in consolidation. Certain prior year amounts in the Consolidated Statements of Income have been reclassified to conform to the current year’s presentation. Reclassifications had no effect on the prior year's net income or stockholders’ equity.
(c) Significant Accounting Policies
Cash and Cash Equivalents
Cash and cash equivalents include cash on hand and in banks and interest earning deposits due substantially from the FRB. Cash equivalents have a maturity of 90 days or less at the time of purchase.
Investment Securities
Investment securities for which the Company has the positive intent and ability to hold to maturity are classified as held to maturity and are carried at amortized cost. Investment securities held primarily for the purpose of selling in the near term are classified as trading securities and are reported at fair value, with unrealized gains and losses included in income. Investment securities not classified as held to maturity or trading are classified as available for sale and are reported at fair value with unrealized gains and losses, net of income taxes, as a separate component of other comprehensive income. The Company determines the appropriate classification of investment securities at the time of purchase and reassesses the classification at each reporting date. Any subsequent reassessment of classification and transfer of investment securities available for sale to held to maturity are completed at the amortized cost basis plus or minus the amount of any remaining unrealized holding gain or loss reported in AOCI of the individual investment securities available for sale. The unrealized holding gain or loss at the date of the transfer continues to be recognized in AOCI, but that gain or loss is amortized over the remaining life of the security using the interest method. When the Company acquires another entity, all investment securities are recorded at fair value and classified as available for sale at the acquisition date.
Realized gains and losses on sales of investment securities are recorded on the trade date in "Loss on sale of investment securities, net" in the Consolidated Statements of Income and determined using the specific identification method. Premiums and discounts on investment securities available for sale and held to maturity are amortized or accreted into income using the interest method. An investment security available for sale or held to maturity is placed on nonaccrual status at the time any principal or payments become more than 90 days delinquent and classified as past due after 30 days of nonpayment. Interest accrued, but not received for an investment security classified as nonaccrual is reversed against interest income during the period that the investment security is placed on nonaccrual status.
ACL on Investment Securities Available for Sale
Management evaluates the need for an ACL on investment securities available for sale on at least a quarterly basis, and more frequently when economic or market conditions warrant such an evaluation. For investment securities available for sale in an unrealized loss position, the Company first assesses whether it intends to sell or it is more likely than not that it will be required to sell the security before the recovery of its amortized cost basis. If either of the criteria regarding intent or requirement to sell is met, the security’s amortized cost basis is written down to fair value through a provision for credit loss against income. For investment securities available for sale that do not meet the aforementioned criteria, the Company evaluates whether the decline
in fair value has resulted from credit losses or other factors. In making this assessment, management considers the extent to which fair value is less than amortized cost, any changes to the rating of the security by a rating agency and adverse conditions specifically related to the security, among other factors. The credit loss is defined as the difference between the present value of the cash flows expected to be collected and the amortized cost basis. If the present value of cash flows expected to be collected is less than the amortized cost basis, a credit loss exists and an ACL on investment securities available for sale is recorded for the credit loss, limited by the amount that the fair value is less than the amortized cost basis. Any unrealized decline in fair value that has not been recorded through an ACL on investment securities available for sale is recognized in other comprehensive income (loss).
Accrued interest receivable on investment securities available for sale is excluded from the estimate of expected credit losses. Changes in the ACL on investment securities available for sale are recorded as provision for credit losses expense. Losses are charged against the ACL when management believes the uncollectibility of an investment security available for sale is confirmed or when either of the criteria regarding intent or requirement to sell is met.
ACL on Investment Securities Held to Maturity
The Company measures expected credit losses on investment securities held to maturity on a pooled, collective basis by major investment security type with similar risk characteristics. A historical lifetime probability of default and severity of loss in the event of default is derived or obtained from external sources and adjusted for the expected effects of reasonable and supportable forecasts over the expected lives of the investment securities on those historical credit losses. Expected credit losses on investment securities in the held to maturity portfolio that do not share similar risk characteristics with any of the pools are individually measured based on net realizable value, or the difference between the discounted value of the expected future cash flows, based on the original effective interest rate, and the recorded amortized cost basis of the investment securities.
Accrued interest receivable on investment securities held to maturity is excluded from the estimate of expected credit losses. Changes in the ACL on investment securities held to maturity are recorded as provision for credit losses expense. Losses are charged against the ACL when management believes the uncollectibility of an investment security held to maturity is confirmed.
Loans Held for Sale
Mortgage loans held for sale are carried at the lower of amortized cost or fair value. Any loan that management does not have the intent and ability to hold for the foreseeable future or until maturity or payoff is classified as held for sale at the time of origination, purchase, securitization or when such decision is made. Unrealized losses on loans held for sale are recorded as a valuation allowance and included in "Other expense" in the Consolidated Statements of Income.
Loans Receivable
Loans receivable includes loans originated, indirect loans purchased by the Company and loans acquired in business combinations that management has the intent and ability to hold for the foreseeable future or until maturity or payoff and is reported at amortized cost. Amortized cost is the outstanding principal balance, net of purchased premiums and discounts and net deferred loan origination fees and costs. Interest on loans is calculated using the interest method based on the daily balance of the principal amount outstanding and is credited to interest income as earned. Accrued interest receivable for loans receivable is reported within "Accrued interest receivable" in the Consolidated Statements of Financial Condition. The Company's policies for loans receivable generally do not differ by loan segments or classes unless specified in the following policies.
Acquired Loans:
Acquired loans are recorded at their fair value at acquisition date net of an ACL on loans expected to be incurred over the life of the loan. The initial ACL on acquired loans is determined using the same methodology as originated loans. For non-PCD loans, the initial ACL on loans is recorded through earnings as a provision for credit losses. For PCD loans, the initial ACL is incorporated into the calculation of the fair value of net assets acquired on the merger date and the net of the PCD loan purchase price and the initial ACL becomes the initial amortized cost basis. The difference between the initial amortized cost basis and the par value of PCD loans is the noncredit discount or premium for PCD loans. The noncredit discount or premium for PCD loans and both the noncredit and credit discount or premium for non-PCD loans are accreted through the "Interest and fees on loans" line item in the Consolidated Statements of Income over the life of the loan using the interest method for non-revolving credits or the straight-line method, which approximates the effective interest method, for revolving credits. Any unrecognized discount or premium for a purchased loan that is subsequently repaid in full is recognized immediately into income. Subsequent changes to the ACL on loans for acquired loans are recorded through earnings as a provision for credit losses.
Delinquent Loans:
Loans are considered past due or delinquent when principal or interest payments are past due 30 days or more. Delinquent loans generally remain on accrual status between 30 days and 89 days past due.
Nonaccrual and Charged-off Loans:
Loans for which the accrual of interest has been discontinued are designated as nonaccrual loans. The accrual of interest is generally discontinued at the time the loan is 90 days delinquent unless the credit is well secured and in the process of collection. Loans are placed on nonaccrual at an earlier date if collection of the contractual principal or interest is doubtful. All interest accrued, but not collected, on loans deemed nonaccrual during the period is reversed against interest income in that period. Interest payments received on nonaccrual loans are generally accounted for on the cost-recovery method whereby the interest payment is applied to the principal balances. Loans may be returned to accrual status when improvements in credit quality eliminate the doubt as to the full collectability of both interest and principal and a period of sustained performance has occurred.
Loans are generally charged off to their net realizable value if collection of the contractual principal or interest as scheduled in the loan agreement is doubtful. Consumer loans are typically charged off no later than 90 days past due.
Deferred Loan Origination Fees and Costs
Direct loan origination fees and costs on originated loans and premiums and discounts on acquired loans are deferred and subsequently amortized or accreted as a yield adjustment over the expected life of the loan without prepayment considerations utilizing the interest method, except revolving loans for which the straight-line method is used. When a loan is paid off prior to maturity, the remaining net deferred balance is immediately recognized into interest income. In the event loans are sold, the unamortized net deferred balance is recognized as a component of the gain or loss on the sale of loans.
ACL on Loans
The ACL on loans is a valuation account that is deducted from the amortized cost of loans receivable to present the net amount expected to be collected. Loans are debited against the ACL on loans when management believes the uncollectibility of a loan balance is confirmed and subsequent recoveries, if any, are credited to the ACL on loans. The Company records the changes in the ACL on loans through earnings as a "Provision for (reversal of) credit losses" in the Consolidated Statements of Income.
Management has adopted a historic loss, open pool CECL methodology to calculate the ACL on loans. Under this methodology, loans are either collectively evaluated if they share similar risk characteristics, including performing modified loans, or individually evaluated if they do not share similar risk characteristics, including nonaccrual loans.
The allowance for individually evaluated loans is calculated using either the collateral value method, which considers the likely source of repayment as the value of the collateral less estimated costs to sell, or the net present value method, which considers the contractual principal and interest terms and estimated cash flows available from the borrower to satisfy the debt. Nonaccrual modified loans are individually evaluated for credit loss except if the original interest rate is used to discount the expected cash flows, not the rate specified in the restructuring.
The allowance for collectively evaluated loans is comprised of the baseline loss allowance, the macroeconomic allowance and the qualitative allowance. The baseline loss allowance begins with the baseline loss rates calculated using the Company's average quarterly historical loss information for an economic cycle. The Company evaluates the historical period on a quarterly basis with the assumption that economic cycles have historically lasted between 10 and 15 years. The baseline loss rates are applied to each loan's estimated cash flows over the life of the loan under the remaining life method to determine the baseline loss estimate for each loan. Estimated cash flows consider the principal and interest in accordance with the contractual term of the loan and estimated prepayments. Contractual cash flows are based on the amortized cost and are adjusted for balances guaranteed by governmental entities, such as SBA or USDA, resulting in the unguaranteed amortized cost. The contractual term excludes expected extensions, renewals and modifications unless the extension or renewal options are included in the original or modified contract at the reporting date and are not unconditionally cancellable by the Company. Prepayments are established for each segment based on historical averages for the segment, which management believes is an accurate representation of future prepayment activity. Management reviews the adequacy of the prepayment assumption on an annual basis.
The macroeconomic allowance includes consideration of the forecasted direction of the economic and business environment and its likely impact on the estimated allowance as compared to the historical losses over the reasonable and supportable time frame. The Company uses macroeconomic scenarios from an independent third party. These scenarios are based on past events, current conditions, the likelihood of future events occurring and include consideration of the forecasted direction of the economic and business environment and its likely impact on the estimated allowance as compared to the historical losses over the reasonable and supportable time frame. Economic forecast models for the current period are uploaded to the model, which targets certain forecasted macroeconomic factors, such as unemployment rate, gross domestic product, housing price index, commercial real estate price index, and certain rate and market indices. Macroeconomic factor multipliers are determined through regression analysis and applied to loss rates for each segment of loans with similar risk characteristics. Each of the forecasted segment balances is impacted by a mix of these macroeconomic factors. Further, each of the macroeconomic factors is utilized differently by segment, including the application of lagged factors and various transformations such as percent change year over year. A macroeconomic sensitive model is developed for each segment given the current and forecasted conditions and a macroeconomic multiplier is calculated for each forecast period considering the forecasted losses as compared to the long-term average actual losses of the dataset. The impact of those macroeconomic factors on each segment, both positive or negative, using the reasonable and supportable period, are added to the calculated baseline loss allowance. After the reasonable and supportable period, forecasted loss rates revert to historical baseline loss levels over the predetermined reversion period on a straight-lined basis.
At September 30, 2023, the Company upgraded its model used to calculate the ACL for collectively evaluated loans. This upgraded version involved modifications to the macroeconomic variables for each loan segment. Changes were based on regression testing, assessing the macroeconomic variable relationships to expected results and adjusting the lookback period from 1991 to 2000 for improved data relevance. The most significant changes to macroeconomic variables were in the commercial and industrial and commercial real estate segments. The commercial and industrial segment had previously used unemployment as a macroeconomic variable which was removed and replaced with a market index, rate index and real estate price index. The commercial real estate segment had previously used gross domestic product as a macroeconomic variable which was removed and replaced with a housing price index. Additionally, a new segment for home equity lines of credit was introduced in this version. The overall impact on the ACL for collectively evaluated loans, before applying qualitative adjustments, was not considered to be material.
The Company’s ACL model also includes adjustments for qualitative factors, where appropriate. Since historical information (such as historical net losses and economic cycles) may not always, by themselves, provide a sufficient basis for determining
future expected credit losses, the Company periodically considers the need for qualitative adjustments to the ACL. Qualitative adjustments may be related to and include, but not be limited to, factors such as: (i) management’s assessment of economic forecasts used in the model and how those forecasts align with management’s overall evaluation of current and expected economic conditions, (ii) organization specific risks such as credit concentrations, collateral specific risks, regulatory risks, and external factors that may ultimately impact credit quality, (iii) potential model limitations such as those identified through back-testing, underwriting changes, acquisition of new portfolios and changes in portfolio segmentation, and (iv) management’s overall assessment of the adequacy of the ACL, including an assessment of model data inputs used to determine the ACL.
Qualitative adjustments primarily relate to certain segments of the loan portfolio deemed by management to be of a higher-risk profile where management believes the quantitative component of the Company’s ACL model may not have fully captured the associated impact to the ACL. Qualitative adjustments also relate to heightened uncertainty as to future macroeconomic conditions and the related impact on the loan segments. Management reviews the need for an appropriate level of qualitative adjustments on a quarterly basis, and as such, the amount and allocation of qualitative adjustments may change in future periods.
In general, management's estimate of the ACL on loans uses relevant available information, from internal and external sources, relating to past events, current conditions, and reasonable and supportable forecasts. The evaluation of ACL on loans is inherently subjective as it requires estimates that are susceptible to significant revision as more information becomes available. While management utilizes its best judgment and information available to recognize estimated losses on loans, future additions to the allowance may be necessary based on declines in local and national economic conditions. In addition, various regulatory agencies, as an integral part of their examination process, periodically review the Company’s ACL on loans. Such agencies may require the Company to adjust the allowance based on their judgments about information available to them at the time of their examinations. The Company believes the ACL on loans is appropriate given all the above considerations.
ACL on Unfunded Commitments
The Company estimates expected credit losses on unfunded, off-balance sheet commitments over the contractual period in which the Company is exposed to credit risk from a contractual obligation to extend credit, unless the obligation is unconditionally cancellable by the Company.
The allowance methodology for unfunded commitments is similar to the ACL on loans, but additionally includes considerations of the current utilization of the commitment and an estimate of the future utilization as determined appropriate by historical commitment utilization and the Company's estimates of future utilization given current economic forecasts.
The ACL for unfunded commitments is recorded in "Accrued expenses and other liabilities" in the Consolidated Statements of Financial Condition and changes are recognized through earnings in the "Provision for (reversal of) credit losses" in the Consolidated Statements of Income.
ACL on Accrued Interest Receivable
Accrued interest receivable on investment securities and loans receivable are excluded from their estimates of credit losses. Additionally, no allowance has been established for accrued interest receivable on investment securities and loans receivable as interest accrued, but not received, is reversed timely in accordance with the policies stated above.
Provision for (reversal of) Credit Losses
The provision for credit losses as presented in the Consolidated Statements of Income includes the provision for credit losses on loans, the provision for credit losses on unfunded commitments and the provision for credit losses on investment securities.
Mortgage Banking Operations
The Bank originated and sold certain residential real estate loans on a servicing-released basis. The Company recognized a gain or loss on sale to the extent that the sale proceeds of the loan sold differed from the net book value at the time of sale. Income from residential real estate loans brokered to other lenders was recognized into income on date of loan closing. In 2024, the Bank ceased the origination of residential real estate loans.
Other Real Estate Owned
Other real estate owned is recorded at the estimated fair value (less the costs to sell) at the date of acquisition, not to exceed net realizable value, and any resulting write-down is charged against the ACL on loans. Physical possession of residential real estate property collateralizing a consumer mortgage loan occurs when legal title is obtained upon completion of foreclosure or when the borrower conveys all interest in the properly to satisfy the loan through completion of a deed in lieu of foreclosure or similar legal agreement.
After acquisition, all costs incurred in maintaining the property are expensed except for costs relating to the development and improvement of the property which are capitalized to the extent of the property’s net realizable value. If the estimated realizable value of the other real estate owned property declines after the acquisition date, the valuation adjustment is charged to "Other real estate owned, net" in the Consolidated Statements of Income.
Premises and Equipment
Premises and equipment, including leasehold improvements, are stated at cost less accumulated depreciation. Depreciation is computed using the straight-line method over the estimated useful lives of the assets or the lease period, whichever is shorter. The estimated useful lives used to compute depreciation and amortization for buildings and building improvements, including leasehold improvements, is 15 to 39 years; and for furniture, fixtures and equipment is three to seven years. The Company reviews premises and equipment, including leasehold improvements, for impairment whenever events or changes in the
circumstances indicate that the undiscounted cash flows for the property are less than its carrying value. If identified, an impairment loss is recognized through a charge to earnings based on the fair value of the property.
Bank Owned Life Insurance
The Company's BOLI policies insure the lives of certain current or former Company officers and name the Company as beneficiary. Noninterest income is generated tax-free (subject to certain limitations) from the increase in the policies' underlying investments made by the insurance company. The Company records BOLI at the cash surrender value adjusted for other charges or other amounts due that are probable at settlement.
Other Intangible Assets
Other intangible assets represent core deposit intangibles acquired in business combinations. The fair value of the core deposit intangible stemming from any given business combination is based on the present value of the expected cost savings attributable to the core deposit funding, relative to an alternative source of funding. The core deposit intangibles are amortized on an accelerated basis following a pattern of the economic benefits of the core deposit intangible over an estimated useful life of the deposit relationships acquired. The Company evaluates such identifiable intangibles for impairment annually or more frequently if an indication of impairment exists.
Goodwill
The Company’s goodwill represents the excess of the purchase price over the fair value of net assets acquired in certain mergers and acquisitions. Goodwill is assigned to the Bank and is evaluated for impairment at the Bank level (single reporting unit) on an annual basis or more frequently if an indication of impairment exists between the annual tests.
For the goodwill impairment assessment, the Company either assesses qualitative factors to determine whether the existence of events or circumstances leads to a determination that it is more-likely-than-not the fair value of the reporting unit is less than its carrying value and a quantitative test is needed or opts to bypass the qualitative analysis and performs a quantitative analysis only. The quantitative analysis requires the Company to make assumptions and judgments regarding the fair value of the reporting unit. If the implied fair value of goodwill is less than the recorded goodwill, an impairment charge would be recorded for the difference.
Income Taxes
The Company and the Bank file a United States consolidated federal income tax return and an Oregon and Idaho State income tax return. Income tax expense is the total of the current year income tax due or refundable and the change in deferred tax assets and liabilities. Deferred tax assets and liabilities are recognized for the future tax consequences attributable to differences between the carrying amounts of existing assets and liabilities and their respective tax bases. Deferred tax assets and liabilities are measured using enacted tax rates applicable to taxable income in the periods in which those temporary differences are expected to be recovered or settled. The effect on deferred tax assets and liabilities of a change in tax rate is recognized in income in the period that includes the enactment date. A valuation allowance, if needed, reduces deferred tax assets to the amounts expected to be realized. Deferred tax assets are reported in "Prepaid expenses and other assets" in the Consolidated Statements of Financial Condition.
We hold equity investments in certain structures which deliver tax benefits, including LIHTC investments and a Solar Tax Credit investment. For those LIHTC investments that qualify for application of the proportional amortization method, we apply such method. Under the proportional amortization method, such investment is amortized in proportion to the allocation of tax benefits received in each period, and the investment amortization and the tax benefits are presented on a net basis within “Income tax expense” on our Consolidated Statements of Income.
A tax position is recognized as a benefit only if it is "more likely than not" that the tax position would be sustained in a tax examination, with a tax examination being presumed to occur. The amount recognized is the largest amount of tax benefit that is greater than 50% likely of being realized on examination. For tax positions not meeting the “more likely than not” test, no tax benefit is recorded.
The Company’s policy is to recognize interest and penalties on unrecognized tax benefits in "Income tax expense" in the Consolidated Statements of Income as the amounts are generally insignificant each year.
Operating Leases
The Company has only identified leases classified as operating leases. Operating leases are recorded as ROU assets and ROU liabilities within "Prepaid expenses and other assets" and "Accrued expenses and other liabilities", respectively, in the Consolidated Statements of Financial Condition. ROU assets represent the Company's right to use an underlying asset for the lease term and ROU liabilities represent the Company's obligation to make lease payments arising from the lease. Operating lease ROU assets and ROU liabilities are recognized at the lease agreement commencement date based on the present value of lease payments over the lease term. The lease term incorporates options to extend the lease when it is reasonably certain that the Company will exercise that option. As the Company's leases typically do not provide an implicit rate; the Company uses its incremental borrowing rate based on the information available at the operating lease commencement date in determining the present value of lease payments. The operating lease ROU asset is further reduced by any lease pre-payments made and lease incentives. The leases may contain various provisions for increases in rental rates based either on changes in the published Consumer Price Index or a predetermined escalation schedule and such variable lease payments are recognized as lease expense as they are incurred. The majority of the Company's leases include variable lease payments such as real estate taxes, maintenance, insurance and other similar costs in addition to the base rent. Lease expense for lease payments is recognized on a straight-line basis over the lease term.
The Company does not separate non-lease components from lease components and excludes operating leases with a term of twelve months or less from being capitalized as ROU assets and ROU liabilities. The Company follows a policy to capitalize lease agreements with total contractual lease payments of $25,000 or more. The Company does not account for any leases at a portfolio level.
Stock-Based Compensation
The Company maintains two stock-based incentive plans, which are discussed in more detail in Note (15) Stock-Based Compensation. Since 2011, the Company has only granted restricted stock unit awards. With respect to these restricted stock unit awards, compensation cost is recognized when awards are granted to employees and directors based on their fair value at the date of grant. Compensation cost is generally recognized over the requisite service period, generally defined as the vesting period, on a straight-line basis. Compensation cost for restricted stock unit awards with market-based vesting is recognized over the service period to the extent the restricted stock unit awards are expected to vest. Forfeitures are recognized as they occur.
The market price of the Company’s common stock at the date of grant is used to determine the fair value of the restricted stock unit awards. Certain restricted stock unit awards are subject to performance-based vesting as well as other approved vesting conditions and cliff-vest based on those conditions, and the fair value for those awards is estimated using a Monte Carlo simulation pricing model. The assumptions used in the Monte Carlo simulation pricing model include the expected term based on the valuation date and the remaining contractual term of the award; the risk-free interest rate based on the Treasury curve at the valuation date of the award; the expected dividend yield based on expected dividend equivalents being payable to the holders; and the expected stock price volatility over the expected term based on the historical volatility over the equivalent historical term.
Investments in Tax Credit Structures
The Company has equity investments in LIHTC partnerships, which are indirect federal subsidies that finance low-income housing projects. As a limited liability investor in these partnerships, the Company receives tax benefits in the form of tax deductions from partnership operating losses and federal income tax credits. The federal income tax credits are earned over a 10-year period as a result of the investment properties meeting certain criteria and are subject to recapture for noncompliance with such criteria over a 15-year period. The Company accounts for the LIHTCs under the proportional amortization method and amortizes the initial cost of the investment in proportion to the tax credits and other tax benefits received and recognizes the net investment performance in the Consolidated Statements of Income as a component of "Income tax expense". The Company reports the carrying value of the equity investments in the unconsolidated LIHTCs as Prepaid expenses and other assets and the unfunded contingent commitments related to the equity investments as Accrued expenses and other liabilities on the Company’s Statements of Financial Condition. The maximum exposure to loss in the LIHTCs is the amount of equity invested and credit extended by the Company. Loans to these entities are underwritten in substantially the same manner as other loans and are secured. The Company has evaluated the variable interests held by the Company in each LIHTC investment and determined the Company does not have controlling financial interests in such investments and is not the primary beneficiary.
The Company has an equity investment in a solar tax credit investment. As a limited liability investor in this partnership, the Company receives tax benefits in the form of tax deductions from partnership operating losses and federal income tax credits. The Company accounts for the solar tax credits under the deferral method where the tax credit is recognized over the useful life of the asset in the Consolidated Statements of Income as a component of "Income tax expense". The Company has evaluated the variable interest held by the Company and determined that the Company does not have controlling financial interests in such investment and is not the primary beneficiary.
Deferred Compensation Plans
The Company maintains a Deferred Compensation Plan in which certain executive officers participate. Under the Deferred Compensation Plan, participants are permitted to elect to defer compensation, and the Company has the discretion to make additional contributions to the Deferred Compensation Plan on behalf of any participant based on a number of factors. Such discretionary contributions are generally approved by the Compensation Committee of the Board. The notional account balances of participants under the Deferred Compensation Plan earn interest on an annual basis. The applicable interest rate is the Moody’s Seasoned Aaa Corporate Bond Yield as of January 1 of each year. Generally, a participant’s account is payable upon the earliest of the participant’s separation from service with the Company, the participant’s death or disability, or a specified date that is elected by the participant in accordance with applicable rules of the Internal Revenue Code, as amended.
Additionally, in conjunction with the Company's merger with Premier Commercial Bancorp in 2018, the Company assumed the Salary Continuation Plan. The Salary Continuation Plan is an unfunded non-qualified deferred compensation plan for select former Premier Commercial executive officers, some of which are current Company officers. Under the Salary Continuation Plan, the Company will pay each participant, or their beneficiary, specified amounts over specified periods beginning with the individual's termination of service due to retirement subject to early termination provisions.
The Company’s obligation to make payments under the Deferred Compensation Plan and the Salary Continuation Plan is a general obligation of the Company and is to be paid from the Company’s general assets. As such, participants are general unsecured creditors of the Company with respect to their participation under both plans. The Company records a liability within "Accrued expenses and other liabilities" in the Consolidated Statements of Financial Condition and records the expense as "Compensation and employee benefits" in the Consolidated Statements of Income in a systematic and rational manner. Since the amounts earned under the Deferred Compensation Plan are generally based on the Company’s annual performance, the Company records deferred compensation expense each year for an amount calculated based on that year’s financial performance.
Earnings per Share
The two-class method is used in the calculation of basic and diluted earnings per common share. Basic earnings per common share is net income allocated to common shareholders divided by the weighted average number of common shares outstanding during the period. All outstanding unvested share-based payment awards that contain rights to nonforfeitable dividends are considered participating securities for this calculation. Dividends and undistributed earnings allocated to participating securities are excluded from net income allocated to common shareholders and participating securities are excluded from weighted average common shares outstanding. Diluted earnings per common share is calculated using the treasury stock method and includes the dilutive effect of additional potential common shares issuable under stock options. Earnings and dividends per share are restated for all stock splits and stock dividends through the date of issuance of the financial statements.
Derivative Financial Instruments
The Company utilizes interest rate swap derivative contracts to facilitate the needs of its commercial customers whereby it enters into an interest rate swap with a customer while at the same time entering into an offsetting interest rate swap with another financial institution. In connection with each swap transaction, the Company agrees to pay interest to the customer on a notional amount at a variable interest rate and receive interest from the customer on a similar notional amount at a fixed interest rate. At the same time, the Company agrees to pay another financial institution the same fixed interest rate on the same notional amount and receive the same variable interest rate on the same notional amount. The transaction allows the Company’s customer to effectively convert a variable rate loan to a fixed rate and the Company recognizes immediate income based upon the difference in the bid/ask spread of the underlying transactions with its customers and the third party. Because the Company acts as an intermediary for its customer, changes in the fair value of the underlying derivative contracts for the most part offset each other and do not significantly impact the Company’s results of operations. These interest rate swaps are not designated as hedging instruments.
The Company is exposed to credit-related losses in the event of nonperformance by the counterparty to these agreements. Credit risk for derivatives with the customer is controlled through the credit approval process, amount limits, and monitoring procedures and is concentrated within our primary market areas. Credit risk for derivatives with third-parties is concentrated among four well-known broker dealers.
Fee income related to interest rate swap derivative contract transactions is recorded in "Interest rate swap fees" in the Consolidated Statements of Income. The fair value of derivative positions outstanding is included in "Prepaid expenses and other assets" and "Accrued expenses and other liabilities" in the Consolidated Statements of Financial Condition. The gains and losses due to changes in fair value and all cash flows are included in "Other income" in the Consolidated Statements of Income, but typically net to zero based on the identical back-to-back interest rate swaps unless a credit valuation adjustment is recorded to appropriately reflect nonperformance risk in the fair value measurement. Various factors impact changes in the credit valuation adjustments over time, including changes in the risk ratings of the parties to the contracts, as well as changes in market rates and volatilities, which affect the total expected exposure of the derivative instruments.
Advertising Expenses
Advertising costs are expensed as incurred. Costs related to production of advertising are considered incurred when the advertising is first used.
Operating Segments
While the Company’s chief operating decision maker ("CODM") monitors the revenue streams of the various products and services, operations are managed and financial performance is evaluated on a Company-wide basis as operating results for all segments are similar. Accordingly, all the financial service operations are considered by management to be aggregated in one reportable operating segment.
Revenue from Contracts with Customers
The Company's revenues are primarily composed of interest income on financial instruments, such as loans and investment securities. The Company's revenue derived from contracts with customers are generally presented in "Service charges and other fees" and "Other income" in the Consolidated Statement of Income and includes the following:
•Service Charges on Deposit Accounts: The Company earns fees from its deposit customers from a variety of deposit products and services. Non-transaction based fees such as account maintenance fees and monthly statement fees are considered to be provided to the customer under a day-to-day contract with ongoing renewals. Revenues for these non-transaction fees are earned over the course of a month, representing the period over which the Company satisfies the performance obligation. Transaction-based fees such as non-sufficient fund charges, stop payment charges and wire fees are recognized at the time the transaction is executed as the contract duration does not extend beyond the service performed.
•Wealth Management: The Company earns fees from contracts with customers for fiduciary and brokerage activities. Revenues are generally recognized monthly and are generally based on a percentage of the customer’s assets under management or based on investment or insurance solutions that are implemented for the customer.
•Merchant Processing Services and Debit and Credit Card Fees: The Company earns fees from cardholder transactions conducted through third-party payment network providers which consist of (i) interchange fees earned from the payment network as a debit card issuer, (ii) referral fee income, and (iii) ongoing merchant fees earned for referring customers to the payment processing provider. These fees are recognized when the transaction occurs, but may settle on a daily or monthly basis.
(d) Recently Issued or Adopted Accounting Pronouncements
FASB ASU 2020-04, Reference Rate Reform (Topic 848), as amended by ASU 2021-01, and ASU 2022-06 was issued in March 2020 and provides optional guidance for a limited period of time to ease the potential burden in accounting for (or recognizing the effects of) reference rate reform on financial reporting. The amendments in this ASU are effective for all entities as of March 12, 2020. In December 2022, FASB amended this ASU and deferred the sunset date of Topic 848 from December 31, 2022, to December 31, 2024. The amendments are elective, apply to all entities, and provide optional expedients and exceptions for applying GAAP to contracts, hedging relationships, and other transactions affected by reference rate reform if certain criteria are met. Effective January 25, 2021, the Company adhered to the Interbank Offered Rate Fallbacks Protocol as published by the International Swaps and Derivatives Association, Inc. and recommended by the Alternative Reference Rates Committee. The Company’s instruments indexed to the London Interbank Offering Rate ("LIBOR") have all been transferred to another index.
FASB ASU 2023-02, Investments - Equity Method and Joint Ventures (Topic 323): Accounting for Investments in Tax Credit Structures Using the Proportional Amortization Method (a consensus of the Emerging Issues Task Force), was issued in February 2023. The amendments in this ASU permit companies to elect to account for their tax equity investments, regardless of the tax credit program from which the income tax credits are received, using the proportional amortization method, if certain conditions are met. Under the proportional amortization method, an entity amortizes the initial cost of the investment in proportion to the income tax credits and other income tax benefits received and recognizes the net amortization and income tax credits and other income tax benefits in the statement of operations as a component of income tax expense (benefit). The amendments also require that a reporting entity disclose certain information in annual and interim reporting periods that enable investors to understand the investments that generate income tax credits and other income tax benefits from a tax credit program. The ASU is effective for fiscal years, and interim periods within those fiscal years, beginning after December 15, 2023, with early adoption permitted. The amendments in the ASU can be applied either on a modified retrospective or a retrospective basis. The Company had already applied proportional amortization to its LIHTC investments prior to January 1, 2024. The amendments in this ASU allow the Company to expand the use of proportional amortization to other types of qualifying tax credit investments. The Company has chosen not to expand the use of proportional amortization beyond its LIHTC investment portfolio. Thus, at this time, this ASU only impacts disclosure requirements.
FASB ASU 2023-06, Disclosure Improvements: Codification Amendments in Response to the SEC's Disclosure Update and Simplification Initiative, was issued in October 2023 to clarify or improve disclosure and presentation requirements on a variety of topics and align the requirements in the FASB accounting standard codification with the Securities and Exchange Commission regulations. The amendments will be effective for the Company only if the SEC removes the related disclosure requirement from its existing regulations no later than June 30, 2027. If the SEC timely removes such a related requirement from its existing regulations, the corresponding amendments within the ASU will become effective for the Company on the same date with early adoption permitted. The Company does not expect the adoption of this ASU to have a material impact on its business operations or Consolidated Statements of Financial Condition.
FASB ASU 2023-07, Segment Reporting - Improvements to Reportable Segment Disclosures (Topic 280), was issued in November 2023. This accounting standards update was issued to improve reportable segment disclosure requirements through enhanced disclosures about significant segment expenses. The ASU applies to all public entities that are required to report segment information in accordance with ASC 280. For public companies, amendments in this ASU was effective for fiscal years beginning after December 15, 2023, and interim periods within fiscal years beginning after December 15, 2024 with early adoption permitted. This ASU only impacts the Company's disclosure requirements and the adoption of this ASU did not have a material impact on its business operations or Consolidated Statements of Financial Condition.
FASB ASU 2023-09, Income Taxes (Topic 740): Improvements to Income Tax Disclosures, was issued in December 2023. The amendments in this ASU requires a public business entity to disclose, on an annual basis, a tabular rate reconciliation using both percentages and currency amounts, broken out into specified categories with certain reconciling items further broken out by nature and jurisdiction to the extent those items exceed a specified threshold. In addition, all entities are required to disclose income taxes paid, net of refunds received disaggregated by federal, state/local, and foreign and by jurisdiction if the amount is at least 5% of total income tax payments, net of refunds received. The new standard is effective for annual periods beginning after December 15, 2024, with early adoption permitted. An entity may apply the amendments in this ASU prospectively by providing the revised disclosures for the period ending December 31, 2025 and continuing to provide the pre-ASU disclosures for the prior periods, or may apply the amendments retrospectively by providing the revised disclosures for all period presented. The Company expects this ASU to only impact its disclosure requirements and does not expect the adoption of this ASU to have a material impact on its business operations or Consolidated Statements of Financial Condition.
FASB ASU 2024-02, Codification Improvements - Amendments to Remove References to the Concepts Statements, was issued in March 2024. This update contains amendments in the Codification that remove references to various Concepts Statements. In most cases, the references were extraneous and not required to understand or apply the guidance. In other instances, the references were used in previous Statements to provide guidance in certain topical areas. The new standard is effective for annual periods beginning after December 15, 2024, with early adoption permitted. An entity may apply the amendments in this ASU prospectively to all new transactions recognized on or after the date that the entity first applies the amendments, or retrospectively to the beginning of the earliest comparative period presented in which the amendments were first applied. If applied retrospectively, an entity shall adjust the opening period of retained earnings as of the beginning of the comparative period presented. The Company does not expect the adoption of this ASU to have a material impact on its business operations or Consolidated Statements of Financial Condition.
FASB ASU 2024-03, Disaggregation of Income Statement Expenses, was issued in November 2024. This accounting standards update will require public companies to disclose, in the notes to financial statements, specified information about certain costs
and expenses at each interim and annual reporting period. The amendments in this ASU are effective for fiscal years beginning after December 15, 2026, with early adoption permitted. The Company does not expect the adoption of this ASU to have a material impact on its business operations or Consolidated Statements of Financial Condition.
(2)Investment Securities
The Company’s investment policy is designed primarily to provide and maintain liquidity, generate a favorable return on assets without incurring undue interest rate and credit risk and complement the Company’s lending activities.
There were no investment securities classified as trading at December 31, 2024 or December 31, 2023.
(a) Investment Securities by Classification, Type and Maturity
The following tables present the amortized cost and fair value of investment securities and the corresponding amounts of gross unrealized and unrecognized gains and losses, including the corresponding amounts of gross unrealized gains and losses on investment securities available for sale recognized in AOCI, at the dates indicated:
| | | | | | | | | | | | | | | | | | | | | | | |
| December 31, 2024 |
| Amortized Cost | | Gross Unrealized Gains | | Gross Unrealized Losses | | Fair Value |
| (Dollars in thousands) |
| Investment securities available for sale: | | | | | | | |
| U.S. government and agency securities | $ | 14,934 | | | $ | — | | | $ | (2,390) | | | $ | 12,544 | |
| Municipal securities | 61,169 | | | 12 | | | (10,239) | | | 50,942 | |
Residential CMO and MBS(1) | 407,520 | | | 711 | | | (38,900) | | | 369,331 | |
Commercial CMO and MBS(1) | 330,249 | | | 134 | | | (20,642) | | | 309,741 | |
| Corporate obligations | 11,700 | | | 181 | | | (111) | | | 11,770 | |
| Other asset-backed securities | 10,020 | | | 47 | | | (1) | | | 10,066 | |
| Total | $ | 835,592 | | | $ | 1,085 | | | $ | (72,283) | | | $ | 764,394 | |
(1) U.S. government agency and government-sponsored enterprise CMO and MBS.
| | | | | | | | | | | | | | | | | | | | | | | |
| December 31, 2024 |
| Amortized
Cost | | Gross
Unrecognized
Gains | | Gross
Unrecognized
Losses | | Fair
Value |
| (Dollars in thousands) |
| Investment securities held to maturity: | | | | | | | |
| U.S. government and agency securities | $ | 151,216 | | | $ | — | | | $ | (28,874) | | | $ | 122,342 | |
Residential CMO and MBS(1) | 244,309 | | | — | | | (18,563) | | | 225,746 | |
Commercial CMO and MBS(1) | 307,760 | | | 27 | | | (32,423) | | | 275,364 | |
| Total | $ | 703,285 | | | $ | 27 | | | $ | (79,860) | | | $ | 623,452 | |
(1) U.S. government agency and government-sponsored enterprise CMO and MBS.
| | | | | | | | | | | | | | | | | | | | | | | |
| December 31, 2023 |
| Amortized
Cost | | Gross
Unrealized
Gains | | Gross
Unrealized
Losses | | Fair
Value |
| (Dollars in thousands) |
| Investment securities available for sale: | | | | | | | |
| U.S. government and agency securities | $ | 16,047 | | | $ | — | | | $ | (2,297) | | | $ | 13,750 | |
| Municipal securities | 92,231 | | | 9 | | | (12,715) | | | 79,525 | |
Residential CMO and MBS(1) | 555,518 | | | 2,656 | | | (46,125) | | | 512,049 | |
Commercial CMO and MBS(1) | 538,910 | | | 88 | | | (34,740) | | | 504,258 | |
| Corporate obligations | 7,745 | | | 2 | | | (134) | | | 7,613 | |
| Other asset-backed securities | 17,336 | | | 31 | | | (209) | | | 17,158 | |
| Total | $ | 1,227,787 | | | $ | 2,786 | | | $ | (96,220) | | | $ | 1,134,353 | |
(1) U.S. government agency and government-sponsored enterprise CMO and MBS.
| | | | | | | | | | | | | | | | | | | | | | | |
| December 31, 2023 |
| Amortized
Cost | | Gross
Unrecognized
Gains | | Gross
Unrecognized
Losses | | Fair
Value |
| (Dollars in thousands) |
| Investment securities held to maturity: | | | | | | | |
| U.S. government and agency securities | $ | 151,075 | | | $ | — | | | $ | (27,701) | | | $ | 123,374 | |
Residential CMO and MBS(1) | 267,204 | | | — | | | (14,101) | | | 253,103 | |
Commercial CMO and MBS(1) | 321,163 | | | — | | | (35,190) | | | 285,973 | |
| Total | $ | 739,442 | | | $ | — | | | $ | (76,992) | | | $ | 662,450 | |
(1) U.S. government agency and government-sponsored enterprise CMO and MBS.
The following table presents the amortized cost and fair value of investment securities by contractual maturity at the date indicated. Actual maturities may differ from contractual maturities because certain borrowers have the right to call or prepay obligations with or without call or prepayment penalties.
| | | | | | | | | | | | | | | | | | | | | | | |
| December 31, 2024 |
| Securities Available for Sale | | Securities Held to Maturity |
| Amortized Cost | | Fair Value | | Amortized Cost | | Fair Value |
| (Dollars in thousands) |
| Due in one year or less | $ | — | | | $ | — | | | $ | — | | | $ | — | |
| Due after one year through five years | 6,442 | | | 6,111 | | | — | | | — | |
| Due after five years through ten years | 34,201 | | | 31,418 | | | 93,294 | | | 78,092 | |
| Due after ten years | 47,160 | | | 37,727 | | | 57,922 | | | 44,250 | |
| Total investment securities due at a single maturity date | 87,803 | | | 75,256 | | | 151,216 | | | 122,342 | |
MBS(1) | 747,789 | | | 689,138 | | | 552,069 | | | 501,110 | |
| Total investment securities | $ | 835,592 | | | $ | 764,394 | | | $ | 703,285 | | | $ | 623,452 | |
(1) MBS, which have prepayment provisions, are not assigned to maturity categories due to fluctuations in their payment speed.
There were no holdings of investment securities of any one issuer, other than the U.S. government and its agencies, in an amount greater than 10% of stockholders’ equity, at December 31, 2024 and December 31, 2023.
(b) Unrealized Losses on Investment Securities Available for Sale
The following tables present the gross unrealized losses and fair value of the Company’s investment securities available for sale for which an ACL on investment securities available for sale has not been recorded, aggregated by investment category and length of time the individual securities have been in a continuous unrealized loss position at the dates indicated:
| | | | | | | | | | | | | | | | | | | | | | | | | | | | | | | | | | | |
| December 31, 2024 |
| Less than 12 Months | | 12 Months or Longer | | Total |
| Fair
Value | | Unrealized
Losses | | Fair
Value | | Unrealized
Losses | | Fair
Value | | Unrealized
Losses |
| (Dollars in thousands) |
| U.S. government and agency securities | $ | — | | | $ | — | | | $ | 12,544 | | | $ | (2,390) | | | $ | 12,544 | | | $ | (2,390) | |
| Municipal securities | — | | | — | | | 45,157 | | | (10,239) | | | 45,157 | | | (10,239) | |
Residential CMO and MBS(1) | 25,126 | | | (321) | | | 232,903 | | | (38,579) | | | 258,029 | | | (38,900) | |
Commercial CMO and MBS(1) | 17,772 | | | (86) | | | 270,897 | | | (20,556) | | | 288,669 | | | (20,642) | |
| Corporate obligations | — | | | — | | | 3,890 | | | (111) | | | 3,890 | | | (111) | |
| Other asset-backed securities | 1,568 | | | (1) | | | — | | | — | | | 1,568 | | | (1) | |
| Total | $ | 44,466 | | | $ | (408) | | | $ | 565,391 | | | $ | (71,875) | | | $ | 609,857 | | | $ | (72,283) | |
(1) U.S. government agency and government-sponsored enterprise CMO and MBS.
| | | | | | | | | | | | | | | | | | | | | | | | | | | | | | | | | | | |
| December 31, 2023 |
| Less than 12 Months | | 12 Months or Longer | | Total |
| Fair
Value | | Unrealized
Losses | | Fair
Value | | Unrealized
Losses | | Fair
Value | | Unrealized
Losses |
| (Dollars in thousands) |
| U.S. government and agency securities | $ | — | | | $ | — | | | $ | 13,750 | | | $ | (2,297) | | | $ | 13,750 | | | $ | (2,297) | |
| Municipal securities | 3,548 | | | (18) | | | 71,458 | | | (12,697) | | | 75,006 | | | (12,715) | |
Residential CMO and MBS(1) | — | | | — | | | 358,316 | | | (46,125) | | | 358,316 | | | (46,125) | |
Commercial CMO and MBS(1) | 37,899 | | | (228) | | | 448,197 | | | (34,512) | | | 486,096 | | | (34,740) | |
| Corporate obligations | 911 | | | (20) | | | 3,887 | | | (114) | | | 4,798 | | | (134) | |
| Other asset-backed securities | 4,338 | | | (22) | | | 7,291 | | | (187) | | | 11,629 | | | (209) | |
| Total | $ | 46,696 | | | $ | (288) | | | $ | 902,899 | | | $ | (95,932) | | | $ | 949,595 | | | $ | (96,220) | |
(1) U.S. government agency and government-sponsored enterprise CMO and MBS.
(c) ACL on Investment Securities
The Company evaluated investment securities available for sale as of December 31, 2024 and December 31, 2023 and determined that any declines in fair value were attributable to changes in interest rates relative to where these investments fall within the yield curve and individual characteristics. Management monitors published credit ratings for adverse changes for all rated investment securities and none of these securities had a below investment grade credit rating as of both December 31, 2024 and December 31, 2023. In addition, the Company does not intend to sell these securities nor does the Company consider it more likely than not that it will be required to sell these securities before the recovery of the amortized cost basis, which may be upon maturity. Therefore, no ACL on investment securities available for sale was recorded as of December 31, 2024 or December 31, 2023.
The Company also evaluated investment securities held to maturity for current expected credit losses as of December 31, 2024 and December 31, 2023. There were no investment securities held to maturity classified as nonaccrual or past due as of December 31, 2024 or December 31, 2023 and all were issued by the U.S. government and its agencies and either explicitly or implicitly guaranteed by the U.S. government, highly rated by major credit rating agencies and had a long history of no credit losses. Accordingly, the Company did not measure expected credit losses on investment securities held to maturity since the historical credit loss information adjusted for current conditions and reasonable and supportable forecasts results in an expectation that nonpayment of the amortized cost basis is zero. Therefore, no ACL on investment securities held to maturity was recorded as of December 31, 2024 or December 31, 2023.
(d) Realized Gains and Losses
The following table presents the gross realized gains and losses on the sale of investment securities available for sale determined using the specific identification method for the dates indicated:
| | | | | | | | | | | | | | | | | |
| Year ended December 31, |
| 2024 | | 2023 | | 2022 |
| (Dollars in thousands) |
| Gross realized gains | $ | — | | | $ | 36 | | | $ | 4 | |
| Gross realized losses | (22,742) | | | (12,267) | | | (260) | |
| Net realized gains/(losses) | $ | (22,742) | | | $ | (12,231) | | | $ | (256) | |
(e) Pledged Securities
The following table summarizes the amortized cost and fair value of investment securities that were pledged as collateral for the following obligations at the dates indicated:
| | | | | | | | | | | | | | | | | | | | | | | |
| December 31, 2024 | | December 31, 2023 |
| Amortized
Cost | | Fair
Value | | Amortized
Cost | | Fair
Value |
| (Dollars in thousands) |
| State and local governments public deposits | $ | 236,047 | | | $ | 220,104 | | | $ | 238,060 | | | $ | 224,879 | |
| FRB | 434,534 | | | 373,410 | | | 845,098 | | | 742,197 | |
| Other securities pledged | 53,296 | | | 48,169 | | | 54,636 | | | 49,032 | |
| Total | $ | 723,877 | | | $ | 641,683 | | | $ | 1,137,794 | | | $ | 1,016,108 | |
(f) Accrued Interest Receivable
Accrued interest receivable excluded from the amortized cost of investment securities available for sale totaled $2.7 million and $3.8 million at December 31, 2024 and December 31, 2023, respectively. Accrued interest receivable excluded from the amortized cost on investment securities held to maturity totaled $2.2 million and $2.3 million at December 31, 2024 and December 31, 2023, respectively.
No amounts of accrued interest receivable on investment securities available for sale or held to maturity were reversed against interest income on investment securities during the years ended December 31, 2024, 2023, and 2022.
(g) Non-Marketable Securities
At December 31, 2022, as a member bank of Visa U.S.A., the Company held 6,549 shares of Visa Inc. Class B common stock. These shares had a carrying value of zero and were restricted from resale to non-member banks of Visa U.S.A. until their conversion into Class A (voting) shares upon the termination of Visa Inc.'s Covered Litigation escrow account. During the year ended December 31, 2023, the Company sold all of its shares of Visa Inc. Class B common stock and recognized a $1.6 million gain which was included in "Other income" in the Consolidated Statements of Income.
(3)Loans Receivable
The Company originates loans in the ordinary course of business and has also acquired loans through mergers and acquisitions. In addition to originating loans, the Company may also purchase loans through pool purchases, participation purchases and syndicated loan purchases. Accrued interest receivable was excluded from disclosures presenting the Company's amortized cost of loans receivable as it was deemed insignificant.
(a) Loan Origination/Risk Management
The Company categorizes the individual loans in the total loan portfolio into four segments: commercial business; residential real estate; real estate construction and land development; and consumer. Within these segments are classes of loans for which management monitors and assesses credit risk in the loan portfolios.
The Company has certain lending policies and guidelines in place that are designed to maximize loan income within an acceptable level of risk. Management reviews and approves these policies and guidelines on a regular basis. A reporting system supplements the review process by providing management with frequent reports related to loan production, loan quality, concentrations of credit, loan delinquencies and nonperforming and criticized loans. The Company also conducts internal loan reviews and validates the credit risk assessment on a periodic basis and presents the results of these reviews to management. The loan review process complements and reinforces the risk identification and assessment decisions made by loan officers and credit personnel.
The amortized cost of loans receivable, net of ACL on loans consisted of the following portfolio segments and classes at the dates indicated:
| | | | | | | | | | | |
| December 31, 2024 | | December 31, 2023 |
| (Dollars in thousands) |
| Commercial business: | | | |
| Commercial and industrial | $ | 842,672 | | | $ | 718,291 | |
| Owner-occupied CRE | 1,003,243 | | | 958,620 | |
| Non-owner occupied CRE | 1,909,107 | | | 1,697,574 | |
| Total commercial business | 3,755,022 | | | 3,374,485 | |
| Residential real estate | 402,954 | | | 375,342 | |
| Real estate construction and land development: | | | |
| Residential | 83,890 | | | 78,610 | |
| Commercial and multifamily | 395,553 | | | 335,819 | |
| Total real estate construction and land development | 479,443 | | | 414,429 | |
| Consumer | 164,704 | | | 171,371 | |
| Loans receivable | 4,802,123 | | | 4,335,627 | |
| ACL on loans | (52,468) | | | (47,999) | |
| Loans receivable, net | $ | 4,749,655 | | | $ | 4,287,628 | |
| | | |
| Balances included in the amortized cost of loans receivable: | | | |
| Unamortized net discount on acquired loans | $ | (1,095) | | | $ | (1,923) | |
| Unamortized net deferred fee | $ | (10,110) | | | $ | (11,063) | |
A discussion of the risk characteristics of each loan portfolio segment is as follows:
Commercial Business:
Commercial and industrial. Commercial and industrial loans are primarily made based on the identified cash flows of the borrower and secondarily on the underlying collateral provided by the borrower. The cash flows of borrowers, however, may not be as expected and the collateral securing these loans may fluctuate in value. Most commercial and industrial loans are secured by the assets being financed or other business assets such as accounts receivable or inventory and may include a personal guarantee; however, some short-term loans may be made on an unsecured basis. In the case of loans secured by accounts receivable, the availability of funds for the repayment of these loans may be substantially dependent on the ability of the borrower to collect amounts due from its customers. Commercial and industrial loans carry more risk than other loans because the borrowers’ cash flow is less predictable and in the event of a default the amount of loss is potentially greater and more difficult to quantify because the value of the collateral securing these loans may fluctuate, may be uncollectible or may be obsolete or of limited use, among other things.
Owner-occupied and non-owner occupied CRE. The Company originates CRE loans primarily within its primary market areas. These loans are subject to underwriting standards and processes similar to commercial and industrial loans in that these loans are viewed primarily as cash flow loans and secondarily as loans secured by real estate properties. CRE lending typically involves higher loan principal amounts and payments on loans and repayment is dependent on successful operation and management of the properties. The value of the real estate securing these loans can be adversely affected by conditions in the real estate market or the economy. There is some common risk characteristics with owner-occupied CRE loans and non-owner occupied CRE loans. However, owner-occupied CRE loans are generally considered to have a slightly lower risk profile as we typically have the guarantee of the owner-occupant and can underwrite risk using the complete financial information on the entity that occupies the property.
Residential Real Estate:
The majority of the Company’s residential real estate loans are secured by one-to-four family residences located in its primary market areas. The Company’s underwriting standards require that residential real estate loans maintained in the portfolio generally are owner-occupied and do not exceed 80% of the lower of appraised value at origination or cost of the underlying collateral. Terms of maturity typically range from 15 to 30 years. In 2024, the Bank ceased the origination of residential real estate loans; however, the Company may purchase pools of residential real estate loans. All purchased loans adhere to the Company's underwriting standards.
Real Estate Construction and Land Development:
The Company originates construction loans for residential and for commercial and multifamily properties. The residential construction loans generally include construction of custom single-family homes whereby the homeowner is the borrower. The Company also provides financing to builders for the construction of pre-sold residential homes and, in selected cases, to builders for the construction of speculative single-family residential property. Construction loans are typically short-term in nature and
priced with variable rates of interest. Construction loans may also be originated as a construction-to-permanent financing loan whereby upon completion of the construction phase, the loan is automatically converted to a permanent term loan. Construction lending can involve a higher level of risk than other types of lending because funds are advanced partially based upon the value of the project, which is uncertain prior to the project’s completion. Because of the uncertainties inherent in estimating construction costs as well as the market value of a completed project and the effects of governmental regulation of real property, the Company’s estimates with regard to the total funds required to complete a project and the related loan-to-value ratio may vary from actual results. As a result, construction loans often involve the disbursement of substantial funds with repayment dependent, in part, on the success of the ultimate project and the ability of the borrower to sell or lease the property or refinance the indebtedness. If the Company’s estimate of the value of a project at completion proves to be overstated, it may have inadequate security for repayment of the loan and may incur a loss if the borrower does not repay the loan. Sources of repayment for these types of loans may be pre-committed permanent loans from approved long-term lenders, sales of developed property or an interim loan commitment from the Company until permanent financing is obtained. These loans are closely monitored by on-site inspections and are considered to have higher risks than other real estate loans due to their ultimate repayment being dependent upon successful completion of the construction project, market interest rate changes, government regulation of real property, general economic conditions and the availability of long-term financing.
Consumer:
The Company originates consumer loans and lines of credit that are both secured and unsecured. The underwriting process for these loans ensures a qualifying primary and secondary source of repayment. Underwriting standards for home equity loans are significantly influenced by statutory requirements, which include, but are not limited to, a maximum loan-to-value percentage of 80%, collection remedies, the number of such loans a borrower can have at one time and documentation requirements. To monitor and manage consumer loan risk, policies and procedures are developed and modified, as needed. The majority of consumer loans are for relatively small amounts disbursed among many individual borrowers which reduces the overall credit risk for this segment. To further reduce the risk, trend reports are reviewed by management on a regular basis.
(b) Concentrations of Credit
Most of the Company’s lending activity occurs within its primary market areas which are concentrated along the I-5 corridor from Whatcom County, Washington to Lane County, Oregon, as well as Yakima County, Washington and Ada County, Idaho. Additionally, the Company's loan portfolio is concentrated in commercial business loans, which include commercial and industrial, owner-occupied and nonowner-occupied CRE, and commercial and multifamily real estate construction and land development loans. Commercial business loans and commercial and multifamily real estate construction and land development loans are generally considered as having a more inherent risk of default than residential real estate loans or other consumer loans. Also, the loan balance per borrower is typically larger than that for residential real estate loans and consumer loans, implying higher potential losses on an individual loan basis.
(c) Credit Quality Indicators
As part of the on-going monitoring of the credit quality of the Company’s loan portfolio, management tracks certain credit quality indicators including trends related to (i) the risk grade of the loans, (ii) the level of classified loans, (iii) net charge-offs, (iv) nonperforming loans, (v) past due status, and (vi) the general economic conditions of the United States of America, and specifically the states of Washington, Oregon and Idaho. The Company utilizes a risk grading matrix to assign a risk grade to each of its loans. Loans are graded on a scale of 1 to 10. A description of the general characteristics of the risk grades is as follows:
•Grades 1 to 5: These grades are considered “Pass” and include loans with negligible to above average, but acceptable, risk. These borrowers generally have strong to acceptable capital levels and consistent earnings and debt service capacity. Loans with the higher grades within the “Pass” category may include borrowers who are experiencing unusual operating difficulties, but have acceptable payment performance to date. Increased monitoring of financial information and/or collateral may be appropriate. Loans with this grade show no immediate loss exposure.
•Grade 6: This grade includes "Watch" loans. The grade is intended to be utilized on a temporary basis for pass grade borrowers where a potentially significant risk-modifying action is anticipated in the near term and are considered Pass grade for reporting purposes.
•Grade 7: This grade includes "Special Mention" ("SM") loans and is intended to highlight loans deemed by management to have some elevated risks that deserve management's close attention. Loans with this grade show signs of deteriorating profits and capital and the borrower might not be strong enough to sustain a major setback. The borrower is typically higher than normally leveraged and outside support might be modest and likely illiquid. The loan is at risk of further credit decline unless active measures are taken to correct the situation.
•Grade 8: This grade includes “Substandard” ("SS") loans in accordance with regulatory guidelines, which the Company has determined have a high credit risk. These loans also have well-defined weaknesses and are characterized by the distinct possibility that the Company will sustain some loss if the deficiencies are not corrected. The borrower may have shown serious negative trends in financial ratios and performance. Such loans may be dependent upon collateral liquidation, a secondary source of repayment or an event outside of the normal course of business.
•Grade 9: This grade includes “Doubtful” loans in accordance with regulatory guidelines and the Company has determined these loans to have excessive credit risk. Such loans are placed on nonaccrual status and may be dependent upon collateral having a value that is difficult to determine or upon some near-term event which lacks certainty. Additionally, these loans generally have been partially charged off for the amount considered uncollectible.
•Grade 10: This grade includes “Loss” loans in accordance with regulatory guidelines and the Company has determined these loans have the highest risk of loss. Such loans are charged off or charged down when payment is acknowledged to be uncertain or when the timing or value of payments cannot be determined.
Numerical loan grades for loans are established at the origination of the loan. Changes to loan grades are considered at the time new information about the performance of a loan becomes available, including the receipt of updated financial information from the borrower, results of annual term loan reviews and scheduled loan reviews. For consumer loans, the Company follows the FDIC’s Uniform Retail Credit Classification and Account Management Policy for subsequent classification in the event of payment delinquencies or default. Typically, an individual loan grade will not be changed from the prior period unless there is a specific indication of credit deterioration or improvement. Credit deterioration is evidenced by delinquency, direct communications with the borrower or other borrower information that becomes known to management. Credit improvements are evidenced by known facts regarding the borrower or the collateral property.
Loan grades relate to the likelihood of losses in that the higher the grade, the greater the loss potential. Loans with a Pass grade may have some estimated inherent losses, but to a lesser extent than the other loan grades. The SM loan grade is transitory in that the Company is waiting on additional information to determine the likelihood and extent of any potential loss. The likelihood of loss for SM graded loans, however, is greater than Watch graded loans because there has been measurable credit deterioration. Loans with a SS grade have further credit deterioration and include both accrual loans and nonaccrual loans. For Doubtful and Loss graded loans, the Company is almost certain of the losses and the outstanding principal balances are generally charged off to the realizable value. There were no loans graded Doubtful or Loss as of December 31, 2024 and 2023.
The following tables present the amortized cost of loans receivable by risk grade and origination year, and the gross charge-offs by loan class and origination year, at the dates indicated.
| | | | | | | | | | | | | | | | | | | | | | | | | | | | | | | | | | | | | | | | | | | | | | | | | | | | | |
| December 31, 2024 | | Revolving Loans | | Revolving Loans Converted(1) | | Loans Receivable |
| Term Loans
Amortized Cost Basis by Origination Year | | | |
| 2024 | | 2023 | | 2022 | | 2021 | | 2020 | | Prior | | | |
| (Dollars in thousands) |
| Commercial business: |
| Commercial and industrial |
| Pass | $ | 204,107 | | | $ | 127,603 | | | $ | 125,220 | | | $ | 51,126 | | | $ | 53,115 | | | $ | 78,039 | | | $ | 147,861 | | | $ | 491 | | | $ | 787,562 | |
| SM | 161 | | | 4,482 | | | 6,495 | | | 502 | | | 1,117 | | | 4,490 | | | 13,555 | | | 2,352 | | | 33,154 | |
| SS | — | | | 235 | | | 857 | | | 315 | | | 2,516 | | | 4,337 | | | 12,331 | | | 1,365 | | | 21,956 | |
| Total | 204,268 | | | 132,320 | | | 132,572 | | | 51,943 | | | 56,748 | | | 86,866 | | | 173,747 | | | 4,208 | | | 842,672 | |
| Owner-occupied CRE |
| Pass | 116,031 | | | 93,567 | | | 136,496 | | | 147,540 | | | 81,161 | | | 389,801 | | | 534 | | | — | | | 965,130 | |
| SM | — | | | 2,719 | | | 1,215 | | | 4,121 | | | 871 | | | 15,298 | | | — | | | — | | | 24,224 | |
| SS | — | | | — | | | — | | | 1,182 | | | 637 | | | 12,070 | | | — | | | — | | | 13,889 | |
| Total | 116,031 | | | 96,286 | | | 137,711 | | | 152,843 | | | 82,669 | | | 417,169 | | | 534 | | | — | | | 1,003,243 | |
| Non-owner occupied CRE |
| Pass | 168,040 | | | 174,993 | | | 338,983 | | | 238,933 | | | 149,804 | | | 790,691 | | | — | | | 24 | | | 1,861,468 | |
| SM | — | | | — | | | — | | | 7,988 | | | — | | | 32,925 | | | — | | | — | | | 40,913 | |
| SS | — | | | — | | | 584 | | | — | | | — | | | 6,142 | | | — | | | — | | | 6,726 | |
| Total | 168,040 | | | 174,993 | | | 339,567 | | | 246,921 | | | 149,804 | | | 829,758 | | | — | | | 24 | | | 1,909,107 | |
| Total commercial business |
| Pass | 488,178 | | | 396,163 | | | 600,699 | | | 437,599 | | | 284,080 | | | 1,258,531 | | | 148,395 | | | 515 | | | 3,614,160 | |
| SM | 161 | | | 7,201 | | | 7,710 | | | 12,611 | | | 1,988 | | | 52,713 | | | 13,555 | | | 2,352 | | | 98,291 | |
| SS | — | | | 235 | | | 1,441 | | | 1,497 | | | 3,153 | | | 22,549 | | | 12,331 | | | 1,365 | | | 42,571 | |
| Total | 488,339 | | | 403,599 | | | 609,850 | | | 451,707 | | | 289,221 | | | 1,333,793 | | | 174,281 | | | 4,232 | | | 3,755,022 | |
| Residential real estate |
| Pass | 32,857 | | | 52,317 | | | 135,115 | | | 132,150 | | | 21,909 | | | 26,838 | | | — | | | — | | | 401,186 | |
| | | | | | | | | | | | | | | | | |
| SS | — | | | — | | | 832 | | | 786 | | | — | | | 150 | | | — | | | — | | | 1,768 | |
| Total | 32,857 | | | 52,317 | | | 135,947 | | | 132,936 | | | 21,909 | | | 26,988 | | | — | | | — | | | 402,954 | |
| | | | | | | | | | | | | | | | | | | | | | | | | | | | | | | | | | | | | | | | | | | | | | | | | | | | | |
| December 31, 2024 | | Revolving Loans | | Revolving Loans Converted(1) | | Loans Receivable |
| Term Loans
Amortized Cost Basis by Origination Year | | | |
| 2024 | | 2023 | | 2022 | | 2021 | | 2020 | | Prior | | | |
| Real estate construction and land development: |
| Residential |
| Pass | 34,078 | | | 34,436 | | | 6,415 | | | — | | | 1,000 | | | 955 | | | 256 | | | — | | | 77,140 | |
| | | | | | | | | | | | | | | | | |
| SS | — | | | 1,000 | | | — | | | 5,750 | | | — | | | — | | | — | | | — | | | 6,750 | |
| Total | 34,078 | | | 35,436 | | | 6,415 | | | 5,750 | | | 1,000 | | | 955 | | | 256 | | | — | | | 83,890 | |
| Commercial and multifamily |
| Pass | 37,022 | | | 169,816 | | | 147,789 | | | 9,865 | | | — | | | 3,002 | | | — | | | — | | | 367,494 | |
| SM | — | | | — | | | 893 | | | — | | | 5,655 | | | 5,886 | | | — | | | — | | | 12,434 | |
| SS | — | | | — | | | — | | | 15,625 | | | — | | | — | | | — | | | — | | | 15,625 | |
| Total | 37,022 | | | 169,816 | | | 148,682 | | | 25,490 | | | 5,655 | | | 8,888 | | | — | | | — | | | 395,553 | |
| Total real estate construction and land development |
| Pass | 71,100 | | | 204,252 | | | 154,204 | | | 9,865 | | | 1,000 | | | 3,957 | | | 256 | | | — | | | 444,634 | |
| SM | — | | | — | | | 893 | | | — | | | 5,655 | | | 5,886 | | | — | | | — | | | 12,434 | |
| SS | — | | | 1,000 | | | — | | | 21,375 | | | — | | | — | | | — | | | — | | | 22,375 | |
| Total | 71,100 | | | 205,252 | | | 155,097 | | | 31,240 | | | 6,655 | | | 9,843 | | | 256 | | | — | | | 479,443 | |
| Consumer |
| Pass | 1,882 | | | 1,513 | | | 1,477 | | | 339 | | | 3,196 | | | 20,518 | | | 133,355 | | | 820 | | | 163,100 | |
| | | | | | | | | | | | | | | | | |
| SS | — | | | — | | | 25 | | | — | | | 115 | | | 609 | | | 60 | | | 795 | | | 1,604 | |
| Total | 1,882 | | | 1,513 | | | 1,502 | | | 339 | | | 3,311 | | | 21,127 | | | 133,415 | | | 1,615 | | | 164,704 | |
| Loans receivable |
| Pass | 594,017 | | | 654,245 | | | 891,495 | | | 579,953 | | | 310,185 | | | 1,309,844 | | | 282,006 | | | 1,335 | | | 4,623,080 | |
| SM | 161 | | | 7,201 | | | 8,603 | | | 12,611 | | | 7,643 | | | 58,599 | | | 13,555 | | | 2,352 | | | 110,725 | |
| SS | — | | | 1,235 | | | 2,298 | | | 23,658 | | | 3,268 | | | 23,308 | | | 12,391 | | | 2,160 | | | 68,318 | |
| Total | $ | 594,178 | | | $ | 662,681 | | | $ | 902,396 | | | $ | 616,222 | | | $ | 321,096 | | | $ | 1,391,751 | | | $ | 307,952 | | | $ | 5,847 | | | $ | 4,802,123 | |
(1) Represents the loans receivable balance at December 31, 2024 which was converted from a revolving loan to a non-revolving amortizing loan during the year ended December 31, 2024.
| | | | | | | | | | | | | | | | | | | | | | | | | | | | | | | | | | | | | | | | | | | | | | | | | | | | | | |
| December 31, 2023 | | Revolving Loans | | Revolving Loans Converted(1) | | Loans Receivable | |
| Term Loans
Amortized Cost Basis by Origination Year | | | | |
| 2023 | | 2022 | | 2021 | | 2020 | | 2019 | | Prior | | | | |
| (Dollars in thousands) | |
| Commercial business: | |
| Commercial and industrial | |
| Pass | $ | 120,973 | | | $ | 150,854 | | | $ | 74,231 | | | $ | 66,364 | | | $ | 40,307 | | | $ | 76,924 | | | $ | 141,740 | | | $ | 188 | | | $ | 671,581 | | |
| SM | — | | | 2,495 | | | 104 | | | 292 | | | 4,556 | | | 1,458 | | | 9,124 | | | — | | | 18,029 | | |
| SS | — | | | 1,215 | | | 2,734 | | | 3,548 | | | 1,076 | | | 7,875 | | | 12,168 | | | 65 | | | 28,681 | | |
| Total | 120,973 | | | 154,564 | | | 77,069 | | | 70,204 | | | 45,939 | | | 86,257 | | | 163,032 | | | 253 | | | 718,291 | | |
| Owner-occupied CRE | |
| Pass | 90,775 | | | 138,505 | | | 159,490 | | | 82,296 | | | 146,869 | | | 299,609 | | | — | | | — | | | 917,544 | | |
| SM | — | | | — | | | 2,219 | | | 2,775 | | | 705 | | | 16,266 | | | — | | | — | | | 21,965 | | |
| SS | — | | | — | | | 4,908 | | | 654 | | | — | | | 13,549 | | | — | | | — | | | 19,111 | | |
| Total | 90,775 | | | 138,505 | | | 166,617 | | | 85,725 | | | 147,574 | | | 329,424 | | | — | | | — | | | 958,620 | | |
| | | | | | | | | | | | | | | | | | | | | | | | | | | | | | | | | | | | | | | | | | | | | | | | | | | | | | |
| December 31, 2023 | | Revolving Loans | | Revolving Loans Converted(1) | | Loans Receivable | |
| Term Loans
Amortized Cost Basis by Origination Year | | | | |
| 2023 | | 2022 | | 2021 | | 2020 | | 2019 | | Prior | | | | |
| Non-owner-occupied CRE | |
| Pass | 153,239 | | | 260,431 | | | 216,811 | | | 157,424 | | | 239,928 | | | 628,489 | | | — | | | — | | | 1,656,322 | | |
| SM | — | | | — | | | 8,172 | | | — | | | 570 | | | 19,300 | | | — | | | — | | | 28,042 | | |
| SS | — | | | 598 | | | — | | | — | | | — | | | 12,612 | | | — | | | — | | | 13,210 | | |
| Total | 153,239 | | | 261,029 | | | 224,983 | | | 157,424 | | | 240,498 | | | 660,401 | | | — | | | — | | | 1,697,574 | | |
| Total commercial business | |
| Pass | 364,987 | | | 549,790 | | | 450,532 | | | 306,084 | | | 427,104 | | | 1,005,022 | | | 141,740 | | | 188 | | | 3,245,447 | | |
| SM | — | | | 2,495 | | | 10,495 | | | 3,067 | | | 5,831 | | | 37,024 | | | 9,124 | | | — | | | 68,036 | | |
| SS | — | | | 1,813 | | | 7,642 | | | 4,202 | | | 1,076 | | | 34,036 | | | 12,168 | | | 65 | | | 61,002 | | |
| Total | 364,987 | | | 554,098 | | | 468,669 | | | 313,353 | | | 434,011 | | | 1,076,082 | | | 163,032 | | | 253 | | | 3,374,485 | | |
| Residential real estate | |
| Pass | 36,321 | | | 141,201 | | | 141,430 | | | 24,108 | | | 15,022 | | | 16,297 | | | — | | | — | | | 374,379 | | |
| | | | | | | | | | | | | | | | | | |
| SS | — | | | — | | | 801 | | | — | | | — | | | 162 | | | — | | | — | | | 963 | | |
| Total | 36,321 | | | 141,201 | | | 142,231 | | | 24,108 | | | 15,022 | | | 16,459 | | | — | | | — | | | 375,342 | | |
| Real estate construction and land development: | |
| Residential | |
| Pass | 41,663 | | | 24,760 | | | 1,050 | | | 1,289 | | | 804 | | | 719 | | | 1 | | | — | | | 70,286 | | |
| SM | — | | | — | | | 2,139 | | | — | | | — | | | — | | | — | | | — | | | 2,139 | | |
| SS | 1,000 | | | 319 | | | 4,866 | | | — | | | — | | | — | | | — | | | — | | | 6,185 | | |
| Total | 42,663 | | | 25,079 | | | 8,055 | | | 1,289 | | | 804 | | | 719 | | | 1 | | | — | | | 78,610 | | |
| Commercial and multifamily | |
| Pass | 42,499 | | | 187,827 | | | 91,460 | | | 337 | | | 749 | | | 3,145 | | | — | | | — | | | 326,017 | | |
| SM | — | | | — | | | — | | | 3,777 | | | 5,660 | | | 365 | | | — | | | — | | | 9,802 | | |
| | | | | | | | | | | | | | | | | | |
| Total | 42,499 | | | 187,827 | | | 91,460 | | | 4,114 | | | 6,409 | | | 3,510 | | | — | | | — | | | 335,819 | | |
| Total real estate construction and land development | |
| Pass | 84,162 | | | 212,587 | | | 92,510 | | | 1,626 | | | 1,553 | | | 3,864 | | | 1 | | | — | | | 396,303 | | |
| SM | — | | | — | | | 2,139 | | | 3,777 | | | 5,660 | | | 365 | | | — | | | — | | | 11,941 | | |
| SS | 1,000 | | | 319 | | | 4,866 | | | — | | | — | | | — | | | — | | | — | | | 6,185 | | |
| Total | 85,162 | | | 212,906 | | | 99,515 | | | 5,403 | | | 7,213 | | | 4,229 | | | 1 | | | — | | | 414,429 | | |
| Consumer | |
| Pass | 1,897 | | | 1,980 | | | 293 | | | 6,221 | | | 15,841 | | | 20,402 | | | 122,007 | | | 1,123 | | | 169,764 | | |
| | | | | | | | | | | | | | | | | | |
| SS | — | | | — | | | — | | | 134 | | | 207 | | | 893 | | | 333 | | | 40 | | | 1,607 | | |
| Total | 1,897 | | | 1,980 | | | 293 | | | 6,355 | | | 16,048 | | | 21,295 | | | 122,340 | | | 1,163 | | | 171,371 | | |
| Loans receivable | |
| Pass | 487,367 | | | 905,558 | | | 684,765 | | | 338,039 | | | 459,520 | | | 1,045,585 | | | 263,748 | | | 1,311 | | | 4,185,893 | | |
| SM | — | | | 2,495 | | | 12,634 | | | 6,844 | | | 11,491 | | | 37,389 | | | 9,124 | | | — | | | 79,977 | | |
| SS | 1,000 | | | 2,132 | | | 13,309 | | | 4,336 | | | 1,283 | | | 35,091 | | | 12,501 | | | 105 | | | 69,757 | | |
| Total | $ | 488,367 | | | $ | 910,185 | | | $ | 710,708 | | | $ | 349,219 | | | $ | 472,294 | | | $ | 1,118,065 | | | $ | 285,373 | | | $ | 1,416 | | | $ | 4,335,627 | | |
(1) Represents the loans receivable balance at December 31, 2023 which was converted from a revolving loan to a non-revolving amortizing loan during the year ended December 31, 2023
The following tables present the gross charge-offs by loan class and origination year, for the periods indicated:
| | | | | | | | | | | | | | | | | | | | | | | | | | | | | | | | | | | | | | | | | | | | | | | | | |
| Year Ended December 31, 2024 |
| Current Period Gross Charge-offs by Origination Year | | Revolving Loans | | | | Total Gross Charge-Offs |
| 2024 | | 2023 | | 2022 | | 2021 | | 2020 | | Prior | | | | |
| (Dollars in thousands) |
| Commercial business | $ | — | | | $ | 313 | | | $ | — | | | $ | — | | | $ | 4 | | | $ | 2,636 | | | $ | — | | | | | $ | 2,953 | |
| | | | | | | | | | | | | | | | | |
| | | | | | | | | | | | | | | | | |
| Consumer | — | | | 6 | | | 22 | | | — | | | 11 | | | 168 | | | 331 | | | | | 538 | |
| Total | $ | — | | | $ | 319 | | | $ | 22 | | | $ | — | | | $ | 15 | | | $ | 2,804 | | | $ | 331 | | | | | $ | 3,491 | |
| | | | | | | | | | | | | | | | | | | | | | | | | | | | | | | | | | | | | | | | | | | | | | | | | |
| Year Ended December 31, 2023 |
| Current Period Gross Charge-offs by Origination Year | | Revolving Loans | | | | Total Gross Charge-Offs |
| 2023 | | 2022 | | 2021 | | 2020 | | 2019 | | Prior | | | | |
| (Dollars in thousands) |
| Commercial business | $ | — | | | $ | — | | | $ | 254 | | | $ | 323 | | | $ | 27 | | | $ | 115 | | | $ | — | | | | | $ | 719 | |
| | | | | | | | | | | | | | | | | |
| | | | | | | | | | | | | | | | | |
| Consumer | 7 | | | 10 | | | 30 | | | 29 | | | 106 | | | 152 | | | 252 | | | | | 586 | |
| Total | $ | 7 | | | $ | 10 | | | $ | 284 | | | $ | 352 | | | $ | 133 | | | $ | 267 | | | $ | 252 | | | | | $ | 1,305 | |
(d) Nonaccrual Loans
The following tables present the amortized cost of nonaccrual loans at the dates indicated:
| | | | | | | | | | | | | | | | | |
| December 31, 2024 |
| Nonaccrual without ACL | | Nonaccrual with ACL | | Total Nonaccrual |
| (Dollars in thousands) |
| Commercial business: | | | | | |
| Commercial and industrial | $ | 1,002 | | | $ | 667 | | | $ | 1,669 | |
| Owner-occupied CRE | 2,250 | | | — | | | 2,250 | |
| | | | | |
| Total commercial business | 3,252 | | | 667 | | | 3,919 | |
| | | | | |
| | | | | |
| | | | | |
| | | | | |
| | | | | |
| Consumer | 160 | | | — | | | 160 | |
| Total | $ | 3,412 | | | $ | 667 | | | $ | 4,079 | |
| | | | | | | | | | | | | | | | | | | |
| December 31, 2023 | | |
| Nonaccrual without ACL | | Nonaccrual with ACL | | Total Nonaccrual | | |
| (Dollars in thousands) |
| Commercial business: | | | | | | | |
| Commercial and industrial | $ | 1,706 | | | $ | 2,557 | | | $ | 4,263 | | | |
| Owner-occupied CRE | — | | | 205 | | | 205 | | | |
| | | | | | | |
| | | | | | | |
| | | | | | | |
| | | | | | | |
| | | | | | | |
| | | | | | | |
| | | | | | | |
| | | | | | | |
| Total | $ | 1,706 | | | $ | 2,762 | | | $ | 4,468 | | | |
The following table presents the reversal of interest income on loans due to the write-off of accrued interest receivable upon the initial classification of loans as nonaccrual loans and the interest income recognized due to payment in full or sale of previously classified nonaccrual loans during the following periods:
| | | | | | | | | | | | | | | | | | | | | | | | | | | |
| Year Ended December 31, 2024 | | Year Ended December 31, 2023 | | |
| Interest Income Reversed | | Interest Income Recognized | | Interest Income Reversed | | Interest Income Recognized | | | | |
| (Dollars in thousands) |
| Commercial business: | | | | | | | | | | | |
| Commercial and industrial | $ | (27) | | | $ | 461 | | | $ | (61) | | | $ | 347 | | | | | |
| Owner-occupied CRE | (28) | | | 144 | | | — | | | — | | | | | |
| | | | | | | | | | | |
| Total commercial business | (55) | | | 605 | | | (61) | | | 347 | | | | | |
| | | | | | | | | | | |
| | | | | | | | | | | |
| | | | | | | | | | | |
| | | | | | | | | | | |
| | | | | | | | | | | |
| Consumer | (5) | | | — | | | — | | | — | | | | | |
| Total | $ | (60) | | | $ | 605 | | | $ | (61) | | | $ | 347 | | | | | |
For the year ended December 31, 2024 and 2023, no interest income was recognized subsequent to a loan’s classification as nonaccrual, except as indicated in the tables above due to payment in full or sale.
(e) Past due loans
The Company performs an aging analysis of past due loans using policies consistent with regulatory reporting requirements with categories of 30-89 days past due and 90 or more days past due. The following tables present the amortized cost of past due loans at the dates indicated:
| | | | | | | | | | | | | | | | | | | | | | | | | | | | | |
| December 31, 2024 |
| 30-89 Days | | 90 Days
or Greater | | Total Past
Due | | Current | | Loans Receivable |
| (Dollars in thousands) |
| Commercial business: |
| Commercial and industrial | $ | 659 | | | $ | 2,471 | | | $ | 3,130 | | | $ | 839,542 | | | $ | 842,672 | |
| Owner-occupied CRE | 1,426 | | | — | | | 1,426 | | | 1,001,817 | | | 1,003,243 | |
| Non-owner occupied CRE | — | | | — | | | — | | | 1,909,107 | | | 1,909,107 | |
| Total commercial business | 2,085 | | | 2,471 | | | 4,556 | | | 3,750,466 | | | 3,755,022 | |
| Residential real estate | 832 | | | — | | | 832 | | | 402,122 | | | 402,954 | |
| Real estate construction and land development: |
| Residential | — | | | — | | | — | | | 83,890 | | | 83,890 | |
| Commercial and multifamily | — | | | — | | | — | | | 395,553 | | | 395,553 | |
| Total real estate construction and land development | — | | | — | | | — | | | 479,443 | | | 479,443 | |
| Consumer | 339 | | | 160 | | | 499 | | | 164,205 | | | 164,704 | |
| Total | $ | 3,256 | | | $ | 2,631 | | | $ | 5,887 | | | $ | 4,796,236 | | | $ | 4,802,123 | |
| | | | | | | | | | | | | | | | | | | | | | | | | | | | | |
| December 31, 2023 |
| 30-89 Days | | 90 Days or
Greater | | Total Past
Due | | Current | | Loans Receivable |
| (Dollars in thousands) |
| Commercial business: |
| Commercial and industrial | $ | 2,289 | | | $ | 3,857 | | | $ | 6,146 | | | $ | 712,145 | | | $ | 718,291 | |
| Owner-occupied CRE | — | | | 189 | | | 189 | | | 958,431 | | | 958,620 | |
| Non-owner occupied CRE | 1,489 | | | — | | | 1,489 | | | 1,696,085 | | | 1,697,574 | |
| Total commercial business | 3,778 | | | 4,046 | | | 7,824 | | | 3,366,661 | | | 3,374,485 | |
| Residential real estate | 162 | | | — | | | 162 | | | 375,180 | | | 375,342 | |
| | | | | | | | | | | | | | | | | | | | | | | | | | | | | |
| December 31, 2023 |
| 30-89 Days | | 90 Days or
Greater | | Total Past
Due | | Current | | Loans Receivable |
| (Dollars in thousands) |
| Real estate construction and land development: |
| Residential | — | | | 319 | | | 319 | | | 78,291 | | | 78,610 | |
| Commercial and multifamily | — | | | — | | | — | | | 335,819 | | | 335,819 | |
| Total real estate construction and land development | — | | | 319 | | | 319 | | | 414,110 | | | 414,429 | |
| Consumer | 615 | | | 87 | | | 702 | | | 170,669 | | | 171,371 | |
| Total | $ | 4,555 | | | $ | 4,452 | | | $ | 9,007 | | | $ | 4,326,620 | | | $ | 4,335,627 | |
The following table present loans 90 days or more past due and still accruing interest:
| | | | | | | | | | | |
| December 31, 2024 | | December 31, 2023 |
| (Dollars in thousands) |
| Commercial business: | | | |
| Commercial and industrial | $ | 1,195 | | | $ | 887 | |
| | | |
| | | |
| Total commercial business | 1,195 | | | 887 | |
| | | |
| Real estate construction and land development: | | | |
| Residential | — | | | 319 | |
| | | |
| Total real estate construction and land development | — | | | 319 | |
| Consumer | — | | | 87 | |
| Total | $ | 1,195 | | | $ | 1,293 | |
(f) Collateral-dependent Loans
The following tables present the type of collateral securing loans individually evaluated for credit losses and for which the repayment was expected to be provided substantially through the operation or sale of the collateral at the dates indicated, with balances representing the amortized cost of the loan classified by the primary collateral category of each loan if multiple collateral sources secure the loan:
| | | | | | | | | | | | | | | | | | | | | | | | | | | | | |
| December 31, 2024 |
| CRE | | Farmland | | Residential Real Estate | | Equipment | | Total |
| (Dollars in thousands) |
| Commercial business: |
| Commercial and industrial | $ | — | | | $ | 389 | | | $ | 613 | | | $ | — | | | $ | 1,002 | |
| Owner-occupied CRE | 2,250 | | | — | | | — | | | — | | | 2,250 | |
| | | | | | | | | |
| Total commercial business | 2,250 | | | 389 | | | 613 | | | — | | | 3,252 | |
| | | | | | | | | |
|
| | | | | | | | | |
| | | | | | | | | |
| | | | | | | | | |
| Consumer | — | | | — | | | 160 | | | — | | | 160 | |
| Total | $ | 2,250 | | | $ | 389 | | | $ | 773 | | | $ | — | | | $ | 3,412 | |
| | | | | | | | | | | | | | | | | | | | | | | | | | | | | |
| December 31, 2023 |
| CRE | | Farmland | | Residential Real Estate | | Equipment | | Total |
| (Dollars in thousands) |
| Commercial business: |
| Commercial and industrial | $ | 260 | | | $ | 389 | | | $ | 621 | | | $ | 304 | | | $ | 1,574 | |
| Owner-occupied CRE | 189 | | | — | | | — | | | — | | | 189 | |
| | | | | | | | | |
| Total commercial business | 449 | | | 389 | | | 621 | | | 304 | | | 1,763 | |
| | | | | | | | | |
|
| | | | | | | | | |
| | | | | | | | | |
| | | | | | | | | |
| | | | | | | | | |
| Total | $ | 449 | | | $ | 389 | | | $ | 621 | | | $ | 304 | | | $ | 1,763 | |
There have been no significant changes to the collateral securing loans individually evaluated for credit losses and for which repayment was expected to be provided substantially through the operation or sale of the collateral during the year ended December 31, 2024, except changes due to additions or removals of loans in this classification.
(g) Modification of Loans
Occasionally, the Company modifies loans to borrowers in financial distress by providing modifications of loans which may include interest rate reductions, principal or interest forgiveness, term extensions, and other actions intended to minimize economic loss and to avoid foreclosure or repossession of collateral. In some cases, the Company provides multiple types of concessions on one loan. When principal forgiveness is provided, the amount of forgiveness is charged-off against the ACL.
The following tables present amortized cost of loans that were experiencing both financial difficulty and modified during the periods indicated:
| | | | | | | | | | | | | | | | | | | | | | | | | | | | | |
| | | Year Ended December 31, 2024 |
| | | Term Extension | | | | | | Term Extension & Int. Rate Reduction | | Total Modified Loans | | % of Modified Loans to Loans Receivable, net |
| | | | | | |
| | | (Dollars in thousands) |
| Commercial business: |
| Commercial and industrial | | | $ | 20,962 | | | | | | | $ | 200 | | | $ | 21,162 | | | 2.51 | % |
| | | | | | | | | | | | | |
| | | | | | | | | | | | | |
| Total commercial business | | | 20,962 | | | | | | | 200 | | | 21,162 | | | 0.56 | |
| | | | | | | | | | | | | |
| Real estate construction and land development: | | | | | | | | | | | | | |
| Residential | | | 6,750 | | | | | | | — | | | 6,750 | | | 8.05 | |
| Commercial and multifamily | | | 5,655 | | | | | | | 15,625 | | | 21,280 | | | 5.38 | |
| Total real estate construction and land development | | | 12,405 | | | | | | | 15,625 | | | 28,030 | | | 5.85 | |
| Consumer | | | 44 | | | | | | | — | | | 44 | | | 0.03 | |
| Total | | | $ | 33,411 | | | | | | | $ | 15,825 | | | $ | 49,236 | | | 1.03 | % |
| | | | | | | | | | | | | | | | | | | | | | | | | | | | | |
| | | Year Ended December 31, 2023 |
| | | Term Extension | | | | | | Term Extension & Int. Rate Reduction | | Total Modified Loans | | % of Modified Loans to Loans Receivable, net |
| | | | | |
| | | (Dollars in thousands) |
| Commercial business: |
| Commercial and industrial | | | $ | 16,822 | | | | | | | $ | — | | | $ | 16,822 | | | 2.34 | % |
| Owner-occupied CRE | | | 209 | | | | | | | — | | | 209 | | | 0.02 | |
| Non-owner occupied CRE | | | 2,701 | | | | | | | 237 | | | 2,938 | | | 0.17 | |
| Total commercial business | | | 19,732 | | | | | | | 237 | | | 19,969 | | | 0.59 | |
| | | | | | | | | | | | | |
| Real estate construction and land development: | | | | | | | | | | | | | |
| Residential | | | 5,866 | | | | | | | — | | | 5,866 | | | 7.46 | |
| Commercial and multifamily | | | 3,777 | | | | | | | — | | | 3,777 | | | 1.12 | |
| Total real estate construction and land development | | | 9,643 | | | | | | | — | | | 9,643 | | | 2.33 | |
| Consumer | | | 26 | | | | | | | 15 | | | 41 | | | 0.02 | |
| Total | | | $ | 29,401 | | | | | | | $ | 252 | | | $ | 29,653 | | | 0.68 | % |
The following tables present the financial effect of the loan modifications presented in the preceding table during the periods indicated:
| | | | | | | | | | | | | |
| | | Year Ended December 31, 2024 |
| | | Weighted Average % of Interest Rate Reductions | | Weighted Average Years of Term Extensions |
| Commercial business: | | | | | |
| Commercial and industrial | | | 1.10 | % | | 0.85 |
| | | | | |
| | | | | |
| Total commercial business | | | 1.10 | | | 0.85 |
| | | | | |
| Real estate construction and land development: | | | | | |
| Residential | | | — | | | 0.17 |
| Commercial and multifamily | | | 1.50 | | | 1.25 |
| Total real estate construction and land development | | | 1.50 | | | 0.99 |
| Consumer | | | — | | | 1.78 |
| Total | | | 1.50 | % | | 0.93 |
| | | | | | | | | | | | | |
| | | Year Ended December 31, 2023 |
| | | Weighted Average % of Interest Rate Reductions | | Weighted Average Years of Term Extensions |
| Commercial business: | | | | | |
| Commercial and industrial | | | — | % | | 0.48 |
| Owner-occupied CRE | | | — | | | 0.75 |
| Non-owner occupied CRE | | | 3.00 | | | 1.09 |
| Total commercial business | | | 3.00 | | | 0.57 |
| | | | | |
| Real estate construction and land development: | | | | | |
| Residential | | | — | | | 0.57 |
| Commercial and multifamily | | | — | | | 0.83 |
| Total real estate construction and land development | | | — | | | 0.67 |
| Consumer | | | 1.00 | | | 2.64 |
| Total | | | 3.00 | % | | 0.61 |
There were no modified loans included in the tables above that were past due or on nonaccrual as of December 31, 2024.
There were no loans to borrowers experiencing financial difficulty that had a payment default during the year ended December 31, 2024 that were modified in the twelve months prior to that default.
At December 31, 2024, there were $4.3 million in commitments to lend additional funds to borrowers experiencing financial difficulty whose terms had been modified during the year ended December 31, 2024. At December 31, 2023, there were $6.6 million in commitments to lend additional funds to borrowers experiencing financial difficulty whose terms had been modified during the year ended December 31, 2023.
The Company closely monitors the performance of loans that are modified for borrowers experiencing financial difficulty to understand the effectiveness of its modification efforts. The Company considers a modified loan as a payment default if the borrower is 90 or more days past due. At December 31, 2024, there were no loans 90 days past due or in default that have been modified in the past 12 months.
(h) Related Party Loans
In the ordinary course of business, the Company has granted loans to certain directors, executive officers and their affiliates. The following table presents the activity in related party loans during the periods indicated:
| | | | | | | | | | | | | | | | | |
| Year Ended December 31, |
| 2024 | | 2023 | | 2022 |
| (Dollars in thousands) |
| Balance outstanding at the beginning of year | $ | 6,749 | | | $ | 6,879 | | | $ | 7,122 | |
| | | | | |
| Principal additions | — | | | 122 | | | — | |
| | | | | | | | | | | | | | | | | |
| Principal reductions | (289) | | | (252) | | | (243) | |
| Balance outstanding at the end of year | $ | 6,460 | | | $ | 6,749 | | | $ | 6,879 | |
All related party loans were performing in accordance with the underlying loan agreements as of December 31, 2024 and December 31, 2023. The Company had $143,000 and $113,000 of unfunded commitments to related parties as of December 31, 2024 and December 31, 2023.
(i) Commercial Loan Sales and Servicing
The following table presents the details of loans serviced for others at the dates indicated:
| | | | | | | | | | | |
| | December 31, 2024 | | December 31, 2023 |
| | (Dollars in thousands) |
| Loans serviced for others with participating interest, gross loan balance | $ | 5,663 | | | $ | 11,715 | |
Loans serviced for others with participating interest, participation balance owned by Company (1) | 1,110 | | | 2,466 | |
(1) Included in the balance of "Loans receivable" in the Consolidated Statements of Financial Condition.
The Company recognized $94,000, $135,000 and $217,000 of servicing income for the years ended December 31, 2024, 2023 and 2022, respectively.
(j) Accrued interest receivable on loans receivable
Accrued interest receivable on loans receivable totaled $14.5 million and $13.3 million at December 31, 2024 and December 31, 2023, respectively, and is excluded from the calculation of the ACL on loans as interest accrued, but not received, is reversed timely.
(k) Foreclosure proceedings in process
At December 31, 2024, there was one home equity loan valued at $160,000, secured by residential real estate, for which formal foreclosure proceedings were in process. At December 31, 2023, there were no loans secured by residential real estate for which formal foreclosure proceedings were in process.
(4)Allowance for Credit Losses on Loans
The following tables detail the activity in the ACL on loans by segment and class for the periods indicated:
| | | | | | | | | | | | | | | | | | | | | | | | | | | | | | | | | |
| Year Ended December 31, 2024 |
| Beginning Balance | | | | | | Charge-offs | | Recoveries | | Provision for (Reversal of) Credit Losses | | Ending Balance |
| (Dollars in thousands) |
| Commercial business: | | | | | | | | | | | | | |
| Commercial and industrial | $ | 11,128 | | | | | | | $ | (443) | | | $ | 496 | | | $ | (1,415) | | | $ | 9,766 | |
| Owner-occupied CRE | 8,999 | | | | | | | (2,510) | | | 359 | | | 5,971 | | | 12,819 | |
| Non-owner occupied CRE | 11,176 | | | | | | | — | | | — | | | 4,532 | | | 15,708 | |
| Total commercial business | 31,303 | | | | | | | (2,953) | | | 855 | | | 9,088 | | | 38,293 | |
| Residential real estate | 3,473 | | | | | | | — | | | — | | | (9) | | | 3,464 | |
| Real estate construction and land development: |
| Residential | 1,643 | | | | | | | — | | | — | | | (864) | | | 779 | |
| Commercial and multifamily | 9,233 | | | | | | | — | | | — | | | (1,356) | | | 7,877 | |
| Total real estate construction and land development | 10,876 | | | | | | | — | | | — | | | (2,220) | | | 8,656 | |
| Consumer | 2,347 | | | | | | | (538) | | | 122 | | | 124 | | | 2,055 | |
| Total | $ | 47,999 | | | | | | | $ | (3,491) | | | $ | 977 | | | $ | 6,983 | | | $ | 52,468 | |
| | | | | | | | | | | | | | | | | | | | | | | | | | | | | |
| Year Ended December 31, 2023 |
| Beginning Balance | | Charge-offs | | Recoveries | | Provision for (Reversal of) Credit Losses | | Ending Balance |
| (Dollars in thousands) |
| Commercial business: | | | | | | | | | |
| Commercial and industrial | $ | 13,962 | | | $ | (719) | | | $ | 1,372 | | | $ | (3,487) | | | $ | 11,128 | |
| Owner-occupied CRE | 7,480 | | | — | | | — | | | 1,519 | | | 8,999 | |
| Non-owner occupied CRE | 9,276 | | | — | | | — | | | 1,900 | | | 11,176 | |
| Total commercial business | 30,718 | | | (719) | | | 1,372 | | | (68) | | | 31,303 | |
| Residential real estate | 2,872 | | | — | | | — | | | 601 | | | 3,473 | |
| Real estate construction and land development: |
| Residential | 1,654 | | | — | | | — | | | (11) | | | 1,643 | |
| Commercial and multifamily | 5,409 | | | — | | | — | | | 3,824 | | | 9,233 | |
| Total real estate construction and land development | 7,063 | | | — | | | — | | | 3,813 | | | 10,876 | |
| Consumer | 2,333 | | | (586) | | | 210 | | | 390 | | | 2,347 | |
| Total | $ | 42,986 | | | $ | (1,305) | | | $ | 1,582 | | | $ | 4,736 | | | $ | 47,999 | |
| | | | | | | | | | | | | | | | | | | | | | | | | | | | | |
| Year Ended December 31, 2022 |
| Beginning Balance | | Charge-offs | | Recoveries | | (Reversal of) Provision for Credit Losses | | Ending Balance |
| (Dollars in thousands) |
| Commercial business: | | | | | | | | | |
| Commercial and industrial | $ | 17,777 | | | $ | (280) | | | $ | 929 | | | $ | (4,464) | | | $ | 13,962 | |
| Owner-occupied CRE | 6,411 | | | (36) | | | — | | | 1,105 | | | 7,480 | |
| Non-owner occupied CRE | 8,861 | | | — | | | — | | | 415 | | | 9,276 | |
| Total commercial business | 33,049 | | | (316) | | | 929 | | | (2,944) | | | 30,718 | |
| Residential real estate | 1,409 | | | (30) | | | 3 | | | 1,490 | | | 2,872 | |
| Real estate construction and land development: |
| Residential | 1,304 | | | — | | | 229 | | | 121 | | | 1,654 | |
| Commercial and multifamily | 3,972 | | | — | | | 155 | | | 1,282 | | | 5,409 | |
| Total real estate construction and land development | 5,276 | | | — | | | 384 | | | 1,403 | | | 7,063 | |
| Consumer | 2,627 | | | (547) | | | 765 | | | (512) | | | 2,333 | |
| Total | $ | 42,361 | | | $ | (893) | | | $ | 2,081 | | | $ | (563) | | | $ | 42,986 | |
The following table details the activity in the ACL on unfunded commitments during the periods indicated:
| | | | | | | | | | | | | | | | | |
| Year Ended December 31, |
| 2024 | | 2023 | | 2022 |
| (Dollars in thousands) |
| Balance, beginning of period | $ | 1,288 | | | $ | 1,744 | | | $ | 2,607 | |
| Reversal of credit losses on unfunded commitments | (701) | | | (456) | | | (863) | |
| Balance, end of period | $ | 587 | | | $ | 1,288 | | | $ | 1,744 | |
(5)Premises and Equipment
The following table presents a summary of premises and equipment at the dates indicated:
| | | | | | | | | | | |
| | December 31, 2024 | | December 31, 2023 |
| | (Dollars in thousands) |
| Land | $ | 18,721 | | | $ | 18,721 | |
| Buildings and building improvements | 64,623 | | | 63,986 | |
| Furniture, fixtures and equipment | 28,819 | | | 28,325 | |
| Total premises and equipment | 112,163 | | | 111,032 | |
| Less: Accumulated depreciation | (40,583) | | | (36,133) | |
| Premises and equipment, net | $ | 71,580 | | | $ | 74,899 | |
Total depreciation expense on premises and equipment was $6.6 million, $6.3 million and $5.4 million for the years ended December 31, 2024, 2023 and 2022, respectively.
(6)Goodwill and Other Intangible Assets
(a) Goodwill
The Company’s goodwill represents the excess of the purchase price over the fair value of net assets acquired in the following mergers: Premier Commercial Bancorp and Puget Sound Bancorp in 2018; Washington Banking Company in 2014; Valley Community Bancshares in 2013; Western Washington Bancorp in 2006; and North Pacific Bank in 1998. The Company’s goodwill is assigned to the Bank and is evaluated for impairment at the Bank level (reporting unit). There were no additions to goodwill during the years ended December 31, 2024, 2023, and 2022.
At December 31, 2024, the Company's analysis concluded the fair value of the reporting unit exceeded the carrying value so the Company's goodwill was not considered impaired. Similarly, no goodwill impairment charges were recorded for the years ended December 31, 2023 and 2022. Even though there was no goodwill impairment at December 31, 2024, changes in economic environment, operations of the reporting unit or other adverse events could result in future impairment charges which could have a material impact on the Company's operating results.
(b) Other Intangible Assets
Other intangible assets represent core deposit intangibles acquired in business combinations with estimated useful lives of ten years. There were no additions during the years ended December 31, 2024, 2023, and 2022.
The following table presents the changes in carrying value of other intangible assets at the dates indicated:
| | | | | | | | | | | | | |
| | December 31, 2024 | | December 31, 2023 | | |
| | (Dollars in thousands) |
| Gross Carrying Value | $ | 30,455 | | | 30,455 | | | |
| Accumulated amortization | (27,302) | | | (25,662) | | | |
| Net carrying value | $ | 3,153 | | | $ | 4,793 | | | |
The following table presents the estimated aggregate amortization of other intangible assets at the dates indicated:
| | | | | |
| December 31, 2024 |
| Estimated amortization expense | |
| 2025 | $ | 1,173 | |
| 2026 | 1,006 | |
| 2027 | 821 | |
| 2028 | 153 | |
| |
| |
| Total | $ | 3,153 | |
(7)Derivative Financial Instruments
The following table presents the notional amounts and estimated fair values of derivatives at the dates indicated:
| | | | | | | | | | | | | | | | | | | | | | | |
| December 31, 2024 | | December 31, 2023 |
| Notional Amounts | | Estimated Fair Value | | Notional Amounts | | Estimated Fair Value |
| (Dollars in thousands) |
| Non-hedging interest rate derivatives: | | | | | | | |
Interest rate swap asset (1) | $ | 299,236 | | | $ | 23,867 | | | $ | 291,740 | | | $ | 23,195 | |
Interest rate swap liability (1) | 299,236 | | | (23,867) | | | 291,740 | | | (23,195) | |
(1) The estimated fair value of derivatives with customers was $(22.7) million and $(22.5) million as of December 31, 2024 and December 31, 2023, respectively. The estimated fair value of derivatives with third-parties was $22.7 million and $22.5 million as of December 31, 2024 and December 31, 2023, respectively.
Generally, the gains and losses of the interest rate derivatives offset each other due to the back-to-back nature of the contracts. However, the settlement values of the Company's net derivative assets with customers had no change as of December 31, 2024 and December 31, 2023 and increased $66,000 as of December 31, 2022 due to the change in the credit valuation adjustment.
(8)Deposits
The following table summarizes the Company's deposits at the dates indicated:
| | | | | | | | | | | |
| December 31, |
| | 2024 | | 2023 |
| | Amount | | Amount |
| | (Dollars in thousands) |
| Noninterest demand deposits | $ | 1,654,955 | | | $ | 1,715,847 | |
| Interest bearing demand deposits | 1,464,129 | | | 1,608,745 | |
| Money market accounts | 1,166,901 | | | 1,094,351 | |
| Savings accounts | 421,377 | | | 487,956 | |
| Certificates of deposit | 977,251 | | | 692,973 | |
| Total deposits | $ | 5,684,613 | | | $ | 5,599,872 | |
Deposit accounts overdrawn and reclassified to loans receivable were $313,000 and $293,000 as of December 31, 2024 and 2023, respectively. Accrued interest payable on deposits was $214,000 and $250,000 as of December 31, 2024 and 2023, respectively and is included in "Accrued expenses and other liabilities" in the Consolidated Statements of Financial Condition.
Scheduled maturities of certificates of deposit for years after December 31, 2024 are as follows, in thousands:
| | | | | |
| |
| |
| 2025 | $ | 939,745 | |
| 2026 | 27,049 | |
| 2027 | 3,379 | |
| 2028 | 5,491 | |
| 2029 | 1,567 | |
| Thereafter | 20 | |
| Total | $ | 977,251 | |
Certificates of deposit issued in denominations equal to or in excess of $250,000 totaled $450.8 million and $260.9 million as of December 31, 2024 and December 31, 2023, respectively.
Deposits received from related parties as of December 31, 2024 and December 31, 2023 totaled $4.1 million and $4.2 million, respectively.
(9)Junior Subordinated Debentures
As part of the acquisition of Washington Banking Company on May 1, 2014, the Company assumed junior subordinated debentures with a total fair value of $18.1 million at the merger date. At December 31, 2024 and December 31, 2023, the balance of the junior subordinated debentures, net of unaccreted discount, was $22.1 million and $21.8 million, respectively.
Washington Banking Master Trust, a Delaware statutory business trust (the "Trust"), was a wholly-owned subsidiary of the Washington Banking Company created for the exclusive purposes of issuing and selling capital securities and utilizing sale
proceeds to acquire junior subordinated debentures issued by the Washington Banking Company. During 2007, the Trust issued $25.0 million of trust preferred securities with a 30-year maturity, callable after the fifth year. The trust preferred securities have a quarterly adjustable rate based upon the three-month SOFR plus 1.56%. On the merger date, the Company acquired the Trust, which retained the Washington Banking Master Trust name, and assumed the performance and observance of the covenants under the indenture related to the trust preferred securities.
The adjustable rate of the trust preferred securities at December 31, 2024 and December 31, 2023 was 6.18% and 7.21%, respectively.
The junior subordinated debentures are the sole assets of the Trust and payments under the junior subordinated debentures are the sole revenues of the Trust. All the common securities of the Trust are owned by the Company. The Company has fully and unconditionally guaranteed the capital securities along with all obligations of the Trust under the trust agreements. For financial reporting purposes, the Company's investment in the Master Trust is accounted for under the equity method and is included in "Prepaid expenses and other assets" in the Consolidated Statements of Financial Condition. The junior subordinated debentures issued and guaranteed by the Company and held by the Master Trust are reflected as "Junior subordinated debentures" in the Consolidated Statements of Financial Condition. As of December 31, 2024, the junior subordinated debentures qualified as additional tier 1 capital of the Company under the Federal Reserve's capital adequacy guidelines.
(10)Other Borrowings
(a) FHLB
At year end, advances from the FHLB were as follows:
| | | | | | | | | | | |
| December 31, |
| 2024 | | 2023 |
| Amount | | Amount |
| (Dollars in thousands) |
| Matures in 2025, fixed rate at rates from 4.51% to 5.16%, averaging 4.69% | $ | 348,000 | | | $ | — | |
| Matures in 2025, floating rate at 4.62% | 35,000 | | | — | |
| Total | $ | 383,000 | | | $ | — | |
The FHLB functions as a member-owned cooperative providing credit for member financial institutions. Advances are made pursuant to several different programs. Each credit program has its own interest rate and range of maturities. Each advance is payable at its maturity date, with a prepayment penalty for fixed rate advances. Limitations on the amount of advances are based on a percentage of the Bank's assets or on the FHLB’s assessment of the institution’s creditworthiness. The advances are collateralized by $1,359 million and $1,418 million of loans under a blanket lien arrangement at December 31, 2024 and December 31, 2023 At December 31, 2024, the Bank maintained a credit facility with the FHLB with available borrowing capacity of $976.3 million.
Advances from the FHLB may be collateralized by FHLB stock owned by the Bank, deposits at the FHLB, certain commercial and residential real estate loans, investment securities or other assets. In accordance with the pledge agreement, the Company must maintain unencumbered collateral in an amount equal to varying percentages ranging from 100% to 160% of outstanding advances depending on the type of collateral.
(b) FRB
The Bank maintains a credit facility with the FRB through the Discount Window with available borrowing capacity of $360.1 million as of December 31, 2024. The Bank had no FRB borrowings outstanding at December 31, 2024. The Bank had $500.0 million of FRB borrowings outstanding at December 31, 2023 through the BTFP, which is no longer available. Any advances on the credit facility would be secured by either investment securities or certain types of the Bank's loans receivable.
(c) Federal Funds Purchased
The Bank maintains advance lines with four correspondent banks to purchase federal funds totaling $145.0 million as of December 31, 2024. The lines generally mature annually or renewed annually. As of December 31, 2024 and December 31, 2023, there were no federal funds purchased.
(d) Related Party Borrowings
The Company did not have any borrowings from related parties as of December 31, 2024 or December 31, 2023.
(11)Leases
The Company's noncancelable operating lease agreements relate to certain banking offices, back-office operational facilities, office equipment and sublease agreements. The majority of the leases contain renewal options and provisions for increases in rental rates based on an agreed upon index or predetermined escalation schedule. As of December 31, 2024 and December 31, 2023, the Company’s operating lease ROU asset was $22.4 million and $23.6 million, respectively, and is included in "Prepaid
expenses and other assets" in the Consolidated Statements of Financial Condition. The related operating lease ROU liability was $24.9 million and $25.5 million, respectively and is included in "Accrued expenses and other liabilities" in the Consolidated Statements of Financial Condition. In addition, the Company has one operating sublease agreement in which the Company is the intermediate lessor. The operating sublease is for five years with rental increases on a predetermined escalation schedule with a projected future cash flow of $1.3 million. The Company does not have any leases designated as finance leases.
The table below summarizes the information about our leases during the periods or at period end presented:
| | | | | | | | | | | |
| Year Ended December 31, |
| 2024 | | 2023 |
| (Dollars in thousands) |
| Operating lease cost | $ | 5,458 | | | $ | 5,279 | |
| Short-term lease cost | 61 | | | 80 | |
| Variable lease cost | 1,255 | | | 1,243 | |
| Sublease income | (393) | | | (392) | |
| Total net lease cost during the period | $ | 6,381 | | | $ | 6,210 | |
| | | |
| Operating cash used for amounts included in the measurement of lease liabilities during the period | $ | 4,890 | | | $ | 4,982 | |
| ROU assets obtained in exchange for lease liabilities during the period | 3,504 | | | 6,880 | |
| | | |
| Weighted average remaining lease term of operating leases, in years, at period end | 5.8 | | 6.2 |
| Weighted average discount rate of operating leases, at period end | 3.24 | % | | 2.95 | % |
The following table presents the lease payment obligations as of December 31, 2024 as outlined in the Company’s lease agreements for each of the next five years and thereafter, in thousands:
| | | | | |
| |
| |
| 2025 | $ | 5,648 | |
| 2026 | 5,229 | |
| 2027 | 4,777 | |
| 2028 | 3,243 | |
| 2029 | 2,826 | |
| Thereafter | 5,855 | |
| Total lease payments | 27,578 | |
| Imputed interest | (2,658) | |
| ROU liability | $ | 24,920 | |
(12)Employee Benefit Plans
(a) Heritage Financial Corporation 401(k) Profit Sharing Plan and Trust
Eligible employees of the Company and Bank may participate in the Plan. The Company funds certain Plan costs as they are incurred. All eligible employees may participate in the Plan commencing with the first of the month following the start of employment or concurrent to their hire date if starting the first of the month. Participants may contribute a portion of their salary, which is matched by the Company at 50%, not to be greater than 3% of eligible compensation, up to Internal Revenue Service limits. All participants are 100% vested in all accounts at all times. Employer matching contributions for the years ended December 31, 2024, 2023 and 2022 were $1.8 million, $1.9 million and $1.8 million, respectively.
The Plan may make profit sharing and discretionary contributions which are completely discretionary. Participants are eligible for profit sharing contributions upon credit of 1,000 hours of service during the plan year, the attainment of 18 years of age and employment on the last day of the year. Employees are 100% vested in profit sharing contributions at all times. For the years ended December 31, 2024, 2023 and 2022, the Company made no employer profit sharing contributions.
(b) Employment Agreements and Change in Control Agreements
The Company has entered into employment agreements with certain officers that provide severance benefits following a termination of the applicable officer by the Company without “cause” or a resignation by the applicable officer for “good reason.” If such termination or resignation occurs in connection with a change in control of the Company, the employment agreements provide for an enhanced severance benefit. Additionally, the Company has entered into change in control agreements with certain officers that provide severance benefits following a termination of the applicable officer by the Company without “cause” or a resignation by the applicable for “good reason” in connection with a change in control of the Company.
(c) Deferred Compensation Plan
The Company has a Deferred Compensation Plan that provides its directors and select executive officers with the opportunity to defer current compensation. The Company records a liability within "Accrued expenses and other liabilities" in the Consolidated Statements of Financial Condition and records the expense as "Compensation and employee benefits" in the Consolidated Statements of Income. The expense incurred for the deferred compensation for the years ended December 31, 2024, 2023, and 2022 was $604,000, $409,000, and $882,000, respectively. As a result, the Company recorded a deferred compensation liability of $4.7 million and $4.5 million at December 31, 2024 and 2023, respectively.
(d) Salary Continuation Plan
In conjunction with the Company's merger with Premier Commercial Bancorp in 2018, the Company assumed an unfunded salary continuation plan for select former Premier Commercial executive officers, some of which are current Company officers. The following table presents a summary of the changes in the Salary Continuation Plan during the periods indicated:
| | | | | | | | | | | | | | | | | |
| Year Ended December 31, |
| 2024 | | 2023 | | 2022 |
| (Dollars in thousands) |
| Obligation, at the beginning of the year | $ | 2,837 | | | $ | 3,576 | | | $ | 3,835 | |
| Benefits paid | (467) | | | (881) | | | (450) | |
| Expenses incurred | 144 | | | 142 | | | 191 | |
| Obligation, at the end of the year | $ | 2,514 | | | $ | 2,837 | | | $ | 3,576 | |
(13)Stockholders’ Equity
(a) Earnings Per Common Share
The following table illustrates the calculation of weighted average shares used for earnings per common share computations for the periods indicated:
| | | | | | | | | | | | | | | | | |
| Year Ended December 31, |
| 2024 | | 2023 | | 2022 |
| (Dollars in thousands, except shares) |
| | | | | |
| | | | | |
| | | | | |
| Net income allocated to common shareholders | $ | 43,258 | | | $ | 61,755 | | | $ | 81,875 | |
| Basic: | | | | | |
| Weighted average common shares outstanding | 34,465,323 | | | 35,022,247 | | | 35,103,465 | |
| | | | | |
| | | | | |
| Diluted: | | | | | |
| Basic weighted average common shares outstanding | 34,465,323 | | | 35,022,247 | | | 35,103,465 | |
Effect of potentially dilutive common shares(1) | 433,713 | | | 235,942 | | | 360,431 | |
| Total diluted weighted average common shares outstanding | 34,899,036 | | | 35,258,189 | | | 35,463,896 | |
Potentially dilutive shares that were excluded from the computation of diluted earnings per share because to do so would be anti-dilutive(2) | 27,526 | | | 171,010 | | | 872 | |
(1) Represents the effect of the vesting of restricted stock units.
(2) Anti-dilution occurs when the unrecognized compensation cost per share of a restricted stock unit exceeds the market price of the Company’s stock.
(b) Dividends
The timing and amount of cash dividends paid on the Company's common stock depends on the Company’s earnings, capital requirements, financial condition and other relevant factors. Dividends on common stock from the Company depend substantially upon receipt of dividends from the Bank, which is the Company’s predominant source of income.
The following table summarizes the Company's dividend activity during the most recent three year period:
| | | | | | | | | | | | | | | | | | | | | | |
| Declared | | Cash Dividend per Share | | Record Date | | Paid Date | | |
| January 26, 2022 | | $0.21 | | February 9, 2022 | | February 23, 2022 | | |
| April 20, 2022 | | $0.21 | | May 4, 2022 | | May 18, 2022 | | |
| July 20, 2022 | | $0.21 | | August 3, 2022 | | August 17, 2022 | | |
| October 19, 2022 | | $0.21 | | November 2, 2022 | | November 16, 2022 | | |
| January 25, 2023 | | $0.22 | | February 8, 2023 | | February 22, 2023 | | |
| April 19, 2023 | | $0.22 | | May 4, 2023 | | May 18, 2023 | | |
| July 19, 2023 | | $0.22 | | August 2, 2023 | | August 16, 2023 | | |
| October 18, 2023 | | $0.22 | | November 1, 2023 | | November 15, 2023 | | |
| January 24, 2024 | | $0.23 | | February 8, 2024 | | February 22, 2024 | | |
| April 24, 2024 | | $0.23 | | May 8, 2024 | | May 22, 2024 | | |
| July 24, 2024 | | $0.23 | | August 7, 2024 | | August 21, 2024 | | |
| October 23, 2024 | | $0.23 | | November 6, 2024 | | November 20, 2024 | | |
The FDIC and the DFI have the authority under their supervisory powers to prohibit the payment of dividends by the Bank to the Company. Additionally, current guidance from the Federal Reserve provides, among other things, that dividends per share on the Company’s common stock generally should not exceed earnings per share, measured over the previous four fiscal quarters. Current regulations allow the Company and the Bank to pay dividends on their common stock if the Company’s or the Bank’s regulatory capital would not be reduced below the statutory capital requirements set by the Federal Reserve and the FDIC. See “Supervision And Regulation—Supervision and Regulation of the Company—Dividend Payments” and “Supervision And Regulation—Supervision and Regulation of the Bank—Dividend Payments” above, for additional detail regarding restrictions on the payment of dividends by the Company and the Bank.
(c) Stock Repurchase Program
The Company has implemented various stock repurchase programs since March 1999. On April 24, 2024, the Board authorized the repurchase of up to 5% of the Company's outstanding common shares or 1,734,492 shares in total, under a new repurchase program, with 990,522 shares remaining available for repurchase under this new repurchase program at December 31, 2024. The stock repurchase program does not obligate the Company to repurchase any shares of its common stock, and other than repurchases that have been completed to date, there is no assurance that the Company will make any further repurchases going forward. Under the stock repurchase program, the Company may repurchase shares of common stock from time to time in open market or privately negotiated transactions. The number, timing and price of shares repurchased will depend on business and market conditions, regulatory requirements, availability of funds, and other factors, including opportunities to deploy the Company's capital. The Company may, in its discretion, begin, suspend or terminate repurchases at any time prior to the Program’s expiration, without any prior notice. The new stock repurchase program superseded the Company's previous stock repurchase program authorized in March 2020 which authorized the repurchase of up to 5% of the Company's outstanding common shares, or 1,799,054 shares in total.
(14)Fair Value Measurements
Fair value is the price that would be received to sell an asset or paid to transfer a liability (exit price) in the principal or most advantageous market for the asset or liability in an orderly transaction between market participants at the measurement date. There are three levels of inputs that may be used to measure fair values:
Level 1: Valuations for assets and liabilities traded in active exchange markets, or interest in open-end mutual funds that allow the Company to sell its ownership interest back to the fund at net asset value on a daily basis. Valuations are obtained from readily available pricing sources for market transactions involving identical assets, liabilities, or funds.
Level 2: Valuations for assets and liabilities traded in less active dealer or broker markets, such as quoted prices for similar assets or liabilities, quoted prices in markets that are not active, or valuations using methodologies with observable inputs.
Level 3: Valuations for assets and liabilities that are derived from other valuation methodologies, such as option pricing models, discounted cash flow models and similar techniques using unobservable inputs, and not based on market exchange, dealer, or broker traded transactions. Level 3 valuations incorporate certain assumptions and projections in determining the fair value assigned to such assets or liabilities.
(a) Recurring and Nonrecurring Basis
The Company used the following methods and significant assumptions to measure the fair value of certain assets on a recurring and nonrecurring basis:
Investment Securities:
The fair values of all investment securities are based upon the assumptions that market participants would use in pricing the security. If available, fair values of investment securities are determined by quoted market prices (Level 1). For investment securities where quoted market prices are not available, fair values are calculated based on market prices on similar securities (Level 2). For investment securities where quoted prices or market prices of similar securities are not available, fair values are calculated by using observable and unobservable inputs such as discounted cash flows or other market indicators (Level 3). Investment security valuations are obtained from third party pricing services.
Collateral-Dependent Loans:
Collateral-dependent loans are identified for the calculation of the ACL on loans. The fair value used to measure credit loss for this type of loan is commonly based on recent real estate appraisals which are generally obtained at least every 18 months or earlier if there are changes to risk characteristics of the underlying loan. These appraisals may utilize a single valuation approach or a combination of approaches including comparable sales and the income approach. Adjustments are routinely made in the appraisal process by independent appraisers to adjust for differences between the comparable sales and income data available. The Company also incorporates an estimate of cost to sell the collateral when the sale is probable. Such adjustments may be significant and result in a Level 3 classification of the inputs for determining fair value. Non-real estate collateral may be valued using an appraisal, net book value based on the borrower’s financial statements or aging reports, adjusted or discounted based on management’s historical knowledge, changes in market conditions from the time of the valuation and management’s expertise and knowledge of the customer and customer’s business (Level 3). Individually evaluated loans are analyzed for credit loss on a quarterly basis and the ACL on loans is adjusted as required based on the results.
Appraisals on collateral-dependent loans are performed by certified general appraisers for commercial properties or certified residential appraisers for residential properties whose qualifications and licenses have been reviewed and verified by the Company. Once received, the Company's internal appraisal department reviews and approves the assumptions and approaches utilized in the appraisal as well as the resulting fair value in comparison with independent data sources such as recent market data or industry-wide statistics.
Derivative Financial Instruments:
The Company obtains broker or dealer quotes to value its interest rate derivative contracts, which use valuation models using observable market data as of the measurement date (Level 2), and incorporates credit valuation adjustments to reflect nonperformance risk in the measurement of fair value (Level 3). Although the Company has determined that the majority of the inputs used to value its interest rate swap derivatives fall within Level 2 of the fair value hierarchy, the credit valuation adjustments associated with its derivatives utilize Level 3 inputs, such as borrower risk ratings, to evaluate the likelihood of default by itself and its counterparties. As of December 31, 2024 and December 31, 2023, the Company assessed the significance of the impact of the credit valuation adjustment on the overall valuation of its interest rate swap derivatives and determined the credit valuation adjustment was not significant to the overall valuation of its interest rate swap derivatives. As a result, the Company has classified its interest rate swap derivative valuations in Level 2 of the fair value hierarchy.
Recurring Basis
The following tables summarize the balances of assets and liabilities measured at fair value on a recurring basis at the dates indicated:
| | | | | | | | | | | | | | | | | | | | | | | |
| December 31, 2024 |
| Total | | Level 1 | | Level 2 | | Level 3 |
| (Dollars in thousands) |
| Assets | | | | | | | |
| Investment securities available for sale: | | | | | | | |
| U.S. government and agency securities | $ | 12,544 | | | $ | — | | | $ | 12,544 | | | $ | — | |
| Municipal securities | 50,942 | | | — | | | 50,942 | | | — | |
Residential CMO and MBS(1) | 369,331 | | | — | | | 369,331 | | | — | |
Commercial CMO and MBS(1) | 309,741 | | | — | | | 309,741 | | | — | |
| Corporate obligations | 11,770 | | | — | | | 11,770 | | | — | |
| Other asset-backed securities | 10,066 | | | — | | | 10,066 | | | — | |
| Total investment securities available for sale | 764,394 | | | — | | | 764,394 | | | — | |
| Equity security | 297 | | | 297 | | | — | | | — | |
| Derivative assets - interest rate swaps | 23,867 | | | — | | | 23,867 | | | — | |
| | | | | | | | | | | | | | | | | | | | | | | |
| December 31, 2024 |
| Total | | Level 1 | | Level 2 | | Level 3 |
| (Dollars in thousands) |
| Liabilities | | | | | | | |
| Derivative liabilities - interest rate swaps | $ | 23,867 | | | $ | — | | | $ | 23,867 | | | $ | — | |
(1) U.S. government agency and government-sponsored enterprise CMO and MBS.
| | | | | | | | | | | | | | | | | | | | | | | |
| December 31, 2023 |
| Total | | Level 1 | | Level 2 | | Level 3 |
| (Dollars in thousands) |
| Assets | | | | | | | |
| Investment securities available for sale: | | | | | | | |
| U.S. government and agency securities | $ | 13,750 | | | $ | — | | | $ | 13,750 | | | $ | — | |
| Municipal securities | 79,525 | | | — | | | 79,525 | | | — | |
Residential CMO and MBS(1) | 512,049 | | | — | | | 512,049 | | | — | |
Commercial CMO and MBS(1) | 504,258 | | | — | | | 504,258 | | | — | |
| Corporate obligations | 7,613 | | | — | | | 7,613 | | | — | |
| Other asset-backed securities | 17,158 | | | — | | | 17,158 | | | — | |
| Total investment securities available for sale | 1,134,353 | | | — | | | 1,134,353 | | | — | |
| Equity security | 314 | | | 314 | | | — | | | — | |
| Derivative assets - interest rate swaps | 23,195 | | | — | | | 23,195 | | | — | |
| Liabilities | | | | | | | |
| Derivative liabilities - interest rate swaps | $ | 23,195 | | | $ | — | | | $ | 23,195 | | | $ | — | |
(1) U.S. government agency and government-sponsored enterprise CMO and MBS.
Nonrecurring Basis
The Company may be required to measure certain financial assets and liabilities at fair value on a nonrecurring basis. These adjustments to fair value usually result from application of lower-of-cost-or-market accounting or write-downs of individual assets. The following tables presents assets measured at fair value on a nonrecurring basis at the dates indicated:
| | | | | | | | | | | | | | | | | | | | | | | |
| Fair Value at December 31, 2024 |
| Total | | Level 1 | | Level 2 | | Level 3 |
| |
| Collateral-dependent loans: | | | | | | | |
| Commercial business: | | | | | | | |
| | | | | | | |
| Owner-occupied CRE | $ | 2,250 | | | $ | — | | | $ | — | | | $ | 2,250 | |
| | | | | | | |
| Total commercial business | 2,250 | | | — | | | — | | | 2,250 | |
| | | | | | | |
|
| | | | | | | |
| | | | | | | |
| | | | | | | |
| Consumer | 160 | | | — | | | — | | | 160 | |
| | | | | | | |
| | | | | | | |
| | | | | | | |
| Total assets measured at fair value on a nonrecurring basis | $ | 2,410 | | | $ | — | | | $ | — | | | $ | 2,410 | |
| | | | | | | | | | | | | | | | | | | | | | | |
| Fair Value at December 31, 2023 |
| Total | | Level 1 | | Level 2 | | Level 3 |
| |
| Collateral-dependent loans: | | | | | | | |
| Commercial business: | | | | | | | |
| | | | | | | |
| Owner-occupied CRE | $ | 173 | | | $ | — | | | $ | — | | | $ | 173 | |
| | | | | | | |
| | | | | | | |
| | | | | | | |
| | | | | | | |
| | | | | | | |
| | | | | | | |
| | | | | | | |
| | | | | | | |
| | | | | | | |
| | | | | | | |
| | | | | | | |
| Total assets measured at fair value on a nonrecurring basis | $ | 173 | | | $ | — | | | $ | — | | | $ | 173 | |
The following tables present quantitative information about Level 3 fair value measurements for financial instruments measured at fair value on a non-recurring basis at the dates indicated:
| | | | | | | | | | | | | | | | | | | | | | | | | | | | | |
| December 31, 2024 |
| Fair
Value | | Valuation
Technique(s) | | Unobservable Input(s) | | Range of Inputs | | Weighted Average(1) |
| (Dollars in thousands) |
| Collateral-dependent loans | $ | 2,410 | | | Market approach | | Adjustments to reflect current conditions and selling costs | | 10.0% - 10.0% | | 10.0% |
| | | | | | | | | |
(1) Weighted by net discount to net appraisal fair value
| | | | | | | | | | | | | | | | | | | | | | | | | | | | | |
| December 31, 2023 |
| Fair
Value | | Valuation
Technique(s) | | Unobservable Input(s) | | Range of Inputs | | Weighted Average(1) |
| (Dollars in thousands) |
| Collateral-dependent loans | $ | 173 | | | Market approach | | Adjustments to reflect current conditions and selling costs | | 16.5% - 16.5% | | 16.5% |
| | | | | | | | | |
(1) Weighted by net discount to net appraisal fair value
(b) Fair Value of Financial Instruments
Broadly traded markets do not exist for most of the Company’s financial instruments; therefore, the fair value calculations attempt to incorporate the effect of current market conditions at a specific time. These determinations are subjective in nature, involve uncertainties and matters of significant judgment and do not include tax ramifications; therefore, the results cannot be determined with precision, substantiated by comparison to independent markets and may not be realized in an actual sale or immediate settlement of the instruments. There may be inherent weaknesses in any calculation technique and changes in the underlying assumptions used, including discount rates and estimates of future cash flows, could significantly affect the results. For all these reasons, the aggregation of the fair value calculations presented herein do not represent, and should not be construed to represent, the underlying value of the Company.
The following tables present the carrying value amount of the Company’s financial instruments and their corresponding estimated fair values at the dates indicated:
| | | | | | | | | | | | | | | | | | | | | | | | | | | | | |
| December 31, 2024 |
| Carrying
Value | | Fair Value | | Fair Value Measurements Using: |
| Level 1 | | Level 2 | | Level 3 |
| (Dollars in thousands) |
| Financial Assets: | | | | | | | | | |
| Cash and cash equivalents | $ | 117,100 | | | $ | 117,100 | | | $ | 117,100 | | | $ | — | | | $ | — | |
| Investment securities available for sale | 764,394 | | | 764,394 | | | — | | | 764,394 | | | — | |
| Investment securities held to maturity | 703,285 | | | 623,452 | | | — | | | 623,452 | | | — | |
| | | | | | | | | |
| Loans receivable, net | 4,749,655 | | | 4,694,516 | | | — | | | — | | | 4,694,516 | |
| Accrued interest receivable | 19,483 | | | 19,483 | | | 63 | | | 4,877 | | | 14,543 | |
| Derivative assets - interest rate swaps | 23,867 | | | 23,867 | | | — | | | 23,867 | | | — | |
| Equity security | 297 | | | 297 | | | 297 | | | — | | | — | |
| Financial Liabilities: | | | | | | | | | |
| Non-maturity deposits | $ | 4,707,362 | | | $ | 4,707,362 | | | $ | 4,707,362 | | | $ | — | | | $ | — | |
| Certificates of deposit | 977,251 | | | 985,602 | | | — | | | 985,602 | | | — | |
| Borrowings | 383,000 | | | 383,222 | | | — | | | 383,222 | | | — | |
| | | | | | | | | |
| Junior subordinated debentures | 22,058 | | | 20,357 | | | — | | | — | | | 20,357 | |
| Accrued interest payable | 859 | | | 859 | | | 66 | | | 722 | | | 71 | |
| Derivative liabilities - interest rate swaps | 23,867 | | | 23,867 | | | — | | | 23,867 | | | — | |
| | | | | | | | | | | | | | | | | | | | | | | | | | | | | |
| December 31, 2023 |
| Carrying
Value | | Fair Value | | Fair Value Measurements Using: |
| | Level 1 | | Level 2 | | Level 3 |
| (Dollars in thousands) |
| Financial Assets: | | | | | | | | | |
| Cash and cash equivalents | $ | 224,973 | | | $ | 224,973 | | | $ | 224,973 | | | $ | — | | | $ | — | |
| Investment securities available for sale | 1,134,353 | | | 1,134,353 | | | — | | | 1,134,353 | | | — | |
| Investment securities held to maturity | 739,442 | | | 662,450 | | | — | | | 662,450 | | | — | |
| | | | | | | | | |
| Loans receivable, net | 4,287,628 | | | 4,159,513 | | | — | | | — | | | 4,159,513 | |
| Accrued interest receivable | 19,518 | | | 19,518 | | | 96 | | | 6,127 | | | 13,295 | |
| Derivative assets - interest rate swaps | 23,195 | | | 23,195 | | | — | | | 23,195 | | | — | |
| Equity security | 314 | | | 314 | | | 314 | | | — | | | — | |
| Financial Liabilities: | | | | | | | | | |
| Non-maturity deposits | $ | 4,906,899 | | | $ | 4,906,899 | | | $ | 4,906,899 | | | $ | — | | | $ | — | |
| Certificates of deposit | 692,973 | | | 701,029 | | | — | | | 701,029 | | | — | |
| Borrowings | 500,000 | | | 499,861 | | | — | | | 499,861 | | | — | |
| | | | | | | | | |
| Junior subordinated debentures | 21,765 | | | 19,750 | | | — | | | — | | | 19,750 | |
| Accrued interest payable | 13,026 | | | 13,026 | | | 63 | | | 12,880 | | | 83 | |
| Derivative liabilities - interest rate swaps | 23,195 | | | 23,195 | | | — | | | 23,195 | | | — | |
(15)Stock-Based Compensation
On May 3, 2023, based upon the recommendation of the Compensation Committee of the Board, the Company's shareholders approved the Heritage Financial Corporation 2023 Omnibus Equity Plan (the "Equity Plan"), which provides for the issuance of up to 1,250,000 shares of the Company's common stock in the form of various types of stock-based awards. As of December 31, 2024, there were 938,362 shares available for future issuance under the Equity Plan. The Equity Plan replaced the Heritage Financial Corporation 2014 Omnibus Equity Plan (the "2014 Plan"). Upon shareholder approval of the Equity Plan by the Company’s shareholders, the 2014 Plan was frozen so that no future awards could be made thereunder. All outstanding awards under the 2014 Plan remain in full force and effect, and are governed by the terms of the 2014 Plan and the related award agreements.
(a) Restricted Stock Units
Time-based restricted stock unit awards generally vest ratably over three years, participate in dividend equivalents and are subject to service conditions in accordance with each award agreement.
Performance-based restricted stock unit awards have a three-year cliff vesting schedule, participate in dividend equivalents and are additionally subject to performance-based vesting. The conditions of the grants allow for an actual payout ranging between no payout and 150% of target. The payout level is calculated based on the Company's return on tangible common equity and three-year total shareholder return relative to a defined peer group of banks. The fair value of each performance-based restricted stock unit award, inclusive of the performance metrics, was determined using a Monte Carlo simulation and will be recognized over the vesting period. The Monte Carlo simulation model uses the same input assumptions as the Black-Scholes model; however, it also further incorporates into the fair value determination the possibility that the performance metrics may not be satisfied. Compensation costs related to these awards are recognized regardless of whether the performance metrics are satisfied, provided that the requisite service has been provided.
The Company used the following assumptions to estimate the fair value of performance-based restricted stock unit awards granted for the periods indicated:
| | | | | | | | | | | | | | | | | |
| Year Ended December 31, |
| 2024 | | 2023 | | 2022 |
| Shares issued | 25,394 | | | 15,112 | | | 15,464 | |
| Expected Term in Years | 2.8 | | 2.9 | | 2.9 |
| Weighted-Average Risk Free Interest Rate | 4.5 | % | | 4.4 | % | | 1.7 | % |
| Weighted Average Fair Value | 17.76 | | | 23.85 | | | 25.87 | |
| | | | | |
| Range of peer company volatilities | 22.9%-71.3% | | 25.8%-107.5% | | 31.6%-77.82% |
| | | | | |
| Company volatility | 31.2 | % | | 35.8 | % | | 41.3 | % |
| | | | | |
Expected volatilities in the model were estimated using a historical period consistent with the performance period of approximately three years. The risk-free interest rate was based on Treasury rates for a term commensurate with the expected life of the grant.
For the years ended December 31, 2024, 2023 and 2022, the Company recognized compensation expense related to restricted stock unit awards of $4.3 million, $4.3 million, and $3.8 million respectively, and a related tax benefit of $961,000, $949,000, and $833,000, respectively. As of December 31, 2024, the total unrecognized compensation expense related to non-vested restricted stock unit awards was $6.6 million and the related weighted-average period over which the compensation expense is expected to be recognized was approximately 2.0 years. The vesting date fair value of the restricted stock unit awards that vested during the years ended December 31, 2024, 2023 and 2022 was $3.1 million, $3.5 million and $3.3 million, respectively.
The following table summarizes the unit activity for the periods indicated:
| | | | | | | | | | | |
| Units | | Weighted-Average Grant Date Fair Value |
| Nonvested at December 31, 2021 | 315,014 | | | $ | 26.01 | |
| Granted | 230,402 | | | 25.72 | |
| Vested | (127,952) | | | 26.99 | |
| Forfeited | (38,572) | | | 26.73 | |
| Nonvested at December 31, 2022 | 378,892 | | | 25.42 | |
| Granted | 225,107 | | | 25.53 | |
| Vested | (162,752) | | | 25.05 | |
| Forfeited | (33,359) | | | 26.08 | |
| Nonvested at December 31, 2023 | 407,888 | | | 25.59 | |
| Granted | 272,201 | | | 18.41 | |
| Vested | (168,204) | | | 24.52 | |
| Forfeited | (31,500) | | | 23.64 | |
| Nonvested at December 31, 2024 | 480,385 | | | $ | 22.02 | |
(16)Investments in Tax Credits Structures
The Company's tax credit investments include LIHTC investments and a Solar Tax Credit investment. LIHTC investments promote qualified affordable housing projects, some of which also support the Company’s regulatory compliance with the Community Reinvestment Act. The Company’s investments in these entities generate a return primarily through the realization of federal income tax credits and other tax benefits, such as tax deductions from operating losses of the investments, over specified time periods. These tax credits and deductions are recognized as a reduction to income tax expense.
LIHTC Investments
The carrying values of investments in unconsolidated LIHTCs were $187.2 million and $207.3 million as of December 31, 2024 and 2023, respectively, as a component of prepaid expense and other assets in the Consolidated Statements of Financial Condition. LIHTCs are accounted for using the proportional amortization method. During the years ended December 31, 2024, 2023 and 2022 the Company recognized proportional amortization of $20.0 million, $16.5 million and $10.9 million, respectively as a component of income tax in the Consolidated Statements of Income.
Total unfunded contingent commitments related to the Company’s LIHTC investments totaled $81.2 million and $107.9 million at December 31, 2024 and 2023, respectively, as a component of accrued expenses and other liabilities in the Consolidated Statements of Financial Condition. The Company expects to fund LIHTC commitments totaling $65.3 million during the year ending December 31, 2025 and $5.5 million during the year ending December 31, 2026, with the remaining commitments of $10.4 million to be funded by December 31, 2041.
There were no impairment losses on the Company’s LIHTC investments during the years ended December 31, 2024, 2023 and 2022.
Solar Tax Credit Investment
The Solar Tax Credit investment is accounted for using the equity method. During the years ended December 31, 2024 and 2023, respectively, the Company recognized amortization expense of $101 and $21, respectively, which was included within other expense in the Consolidated Statements of Income.
(17)Income Taxes
Income tax expense is substantially due to federal income taxes as the provision for the states of Oregon and Idaho income taxes are insignificant and the state of Washington does not charge an income tax in lieu of a business and occupation tax. Income tax expense consisted of the following for the periods indicated:
| | | | | | | | | | | | | | | | | |
| | Year Ended December 31, |
| | 2024 | | 2023 | | 2022 |
| | (Dollars in thousands) |
| | | | | |
| | | | | |
| | | | | |
| Current tax expense | $ | 24,292 | | | $ | 24,364 | | | $ | 16,690 | |
| | | | | |
| | | | | |
| | | | | |
| Deferred tax expense (benefit) | (15,291) | | | (13,204) | | | 871 | |
| Income tax expense | $ | 9,001 | | | $ | 11,160 | | | $ | 17,561 | |
The effective tax rate was 17.2% for the December 31, 2024 compared to an effective tax rate of 15.3% and 17.7% for the years ended December 31, 2023 and 2022, respectively. The increase in the effective tax rate during the year ended December 31, 2024 was due primarily to tax expense related to the surrender of BOLI of $2.4 million.
The following table presents the reconciliation of income taxes computed at the Federal statutory income tax rate of 21% to the actual effective rate for the periods indicated:
| | | | | | | | | | | | | | | | | |
| | Year Ended December 31, |
| | 2024 | | 2023 | | 2022 |
| | (Dollars in thousands) |
| Income tax expense at Federal statutory rate | $ | 10,975 | | | $ | 15,312 | | | $ | 20,882 | |
| State tax, net of Federal tax benefit | 526 | | | 827 | | | 936 | |
| Tax-exempt instruments | (850) | | | (1,311) | | | (1,733) | |
| BOLI surrender | $ | 2,371 | | | — | | | — | |
Federal tax credits and other benefits (1) | (4,014) | | | (3,205) | | | (1,979) | |
| Effects of BOLI | (571) | | | (564) | | | (735) | |
| | | | | |
| | | | | |
| | | | | |
| | | | | |
| Other, net | 564 | | | 101 | | | 190 | |
| Income tax expense | $ | 9,001 | | | $ | 11,160 | | | $ | 17,561 | |
(1) Federal tax credits are provided for under the Solar Tax Credits and LIHTC programs as described in Note (1) Description of Business, Basis of Presentation, Significant Accounting Policies and Recently Issued Accounting Pronouncements.
The following table presents major components of the deferred income tax asset (liability) resulting from differences between financial reporting and tax basis at the dates indicated:
| | | | | | | | | | | |
| | December 31, 2024 | | December 31, 2023 |
| | (Dollars in thousands) |
| Deferred tax assets: | | | |
| Allowance for credit losses | $ | 11,684 | | | $ | 10,798 | |
| Accrued compensation | 3,112 | | | 2,918 | |
| Stock compensation | 807 | | | 793 | |
| | | |
| | | |
| | | |
| | | |
| Market discount on acquired loans | 511 | | | 654 | |
| Foregone interest on nonaccrual loans | 275 | | | 425 | |
| Net operating loss carryforward acquired | 124 | | | 145 | |
| | | |
| | | |
| ROU lease liability | 5,488 | | | 5,596 | |
| Net unrealized losses on investment securities | 15,568 | | | 20,395 | |
| Tax credit carryforward | 24,561 | | | 11,085 | |
| Other deferred tax assets | 328 | | | 503 | |
| Total deferred tax assets | 62,458 | | | 53,312 | |
| Deferred tax liabilities: | | | |
| Deferred loan fees, net | (1,314) | | | (1,263) | |
| Premises and equipment | (1,296) | | | (2,268) | |
| FHLB stock | (217) | | | (216) | |
| | | |
| | | |
| Goodwill and other intangible assets | (599) | | | (816) | |
| | | |
| Junior subordinated debentures | (813) | | | (873) | |
| | | | | | | | | | | |
| | December 31, 2024 | | December 31, 2023 |
| | (Dollars in thousands) |
| ROU lease asset | (4,938) | | | (5,170) | |
| | | |
| Other deferred tax liabilities | (122) | | | (167) | |
| Total deferred tax liabilities | (9,299) | | | (10,773) | |
| Deferred tax asset, net | $ | 53,159 | | | $ | 42,539 | |
In assessing the realizability of deferred tax assets, management considers whether it is more likely than not that some portion or all of the deferred tax assets will not be realized. A valuation allowance is required to be recognized for the portion of the deferred tax asset that will not be realized. The ultimate realization of deferred tax assets is dependent upon the generation of future taxable income during the periods in which those temporary differences become deductible. As of December 31, 2024, based upon the level of historical taxable income and projections for future taxable income over the periods in which the deferred tax assets are deductible, management expects to realize the benefits of these deductible differences.
At December 31, 2024 and December 31, 2023, the Company had a net operating loss carryforward of $593,000 and $691,000, respectively, that does not expire. The Company is limited to the amount of the net operating loss carryforward that it can deduct each year under Section 382 of the Internal Revenue Code. Due to sufficient earnings history and other positive evidence, management has not recorded a valuation allowance on the net operating loss carryforward as of December 31, 2024 and December 31, 2023. At December 31, 2024, the Company had a tax credit carryforward of $24.6 million that expires in 2044. Due to sufficient earnings history and other positive evidence, management has not recorded a valuation allowance on the tax credit carryforward as of December 31, 2024.
As of December 31, 2024 and December 31, 2023, the Company had an insignificant amount of unrecognized tax benefits, none of which would materially affect its effective tax rate if recognized. The Company does not anticipate that the amount of unrecognized tax benefits will significantly increase or decrease in the 12 months following December 31, 2024. The amount of interest and penalties accrued as of December 31, 2024 and December 31, 2023 were immaterial.
The Company has qualified under provisions of the Internal Revenue Code to compute income taxes after deductions of additions to the bad debt reserves when it was registered as a Savings Bank. At December 31, 2024, the Company had a taxable temporary difference of approximately $2.8 million that arose before 1988 (base-year amount). In accordance with FASB ASC 740, an estimated deferred tax liability of $588,000 has not been recognized for the temporary difference. Management does not expect this temporary difference to reverse in the foreseeable future.
The Company and its Bank subsidiary file a United States consolidated federal income tax return, Oregon State and local income tax returns, and Idaho State tax return. The tax years subject to examination by the Internal Revenue Service are the years ended December 31, 2024, 2023, 2022 and 2021.
(18) Commitments and Contingencies
(a) Commitments to Extend Credit
In the ordinary course of business, the Company may enter into various types of transactions that include commitments to extend credit that are not included in its Consolidated Financial Statements. The Company applies the same credit standards to these commitments as it uses in all its lending activities and has included these commitments in its lending risk evaluations. The majority of the commitments presented below are variable rate. Loan commitments can be either revolving or non-revolving. The Company’s exposure to credit and market risk under commitments to extend credit is represented by the amount of these commitments.
The following table presents outstanding commitments to extend credit, including letters of credit, at the dates indicated:
| | | | | | | | | | | |
| | December 31, 2024 | | December 31, 2023 |
| | (Dollars in thousands) |
| Commercial business: | | | |
| Commercial and industrial | $ | 591,863 | | | $ | 542,975 | |
| Owner-occupied CRE | 14,778 | | | 8,731 | |
| Non-owner occupied CRE | 23,100 | | | 26,534 | |
| Total commercial business | 629,741 | | | 578,240 | |
| | | |
| | | | | | | | | | | |
| | December 31, 2024 | | December 31, 2023 |
| | (Dollars in thousands) |
| Real estate construction and land development: | | | |
| Residential | 28,353 | | | 46,924 | |
| Commercial and multifamily | 174,606 | | | 308,206 | |
| Total real estate construction and land development | 202,959 | | | 355,130 | |
| Consumer | 348,373 | | | 335,729 | |
| Total outstanding commitments | $ | 1,181,073 | | | $ | 1,269,099 | |
(19)Regulatory Capital Requirements
The Company is a bank holding company under the supervision of the Federal Reserve. Bank holding companies are subject to capital adequacy requirements of the Federal Reserve under the Bank Holding Company Act of 1956, as amended, and the regulations of the Federal Reserve. The Bank is a federally insured institution and thereby is subject to the capital requirements established by the FDIC. The Federal Reserve capital requirements generally parallel the FDIC requirements. Failure to meet minimum capital requirements can initiate certain mandatory, and possibly additional discretionary, actions by regulators that, if undertaken, could have a direct material effect in the Consolidated Financial Statements and operations. Additionally, the Company and the Bank are required to maintain a capital conservation buffer of common equity Tier 1 capital above 2.5% to avoid restrictions on certain activities including payment of dividends, stock repurchases and discretionary bonuses to executive officers. Management believes that as of December 31, 2024, the Company and the Bank met all capital adequacy requirements to which they were subject.
As of December 31, 2024 and December 31, 2023, the most recent regulatory notifications categorized the Bank as well-capitalized under the regulatory framework for prompt corrective action. There have been no conditions or events since that notification that management believes have changed the Bank's categories.
The following table summarizes the Company's consolidated and the Bank's capital ratios compared to the regulatory "adequately capitalized" capital ratios and the regulatory minimum capital ratios needed to qualify as a "well capitalized" institution, as calculated under regulatory guideline at the dates presented:
| | | | | | | | | | | | | | | | | | | | | | | | | | | | | | | | | | | |
| | Actual | | Adequately Capitalized | | Well-Capitalized (1) |
| | (Dollars in thousands) |
| December 31, 2024 | |
| Total capital ratio | | | | | | | | | | | |
| Company | $ | 749,854 | | | 13.3 | % | | $ | 450,307 | | | 8.0 | % | | $ | 562,884 | | | 10.0 | % |
| Bank | 742,222 | | | 13.2 | | | 450,002 | | | 8.0 | | | 562,503 | | | 10.0 | |
| Tier 1 capital ratio | | | | | | | | | | | |
| Company | 698,412 | | | 12.4 | | | 337,730 | | | 6.0 | | | 450,307 | | | 8.0 | |
| Bank | 690,780 | | | 12.3 | | | 337,502 | | | 6.0 | | | 450,002 | | | 8.0 | |
| Common equity Tier 1 capital ratio | | | | | | | | | | | |
| Company | 676,354 | | | 12.0 | | | 253,298 | | | 4.5 | | | 365,874 | | | 6.5 | |
| Bank | 690,780 | | | 12.3 | | | 253,126 | | | 4.5 | | | 365,627 | | | 6.5 | |
| Leverage ratio | | | | | | | | | | | |
| Company | 698,412 | | | 10.0 | | | 278,910 | | | 4.0 | | | 348,637 | | | 5.0 | |
| Bank | 690,780 | | | 9.9 | | | 278,749 | | | 4.0 | | | 348,436 | | | 5.0 | |
| December 31, 2023 | |
| Total capital ratio | | | | | | | | | | | |
| Company | $ | 750,945 | | | 14.1 | % | | $ | 425,084 | | | 8.0 | % | | $ | 531,355 | | | 10.0 | % |
| Bank | 732,379 | | | 13.8 | | | 424,808 | | | 8.0 | | | 531,009 | | | 10.0 | |
| Tier 1 capital ratio | | | | | | | | | | | |
| Company | 704,839 | | | 13.3 | | | 318,813 | | | 6.0 | | | 425,084 | | | 8.0 | |
| Bank | 686,273 | | | 12.9 | | | 318,606 | | | 6.0 | | | 424,808 | | | 8.0 | |
| Common equity Tier 1 capital ratio | | | | | | | | | | | |
| Company | 683,074 | | | 12.9 | | | 239,110 | | | 4.5 | | | 345,381 | | | 6.5 | |
| Bank | 686,273 | | | 12.9 | | | 238,954 | | | 4.5 | | | 345,156 | | | 6.5 | |
| | | | | | | | | | | | | | | | | | | | | | | | | | | | | | | | | | | |
| Leverage ratio | | | | | | | | | | | |
| Company | 704,839 | | | 10.0 | | | 281,673 | | | 4.0 | | | 352,092 | | | 5.0 | |
| Bank | 686,273 | | | 9.8 | | | 281,539 | | | 4.0 | | | 351,923 | | | 5.0 | |
(1) The ratios to meet the requirements to be deemed “well-capitalized” under prompt corrective action regulations are only applicable to the Bank. However, the Company manages its capital position as if the requirements apply to the consolidated Company and has presented the ratios as if they also applied on a consolidated basis.
As of December 31, 2024 and 2023, the capital measures reflected the revised CECL capital transition provisions adopted by the Federal Reserve and the FDIC that provided banking organizations that implemented CECL before the end of 2020 the option to delay for two years the estimated impact of CECL on regulatory capital relative to regulatory capital determined under the prior incurred loss methodology, followed by a three-year transition period to phase out the aggregate amount of capital benefit provided during the initial two-year delay.
(20)Heritage Financial Corporation (Parent Company Only)
Following are the condensed financial statements of the Parent Company, excluding the Bank.
HERITAGE FINANCIAL CORPORATION
(PARENT COMPANY ONLY)
Condensed Statements of Financial Condition
| | | | | | | | | | | |
| | December 31, 2024 | | December 31, 2023 |
| | (Dollars in thousands) |
| ASSETS | | | |
| Cash and cash equivalents | $ | 4,732 | | | $ | 15,752 | |
| Investment in subsidiary bank | 877,952 | | | 856,460 | |
| Other assets | 3,812 | | | 3,455 | |
| Total assets | $ | 886,496 | | | $ | 875,667 | |
| | | |
| LIABILITIES AND STOCKHOLDERS’ EQUITY | | | |
| Junior subordinated debentures | $ | 22,058 | | | $ | 21,765 | |
| Other liabilities | 911 | | | 641 | |
| Total stockholders’ equity | 863,527 | | | 853,261 | |
| Total liabilities and stockholders’ equity | $ | 886,496 | | | $ | 875,667 | |
HERITAGE FINANCIAL CORPORATION
(PARENT COMPANY ONLY)
Condensed Statements of Income
| | | | | | | | | | | | | | | | | |
| | Year Ended December 31, |
| | 2024 | | 2023 | | 2022 |
| | (Dollars in thousands) |
| INTEREST INCOME: | | | | | |
| Interest on interest earning deposits | $ | 13 | | | $ | 26 | | | $ | 15 | |
| | | | | |
| INTEREST EXPENSE: | | | | | |
| Junior subordinated debentures | 2,139 | | | 2,074 | | | 1,156 | |
| | | | | |
| Net interest expense | (2,126) | | | (2,048) | | | (1,141) | |
| NONINTEREST INCOME: | | | | | |
| Dividends from subsidiary bank | 46,000 | | | 43,500 | | | 44,000 | |
| Equity in undistributed income of subsidiary bank | 4,260 | | | 24,963 | | | 43,507 | |
| Other income | 51 | | | 192 | | | 33 | |
| Total noninterest income | 50,311 | | | 68,655 | | | 87,540 | |
| NONINTEREST EXPENSE: | | | | | |
| Professional services | 524 | | | 455 | | | 476 | |
| Other expense | 6,393 | | | 6,282 | | | 5,631 | |
| Total noninterest expense | 6,917 | | | 6,737 | | | 6,107 | |
| Income before income taxes | 41,268 | | | 59,870 | | | 80,292 | |
| Income tax benefit | (1,990) | | | (1,885) | | | (1,583) | |
| Net income | $ | 43,258 | | | $ | 61,755 | | | $ | 81,875 | |
HERITAGE FINANCIAL CORPORATION
(PARENT COMPANY ONLY)
Condensed Statements of Cash Flows
| | | | | | | | | | | | | | | | | |
| | Year Ended December 31, |
| | 2024 | | 2023 | | 2022 |
| | (Dollars in thousands) |
| Cash flows from operating activities: | | | | | |
| Net income | $ | 43,258 | | | $ | 61,755 | | | $ | 81,875 | |
| Adjustments to reconcile net income to net cash provided by operating activities: | | | | | |
| Equity in undistributed income of subsidiary bank | (4,260) | | | (24,963) | | | (43,507) | |
| | | | | |
| Stock-based compensation expense | 4,344 | | | 4,325 | | | 3,795 | |
| Net change in other assets and other liabilities | (168) | | | (497) | | | (63) | |
| Net cash provided by operating activities | 43,174 | | | 40,620 | | | 42,100 | |
| | | | | |
| | | | | |
| | | | | |
| | | | | |
| Cash flows from financing activities: | | | | | |
| Common stock cash dividends paid | (31,776) | | | (30,820) | | | (29,491) | |
| | | | | |
| | | | | |
| Repurchase of common stock | (22,418) | | | (6,974) | | | (3,196) | |
| Net cash used in financing activities | (54,194) | | | (37,794) | | | (32,687) | |
| Net (decrease) increase in cash and cash equivalents | (11,020) | | | 2,826 | | | 9,413 | |
| Cash and cash equivalents at the beginning of year | 15,752 | | | 12,926 | | | 3,513 | |
| Cash and cash equivalents at the end of year | $ | 4,732 | | | $ | 15,752 | | | $ | 12,926 | |
| | | | | |
| | | | | |
| | | | | |
| | | | | |
(21) Segment Information
The Company's reportable segments are determined by the Chief Executive Officer, who is the designated chief operating decision maker ("CODM"), based upon information provided about the Company's products and services offered, primarily
banking operations. The segment is also distinguished by the level of information provided to the CODM, who uses such information to review performance of various components of the business, such as branches, which are then aggregated if operating performance, products/services, and customers are similar. The CODM will evaluate the financial performance of the Company's business components by evaluating revenue streams, significant expenses, and budget to actual results in assessing the Company's segment and in the determination of allocating resources. The CODM uses revenue streams to evaluate product pricing and significant expenses to assess performance and evaluate return on assets. The CODM uses consolidated net income to benchmark the Company against its competitors. The benchmarking analysis coupled with monitoring of budget to actual results are used in assessment performance and in establishing compensation. Loans, investments, and deposits provide the revenues of the banking operation. Interest expense, provisions for credit losses, and payroll provide the significant expenses in the banking operation. All operations are domestic.
Accounting policies for segments are the same as those described in Note 1. Segment performance is evaluated using consolidated net income. Information reported internally for performance assessment by the CODM follows, inclusive of reconciliations of significant segment totals to the financial statements:
| | | | | | | | | | | | | | | | | |
| | Year Ended December 31, |
| | 2024 | | 2023 | | 2022 |
| | (Dollars in thousands) |
| Total interest income | $ | 309,712 | | | $ | 284,465 | | | $ | 227,457 | |
| | | | | |
| Reconciliation of revenue | | | | | |
| Other revenues | 7,473 | | | 18,663 | | | 29,591 | |
| Total consolidated revenues | 317,185 | | | 303,128 | | | 257,048 | |
| | | | | |
| Less: | | | | | |
| Total interest expense | 100,348 | | | 59,310 | | | 8,072 | |
| Less: | | | | | |
| Provision for (reversal of) credit losses | 6,282 | | | 4,280 | | | (1,426) | |
| Compensation and employee benefits | 98,527 | | | 100,083 | | | 92,092 | |
Other segment expenses (1) | 59,769 | | | 66,540 | | | 58,874 | |
| Income tax expense | 9,001 | | | 11,160 | | | 17,561 | |
| Segment net income/consolidated net income | $ | 43,258 | | | $ | 61,755 | | | $ | 81,875 | |
| | | | | |
| Other segment disclosures | | | | | |
| Total interest income | 309,712 | | | 284,465 | | | 227,457 | |
| Total interest expense | 100,348 | | | 59,310 | | | 8,072 | |
| Depreciation | 6,567 | | | 6,255 | | | 5,421 | |
| Amortization of intangible assets | 1,640 | | | 2,434 | | | 2,750 | |
| Other significant noncash items: | | | | | |
| Provision for (reversal of) credit losses | 6,282 | | | 4,280 | | | (1,426) | |
| Segment assets | $ | 7,106,278 | | | $ | 7,174,957 | | | $ | 6,980,100 | |
| Expenses for segment assets | 273,927 | | | 241,373 | | | 175,173 | |
| | | | | |
| Reconciliation of assets: | | | | | |
| Total assets for reportable segments | 7,106,278 | | | 7,174,957 | | | 6,980,100 | |
| Other assets | — | | | — | | | — | |
| Total consolidated assets | $ | 7,106,278 | | | $ | 7,174,957 | | | $ | 6,980,100 | |
(1) Other segment expenses include expenses for occupancy and equipment, data processing, marketing, professional services and other overhead costs.
ITEM 9. CHANGES IN AND DISAGREEMENTS WITH ACCOUNTANTS ON ACCOUNTING AND FINANCIAL DISCLOSURE
None.
ITEM 9A. CONTROLS AND PROCEDURES
Disclosure Controls and Procedures
Our disclosure controls and procedures are designed to ensure that information the Company must disclose in its reports filed or submitted under the Exchange Act, is recorded, processed, summarized, and reported on a timely basis. Our management has evaluated, with the participation and under the supervision of our Chief Executive Officer and Chief Financial Officer, the effectiveness of our disclosure controls and procedures (as defined in Rules 13a-15(e) and 15d-15(e) of the Exchange Act) as of the end of the period covered by this report. Based on this evaluation, our Chief Executive Officer and Chief Financial Officer have concluded that, as of such date, the Company’s disclosure controls and procedures are effective in ensuring that information relating to the Company, including its consolidated subsidiaries, required to be disclosed in reports that it files under the Exchange Act is (1) recorded, processed, summarized and reported within the time periods specified in the SEC’s rules and forms, and (2) accumulated and communicated to our management, including our Chief Executive Officer and Chief Financial Officer, as appropriate to allow timely decisions regarding required disclosure.
Internal Control Over Financial Reporting
(a) Management’s report on internal control over financial reporting
The Company’s management is responsible for establishing and maintaining adequate internal control over the Company’s financial reporting. The Company’s internal control system is designed to provide reasonable assurance to our management and the Board regarding the preparation and fair presentation of published financial statements. Internal control over financial reporting includes self-monitoring mechanisms and taking action to correct deficiencies as they are identified. Because of inherent limitations in any system of internal control, no matter how well designed, misstatements due to error or fraud may occur and not be detected, including the possibility of the circumvention or overriding of controls. Accordingly, even effective internal control over financial reporting can provide only reasonable assurance with respect to financial statement preparation and presentation and may not eliminate the need for restatements. Further, because of changes in conditions, internal control effectiveness may vary over time.
The Company’s management assessed the effectiveness of the Company’s internal control over financial reporting as of December 31, 2024. In making this assessment, management used the criteria set forth by the Committee of Sponsoring Organizations of the Treadway Commission in the 2013 Internal Control—Integrated Framework. Based on its assessment, management believes that, as of December 31, 2024, the Company’s internal control over financial reporting was effective based on these criteria.
Crowe LLP, an independent registered public accounting firm, has audited the effectiveness of our internal control over financial reporting as of December 31, 2024, and their report is included in Item 8. Financial Statements And Supplementary Data of this Form 10-K.
(b) Attestation report of the registered public accounting firm.
See Item 8. Financial Statements And Supplementary Data of this Form 10-K.
(c) Changes in internal control over financial reporting.
There were no significant changes in the Company’s internal control over financial reporting during the fourth quarter of the period covered by this Form 10-K that materially affected, or are reasonably likely to materially affect, the Company’s internal control over financial reporting.
ITEM 9B. OTHER INFORMATION
During the fiscal quarter ended December 31, 2024, none of the Company’s directors or executive officers adopted or terminated any contract, instruction or written plan for the purchase or sale of Company securities that was intended to satisfy the affirmative defense conditions of Rule 10b5-1(c) or any “non-Rule 10b5-1 trading arrangement.
ITEM 9C. DISCLOSURE REGARDING FOREIGN JURISDICTIONS THAT PREVENT INSPECTIONS
Not applicable.
PART III
ITEM 10. DIRECTORS, EXECUTIVE OFFICERS AND CORPORATE GOVERNANCE
Certain of the information required by this Item 10 will be included in the Company’s Proxy Statement under the headings “Director Nominees,” “Board Structure,” “Proposal 1– Election of Directors,” “Meetings and Committees of the Board of Directors,” “Corporate Governance,” “Director Compensation,” “Compensation Discussion and Analysis,” “Shareholder Proposals” and "Information About our Executive Officers" and is incorporated herein by reference. The Proxy Statement will be filed with the SEC pursuant to Regulation 14A within 120 days of the end of the Company’s 2024 fiscal year.
ITEM 11. EXECUTIVE COMPENSATION
The information required by this Item 11 will be included in the Company’s Proxy Statement under the headings “Director Compensation,” “Compensation Discussion and Analysis,” “Report of the Compensation Committee” and “Executive Compensation” (excluding “Pay Versus Performance”) and is incorporated herein by reference. The Proxy Statement will be filed with the SEC pursuant to Regulation 14A within 120 days of the end of the Company’s 2024 fiscal year.
ITEM 12. SECURITY OWNERSHIP OF CERTAIN BENEFICIAL OWNERS AND MANAGEMENT AND RELATED STOCKHOLDER MATTERS
Equity Compensation Plan Information
The following table summarizes certain information with respect to the compensation plans under which our equity securities are authorized for issuance as of December 31, 2024.
| | | | | | | | | | | | | | | | | |
| Number of securities to be issued upon exercise of outstanding options, warrants, rights(1) | | Weighted-average exercise price of options, warrants and rights (2) | | Number of securities remaining available for future issuance under the equity compensation plans (excluding securities reflected in column (a) (3) |
| Plan Category | (a) | | (b) | | (c) |
| Equity compensation plans, all of which have been approved by security holders | 480,385 | | — | | 938,362 |
| Equity compensation plans, not approved by security holders | — | | — | | — |
(1) The securities set forth in this column (a) relate to 278,420 outstanding restricted stock unit awards under the Equity Plan and 201,965 outstanding restricted stock units awards under the 2014 Plan.
(2) The weighted-average exercise price does not reflect the shares that will be issued in connection with the settlement of restricted stock unit awards set forth in column (a), because restricted stock units do not have an exercise price.
(3) The securities set forth in this column (c) include restricted stock units, stock options, restricted stock, and other types of stock awards that remain available for issuance under the Equity Plan. No future awards may be granted under the 2014 Plan.
Other information required by this Item 12 will be included in the Company’s Proxy Statement under the heading “Security Ownership of Certain Beneficial Owners and Management” and is incorporated herein by reference. The Proxy Statement will be filed with the SEC pursuant to Regulation 14A within 120 days of the end of the Company’s 2024 fiscal year.
The Company is not aware of any arrangements, including any pledge by any person of securities of the Company, the operation of which may at a subsequent date result in a change in control of the Company.
ITEM 13. CERTAIN RELATIONSHIP AND RELATED TRANSACTIONS, AND DIRECTOR INDEPENDENCE
The information required by this Item 13 will be included in the Company’s Proxy Statement under the headings “Proposal 1 - Election of Directors,” “Meetings and Committees of the Board of Directors” and “Corporate Governance” and is incorporated herein by reference. The Proxy Statement will be filed with the SEC pursuant to Regulation 14A within 120 days of the end of the Company’s 2024 fiscal year.
ITEM 14. PRINCIPAL ACCOUNTANT FEES AND SERVICES
The information required by this Item 14 will be included in the Company’s Proxy Statement under the heading “Proposal 3–Ratification of the Appointment of Independent Registered Public Accounting Firm” and is incorporated herein by reference. The Proxy Statement will be filed with the SEC pursuant to Regulation 14A within 120 days of the end of the Company’s 2024 fiscal year.
PART IV
ITEM 15. EXHIBITS AND FINANCIAL STATEMENT SCHEDULES
(a) The following documents are filed as a part of this report:
(1) Financial Statements: The Consolidated Financial Statements are included in Item 8. Financial Statements And Supplementary Data of this Form 10-K.
(2) Financial Statements Schedules: All schedules are omitted because they are not required or applicable, or the required information is shown in the Consolidated Financial Statements or Notes.
(3) Exhibits: Included in schedule below.
| | | | | | | | | | | | | | | | | | | | | | | | | | |
| | | | Incorporated by Reference |
| Exhibit No. | | Description of Exhibit | | Form | | Exhibit | | Filing Date/Period End Date |
| | | | | | | | |
| | | | | | | | |
| | | | | | | | |
| | | | | | | | |
| 3.1 | | | | 8-K | | 3.1(B) | | 05/18/2010 |
| | | | | | | | |
| 3.2 | | | | S-14A | | - | | 03/18/2011 |
| | | | | | | | |
| 3.3 | | | | 8-K | | 3.3 | | 06/30/2020 |
| | | | | | | | |
| 4.1 | | Form of Certificate of Company's Common Stock (3) | | S-1/A | | - | | 10/29/1997 |
| | | | | | | | |
| 4.2 | | | | | | | | |
| | | | | | | | |
| 10.1* | | | | | | | | |
| | | | | | | | |
| 10.2* | | | | DEF 14A | | Appendix A | | 06/11/2014 |
| | | | | | | | |
| 10.3* | | | | 8-K | | 99.2 | | 02/01/2017 |
| | | | | | | | |
| 10.4* | | | | 8-K | | 99.4 | | 02/01/2017 |
| | | | | | | | |
| 10.5* |
| | | 8-K | | 99.3 | | 02/01/2017 |
| | | | | | | | |
| | | | | | | | |
| | | | | | | | |
| | | | | | | | |
| | | | | | | | |
| 10.6* | | | | DEF 14A | | Appendix A | | 03/22/2023 |
| | | | | | | | |
| 10.7* | | | | S-8 | | 4.5 | | 05/08/2023 |
| | | | | | | | |
| 10.8* | | | | S-8 | | 4.6 | | 05/08/2023 |
| | | | | | | | |
| 10.9* | | | | 8-K | | 10.1 | | 07/01/2024 |
| | | | | | | | |
| 10.10* | | | | | | | | |
| | | | | | | | |
| 10.11* | | | | 8-K | | 10.6 | | 09/07/2012 |
| | | | | | | | |
| 10.12* | | | | 8-K | | 10.2 | | 12/22/2016 |
| | | | | | | | |
| 10.13* | | | | | | | | |
| | | | | | | | |
| 10.14* | | | | 10-Q | | 10.40 | | 11/09/2022 |
| | | | | | | | |
| 10.15* | | | | 10-Q | | 10.22 | | 11/06/2019 |
| | | | | | | | |
| 10.16* | | | | 8-K | | 10.7 | | 09/07/2012 |
| | | | | | | | |
| 10.17* | | | | 8-K | | 10.3 | | 12/22/2016 |
| | | | | | | | |
| 10.18* | | | | | | | | |
| | | | | | | | |
| 10.19* | | | | 10-Q | | 10.41 | | 11/09/2022 |
| | | | | | | | |
| 10.20* | | | | 8-K | | 10.2 | | 07/01/2024 |
| | | | | | | | |
| | | | | | | | | | | | | | | | | | | | | | | | | | |
| 10.21* | | | | 10-K | | 10.16 | | 03/11/2015 |
| | | | | | | | |
| 10.22* | | | | 8-K | | 10.4 | | 12/22/2016 |
| | | | | | | | |
| 10.23* | | | | | | | | |
| | | | | | | | |
| 10.24* | | | | 10-Q | | 10.42 | | 11/09/2022 |
| | | | | | | | |
| 10.25* | | | | | | | | |
| | | | | | | | |
| 10.26* | | | | 8-K | | 10.1 | | 12/19/2024 |
| | | | | | | | |
| 10.27* | | | | 10-Q | | 10.17 | | 08/06/2015 |
| | | | | | | | |
| 10.28* | | | | 10-Q | | 10.34 | | 05/09/2019 |
| | | | | | | | |
| 10.29* | | | | 8-K | | 10.1 | | 06/30/2020 |
| | | | | | | | |
| 10.30* | | | | 8-K | | 10.3 | | 06/30/2020 |
| | | | | | | | |
| | | | | | | | |
| | | | | | | | |
| 10.31* | | | | 10-Q | | 10.43 | | 11/09/2022 |
| | | | | | | | |
| 10.32* | | | | 10-Q | | 10.34 | | 05/05/2021 |
| | | | | | | | |
| 10.33* | | | | 8-K | | 10.1 | | 10/23/2024 |
| | | | | | | | |
| 10.34* | | | | | | | | |
| | | | | | | | |
| 14.0 |
| Code of Ethics and Conduct Policy (2) | | | | | | |
| | | | | | | | |
| 19.0 | | | | | | | | |
| | | | | | | | |
| 21.0 | | | | | | | | |
| | | | | | | | |
| 23.0 | | | | | | | | |
| | | | | | | | |
| 24.0 | | | | | | | | |
| | | | | | | | |
| 31.1 |
| | | | | | | |
| | | | | | | | |
| 31.2 |
| | | | | | | |
| | | | | | | | |
| 32.1 |
| | | | | | | |
| | | | | | | | |
| 97.0 | | | | | 10-K | | 97.0 | | 2/27/2024 |
| | | | | | | | |
| 101.INS |
| XBRL Instance Document (1) | | | | | | |
| | | | | | | | |
| 101.SCH | | XBRL Taxonomy Extension Schema Document (1) | | | | | | |
| | | | | | | | |
| 101.CAL | | XBRL Taxonomy Extension Calculation Linkbase Document (1) | | | | | | |
| | | | | | | | |
| 101.DEF | | XBRL Taxonomy Extension Definition Linkbase Document (1) | | | | | | |
| | | | | | | | |
| 101.LAB | | XBRL Taxonomy Extension Label Linkbase Document (1) | | | | | | |
| | | | | | | | |
| | | | | | | | | | | | | | | | | | | | | | | | | | |
| 101.PRE | | XBRL Taxonomy Extension Presentation Linkbase Document (1) | | | | | | |
| | | | | | | | |
| 104 | | | Cover Page Interactive Data File, formatted in Inline XBRL and included in Exhibit 101 | | | | | | |
*Indicates management contract or compensatory plan or arrangement.
(1) Filed herewith.
(2) Registrant elects to satisfy Regulation S-K §229.406(c) by posting its Code of Ethics on its website at www.hf-wa.com in the section titled Overview: Governance Documents.
(3) Exhibit not previously filed in electronic format.
ITEM 16. FORM 10-K SUMMARY
None.
SIGNATURES
Pursuant to the requirements of Section 13 or 15(d) of the Securities Exchange Act of 1934, the registrant has duly caused this report to be signed on its behalf by the undersigned, thereunto duly authorized, on February 27, 2025.
| | | | | | | | |
| | HERITAGE FINANCIAL CORPORATION |
| | (Registrant) |
| | |
| | /S/ JEFFREY J. DEUEL |
| | Jeffrey J. Deuel |
| | Chief Executive Officer |
Pursuant to the requirements of the Securities Exchange Act of 1934, this report has been signed below by the following persons on behalf of the registrant and in the capacities indicated on February 27, 2025.
| | | | | | | | |
| | |
| | |
| | Principal Executive Officer: |
| | /S/ JEFFREY J. DEUEL |
| | Jeffrey J. Deuel |
| | Chief Executive Officer |
| | |
| | |
| | Principal Financial Officer and Principal Accounting Officer: |
| | /S/ DONALD J. HINSON |
| | Donald J. Hinson |
| | Executive Vice President and Chief Financial Officer |
| | |
| | |
| Jeffrey J. Deuel, pursuant to a power of attorney that is being filed with the Form 10-K, has signed this report as attorney in fact for the following directors who constitute a majority of the Board of Directors. |
|
| | |
| Brian S. Charneski | | |
| Jeffrey J. Deuel | | |
| Trevor D. Dryer | | |
| Kimberly T. Ellwanger | | |
| Deborah J. Gavin | | |
| Gail B. Giacobbe | | |
| Jeffrey S. Lyon | | |
| Frederick B. Rivera | | |
| Karen R. Saunders | | |
| Brian L. Vance | | |
| Ann Watson | | |
| | /S/ JEFFREY J. DEUEL |
| | Jeffrey J. Deuel |
| | Attorney-in-Fact |
| | pursuant to a power of attorney |
| | February 27, 2025 |