 Q2 2013 Investor Presentation Heritage Financial Corporation Brian L. Vance CEO & President Exhibit 99.1 |
 Forward Looking Statement 2 This presentation contains forward-looking statements that are subject to risks and uncertainties, including, but not limited to: The credit and concentration risks of lending activities; Changes in general economic conditions, either nationally or in our market areas; Competitive market pricing factors and interest rate risks; Market interest rate volatility; Balance sheet (for example, loans) concentrations; Fluctuations in demand for loans and other financial services in our market areas; Changes in legislative or regulatory requirements or the results of regulatory examinations; The ability to recruit and retain key management and staff; Risks associated with our ability to implement our expansion strategy and merger integration; Stability of funding sources and continued availability of borrowings; Adverse changes in the securities markets; The inability of key third-party providers to perform their obligations to us; Changes in accounting policies and practices and the use of estimates in determining fair value of certain of our assets, which estimates may prove to be incorrect and result in significant declines in valuation; and These and other risks as may be detailed from time to time in our filings with the Securities and Exchange Commission. The Company cautions readers not to place undue reliance on any forward-looking statements. Moreover, you should treat these statements as speaking only as of the date they are made and based only on information then actually known to the Company. The Company does not undertake and specifically disclaims any obligation to revise any forward-looking statements to reflect the occurrence of anticipated or unanticipated events or circumstances after the date of such statements. These risks could cause our actual results for 2013 and beyond to differ materially from those expressed in any forward-looking statements by, or on behalf of, us, and could negatively affect the Company’s operating and stock price performance. |
 Overview • Company Information • Financial Performance • Strategic Initiatives 3 |
 Company Information 4 |
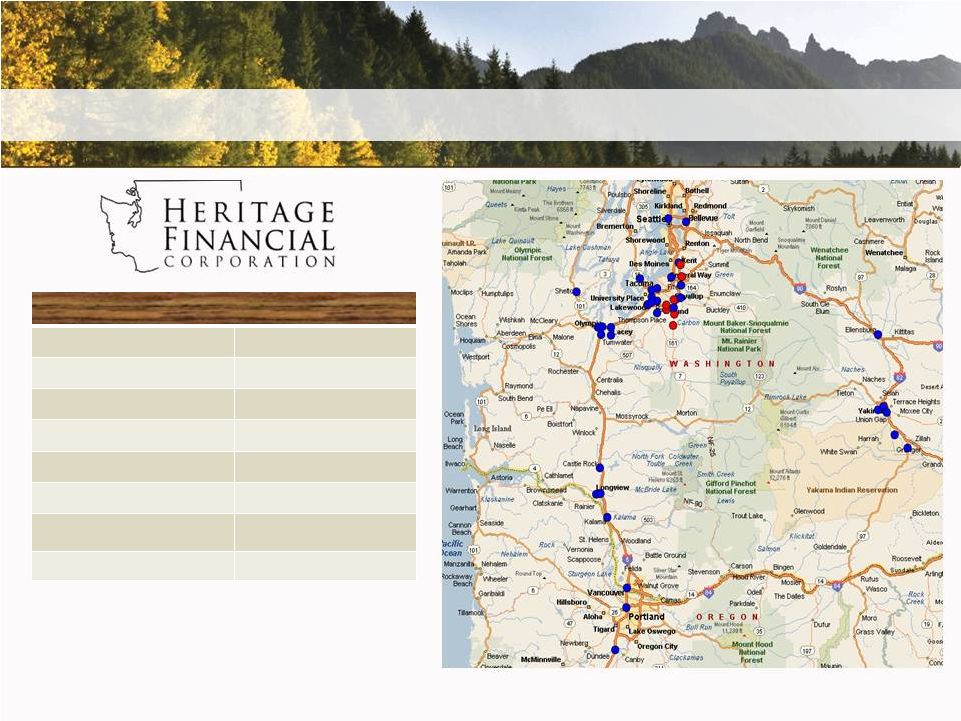 Our Company 5 Financial Data as of and for the period ending June 30, 2013 • Effective July 15, 2013, acquired 8 Valley Bank branches and Valley Community Bancshares, Inc. pro-forma total assets of $234 million. Financial Highlights Total Assets $1.43 billion Net Loans $1.09 billion Total Deposits $1.20 billion Tangible Common Equity $187 million Loan/Deposit Ratio 90.8% Return on Average Assets 0.79% (YTD) Net Interest Margin 5.00% (YTD) Branches 34 |
 2013 Announcements 6 January 9, 2013 – Completed Merger with Northwest Commercial Bank • Results in an Auburn location, consolidation of Lakewood branches and $65 million in total assets. Completed systems conversion March 9, 2013. June 19, 2013 – Completed Bank Subsidiary Consolidation • Central Valley Bank has been a wholly-owned subsidiary of Heritage Financial Corporation for 14 years • 6 Branches and $179 million total assets were added to Heritage Bank July 15, 2013 – Completed Merger with Valley Community Bancshares, Inc. • 8 branches in Pierce & King Counties and $234 million in total assets |
 2013 Merger Activity Review 7 • CVB Charter Merger • Anticipated to reduce annualized expense by approximately $465,000 • Valley Bank Merger • Estimated cost saves between 45-50% • Will consolidate 4 of 8 branches by end of Q4 • Q3 & Q4 estimated expenses of $1.75 million • 2014 EPS accretion estimated at 19% • Pro-forma TCE estimated at 11.8% down from 13.0% at year end 2012 |
 Financial Performance 8 |
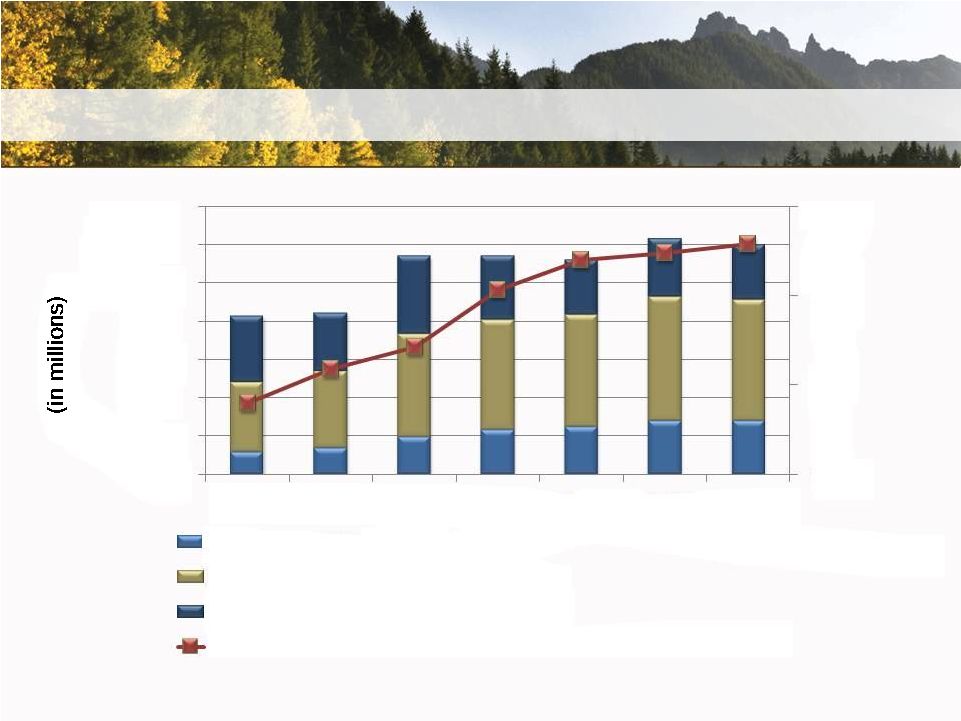
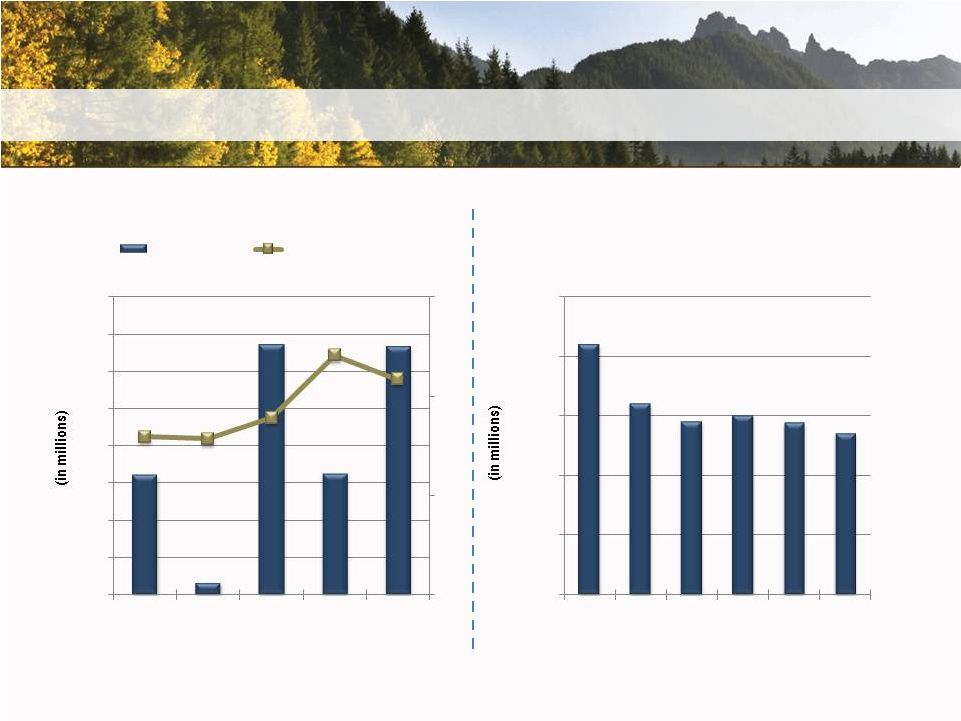
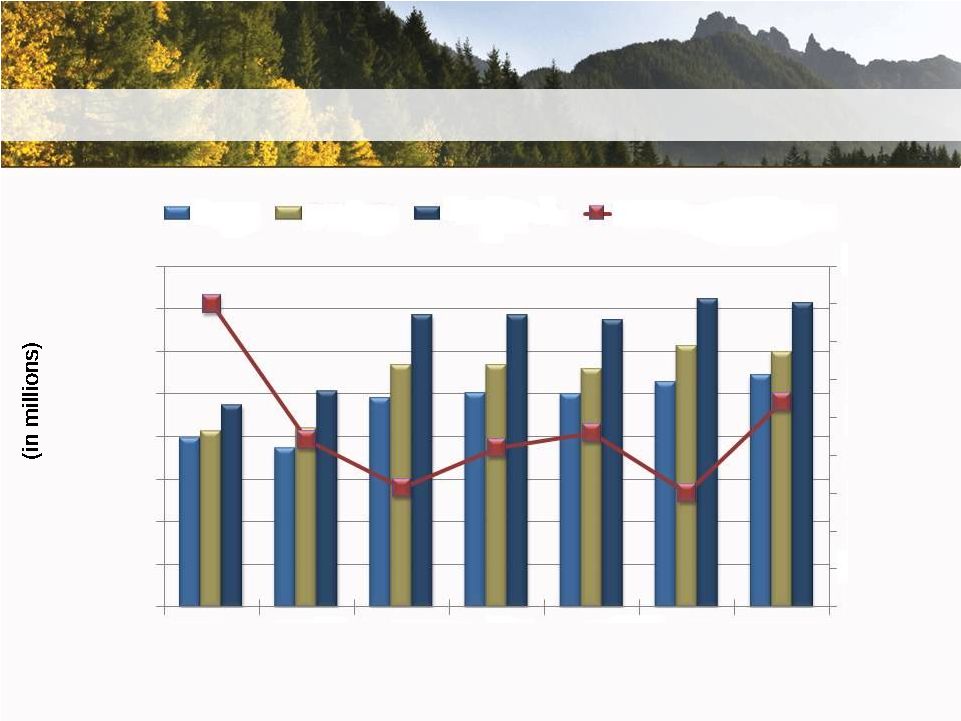 Balance Sheet 9 80% 82% 84% 86% 88% 90% 92% 94% 96% 98% $- $200 $400 $600 $800 $1,000 $1,200 $1,400 $1,600 2008 2009 2010 2011 2012 Q1 '13 Q2 '13 % Loans to Deposits Deposits Total Assets Loans |
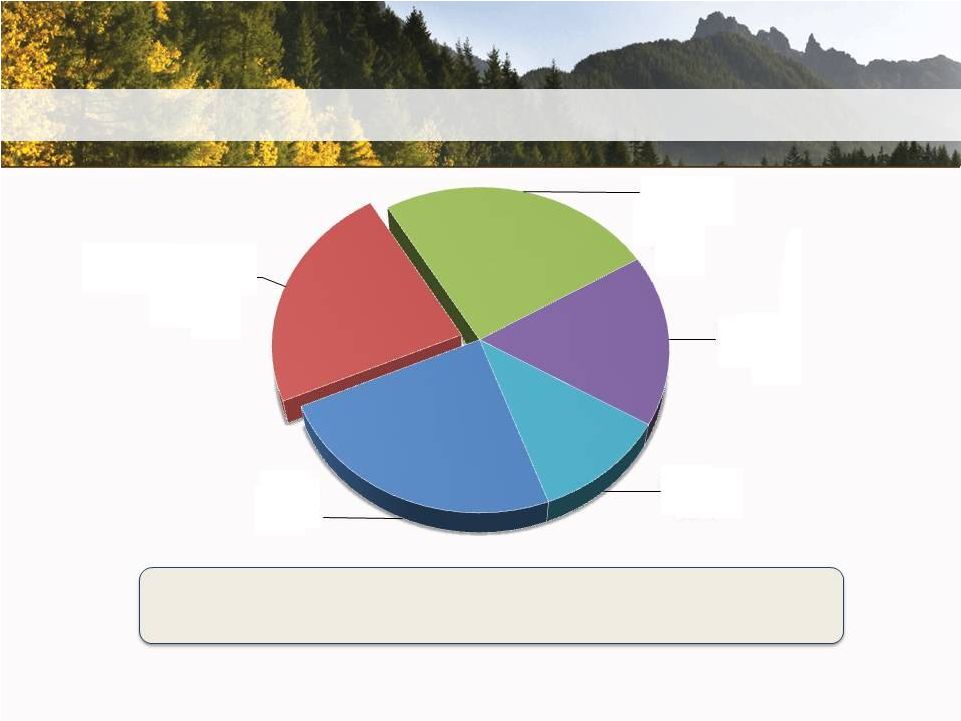
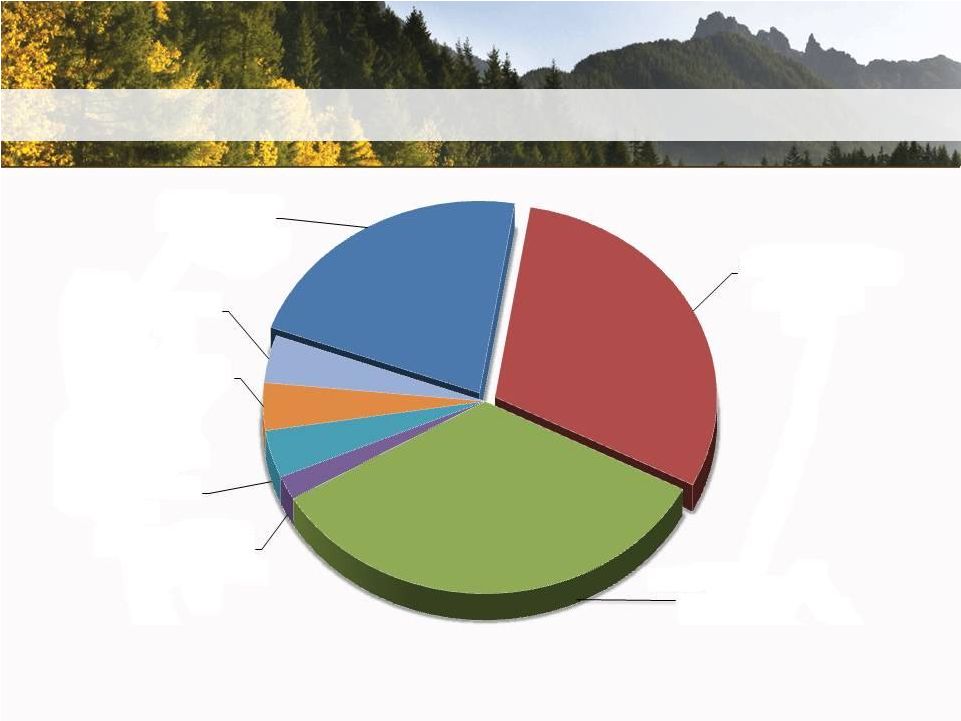 Total Loan Portfolio 10 Financial data as of June 30, 2013 CRE Owner Occupied 22% Commercial & Industrial 30% CRE Non-Owner Occupied 34% Residential Construction 2% Commercial Construction 4% Estate 4% Consumer 4% Residential Real |
 Net Loan Trends 11 2009 2010 2011 2012 Q1 2013 Q2 2013 CAGR Originated Loans $746.1 $720.0 $815.6 $855.4 $869.2 $914.7 5.23% Purchased Covered Loans - $128.7 $105.4 $84.0 $81.4 $75.0 n/a Purchased Non- Covered Loans - $131.0 $83.5 $59.0 $104.9 $96.8 n/a Total $746.1 $979.8 $1,004.5 $998.4 $1,055.5 $1,086.5 9.06% Dollars in millions |
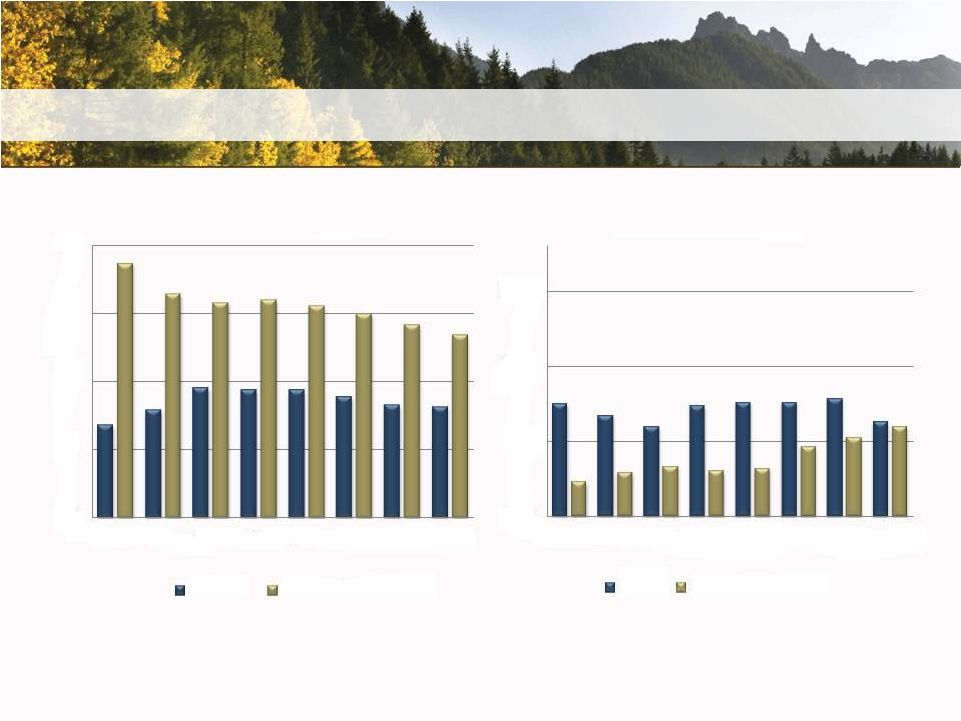 Credit Quality 12 Regional Peer Group (10): Ticker Symbols – BANR, CACB, COLB, FFNW, HOME, NRIM, PCBK, RVSB, TSBK, WBCO Source: SNL Financial 0% 2% 3% 5% 6% Q2'11 Q3'11 Q4'11 Q1'12 Q2'12 Q3'12 Q4'12 Q1'13 NPAs/Assets (%) HFWA Regional Peers 40% 80% 120% 160% Q2'11 Q3'11 Q4'11 Q1'12 Q2'12 Q3'12 Q4'12 Q1'13 Reserves/NPLs (%) HFWA Regional Peers |
 Deposit Base 13 Financial data as of and for the quarter ending June 30, 2013. CDs 24% Non-Interest Demand 23% Interest Checking (NOW) 25% Money Market 17% Savings 11% Total Deposits Non-Maturity Deposits / Total Deposits $1.2 billion 76% Cost of Deposits Cost of Interest Bearing Deposits 0.30% 0.39% |
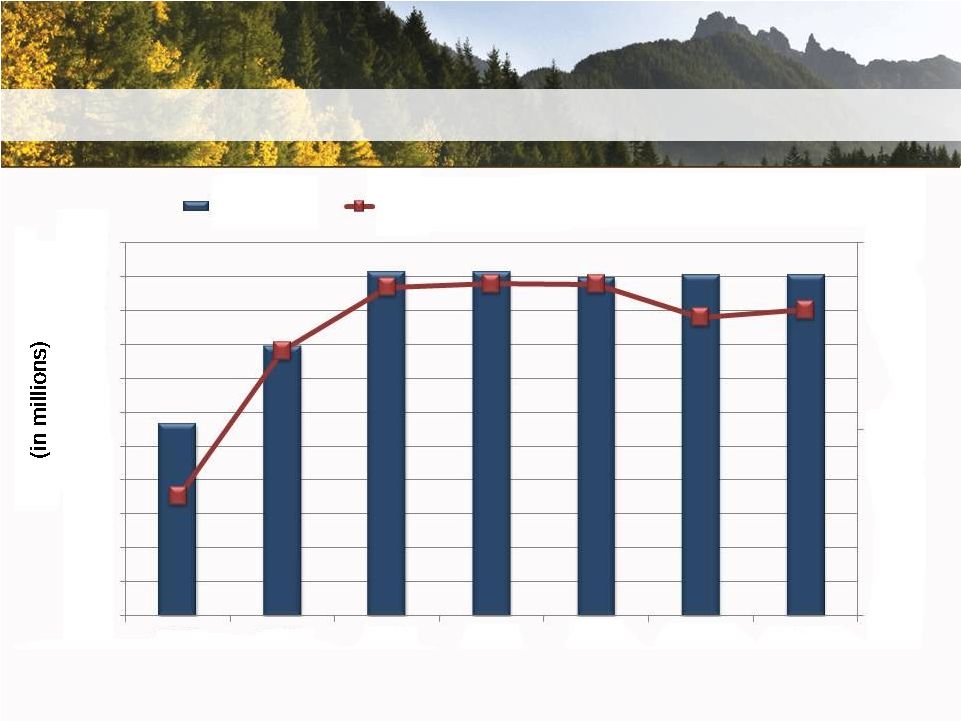
 Deposits 14 10% 15% 20% 25% $- $200 $400 $600 $800 $1,000 $1,200 $1,400 2008 2009 2010 2011 2012 Q1 '13 Q2 '13 Non-Interest Demand Deposits NOW/Savings/MMA Certificates of Deposit % of Non-Interest Interest Demand Deposits to Total Deposits |
 Equity 15 *After the acquisition of Valley Bank, Tangible Common Equity/Tangible Assets is estimated to be 11.8% $113.1 $158.5 $202.3 $202.5 $198.9 $200.5 $200.5 5% 10% 15% $- $20 $40 $60 $80 $100 $120 $140 $160 $180 $200 $220 2008 2009 2010 2011 2012 Q1'13 Q2'13 Total Equity Tangible Common Equity/Tangible Assets |
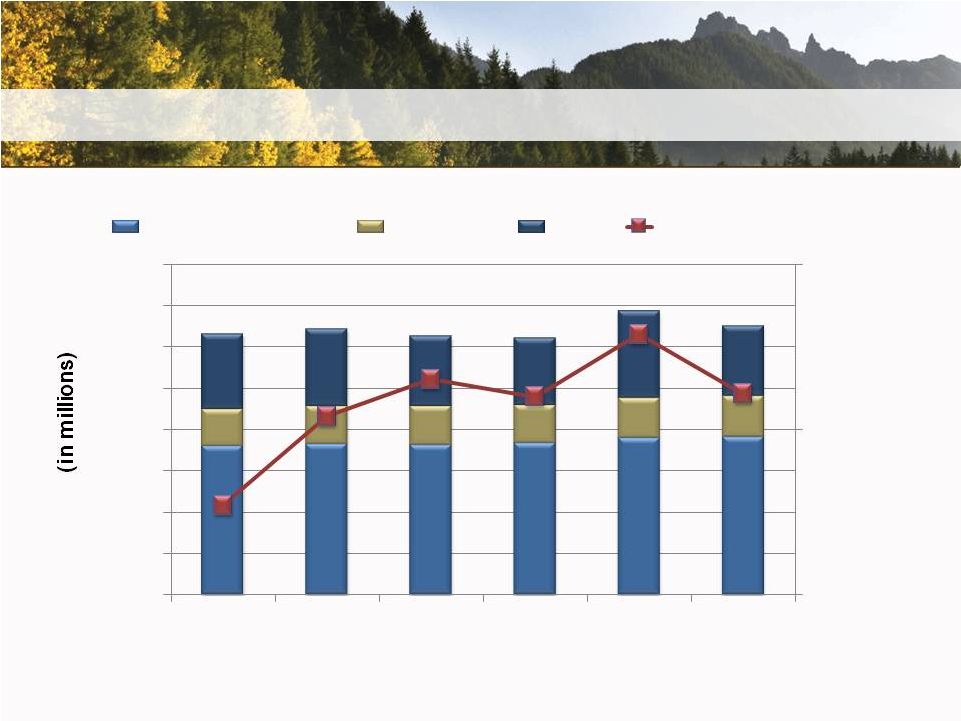
 Earnings Annual Net Income Quarterly Net Income 16 *Includes after-tax gain of $7.7 million for FDIC-assisted bank acquisitions. Net Income Net Interest Margin $16 $14 $12 $10 $8 $6 $4 $2 $- 2008 2009 2010* 2011 2012 3% 4% 5% 6% $6.4 $0.6 $13.4 $6.5 $13.3 $5 $4 $3 $2 $1 $- Q1'12 Q2'12 Q3'12 Q4'12 Q1'13 Q2'13 $4.2 $3.2 $2.9 $3.0 $2.9 $2.7 |
 Diluted Earnings Per Share Annual Earnings/(Loss) Per Share Quarterly Earnings Per Share 17 *Includes $0.69 earnings per share related to the after-tax gain on FDIC-assisted acquisitions. $1.50 $1.30 $1.10 $0.90 $0.70 $0.50 $0.30 $0.10 -$0.10 2008 2009 2010* 2011 2012 $0.93 ($0.09) $1.05 $0.42 $0.87 $0.40 $0.35 $0.30 $0.25 $0.20 $0.15 $0.10 $0.05 $0.00 Q1'12 Q2'12 Q3'12 Q4'12 Q1'13 Q2'13 $0.27 $0.21 $0.19 $0.20 $0.19 $0.18 |
 Operating Expenses 18 *Includes acquisition/conversion expenses of $788,000 for Q1’13 and $455,000 for Q2’13, respectively. Salaries & Benefits Occupancy Other Efficiency Ratio $16 $14 $12 $10 $8 $6 $4 $2 $- Q1 '12 Q2 '12 Q3 '12 Q4 '12 Q1 '13* Q2 '13* 75% 70% 65% |
 19 19 Strategic Initiatives |
 • Acquisitions • Enhance Pacific Northwest footprint • Completed Northwest Commercial Bank and Valley Bank acquisitions • Balance Sheet Growth • 2013 projected originated loan growth of 3-5% • Actual YTD originated loan growth of 6.9% • Maintain loan to deposit ratio 85-90% • 06/30/13 loan to deposit ratio was 90.8% • Efficiency Improvements • Merged Central Valley Bank into Heritage Bank in Q2 2013 • Resulting in a projected annualized expense reduction of $465,000 • Core System Conversion in Q4 2013 20 2013 Strategic Initiatives |
 • Branching • De Novo branch - East Vancouver, WA • Groundbreaking was 07/16/13 • Re-locating branches – Tumwater and Kent, WA • Valley Bank branch consolidation • 4 branch consolidations scheduled for Q4 • Wealth Management • Continue growth focus on Trust, Brokerage, Advisory Management Services 21 2013 Strategic Initiatives |
 Strategic Efficiency Initiatives • Emphasis on improving: • Assets per employee (ApE) (in thousands) • HB 12/31/12 Actual: $3,707 ApE • NCB at conversion: 10 FTE + $65MM total assets = $6,500 ApE • Valley estimates: 33 FTE + $234MM total assets = $7,091 ApE • Deposits per branch (DpB) (in thousands) • HB 12/31/12 Actual: $33,878 DpB • NCB at conversion: 1 Branch + $60MM total deposits = $60,000 DpB • Valley estimates: 4 Branches + $203MM total deposits = $50,750 DpB • Loan commitments per lender 22 |
 • Cash Dividends • Regular dividends in the 35% to 40% payout range • Special dividends as appropriate but dependent on acquisition activities • Stock buybacks on an opportunistic basis 23 2011 2012 2013 Q2 Q3 Q4 Q1 Q2 Q3 Q4 Q1 Q2 Quarterly Dividend $0.03 $0.05 $0.05 $0.06 $0.08 $0.08 $0.08 $0.08 $0.08 Special Dividend - - $0.25 - $0.20 - $0.30 - $0.10 Strategic Capital Management |
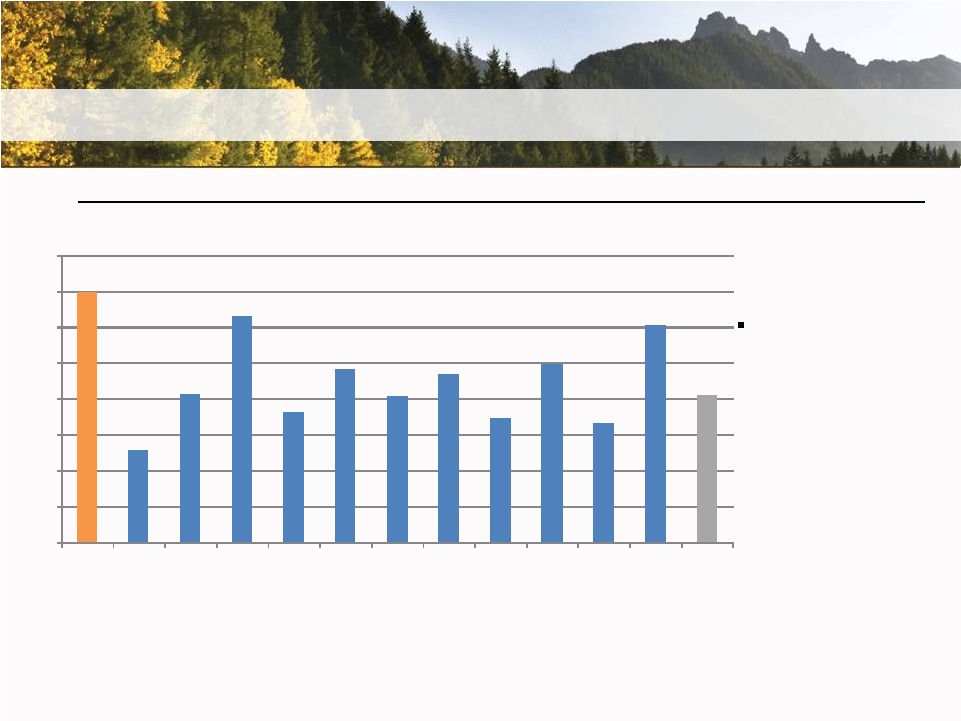 Capital Return 24 Total Capital Returned* Since Q1 2011 (% of Tg. Common Equity in Q1 2011) Source: SNL Financial, as of 12/31/2012 unless noted otherwise *Total capital returned includes all cash dividends and stock buybacks since Q1 2011 HFWA has returned more capital to shareholders than most peers since Q1 2011 based on beginning balance of tangible common equity 14.0% 5.1% 8.2% 12.7% 7.3% 9.7% 8.1% 9.4% 6.9% 9.9% 6.6% 12.1% 8.2% 0% 2% 4% 6% 8% 10% 12% 14% 16% HFWA BMRC COLB CVBF FIBK GBCI PCBK PACW TCBK UMPQ WBCO WAFD Median |
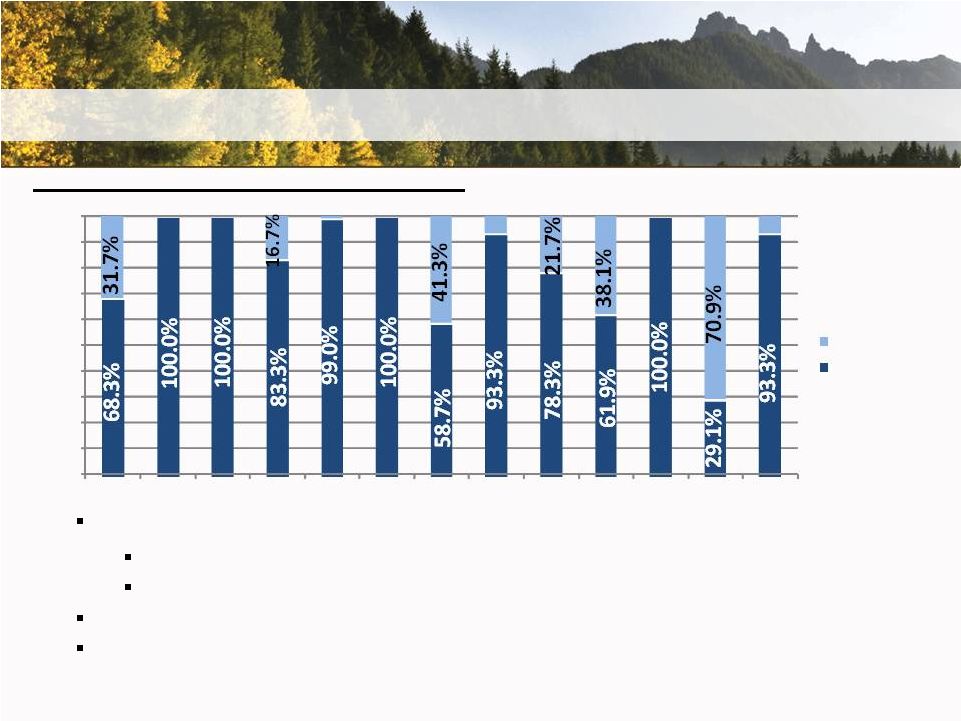 Capital Return 25 Source: SNL Financial, as of 12/31/2012 *Total capital returned includes all cash dividends and stock buybacks since Q1 2011 HFWA has returned capital through both dividends and stock buybacks 68.3% through dividends and 31.7% through buybacks vs. peer median 93.3% through dividends and 6.7% through buybacks More advantageous for shareholders from a tax perspective for stock buybacks vs. dividends None of the selected companies had a buyback program in place without a dividend program as well Mix of Capital Returned* (Since Q1 2011) 0% 10% 20% 30% 40% 50% 60% 70% 80% 90% 100% HFWA BMRC COLB CVBF FIBK GBCI PCBK PACW TCBK UMPQ WBCO WAFD Median Buyback Dividends |
 26 Conclusion 26 |
 Investment Value • Strong financial foundation • Positioned to take advantage of the right opportunities • Continued focus on building long-term franchise value • Disciplined approach to acquisitions 27 |
 Thank You Questions? |