| OMB APPROVAL |
OMB Number: 3235-0570 Expires: Oct. 31, 2006 Estimated average burden hours per response: 19.3 |
UNITED STATES
SECURITIES AND EXCHANGE COMMISSION
Washington, D.C. 20549
FORM N-CSR
CERTIFIED SHAREHOLDER REPORT OF REGISTERED MANAGEMENT INVESTMENT
COMPANIES
Investment Company Act file number 811-08413
Equity Trust
_____________________________________________________________
(Exact name of registrant as specified in charter)
200 Berkeley Street Boston, Massachusetts 02116
_____________________________________________________________
(Address of principal executive offices) (Zip code)
Michael H. Koonce, Esq.
200 Berkeley Street Boston, Massachusetts 02116
____________________________________________________________
(Name and address of agent for service)
Registrant's telephone number, including area code: (617) 210-3200
Date of fiscal year end: Registrant is making a semiannual filing for 3 of its series, Evergreen Asset Allocation Fund, Balanced Fund and Foundation Fund, for the year ended 09/30/04. These 3 series have a 03/31 fiscal year end.
Date of reporting period: 09/30/04
Item 1 - Reports to Stockholders.

| | |
| table of contents |
| 1 | | L E T T E R T O S H A R E H O L D E R S |
| 4 | | F U N D AT A G L A N C E |
| 6 | | A B O U T Y O U R F U N D ' S E X P E N S E S |
| 8 | | F I N A N C I A L H I G H L I G H T S |
| 13 | | S C H E D U L E O F I N V E S T M E N T S |
| 14 | | S TAT E M E N T O F A S S E T S A N D L I A B I L I T I E S |
| 15 | | S TAT E M E N T O F O P E R AT I O N S |
| 16 | | S TAT E M E N T S O F C H A N G E S I N N E T A S S E T S |
| 17 | | N O T E S T O F I N A N C I A L S TAT E M E N T S |
| 24 | | T R U S T E E S A N D O F F I C E R S |
This semiannual report must be preceded or accompanied by a prospectus of the Evergreen fund contained herein. The prospectus contains more complete information, including fees and expenses, and should be read carefully before investing or sending money.
The fund will file its complete schedule of portfolio holdings with the SEC for the first and third quarters of each fiscal year on Form N-Q. The fund's Form N-Q will be available on the SEC's Web site at http://www.sec.gov. In addition, the fund's Form N-Q may be reviewed and copied at the SEC's Public Reference Room in Washington, D.C. Information on the operation of the Public Reference Room may be obtained by calling 800.SEC.0330.
A description of the fund's proxy voting policies and procedures is available without charge, upon request, by calling 800.343.2898, by visiting our Web site at EvergreenInvestments.com or by visiting the SEC's Web site at http://www.sec.gov.
Information relating to how the fund voted proxies relating to portfolio securities during the most recent 12-month period ended June 30 is available by visiting our Web site at EvergreenInvestments.com or by visiting the SEC's Web site at http://www.sec.gov.
Mutual Funds:
| | | | |
| NOT FDIC INSURED | | MAY LOSE VALUE | | NOT BANK GUARANTEED |
Evergreen InvestmentsSM is a service mark of Evergreen Investment Management Company, LLC. Copyright 2004.
Evergreen mutual funds are distributed by Evergreen Investment Services, Inc. 200 Berkeley Street, Boston, MA 02116
LETTER TO SHAREHOLDERS
November 2004

Dennis H. Ferro
President and Chief
Executive Officer
|
Dear Shareholder,
We are pleased to provide the semiannual report for the Evergreen Asset Allocation Fund, which covers the six-month period ended September 30, 2004.
During these challenging times, the importance of proper asset allocation between stocks, bonds and cash cannot be overstated. We strongly believe that investment portfolios utilizing a balanced approach for diversification will provide investors, as they have historically, with the stability necessary during periods of market turmoil. Given the uncertain geopolitical backdrop, our portfolio managers entered the investment period preparing for, and adapting to, the rapidly changing fundamental landscape. Our forecast for the investment period included less accommodation from the Federal Reserve, along with a moderation in economic and corporate profit growth. As a result, our equity analysts sought sustainable profits and the potential for higher dividends, while our bond teams attempted to identify credit quality with appropriate maturities for the fixed income portion of our diversified investment portfolios.
The period began with positive momentum on the economic front. First quarter Gross Domestic Products (GDP) grew in excess of 4%, and supporting data pointed to a continuation of solid growth. Retail sales were strong and manufacturing had managed to put together several months of consistent growth. The solid contributions from business investment, meanwhile, had enabled the expansion to broaden, reinforcing the trend for sustainable economic growth. The next key for the recovery would come in the
1
LETTER TO SHAREHOLDERS continued
form of employment growth, which has historically lagged that of GDP growth. This recovery was no exception, and fears of a jobless recovery persisted for months. Yet that too also improved, as the investment period began with consecutive monthly payroll gains in excess of 300,000 jobs.
Another condition of economic recoveries is that they have to transition from the initial phase of surging growth to more normalized periods of average growth. This historically subtle transition was abundantly clear during the second quarter as GDP growth had moderated two full percentage points, to 3%, from the approximately 5% pace over the prior twelve months. Personal consumption weakened, prices for oil and gasoline were surging, and fears of terror abounded as the June 30th deadline approached for the handover of power in Iraq.
As if this wasn't enough, the Federal Reserve had been preparing Wall Street for higher interest rates. Monetary policymakers began the second quarter with a new "spin" on their message to the public, stating that they would remain "measured" in their removal of policy accommodation. Despite these attempts at improved clarity from the Federal Reserve, market interest rates alternately plunged, then soared, only to recover again by the end of the summer. These interest rate concerns were exacerbated by rising gasoline prices and the larger-than-forecasted readings on consumer inflation during May and June. As it turned out, the advent of the Federal Reserve's gradual tightening cycle proved to be the tonic that the markets needed, with the yield curve flattening slightly by the end of the investment period.
In addition to the aforementioned deceleration in GDP growth, the pace of growth in corporate profits has also moderated in recent months. After climbing approximately 20% over the past twelve months, operating earnings for companies within the S&P 500 Index are expected to climb by 15% in the second half of 2004, with profit gains of up to 10% in 2005.
2
LETTER TO SHAREHOLDERS continued
These forecasts were also weighed down by the fact that the third quarter represented the first time in a year that consensus EPS estimates did not increase during the quarter. Add in the uncertainty of the presidential election and higher energy prices, and the stock market faced many challenges during the investment period. To combat these issues, our equity teams endeavored to find companies with sustainability in profits, cash flows, and dividends in order to enhance total return prospects.
Please visit our website, EvergreenInvestments.com, for more information about our funds and other investment products available to you. Thank you for your continued support of Evergreen Investments.
Sincerely,

Dennis H. Ferro
President and Chief Executive Officer
Evergreen Investment Company, Inc.
|
Special Notice to Shareholders:
Please visit our website at EvergreenInvestments.com for statements from President and Chief Executive Officer, Dennis Ferro, and Chairman of the Board of the Evergreen Funds, Michael S. Scofield, addressing recent SEC actions involving the Evergreen Funds.
3
FUND AT A GLANCE
as of September 30, 2004
M A N A G E M E N T T E A M
Grantham, Mayo, Van Otterloo & Co. LLC
Asset Allocation Team
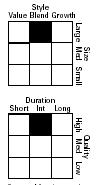
C U R R E N T I N V E S T M E N T S T Y L E

Source: Morningstar, Inc.
Morningstar's style box is based on a portfolio date as of 9/30/2004.
The domestic equity style box placement is based on 10 growth and valuation measures for each of the fund's holdings, as well as the size of the companies in which it invests, or median market capitalization.
P E R F O R M A N C E A N D R E T U R N S
Portfolio inception date: 7/29/1996
| | | | | | | | | | |
| | | Class A | | Class B | | Class C | | Class I | | Class R |
| Class inception date | | 7/29/1996 | | 10/3/2002 | | 10/3/2002 | | 10/3/2002 | | 10/10/2003 |
|
| Nasdaq symbol | | EAAFX | | EABFX | | EACFX | | EAIFX | | EAXFX |
|
| 6-month return with | | | | | | | | | | |
| sales charge | | -5.45% | | -5.07% | | -1.08% | | N/A | | N/A |
|
| 6-month return w/o | | | | | | | | | | |
| sales charge | | 0.31% | | -0.08% | | -0.08% | | 0.38% | | 0.23% |
|
| Average annual return* | | | | | | | | | | |
|
| 1-year with sales charge | | 7.44% | | 8.26% | | 12.27% | | N/A | | N/A |
|
| 1-year w/o sales charge | | 14.01% | | 13.26% | | 13.27% | | 14.34% | | 13.81% |
|
| 5-year | | 7.37% | | 7.64% | | 7.94% | | 8.98% | | 8.62% |
|
| Since portfolio inception | | 8.57% | | 8.61% | | 8.62% | | 9.68% | | 9.31% |
|
* Adjusted for maximum applicable sales charge, unless noted.
Past performance is no guarantee of future results. The performance quoted represents past performance and current performance may be lower or higher. The investment return and principal value of an investment will fluctuate so that investors' shares, when redeemed, may be worth more or less than their original cost. To obtain performance information current to the most recent month-end for Classes A, B, C or I, please go to EvergreenInvestments.com/fundperformance. Please call 1.800.847.5397 for the most recent month-end performance information for Class R. The performance of each class may vary based on differences in loads, fees and expenses paid by the shareholders investing in each class. The maximum applicable sales charge is 5.75% for Class A, 5.00% for Class B and 1.00% for Class C. Classes I and R are not subject to sales charges. Performance includes the reinvestment of income dividends and capital gain distributions. Performance shown does not reflect the deduction of taxes that a shareholder would pay on fund distributions or the redemption of fund shares.
For periods prior to 10/3/2002, returns have been adjusted downward to reflect the fund's current higher direct fund operating expenses. Historical performance shown for Classes B, C, I and R prior to their inception is based on the performance of Class A. Historical performance for Class A prior to 10/3/2002 is based on the performance of Class III of the fund's predecessor fund, GMO Global Balanced Allocation Fund. The historical returns for Classes A, B, C and R have been adjusted to reflect the effect of each class' 12b-1 fee. These fees are 0.30% for Class A, 0.50% for Class R and 1.00% for Classes B and C. Class I of the Fund does not, and Class III of the predecessor fund did not, pay a 12b-1 fee.
The advisor is waiving a portion of its advisory fee. Had the fee not been waived, returns would have been lower.
4
FUND AT A GLANCE continued
L O N G - T E R M G R O W T H
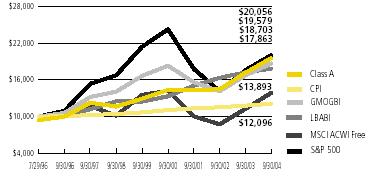
Comparison of a $10,000 investment in the Evergreen Asset Allocation Fund Class A shares, versus a similar investment in the GMO Global Balanced Index (GMOGBI), the Lehman Brothers Aggregate Bond Index (LBABI), the Morgan Stanley Capital International All Country World Free Index excluding U.S. (MSCI ACWI Free), the Standard & Poor's 500 Index (S&P 500) and the Consumer Price Index (CPI).
The GMOGBI, the LBABI, the MSCI ACWI Free and the S&P 500 are unmanaged market indexes and do not include transaction costs associated with buying and selling securities, any mutual fund expenses or any taxes. The CPI is a commonly used measure of inflation and does not represent an investment return. It is not possible to invest directly in an index.
Class I shares are only offered to investment advisory clients of an investment advisor of an Evergreen fund (or its advisory affiliates), through special arrangements entered into on behalf of Evergreen funds with certain financial services firms, certain institutional investors and persons who owned Class Y shares in registered name in an Evergreen fund on or before December 31, 1994. Class I shares are only available to institutional shareholders with a minimum $1 million investment.
Class R shares generally are available only to 401(k) plans, 457 plans, employer-sponsored 403(b) plans, profit sharing and money purchase pension plans, defined benefit plans and non-qualified deferred compensation plans.
The fund's investment objective is nonfundamental and may be changed without the vote of the fund's shareholders.
Foreign investments may contain more risk due to the inherent risks associated with changing political climates, foreign market instability and foreign currency fluctuations. Risks of international investing are magnified in emerging or developing markets.
Smaller capitalization stock investing may offer the potential for greater long-term results; however, it is also generally associated with greater price volatility due to the higher risk of failure.
The return of principal is not guaranteed due to fluctuation in the NAV of the fund caused by changes in the price of the individual bonds held by the underlying funds and the buying and selling of bonds by the underlying funds. Bond funds have the same inflation, interest rate and credit risks that are associated with the individual bonds held by the underlying funds.
All data is as of September 30, 2004, and subject to change.
5
ABOUT YOUR FUND'S EXPENSES
The Example below is intended to describe the fees and expenses borne by shareholders and the impact of those costs on your investment.
Example
As a shareholder of the fund, you incur two types of costs: (1) transaction costs, including sales charges (loads), redemption fees and exchange fees; and (2) ongoing costs, including management fees, distribution (12b-1) fees and other fund expenses. This Example is intended to help you understand your ongoing costs (in dollars) of investing in the fund and to compare these costs with the ongoing costs of investing in other mutual funds. The Example is based on an investment of $1,000 invested at the beginning of the period and held for the entire period from April 1, 2004 to September 30, 2004.
The example illustrates your fund's costs in two ways:
- Actual expenses
The section in the table under the heading "Actual" provides information about actual account valuesand actual expenses. You may use the information in these columns, together with the amount youinvested, to estimate the expenses that you paid over the period. Simply divide your account valueby $1,000 (for example, an $8,600 account value divided by $1,000 = 8.6), then multiply the resultby the number in the appropriate column for your share class, in the column entitled "Expenses PaidDuring Period" to estimate the expenses you paid on your account during this period. - Hypothetical example for comparison purposes
The section in the table under the heading "Hypothetical (5% return before expenses)" providesinformation about hypothetical account values and hypothetical expenses based on the fund's actualexpense ratio and an assumed rate of return of 5% per year before expenses, which is not the fund'sactual return. The hypothetical account values and expenses may not be used to estimate the actualending account balance or expenses you paid for the period. You may use this information tocompare the ongoing costs of investing in the fund and other funds. To do so, compare this 5%hypothetical example with the 5% hypothetical examples that appear in the shareholder reportsof the other funds.
Please note that the expenses shown in the table are meant to highlight your ongoing costs only and do not reflect any transactional costs, such as sales charges (loads), redemption fees or exchange fees. Therefore, the section in the table under the heading "Hypothetical (5% return before expenses)" is useful in comparing ongoing costs only, and will not help you determine the relative total costs of owning different funds. In addition, if these transactional costs were included, your costs would have been higher.
| | | | | | |
| | | Beginning | | Ending | | |
| | | Account | | Account | | Expenses |
| | | Value | | Value | | Paid During |
| | | 4/1/2004 | | 9/30/2004 | | Period* |
|
| Actual | | | | | | |
| Class A | | $1,000.00 | | $1,003.08 | | $5.02 |
| Class B | | $1,000.00 | | $ 999.22 | | $8.52 |
| Class C | | $1,000.00 | | $ 999.21 | | $8.52 |
| Class I | | $1,000.00 | | $1,003.84 | | $3.52 |
| Class R | | $1,000.00 | | $1,002.31 | | $5.32 |
| Hypothetical | | | | | | |
| (5% return | | | | | | |
| before expenses) | | | | | | |
| Class A | | $1,000.00 | | $1,020.05 | | $5.06 |
| Class B | | $1,000.00 | | $1,016.55 | | $8.59 |
| Class C | | $1,000.00 | | $1,016.55 | | $8.59 |
| Class I | | $1,000.00 | | $1,021.56 | | $3.55 |
| Class R | | $1,000.00 | | $1,019.75 | | $5.37 |
|
| * | For each class of the Fund, expenses are equal to the annualized expense ratio of each class (1.00% for Class A, 1.70% for Class B, 1.70% for Class C, 0.70% for Class I and 1.06% for Class R), multiplied by the average account value over the period, multiplied by 183 / 365 days. |
| |
6
ABOUT YOUR FUND'S EXPENSES continued
Because the Fund invests primarily in other mutual funds, the Fund incurs fees and expenses indirectly as a shareholder of the underlying funds. The example below is intended to describe the fees and expenses borne by the shareholders including the indirect expenses of the underlying funds and the impact of those costs on your investment.
| | | | | | |
| | | Beginning | | Ending | | |
| | | Account | | Account | | Expenses |
| | | Value | | Value | | Paid During |
| | | 4/1/2004 | | 9/30/2004 | | Period* |
|
| Actual | | | | | | |
| Class A | | $1,000.00 | | $1,003.08 | | $ 7.78 |
| Class B | | $1,000.00 | | $ 999.22 | | $11.28 |
| Class C | | $1,000.00 | | $ 999.21 | | $11.28 |
| Class I | | $1,000.00 | | $1,003.84 | | $ 6.28 |
| Class R | | $1,000.00 | | $1,002.31 | | $ 8.08 |
| Hypothetical | | | | | | |
| (5% return | | | | | | |
| before expenses) | | | | | | |
| Class A | | $1,000.00 | | $1,017.30 | | $ 7.84 |
| Class B | | $1,000.00 | | $1,013.79 | | $11.36 |
| Class C | | $1,000.00 | | $1,013.79 | | $11.36 |
| Class I | | $1,000.00 | | $1,018.80 | | $ 6.33 |
| Class R | | $1,000.00 | | $1,017.00 | | $ 8.14 |
|
| * | The expense ratios include the fund's direct operating expenses as of 9/30/2004 and the indirect expenses of the underlying funds in which the fund invests as of 3/31/2004. The indirect expenses were estimated to be 0.55%. For each class of the Fund, expenses are equal to the annualized expense ratio of each class (1.55% for Class A, 2.25% for Class B, 2.25% for Class C, 1.25% for Class I and 1.61% for Class R), multiplied by the average account value over the period, multiplied by 183 / 365 days. |
| |
7
FINANCIAL HIGHLIGHTS
(For a share outstanding throughout each period)
| | | | | | | | | | | | | | |
| | | | | | | | | | | | | | | |
| | | Six Months
Ended | | Year Ended March 31, | | Year Ended February 28, |
| | September
30, 2004 | |
| |
|
| CLASS A | | (unaudited) | | 2004 1 | | 2003 1,2 | | 2003 3 | | 2002 1,3 | | 2001 3 | | 2000 3 |
|
| Net asset value, beginning of period | | $ 12.97 | | $ 9.91 | | $ 9.98 | | $ 10.77 | | $ 10.80 | | $ 10.78 | | $ 10.51 |
|
| Income from investment operations | | | | | | | | | | | | | | |
| Net investment income (loss) | | 0.01 | | 0.26 | | (0.01) | | 0.16 | | 0.43 | | 0.47 | | 0.44 |
| Net realized and unrealized gains | | | | | | | | | | | | | | |
| or losses on investments | | 0.03 | | 3.02 | | (0.06 ) | | (0.49 ) | | 0.04 | | 0.60 | | 0.91 |
| |
| |
| |
| |
| |
| |
| |
|
| Total from investment operations | | 0.04 | | 3.28 | | (0.07) | | (0.33) | | 0.47 | | 1.07 | | 1.35 |
|
| Distributions to shareholders from | | | | | | | | | | | | | | |
| Net investment income | | 0 | | (0.21 ) | | 0 | | (0.42 ) | | (0.50 ) | | (0.82 ) | | (0.43 ) |
| Net realized gains | | 0 | | (0.01) | | 0 | | (0.04) | | 0 | | (0.23) | | (0.65) |
| |
| |
| |
| |
| |
| |
| |
|
| Total distributions to shareholders | | 0 | | (0.22) | | 0 | | (0.46) | | (0.50) | | (1.05) | | (1.08) |
|
| Net asset value, end of period | | $ 13.01 | | $ 12.97 | | $ 9.91 | | $ 9.98 | | $ 10.77 | | $ 10.80 | | $ 10.78 |
|
| Total return 4 | | 0.31% | | 33.15% | | (0.70%) | | (3.16%) | | 4.43% | | 10.12% | | 12.77% |
|
| Ratios and supplemental data | | | | | | | | | | | | | | |
| Net assets, end of period (thousands) | | $1,174,705 | | $722,977 | | $25,019 | | $13,879 | | $130,926 | | $112,704 | | $119,075 |
| Ratios to average net assets | | | | | | | | | | | | | | |
| Expenses 5,6 | | 1.00% 7 | | 1.17% | | 1.16% 7 | | 0.02% | | 0.00% | | 0.00% | | 0.00% |
| Net investment income (loss) | | 0.22% 7 | | 1.03% | | (1.12%) 7 | | 2.51% | | 4.00% | | 4.13% | | 4.18% |
| Portfolio turnover rate | | 5% | | 16% | | 0% | | 28% | | 16% | | 26% | | 26% |
|
| 1 Net investment income (loss) per share is based on average shares outstanding during the period. |
| 2 For the one month ended March 31, 2003. The Fund changed its fiscal year end from February 28 to March 31, effective March 31, 2003. |
| 3 Effective at the close of business on October 2, 2002, Evergreen Asset Allocation Fund acquired the net assets of GMO Global Balanced Allocation Fund ("GMO Fund"). GMO Fund was the accounting |
| and performance survivor in this transaction. The financial highlights for the periods prior to October 3, 2002 are those of C lass III of GMO Fund. |
| 4 Excluding applicable sales charges |
| 5 Excludes expenses incurred indirectly through investment in underlying funds |
| 6 The ratio of expenses to average net assets excludes expense reductions but includes fee waivers and/or expense reimbursements. |
| 7 Annualized |
See Notes to Financial Statements
8
FINANCIAL HIGHLIGHTS
(For a share outstanding throughout each period)
| | | | | | | | |
| | | Six Months Ended | | Year EndedMarch 31, | | |
| | | September 30, 2004 | |
| | Year Ended |
| CLASS B | | (unaudited) | | 2004 1 | | 2003 1,2 | | February 28, 2003 1,3 |
|
| Net asset value, beginning of period | | $ 12.87 | | $ 9.87 | | $ 9.94 | | $ 10.00 |
|
| Income from investment operations | | | | | | | | |
| Net investment income (loss) | | (0.03) | | 0.19 | | (0.01) | | (0.06) |
Net realized and unrealized gains
or losses on investments | | 0.02 | | 2.99 | | (0.06 ) | | 0.28 |
| |
| |
| |
| |
|
| Total from investment operations | | (0.01) | | 3.18 | | (0.07) | | 0.22 |
|
| Distributions to shareholders from | | | | | | | | |
| Net investment income | | 0 | | (0.17 ) | | 0 | | (0.28 ) |
| Net realized gains | | 0 | | (0.01) | | 0 | | 0 |
| |
| |
| |
| |
|
| Total distributions to shareholders | | 0 | | (0.18) | | 0 | | (0.28) |
|
| Net asset value, end of period | | $ 12.86 | | $ 12.87 | | $ 9.87 | | $ 9.94 |
|
| Total return 4 | | (0.08%) | | 32.30% | | (0.70%) | | 2.17% |
|
| Ratios and supplemental data | | | | | | | | |
| Net assets, end of period (thousands) | | $950,947 | | $668,013 | | $43,477 | | $23,364 |
| Ratios to average net assets | | | | | | | | |
| Expenses 5,6 | | 1.70% 7 | | 1.88% | | 1.89% 7 | | 1.88% 7 |
| Net investment income (loss) | | (0.48%) 7 | | 0.44% | | (1.85%) 7 | | (1.46%) 7 |
| Portfolio turnover rate | | 5% | | 16% | | 0% | | 28% |
|
| 1 Net investment income (loss) per share is based on average shares outstanding during the period. |
| 2 For the one month ended March 31, 2003. The Fund changed its fiscal year end from February 28 to March 31, effective March 31, 2003. |
| 3 For the period from October 3, 2002 (commencement of class operations), to February 28, 2003. |
| 4 Excluding applicable sales charges |
| 5 Excludes expenses incurred indirectly through investment in underlying funds |
| 6 The ratio of expenses to average net assets excludes expense reductions but includes fee waivers and/or expense reimbursements. |
| 7 Annualized |
See Notes to Financial Statements
9
FINANCIAL HIGHLIGHTS
(For a share outstanding throughout each period)
| | | | | | | | | | |
| | | | | Year Ended March 31, | | |
| | | September 30, 2004 | |
| | Year Ended |
| CLASS C | | (unaudited)1 | | 2004 1 | | 2003 1,2 | | February 28, 2003 1,3 |
|
| Net asset value, beginning of period | | $ | | 12.67 | | $ 9.72 | | $ 9.80 | | $ 10.00 |
|
| Income from investment operations | | | | | | | | | | |
| Net investment income (loss) | | | | (0.03) | | 0.18 | | (0.01) | | (0.07) |
Net realized and unrealized gains
or losses on investments | | | | 0.02 | | 2.96 | | (0.07 ) | | 0.30 |
| | | |
| |
| |
| |
|
| Total from investment operations | | | | (0.01) | | 3.14 | | (0.08) | | 0.23 |
|
| Distributions to shareholders from | | | | | | | | | | |
| Net investment income | | | | 0 | | (0.18 ) | | 0 | | (0.43 ) |
| Net realized gains | | | | 0 | | (0.01) | | 0 | | 0 |
| | | |
| |
| |
| |
|
| Total distributions to shareholders | | | | 0 | | (0.19) | | 0 | | (0.43) |
|
| Net asset value, end of period | | $ | | 12.66 | | $ 12.67 | | $ 9.72 | | $ 9.80 |
|
| Total return 4 | | | | (0.08%) | | 32.36% | | (0.82%) | | 2.27% |
|
| Ratios and supplemental data | | | | | | | | | | |
| Net assets, end of period (thousands) | | $ | | 1,243,817 | | $849,900 | | $22,566 | | $12,306 |
| Ratios to average net assets | | | | | | | | | | |
| Expenses 5,6 | | | | 1.70% 7 | | 1.88% | | 1.90% 7 | | 1.86% 7 |
| Net investment income (loss) | | | | (0.48%) 7 | | 0.37% | | (1.86%) 7 | | (1.76%) 7 |
| Portfolio turnover rate | | | | 5% | | 16% | | 0% | | 28% |
|
| 1 Net investment income (loss) per share is based on average shares outstanding during the period. |
| 2 For the one month ended March 31, 2003. The Fund changed its fiscal year end from February 28 to March 31, effective March 31, 2003. |
| 3 For the period from October 3, 2002 (commencement of class operations), to February 28, 2003. |
| 4 Excluding applicable sales charges |
| 5 Excludes expenses incurred indirectly through investment in underlying funds |
| 6 The ratio of expenses to average net assets excludes expense reductions but includes fee waivers and/or expense reimbursements. |
| 7 Annualized |
See Notes to Financial Statements
10
FINANCIAL HIGHLIGHTS
(For a share outstanding throughout each period)
| | | | | | | | |
| | | Six Months Ended | | Year Ended March 31, | | |
| | | September 30, 2004 | |
| | Year Ended |
| CLASS I | | (unaudited) 1 | | 2004 1 | | 2003 1,2 | | February 28, 2003 3 |
|
| Net asset value, beginning of period | | $ 13.02 | | $ 9.92 | | $ 9.98 | | $10.00 |
|
| Income from investment operations | | | | | | | | |
| Net investment income (loss) | | 0.03 | | 0.30 | | (0.01) | | 0.29 |
Net realized and unrealized gains
or losses on investments | | 0.02 | | 3.03 | | (0.05 ) | | (0.05 ) |
| |
| |
| |
| |
|
| Total from investment operations | | 0.05 | | 3.33 | | (0.06) | | 0.24 |
|
| Distributions to shareholders from | | | | | | | | |
| Net investment income | | 0 | | (0.22) | | 0 | | (0.26) |
| Net realized gains | | 0 | | (0.01) | | 0 | | 0 |
| |
| |
| |
| |
|
| Total distributions to shareholders | | 0 | | (0.23) | | 0 | | (0.26) |
|
| Net asset value, end of period | | $ 13.07 | | $ 13.02 | | $ 9.92 | | $ 9.98 |
|
| Total return | | 0.38% | | 33.65% | | (0.60%) | | 2.41% |
|
| Ratios and supplemental data | | | | | | | | |
| Net assets, end of period (thousands) | | $62,551 | | $46,970 | | $15,039 | | $ 22 |
| Ratios to average net assets | | | | | | | | |
| Expenses 4,5 | | 0.70% 6 | | 0.88% | | 0.91% 6 | | 0.91% 6 |
| Net investment income (loss) | | 0.51% 6 | | 1.56% | | (0.87%) 6 | | 7.00% 6 |
| Portfolio turnover rate | | 5% | | 16% | | 0% | | 28% |
|
| 1 Net investment income (loss) per share is based on average shares outstanding during the period. |
| 2 For the one month ended March 31, 2003. The Fund changed its fiscal year end from February 28 to March 31, effective March 31, 2003. |
| 3 For the period from October 3, 2002 (commencement of class operations), to February 28, 2003. |
| 4 Excludes expenses incurred indirectly through investment in underlying funds |
| 5 The ratio of expenses to average net assets excludes expense reductions but includes fee waivers and/or expense reimbursements. |
| 6 Annualized |
See Notes to Financial Statements
11
FINANCIAL HIGHLIGHTS
(For a share outstanding throughout each period)
| | | | |
| | | Six Months Ended | | |
| | | September 30, 2004 | | Year Ended |
| CLASS R | | (unaudited) 1 | | March 31, 2004 1,2 |
|
| Net asset value, beginning of period | | $12.96 | | $11.95 |
|
| Income from investment operations | | | | |
| Net investment income | | 0.02 | | 0.07 |
Net realized and unrealized gains
or losses on investments | | 0.01 | | 1.16 |
| |
| |
|
| Total from investment operations | | 0.03 | | 1.23 |
|
| Distributions to shareholders from | | | | |
| Net investment income | | 0 | | (0.21) |
| Net realized gains | | 0 | | (0.01) |
| |
| |
|
| Total distributions to shareholders | | 0 | | (0.22) |
|
| Net asset value, end of period | | $12.99 | | $12.96 |
|
| Total return | | 0.23% | | 10.32% |
|
| Ratios and supplemental data | | | | |
| Net assets, end of period (thousands) | | $ 3 | | $ 1 |
| Ratios to average net assets | | | | |
| Expenses 3,4 | | 1.06% 5 | | 1.20% 5 |
| Net investment income | | 0.24% 5 | | 1.28% 5 |
| Portfolio turnover rate | | 5% | | 16% |
|
| 1 Net investment income per share is based on average shares outsta nding during the period. |
| 2 For the period from October 10, 2003 (commen cement of class operations), to March 31, 2004. |
| 3 Excludes expenses incurred indirectly though investment in underlying funds |
| 4 The ratio of expenses to average net assets excludes expense reductions but includes fee waivers and/or expense reimbursements. |
| 5 Annualized |
See Notes to Financial Statements
12
SCHEDULE OF INVESTMENTS
September 30, 2004 (unaudited)
| | | | |
| | | Shares | | Value |
|
| |
| MUTUAL FUND SHARES 99.1% | | | | |
| U.S. FIXED INCOME 28.3% | | | | |
| GMO Core Plus Bond Fund, Class III | | 41,325,166 | | $ 435,154,003 |
| GMO Domestic Bond Fund, Class III | | 42,394,581 | | 427,761,325 |
| GMO Inflation Indexed Bond Fund, Class III | | 8,982,782 | | 107,703,555 |
| GMO Short Duration Investment Fund, Class III | | 899 | | 7,917 |
| | | |
|
| | | | | 970,626,800 |
| | | |
|
| INTERNATIONAL FIXED INCOME 7.4% | | | | |
| GMO Currency Hedged International Bond Fund, Class III | | 14,139,437 | | 131,779,557 |
| GMO Emerging Country Debt Fund, Class IV | | 5,114,082 | | 57,022,016 |
| GMO International Bond Fund, Class III | | 6,254,578 | | 63,546,508 |
| | | |
|
| | | | | 252,348,081 |
| | | |
|
| U.S. EQUITY 28.8% | | | | |
| GMO Real Estate Fund, Class III | | 7,606,877 | | 101,780,012 |
| GMO U.S. Core Fund, Class VI | | 48,638,249 | | 641,052,119 |
| GMO U.S. Quality Equity Fund, Class IV | | 12,664,060 | | 246,189,334 |
| | | |
|
| | | | | 989,021,465 |
| | | |
|
| INTERNATIONAL EQUITY 34.6% | | | | |
| GMO Alpha Only Fund, Class III | | 7,442,706 | | 75,096,907 |
| GMO Currency Hedged International Equity Fund, Class III | | 23,116,613 | | 175,455,094 |
| GMO Emerging Markets Fund, Class VI | | 14,035,579 | | 219,797,161 |
| GMO Emerging Markets Quality Fund, Class VI | | 3,227,343 | | 20,913,180 |
| GMO International Growth Fund, Class III | | 11,785,276 | | 279,428,902 |
| GMO International Intrinsic Value Fund, Class IV | | 11,433,628 | | 290,185,484 |
| GMO International Small Companies Fund, Class III | | 7,591,303 | | 127,002,496 |
| | | |
|
| | | | | 1,187,879,224 |
| | | |
|
Total Mutual Fund Shares (cost $3,229,085,664)
| | | | 3,399,875,570 |
| | | |
|
| SHORT-TERM INVESTMENTS 0.1% | | | | |
| MUTUAL FUND SHARES 0.1% | | | | |
| Evergreen Institutional Money Market Fund ø (cost $4,665,099) | | 4,665,099 | | 4,665,099 |
| | | |
|
| Total Investments (cost $3,233,750,763) 99.2% | | | | 3,404,540,669 |
| Other Assets and Liabilities 0.8% | | | | 27,482,472 |
| | | |
|
| Net Assets 100.0% | | | | $ 3,432,023,141 |
| | | |
|
ø Evergreen Investment Management Company, LLC is the investment advisor to both the Fund and the money market fund.
The following table shows portfolio composition as a percent of total investments as of September 30, 2004:
| | |
| Equity Mutual Fund Shares | | 64.0% |
| Fixed Income Mutual Fund Shares | | 35.9% |
| Cash Equivalents | | 0.1% |
| |
|
| | | 100.0% |
| | |
|
See Notes to Financial Statements
13
STATEMENT OF ASSETS AND LIABILITIES
September 30, 2004 (unaudited)
| | | | |
| Assets | | | | |
| Investments at value (cost $3,233,750,763) | | $ | | 3,404,540,669 |
| Receivable for Fund shares sold | | | | 33,446,675 |
| Prepaid expenses and other assets | | | | 618,596 |
|
| Total assets | | | | 3,438,605,940 |
|
| Liabilities | | | | |
| Payable for Fund shares redeemed | | | | 6,274,530 |
| Advisory fee payable | | | | 38,228 |
| Distribution Plan expenses payable | | | | 69,489 |
| Due to other related parties | | | | 10,077 |
| Accrued expenses and other liabilities | | | | 190,475 |
|
| Total liabilities | | | | 6,582,799 |
|
| Net assets | | $ | | 3,432,023,141 |
|
| Net assets represented by | | | | |
| Paid-in capital | | $ | | 3,232,557,483 |
| Undistributed net investment loss | | | | (3,288,236) |
| Accumulated net realized gains on investments | | | | 31,963,988 |
| Net unrealized gains on investments | | | | 170,789,906 |
|
| Total net assets | | $ | | 3,432,023,141 |
|
| Net assets consists of | | | | |
| Class A | | $ | | 1,174,704,924 |
| Class B | | | | 950,946,912 |
| Class C | | | | 1,243,817,312 |
| Class I | | | | 62,551,265 |
| Class R | | | | 2,728 |
|
| Total net assets | | $ | | 3,432,023,141 |
|
| Shares outstanding | | | | |
| Class A | | | | 90,299,556 |
| Class B | | | | 73,959,516 |
| Class C | | | | 98,244,929 |
| Class I | | | | 4,784,247 |
| Class R | | | | 210 |
|
| Net asset value per share | | | | |
| Class A | | $ | | 13.01 |
| Class A - Offering price (based on sales charge of 5.75%) | | $ | | 13.80 |
| Class B | | $ | | 12.86 |
| Class C | | $ | | 12.66 |
| Class I | | $ | | 13.07 |
| Class R | | $ | | 12.99 |
|
See Notes to Financial Statements
14
STATEMENT OF OPERATIONS
Six Months Ended September 30, 2004 (unaudited)
| | | | |
| Investment income | | | | |
| Dividends from investment company shares | | $ | | 17,387,443 |
|
| Expenses | | | | |
| Advisory fee | | | | 6,024,973 |
| Distribution Plan expenses | | | | |
| Class A | | | | 1,419,696 |
| Class B | | | | 4,052,603 |
| Class C | | | | 5,177,657 |
| Class R | | | | 4 |
| Administrative services fee | | | | 1,422,359 |
| Transfer agent fees | | | | 1,956,442 |
| Trustees' fees and expenses | | | | 17,007 |
| Printing and postage expenses | | | | 71,171 |
| Custodian and accounting fees | | | | 342,784 |
| Registration and filing fees | | | | 137,614 |
| Professional fees | | | | 11,227 |
| Other | | | | 34,650 |
|
| Total expenses | | | | 20,668,187 |
| Less: Expense reductions | | | | (5,024) |
| Fee waivers | | | | (7,542) |
|
| Net expenses | | | | 20,655,621 |
|
| Net investment loss | | | | (3,268,178) |
|
| Net realized and unrealized gains or losses on investments | | | | |
| Net realized gains or losses on: | | | | |
| Sale of investment company shares | | | | (4,552,969) |
| Capital gain distributions from investment company shares | | | | 37,247,803 |
|
| Net realized gains on investments | | | | 32,694,834 |
| Net change in unrealized gains or losses on investments | | | | (851,973) |
|
| Net realized and unrealized gains or losses on investments | | | | 31,842,861 |
|
| Net increase in net assets resulting from operations | | $ | | 28,574,683 |
|
See Notes to Financial Statements
15
STATEMENTS OF CHANGES IN NET ASSETS
| | | | | | | | |
| | | Six Months Ended | | | | |
| | | September 30, 2004 | | Year Ended |
| | | (unaudited) | | March 31, 2004(a) |
|
| Operations | | | | | | | | |
| Net investment income (loss) | | $ | | (3,268,178) | | $ | | 5,336,364 |
| Net realized gains on investments | | | | 32,694,834 | | | | 11,681,803 |
| Net change in unrealized gains or | | | | | | | | |
| losses on investments | | | | (851,973) | | | | 172,281,491 |
|
| Net increase in net assets resulting | | | | | | | | |
| from operations | | | | 28,574,683 | | | | 189,299,658 |
|
| Distributions to shareholders from | | | | | | | | |
| Net investment income | | | | | | | | |
| Class A | | | | 0 | | | | (6,267,950) |
| Class B | | | | 0 | | | | (6,117,076) |
| Class C | | | | 0 | | | | (6,935,829) |
| Class I | | | | 0 | | | | (581,933) |
| Class R | | | | 0 | | | | (17) |
| Net realized gains | | | | | | | | |
| Class A | | | | 0 | | | | (226,443) |
| Class B | | | | 0 | | | | (266,578) |
| Class C | | | | 0 | | | | (289,475) |
| Class I | | | | 0 | | | | (19,866) |
| Class R | | | | 0 | | | | (1) |
|
| Total distributions to shareholders | | | | 0 | | | | (20,705,168) |
|
| | | Shares | | | | Shares | | |
| Capital share transactions | | | | | | | | |
| Proceeds from shares sold | | | | | | | | |
| Class A | | 40,922,139 | | 518,229,709 | | 55,309,819 | | 677,203,879 |
| Class B | | 25,722,544 | | 323,006,273 | | 49,136,496 | | 584,123,724 |
| Class C | | 35,726,879 | | 441,733,704 | | 66,378,036 | | 792,173,565 |
| Class I | | 1,559,857 | | 19,794,848 | | 2,452,448 | | 29,634,885 |
| Class R | | 126 | | 1,613 | | 84 | | 1,222 |
|
| | | | | 1,302,766,147 | | | | 2,083,137,275 |
|
| Net asset value of shares issued in | | | | | | | | |
| reinvestment of distributions | | | | | | | | |
| Class A | | 0 | | 0 | | 438,266 | | 5,425,742 |
| Class B | | 0 | | 0 | | 472,100 | | 5,806,831 |
| Class C | | 0 | | 0 | | 436,202 | | 5,282,408 |
| Class I | | 0 | | 0 | | 11,913 | | 147,954 |
|
| Total | | | | 0 | | | | 16,662,935 |
|
| Automatic conversion of Class B | | | | | | | | |
| shares to Class A shares | | | | | | | | |
| Class A | | 535,202 | | 6,795,903 | | 358,367 | | 4,430,386 |
| Class B | | (540,572) | | (6,795,903) | | (361,095) | | (4,430,386) |
|
| | | | | 0 | | | | 0 |
|
| Payment for shares redeemed | | | | | | | | |
| Class A | | (6,883,643) | | (86,868,393) | | (2,905,387) | | (35,841,664) |
| Class B | | (3,136,927) | | (39,312,644) | | (1,739,927) | | (21,224,236) |
| Class C | | (4,560,259) | | (56,103,484) | | (2,056,681) | | (24,979,025) |
| Class I | | (383,275) | | (4,893,728) | | (372,278) | | (4,590,459) |
|
| | | | | (187,178,249) | | | | (86,635,384) |
|
| Net increase in net assets resulting | | | | | | | | |
| from capital share transactions | | | | 1,115,587,898 | | | | 2,013,164,826 |
|
| Total increase in net assets | | | | 1,144,162,581 | | | | 2,181,759,316 |
| Net assets | | | | | | | | |
| Beginning of period | | | | 2,287,860,560 | | | | 106,101,244 |
|
| End of period | | $ | | 3,432,023,141 | | $ | | 2,287,860,560 |
|
| Undistributed (overdistributed) | | | | | | | | |
| net investment income (loss) | | $ | | (3,288,236) | | $ | | (20,058) |
|
(a) For Class R shares, for the period from October 10, 2003 (commencement of class operations), to March 31, 2004.
See Notes to Financial Statements
16
NOTES TO FINANCIAL STATEMENTS (unaudited)
1 . O R G A N I Z AT I O N
Evergreen Asset Allocation Fund (the "Fund") is a diversified series of Evergreen Equity Trust (the "Trust"), a Delaware statutory trust organized on September 18, 1997. The Trust is an open-end management investment company registered under the Investment Company Act of 1940, as amended (the "1940 Act").
The Fund operates as a "fund of funds" which invests in shares of GMO-managed mutual funds ("underlying funds"). Each underlying fund's accounting policies are outlined in the underlying fund's financial statements, which are available upon request.
The Fund offers Class A, Class B, Class C, Class R and Institutional ("Class I") shares. Class A shares are sold with a front-end sales charge. However, Class A share investments of $1 million or more are not subject to a front-end sales charge but will be subject to a contingent deferred sales charge of 1.00% upon redemption within one year. Class B shares are sold without a front-end sales charge but are subject to a contingent deferred sales charge that is payable upon redemption and decreases depending on how long the shares have been held. Effective February 2, 2004, Class C shares are no longer sold with a front-end sales charge but are still subject to a contingent deferred sales charge that is payable upon redemption within one year. Class R shares are only available to participants in certain retirement plans and are sold without a front-end sales charge or contingent deferred sales charge. Class I shares are sold without a front-end sales charge or contingent deferred sales charge. Each class of shares, except Class I shares, pays an ongoing distribution fee.
2 . S I G N I F I C A N T A C C O U N T I N G P O L I C I E S
The following is a summary of significant accounting policies consistently followed by the Fund in the preparation of its financial statements. The policies are in conformity with generally accepted accounting principles in the United States of America, which require management to make estimates and assumptions that affect amounts reported herein. Actual results could differ from these estimates.
a. Valuation of investments
Investments in the underlying funds are valued at the net asset value per share as reported by the underlying funds as of the close of the regular trading on the New York Stock Exchange on each day the exchange is open for trading.
Short-term investments in other mutual funds are also valued at net asset value.
b. Investment transactions and investment income
Investment transactions are recorded on trade date. Income dividends and capital gain distributions from underlying funds are recorded on the ex-dividend date. Realized gains and losses from investment transactions are determined on the identified cost basis.
17
NOTES TO FINANCIAL STATEMENTS (unaudited) continued
c. Federal taxes
The Fund intends to continue to qualify as a regulated investment company and distribute all of its taxable income, including any net capital gains (which have already been offset by available capital loss carryovers). Accordingly, no provision for federal taxes is required.
d. Distributions
Distributions to shareholders from net investment income and net realized gains, if any, are recorded on the ex-dividend date. Such distributions are determined in conformity with income tax regulations, which may differ from generally accepted accounting principles.
e. Class allocations
Income, common expenses and realized and unrealized gains and losses are allocated to the classes based on the relative net assets of each class. Distribution fees, if any, are calculated daily at the class level based on the appropriate net assets of each class and the specific expense rates applicable to each class.
3 . A D V I S O RY F E E A N D O T H E R T R A N S A C T I O N S W I T H A F F I L I AT E S
Evergreen Investment Management Company, LLC ("EIMC"), an indirect, wholly-owned subsidiary of Wachovia Corporation ("Wachovia"), is the investment advisor to the Fund and is paid an annual fee starting at 0.49% and declining to 0.35% as average daily net assets increase.
Grantham, Mayo, Van Otterloo & Co. LLC ("GMO") is the investment sub-advisor to the Fund. GMO does not receive a direct fee from the Fund for its services. However, the Fund incurs fees and expenses indirectly as a shareholder of the underlying GMO-managed funds, including its indirect share of management or other fees paid to GMO.
From time to time, EIMC may voluntarily or contractually waive its fee and/or reimburse expenses in order to limit operating expenses. For fee waivers and/or reimbursements made after January 1, 2003, EIMC may recoup certain amounts waived and/or reimbursed up to a period of three years following the end of the fiscal year in which the fee waivers and/or reimbursements were made. During the six months ended September 30, 2004, EIMC waived its fee in the amount of $7,542. As of September 30, 2004 the Fund has $75,486 in advisory fee waivers and expense reimbursements subject to recoupment.
Evergreen Investment Services, Inc. ("EIS"), an indirect, wholly-owned subsidiary of Wachovia, is the administrator to the Fund. As administrator, EIS provides the Fund with facilities, equipment and personnel and is paid an annual rate determined by applying percentage rates to the aggregate average daily net assets of the Evergreen funds (excluding money market funds), starting at 0.10% and declining to 0.05% as the aggregate average daily net assets of the Evergreen funds (excluding money market funds) increase.
18
NOTES TO FINANCIAL STATEMENTS (unaudited) continued
Evergreen Service Company, LLC ("ESC"), an indirect, wholly-owned subsidiary of Wachovia, is the transfer and dividend disbursing agent for the Fund. ESC receives account fees that vary based on the type of account held by the shareholders in the Fund. For the six months ended September 30, 2004, the transfer agent fees were equivalent to an annual rate of 0.14% of the Fund's average daily net assets.
4 . D I S T R I B U T I O N P L A N S
EIS also serves as distributor of the Fund's shares. Prior to May 1, 2004, Evergreen Distributor, Inc., a wholly-owned subsidiary of BISYS Fund Services, Inc., served as the Fund's distributor.
The Fund has adopted Distribution Plans, as allowed by Rule 12b-1 of the 1940 Act, for each class of shares, except Class I. Under the Distribution Plans, distribution fees are paid at an annual rate of 0.30% of the average daily net assets for Class A shares, 0.50% of the average daily net assets for Class R shares and 1.00% of the average daily net assets for each of Class B and Class C shares.
For the six months ended September 30, 2004, EIS received $837,825 from the sale of Class A shares and $1,096, $890,494 and $207,236 in contingent deferred sales charges from redemptions of Class A, Class B and Class C shares, respectively.
5 . I N V E S T M E N T T R A N S A C T I O N S
Cost of purchases and proceeds from sales of investment securities (excluding short-term investments) were $1,319,510,955 and $151,319,623, respectively, for the six months ended September 30, 2004.
On September 30, 2004, the aggregate cost of investments for federal income tax purposes was $3,234,524,011. The gross unrealized appreciation and depreciation on investments based on tax cost was $174,623,352 and $4,606,694, respectively, with a net unrealized appreciation of $170,016,658.
6 . I N T E R F U N D L E N D I N G
Pursuant to an Exemptive Order issued by the SEC, the Fund may participate in an interfund lending program with certain funds in the Evergreen fund family. This program allows the Fund to borrow from, or lend money to, other participating funds. During the six months ended September 30, 2004, the Fund did not participate in the interfund lending program.
7 . E X P E N S E R E D U C T I O N S
Through expense offset arrangements with ESC and the Fund's custodian, a portion of fund expenses has been reduced.
19
NOTES TO FINANCIAL STATEMENTS (unaudited) continued
8 . D E F E R R E D T R U S T E E S ' F E E S
Each Trustee of the Fund may defer any or all compensation related to performance of their duties as Trustees. The Trustees' deferred balances are allocated to deferral accounts, which are included in the accrued expenses for the Fund. The investment performance of the deferral accounts are based on the investment performance of certain Evergreen funds. Any gains earned or losses incurred in the deferral accounts are reported in the Fund's Trustees' fees and expenses. At the election of the Trustees, the deferral account will be paid either in one lump sum or in quarterly installments for up to ten years.
9 . F I N A N C I N G A G R E E M E N T
The Fund and certain other Evergreen funds share in a $150 million unsecured revolving credit commitment for temporary and emergency purposes, including the funding of redemptions, as permitted by each participating fund's borrowing restrictions. Borrowings under this facility bear interest at 0.50% per annum above the Federal Funds rate. All of the participating funds are charged an annual commitment fee of 0.09% of the unused balance, which is allocated pro rata. During the six months ended September 30, 2004, the Fund had no borrowings under this agreement.
1 0 . L I T I G AT I O N
From time to time, the Fund and EIMC are involved in various legal actions in the normal course of business. In EIMC's opinion, based upon the opinions of counsel, the Fund is not involved in any legal action that will have a material effect on the Fund's financial position and results of operations.
1 1 . R E G U L AT O RY M AT T E R S
Since September 2003, governmental and self-regulatory authorities have instituted numerous ongoing investigations of various practices in the mutual fund industry, including investigations relating to revenue sharing, market-timing, late trading and record retention, among other things. The investigations cover investment advisors, distributors and transfer agents to mutual funds, as well as other firms. EIMC, EIS and ESC (collectively, "Evergreen") have received subpoenas and other requests for documents and testimony relating to these investigations, are endeavoring to comply with those requests, and are cooperating with the investigations. Evergreen is continuing its own internal review of policies, practices, procedures and personnel, and is taking remedial action where appropriate.
20
NOTES TO FINANCIAL STATEMENTS (unaudited) continued
In connection with one of these investigations, on July 28, 2004, the staff of the Securities and Exchange Commission ("SEC") informed Evergreen that the staff intends to recommend to the SEC that it institute an enforcement action against Evergreen. The SEC staff's proposed allegations relate to (i) an arrangement pursuant to which a broker at one of EIMC's affiliated broker-dealers had been authorized, apparently by an EIMC officer (no longer with EIMC), to engage in short-term trading, on behalf of a client, in Evergreen Mid Cap Growth Fund (formerly Evergreen Small Company Growth Fund and prior to that, known as Evergreen Emerging Growth Fund) during the period from December 2000 through April 2003, in excess of the limitations set forth in this fund's prospectus, (ii) short-term trading from September 2001 through January 2003, by a former Evergreen portfolio manager of Evergreen Precious Metals Fund, a fund he managed at the time, (iii) the sufficiency of systems for monitoring exchanges and enforcing exchange limitations as stated in each fund's prospectuses, and (iv) the adequacy of e-mail retention practices. In connection with the activity in Evergreen Mid Cap Growth Fund, EIMC reimbursed this fund $378,905, plus an additional $25,242, representing what EIMC calculated at that time to be the client's net gain and the fees earned by EIMC and the expenses incurred by this fund on the client's account. In connection with the activity in Evergreen Precious Metals Fund, EIMC reimbursed this fund $70,878, plus an additional $3,075, representing what EIMC calculated at that time to be the portfolio manager's net gain and the fees earned by EIMC and expenses incurred by this fund on the portfolio manager's account. Evergreen currently intends to make a written Wells submission explaining why it believes that no such enforcement action should be instituted, and Evergreen also intends to engage in discussions with the staff of the SEC concerning its recommendation.
Any resolution of these matters with regulatory authorities may include, but not be limited to, sanctions, penalties or injunctions regarding Evergreen, restitution to mutual fund shareholders and/or other financial penalties and structural changes in the governance or management of Evergreen's mutual fund business. Any penalties or restitution will be paid by Evergreen and not by the Evergreen funds.
Evergreen does not believe the foregoing investigations and action will have a material adverse impact on the Evergreen funds. There can be no assurance, however, that these matters and any publicity surrounding or resulting from them will not result in reduced sales or increased redemptions of fund shares, which could increase fund transaction costs or operating expenses, or have other adverse consequences on the Evergreen funds.
21
This page left intentionally blank
22
This page left intentionally blank
23
TRUSTEES AND OFFICERS
| | |
| TRUSTEES1 | | |
| Charles A. Austin III | | Principal occupations: Investment Counselor, Anchor Capital Advisors, Inc. (investment advice); |
| Trustee | | Director, The Andover Companies (insurance); Trustee, Arthritis Foundation of New England; |
| DOB: 10/23/1934 | | Director, The Francis Ouimet Society; Former Director, Health Development Corp. (fitness- |
| Term of office since: 1991 | | wellness centers); Former Director, Mentor Income Fund, Inc.; Former Trustee, Mentor Funds and |
| | | Cash Resource Trust; Former Investment Counselor, Appleton Partners, Inc. (investment advice); |
| Other directorships: None | | Former Director, Executive Vice President and Treasurer, State Street Research & Management |
| | | Company (investment advice) |
|
| |
| Shirley L. Fulton | | Principal occupations: Partner, Helms, Henderson & Fulton, P.A. (law firm); Retired Senior |
| Trustee | | Resident Superior Court Judge, 26th Judicial District, Charlotte, NC |
| DOB: 1/10/1952 | | |
| Term of office since: 2004 | | |
| Other directorships: None | | |
|
| |
| K. Dun Gifford | | Principal occupations: Chairman and President, Oldways Preservation and Exchange Trust |
| Trustee | | (education); Trustee, Treasurer and Chairman of the Finance Committee, Cambridge College; |
| DOB: 10/23/1938 | | Former Chairman of the Board, Director, and Executive Vice President, The London Harness |
| Term of office since: 1974 | | Company (leather goods purveyor); Former Director, Mentor Income Fund, Inc.; Former Trustee, |
| | | Mentor Funds and Cash Resource Trust |
| Other directorships: None | | |
|
| |
| Dr. Leroy Keith, Jr. | | Principal occupations: Partner, Stonington Partners, Inc. (private investment firm); Trustee of |
| Trustee | | Phoenix Series Fund, Phoenix Multi-Portfolio Fund, and The Phoenix Big Edge Series Fund; |
| DOB: 2/14/1939 | | Former Chairman of the Board and Chief Executive Officer, Carson Products Company |
| Term of office since: 1983 | | (manufacturing); Director, Obagi Medical Products Co.; Director, Lincoln Educational Services; |
| | | Director, Diversapack Co.; Former President, Morehouse College; Former Director, Mentor |
| Other directorships: Trustee, | | Income Fund, Inc.; Former Trustee, Mentor Funds and Cash Resource Trust |
| Phoenix Series Fund, Phoenix | | |
| Multi-Portfolio Fund, and The | | |
| Phoenix Big Edge Series Fund | | |
|
| |
| Gerald M. McDonnell | | Principal occupations: Manager of Commercial Operations, SMI STEEL Co. – South Carolina |
| Trustee | | (steel producer); Former Sales and Marketing Management, Nucor Steel Company; Former |
| DOB: 7/14/1939 | | Director, Mentor Income Fund, Inc.; Former Trustee, Mentor Funds and Cash Resource Trust |
| Term of office since: 1988 | | |
| Other directorships: None | | |
|
| |
| William Walt Pettit | | Principal occupations: Partner and Vice President, Kellam & Pettit, P.A. (law firm); Former |
| Trustee | | Director, Mentor Income Fund, Inc.; Former Trustee, Mentor Funds and Cash Resource Trust |
| DOB: 8/26/1955 | | |
| Term of office since: 1984 | | |
| Other directorships: None | | |
|
| |
| David M. Richardson | | Principal occupations: President, Richardson, Runden LLC (executive recruitment business |
| Trustee | | development/consulting company); Consultant, Kennedy Information, Inc. (executive |
| DOB: 9/19/1941 | | recruitment information and research company); Consultant, AESC (The Association of Retained |
| Term of office since: 1982 | | Executive Search Consultants); Trustee, NDI Technologies, LLP (communications); Director, J&M |
| | | Cumming Paper Co. (paper merchandising); Former Vice Chairman, DHR International, Inc. |
| Other directorships: None | | (executive recruitment); Former Director, Mentor Income Fund, Inc.; Former Trustee, Mentor |
| | | Funds and Cash Resource Trust |
|
| |
| Dr. Russell A. Salton III | | Principal occupations: President/CEO, AccessOne MedCard; Former Medical Director, Healthcare |
| Trustee | | Resource Associates, Inc.; Former Medical Director, U.S. Health Care/Aetna Health Services; |
| DOB: 6/2/1947 | | Former Director, Mentor Income Fund, Inc.; Former Trustee, Mentor Funds and Cash Resource |
| Term of office since: 1984 | | Trust |
| Other directorships: None | | |
|
24
TRUSTEES AND OFFICERS continued
| | |
| Michael S. Scofield | | Principal occupations: Attorney, Law Offices of Michael S. Scofield; Former Director, Mentor |
| Trustee | | Income Fund, Inc.; Former Trustee, Mentor Funds and Cash Resource Trust |
| DOB: 2/20/1943 | | |
| Term of office since: 1984 | | |
| Other directorships: None | | |
|
| |
| Richard J. Shima | | Principal occupations: Independent Consultant; Director, Trust Company of CT; Trustee, Saint |
| Trustee | | Joseph College (CT); Director, Hartford Hospital; Trustee, Greater Hartford YMCA; Former |
| DOB: 8/11/1939 | | Director, Enhance Financial Services, Inc.; Former Director, Old State House Association; Former |
| Term of office since: 1993 | | Director of CTG Resources, Inc. (natural gas); Former Director, Mentor Income Fund, Inc.; Former |
| | | Trustee, Mentor Funds and Cash Resource Trust |
| Other directorships: None | | |
|
| |
| Richard K. Wagoner, CFA 2 | | Principal occupations: Member and Former President, North Carolina Securities Traders |
| Trustee | | Association; Member, Financial Analysts Society; Former Consultant to the Boards of Trustees of |
| DOB: 12/12/1937 | | the Evergreen funds; Former Trustee, Mentor Funds and Cash Resource Trust |
| Term of office since: 1999 | | |
| Other directorships: None | | |
|
| |
| |
| OFFICERS | | |
| |
| Dennis H. Ferro 3 | | Principal occupations: President and Chief Executive Officer, Evergreen Investment Company, |
| President | | Inc. and Executive Vice President, Wachovia Bank, N.A.; former Chief Investment Officer, |
| DOB: 6/20/1945 | | Evergreen Investment Company, Inc. |
| Term of office since: 2003 | | |
|
| |
| Carol Kosel4 | | Principal occupations: Senior Vice President, Evergreen Investment Services, Inc. |
| Treasurer | | |
| DOB: 12/25/1963 | | |
| Term of office since: 1999 | | |
|
| |
| Michael H. Koonce 4 | | Principal occupations: Senior Vice President and General Counsel, Evergreen Investment |
| Secretary | | Services, Inc.; Senior Vice President and Assistant General Counsel, Wachovia Corporation |
| DOB: 4/20/1960 | | |
| Term of office since: 2000 | | |
|
| |
| James Angelos4 | | Principal occupations: Chief Compliance Officer, Senior Vice President and Director of |
| Chief Compliance Officer | | Compliance, Evergreen Investment Services, Inc. |
| DOB: 9/2/1947 | | |
| Term of office since: 2004 | | |
|
|
| 1 Each Trustee serves until a successor is duly elected or qualified or until his death, resignation, retirement or removal from office. Each |
| Trustee oversees 93 Evergreen funds. Correspondence for each Trustee may be sent to Evergreen Board of Trustees, P.O. Box 20083, |
| Charlotte, North Carolina 28202. |
| 2 Mr. Wagoner is an "interested person" of the Fund because of his ownership of shares in Wachovia Corporation, the parent to the |
| Fund's investment advisor. |
| 3 The address of the Officer is 401 S. Tryon Street, 20th Floor, Charlotte, NC 28288. |
| 4 The address of the Officer is 200 Berkeley Street, Boston, MA 02116. |
Additional information about the Fund's Board of Trustees and Officers can be found in the Statement of Additional Information (SAI) and is available upon request without charge by calling 800.343.2898.
25
568007 rv1 11/2004

| | |
| table of contents |
| 1 | | LETTER TO SHAREHOLDERS |
| 4 | | FUND AT A GLANCE |
| 6 | | ABOUT YOUR FUND'S EXPENSES |
| 7 | | FINANCIAL HIGHLIGHTS |
| 11 | | SCHEDULE OF INVESTMENTS |
| 25 | | STATEMENT OF ASSETS AND LIABILITIES |
| 26 | | STATEMENT OF OPERATIONS |
| 27 | | STATEMENTS OF CHANGES IN NET ASSETS |
| 28 | | NOTES TO FINANCIAL STATEMENTS |
| 36 | | TRUSTEES AND OFFICERS |
This semiannual report must be preceded or accompanied by a prospectus of the Evergreen fund contained herein. The prospectus contains more complete information, including fees and expenses, and should be read carefully before investing or sending money.
The fund will file its complete schedule of portfolio holdings with the SEC for the first and third quarters of each fiscal year on Form N-Q. The fund's Form N-Q will be available on the SEC's Web site at http://www.sec.gov. In addition, the fund's Form N-Q may be reviewed and copied at the SEC's Public Reference Room in Washington, D.C. Information on the operation of the Public Reference Room may be obtained by calling 800.SEC.0330.
A description of the fund's proxy voting policies and procedures is available without charge, upon request, by calling 800.343.2898, by visiting our Web site at EvergreenInvestments.com or by visiting the SEC's Web site at http://www.sec.gov.
Information relating to how the fund voted proxies relating to portfolio securities during the most recent 12-month period ended June 30 is available by visiting our Web site at EvergreenInvestments.com or by visiting the SEC's Web site at http://www.sec.gov.
Mutual Funds:
| | | | |
| NOT FDIC INSURED | | MAY LOSE VALUE | | NOT BANK GUARANTEED |
Evergreen InvestmentsSM is a service mark of Evergreen Investment Management Company, LLC. Copyright 2004.
Evergreen mutual funds are distributed by Evergreen Investment Services, Inc. 200 Berkeley Street, Boston, MA 02116
LETTER TO SHAREHOLDERS
November 2004

| | Dennis H. Ferro
President and Chief
Executive Officer
|
Dear Shareholder,
We are pleased to provide the semiannual report for the Evergreen Balanced Fund, which covers the six-month period ended September 30, 2004.
During these challenging times, the importance of proper asset allocation between stocks, bonds and cash cannot be overstated. We strongly believe that investment portfolios utilizing a balanced approach for diversification will provide investors, as they have historically, with the stability necessary during periods of market turmoil. Given the uncertain geopolitical backdrop, our portfolio managers entered the investment period preparing for, and adapting to, the rapidly changing fundamental landscape. Our forecast for the investment period included less accommodation from the Federal Reserve, along with a moderation in economic and corporate profit growth. As a result, our equity analysts sought sustainable profits and the potential for higher dividends, while our bond teams attempted to identify credit quality with appropriate maturities for the fixed income portion of our diversified investment portfolios.
The period began with positive momentum on the economic front. First quarter Gross Domestic Products (GDP) grew in excess of 4%, and supporting data pointed to a continuation of solid growth. Retail sales were strong and manufacturing had managed to put together several months of consistent growth. The solid contributions from business investment, meanwhile, had enabled the expansion to broaden, reinforcing the trend for sustainable economic growth. The next key for the recovery would come in the
1
LETTER TO SHAREHOLDERS continued
form of employment growth, which has historically lagged that of GDP growth. This recovery was no exception, and fears of a jobless recovery persisted for months. Yet that too also improved, as the investment period began with consecutive monthly payroll gains in excess of 300,000 jobs.
Another condition of economic recoveries is that they have to transition from the initial phase of surging growth to more normalized periods of average growth. This historically subtle transition was abundantly clear during the second quarter as GDP growth had moderated two full percentage points, to 3%, from the approximately 5% pace over the prior twelve months. Personal consumption weakened, prices for oil and gasoline were surging, and fears of terror abounded as the June 30th deadline approached for the handover of power in Iraq.
As if this wasn't enough, the Federal Reserve had been preparing Wall Street for higher interest rates. Monetary policymakers began the second quarter with a new "spin" on their message to the public, stating that they would remain "measured" in their removal of policy accommodation. Despite these attempts at improved clarity from the Federal Reserve, market interest rates alternately plunged, then soared, only to recover again by the end of the summer. These interest rate concerns were exacerbated by rising gasoline prices and the larger than-forecasted readings on consumer inflation during May and June. As it turned out, the advent of the Federal Reserve's gradual tightening cycle proved to be the tonic that the markets needed, with the yield curve flattening slightly by the end of the investment period.
In addition to the aforementioned deceleration in GDP growth, the pace of growth in corporate profits has also moderated in recent months. After climbing approximately 20% over the past twelve months, operating earnings for companies within the S&P 500 Index are expected to climb by 15% in the second half of 2004, with profit gains of up to 10% in 2005.
2
LETTER TO SHAREHOLDERS continued
These forecasts were also weighed down by the fact that the third quarter represented the first time in a year that consensus EPS estimates did not increase during the quarter. Add in the uncertainty of the presidential election and higher energy prices, and the stock market faced many challenges during the investment period. To combat these issues, our equity teams endeavored to find companies with sustainability in profits, cash flows, and dividends in order to enhance total return prospects.
Please visit our website, EvergreenInvestments.com, for more information about our funds and other investment products available to you. Thank you for your continued support of Evergreen Investments.
Sincerely,

Dennis H. Ferro
President and Chief Executive Officer
Evergreen Investment Company, Inc.
|
Special Notice to Shareholders:
Please visit our website at EvergreenInvestments.com for statements from President and Chief Executive Officer, Dennis Ferro, and Chairman of the Board of the Evergreen Funds, Michael S. Scofield, addressing recent SEC actions involving the Evergreen Funds.
3
FUND AT A GLANCE
as of September 30, 2004
MANAGEMENT TEAM

Patricia A. Bannan, CFA
Large Cap Core Growth Team Lead Manager
Tattersall Advisory Group, Inc.
CURRENT INVESTMENT STYLE
Source: Morningstar, Inc.
Morningstar's style box is based on a portfolio date as of 9/30/2004.
The domestic equity style box placement is based on 10 growth and valuation measures for each of the fund's holdings, as well as the size of the companies in which it invests, or median market capitalization.
The fixed income style box placement is based on a fund's average effective maturity or duration and the average credit rating of the bond portfolio.
PERFORMANCE AND RETURNS
Portfolio inception date: 9/11/1935
| | | | | | | | |
| | | Class A | | Class B | | Class C | | Class I |
| Class inception date | | 1/20/1998 | | 9/11/1935 | | 1/22/1998 | | 1/26/1998 |
|
| Nasdaq symbol | | EKBAX | | EKBBX | | EKBCX | | EKBYX |
|
| 6-month return with sales charge | | -6.99% | | -6.57% | | -2.65% | | N/A |
|
| 6-month return w/o sales charge | | -1.32% | | -1.68% | | -1.67% | | -1.06% |
|
| Average annual return* | | | | | | | | |
|
| 1-year with sales charge | | 1.94% | | 2.39% | | 6.40% | | N/A |
|
| 1-year w/o sales charge | | 8.15% | | 7.39% | | 7.40% | | 8.51% |
|
| 5-year | | 0.28% | | 0.40% | | 0.71% | | 1.69% |
|
| 10-year | | 7.25% | | 7.33% | | 7.35% | | 8.05% |
|
* Adjusted for maximum applicable sales charge, unless noted.
Past performance is no guarantee of future results. The performance quoted represents past performance and current performance may be lower or higher. The investment return and principal value of an investment will fluctuate so that investors' shares, when redeemed, may be worth more or less than their original cost. To obtain performance information current to the most recent month-end for Classes A, B, C or I, please go to EvergreenInvestments.com/fundperformance. The performance of each class may vary based on differences in loads, fees and expenses paid by the shareholders investing in each class. The maximum applicable sales charge is 5.75% for Class A, 5.00% for Class B and 1.00% for Class C. Class I is not subject to a sales charge. Performance includes the reinvestment of income dividends and capital gain distributions. Performance shown does not reflect the deduction of taxes that a shareholder would pay on fund distributions or the redemption of fund shares.
Historical performance shown for Classes A, C and I prior to their inception is based on the performance of Class B, the original class offered. The historical returns for Classes A and I have not been adjusted to reflect the effect of each class' 12b-1 fee. These fees are 0.30% for Class A and 1.00% for Classes B and C. Class I does not pay a 12b-1 fee. If these fees had been reflected, returns for Classes A and I would have been higher.
4
FUND AT A GLANCE continued
LONG-TERM GROWTH
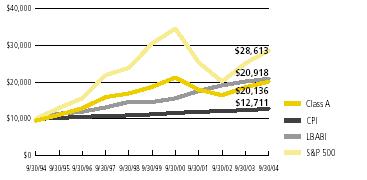
Comparison of a $10,000 investment in the Evergreen Balanced Fund Class A shares, versus a similar investment in the Lehman Brothers Aggregate Bond Index (LBABI), the Standard & Poor's 500 Index (S&P 500) and the Consumer Price Index (CPI).
The LBABI and the S&P 500 are unmanaged market indexes and do not include transaction costs associated with buying and selling securities, any mutual fund expenses or any taxes. The CPI is a commonly used measure of inflation and does not represent an investment return. It is not possible to invest directly in an index.
Class I shares are only offered to investment advisory clients of an investment advisor of an Evergreen fund (or its advisory affiliates), through special arrangements entered into on behalf of Evergreen funds with certain financial services firms, certain institutional investors and persons who owned Class Y shares in registered name in an Evergreen fund on or before December 31, 1994. Class I shares are only available to institutional shareholders with a minimum $1 million investment.
The fund's investment objective is nonfundamental and may be changed without the vote of the fund's shareholders.
Funds that invest in high yield, lower-rated bonds may contain more risk due to the increased possibility of default.
Foreign investments may contain more risk due to the inherent risks associated with changing political climates, foreign market instability and foreign currency fluctuations.
U.S. government guarantees apply only to certain securities held in the fund's portfolio and not to the fund's shares.
The return of principal is not guaranteed due to fluctuation in the NAV of the fund caused by changes in the price of the individual bonds held by the fund and the buying and selling of bonds by the fund. Bond funds have the same inflation, interest rate and credit risks that are associated with the individual bonds held by the fund.
All data is as of September 30, 2004, and subject to change.
5
ABOUT YOUR FUND'S EXPENSES
The Example below is intended to describe the fees and expenses borne by shareholders and the impact of those costs on your investment.
Example
As a shareholder of the fund, you incur two types of costs: (1) transaction costs, including sales charges (loads), redemption fees and exchange fees; and (2) ongoing costs, including management fees, distribution (12b-1) fees and other fund expenses. This Example is intended to help you understand your ongoing costs (in dollars) of investing in the fund and to compare these costs with the ongoing costs of investing in other mutual funds. The Example is based on an investment of $1,000 invested at the beginning of the period and held for the entire period from April 1, 2004 to September 30, 2004.
The example illustrates your fund's costs in two ways:
- Actual expenses
The section in the table under the heading "Actual" provides information about actual account valuesand actual expenses. You may use the information in these columns, together with the amount youinvested, to estimate the expenses that you paid over the period. Simply divide your account valueby $1,000 (for example, an $8,600 account value divided by $1,000 = 8.6), then multiply the resultby the number in the appropriate column for your share class, in the column entitled "Expenses PaidDuring Period" to estimate the expenses you paid on your account during this period. - Hypothetical example for comparison purposes
The section in the table under the heading "Hypothetical (5% return before expenses)" providesinformation about hypothetical account values and hypothetical expenses based on the fund's actualexpense ratio and an assumed rate of return of 5% per year before expenses, which is not the fund'sactual return. The hypothetical account values and expenses may not be used to estimate the actualending account balance or expenses you paid for the period. You may use this information tocompare the ongoing costs of investing in the fund and other funds. To do so, compare this 5%hypothetical example with the 5% hypothetical examples that appear in the shareholder reports ofthe other funds.
Please note that the expenses shown in the table are meant to highlight your ongoing costs only and do not reflect any transactional costs, such as sales charges (loads), redemption fees or exchange fees. Therefore, the section in the table under the heading "Hypothetical (5% return before expenses)" is useful in comparing ongoing costs only, and will not help you determine the relative total costs of owning different funds. In addition, if these transactional costs were included, your costs would have been higher.
| | | | | | |
| | | Beginning | | Ending | | |
| | | Value | | Value | | Paid During |
| | | 4/1/2004 | | 9/30/2004 | | Period* |
|
| Actual | | | | | | |
| Class A | | $1,000.00 | | $ 986.77 | | $5.03 |
| Class B | | $1,000.00 | | $ 983.24 | | $8.50 |
| Class C | | $1,000.00 | | $ 983.27 | | $8.50 |
| Class I | | $1,000.00 | | $ 989.43 | | $3.54 |
| Hypothetical | | | | | | |
| (5% return | | | | | | |
| before expenses) | | | | | | |
| Class A | | $1,000.00 | | $1,020.00 | | $5.11 |
| Class B | | $1,000.00 | | $1,016.50 | | $8.64 |
| Class C | | $1,000.00 | | $1,016.50 | | $8.64 |
| Class I | | $1,000.00 | | $1,021.51 | | $3.60 |
|
| * | For each class of the Fund, expenses are equal to the annualized expense ratio of each class (1.01% for Class A, 1.71% for Class B, 1.71% for Class C and 0.71% for Class I), multiplied by the average account value over the period, multiplied by 183 / 365 days. |
| |
6
FINANCIAL HIGHLIGHTS
(For a share outstanding throughout each period)
| | | | | | | | | | | | |
| | | | | | | | | | | | | |
| | | Six Months Ended | | Year Ended March 31, |
| | September 30, 2004 | |
|
| CLASS A | | (unaudited) 1 | | 2004 | | 2003 1 | | 2002 1 | | 2001 | | 2000 |
|
| Net asset value, beginning of period | | $8.20 | | $ 6.91 | | $ 8.06 | | $8.16 | | $11.01 | | $11.28 |
|
| Income from investment operations | | | | | | | | | | | | |
| Net investment income | | 0.07 | | 0.12 | | 0.17 | | 0.18 | | 0.27 | | 0.28 |
| Net realized and unrealized gains or losses on | | | | | | | | | | | | |
| securities and foreign currency related transactions | | (0.18 ) | | 1.32 | | (1.16 ) | | (0.10 ) | | (1.34 ) | | 1.18 |
| |
| |
| |
| |
| |
| |
|
| Total from investment operations | | (0.11) | | 1.44 | | (0.99) | | 0.08 | | (1.07) | | 1.46 |
|
| Distributions to shareholders from | | | | | | | | | | | | |
| Net investment income | | (0.07) | | (0.15) | | (0.16) | | (0.18) | | (0.26) | | (0.28 ) |
| Net realized gains | | 0 | | 0 | | 0 | | 0 | | (1.52) | | (1.45) |
| |
| |
| |
| |
| |
| |
|
| Total distributions to shareholders | | (0.07) | | (0.15) | | (0.16) | | (0.18) | | (1.78) | | (1.73) |
|
| Net asset value, end of period | | $8.02 | | $ 8.20 | | $ 6.91 | | $8.06 | | $ 8.16 | | $11.01 |
|
| Total return 2 | | (1.32%) | | 20.90% | | (12.36%) | | 0.99% | | (10.71%) | | 13.89% |
|
| Ratios and supplemental data | | | | | | | | | | | | |
| Net assets, end of period (millions) | | $ 620 | | $ 688 | | $ 672 | | $ 880 | | $ 932 | | $1,264 |
| Ratios to average net assets | | | | | | | | | | | | |
| Expenses 3 | | 1.01% 4 | | 1.00% | | 0.98% | | 0.97% | | 0.92% | | 0.91% |
| Net investment income | | 1.55% 4 | | 1.59% | | 2.29% | | 2.18% | | 2.73% | | 2.48% |
| Portfolio turnover rate | | 61% | | 122% | | 125% | | 243% | | 143% | | 109% |
|
| 1 Net investment income per share is based on average shares outsta nding during the period. |
| 2 Excluding applicable sales charges |
| 3 The ratio of expenses to average net assets excludes expense reductions but includes fee waivers and/or expense reimbursements. |
| 4 Annualized |
See Notes to Financial Statements
7
FINANCIAL HIGHLIGHTS
(For a share outstanding throughout each period)
| | | | | | | | | | | | |
| | | | | | | | | | | | | |
| | | Six Months Ended | | Year Ended March 31, |
| | September 30, 2004 | |
|
| CLASS B | | (unaudited) 1 | | 2004 1 | | 2003 1 | | 2002 1 | | 2001 | | 2000 |
|
| Net asset value, beginning of period | | $8.20 | | $ 6.91 | | $ 8.06 | | $8.17 | | $11.02 | | $11.29 |
|
| Income from investment operations | | | | | | | | | | | | |
| Net investment income | | 0.04 | | 0.07 | | 0.11 | | 0.12 | | 0.19 | | 0.20 |
| Net realized and unrealized gains or losses on | | | | | | | | | | | | |
| securities and foreign currency related transactions | | (0.18 ) | | 1.31 | | (1.16 ) | | (0.11 ) | | (1.34 ) | | 1.18 |
| |
| |
| |
| |
| |
| |
|
| Total from investment operations | | (0.14) | | 1.38 | | (1.05) | | 0.01 | | (1.15) | | 1.38 |
|
| Distributions to shareholders from | | | | | | | | | | | | |
| Net investment income | | (0.04 ) | | (0.09 ) | | (0.10 ) | | (0.12 ) | | (0.18 ) | | (0.20 ) |
| Net realized gains | | 0 | | 0 | | 0 | | 0 | | (1.52) | | (1.45) |
| |
| |
| |
| |
| |
| |
|
| Total distributions to shareholders | | (0.04) | | (0.09) | | (0.10) | | (0.12) | | (1.70) | | (1.65) |
|
| Net asset value, end of period | | $8.02 | | $ 8.20 | | $ 6.91 | | $8.06 | | $ 8.17 | | $11.02 |
|
| Total return 2 | | (1.68%) | | 20.06% | | (13.03%) | | 0.10% | | (11.40%) | | 13.06% |
|
| Ratios and supplemental data | | | | | | | | | | | | |
| Net assets, end of period (millions) | | $ 87 | | $ 98 | | $ 92 | | $ 118 | | $ 216 | | $ 279 |
| Ratios to average net assets | | | | | | | | | | | | |
| Expenses 3 | | 1.71% 4 | | 1.70% | | 1.73% | | 1.72% | | 1.67% | | 1.66% |
| Net investment income | | 0.84% 4 | | 0.89% | | 1.54% | | 1.44% | | 1.98% | | 1.73% |
| Portfolio turnover rate | | 61% | | 122% | | 125% | | 243% | | 143% | | 109% |
|
| 1 Net investment income per share is based on average shares outsta nding during the period. |
| 2 Excluding applicable sales charges |
| 3 The ratio of expenses to average net assets excludes expense reductions but includes fee waivers and/or expense reimbursements. |
| 4 Annualized |
See Notes to Financial Statements
8
FINANCIAL HIGHLIGHTS
(For a share outstanding throughout each period)
| | | | | | | | | | | | |
| | | | | | | | | | | | | |
| | | Six Months Ended | | Year Ended March 31, |
| | September 30, 2004 | |
|
| CLASS C | | (unaudited) 1 | | 2004 1 | | 2003 1 | | 2002 1 | | 2001 | | 2000 |
|
| Net asset value, beginning of period | | $8.21 | | $ 6.93 | | $ 8.08 | | $8.18 | | $11.03 | | $11.30 |
|
| Income from investment operations | | | | | | | | | | | | |
| Net investment income | | 0.04 | | 0.06 | | 0.11 | | 0.11 | | 0.20 | | 0.19 |
| Net realized and unrealized gains or losses on | | | | | | | | | | | | |
| securities and foreign currency related transactions | | (0.18 ) | | 1.32 | | (1.16 ) | | (0.09 ) | | (1.35 ) | | 1.19 |
| |
| |
| |
| |
| |
| |
|
| Total from investment operations | | (0.14) | | 1.38 | | (1.05) | | 0.02 | | (1.15) | | 1.38 |
|
| Distributions to shareholders from | | | | | | | | | | | | |
| Net investment income | | (0.04 ) | | (0.10 ) | | (0.10 ) | | (0.12 ) | | (0.18 ) | | (0.20 ) |
| Net realized gains | | 0 | | 0 | | 0 | | 0 | | (1.52) | | (1.45) |
| |
| |
| |
| |
| |
| |
|
| Total distributions to shareholders | | (0.04) | | (0.10) | | (0.10) | | (0.12) | | (1.70) | | (1.65) |
|
| Net asset value, end of period | | $8.03 | | $ 8.21 | | $ 6.93 | | $8.08 | | $ 8.18 | | $11.03 |
|
| Total return 2 | | (1.67%) | | 19.91% | | (12.98%) | | 0.22% | | (11.39%) | | 13.06% |
|
| Ratios and supplemental data | | | | | | | | | | | | |
| Net assets, end of period (millions) | | $ 14 | | $ 16 | | $ 11 | | $ 11 | | $ 7 | | $ 3 |
| Ratios to average net assets | | | | | | | | | | | | |
| Expenses 3 | | 1.71% 4 | | 1.70% | | 1.73% | | 1.72% | | 1.68% | | 1.66% |
| Net investment income | | 0.85% 4 | | 0.83% | | 1.54% | | 1.42% | | 2.01% | | 1.73% |
| Portfolio turnover rate | | 61% | | 122% | | 125% | | 243% | | 143% | | 109% |
|
| 1 Net investment income per share is based on average shares outsta nding during the period. |
| 2 Excluding applicable sales charges |
| 3 The ratio of expenses to average net assets excludes expense reductions but includes fee waivers and/or expense reimbursements. |
| 4 Annualized |
See Notes to Financial Statements
9
FINANCIAL HIGHLIGHTS
(For a share outstanding throughout each period)
| | | | | | | | | | | | |
| | | | | | | | | | | | | |
| | | Six Months Ended | | Year Ended March 31, |
| | September 30, 2004 | |
|
| CLASS I 1 | | (unaudited) 2 | | 2004 | | 2003 2 | | 2002 2 | | 2001 | | 2000 |
|
| Net asset value, beginning of period | | $8.16 | | $ 6.89 | | $ 8.03 | | $8.15 | | $11.00 | | $11.27 |
|
| Income from investment operations | | | | | | | | | | | | |
| Net investment income | | 0.08 | | 0.15 | | 0.18 | | 0.20 | | 0.30 | | 0.32 |
| Net realized and unrealized gains or losses on | | | | | | | | | | | | |
| securities and foreign currency related transactions | | (0.17 ) | | 1.29 | | (1.15 ) | | (0.12 ) | | (1.34 ) | | 1.17 |
| |
| |
| |
| |
| |
| |
|
| Total from investment operations | | (0.09) | | 1.44 | | (0.97) | | 0.08 | | (1.04) | | 1.49 |
|
| Distributions to shareholders from | | | | | | | | | | | | |
| Net investment income | | (0.08 ) | | (0.17 ) | | (0.17 ) | | (0.20 ) | | (0.29 ) | | (0.31 ) |
| Net realized gains | | 0 | | 0 | | 0 | | 0 | | (1.52) | | (1.45) |
| Total distributions to shareholders | | (0.08) | | (0.17) | | (0.17) | | (0.20) | | (1.81) | | (1.76) |
|
| Net asset value, end of period | | $7.99 | | $ 8.16 | | $ 6.89 | | $8.03 | | $ 8.15 | | $11.00 |
|
| Total return | | (1.06%) | | 21.03% | | (12.07%) | | 1.00% | | (10.49%) | | 14.21% |
|
| Ratios and supplemental data | | | | | | | | | | | | |
| Net assets, end of period (millions) | | $ 172 | | $ 216 | | $ 188 | | $ 9 | | $ 13 | | $ 20 |
| Ratios to average net assets | | | | | | | | | | | | |
| Expenses 3 | | 0.71% 4 | | 0.70% | | 0.73% | | 0.72% | | 0.67% | | 0.66% |
| Net investment income | | 1.84% 4 | | 1.91% | | 2.61% | | 2.44% | | 2.98% | | 2.73% |
| Portfolio turnover rate | | 61% | | 122% | | 125% | | 243% | | 143% | | 109% |
|
| 1 Effective at the close of business on May 11, 2001, Class Y sh ares were renamed as Institutional shares (Class I). |
| 2 Net investment income per share is based on average shares outsta nding during the period. |
| 3 The ratio of expenses to average net assets excludes expense reductions but includes fee waivers and/or expense reimbursements. |
| 4 Annualized |
See Notes to Financial Statements
10
SCHEDULE OF INVESTMENTS
September 30, 2004 (unaudited)
| | | | | | | | |
| | | | | Principal | | | | |
| | | | | Amount | | | | Value |
|
| |
| ASSET-BACKED SECURITIES 0.8% | | | | | | | | |
| Ameriquest Mtge. Securities, Inc., Ser. 2003-8, Class AF5, 4.64%, 10/25/2033 | | $ | | 1,935,000 | | $ | | 1,938,380 |
| Residential Asset Mtge. Products, Inc.: | | | | | | | | |
| Ser. 2002-RS3, Class AI5, 5.57%, 02/25/2032 | | | | 3,515,000 | | | | 3,601,337 |
| Ser. 2003-RS7, Class AI6, 5.34%, 08/25/2033 | | | | 1,995,000 | | | | 2,047,791 |
|
|
| Total Asset-Backed Securities (cost $7,520,039) | | | | | | | | 7,587,508 |
|
|
| CORPORATE BONDS 8.2% | | | | | | | | |
| CONSUMER DISCRETIONARY 1.5% | | | | | | | | |
| Auto Components 0.0% | | | | | | | | |
| Dana Corp., 9.00%, 08/15/2011 | | | | 250,000 | | | | 303,125 |
| HLI Operating, Inc., 10.50%, 06/15/2010 | | | | 110,000 | | | | 120,450 |
|
|
| | | | | | | | | 423,575 |
|
|
| Automobiles 0.5% | | | | | | | | |
| Ford Motor Co., 6.375%, 02/01/2029 | | | | 1,750,000 | | | | 1,542,534 |
| General Motors Corp., 7.20%, 01/15/2011 | | | | 3,000,000 | | | | 3,181,215 |
|
|
| | | | | | | | | 4,723,749 |
|
|
| Hotels, Restaurants & Leisure 0.2% | | | | | | | | |
| Chumash Casino & Resort Enterprise, 9.00%, 07/15/2010 144A | | | | 250,000 | | | | 278,750 |
| Friendly Ice Cream Corp., 8.375%, 06/15/2012 | | | | 50,000 | | | | 48,250 |
| John Q. Hammons Hotels LP, Ser. B, 8.875%, 05/15/2012 | | | | 250,000 | | | | 280,000 |
| La Quinta Properties, Inc., 7.00%, 08/15/2012 144A | | | | 75,000 | | | | 79,406 |
| Prime Hospitality Corp., Ser. B, 8.375%, 05/01/2012 | | | | 350,000 | | | | 398,125 |
| Seneca Gaming Corp., 7.25%, 05/01/2012 144A | | | | 255,000 | | | | 264,563 |
|
|
| | | | | | | | | 1,349,094 |
|
|
| Household Durables 0.1% | | | | | | | | |
| Meritage Corp., 9.75%, 06/01/2011 | | | | 100,000 | | | | 112,750 |
| Schuler Homes, Inc., 10.50%, 07/15/2011 | | | | 200,000 | | | | 231,000 |
| Standard Pacific Corp., 7.75%, 03/15/2013 | | | | 200,000 | | | | 218,500 |
| WCI Communities, Inc., 9.125%, 05/01/2012 | | | | 200,000 | | | | 224,000 |
|
|
| | | | | | | | | 786,250 |
|
|
| Media 0.4% | | | | | | | | |
| CSC Holdings, Inc., 7.625%, 04/01/2011 | | | | 350,000 | | | | 370,562 |
| Dex Media West LLC, 8.50%, 08/15/2010 | | | | 155,000 | | | | 176,700 |
| Emmis Communications Corp., 6.875%, 05/15/2012 | | | | 100,000 | | | | 104,250 |
| Mediacom Capital Corp., 9.50%, 01/15/2013 | | | | 205,000 | | | | 198,338 |
| Mediacom LLC, 7.875%, 02/15/2011 | | | | 140,000 | | | | 134,400 |
| MediaNews Group, Inc., 6.875%, 10/01/2013 | | | | 200,000 | | | | 207,500 |
| R.H. Donnelley Finance Corp., 10.875%, 12/15/2012 | | | | 150,000 | | | | 182,625 |
| Time Warner, Inc., 7.625%, 04/15/2031 | | | | 2,000,000 | | | | 2,309,068 |
|
|
| | | | | | | | | 3,683,443 |
|
|
| Multi-line Retail 0.1% | | | | | | | | |
| May Department Stores Co., 7.45%, 09/15/2011 | | | | 1,000,000 | | | | 1,137,608 |
|
|
See Notes to Financial Statements
11
SCHEDULE OF INVESTMENTS continued
September 30, 2004 (unaudited)
| | | | | | | | |
| | | | | Principal | | | | |
| | | | | Amount | | | | Value |
|
| |
| CORPORATE BONDS continued | | | | | | | | |
| CONSUMER DISCRETIONARY continued | | | | | | | | |
| Specialty Retail 0.2% | | | | | | | | |
| Cole National Group, Inc., 8.875%, 05/15/2012 | | $ | | 200,000 | | $ | | 227,500 |
| CSK Auto, Inc., 7.00%, 01/15/2014 | | | | 200,000 | | | | 194,500 |
| Group 1 Automotive, Inc., 8.25%, 08/15/2013 | | | | 200,000 | | | | 212,000 |
| Michaels Stores, Inc., 9.25%, 07/01/2009 | | | | 200,000 | | | | 218,000 |
| PETCO Animal Supplies, Inc., 10.75%, 11/01/2011 | | | | 200,000 | | | | 233,000 |
| United Auto Group, Inc., 9.625%, 03/15/2012 | | | | 200,000 | | | | 221,500 |
| Warnaco Group, Inc., 8.875%, 06/15/2013 | | | | 350,000 | | | | 391,125 |
|
|
| | | | | | | | | 1,697,625 |
|
|
| CONSUMER STAPLES 0.2% | | | | | | | | |
| Beverages 0.1% | | | | | | | | |
| Coca Cola Enterprises, Inc., 6.95%, 11/15/2026 | | | | 650,000 | | | | 756,328 |
|
|
| Food & Staples Retailing 0.1% | | | | | | | | |
| Couche-Tard LP, 7.50%, 12/15/2013 | | | | 100,000 | | | | 107,000 |
| Rite Aid Corp., 8.125%, 05/01/2010 | | | | 200,000 | | | | 211,000 |
| Roundy's, Inc., Ser. B, 8.875%, 06/15/2012 | | | | 200,000 | | | | 216,500 |
|
|
| | | | | | | | | 534,500 |
|
|
| Food Products 0.0% | | | | | | | | |
| Chiquita Brands International, Inc., 7.50%, 11/01/2014 144A | | | | 35,000 | | | | 35,175 |
| Del Monte Foods Co., 8.625%, 12/15/2012 | | | | 200,000 | | | | 223,500 |
| Dole Food Co., Inc., 7.25%, 06/15/2010 | | | | 200,000 | | | | 207,500 |
|
|
| | | | | | | | | 466,175 |
|
|
| Personal Products 0.0% | | | | | | | | |
| Alderwoods Group, Inc., 7.75%, 09/15/2012 144A | | | | 100,000 | | | | 106,250 |
|
|
| ENERGY 0.3% | | | | | | | | |
| Energy Equipment & Services 0.0% | | | | | | | | |
| Dresser, Inc., 9.375%, 04/15/2011 | | | | 200,000 | | | | 221,000 |
| Parker Drilling Co., Ser. B, 10.125%, 11/15/2009 | | | | 100,000 | | | | 106,625 |
|
|
| | | | | | | | | 327,625 |
|
|
| Oil & Gas 0.3% | | | | | | | | |
| Chesapeake Energy Corp., 6.875%, 01/15/2016 | | | | 250,000 | | | | 262,500 |
| El Paso Energy Partners LP, 8.50%, 06/01/2011 | | | | 400,000 | | | | 451,500 |
| Evergreen Resources, Inc., 5.875%, 03/15/2012 | | | | 40,000 | | | | 41,400 |
| Exco Resources, Inc., 7.25%, 01/15/2011 | | | | 70,000 | | | | 74,550 |
| Ferrellgas LP, 6.75%, 05/01/2014 | | | | 180,000 | | | | 184,500 |
| Forest Oil Corp., 7.75%, 05/01/2014 | | | | 250,000 | | | | 273,125 |
| Frontier Oil Corp., 6.625%, 10/01/2011 144A # | | | | 50,000 | | | | 50,875 |
| Kinder Morgan Energy Partners, 7.40%, 03/15/2031 | | | | 800,000 | | | | 910,853 |
| Plains Exploration & Production Co., 8.75%, 07/01/2012 | | | | 200,000 | | | | 225,500 |
| Stone Energy Corp., 8.25%, 12/15/2011 | | | | 175,000 | | | | 189,437 |
|
|
| | | | | | | | | 2,664,240 |
|
|
See Notes to Financial Statements
12
SCHEDULE OF INVESTMENTS continued
September 30, 2004 (unaudited)
| | | | | | | | |
| | | | | Principal | | | | |
| | | | | Amount | | | | Value |
|
| |
| CORPORATE BONDS continued | | | | | | | | |
| FINANCIALS 3.8% | | | | | | | | |
| Capital Markets 1.1% | | | | | | | | |
| Alliance Capital Management LP, 5.625%, 08/15/2006 | | $ | | 4,425,000 | | $ | | 4,631,564 |
| Goldman Sachs & Co., Inc., 7.35%, 10/01/2009 | | | | 1,085,000 | | | | 1,246,026 |
| Legg Mason, Inc., 6.75%, 07/02/2008 | | | | 3,500,000 | | | | 3,857,749 |
| Morgan Stanley, 3.625%, 04/01/2008 | | | | 400,000 | | | | 401,168 |
|
|
| | | | | | | | | 10,136,507 |
|
|
| Commercial Banks 0.4% | | | | | | | | |
| Bank of America Corp., 7.125%, 05/01/2006 | | | | 1,000,000 | | | | 1,066,480 |
| Union Planters Bank, 6.50%, 03/15/2008 | | | | 2,380,000 | | | | 2,570,807 |
|
|
| | | | | | | | | 3,637,287 |
|
|
| Consumer Finance 0.7% | | | | | | | | |
| Ford Motor Credit Co., 7.00%, 10/01/2013 | | | | 500,000 | | | | 529,528 |
| Household Finance Corp., 4.75%, 05/15/2009 | | | | 3,000,000 | | | | 3,099,540 |
| Sprint Capital Corp., 6.875%, 11/15/2028 | | | | 2,160,000 | | | | 2,272,413 |
|
|
| | | | | | | | | 5,901,481 |
|
|
| Diversified Financial Services 0.1% | | | | | | | | |
| Arch Western Finance LLC, 6.75%, 07/01/2013 144A | | | | 350,000 | | | | 378,000 |
|
|
| Insurance 0.0% | | | | | | | | |
| Crum & Forster Holdings Corp., 10.375%, 06/15/2013 | | | | 250,000 | | | | 268,125 |
|
|
| Real Estate 1.4% | | | | | | | | |
| CB Richard Ellis Services, Inc., 9.75%, 05/15/2010 REIT | | | | 227,000 | | | | 258,213 |
| Crescent Real Estate Equities, 9.25%, 04/15/2009 REIT | | | | 250,000 | | | | 270,625 |
| Duke Realty LP, 7.05%, 03/01/2006 REIT | | | | 700,000 | | | | 730,827 |
| EOP Operating LP: | | | | | | | | |
| 7.00%, 07/15/2011 | | | | 3,250,000 | | | | 3,656,084 |
| 7.75%, 11/15/2007 | | | | 500,000 | | | | 558,702 |
| ERP Operating LP, 6.63%, 04/13/2015 REIT | | | | 4,680,000 | | | | 4,781,547 |
| FelCor Suites LP, 7.625%, 10/01/2007 REIT | | | | 250,000 | | | | 265,000 |
| Host Marriott LP, Ser. J, 7.125%, 11/01/2013 REIT | | | | 200,000 | | | | 211,000 |
| LNR Property Corp., 7.625%, 07/15/2013 | | | | 200,000 | | | | 220,000 |
| Simon Property Group, Inc., 6.875%, 10/27/2005 REIT | | | | 1,250,000 | | | | 1,301,627 |
| Thornburg Mortgage, Inc., 8.00%, 05/15/2013 REIT | | | | 200,000 | | | | 208,000 |
|
|
| | | | | | | | | 12,461,625 |
|
|
| Thrifts & Mortgage Finance 0.1% | | | | | | | | |
| American General Finance Corp., 5.75%, 03/15/2007 | | | | 925,000 | | | | 977,964 |
|
|
| HEALTH CARE 0.1% | | | | | | | | |
| Health Care Equipment & Supplies 0.0% | | | | | | | | |
| NeighborCare, Inc., 6.875%, 11/15/2013 | | | | 135,000 | | | | 141,075 |
|
|
| Health Care Providers & Services 0.1% | | | | | | | | |
| Extendicare Health Services, Inc., 6.875%, 05/01/2014 | | | | 350,000 | | | | 358,750 |
| Service Corporation International, 6.75%, 04/01/2016 144A | | | | 110,000 | | | | 110,550 |
| Triad Hospitals, Inc., 7.00%, 11/15/2013 | | | | 400,000 | | | | 409,000 |
|
|
| | | | | | | | | 878,300 |
|
|
See Notes to Financial Statements
13
SCHEDULE OF INVESTMENTS continued
September 30, 2004 (unaudited)
| | | | | | | | |
| | | | | Principal | | | | |
| | | | | Amount | | | | Value |
|
| |
| CORPORATE BONDS continued | | | | | | | | |
| INDUSTRIALS 1.2% | | | | | | | | |
| Aerospace & Defense 0.1% | | | | | | | | |
| Aviall, Inc., 7.625%, 07/01/2011 | | $ | | 190,000 | | $ | | 206,150 |
| DRS Technologies, Inc., 6.875%, 11/01/2013 | | | | 350,000 | | | | 365,750 |
|
|
| | | | | | | | | 571,900 |
|
|
| Air Freight & Logistics 0.1% | | | | | | | | |
| United Parcel Services, Inc., 8.375%, 04/01/2020 | | | | 1,000,000 | | | | 1,334,707 |
|
|
| Commercial Services & Supplies 0.2% | | | | | | | | |
| Adesa, Inc., 7.625%, 06/15/2012 | | | | 350,000 | | | | 362,250 |
| Allied Waste North America, Inc., 6.50%, 11/15/2010 | | | | 50,000 | | | | 49,750 |
| Cenveo Corp., 7.875%, 12/01/2013 | | | | 135,000 | | | | 132,300 |
| Coinmach Corp., 9.00%, 02/01/2010 | | | | 200,000 | | | | 208,500 |
| Geo Group, Inc., 8.25%, 07/15/2013 | | | | 250,000 | | | | 259,062 |
| Hines Nurseries, Inc., 10.25%, 10/01/2011 | | | | 75,000 | | | | 79,875 |
| Manitowoc Co., Inc., 7.125%, 11/01/2013 | | | | 75,000 | | | | 79,688 |
| NationsRent, Inc., 9.50%, 10/15/2010 | | | | 200,000 | | | | 218,000 |
|
|
| | | | | | | | | 1,389,425 |
|
|
| Machinery 0.4% | | | | | | | | |
| Case New Holland, Inc., 9.25%, 08/01/2011 144A | | | | 250,000 | | | | 281,250 |
| Cummins, Inc., 9.50%, 12/01/2010 | | | | 50,000 | | | | 58,000 |
| Ingersoll Rand Co., 6.25%, 05/15/2006 | | | | 2,625,000 | | | | 2,758,807 |
| Terex Corp., 7.375%, 01/15/2014 | | | | 200,000 | | | | 211,000 |
| Wolverine Tube, Inc., 7.375%, 08/01/2008 144A | | | | 200,000 | | | | 199,000 |
|
|
| | | | | | | | | 3,508,057 |
|
|
| Road & Rail 0.4% | | | | | | | | |
| Burlington Northern Santa Fe Corp.: | | | | | | | | |
| 5.90%, 07/01/2012 | | | | 2,000,000 | | | | 2,156,012 |
| 6.75%, 07/15/2011 | | | | 1,050,000 | | | | 1,180,949 |
|
|
| | | | | | | | | 3,336,961 |
|
|
| Transportation Infrastructure 0.0% | | | | | | | | |
| Offshore Logistics, Inc., 6.125%, 06/15/2013 | | | | 350,000 | | | | 357,000 |
|
|
| INFORMATION TECHNOLOGY 0.1% | | | | | | | | |
| IT Services 0.1% | | | | | | | | |
| Iron Mountain, Inc., 6.625%, 01/01/2016 | | | | 200,000 | | | | 196,000 |
| Stratus Technologies, Inc., 10.375%, 12/01/2008 | | | | 300,000 | | | | 273,000 |
| Unisys Corp., 6.875%, 03/15/2010 | | | | 200,000 | | | | 209,500 |
|
|
| | | | | | | | | 678,500 |
|
|
| MATERIALS 0.6% | | | | | | | | |
| Chemicals 0.3% | | | | | | | | |
| Airgas, Inc., 9.125%, 10/01/2011 | | | | 400,000 | | | | 452,000 |
| Dow Chemical Co., 8.625%, 04/01/2006 | | | | 836,000 | | | | 903,396 |
| Equistar Chemicals LP, 10.625%, 05/01/2011 | | | | 200,000 | | | | 229,000 |
| Ethyl Corp., 8.875%, 05/01/2010 | | | | 95,000 | | | | 103,075 |
See Notes to Financial Statements
14
SCHEDULE OF INVESTMENTS continued
September 30, 2004 (unaudited)
| | | | | | | | |
| | | | | Principal | | | | |
| | | | | Amount | | | | Value |
|
| |
| CORPORATE BONDS continued | | | | | | | | |
| MATERIALS continued | | | | | | | | |
| Chemicals continued | | | | | | | | |
| FMC Corp., 10.25%, 11/01/2009 | | $ | | 150,000 | | $ | | 175,875 |
| Huntsman Advanced Materials LLC: | | | | | | | | |
| 11.00%, 07/15/2010 144A | | | | 67,000 | | | | 78,055 |
| 11.625%, 10/15/2010 | | | | 200,000 | | | | 232,500 |
| Lyondell Chemical Co., 9.50%, 12/15/2008 | | | | 400,000 | | | | 438,500 |
| Nalco Co., 7.75%, 11/15/2011 | | | | 200,000 | | | | 213,000 |
|
|
| | | | | | | | | 2,825,401 |
|
|
| Containers & Packaging 0.1% | | | | | | | | |
| Crown Cork & Seal Co., Inc., 7.375%, 12/15/2026 | | | | 250,000 | | | | 223,750 |
| Graphic Packaging International, Inc., 8.50%, 08/15/2011 | | | | 200,000 | | | | 224,500 |
| Jefferson Smurfit Group, 7.50%, 06/01/2013 | | | | 200,000 | | | | 212,000 |
| Owens-Brockway Glass Container, Inc., 8.875%, 02/15/2009 | | | | 200,000 | | | | 218,500 |
| Stone Container Corp., 9.75%, 02/01/2011 | | | | 200,000 | | | | 222,500 |
|
|
| | | | | | | | | 1,101,250 |
|
|
| Metals & Mining 0.1% | | | | | | | | |
| Century Aluminum Co., 7.50%, 08/15/2014 144A | | | | 75,000 | | | | 79,313 |
| Massey Energy Co., 6.625%, 11/15/2010 | | | | 100,000 | | | | 104,750 |
| Peabody Energy Corp.: | | | | | | | | |
| 5.875%, 04/15/2016 | | | | 155,000 | | | | 153,837 |
| 6.875%, 03/15/2013 | | | | 170,000 | | | | 184,450 |
| U.S. Steel LLC, 10.75%, 08/01/2008 | | | | 60,000 | | | | 71,100 |
|
|
| | | | | | | | | 593,450 |
|
|
| Paper & Forest Products 0.1% | | | | | | | | |
| Georgia Pacific Corp., 8.125%, 05/15/2011 | | | | 250,000 | | | | 290,000 |
| Millar Western Forest Products, Ltd., 7.75%, 11/15/2013 144A | | | | 350,000 | | | | 369,250 |
|
|
| | | | | | | | | 659,250 |
|
|
| TELECOMMUNICATION SERVICES 0.1% | | | | | | | | |
| Diversified Telecommunication Services 0.0% | | | | | | | | |
| Insight Midwest LP, 10.50%, 11/01/2010 | | | | 200,000 | | | | 220,000 |
| Qwest Corp., 7.875%, 09/01/2011 144A | | | | 100,000 | | | | 104,250 |
|
|
| | | | | | | | | 324,250 |
|
|
| Wireless Telecommunications Services 0.1% | | | | | | | | |
| Nextel Communications, Inc., 5.95%, 03/15/2014 | | | | 350,000 | | | | 344,750 |
|
|
| UTILITIES 0.3% | | | | | | | | |
| Electric Utilities 0.3% | | | | | | | | |
| Georgia Power Co., Ser. G, 6.20%, 02/01/2006 | | | | 1,250,000 | | | | 1,307,144 |
| Progress Energy, Inc., 7.75%, 03/01/2031 | | | | 1,275,000 | | | | 1,512,035 |
|
|
| | | | | | | | | 2,819,179 |
|
|
See Notes to Financial Statements
15
SCHEDULE OF INVESTMENTS continued
September 30, 2004 (unaudited)
| | | | | | | | |
| | | | | Principal | | | | |
| | | | | Amount | | | | Value |
|
| |
| CORPORATE BONDS continued | | | | | | | | |
| UTILITIES continued | | | | | | | | |
| Multi-Utilities & Unregulated Power 0.0% | | | | | | | | |
| NRG Energy, Inc., 8.00%, 12/15/2013 144A | | $ | | 175,000 | | $ | | 188,344 |
| Reliant Resources, Inc., 9.50%, 07/15/2013 | | | | 200,000 | | | | 218,250 |
|
|
| | | | | | | | | 406,594 |
|
|
| Total Corporate Bonds (cost $68,484,344) | | | | | | | | 73,687,500 |
|
|
| U.S. TREASURY OBLIGATIONS 3.0% | | | | | | | | |
| U.S. Treasury Bonds, 6.00%, 02/15/2026 | | | | 20,915,000 | | | | 23,852,093 |
| U.S. Treasury Notes: | | | | | | | | |
| 2.75%, 07/31/2006 | | | | 340,000 | | | | 341,381 |
| 3.375%, 01/15/2007 | | | | 1,213,818 | | | | 1,297,221 |
| 5.00%, 08/15/2011 | | | | 1,240,000 | | | | 1,333,050 |
|
|
| Total U.S. Treasury Obligations (cost $25,918,455) | | | | | | | | 26,823,745 |
|
|
| YANKEE OBLIGATIONS-CORPORATE 0.3% | | | | | | | | |
| INFORMATION TECHNOLOGY 0.0% | | | | | | | | |
| Electronic Equipment & Instruments 0.0% | | | | | | | | |
| Celestica, Inc., 7.875%, 07/01/2011 | | | | 110,000 | | | | 114,675 |
|
|
| MATERIALS 0.3% | | | | | | | | |
| Metals & Mining 0.3% | | | | | | | | |
| Alcan, Inc., 6.125%, 12/15/2033 | | | | 2,500,000 | | | | 2,604,407 |
|
|
| TELECOMMUNICATION SERVICES 0.0% | | | | | | | | |
| Wireless Telecommunications Services 0.0% | | | | | | | | |
| Rogers Cantel, Inc., 9.75%, 06/01/2016 | | | | 200,000 | | | | 224,250 |
| Rogers Wireless, Inc., 6.375%, 03/01/2014 | | | | 200,000 | | | | 185,000 |
|
|
| | | | | | | | | 409,250 |
|
|
| Total Yankee Obligations-Corporate (cost $2,904,160) | | | | | | | | 3,128,332 |
|
|
| COMMERCIAL MORTGAGE-BACKED SECURITIES 2.5% | | | | | | | | |
| Fixed Rate 2.5% | | | | | | | | |
| Asset Securitization Corp., Ser. 1997-D4, Class A-1D, 7.49%, 04/14/2029 | | | | 681,874 | | | | 741,387 |
| Commercial Mtge. Pass-Through Cert., Ser. 2004-LB2A, Class A1, | | | | | | | | |
| 2.96%, 03/10/2039 | | | | 3,191,006 | | | | 3,149,570 |
| Credit Suisse First Boston Mtge. Securities Corp., Ser. 2001-CKN5, Class A4, | | | | | | | | |
| 5.44%, 09/15/2034 | | | | 1,905,000 | | | | 2,020,721 |
| GMAC Comml. Mtge. Securities, Inc., Ser. 2000-C3, Class A2, 6.96%, | | | | | | | | |
| 09/15/2035 | | | | 3,940,000 | | | | 4,489,561 |
| LB-UBS Comml. Mtge. Trust: | | | | | | | | |
| Ser. 2000-C4, Class A1, 7.18%, 09/15/2019 | | | | 2,956,298 | | | | 3,227,393 |
| Ser. 2002-C2, Class A4, 5.59%, 06/15/2031 | | | | 1,920,000 | | | | 2,060,245 |
| Ser. 2004-C1, Class A4, 4.57%, 01/15/2031 | | | | 2,885,000 | | | | 2,856,890 |
| Wachovia Bank Comml. Mtge. Trust, Ser. 2003-C8, Class A1, 3.44%, | | | | | | | | |
| 11/15/2035 | | | | 3,488,003 | | | | 3,466,145 |
|
|
| Total Commercial Mortgage-Backed Securities (cost $21,928,646) | | | | | | | | 22,011,912 |
|
|
See Notes to Financial Statements
16
SCHEDULE OF INVESTMENTS continued
September 30, 2004 (unaudited)
| | | | | | |
| | | Principal | | | | |
| | | Amount | | | | Value |
|
| |
| AGENCY MORTGAGE-BACKED COLLATERALIZED MORTGAGE | | | | | | |
| OBLIGATIONS 3.3% | | | | | | |
| Fixed Rate 3.3% | | | | | | |
| FHLMC: | | | | | | |
| Ser. 2727, Class PD, 4.50%, 06/15/2029 | | $ 3,300,000 | | $ | | 3,289,702 |
| Ser. 2752, Class PE, 5.00%, 02/15/2028 | | 3,172,000 | | | | 3,216,231 |
| Ser. 2773, Class EB, 4.50%, 08/15/2013 | | 3,115,000 | | | | 3,158,599 |
| Ser. 2780, Class BD, 4.50%, 10/15/2017 | | 3,575,000 | | | | 3,623,459 |
| Ser. 2840, Class OD, 5.00%, 07/15/2029 | | 3,793,000 | | | | 3,822,628 |
| FNMA: | | | | | | |
| Ser. 1999-8, Class QD, 6.00%, 03/25/2014 | | 751,730 | | | | 782,078 |
| Ser. 2001-69, Class PG, 6.00%, 12/25/2016 | | 4,013,000 | | | | 4,239,569 |
| Ser. 2002-09, Class PC, 6.00%, 03/25/2017 | | 865,000 | | | | 907,738 |
| Ser. 2003-92, Class PD, 4.50%, 03/25/2017 | | 3,605,000 | | | | 3,599,507 |
| Ser. 2004-33, Class MW, 4.50%, 01/25/2030 | | 2,617,000 | | | | 2,552,357 |
| | | | | |
|
| Total Agency Mortgage-Backed Collateralized Mortgage Obligations | | | | | | |
| (cost $28,920,945) | | | | | | 29,191,868 |
| | | | | |
|
| WHOLE LOAN MORTGAGE-BACKED COLLATERALIZED MORTGAGE | | | | | | |
| OBLIGATIONS 0.5% | | | | | | |
| Fixed Rate 0.5% | | | | | | |
| Wells Fargo Mtge. Backed Securities Trust: | | | | | | |
| Ser. 2004-N, Class A6, 4.00%, 08/25/2034 | | 1,585,000 | | | | 1,560,776 |
| Ser. 2004-S, Class A7, 3.54%, 09/25/2034 | | 2,845,000 | | | | 2,763,035 |
| | | | | |
|
| Total Whole Loan Mortgage-Backed Collateralized Mortgage Obligations | | | | | | |
| (cost $4,266,215) | | | | | | 4,323,811 |
| | | | | |
|
| AGENCY MORTGAGE-BACKED PASS-THROUGH SECURITIES 10.4% | | | | | | |
| Fixed Rate 10.4% | | | | | | |
| FHLMC: | | | | | | |
| 4.50%, TBA # | | 8,240,000 | | | | 7,938,729 |
| 5.00%, TBA # | | 605,000 | | | | 599,139 |
| 6.00%, 08/01/2013 | | 2,049,918 | | | | 2,154,473 |
| 6.50%, 06/01/2029 | | 97,320 | | | | 102,320 |
| 7.50%, 06/01/2032 | | 1,493,936 | | | | 1,603,914 |
| FNMA: | | | | | | |
| 4.50%, TBA # | | 12,555,000 | | | | 12,511,836 |
| 4.87%, 05/01/2013 | | 2,495,000 | | | | 2,568,857 |
| 5.00%, TBA # | | 3,720,000 | | | | 3,681,639 |
| 5.50%, TBA # | | 3,490,000 | | | | 3,536,899 |
| 6.00%, 12/01/2012 | | 3,438,895 | | | | 3,615,749 |
| 6.13%, 09/01/2008 | | 1,594,178 | | | | 1,714,400 |
| 6.23%, 06/01/2008 | | 3,865,014 | | | | 4,112,449 |
| 6.40%, 07/01/2011 | | 2,937,486 | | | | 3,237,743 |
| 6.50%, 07/01/2013 | �� | 8,057,101 | | | | 8,481,208 |
| 6.54%, 12/01/2007 | | 459,991 | | | | 494,170 |
| 6.56%, 12/01/2007 | | 1,741,706 | | | | 1,872,050 |
| 6.80%, 01/01/2007 | | 5,049,342 | | | | 5,345,846 |
| 7.00%, 05/01/2032 | | 2,318,916 | | | | 2,460,678 |
See Notes to Financial Statements
17
SCHEDULE OF INVESTMENTS continued
September 30, 2004 (unaudited)
| | | | | | | | |
| | | | | Principal | | | | |
| | | | | Amount | | | | Value |
|
| |
| AGENCY MORTGAGE-BACKED PASS-THROUGH SECURITIES continued | | | | | | |
| Fixed Rate continued | | | | | | | | |
| FNMA continued | | | | | | | | |
| 7.02%, 07/01/2009 | | | $ | 2,146,486 | | $ | | 2,379,310 |
| 7.06%, 08/01/2006 | | 2,272,811 | | | | 2,387,997 |
| 7.09%, 10/01/2007 | | 1,886,516 | | | | 2,035,447 |
| 7.14%, 07/01/2009 | | 1,906,335 | | | | 2,121,980 |
| 7.22%, 07/01/2007 | | 2,275,331 | | | | 2,451,134 |
| 7.32%, 12/01/2010 | | 2,567,991 | | | | 2,948,977 |
| 7.47%, 08/01/2007 | | 1,361,799 | | | | 1,467,940 |
| 7.50%, 12/01/2030 | | 1,455,841 | | | | 1,561,280 |
| 7.53%, 05/01/2007 | | 4,143,704 | | | | 4,467,660 |
| 9.00%, 08/01/2014 | | 1,353,439 | | | | 1,468,966 |
| GNMA: | | | | | | |
| 5.50%, 01/15/2034 | | 2,806,773 | | | | 2,860,731 |
| 6.50%, 10/15/2008 | | 564,690 | | | | 600,222 |
| | | | | |
|
| Total Agency Mortgage-Backed Pass-Through Securities | | | | | | |
| (cost $91,565,488) | | | | | | 92,783,743 |
| | | | | |
|
| WHOLE LOAN MORTGAGE-BACKED PASS-THROUGH SECURITIES 0.8% | | | | | | |
| Fixed Rate 0.8% | | | | | | |
| Master Alternative Loan Trust, 4.50%, 07/25/2019 | | 4,413,936 | | | | 4,470,576 |
| Residential Asset Mtge. Products, Inc., Ser. 2004-SL2, Class AI, 6.50%, | | | | | | |
| 10/25/2016 | | 2,333,540 | | | | 2,415,534 |
| | | | | |
|
| Total Whole Loan Mortgage-Backed Pass-Through Securities | | | | | | |
| (cost $6,666,386) | | | | | | 6,886,110 |
| | | | | |
|
| REPERFORMING MORTGAGE-BACKED PASS-THROUGH SECURITIES 1.8% | | | | | | |
| FNMA: | | | | | | |
| 7.50%, 02/25/2029 | | 693,136 | | 751,753 |
| Ser. 2001-T10, Class A1, 7.00%, 12/25/2041 | | 1,540,317 | | 1,641,772 |
| Ser. 2002-T4, Class A2, 7.00%, 12/25/2041 | | 1,899,493 | | 2,036,019 |
| Ser. 2003-W2, Class 1A2, 7.00%, 07/25/2042 | | 2,451,151 | | 2,627,328 |
| Ser. 2004-T1, Class 1A3, 7.00%, 01/25/2044 | | 2,633,117 | | 2,786,821 |
| Ser. 2004-W1, Class 2A2, 7.00%, 12/25/2033 | | 2,969,403 | | 3,142,543 |
| Ser. 2004-W9, Class 2A1, 6.50%, 02/25/2044 | | 2,905,822 | | 3,072,907 |
| | | |
|
| Total Reperforming Mortgage-Backed Pass-Through Securities | | |
| (cost $16,108,810) | | 16,059,143 |
| |
|
| REPERFORMING MORTGAGE-BACKED COLLATERALIZED MORTGAGE OBLIGATIONS 1.2% | | |
| FNMA: | | |
| Ser. 2003-W14, Class 1A6, 5.82%, 09/25/2043 | | 3,890,000 | | 4,030,250 |
| Ser. 2003-W19, Class 1A5, 5.50%, 11/25/2033 | | 6,345,000 | | 6,562,815 |
| | | |
|
| Total Reperforming Mortgage-Backed Collateralized Mortgage Obligations | | | | | |
| (cost $10,702,904) | | | | | | 10,593,065 |
| | | | | |
|
See Notes to Financial Statements
18
SCHEDULE OF INVESTMENTS continued
September 30, 2004 (unaudited)
| | | | | | |
| | | Shares | | | | Value |
|
| |
| COMMON STOCKS 62.7% | | | | | | |
| CONSUMER DISCRETIONARY 7.2% | | | | | | |
| Auto Components 0.3% | | | | | | |
| Lear Corp. | | 52,236 | | $ | | 2,844,250 |
| | | | | |
|
| Hotels, Restaurants & Leisure 0.3% | | | | | | |
| Starbucks Corp. * | | 64,596 | | | | 2,936,534 |
| | | | | |
|
| Household Durables 0.5% | | | | | | |
| Pulte Homes, Inc. | | 69,100 | | | | 4,240,667 |
| | | | | |
|
| Internet & Catalog Retail 0.4% | | | | | | |
| eBay, Inc. * | | 38,976 | | | | 3,583,453 |
| | | | | |
|
| Media 1.4% | | | | | | |
| Comcast Corp., Class A * | | 149,602 | | | | 4,224,761 |
| Viacom, Inc., Class A | | 20,833 | | | | 708,322 |
| Viacom, Inc., Class B | | 214,000 | | | | 7,181,840 |
| | | | | |
|
| | | | | | | 12,114,923 |
| | | | | |
|
| Multi-line Retail 0.9% | | | | | | |
| Nordstrom, Inc. | | 150,700 | | | | 5,762,768 |
| Target Corp. | | �� 58,000 | | | | 2,624,500 |
| | | | | |
|
| | | | | | | 8,387,268 |
| | | | | |
|
| Specialty Retail 2.3% | | | | | | |
| Best Buy Co., Inc. | | 112,041 | | | | 6,077,104 |
| Chico's FAS, Inc. * | | 59,300 | | | | 2,028,060 |
| Lowe's Companies, Inc. | | 140,291 | | | | 7,624,816 |
| Staples, Inc. | | 152,647 | | | | 4,551,933 |
| | | | | |
|
| | | | | | | 20,281,913 |
| | | | | |
|
| Textiles, Apparel & Luxury Goods 1.1% | | | | | | |
| Nike, Inc., Class B | | 74,600 | | | | 5,878,480 |
| Polo Ralph Lauren Corp., Class A | | 117,461 | | | | 4,272,057 |
| | | | | |
|
| | | | | | | 10,150,537 |
| | | | | |
|
| CONSUMER STAPLES 5.7% | | | | | | |
| Beverages 1.6% | | | | | | |
| Anheuser-Busch Companies, Inc. | | 57,813 | | | | 2,887,759 |
| Diageo plc | | 361,800 | | | | 4,517,769 |
| PepsiCo, Inc. | | 135,067 | | | | 6,571,010 |
| | | | | |
|
| | | | | | | 13,976,538 |
| | | | | |
|
| Food & Staples Retailing 2.9% | | | | | | |
| BJ's Wholesale Club, Inc. * | | 172,125 | | | | 4,705,898 |
| CVS Corp. | | 196,296 | | | | 8,269,950 |
| Wal-Mart Stores, Inc. | | 247,106 | | | | 13,146,039 |
| | | | | |
|
| | | | | | | 26,121,887 |
| | | | | |
|
| Household Products 1.0% | | | | | | |
| Procter & Gamble Co. | | 161,640 | | | | 8,747,957 |
| | | | | |
|
See Notes to Financial Statements
19
SCHEDULE OF INVESTMENTS continued
September 30, 2004 (unaudited)
| | | | | | |
| | | Shares | | | | Value |
|
| |
| COMMON STOCKS continued | | | | | | |
| CONSUMER STAPLES continued | | | | | | |
| Tobacco 0.2% | | | | | | |
| Altria Group, Inc. | | 39,695 | | $ | | 1,867,253 |
| | | | | |
|
| ENERGY 4.3% | | | | | | |
| Energy Equipment & Services 0.3% | | | | | | |
| Schlumberger, Ltd | | 32,400 | | | | 2,180,844 |
| | | | | |
|
| Oil & Gas 4.0% | | | | | | |
| Apache Corp. | | 133,340 | | | | 6,681,668 |
| BP Amoco plc, ADR | | 190,100 | | | | 10,936,453 |
| Exxon Mobil Corp. | | 309,382 | | | | 14,952,432 |
| Occidental Petroleum Corp. | | 60,300 | | | | 3,372,579 |
| | | | | |
|
| | | | | | | 35,943,132 |
| | | | | |
|
| FINANCIALS 13.4% | | | | | | |
| Capital Markets 1.4% | | | | | | |
| Goldman Sachs Group, Inc. | | 60,700 | | | | 5,659,668 |
| Morgan Stanley | | 138,801 | | | | 6,842,889 |
| | | | | |
|
| | | | | | | 12,502,557 |
| | | | | |
|
| Commercial Banks 3.5% | | | | | | |
| Bank of America Corp. | | 359,758 | | | | 15,588,314 |
| U.S. BanCorp. | | 206,367 | | | | 5,964,006 |
| Wells Fargo & Co. | | 91,195 | | | | 5,437,958 |
| Zions BanCorp. | | 72,900 | | | | 4,449,816 |
| | | | | |
|
| | | | | | | 31,440,094 |
| | | | | |
|
| Consumer Finance 1.4% | | | | | | |
| American Express Co. | | 138,821 | | | | 7,143,729 |
| Capital One Financial Corp. | | 69,100 | | | | 5,106,490 |
| | | | | |
|
| | | | | | | 12,250,219 |
| | | | | |
|
| Diversified Financial Services 3.0% | | | | | | |
| Citigroup, Inc. | | 413,667 | | | | 18,250,988 |
| JPMorgan Chase & Co. | | 230,028 | | | | 9,139,013 |
| | | | | |
|
| | | | | | | 27,390,001 |
| | | | | |
|
| Insurance 2.7% | | | | | | |
| American International Group, Inc. | | 209,597 | | | | 14,250,500 |
| Hartford Financial Services Group, Inc. | | 92,197 | | | | 5,709,760 |
| MetLife, Inc. | | 102,900 | | | | 3,977,085 |
| | | | | |
|
| | | | | | | 23,937,345 |
| | | | | |
|
| Thrifts & Mortgage Finance 1.4% | | | | | | |
| Countrywide Financial Corp. | | 170,800 | | | | 6,727,812 |
| Freddie Mac | | 87,800 | | | | 5,728,072 |
| | | | | |
|
| | | | | | | 12,455,884 |
| | | | | |
|
See Notes to Financial Statements
20
SCHEDULE OF INVESTMENTS continued
September 30, 2004 (unaudited)
| | | | | | |
| | | Shares | | | | Value |
|
| |
| COMMON STOCKS continued | | | | | | |
| HEALTH CARE 8.6% | | | | | | |
| Biotechnology 0.8% | | | | | | |
| Amgen, Inc. * | | 99,485 | | $ | | 5,638,810 |
| Genentech, Inc. * | | 33,904 | | | | 1,777,248 |
| | | | | |
|
| | | | | | | 7,416,058 |
| | | | | |
|
| Health Care Equipment & Supplies 2.0% | | | | | | |
| Medtronic, Inc. | | 67,016 | | | | 3,478,130 |
| Millipore Corp. * | | 97,400 | | | | 4,660,590 |
| St. Jude Medical, Inc. * | | 77,400 | | | | 5,825,898 |
| Zimmer Holdings, Inc. * | | 47,600 | | | | 3,762,304 |
| | | | | |
|
| | | | | | | 17,726,922 |
| | | | | |
|
| Health Care Providers & Services 2.1% | | | | | | |
| Aetna, Inc. | | 68,900 | | | | 6,885,177 |
| Anthem, Inc. * | | 61,896 | | | | 5,400,426 |
| Caremark Rx, Inc. * | | 202,600 | | | | 6,497,382 |
| | | | | |
|
| | | | | | | 18,782,985 |
| | | | | |
|
| Pharmaceuticals 3.7% | | | | | | |
| Abbott Laboratories | | 48,300 | | | | 2,045,988 |
| Johnson & Johnson | | 192,732 | | | | 10,856,593 |
| Merck & Co., Inc. | | 131,638 | | | | 4,344,054 |
| Pfizer, Inc. | | 365,688 | | | | 11,190,053 |
| Wyeth | | 125,974 | | | | 4,711,428 |
| | | | | |
|
| | | | | | | 33,148,116 |
| | | | | |
|
| INDUSTRIALS 8.6% | | | | | | |
| Aerospace & Defense 1.7% | | | | | | |
| Lockheed Martin Corp. | | 157,838 | | | | 8,804,204 |
| United Technologies Corp. | | 70,300 | | | | 6,564,614 |
| | | | | |
|
| | | | | | | 15,368,818 |
| | | | | |
|
| Airlines 0.2% | | | | | | |
| Southwest Airlines Co. | | 150,000 | | | | 2,043,000 |
| | | | | |
|
| Building Products 1.4% | | | | | | |
| American Standard Companies, Inc. * | | 134,019 | | | | 5,214,679 |
| Masco Corp. | | 194,500 | | | | 6,716,085 |
| | | | | |
|
| | | | | | | 11,930,764 |
| | | | | |
|
| Commercial Services & Supplies 0.5% | | | | | | |
| Cendant Corp. | | 210,117 | | | | 4,538,527 |
| | | | | |
|
| Industrial Conglomerates 3.4% | | | | | | |
| General Electric Co. | | 672,971 | | | | 22,598,366 |
| Tyco International, Ltd | | 249,484 | | | | 7,649,180 |
| | | | | |
|
| | | | | | | 30,247,546 |
| | | | | |
|
See Notes to Financial Statements
21
SCHEDULE OF INVESTMENTS continued
September 30, 2004 (unaudited)
| | | | | | | | |
| | | | | Shares | | | | Value |
|
| |
| COMMON STOCKS continued | | | | | | | | |
| INDUSTRIALS continued | | | | | | | | |
| Machinery 1.4% | | | | | | | | |
| Deere & Co. | | | | 111,707 | | $ | | 7,210,687 |
| Dover Corp. | | | | 143,729 | | | | 5,586,746 |
|
|
| | | | | | | | | 12,797,433 |
|
|
| INFORMATION TECHNOLOGY 10.8% | | | | | | | | |
| Communications Equipment 1.5% | | | | | | | | |
| Cisco Systems, Inc. * | | | | 311,952 | | | | 5,646,331 |
| Corning, Inc. | | | | 225,653 | | | | 2,500,236 |
| QUALCOMM, Inc. | | | | 129,900 | | | | 5,071,296 |
|
|
| | | | | | | | | 13,217,863 |
|
|
| Computers & Peripherals 2.4% | | | | | | | | |
| Dell, Inc. * | | | | 232,961 | | | | 8,293,411 |
| Hewlett-Packard Co. | | | | 177,408 | | | | 3,326,400 |
| International Business Machines Corp. | | | | 68,282 | | | | 5,854,499 |
| Lexmark International, Inc., Class A * | | | | 42,900 | | | | 3,604,029 |
|
|
| | | | | | | | | 21,078,339 |
|
|
| IT Services 1.1% | | | | | | | | |
| Accenture, Ltd., Class A * | | | | 271,090 | | | | 7,332,985 |
| Cognizant Technology Solutions Corp., Class A * | | | | 91,400 | | | | 2,788,614 |
|
|
| | | | | | | | | 10,121,599 |
|
|
| Semiconductors & Semiconductor Equipment1.5% | | | | | | |
| Altera Corp. * | | 187,675 | | | | 3,672,800 |
| Intel Corp. | | 260,083 | | | | 5,217,265 |
| Texas Instruments, Inc. | | 222,459 | | | | 4,733,927 |
| | | | | |
|
| | | | | | | | | 13,623,992 |
|
|
| Software 4.3% | | | | | | | | |
| Citrix Systems, Inc. * | | | | 171,700 | | | | 3,008,184 |
| Intuit, Inc. * | | | | 92,600 | | | | 4,204,040 |
| Microsoft Corp. | | | | 715,702 | | | | 19,789,160 |
| Oracle Corp. * | | | | 989,696 | | | | 11,163,771 |
|
|
| | | | | | | | | 38,165,155 |
|
|
| MATERIALS 2.5% | | | | | | | | |
| Chemicals 1.5% | | | | | | | | |
| Air Products & Chemicals, Inc. | | | | 126,227 | | | | 6,864,224 |
| PPG Industries, Inc. | | | | 100,179 | | | | 6,138,969 |
|
|
| | | | | | | | | 13,003,193 |
|
|
| Metals & Mining 0.6% | | | | | | | | |
| Alcoa, Inc. | | | | 167,971 | | | | 5,642,147 |
|
|
| Paper & Forest Products 0.4% | | | | | | | | |
| Weyerhaeuser Co. | | | | 52,400 | | | | 3,483,552 |
|
|
See Notes to Financial Statements
22
SCHEDULE OF INVESTMENTS continued
September 30, 2004 (unaudited)
| | | | | | |
| | | Shares | | | | Value |
|
| COMMON STOCKS continued | | | | | | |
| TELECOMMUNICATION SERVICES 1.1% | | | | | | |
| Diversified Telecommunication Services 1.1% | | | | | | |
| Verizon Communications, Inc. | | 256,759 | | $ | | 10,111,169 |
| | | | | |
|
| UTILITIES 0.5% | | | | | | |
| Multi-Utilities & Unregulated Power 0.5% | | | | | | |
| ONEOK, Inc. | | 155,470 | | | | 4,045,329 |
| | | | | |
|
| Total Common Stocks (cost $493,940,161) | | | | | | 559,845,763 |
| | | | | |
|
| SHORT-TERM INVESTMENTS 7.1% | | | | | | |
| MUTUAL FUND SHARES 7.1% | | | | | | |
| Evergreen Institutional U.S. Government Money Market Fund ø ## | | | | | | |
| (cost $63,908,730) | | 63,908,730 | | | | 63,908,730 |
| | | | | |
|
| Total Investments (cost $842,835,283) 102.6% | | | | | | 916,831,230 |
| Other Assets and Liabilities (2.6%) | | | | | | (23,255,234) |
| | | | | |
|
| Net Assets 100.0% | | | | $ | | 893,575,996 |
| | | | | |
|
| | |
| 144A | | Security that may be resold to qualified institutional buyers under Rule 144A of the Securities Act of 1933, as amended. |
| | | This security has been determined to be liquid under guidelines established by the Board of Trustees. |
| # | | When-issued or delayed delivery security |
| * | | Non-income producing security |
| ø | | Evergreen Investment Management Company, LLC is the investment advisor to both the Fund and the money market |
| | | fund. |
| ## | | All or a portion of this security has been segregated for when-issued or delayed delivery securities. |
| |
| Summaryof Abbreviations |
| ADR | | American Depositary Receipt |
| FHLMC | | Federal Home Loan Mortgage Corp. |
| FNMA | | Federal National Mortgage Association |
| GNMA | | Government National Mortgage Association |
| REIT | | Real Estate Investment Trust |
| TBA | | To Be Announced |
See Notes to Financial Statements
23
SCHEDULE OF INVESTMENTS continued
September 30, 2004 (unaudited)
The following table shows portfolio composition as a percent of total investments as of September 30, 2004:
| | |
| Common Stocks | | 61.0% |
| Agency Mortgage-Backed Pass-Through | | |
| Securities | | 10.1% |
| Corporate Bonds | | 8.0% |
| Cash Equivalents | | 7.0% |
| Agency Mortgage-Backed Collateralized | | |
| Mortgage Obligations | | 3.2% |
| U.S. Treasury Obligations | | 2.9% |
| Commercial Mortgage-Backed Securities | | 2.4% |
| Reperforming Mortgage-Backed | | |
| Pass-Through Securities | | 1.8% |
| Reperforming Mortgage-Backed | | |
| Collateralized Mortgage Obligations | | 1.2% |
| Whole Loan Mortgage-Backed | | |
| Pass-Through Securities | | 0.8% |
| Asset-Backed Securities | | 0.8% |
| Whole Loan Mortgage-Backed | | |
| Collateralized Mortgage Obligations | | 0.5% |
| Yankee Obligations-Corporate | | 0.3% |
| |
|
| | | 100% |
| |
|
The following table shows the percent of total bonds by credit quality based on Moody's and Standard & Poor's ratings as of September 30, 2004:
| | |
| AAA | | 72.7% |
| A | | 6.7% |
| BBB | | 11.8% |
| BB | | 2.6% |
| B | | 4.7% |
| NR | | 1.5% |
| |
|
| | | 100.0% |
| | |
|
The following table shows the percent of total bonds by maturity as of September 30, 2004:
| | |
| Less than 1 year | | 6.0% |
| 1 to 3 year(s) | | 29.0% |
| 3 to 5 years | | 19.0% |
| 5 to 10 years | | 34.0% |
| 10 to 20 years | | 1.0% |
| 20 to 30 years | | 11.0% |
| |
|
| | | 100.0% |
| | |
|
See Notes to Financial Statements
24
STATEMENT OF ASSETS AND LIABILITIES
September 30, 2004 (unaudited)
| | | | |
|
| Assets | | | | |
| Investments in securities, at value (cost $842,835,283) | | $ | | 916,831,230 |
| Receivable for securities sold | | | | 5,566,337 |
| Receivable for Fund shares sold | | | | 37,369 |
| Dividends and interest receivable | | | | 2,985,570 |
| Prepaid expenses and other assets | | | | 88,036 |
|
| Total assets | | | | 925,508,542 |
|
| Liabilities | | | | |
| Payable for securities purchased | | | | 29,696,966 |
| Payable for Fund shares redeemed | | | | 1,966,519 |
| Advisory fee payable | | | | 9,125 |
| Distribution Plan expenses payable | | | | 7,882 |
| Due to other related parties | | | | 27,599 |
| Accrued expenses and other liabilities | | | | 224,455 |
|
| Total liabilities | | | | 31,932,546 |
|
| Net assets | | $ | | 893,575,996 |
|
| Net assets represented by | | | | |
| Paid-in capital | | $ | | 938,172,338 |
| Overdistributed net investment income | | | | (989,449) |
| Accumulated net realized losses on securities and foreign currency related transactions | | | | (117,602,840) |
| Net unrealized gains on securities | | | | 73,995,947 |
|
| Total net assets | | $ | | 893,575,996 |
|
| Net assets consists of | | | | |
| Class A | | $ | | 620,284,095 |
| Class B | | | | 86,559,942 |
| Class C | | | | 14,350,179 |
| Class I | | | | 172,381,780 |
|
| Total net assets | | $ | | 893,575,996 |
|
| Shares outstanding | | | | |
| Class A | | | | 77,343,264 |
| Class B | | | | 10,794,429 |
| Class C | | | | 1,786,212 |
| Class I | | | | 21,579,809 |
|
| Net asset value per share | | | | |
| Class A | | $ | | 8.02 |
| Class A - Offering price (based on sales charge of 5.75%) | | $ | | 8.51 |
| Class B | | $ | | 8.02 |
| Class C | | $ | | 8.03 |
| Class I | | $ | | 7.99 |
|
See Notes to Financial Statements
25
STATEMENT OF OPERATIONS
Six Months Ended September 30, 2004 (unaudited)
| | | | |
|
| Investment income | | | | |
| Interest | | $ | | 7,879,508 |
| Dividends (net of foreign withholding taxes of $10,074) | | | | 4,150,359 |
|
| Total investment income | | | | 12,029,867 |
|
| Expenses | | | | |
| Advisory fee | | | | 1,793,688 |
| Distribution Plan expenses | | | | |
| Class A | | | | 970,785 |
| Class B | | | | 456,195 |
| Class C | | | | 74,518 |
| Administrative services fee | | | | 471,092 |
| Transfer agent fees | | | | 883,956 |
| Trustees' fees and expenses | | | | 7,221 |
| Printing and postage expenses | | | | 50,101 |
| Custodian and accounting fees | | | | 95,864 |
| Registration and filing fees | | | | 19,571 |
| Professional fees | | | | 12,557 |
| Other | | | | 10,012 |
|
| Total expenses | | | | 4,845,560 |
| Less: Expense reductions | | | | (2,176) |
|
| Net expenses | | | | 4,843,384 |
|
| Net investment income | | | | 7,186,483 |
|
| Net realized and unrealized gains or losses on securities and foreign currency | | | | |
| related transactions | | | | |
| Net realized gains on: | | | | |
| Securities | | | | 16,560,235 |
| Foreign currency related transactions | | | | 3,048 |
|
| Net realized gains on securities and foreign currency related transactions | | | | 16,563,283 |
| Net change in unrealized gains or losses on securities | | | | (37,537,911) |
|
| Net realized and unrealized gains or losses on securities and foreign currency related transactions | | | | (20,974,628) |
|
| Net decrease in net assets resulting from operations | | $ | | (13,788,145) |
|
See Notes to Financial Statements
26
STATEMENTS OF CHANGES IN NET ASSETS
| | | | | | | | |
| | | Six MonthsEnded | | | | |
| | | September30, 2004 | | Year Ended |
| | | (unaudited) | | March 31,2004 |
|
| Operations | | | | | | | | |
| Net investment income | | | | $ 7,186,483 | | | | $ 16,885,358 |
| Net realized gains on securities and | | | | | | | | |
| foreign currency related transactions | | | | 16,563,283 | | | | 47,447,294 |
| Net change in unrealized gains or losses | | | | | | | | |
| on securities | | | | (37,537,911) | | | | 130,113,139 |
|
| Net increase (decrease) in net assets | | | | | | | | |
| resulting from operations | | | | (13,788,145) | | | | 194,445,791 |
|
| Distributions to shareholders from | | | | | | | | |
| Net investment income | | | | | | | | |
| Class A | | | | (5,669,227) | | | | (13,123,207) |
| Class B | | | | (474,127) | | | | (1,159,297) |
| Class C | | | | (77,101) | | | | (173,475) |
| Class I | | | | (1,918,058) | | | | (5,083,655) |
|
| Total distributions to shareholders | | | | (8,138,513) | | | | (19,539,634) |
|
| | | Shares | | | | Shares | | |
| Capital share transactions | | | | | | | | |
| Proceeds from shares sold | | | | | | | | |
| Class A | | 728,688 | | 5,837,820 | | 2,435,928 | | 18,846,671 |
| Class B | | 376,049 | | 3,016,687 | | 1,282,480 | | 9,915,408 |
| Class C | | 109,148 | | 875,277 | | 741,937 | | 5,747,688 |
| Class I | | 1,017,430 | | 8,125,417 | | 2,767,778 | | 21,550,051 |
|
| | | | | 17,855,201 | | | | 56,059,818 |
|
| Net asset value of shares issued in | | | | | | | | |
| reinvestment of distributions | | | | | | | | |
| Class A | | 592,647 | | 4,764,713 | | 1,397,375 | | 10,981,365 |
| Class B | | 53,277 | | 428,327 | | 133,533 | | 1,048,688 |
| Class C | | 8,701 | | 70,040 | | 19,783 | | 156,184 |
| Class I | | 127,059 | | 1,017,069 | | 295,151 | | 2,325,107 |
|
| | | | | 6,280,149 | | | | 14,511,344 |
|
| Automatic conversion of Class B shares | | | | | | | | |
| to Class A shares | | | | | | | | |
| Class A | | 292,037 | | 2,347,729 | | 420,067 | | 3,266,904 |
| Class B | | (292,330) | | (2,347,729) | | (420,505) | | (3,266,904) |
|
| | | | | 0 | | | | 0 |
|
| Payment for shares redeemed | | | | | | | | |
| Class A | | (8,165,538) | | (65,491,585) | | (17,770,006) | | (138,164,913) |
| Class B | | (1,330,458) | | (10,659,995) | | (2,341,268) | | (18,195,095) |
| Class C | | (289,438) | | (2,313,193) | | (383,355) | | (2,988,120) |
| Class I | | (5,964,568) | | (47,719,203) | | (23,910,082) | | (183,902,234) |
|
| | | | | (126,183,976) | | | | (343,250,362) |
|
| Net asset value of shares issued in | | | | | | | | |
| acquisition | | | | | | | | |
| Class A | | 0 | | 0 | | 229,629 | | 1,741,067 |
| Class I | | 0 | | 0 | | 19,938,828 | | 150,597,452 |
|
| | | | | 0 | | | | 152,338,519 |
|
| Net decrease in net assets resulting from | | | | | | | | |
| capital share transactions | | | | (102,048,626) | | | | (120,340,681) |
|
| Total increase (decrease) in net assets | | | | (123,975,284) | | | | 54,565,476 |
| Net assets | | | | | | | | |
| Beginning of period | | | | 1,017,551,280 | | | | 962,985,804 |
|
| End of period | | | | $ 893,575,996 | | | | $1,017,551,280 |
|
| Overdistributed net investment income | | | | $ (989,449) | | | | $ (37,419) |
|
See Notes to Financial Statements
27
NOTES TO FINANCIAL STATEMENTS (unaudited)
1. ORGANIZATION
Evergreen Balanced Fund (the "Fund") is a diversified series of Evergreen Equity Trust (the "Trust"), a Delaware statutory trust organized on September 18, 1997. The Trust is an open-end management investment company registered under the Investment Company Act of 1940, as amended (the "1940 Act").
The Fund offers Class A, Class B, Class C and Institutional ("Class I") shares. Class A shares are sold with a front-end sales charge. However, Class A share investments of $1 million or more are not subject to a front-end sales charge but will be subject to a contingent deferred sales charge of 1.00% upon redemption within one year. Class B shares are sold without a front-end sales charge but are subject to a contingent deferred sales charge that is payable upon redemption and decreases depending on how long the shares have been held. Effective February 2, 2004, Class C shares are no longer sold with a front-end sales charge but are still subject to a contingent deferred sales charge that is payable upon redemption within one year. Class I shares are sold without a front-end sales charge or contingent deferred sales charge. Each class of shares, except Class I shares, pays an ongoing distribution fee.
2. SIGNIFICANT ACCOUNTING POLICIES
The following is a summary of significant accounting policies consistently followed by the Fund in the preparation of its financial statements. The policies are in conformity with generally accepted accounting principles in the United States of America, which require management to make estimates and assumptions that affect amounts reported herein. Actual results could differ from these estimates.
a. Valuation of investments
Listed equity securities are usually valued at the last sales price or official closing price on the national securities exchange where the securities are principally traded.
Foreign securities traded on an established exchange are valued at the last sales price on the exchange where the security is primarily traded. If there has been no sale, the securities are valued at the mean between bid and asked prices. Foreign securities may be valued at fair value according to procedures approved by the Board of Trustees if the closing price is not reflective of current market prices due to trading or events occurring in the foreign markets between the close of the established exchange and the valuation time of the Fund. In addition, substantial changes in values in the U.S. markets subsequent to the close of a foreign market may also affect the values of securities traded in the foreign market. The value of foreign securities may be adjusted if such movements in the U.S. market exceed a specified threshold.
Portfolio debt securities acquired with more than 60 days to maturity are valued at prices obtained from an independent pricing service which takes into consideration such factors as similar security prices, yields, maturities, liquidity and ratings. Securities for which valuations are not available from an independent pricing service may be valued by brokers which use prices provided by market makers or estimates of market value obtained from yield data relating to investments or securities with similar characteristics.
28
NOTES TO FINANCIAL STATEMENTS (unaudited) continued
Short-term securities with remaining maturities of 60 days or less at the time of purchase are valued at amortized cost, which approximates market value.
Investments in other mutual funds are valued at net asset value. Securities for which market quotations are not available or not reflective of current market value are valued at fair value as determined in good faith, according to procedures approved by the Board of Trustees.
b. Foreign currency translation
All assets and liabilities denominated in foreign currencies are translated into U.S. dollar amounts at the date of valuation. Purchases and sales of portfolio securities and income items denominated in foreign currencies are translated into U.S. dollar amounts on the respective dates of such transactions. The Fund does not separately account for that portion of the results of operations resulting from changes in foreign exchange rates on investments and the fluctuations arising from changes in market prices of securities held. Such fluctuations are included with the net realized and unrealized gains or losses on securities.
c. When-issued and delayed delivery transactions
The Fund records when-issued or delayed delivery securities as of trade date and maintains security positions such that sufficient liquid assets will be available to make payment for the securities purchased. Securities purchased on a when-issued or delayed delivery basis are marked-to-market daily and begin earning interest on the settlement date. Losses may occur on these transactions due to changes in market conditions or the failure of counterparties to perform under the contract.
d. Dollar roll transactions
The Fund may enter into dollar roll transactions with respect to mortgage-backed securities. In a dollar roll transaction, the Fund sells mortgage-backed securities to financial institutions and simultaneously agrees to accept substantially similar (same type, coupon and maturity) securities at a later date at an agreed upon price. The Fund will use the proceeds generated from the transactions to invest in short-term investments, which may enhance the Fund's current yield and total return. The Fund accounts for dollar roll transactions as purchases and sales.
e. Security transactions and investment income
Security transactions are recorded on trade date. Realized gains and losses are computed using the specific cost of the security sold. Interest income is recorded on the accrual basis and includes accretion of discounts and amortization of premiums. Dividend income is recorded on the ex-dividend date or in the case of some foreign securities, on the date when the Fund is made aware of the dividend. Foreign income and capital gains realized on some securities may be subject to foreign taxes, which are accrued as applicable.
f. Federal taxes
The Fund intends to continue to qualify as a regulated investment company and distribute all of its taxable income, including any net capital gains (which have already been offset by available capital loss carryovers). Accordingly, no provision for federal taxes is required.
29
NOTES TO FINANCIAL STATEMENTS (unaudited) continued
g. Distributions
Distributions to shareholders from net investment income and net realized gains, if any, are recorded on the ex-dividend date. Such distributions are determined in conformity with income tax regulations, which may differ from generally accepted accounting principles.
h. Class allocations
Income, common expenses and realized and unrealized gains and losses are allocated to the classes based on the relative net assets of each class. Distribution fees, if any, are calculated daily at the class level based on the appropriate net assets of each class and the specific expense rates applicable to each class.
3. ADVISORY FEE AND OTHER TRANSACTIONS WITH AFFILIATES
Evergreen Investment Management Company, LLC ("EIMC"), an indirect, wholly-owned subsidiary of Wachovia Corporation ("Wachovia"), is the investment advisor to the Fund and is paid a fee at an annual rate of 1.5% of the Fund's gross investment income plus an amount determined by applying percentage rates to the average daily net assets of the Fund, starting at 0.41% and declining to 0.21% as average daily net assets increase.
Tattersall Advisory Group, Inc., an indirect, wholly-owned subsidiary of Wachovia, is the investment sub-advisor to the fixed income portion of the Fund and is paid by EIMC for its services to the Fund.
From time to time, EIMC may voluntarily or contractually waive its fee and/or reimburse expenses in order to limit operating expenses. For fee waivers and/or reimbursements made after January 1, 2003, EIMC may recoup certain amounts waived and/or reimbursed up to a period of three years following the end of the fiscal year in which the fee waivers and/or reimbursements were made.
Evergreen Investment Services, Inc. ("EIS"), an indirect, wholly-owned subsidiary of Wachovia, is the administrator to the Fund. As administrator, EIS provides the Fund with facilities, equipment and personnel and is paid an annual rate determined by applying percentage rates to the aggregate average daily net assets of the Evergreen funds (excluding money market funds), starting at 0.10% and declining to 0.05% as the aggregate average daily net assets of the Evergreen funds (excluding money market funds) increase.
Evergreen Service Company, LLC ("ESC"), an indirect, wholly-owned subsidiary of Wachovia, is the transfer and dividend disbursing agent for the Fund. ESC receives account fees that vary based on the type of account held by the shareholders in the Fund. For the six months ended September 30, 2004 the transfer agent fees were equivalent to an annual rate of 0.19% of the Fund's average daily net assets.
The Fund has placed a portion of its portfolio transactions with brokerage firms that are affiliates of Wachovia. During the six months ended September 30, 2004 the Fund paid brokerage commissions of $90,801 to Wachovia Securities, LLC.
30
NOTES TO FINANCIAL STATEMENTS (unaudited) continued
4. DISTRIBUTION PLANS
EIS also serves as distributor of the Fund's shares. Prior to May 1, 2004, Evergreen Distributor, Inc., a wholly-owned subsidiary of BISYS Fund Services, Inc., served as the Fund's distributor.
The Fund has adopted Distribution Plans, as allowed by Rule 12b-1 of the 1940 Act, for each class of shares, except Class I. Under the Distribution Plans, distribution fees are paid at an annual rate of 0.30% of the average daily net assets for Class A shares and 1.00% of the average daily net assets for each of Class B and Class C shares.
For the six months ended September 30, 2004, EIS received $7,757 from the sale of Class A shares and $75,774 and $2,589 in contingent deferred sales charges from redemptions of Class B and Class C shares, respectively.
5. ACQUISITION
Effective at the close of business on June 13, 2003, the Fund acquired the net assets of Evergreen Select Balanced Fund in a tax-free exchange for Class A and Class I shares of the Fund. Shares were issued to Class IS and Class I shares of Evergreen Select Balanced Fund at an exchange ratio of 1.34 and 1.34 for Class A and Class I shares, respectively, of the Fund. The acquired net assets consisted primarily of portfolio securities with unrealized appreciation of $13,669,638. The aggregate net assets of the Fund and the Evergreen Select Balanced Fund immediately prior to the acquisition were $1,003,038,972 and $152,338,519, respectively. The aggregate net assets of the Fund immediately after the acquisition were $1,155,377,491.
6. SECURITIES TRANSACTIONS
Cost of purchases and proceeds from sales of investment securities (excluding short-term securities) were as follows for the six months ended September 30, 2004:
| | | | | | |
| Cost of Purchases | | Proceeds from Sales |
|
| U.S. | | Non-U.S. | | U.S. | | Non-U.S. |
| Government | | Government | | Government | | Government |
|
| $271,142,619 | | $275,824,440 | | $295,556,279 | | $362,711,374 |
|
On September 30, 2004, the aggregate cost of securities for federal income tax purposes was $849,233,121. The gross unrealized appreciation and depreciation on securities based on tax cost was $75,496,658 and $7,898,549, respectively, with a net unrealized appreciation of $67,598,109.
As of March 31, 2004, the Fund had $126,366,254 in capital loss carryovers for federal income tax purposes with $47,021,627 expiring in 2009, $51,415,783 expiring in 2010 and $27,928,844 expiring in 2011.
7. INTERFUND LENDING
Pursuant to an Exemptive Order issued by the SEC, the Fund may participate in an interfund lending program with certain funds in the Evergreen fund family. This program allows the Fund
31
NOTES TO FINANCIAL STATEMENTS (unaudited) continued
to borrow from, or lend money to, other participating funds. During the six months ended September 30, 2004 the Fund did not participate in the interfund lending program.
8. EXPENSE REDUCTIONS
Through expense offset arrangements with ESC and the Fund's custodian, a portion of fund expenses has been reduced.
9. DEFERRED TRUSTEES' FEES
Each Trustee of the Fund may defer any or all compensation related to performance of their duties as Trustees. The Trustees' deferred balances are allocated to deferral accounts, which are included in the accrued expenses for the Fund. The investment performance of the deferral accounts are based on the investment performance of certain Evergreen funds. Any gains earned or losses incurred in the deferral accounts are reported in the Fund's Trustees' fees and expenses. At the election of the Trustees, the deferral account will be paid either in one lump sum or in quarterly installments for up to ten years.
10. FINANCING AGREEMENT
The Fund and certain other Evergreen funds share in a $150 million unsecured revolving credit commitment for temporary and emergency purposes, including the funding of redemptions, as permitted by each participating fund's borrowing restrictions. Borrowings under this facility bear interest at 0.50% per annum above the Federal Funds rate. All of the participating funds are charged an annual commitment fee of 0.09% of the unused balance, which is allocated pro rata. During the six months ended September 30, 2004, the Fund had no borrowings under this agreement.
11. LITIGATION
From time to time, the Fund and EIMC are involved in various legal actions in the normal course of business. In EIMC's opinion, based upon the opinions of counsel, the Fund is not involved in any legal action that will have a material effect on the Fund's financial position and results of operations.
12. REGULATORY MATTERS
Since September 2003, governmental and self-regulatory authorities have instituted numerous ongoing investigations of various practices in the mutual fund industry, including investigations relating to revenue sharing, market-timing, late trading and record retention, among other things. The investigations cover investment advisors, distributors and transfer agents to mutual funds, as well as other firms. EIMC, EIS and ESC (collectively, "Evergreen") have received subpoenas and other requests for documents and testimony relating to these investigations, are endeavoring to comply with those requests, and are cooperating with the investigations. Evergreen is continuing its own internal review of policies, practices, procedures and personnel, and is taking remedial action where appropriate.
32
NOTES TO FINANCIAL STATEMENTS (unaudited) continued
In connection with one of these investigations, on July 28, 2004, the staff of the Securities and Exchange Commission ("SEC") informed Evergreen that the staff intends to recommend to the SEC that it institute an enforcement action against Evergreen. The SEC staff's proposed allegations relate to (i) an arrangement pursuant to which a broker at one of EIMC's affiliated broker-dealers had been authorized, apparently by an EIMC officer (no longer with EIMC), to engage in short-term trading, on behalf of a client, in Evergreen Mid Cap Growth Fund (formerly Evergreen Small Company Growth Fund and prior to that, known as Evergreen Emerging Growth Fund) during the period from December 2000 through April 2003, in excess of the limitations set forth in this fund's prospectus, (ii) short-term trading from September 2001 through January 2003, by a former Evergreen portfolio manager of Evergreen Precious Metals Fund, a fund he managed at the time, (iii) the sufficiency of systems for monitoring exchanges and enforcing exchange limitations as stated in each fund's prospectuses, and (iv) the adequacy of e-mail retention practices. In connection with the activity in Evergreen Mid Cap Growth Fund, EIMC reimbursed this fund $378,905, plus an additional $25,242, representing what EIMC calculated at that time to be the client's net gain and the fees earned by EIMC and the expenses incurred by this fund on the client's account. In connection with the activity in Evergreen Precious Metals Fund, EIMC reimbursed this fund $70,878, plus an additional $3,075, representing what EIMC calculated at that time to be the portfolio manager's net gain and the fees earned by EIMC and expenses incurred by this fund on the portfolio manager's account. Evergreen currently intends to make a written Wells submission explaining why it believes that no such enforcement action should be instituted, and Evergreen also intends to engage in discussions with the staff of the SEC concerning its recommendation.
Any resolution of these matters with regulatory authorities may include, but not be limited to, sanctions, penalties or injunctions regarding Evergreen, restitution to mutual fund shareholders and/or other financial penalties and structural changes in the governance or management of Evergreen's mutual fund business. Any penalties or restitution will be paid by Evergreen and not by the Evergreen funds.
Evergreen does not believe the foregoing investigations and action will have a material adverse impact on the Evergreen funds. There can be no assurance, however, that these matters and any publicity surrounding or resulting from them will not result in reduced sales or increased redemptions of fund shares, which could increase fund transaction costs or operating expenses, or have other adverse consequences on the Evergreen funds.
33
This page left intentionally blank
34
This page left intentionally blank
35
TRUSTEES AND OFFICERS
| | |
| TRUSTEES1 | | |
| Charles A. Austin III | | Principal occupations: Investment Counselor, Anchor Capital Advisors, Inc. (investment advice); |
| Trustee | | Director, The Andover Companies (insurance); Trustee, Arthritis Foundation of New England; |
| DOB: 10/23/1934 | | Director, The Francis Ouimet Society; Former Director, Health Development Corp. (fitness- |
| Term of office since: 1991 | | wellness centers); Former Director, Mentor Income Fund, Inc.; Former Trustee, Mentor Funds and |
| | | Cash Resource Trust; Former Investment Counselor, Appleton Partners, Inc. (investment advice); |
| Other directorships: None | | Former Director, Executive Vice President and Treasurer, State Street Research & Management |
| | | Company (investment advice) |
|
| |
| Shirley L. Fulton | | Principal occupations: Partner, Helms, Henderson & Fulton, P.A. (law firm); Retired Senior |
| Trustee | | Resident Superior Court Judge, 26th Judicial District, Charlotte, NC |
| DOB: 1/10/1952 | | |
| Term of office since: 2004 | | |
| Other directorships: None | | |
|
| |
| K. Dun Gifford | | Principal occupations: Chairman and President, Oldways Preservation and Exchange Trust |
| Trustee | | (education); Trustee, Treasurer and Chairman of the Finance Committee, Cambridge College; |
| DOB: 10/23/1938 | | Former Chairman of the Board, Director, and Executive Vice President, The London Harness |
| Term of office since: 1974 | | Company (leather goods purveyor); Former Director, Mentor Income Fund, Inc.; Former Trustee, |
| | | Mentor Funds and Cash Resource Trust |
| Other directorships: None | | |
|
| |
| Dr. Leroy Keith, Jr. | | Principal occupations: Partner, Stonington Partners, Inc. (private investment firm); Trustee of |
| Trustee | | Phoenix Series Fund, Phoenix Multi-Portfolio Fund, and The Phoenix Big Edge Series Fund; |
| DOB: 2/14/1939 | | Former Chairman of the Board and Chief Executive Officer, Carson Products Company |
| Term of office since: 1983 | | (manufacturing); Director, Obagi Medical Products Co.; Director, Lincoln Educational Services; |
| | | Director, Diversapack Co.; Former President, Morehouse College; Former Director, Mentor |
| Other directorships: Trustee, | | Income Fund, Inc.; Former Trustee, Mentor Funds and Cash Resource Trust |
| Phoenix Series Fund, Phoenix | | |
| Multi-Portfolio Fund, and The | | |
| Phoenix Big Edge Series Fund | | |
|
| |
| Gerald M. McDonnell | | Principal occupations: Manager of Commercial Operations, SMI STEEL Co. – South Carolina |
| Trustee | | (steel producer); Former Sales and Marketing Management, Nucor Steel Company; Former |
| DOB: 7/14/1939 | | Director, Mentor Income Fund, Inc.; Former Trustee, Mentor Funds and Cash Resource Trust |
| Term of office since: 1988 | | |
| Other directorships: None | | |
|
| |
| William Walt Pettit | | Principal occupations: Partner and Vice President, Kellam & Pettit, P.A. (law firm); Former |
| Trustee | | Director, Mentor Income Fund, Inc.; Former Trustee, Mentor Funds and Cash Resource Trust |
| DOB: 8/26/1955 | | |
| Term of office since: 1984 | | |
| Other directorships: None | | |
|
| |
| David M. Richardson | | Principal occupations: President, Richardson, Runden LLC (executive recruitment business |
| Trustee | | development/consulting company); Consultant, Kennedy Information, Inc. (executive |
| DOB: 9/19/1941 | | recruitment information and research company); Consultant, AESC (The Association of Retained |
| Term of office since: 1982 | | Executive Search Consultants); Trustee, NDI Technologies, LLP (communications); Director, J&M |
| | | Cumming Paper Co. (paper merchandising); Former Vice Chairman, DHR International, Inc. |
| Other directorships: None | | (executive recruitment); Former Director, Mentor Income Fund, Inc.; Former Trustee, Mentor |
| | | Funds and Cash Resource Trust |
|
| |
| Dr. Russell A. Salton III | | Principal occupations: President/CEO, AccessOne MedCard; Former Medical Director, Healthcare |
| Trustee | | Resource Associates, Inc.; Former Medical Director, U.S. Health Care/Aetna Health Services; |
| DOB: 6/2/1947 | | Former Director, Mentor Income Fund, Inc.; Former Trustee, Mentor Funds and Cash Resource |
| Term of office since: 1984 | | Trust |
| Other directorships: None | | |
|
36
TRUSTEES AND OFFICERS continued
| | |
| Michael S. Scofield | | Principal occupations: Attorney, Law Offices of Michael S. Scofield; Former Director, Mentor |
| Trustee | | Income Fund, Inc.; Former Trustee, Mentor Funds and Cash Resource Trust |
| DOB: 2/20/1943 | | |
| Term of office since: 1984 | | |
| Other directorships: None | | |
|
| |
| Richard J. Shima | | Principal occupations: Independent Consultant; Director, Trust Company of CT; Trustee, Saint |
| Trustee | | Joseph College (CT); Director, Hartford Hospital; Trustee, Greater Hartford YMCA; Former |
| DOB: 8/11/1939 | | Director, Enhance Financial Services, Inc.; Former Director, Old State House Association; Former |
| Term of office since: 1993 | | Director of CTG Resources, Inc. (natural gas); Former Director, Mentor Income Fund, Inc.; Former |
| | | Trustee, Mentor Funds and Cash Resource Trust |
| Other directorships: None | | |
|
| |
| Richard K. Wagoner, CFA 2 | | Principal occupations: Member and Former President, North Carolina Securities Traders |
| Trustee | | Association; Member, Financial Analysts Society; Former Consultant to the Boards of Trustees of |
| DOB: 12/12/1937 | | the Evergreen funds; Former Trustee, Mentor Funds and Cash Resource Trust |
| Term of office since: 1999 | | |
| Other directorships: None | | |
|
| |
| |
| OFFICERS | | |
| |
| Dennis H. Ferro 3 | | Principal occupations: President and Chief Executive Officer, Evergreen Investment Company, |
| President | | Inc. and Executive Vice President, Wachovia Bank, N.A.; former Chief Investment Officer, |
| DOB: 6/20/1945 | | Evergreen Investment Company, Inc. |
| Term of office since: 2003 | | |
|
| |
| Carol Kosel4 | | Principal occupations: Senior Vice President, Evergreen Investment Services, Inc. |
| Treasurer | | |
| DOB: 12/25/1963 | | |
| Term of office since: 1999 | | |
|
| |
| Michael H. Koonce 4 | | Principal occupations: Senior Vice President and General Counsel, Evergreen Investment |
| Secretary | | Services, Inc.; Senior Vice President and Assistant General Counsel, Wachovia Corporation |
| DOB: 4/20/1960 | | |
| Term of office since: 2000 | | |
|
| |
| James Angulos 4 | | Principal occupations: Chief Compliance Officer, Senior Vice President and Director of |
| Chief Compliance Officer | | Compliance, Evergreen Investment Services, Inc. |
| DOB: 9/2/1947 | | |
| Term of office since: 2004 | | |
|
|
| 1 Each Trustee serves until a successor is duly elected or qualified or until his death, resignation, retirement or removal from office. Each |
| Trustee oversees 93 Evergreen funds. Correspondence for each Trustee may be sent to Evergreen Board of Trustees, P.O. Box 20083, |
| Charlotte, North Carolina 28202. |
| 2 Mr. Wagoner is an "interested person" of the Fund because of his ownership of shares in Wachovia Corporation, the parent to the |
| Fund's investment advisor. |
| 3 The address of the Officer is 401 S. Tryon Street, 20th Floor, Charlotte, NC 28288. |
| 4 The address of the Officer is 200 Berkeley Street, Boston, MA 02116. |
Additional information about the Fund's Board of Trustees and Officers can be found in the Statement of Additional Information (SAI) and is available upon request without charge by calling 800.343.2898.
37
568008 rv1 11/2004

| | |
| table of contents |
| 1 | | LETTER TO SHAREHOLDERS |
| 4 | | FUND AT A GLANCE |
| 6 | | ABOUT YOUR FUND'S EXPENSES |
| 7 | | FINANCIAL HIGHLIGHTS |
| 11 | | SCHEDULE OF INVESTMENTS |
| 21 | | STATEMENT OF ASSETS AND LIABILITIES |
| 22 | | STATEMENT OF OPERATIONS |
| 23 | | STATEMENTS OF CHANGES IN NET ASSETS |
| 24 | | NOTES TO FINANCIAL STATEMENTS |
| 32 | | TRUSTEES AND OFFICERS |
This semiannual report must be preceded or accompanied by a prospectus of the Evergreen fund contained herein. The prospectus contains more complete information, including fees and expenses, and should be read carefully before investing or sending money.
The fund will file its complete schedule of portfolio holdings with the SEC for the first and third quarters of each fiscal year on Form N-Q. The fund's Form N-Q will be available on the SEC's Web site at http://www.sec.gov. In addition, the fund's Form N-Q may be reviewed and copied at the SEC's Public Reference Room in Washington, D.C. Information on the operation of the Public Reference Room may be obtained by calling 800.SEC.0330.
A description of the fund's proxy voting policies and procedures is available without charge, upon request, by calling 800.343.2898, by visiting our Web site at EvergreenInvestments.com or by visiting the SEC's Web site at http://www.sec.gov.
Information relating to how the fund voted proxies relating to portfolio securities during the most recent 12-month period ended June 30 is available by visiting our Web site at EvergreenInvestments.com or by visiting the SEC's Web site at http://www.sec.gov.
| | | | |
| Mutual Funds: | | | | |
| NOT FDIC INSURED | | MAY LOSE VALUE | | NOT BANK GUARANTEED |
Evergreen InvestmentsSM is a service mark of Evergreen Investment Management Company, LLC. Copyright 2004.
Evergreen mutual funds are distributed by Evergreen Investment Services, Inc. 200 Berkeley Street, Boston, MA 02116
LETTER TO SHAREHOLDERS
November 2004

Dennis H. Ferro
President and Chief
Executive Officer
Dear Shareholder,
We are pleased to provide the semiannual report for the Evergreen Foundation Fund, which covers the six-month period ended September 30, 2004.
During these challenging times, the importance of proper asset allocation between stocks, bonds and cash cannot be overstated. We strongly believe that investment portfolios utilizing a balanced approach for diversification will provide investors, as they have historically, with the stability necessary during periods of market turmoil. Given the uncertain geopolitical backdrop, our portfolio managers entered the investment period preparing for, and adapting to, the rapidly changing fundamental landscape. Our forecast for the investment period included less accommodation from the Federal Reserve, along with a moderation in economic and corporate profit growth. As a result, our equity analysts sought sustainable profits and the potential for higher dividends, while our bond teams attempted to identify credit quality with appropriate maturities for the fixed income portion of our diversified investment portfolios.
The period began with positive momentum on the economic front. First quarter Gross Domestic Products (GDP) grew in excess of 4%, and supporting data pointed to a continuation of solid growth. Retail sales were strong and manufacturing had managed to put together several months of consistent growth. The solid contributions from business investment, meanwhile, had enabled the expansion to broaden, reinforcing the trend for sustainable economic growth. The next key for the recovery would come in the
1
LETTER TO SHAREHOLDERS continued
form of employment growth, which has historically lagged that of GDP growth. This recovery was no exception, and fears of a jobless recovery persisted for months. Yet that too also improved, as the investment period began with consecutive monthly payroll gains in excess of 300,000 jobs.
Another condition of economic recoveries is that they have to transition from the initial phase of surging growth to more normalized periods of average growth. This historically subtle transition was abundantly clear during the second quarter as GDP growth had moderated two full percentage points, to 3%, from the approximately 5% pace over the prior twelve months. Personal consumption weakened, prices for oil and gasoline were surging, and fears of terror abounded as the June 30th deadline approached for the handover of power in Iraq.
As if this wasn't enough, the Federal Reserve had been preparing Wall Street for higher interest rates. Monetary policymakers began the second quarter with a new "spin" on their message to the public, stating that they would remain "measured" in their removal of policy accommodation. Despite these attempts at improved clarity from the Federal Reserve, market interest rates alternately plunged, then soared, only to recover again by the end of the summer. These interest rate concerns were exacerbated by rising gasoline prices and the larger-than-forecasted readings on consumer inflation during May and June. As it turned out, the advent of the Federal Reserve's gradual tightening cycle proved to be the tonic that the markets needed, with the yield curve flattening slightly by the end of the investment period.
In addition to the aforementioned deceleration in GDP growth, the pace of growth in corporate profits has also moderated in recent months. After climbing approximately 20% over the past twelve months, operating earnings for companies within the S&P 500 Index are expected to climb by 15% in the second half of 2004, with profit gains of up to 10% in 2005.
2
LETTER TO SHAREHOLDERS continued
These forecasts were also weighed down by the fact that the third quarter represented the first time in a year that consensus EPS estimates did not increase during the quarter. Add in the uncertainty of the presidential election and higher energy prices, and the stock market faced many challenges during the investment period. To combat these issues, our equity teams endeavored to find companies with sustainability in profits, cash flows, and dividends in order to enhance total return prospects.
Please visit our website, EvergreenInvestments.com, for more information about our funds and other investment products available to you. Thank you for your continued support of Evergreen Investments.
Sincerely,

Dennis H. Ferro
President and Chief Executive Officer
Evergreen Investment Company, Inc.
Special Notice to Shareholders:
Please visit our website at EvergreenInvestments.com for statements from President and Chief Executive Officer, Dennis Ferro, and Chairman of the Board of the Evergreen Funds, Michael S. Scofield, addressing recent SEC actions involving the Evergreen Funds.
3
FUND AT A GLANCE
as of September 30, 2004
MANAGEMENT TEAM

Maureen E.
Cullinane, CFA
Large Cap Core
Growth Team
Lead Manager

Timothy E. O'Grady
Value Equity Team
Lead Manager
Tattersall Advisory Group, Inc.
CURRENT INVESTMENT STYLE


Source: Morningstar, Inc.
Morningstar's style box is based on a portfolio date as of 9/30/2004.
The fixed income style box placement is based on a fund's average effective maturity or duration and the average credit rating of the bond portfolio.
The domestic equity style box placement is based on 10 growth and valuation measures for each of the fund's holdings, as well as the size of the companies in which it invests, or median market capitalization.
PERFORMANCE AND RETURNS
Portfolio inception date: 1/2/1990
| | | | | | | | |
| | | Class A | | Class B | | Class C | | Class I |
| Class inception date | | 1/3/1995 | | 1/3/1995 | | 1/3/1995 | | 1/2/1990 |
|
| Nasdaq symbol | | EFOAX | | EFOBX | | EFOCX | | EFONX |
|
| 6-month return with sales charge | | -7.15% | | -6.77% | | -2.85% | | N/A |
|
| 6-month return w/o sales charge | | -1.51% | | -1.89% | | -1.87% | | -1.36% |
|
| Average annual return* | | | | | | | | |
|
| 1-year with sales charge | | 2.46% | | 2.86% | | 6.88% | | N/A |
|
| 1-year w/o sales charge | | 8.69% | | 7.86% | | 7.88% | | 9.01% |
|
| 5-year | | -1.37% | | -1.25% | | -0.93% | | 0.08% |
|
| 10-year | | 6.73% | | 6.57% | | 6.56% | | 7.62% |
|
* Adjusted for maximum applicable sales charge, unless noted.
Past performance is no guarantee of future results. The performance quoted represents past performance and current performance may be lower or higher. The investment return and principal value of an investment will fluctuate so that investors' shares, when redeemed, may be worth more or less than their original cost. To obtain performance information current to the most recent month-end for Classes A, B, C or I, please go to EvergreenInvestments.com/fundperformance. The performance of each class may vary based on differences in loads, fees and expenses paid by the shareholders investing in each class.The maximum applicable sales charge is 5.75% for Class A, 5.00% for Class B and 1.00% for Class C. Class I is not subject to a sales charge. Performance includes the reinvestment of income dividends and capital gain distributions. Performance shown does not reflect the deduction of taxes that a shareholder would pay on fund distributions or the redemption of fund shares.
Historical performance shown for Classes A, B and C prior to their inception is based on the performance of Class I, the original class offered. The historical returns for Classes A, B and C have not been adjusted to reflect the effect of each class' 12b-1 fee. These fees are 0.30% for Class A and 1.00% for Classes B and C. Class I does not pay a 12b-1 fee. If these fees had been reflected, returns for Classes A, B and C would have been lower.
The advisor is waiving a portion of its advisory fee. Had the fee not been waived, returns would have been lower.
4
FUND AT A GLANCE continued
LONG-TERM GROWTH
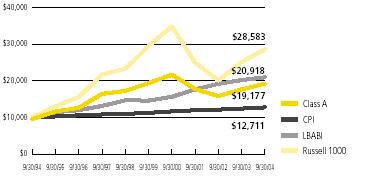
Comparison of a $10,000 investment in the Evergreen Foundation Fund Class A shares, versus a similar investment in the Lehman Brothers Aggregate Bond Index (LBABI), the Russell 1000 Index (Russell 1000) and the Consumer Price Index (CPI).
The LBABI and the Russell 1000 are unmanaged market indexes and do not include transaction costs associated with buying and selling securities, any mutual fund expenses or any taxes. The CPI is a commonly used measure of inflation and does not represent an investment return. It is not possible to invest directly in an index.
Class I shares are only offered to investment advisory clients of an investment advisor of an Evergreen fund (or its advisory affiliates), through special arrangements entered into on behalf of Evergreen funds with certain financial services firms, certain institutional investors and persons who owned Class Y shares in registered name in an Evergreen fund on or before December 31, 1994. Class I shares are only available to institutional shareholders with a minimum $1 million investment.
The fund's investment objective is nonfundamental and may be changed without the vote of the fund's shareholders.
Foreign investments may contain more risk due to the inherent risks associated with changing political climates, foreign market instability and foreign currency fluctuations. Risks of international investing are magnified in emerging or developing markets.
U.S. government guarantees apply only to certain securities held in the fund's portfolio and not to the fund's shares.
The return of principal is not guaranteed due to fluctuation in the NAV of the fund caused by changes in the price of the individual bonds held by the fund and the buying and selling of bonds by the fund. Bond funds have the same inflation, interest rate and credit risks that are associated with the individual bonds held by the fund.
All data is as of September 30, 2004, and subject to change.
5
ABOUT YOUR FUND'S EXPENSES
The Example below is intended to describe the fees and expenses borne by shareholders and the impact of those costs on your investment.
Example
As a shareholder of the fund, you incur two types of costs: (1) transaction costs, including sales charges (loads), redemption fees and exchange fees; and (2) ongoing costs, including management fees, distribution (12b-1) fees and other fund expenses. This Example is intended to help you understand your ongoing costs (in dollars) of investing in the fund and to compare these costs with the ongoing costs of investing in other mutual funds. The Example is based on an investment of $1,000 invested at the beginning of the period and held for the entire period from April 1, 2004 to September 30, 2004.
The example illustrates your fund's costs in two ways:
• Actual expenses
The section in the table under the heading "Actual" provides information about actual account values and actual expenses. You may use the information in these columns, together with the amount you invested, to estimate the expenses that you paid over the period. Simply divide your account value by $1,000 (for example, an $8,600 account value divided by $1,000 = 8.6), then multiply the result by the number in the appropriate column for your share class, in the column entitled "Expenses Paid During Period" to estimate the expenses you paid on your account during this period.
• Hypothetical example for comparison purposes
The section in the table under the heading "Hypothetical (5% return before expenses)" provides information about hypothetical account values and hypothetical expenses based on the fund's actual expense ratio and an assumed rate of return of 5% per year before expenses, which is not the fund's actual return. The hypothetical account values and expenses may not be used to estimate the actual ending account balance or expenses you paid for the period. You may use this information to compare the ongoing costs of investing in the fund and other funds. To do so, compare this 5% hypothetical example with the 5% hypothetical examples that appear in the shareholder reports of the other funds.
Please note that the expenses shown in the table are meant to highlight your ongoing costs only and do not reflect any transactional costs, such as sales charges (loads), redemption fees or exchange fees. Therefore, the section in the table under the heading "Hypothetical (5% return before expenses)" is useful in comparing ongoing costs only, and will not help you determine the relative total costs of owning different funds. In addition, if these transactional costs were included, your costs would have been higher.
| | | | | | |
| | | Beginning | | Ending | | |
| | | Account | | Account | | Expenses |
| | | Value | | Value | | Paid During |
| | | 4/1/2004 | | 9/30/2004 | | Period* |
|
| Actual | | | | | | |
| Class A | | $1,000.00 | | $ 984.94 | | $ 6.42 |
| Class B | | $1,000.00 | | $ 981.14 | | $ 9.88 |
| Class C | | $1,000.00 | | $ 981.26 | | $ 9.88 |
| Class I | | $1,000.00 | | $ 986.42 | | $ 4.93 |
| Hypothetical | | | | | | |
| (5% return | | | | | | |
| before expenses) | | | | | | |
| Class A | | $1,000.00 | | $1,018.60 | | $ 6.53 |
| Class B | | $1,000.00 | | $1,015.09 | | $10.05 |
| Class C | | $1,000.00 | | $1,015.09 | | $10.05 |
| Class I | | $1,000.00 | | $1,020.10 | | $ 5.01 |
|
| * | For each class of the Fund, expenses are equal to the annualized expense ratio of each class (1.29% for Class A, 1.99% for Class B, 1.99% for Class C and 0.99% for Class I), multiplied by the average account value over the period, multiplied by 183 / 365 days. |
6
FINANCIAL HIGHLIGHTS
(For a share outstanding throughout each period)
| | | | | | | | | | | | |
| | | Six Months Ended | | Year Ended March 31, |
| | September 30, 2004 | |
|
| CLASS A | | (unaudited) | | 2004 1 | | 2003 1 | | 2002 1 | | 2001 | | 2000 |
|
| Net asset value, beginning of period | | $16.61 | | $13.81 | | $16.14 | | $16.64 | | $23.41 | | $20.98 |
|
| Income from investment operations | | | | | | | | | | | | |
| Net investment income | | 0.11 | | 0.18 | | 0.25 | | 0.29 | | 0.31 | | 0.36 |
Net realized and unrealized gains or
losses on securities and foreign | | | | | | | | | | | | |
| currency related transactions | | (0.36) | | 2.80 | | (2.34) | | (0.50) | | (3.74) | | 3.01 |
| |
| |
| |
| |
| |
| |
|
| Total from investment operations | | (0.25) | | 2.98 | | (2.09) | | (0.21) | | (3.43) | | 3.37 |
|
| Distributions to shareholders from | | | | | | | | | | | | |
| Net investment income | | (0.12) | | (0.18) | | (0.24) | | (0.29) | | (0.30) | | (0.35) |
| Net realized gains | | 0 | | 0 | | 0 | | 0 | | (3.04) | | (0.59) |
| |
| |
| |
| |
| |
| |
|
| Total distributions to shareholders | | (0.12) | | (0.18) | | (0.24) | | (0.29) | | (3.34) | | (0.94) |
|
| Net asset value, end of period | | $16.24 | | $16.61 | | $13.81 | | $16.14 | | $16.64 | | $23.41 |
|
| Total return 2 | | (1.51%) | | 21.66% | | (12.99%) | | (1.26%) | | (16.51%) | | 16.38% |
|
| Ratios and supplemental data | | | | | | | | | | | | |
| Net assets, end of period (millions) | | $ 387 | | $ 407 | | $ 350 | | $ 420 | | $ 498 | | $ 486 |
| Ratios to average net assets | | | | | | | | | | | | |
| Expenses 3 | | 1.29% 4 | | 1.51% | | 1.41% | | 1.34% | | 1.26% | | 1.21% |
| Net investment income | | 1.38% 4 | | 1.16% | | 1.70% | | 1.74% | | 1.59% | | 1.62% |
| Portfolio turnover rate | | 71% | | 146% | | 129% | | 197% | | 95% | | 83% |
|
| 1 Net investment income per share is based on average shares outstanding during the period. |
| 2 Excluding applicable sales charges |
| 3 The ratio of expenses to average net assets excludes expense reductions but includes fee waivers and/or expense reimbursements. |
| 4 Annualized |
See Notes to Financial Statements
7
FINANCIAL HIGHLIGHTS
(For a share outstanding throughout each period)
| | | | | | | | | | | | |
| | | Six Months Ended | | Year Ended March 31, |
| | September 30, 2004 | |
|
| CLASS B | | (unaudited) 1 | | 2004 1 | | 2003 1 | | 2002 1 | | 2001 | | 2000 |
|
| Net asset value, beginning of period | | $16.52 | | $13.73 | | $16.05 | | $16.54 | | $23.29 | | $20.88 |
|
| Income from investment operations | | | | | | | | | | | | |
|
| Net investment income | | 0.06 | | 0.07 | | 0.14 | | 0.16 | | 0.16 | | 0.19 |
Net realized and unrealized gains or
losses on securities and foreign | | | | | | | | | | | | |
| currency related transactions | | (0.37) | | 2.79 | | (2.33) | | (0.49) | | (3.71) | | 3.00 |
| |
| |
| |
| |
| |
| |
|
| Total from investment operations | | (0.31) | | 2.86 | | (2.19) | | (0.33) | | (3.55) | | 3.19 |
|
| Distributions to shareholders from | | | | | | | | | | | | |
| Net investment income | | (0.06) | | (0.07) | | (0.13) | | (0.16) | | (0.16) | | (0.19) |
| Net realized gains | | 0 | | 0 | | 0 | | 0 | | (3.04) | | (0.59) |
| |
| |
| |
| |
| |
| |
|
| Total distributions to shareholders | | (0.06) | | (0.07) | | (0.13) | | (0.16) | | (3.20) | | (0.78) |
|
| Net asset value, end of period | | $16.15 | | $16.52 | | $13.73 | | $16.05 | | $16.54 | | $23.29 |
|
| Total return 2 | | (1.89%) | | 20.83% | | (13.69%) | | (1.97%) | | (17.14%) | | 15.48% |
|
| Ratios and supplemental data | | | | | | | | | | | | |
| Net assets, end of period (millions) | | $ 339 | | $ 439 | | $ 518 | | $ 976 | | $1,234 | | $1,612 |
| Ratios to average net assets | | | | | | | | | | | | |
| Expenses 3 | | 1.99% 4 | | 2.21% | | 2.16% | | 2.09% | | 2.01% | | 1.96% |
| Net investment income | | 0.67% 4 | | 0.46% | | 0.95% | | 0.99% | | 0.81% | | 0.88% |
| Portfolio turnover rate | | 71% | | 146% | | 129% | | 197% | | 95% | | 83% |
|
| 1 Net investment income per share is based on average shares outstanding during the period. |
| 2 Excluding applicable sales charges |
| 3 The ratio of expenses to average net assets excludes expense reductions but includes fee waivers and/or expense reimbursements. |
| 4 Annualized |
See Notes to Financial Statements
8
FINANCIAL HIGHLIGHTS
(For a share outstanding throughout each period)
| | | | | | | | | | | | |
| | | | | | | | | | | | | |
| | | Six Months Ended | | Year Ended March 31, |
| | September 30, 2004 | |
|
| CLASS C | | (unaudited) 1 | | 2004 1 | | 2003 1 | | 2002 1 | | 2001 | | 2000 |
|
| Net asset value, beginning of period | | $16.51 | | $13.72 | | $16.04 | | $16.53 | | $23.28 | | $20.87 |
|
| Income from investment operations | | | | | | | | | | | | |
|
| Net investment income | | 0.06 | | 0.07 | | 0.14 | | 0.16 | | 0.18 | | 0.19 |
Net realized and unrealized gains or
losses on securities and foreign | | | | | | | | | | | | |
| currency related transactions | | (0.37) | | 2.79 | | (2.33) | | (0.49) | | (3.73) | | 3.00 |
| |
| |
| |
| |
| |
| |
|
| Total from investment operations | | (0.31) | | 2.86 | | (2.19) | | (0.33) | | (3.55) | | 3.19 |
|
| Distributions to shareholders from | | | | | | | | | | | | |
| Net investment income | | (0.06) | | (0.07) | | (0.13) | | (0.16) | | (0.16) | | (0.19 ) |
| Net realized gains | | 0 | | 0 | | 0 | | 0 | | (3.04) | | (0.59) |
| |
| |
| |
| |
| |
| |
|
| Total distributions to shareholders | | (0.06) | | (0.07) | | (0.13) | | (0.16) | | (3.20) | | (0.78) |
|
| Net asset value, end of period | | $16.14 | | $16.51 | | $13.72 | | $16.04 | | $16.53 | | $23.28 |
|
| Total return 2 | | (1.87%) | | 20.85% | | (13.69%) | | (1.97%) | | (17.15%) | | 15.49% |
|
| Ratios and supplemental data | | | | | | | | | | | | |
| Net assets, end of period (millions) | | $ 86 | | $ 101 | | $ 111 | | $ 177 | | $ 251 | | $ 76 |
| Ratios to average net assets | | | | | | | | | | | | |
| Expenses 3 | | 1.99% 4 | | 2.21% | | 2.16% | | 2.09% | | 2.02% | | 1.96% |
| Net investment income | | 0.68% 4 | | 0.46% | | 0.95% | | 0.99% | | 0.90% | | 0.88% |
| Portfolio turnover rate | | 71% | | 146% | | 129% | | 197% | | 95% | | 83% |
|
| 1 Net investment income per share is based on average shares outstanding during the period. |
| 2 Excluding applicable sales charges |
| 3 The ratio of expenses to average net assets excludes expense reductions but includes fee waivers and/or expense reimbursements. |
| 4 Annualized |
See Notes to Financial Statements
9
FINANCIAL HIGHLIGHTS
(For a share outstanding throughout each period)
| | | | | | | | | | | | |
| | | Six Months Ended | | Year Ended March 31, |
| | September 30, 2004 | |
|
| CLASS I 1 | | (unaudited) 2 | | 2004 2 | | 2003 2 | | 2002 2 | | 2001 | | 2000 |
|
| Net asset value, beginning of period | | $16.61 | | $13.80 | | $16.14 | | $16.64 | | $23.42 | | $20.99 |
|
| Income from investment operations | | | | | | | | | | | | |
|
| Net investment income | | 0.14 | | 0.23 | | 0.28 | | 0.29 | | 0.36 | | 0.43 |
Net realized and unrealized gains
or losses on securities and foreign | | | | | | | | | | | | |
| currency related transactions | | (0.37) | | 2.81 | | (2.34) | | (0.46) | | (3.74) | | 3.00 |
| |
| |
| |
| |
| |
| |
|
| Total from investment operations | | (0.23) | | 3.04 | | (2.06) | | (0.17) | | (3.38) | | 3.43 |
|
| Distributions to shareholders from | | | | | | | | | | | | |
| Net investment income | | (0.14) | | (0.23) | | (0.28) | | (0.33) | | (0.36) | | (0.41) |
| Net realized gains | | 0 | | 0 | | 0 | | 0 | | (3.04) | | (0.59) |
| |
| |
| |
| |
| |
| |
|
| Total distributions to shareholders | | (0.14) | | (0.23) | | (0.28) | | (0.33) | | (3.40) | | (1.00) |
|
| Net asset value, end of period | | $16.24 | | $16.61 | | $13.80 | | $16.14 | | $16.64 | | $23.42 |
|
| Total return | | (1.36%) | | 22.10% | | (12.83%) | | (1.01%) | | (16.32%) | | 16.68% |
|
| Ratios and supplemental data | | | | | | | | | | | | |
| Net assets, end of period (millions) | | $ 222 | | $ 251 | | $ 302 | | $ 456 | | $ 830 | | $1,176 |
| Ratios to average net assets | | | | | | | | | | | | |
| Expenses 3 | | 0.99% 4 | | 1.21% | | 1.15% | | 1.09% | | 1.01% | | 0.96% |
| Net investment income | | 1.68% 4 | | 1.46% | | 1.94% | | 1.99% | | 1.81% | | 1.89% |
| Portfolio turnover rate | | 71% | | 146% | | 129% | | 197% | | 95% | | 83% |
|
| 1 Effective at the close of business on May 11, 2001, Class Y shares were renamed as Institutional shares (Class I). |
| 2 Net investment income per share is based on average shares outstanding during the period. |
| 3 The ratio of expenses to average net assets excludes expense reductions but includes fee waivers and/or expense reimbursements. |
| 4 Annualized |
See Notes to Financial Statements
10
SCHEDULE OF INVESTMENTS
September 30, 2004 (unaudited)
| | | | | | |
| | | Principal | | | | |
| | | Amount | | | | Value |
|
| ASSET-BACKED SECURITIES 1.6% | | | | | | |
| Chase Credit Card Owner Trust, Ser. 2004-1, Class A, 1.79%, | | | | | | |
| 05/15/2009 | | $ 4,300,000 | | $ | | 4,302,540 |
| Detroit Edison Securitization, Ser. 2001-1, Class A6, 6.62%, | | | | | | |
| 03/01/2016 | | 2,050,000 | | | | 2,351,406 |
| Fleet Credit Card Master Trust I, Ser. 2000-D, Class A, 1.90%, | | | | | | |
| 05/15/2008 | | 4,300,000 | | | | 4,309,338 |
| Residential Asset Mtge. Products, Inc.: | | | | | | |
| Ser. 2002-RZ3, Class A4, 4.73%, 12/25/2031 | | 2,045,096 | | | | 2,057,383 |
| Ser. 2003-RS7, Class AI6, 5.34%, 08/25/2033 | | 3,120,000 | | | | 3,202,561 |
| | | | | |
|
| Total Asset-Backed Securities (cost $16,065,650) | | | | | | 16,223,228 |
| | | | | |
|
| |
| CORPORATE BONDS 8.1% | | | | | | |
| CONSUMER DISCRETIONARY 0.9% | | | | | | |
| Automobiles 0.1% | | | | | | |
| Ford Motor Co., 6.375%, 02/01/2029 | | 1,600,000 | | | | 1,410,317 |
| | | | | |
|
| Media 0.3% | | | | | | |
| Time Warner, Inc., 7.625%, 04/15/2031 | | 2,700,000 | | | | 3,117,242 |
| | | | | |
|
| Multi-line Retail 0.5% | | | | | | |
| May Department Stores Co., 6.90%, 01/15/2032 | | 5,000,000 | | | | 5,321,305 |
| | | | | |
|
| CONSUMER STAPLES 1.2% | | | | | | |
| Beverages 0.7% | | | | | | |
| Coca-Cola Enterprises, Inc., 0.00%, 06/20/2020 (n) | | 17,530,000 | | | | 7,441,257 |
| | | | | |
|
| Food Products 0.5% | | | | | | |
| General Mills, Inc., 6.00%, 02/15/2012 | | 4,500,000 | | | | 4,854,299 |
| | | | | |
|
| FINANCIALS 3.9% | | | | | | |
| Capital Markets 0.6% | | | | | | |
| Bank of New York Co., Inc., 7.30%, 12/01/2009 | | 3,675,000 | | | | 4,237,937 |
| Merrill Lynch & Co., Inc., 4.125%, 09/10/2009 | | 2,650,000 | | | | 2,660,173 |
| | | | | |
|
| | | | | | | 6,898,110 |
| | | | | |
|
| Commercial Banks 0.4% | | | | | | |
| Bank of America Corp., 4.375%, 12/01/2010 | | 35,000 | | | | 35,317 |
| PNC Funding Corp., 5.75%, 08/01/2006 | | 1,735,000 | | | | 1,818,535 |
| U.S. Bank, 6.375%, 08/01/2011 | | 2,000,000 | | | | 2,237,744 |
| | | | | |
|
| | | | | | | 4,091,596 |
| | | | | |
|
| Consumer Finance 2.4% | | | | | | |
| General Electric Capital Corp., 3.50%, 05/01/2008 | | 3,000,000 | | | | 3,005,439 |
| GMAC, 6.875%, 09/15/2011 | | 4,675,000 | | | | 4,910,943 |
| Household Finance Corp., 6.40%, 06/17/2008 | | 3,750,000 | | | | 4,095,097 |
| International Lease Finance Corp., 4.375%, 12/15/2005 | | 4,105,000 | | | | 4,185,351 |
| Sprint Capital Corp., 6.875%, 11/15/2028 | | 2,600,000 | | | | 2,735,312 |
| USAA Capital Corp., 5.59%, 12/20/2006 144A | | 5,500,000 | | | | 5,807,521 |
| | | | | |
|
| | | | | | | 24,739,663 |
| | | | | |
|
See Notes to Financial Statements
11
SCHEDULE OF INVESTMENTS continued
September 30, 2004 (unaudited)
| | | | | | |
| | | Principal | | | | |
| | | Amount | | | | Value |
|
| CORPORATE BONDS continued | | | | | | |
| FINANCIALS continued | | | | | | |
| Thrifts & Mortgage Finance 0.5% | | | | | | |
| American General Finance Corp., 5.875%, 07/14/2006 | | $ 4,800,000 | | $ | | 5,043,192 |
| | | | | |
|
| INDUSTRIALS 0.8% | | | | | | |
| Road & Rail 0.8% | | | | | | |
| Burlington Northern Santa Fe Corp., 6.75%, 07/15/2011 | | 7,000,000 | | | | 7,872,991 |
| | | | | |
|
| TELECOMMUNICATION SERVICES 0.4% | | | | | | |
| Diversified Telecommunication Services 0.4% | | | | | | |
| SBC Communications, Inc., 5.875%, 02/01/2012 | | 3,625,000 | | | | 3,875,843 |
| | | | | |
|
| UTILITIES 0.9% | | | | | | |
| Electric Utilities 0.4% | | | | | | |
| Southwestern Public Service Co., Ser. B, 5.125%, 11/01/2006 | | 4,500,000 | | | | 4,658,872 |
| | | | | |
|
| Gas Utilities 0.5% | | | | | | |
| Consolidated Natural Gas Co., 5.375%, 11/01/2006 | | 4,700,000 | | | | 4,892,136 |
| | | | | |
|
| Total Corporate Bonds (cost $78,037,369) | | | | | | 84,216,823 |
| | | | | |
|
| |
| U.S. TREASURY OBLIGATIONS 4.8% | | | | | | |
| U.S. Treasury Bonds, 6.00%, 02/15/2026 ## | | 27,095,000 | | | | 30,899,951 |
| U.S. Treasury Notes: | | | | | | |
| 2.75%, 07/31/2006 | | 12,455,000 | | | | 12,505,605 |
| 3.375%, 01/15/2007 | | 2,780,421 | | | | 2,971,466 |
| 5.00%, 08/15/2011 | | 3,430,000 | | | | 3,687,387 |
| | | | | |
|
| Total U.S. Treasury Obligations (cost $48,802,077) | | | | | | 50,064,409 |
| | | | | |
|
| |
| YANKEE OBLIGATIONS-CORPORATE 0.3% | | | | | | |
| MATERIALS 0.3% | | | | | | |
| Metals & Mining 0.3% | | | | | | |
| Alcan, Inc., 6.125%, 12/15/2033 (cost $3,057,272) | | 3,000,000 | | | | 3,125,289 |
| | | | | |
|
| COMMERCIAL MORTGAGE-BACKED SECURITIES 3.1% | | | | | | |
| FIXED RATE 3.1% | | | | | | |
| Credit Suisse First Boston Mtge. Securities Corp., Ser. 2001-CKN5, | | | | | | |
| Class A4, 5.44%, 09/15/2034 | | 4,725,000 | | | | 5,012,025 |
| GE Capital Comml. Mtge. Corp., Ser. 2001-1, Class A2, 6.53%, | | | | | | |
| 05/15/2033 | | 3,145,000 | | | | 3,524,993 |
| LB-UBS Comml. Mtge. Trust: | | | | | | |
| Ser. 2000-C3, Class A1, 7.95%, 05/15/2015 | | 4,116,919 | | | | 4,439,588 |
| Ser. 2000-C4, Class A1, 7.18%, 09/15/2019 | | 3,774,157 | | | | 4,120,251 |
| Ser. 2001-C2, Class A2, 6.65%, 11/15/2027 | | 5,120,000 | | | | 5,780,214 |
| Morgan Stanley Dean Witter Capital I, Ser. 2003-HQ2, Class A2, | | | | | | |
| 4.92%, 03/12/2035 | | 4,830,000 | | | | 4,934,737 |
| Wachovia Bank Comml. Mtge. Trust, Ser. 2003-C8, Class A1, 3.44%, | | | | | | |
| 11/15/2035 | | 4,564,836 | | | | 4,536,229 |
| | | | | |
|
| Total Commercial Mortgage-Backed Securities (cost $32,224,175) | | | | | | 32,348,037 |
| | | | | |
|
See Notes to Financial Statements
12
SCHEDULE OF INVESTMENTS continued
September 30, 2004 (unaudited)
| | | | | | |
| | | Principal | | | | |
| | | Amount | | | | Value |
|
| AGENCY MORTGAGE-BACKED COLLATERALIZED MORTGAGE | | | | | | |
| OBLIGATIONS 4.3% | | | | | | |
| FIXED RATE 4.3% | | | | | | |
| FHLMC: | | | | | | |
| Ser. 2727, Class PD, 4.50%, 06/15/2029 | | $ 3,650,000 | | $ | | 3,638,610 |
| Ser. 2750, Class WD, 4.50%, 09/15/2015 | | 5,170,400 | | | | 5,244,160 |
| FNMA: | | | | | | |
| Ser. 1993-G36, Class ZQ, 6.50%, 12/25/2023 | | 3,445,495 | | | | 3,662,227 |
| Ser. 2001-51, Class QN, 6.00%, 10/25/2016 | | 7,140,000 | | | | 7,449,336 |
| Ser. 2002-09, Class PC, 6.00%, 03/25/2017 | | 8,350,000 | | | | 8,762,556 |
| Ser. 2002-12, Class PG, 6.00%, 03/25/2017 | | 2,971,000 | | | | 3,126,618 |
| Ser. 2003 129, Class PW, 4.50%, 07/25/2033 | | 5,600,000 | | | | 5,593,420 |
| Ser. 2003-92, Class PD, 4.50%, 03/25/2017 | | 5,000,000 | | | | 4,992,382 |
| Ser. 2004-31, Class VB, 4.50%, 09/25/2027 | | 2,050,000 | | | | 1,933,844 |
| | | | | |
|
Total Agency Mortgage-Backed Collateralized
Mortgage Obligations | | | | | | |
| (cost $48,169,869) | | | | | | 44,403,153 |
| | | | | |
|
| |
WHOLE LOAN MORTGAGE-BACKED
COLLATERALIZED MORTGAGE | | | | | | |
| OBLIGATIONS 1.1% | | | | | | |
| FIXED RATE 1.1% | | | | | | |
| Morgan Stanley Mtge. Loan Trust, Ser. 2004-8AR, Class 3PT5, 5.47%, | | | | | | |
| 10/25/2034 (h) | | 3,515,000 | | | | 3,595,142 |
| Washington Mutual, Inc., Ser. 2004-AR4, Class A6, 3.81%, 06/25/2034 | | 4,220,000 | | | | 4,163,621 |
| Wells Fargo Mtge. Backed Securities Trust, Ser. 2004-S, Class A7, | | | | | | |
| 3.54%, 09/25/2034 | | 3,750,000 | | | | 3,641,962 |
| | | | | |
|
| Total Whole Loan Mortgage-Backed Collateralized Mortgage | | | | | | |
| Obligations (cost $7,681,253) | | | | | | 11,400,725 |
| | | | | |
|
| |
| AGENCY MORTGAGE-BACKED PASS-THROUGH SECURITIES 9.3% | | | | | | |
| FIXED RATE 9.3% | | | | | | |
| FHLMC: | | | | | | |
| 4.50%, TBA # | | 5,615,000 | | | | 5,409,705 |
| 5.00%, TBA # | | 1,380,000 | | | | 1,366,631 |
| 6.00%, 04/01/2014 | | 2,101,186 | | | | 2,208,356 |
| 8.50%, 09/01/2020 | | 721,525 | | | | 800,459 |
| FNMA: | | | | | | |
| 4.50%, TBA # | | 16,495,000 | | | | 16,438,290 |
| 4.90%, 01/01/2013 | | 7,081,212 | | | | 7,312,831 |
| 5.50%, TBA # | | 4,400,000 | | | | 4,459,127 |
| 5.84%, 12/01/2008 | | 10,069,429 | | | | 10,777,999 |
| 5.85%, 02/01/2009 | | 418,051 | | | | 447,247 |
| 5.89%, 10/01/2008 | | 6,840,245 | | | | 7,271,794 |
| 6.00%, 08/01/2006-07/01/2017 | | 12,587,848 | | | | 13,206,098 |
| 6.35%, 05/01/2011 | | 1,451,669 | | | | 1,575,116 |
| 6.40%, 06/01/2009 | | 4,190,093 | | | | 4,581,973 |
| 6.50%, 07/01/2032-08/01/2032 | | 5,418,716 | | | | 5,689,513 |
| 7.00%, 06/01/2032 | | 1,900,550 | | | | 2,016,736 |
| 7.19%, 05/01/2007 | | 3,952,619 | | | | 4,230,465 |
| 7.50%, 10/01/2031 | | 1,458,203 | | | | 1,563,388 |
See Notes to Financial Statements
13
SCHEDULE OF INVESTMENTS continued
September 30, 2004 (unaudited)
| | | | | | |
| | | Principal | | | | |
| | | Amount | | | | Value |
|
| |
| AGENCY MORTGAGE-BACKED PASS-THROUGH SECURITIES continued | | | | | | |
| FIXED RATE continued | | | | | | |
| GNMA: | | | | | | |
| 4.00%, 09/20/2029-07/20/2030 | | $ 2,452,109 | | $ | | 2,478,178 |
| 5.50%, 11/15/2033 | | 3,970,042 | | | | 4,048,473 |
| | | | | |
|
| | | | | | | 94,515,748 |
| | | | | |
|
| Total Agency Mortgage-Backed Pass-Through Securities | | | | | | |
| (cost $95,030,490) | | | | | | 95,882,379 |
| | | | | |
|
| |
| WHOLE LOAN MORTGAGE-BACKED PASS-THROUGH SECURITIES 0.4% | | | | | | |
| FIXED RATE 0.4% | | | | | | |
| Master Alternative Loan Trust, 4.50%, 07/25/2019 (cost $3,622,663) | | 3,760,753 | | | | 3,809,011 |
| | | | | |
|
| REPERFORMING MORTGAGE-BACKED PASS-THROUGH SECURITIES 2.8% | | | | | | |
| FHLMC: | | | | | | |
| Ser. 2001-T5, Class A2, 7.00%, 02/19/2030 | | 3,174,658 | | | | 3,357,225 |
| Ser. T-54, Class 3A, 7.00%, 02/25/2043 | | 2,717,666 | | | | 2,918,943 |
| FNMA: | | | | | | |
| Ser. 2002-W7, Class A5, 7.50%, 02/25/2029 | | 1,448,448 | | | | 1,570,940 |
| Ser. 2002-T19, Class A1, 6.50%, 07/25/2042 | | 5,405,607 | | | | 5,716,429 |
| Ser. 2003-W2, Class 1A2, 7.00%, 07/25/2042 | | 2,784,422 | | | | 2,984,552 |
| Ser. 2004-T1, Class 1A3, 7.00%, 01/25/2044 | | 2,422,468 | | | | 2,563,875 |
| Ser. 2004-T2, Class 1A4, 7.50%, 11/25/2043 | | 3,442,241 | | | | 3,700,432 |
| Ser. 2004-W1, Class 2A2, 7.00%, 12/25/2033 | | 3,211,643 | | | | 3,398,909 |
| Ser. 2004-W2, Class 2A2, 7.00%, 02/25/2044 | | 2,425,697 | | | | 2,595,182 |
| | | | | |
|
| Total Reperforming Mortgage-Backed Pass-Through Securities | | | | | | |
| (cost $28,779,613) | | | | | | 28,806,487 |
| | | | | |
|
| |
| REPERFORMING MORTGAGE-BACKED COLLATERALIZED | | | | | | |
| MORTGAGE OBLIGATIONS 0.9% | | | | | | |
| FNMA: | | | | | | |
| Ser. 2003-DT, Class 1A6, 5.82%, 09/25/2043 | | 4,436,628 | | | | 4,596,586 |
| Ser. 2003-W6, Class 2A, 5.00%, 09/25/2042 | | 4,295,000 | | | | 4,372,034 |
| | | | | |
|
| Total Reperforming Mortgage-Backed Collateralized Mortgage | | | | | | |
| Obligations (cost $9,022,477) | | | | | | 8,968,620 |
| | | | | | |
|
|
| | | Shares | | | | Value |
|
| COMMON STOCKS 61.0% | | | | | | |
| CONSUMER DISCRETIONARY 6.9% | | | | | | |
| Distributors 0.1% | | | | | | |
| Adesa, Inc. * | | 67,782 | | | | 1,113,658 |
| | | | | |
|
| Hotels, Restaurants & Leisure 0.8% | | | | | | |
| International Game Technology | | 54,000 | | | | 1,941,300 |
| Starbucks Corp. * | | 135,000 | | | | 6,137,100 |
| | | | | |
|
| | | | | | | 8,078,400 |
| | | | | |
|
See Notes to Financial Statements
14
SCHEDULE OF INVESTMENTS continued
September 30, 2004 (unaudited)
| | | | | | |
| | | Shares | | | | Value |
|
| |
| COMMON STOCKS continued | | | | | | |
| CONSUMER DISCRETIONARY continued | | | | | | |
| Household Durables 0.1% | | | | | | |
| Sharp Corp | | 100,000 | | $ | | 1,375,743 |
| | | | | |
|
| Internet & Catalog Retail 1.2% | | | | | | |
| Amazon.com, Inc. (p) | | 112,000 | | | | 4,576,320 |
| eBay, Inc. * | | 82,000 | | | | 7,539,080 |
| | | | | |
|
| | | | | | | 12,115,400 |
| | | | | |
|
| Media 2.2% | | | | | | |
| Comcast Corp., Class A * | | 243,704 | | | | 6,804,216 |
| Liberty Media Corp., Class A * | | 460,984 | | | | 4,019,780 |
| News Corp., Ltd., ADR (p) | | 164,615 | | | | 5,157,388 |
| Time Warner, Inc. * | | 425,464 | | | | 6,866,989 |
| | | | | |
|
| | | | | | | 22,848,373 |
| | | | | |
|
| Multi-line Retail 0.7% | | | | | | |
| Target Corp | | 152,000 | | | | 6,878,000 |
| | | | | |
|
| Specialty Retail 1.1% | | | | | | |
| Best Buy Co., Inc | | 100,000 | | | | 5,424,000 |
| Home Depot, Inc | | 167,000 | | | | 6,546,400 |
| | | | | |
|
| | | | | | | 11,970,400 |
| | | | | |
|
| Textiles, Apparel & Luxury Goods 0.7% | | | | | | |
| Coach, Inc. * | | 81,000 | | | | 3,436,020 |
| Liz Claiborne, Inc | | 98,849 | | | | 3,728,585 |
| | | | | |
|
| | | | | | | 7,164,605 |
| | | | | |
|
| CONSUMER STAPLES 4.3% | | | | | | |
| Beverages 1.1% | | | | | | |
| Anheuser-Busch Companies, Inc | | 45,339 | | | | 2,264,683 |
| Diageo plc, ADR (p) | | 30,000 | | | | 1,512,900 |
| PepsiCo, Inc | | 154,006 | | | | 7,492,392 |
| | | | | |
|
| | | | | | | 11,269,975 |
| | | | | |
|
| Food & Staples Retailing 0.8% | | | | | | |
| CVS Corp | | 117,500 | | | | 4,950,275 |
| Wal-Mart Stores, Inc | | 66,340 | | | | 3,529,288 |
| | | | | |
|
| | | | | | | 8,479,563 |
| | | | | |
|
| Food Products 0.7% | | | | | | |
| General Mills, Inc | | 88,652 | | | | 3,980,475 |
| H.J. Heinz Co | | 92,330 | | | | 3,325,726 |
| | | | | |
|
| | | | | | | 7,306,201 |
| | | | | |
|
| Household Products 0.9% | | | | | | |
| Kimberly-Clark Corp | | 48,119 | | | | 3,108,006 |
| Procter & Gamble Co | | 100,000 | | | | 5,412,000 |
| | | | | |
|
| | | | | | | 8,520,006 |
| | | | | |
|
See Notes to Financial Statements
15
SCHEDULE OF INVESTMENTS continued
September 30, 2004 (unaudited)
| | | | | | |
| | | Shares | | | | Value |
|
| |
| COMMON STOCKS continued | | | | | | |
| CONSUMER STAPLES continued | | | | | | |
| Tobacco 0.8% | | | | | | |
| Altria Group, Inc | | 176,745 | | $ | | 8,314,085 |
| | | | | |
|
| ENERGY 6.5% | | | | | | |
| Energy Equipment & Services 1.2% | | | | | | |
| Halliburton Co | | 66,806 | | | | 2,250,694 |
| Schlumberger, Ltd | | 128,076 | | | | 8,620,796 |
| Transocean, Inc. * | | 55,362 | | | | 1,980,852 |
| | | | | |
|
| | | | | | | 12,852,342 |
| | | | | |
|
| Oil & Gas 5.3% | | | | | | |
| Apache Corp | | 85,240 | | | | 4,271,376 |
| Burlington Resources, Inc | | 130,000 | | | | 5,304,000 |
| ChevronTexaco Corp | | 154,334 | | | | 8,278,476 |
| Devon Energy Corp | | 33,171 | | | | 2,355,473 |
| Exxon Mobil Corp | | 465,422 | | | | 22,493,845 |
| Marathon Oil Corp | | 89,430 | | | | 3,691,670 |
| XTO Energy, Inc | | 248,314 | | | | 8,065,239 |
| | | | | |
|
| | | | | | | 54,460,079 |
| | | | | |
|
| FINANCIALS 11.5% | | | | | | |
| Capital Markets 1.6% | | | | | | |
| Goldman Sachs Group, Inc | | 18,000 | | | | 1,678,320 |
| Merrill Lynch & Co., Inc | | 109,546 | | | | 5,446,627 |
| Morgan Stanley | | 182,678 | | | | 9,006,025 |
| | | | | |
|
| | | | | | | 16,130,972 |
| | | | | |
|
| Commercial Banks 3.1% | | | | | | |
| Bank of America Corp | | 317,486 | | | | 13,756,668 |
| SunTrust Banks, Inc | | 47,581 | | | | 3,350,178 |
| U.S. Bancorp | | 183,455 | | | | 5,301,850 |
| Wells Fargo & Co | | 133,247 | | | | 7,945,519 |
| Zions Bancorp | | 35,000 | | | | 2,136,400 |
| | | | | |
|
| | | | | | | 32,490,615 |
| | | | | |
|
| Consumer Finance 0.9% | | | | | | |
| American Express Co | | 190,403 | | | | 9,798,138 |
| | | | | |
|
| Diversified Financial Services 2.5% | | | | | | |
| Citigroup, Inc | | 345,264 | | | | 15,233,048 |
| JPMorgan Chase & Co | | 258,106 | | | | 10,254,551 |
| | | | | |
|
| | | | | | | 25,487,599 |
| | | | | |
|
| Insurance 2.3% | | | | | | |
| Allstate Corp | | 106,163 | | | | 5,094,763 |
| American International Group, Inc | | 195,129 | | | | 13,266,821 |
| Mitsui Sumitomo Insurance Co., Ltd | | 390,000 | | | | 3,217,115 |
| SAFECO Corp. (p) | | 44,079 | | | | 2,012,206 |
| | | | | |
|
| | | | | | | 23,590,905 |
| | | | | |
|
See Notes to Financial Statements
16
SCHEDULE OF INVESTMENTS continued
September 30, 2004 (unaudited)
| | | | | | |
| | | Shares | | | | Value |
|
| |
| COMMON STOCKS continued | | | | | | |
| FINANCIALS continued | | | | | | |
| Thrifts & Mortgage Finance 1.1% | | | | | | |
| Sovereign Bancorp, Inc | | 167,085 | | $ | | 3,645,795 |
| Washington Mutual, Inc | | 208,948 | | | | 8,165,688 |
| | | | | |
|
| | | | | | | 11,811,483 |
| | | | | |
|
| HEALTH CARE 9.0% | | | | | | |
| Biotechnology 0.7% | | | | | | |
| Amgen, Inc. * | | 45,000 | | | | 2,550,600 |
| Biogen Idec, Inc. * | | 55,000 | | | | 3,364,350 |
| Genentech, Inc. * | | 34,000 | | | | 1,782,280 |
| | | | | |
|
| | | | | | | 7,697,230 |
| | | | | |
|
| Health Care Equipment & Supplies 3.6% | | | | | | |
| Alcon, Inc | | 23,000 | | | | 1,844,600 |
| Baxter International, Inc | | 32,345 | | | | 1,040,215 |
| Medtronic, Inc | | 217,638 | | | | 11,295,413 |
| Millipore Corp. * | | 90,000 | | | | 4,306,500 |
| St. Jude Medical, Inc. * | | 74,000 | | | | 5,569,980 |
| Stryker Corp | | 102,000 | | | | 4,904,160 |
| Thermo Electron Corp. * | | 133,310 | | | | 3,602,036 |
| Zimmer Holdings, Inc. * | | 55,500 | | | | 4,386,720 |
| | | | | |
|
| | | | | | | 36,949,624 |
| | | | | |
|
| Health Care Providers & Services 1.2% | | | | | | |
| Aetna, Inc | | 82,000 | | | | 8,194,260 |
| Caremark Rx, Inc. * | | 140,000 | | | | 4,489,800 |
| | | | | |
|
| | | | | | | 12,684,060 |
| | | | | |
|
| Pharmaceuticals 3.5% | | | | | | |
| Abbott Laboratories | | 78,625 | | | | 3,330,555 |
| Eli Lilly & Co | | 30,000 | | | | 1,801,500 |
| Merck & Co., Inc | | 171,778 | | | | 5,668,674 |
| Pfizer, Inc | | 484,701 | | | | 14,831,851 |
| Schering-Plough Corp | | 140,000 | | | | 2,668,400 |
| Wyeth | | 201,723 | | | | 7,544,440 |
| | | | | |
|
| | | | | | | 35,845,420 |
| | | | | |
|
| INDUSTRIALS 7.8% | | | | | | |
| Aerospace & Defense 1.6% | | | | | | |
| Boeing Co | | 42,000 | | | | 2,168,040 |
| Honeywell International, Inc | | 103,141 | | | | 3,698,636 |
| Lockheed Martin Corp | | 116,000 | | | | 6,470,480 |
| Northrop Grumman Corp | | 85,835 | | | | 4,577,581 |
| | | | | |
|
| | | | | | | 16,914,737 |
| | | | | |
|
| Building Products 0.4% | | | | | | |
| Masco Corp | | 135,000 | | | | 4,661,550 |
| | | | | |
|
See Notes to Financial Statements
17
SCHEDULE OF INVESTMENTS continued
September 30, 2004 (unaudited)
| | | | | | |
| | | Shares | | | | Value |
|
| COMMON STOCKS continued | | | | | | |
| INDUSTRIALS continued | | | | | | |
| Commercial Services & Supplies 0.3% | | | | | | |
| Cendant Corp | | 145,000 | | $ | | 3,132,000 |
| | | | | |
|
| Electrical Equipment 0.6% | | | | | | |
| Cooper Industries, Ltd., Class A | | 105,000 | | | | 6,195,000 |
| | | | | |
|
| Industrial Conglomerates 3.4% | | | | | | |
| Allete, Inc | | 69,865 | | | | 2,270,612 |
| General Electric Co | | 629,184 | | | | 21,127,999 |
| Tyco International, Ltd | | 369,247 | | | | 11,321,113 |
| | | | | |
|
| | | | | | | 34,719,724 |
| | | | | |
|
| Machinery 1.5% | | | | | | |
| Deere & Co | | 127,751 | | | | 8,246,327 |
| Illinois Tool Works, Inc | | 35,350 | | | | 3,293,559 |
| Ingersoll-Rand Co., Ltd., Class A * | | 55,543 | | | | 3,775,258 |
| | | | | |
|
| | | | | | | 15,315,144 |
| | | | | |
|
| INFORMATION TECHNOLOGY 9.5% | | | | | | |
| Communications Equipment 2.4% | | | | | | |
| Cisco Systems, Inc. * | | 285,000 | | | | 5,158,500 |
| Corning, Inc | | 610,000 | | | | 6,758,800 |
| Motorola, Inc | | 222,000 | | | | 4,004,880 |
| QUALCOMM, Inc | | 220,000 | | | | 8,588,800 |
| | | | | |
|
| | | | | | | 24,510,980 |
| | | | | |
|
| Computers & Peripherals 2.1% | | | | | | |
| Dell, Inc. * | | 133,000 | | | | 4,734,800 |
| Hewlett-Packard Co | | 216,478 | | | | 4,058,962 |
| International Business Machines Corp | | 79,367 | | | | 6,804,927 |
| Lexmark International, Inc., Class A * | | 74,000 | | | | 6,216,740 |
| | | | | |
|
| | | | | | | 21,815,429 |
| | | | | |
|
| Electronic Equipment & Instruments 0.0% | | | | | | |
| Ingram Micro, Inc., Class A | | 10,614 | | | | 170,885 |
| | | | | |
|
| Internet Software & Services 0.4% | | | | | | |
| Yahoo!, Inc. * | | 130,000 | | | | 4,408,300 |
| | | | | |
|
| IT Services 1.3% | | | | | | |
| Accenture, Ltd., Class A * | | 135,000 | | | | 3,651,750 |
| Affiliated Computer Services, Inc., Class A * | | 55,000 | | | | 3,061,850 |
| Cognizant Technology Solutions Corp., Class A * | | 82,500 | | | | 2,517,075 |
| First Data Corp | | 91,745 | | | | 3,990,908 |
| | | | | |
|
| | | | | | | 13,221,583 |
| | | | | |
|
| Semiconductors & Semiconductor Equipment 0.8% | | | | | | �� |
| Intel Corp | | 412,889 | | | | 8,282,553 |
| | | | | |
|
See Notes to Financial Statements
18
SCHEDULE OF INVESTMENTS continued
September 30, 2004 (unaudited)
| | | | |
| | | Shares | | Value |
|
| COMMON STOCKS continued | | | | |
| INFORMATION TECHNOLOGY continued | | | | |
| Software 2.5% | | | | |
| Intuit, Inc. * | | 75,000 | $ | 3,405,000 |
| Microsoft Corp | | 695,978 | | 19,243,792 |
| Oracle Corp. * | | 291,900 | | 3,292,632 |
| | | |
|
| | | | | 25,941,424 |
| | | |
|
| MATERIALS 2.3% | | | | |
| Chemicals 1.2% | | | | |
| Air Products & Chemicals, Inc | | 70,000 | | 3,806,600 |
| Dow Chemical Co | | 42,395 | | 1,915,406 |
| Monsanto Co | | 93,164 | | 3,393,033 |
| PPG Industries, Inc | | 55,000 | | 3,370,400 |
| | | |
|
| | | | | 12,485,439 |
| | | |
|
| Metals & Mining 1.1% | | | | |
| Freeport-McMoRan Copper & Gold, Inc., Class B (p) | | 107,524 | | 4,354,722 |
| Peabody Energy Corp. (p) | | 48,207 | | 2,868,316 |
| Phelps Dodge Corp | | 38,028 | | 3,499,717 |
| | | |
|
| | | | | 10,722,755 |
| | | |
|
| TELECOMMUNICATION SERVICES 1.8% | | | | |
| Diversified Telecommunication Services 1.4% | | | | |
| ALLTEL Corp | | 59,976 | | 3,293,282 |
| Verizon Communications, Inc | | 272,294 | | 10,722,938 |
| | | |
|
| | | | | 14,016,220 |
| | | |
|
| Wireless Telecommunications Services 0.4% | | | | |
| Nextel Communications, Inc., Class A * | | 181,117 | | 4,317,829 |
| | | |
|
| UTILITIES 1.4% | | | | |
| Electric Utilities 1.4% | | | | |
| Entergy Corp | | 91,620 | | 5,553,088 |
| Exelon Corp | | 118,783 | | 4,358,149 |
| PG&E Corp. * | | 153,448 | | 4,664,819 |
| | | |
|
| | | | | 14,576,056 |
| | | |
|
| Total Common Stocks (cost $552,083,743) | | | | 630,640,484 |
| | | |
|
| |
| SHORT-TERM INVESTMENTS 6.3% | | | | |
| MUTUAL FUND SHARES 6.3% | | | | |
| Evergreen Institutional U.S. Government Money Market Fund ø | | 45,829,244 | | 45,829,244 |
| Navigator Prime Portfolio (p)(p) | | 19,054,335 | | 19,054,335 |
| | | |
|
| Total Short-Term Investments (cost $64,883,579) | | | | 64,883,579 |
| | | |
|
| Total Investments (cost $987,460,230) 104.0% | | | | 1,074,772,224 |
| Other Assets and Liabilities (4.0%) | | | | (40,956,994) |
| | | |
|
| Net Assets 100.0% | | | $ | 1,033,815,230 |
| | | |
|
See Notes to Financial Statements
19
SCHEDULE OF INVESTMENTS continued
September 30, 2004 (unaudited)
| | |
| (h) | | No market quotation available. Valued at fair value as determined in good faith under procedures established by the |
| | | Board of Trustees. |
| (n) | | Security issued in zero coupon form with no periodic interest payments but is acquired at a discount that results in a |
| | | current yield to maturity. An effective interest rate is applied to recognize interest income daily for the bond. This rate is |
| | | based on total expected income to be earned over the life of the bond from amortization of discount at acquisition. |
| # | | When-issued or delayed delivery security |
| ## | | All or a portion of the security has been segregated for when-issued or delayed delivery securities. |
| ø | | Evergreen Investment Management Company, LLC is the investment advisor to both the Fund and the money market |
| | | fund. |
| (p) | | All or a portion of this security is on loan. |
| (p)(p) | | Represents investment of cash collateral received from securities on loan. |
| 144A | | Security that may be resold to qualified institutional buyers under Rule 144A of the Securities Act of 1933, as amended. |
| | | This security has been determined to be liquid under guidelines established by the Board of Trustees. |
| * | | Non-income producing security |
| |
| Summary of Abbreviations: |
| ADR | American Depository Receipt |
| FHLMC | Federal Home Loan Mortgage Corp. |
| FNMA | Federal National Mortgage Association |
| GNMA | Government National Mortgage Association |
| TBA | To Be Announced |
The following table shows portfolio composition as a percent of total investments as of September 30, 2004:
| | |
| Common Stocks | | 58.7% |
| Agency Mortgage-Backed Pass-Through Securities | | 8.9% |
| Corporate Bonds | | 7.8% |
| U.S. Treasury Obligations | | 4.7% |
| Agency Mortgage-Backed Collateralized Mortgage Obligations | | 4.5% |
| Commercial Mortgage-Backed Securities | | 3.0% |
| Reperforming Mortgage-Backed Pass-Through Securities | | 2.7% |
| Asset-Backed Securities | | 1.5% |
| Reperforming Mortgage-Backed Collateralized-Mortgage Obligations | | 0.8% |
| Whole Loan Mortgage-Backed Pass-Collateralized Mortgage Obligations | | 0.7% |
| Whole Loan Mortgage-Backed Pass-Through Securities | | 0.4% |
| Yankee Obligations-Corporate | | 0.3% |
| Cash Equivalents | | 6.0% |
| |
|
| | | 100.0% |
| | |
|
See Notes to Financial Statements
20
STATEMENT OF ASSETS AND LIABILITIES
September 30, 2004 (unaudited)
| | | | |
|
| Assets | | | | |
| Investments in securities, at value (cost $987,460,230) including | | | | |
| $18,729,437 of securities loaned | | $ | | 1,074,772,224 |
| Receivable for securities sold | | | | 17,206,927 |
| Receivable for Fund shares sold | | | | 61,287 |
| Dividends and interest receivable | | | | 3,208,625 |
| Receivable for securities lending income | | | | 271 |
| Prepaid expenses and other assets | | | | 6,293 |
|
| Total assets | | | | 1,095,255,627 |
|
| Liabilities | | | | |
| Payable for securities purchased | | | | 34,481,701 |
| Payable for Fund shares redeemed | | | | 7,525,895 |
| Payable for securities on loan | | | | 19,054,335 |
| Due to custodian bank | | | | 15,487 |
| Advisory fee payable | | | | 13,474 |
| Distribution Plan expenses payable | | | | 14,864 |
| Due to other related parties | | | | 14,747 |
| Accrued expenses and other liabilities | | | | 319,894 |
|
| Total liabilities | | | | 61,440,397 |
|
| Net assets | | $ | | 1,033,815,230 |
|
| Net assets represented by | | | | |
| | | | |
| Paid-in capital | | $ | | 1,063,104,475 |
| Overdistributed net investment income | | | | (190,371) |
| Accumulated net realized losses on securities and foreign currency related transactions | | | | (116,410,938) |
| Net unrealized gains on securities and foreign currency related transactions | | | | 87,312,064 |
|
| Total net assets | | $ | | 1,033,815,230 |
|
| Net assets consists of | | | | |
| Class A | | $ | | 387,300,787 |
| Class B | | | | 338,790,558 |
| Class C | | | | 85,616,088 |
| Class I | | | | 222,107,797 |
|
| Total net assets | | $ | | 1,033,815,230 |
|
| Shares outstanding | | | | |
| Class A | | | | 23,848,733 |
| Class B | | | | 20,972,368 |
| Class C | | | | 5,303,847 |
| Class I | | | | 13,679,619 |
|
| Net asset value per share | | | | |
| Class A | | $ | | 16.24 |
| Class A - Offering price (based on sales charge of 5.75%) | | $ | | 17.23 |
| Class B | | $ | | 16.15 |
| Class C | | $ | | 16.14 |
| Class I | | $ | | 16.24 |
|
See Notes to Financial Statements
21
STATEMENT OF OPERATIONS
Six Months Ended September 30, 2004 (unaudited)
| | | | |
|
| Investment income | | | | |
| Interest | | $ | | 9,708,639 |
| Dividends (net of foreign withholding taxes of $34,713) | | | | 5,126,592 |
|
| Total investment income | | | | 14,835,231 |
|
| Expenses | | | | |
| Advisory fee | | | | 2,878,192 |
| Distribution Plan expenses | | | | |
| Class A | | | | 592,782 |
| Class B | | | | 1,932,522 |
| Class C | | | | 458,598 |
| Administrative services fee | | | | 555,783 |
| Transfer agent fees | | | | 2,058,613 |
| Trustees' fees and expenses | | | | 15,568 |
| Printing and postage expenses | | | | 77,859 |
| Custodian and accounting fees | | | | 138,944 |
| Registration and filing fees | | | | 18,111 |
| Professional fees | | | | 12,189 |
| Other | | | | 26,998 |
|
| Total expenses | | | | 8,766,159 |
| Less: Expense reductions | | | | (2,435) |
| Fee waivers | | | | (278,018) |
|
| Net expenses | | | | 8,485,706 |
|
| Net investment income | | | | 6,349,525 |
|
| Net realized and unrealized gains or losses on securities | | | | |
| and foreign currency related transactions | | | | |
| Net realized gains or losses on: | | | | |
| Securities | | | | 25,595,133 |
| Foreign currency related transactions | | | | (3,781) |
|
| Net realized gains on securities and foreign currency related transactions | | | | 25,591,352 |
| Net change in unrealized gains or losses on securities and | | | | |
| foreign currency related transactions | | | | (52,380,527) |
|
| Net realized and unrealized gains or losses on securities and | | | | |
| foreign currency related transactions | | | | (26,789,175) |
|
| Net decrease in net assets resulting from operations | | | | ($20,439,650) |
|
See Notes to Financial Statements
22
STATEMENTS OF CHANGES IN NET ASSETS
| | | | | | | | |
| | | Six Months Ended | | | | |
| | | September 30, 2004 | | Year Ended |
| | | (unaudited) | | March 31, 2004 |
|
| Operations | | | | | | | | |
| Net investment income | | $ | | 6,349,525 | | $ | | 11,522,548 |
| Net realized gains on securities and | | | | | | | | |
| foreign currency related | | | | | | | | |
| transactions | | | | 25,591,352 | | | | 69,364,066 |
| Net change in unrealized gains or | | | | | | | | |
| losses on securities and foreign | | | | | | | | |
| currency related transactions | | | | (52,380,527) | | | | 170,119,960 |
|
| Net increase (decrease) in net assets | | | | | | | | |
| resulting from operations | | | | (20,439,650) | | | | 251,006,574 |
|
| Distributions to shareholders | | | | | | | | |
| from | | | | | | | | |
| Net investment income | | | | | | | | |
| Class A | | | | (2,910,982) | | | | (4,583,725) |
| Class B | | | | (1,332,063) | | | | (2,037,705) |
| Class C | | | | (337,424) | | | | (464,109) |
| Class I | | | | (2,084,938) | | | | (4,200,028) |
|
| Total distributions to shareholders | | | | (6,665,407) | | | | (11,285,567) |
|
| | | Shares | | | | Shares | | |
| Capital share transactions | | | | | | | | |
| Proceeds from shares sold | | | | | | | | |
| Class A | | 598,908 | | 9,740,462 | | 1,329,765 | | 20,504,957 |
| Class B | | 124,503 | | 2,015,020 | | 449,776 | | 6,894,464 |
| Class C | | 31,189 | | 504,720 | | 87,371 | | 1,332,360 |
| Class I | | 458,522 | | 7,475,740 | | 2,055,863 | | 31,455,829 |
|
| | | | | 19,735,942 | | | | 60,187,610 |
|
| Net asset value of shares issued in | | | | | | | | |
| reinvestment of distributions | | | | | | | | |
| Class A | | 168,956 | | 2,755,699 | | 273,022 | | 4,331,770 |
| Class B | | 78,255 | | 1,269,845 | | 123,012 | | 1,935,235 |
| Class C | | 18,734 | | 303,809 | | 26,372 | | 414,970 |
| Class I | | 117,308 | | 1,912,783 | | 234,659 | | 3,710,407 |
|
| | | | | 6,242,136 | | | | 10,392,382 |
|
| Automatic conversion of Class B | | | | | | | | |
| shares to Class A shares | | | | | | | | |
| Class A | | 1,953,169 | | 31,770,927 | | 4,100,014 | | 62,960,093 |
| Class B | | (1,965,441) | | (31,770,927) | | (4,126,554) | | (62,960,093) |
|
| | | | | 0 | | | | 0 |
|
| Payment for shares redeemed | | | | | | | | |
| Class A | | (3,387,175) | | (55,002,699) | | (6,518,236) | | (101,811,010) |
| Class B | | (3,827,415) | | (61,755,693) | | (7,579,932) | | (116,875,329) |
| Class C | | (839,428) | | (13,574,849) | | (2,089,612) | | (32,297,850) |
| Class I | | (2,034,201) | | (33,018,485) | | (9,050,144) | | (141,255,482) |
|
| | | | | (163,351,726) | | | | (392,239,671) |
|
| Net decrease in net assets resulting | | | | | | | | |
| from capital share transactions | | | | (137,373,648) | | | | (321,659,679) |
|
| Total decrease in net assets | | | | (164,478,705) | | | | (81,938,672) |
| Net assets | | | | | | | | |
| Beginning of period | | | | 1,198,293,935 | | | | 1,280,232,607 |
|
| End of period | | $ | | 1,033,815,230 | | $ | | 1,198,293,935 |
|
| Undistributed (overdistributed) net | | | | | | | | |
| investment income | | $ | | (190,371) | | $ | | 125,511 |
|
See Notes to Financial Statements
23
NOTES TO FINANCIAL STATEMENTS (unaudited)
1. ORGANIZATION
Evergreen Foundation Fund (the "Fund") is a diversified series of Evergreen Equity Trust (the "Trust"), a Delaware statutory trust organized on September 18, 1997. The Trust is an open-end management investment company registered under the Investment Company Act of 1940, as amended (the "1940 Act").
The Fund offers Class A, Class B, Class C and Institutional ("Class I") shares. Class A shares are sold with a front-end sales charge. However, Class A share investments of $1 million or more are not subject to a front-end sales charge but will be subject to a contingent deferred sales charge of 1.00% upon redemption within one year. Class B shares are sold without a front-end sales charge but are subject to a contingent deferred sales charge that is payable upon redemption and decreases depending on how long the shares have been held. Effective February 2, 2004, Class C shares are no longer sold with a front-end sales charge but are still subject to a contingent deferred sales charge that is payable upon redemption within one year. Class I shares are sold without a front-end sales charge or contingent deferred sales charge. Each class of shares, except Class I shares, pays an ongoing distribution fee.
2. SIGNIFICANT ACCOUNTING POLICIES
The following is a summary of significant accounting policies consistently followed by the Fund in the preparation of its financial statements. The policies are in conformity with generally accepted accounting principles in the United States of America, which require management to make estimates and assumptions that affect amounts reported herein. Actual results could differ from these estimates.
a. Valuation of investments
Listed equity securities are usually valued at the last sales price or official closing price on the national securities exchange where the securities are principally traded.
Portfolio debt securities acquired with more than 60 days to maturity are valued at prices obtained from an independent pricing service which takes into consideration such factors as similar security prices, yields, maturities, liquidity and ratings. Securities for which valuations are not available from an independent pricing service may be valued by brokers which use prices provided by market makers or estimates of market value obtained from yield data relating to investments or securities with similar characteristics.
Foreign securities traded on an established exchange are valued at the last sales price on the exchange where the security is primarily traded. If there has been no sale, the securities are valued at the mean between bid and asked prices. Foreign securities may be valued at fair value according to procedures approved by the Board of Trustees if the closing price is not reflective of current market prices due to trading or events occurring in the foreign markets between the close of the established exchange and the valuation time of the Fund. In addition, substantial changes in values in the U.S. markets subsequent to the close of a foreign market may also affect the values of securities traded in the foreign market. The value of foreign securities may be adjusted if such movements in the U.S. market exceed a specified threshold.
24
NOTES TO FINANCIAL STATEMENTS (unaudited) continued
Short-term securities with remaining maturities of 60 days or less at the time of purchase are valued at amortized cost, which approximates market value.
Investments in other mutual funds are valued at net asset value. Securities for which market quotations are not available or not reflective of current market value are valued at fair value as determined in good faith, according to procedures approved by the Board of Trustees.
b. Foreign currency translation
All assets and liabilities denominated in foreign currencies are translated into U.S. dollar amounts at the date of valuation. Purchases and sales of portfolio securities and income items denominated in foreign currencies are translated into U.S. dollar amounts on the respective dates of such transactions. The Fund does not separately account for that portion of the results of operations resulting from changes in foreign exchange rates on investments and the fluctuations arising from changes in market prices of securities held. Such fluctuations are included with the net realized and unrealized gains or losses on securities.
c. When-issued and delayed delivery transactions
The Fund records when-issued securities as of trade date and maintains security positions such that sufficient liquid assets will be available to make payment for the securities purchased. Securities purchased on a when-issued or delayed delivery basis are marked-to-market daily and begin earning interest on the settlement date. Losses may occur on these transactions due to changes in market conditions or the failure of counterparties to perform under the contract.
d. Securities lending
The Fund may lend its securities to certain qualified brokers in order to earn additional income. The Fund receives compensation in the form of fees or interest earned on the investment of any cash collateral received. The Fund also continues to receive interest and dividends on the securities loaned. The Fund receives collateral in the form of cash or securities with a market value at least equal to the market value of the securities on loan. In the event of default or bankruptcy by the borrower, the Fund could experience delays and costs in recovering the loaned securities or in gaining access to the collateral. The Fund has the right under the lending agreement to recover the securities from the borrower on demand.
e. Dollar roll transactions
The Fund may enter into dollar roll transactions with respect to mortgage-backed securities. In a dollar roll transaction, the Fund sells mortgage-backed securities to financial institutions and simultaneously agrees to accept substantially similar (same type, coupon and maturity) securities at a later date at an agreed upon price. The Fund will use the proceeds generated from the transactions to invest in short-term investments, which may enhance the Fund's current yield and total return. The Fund accounts for dollar roll transactions as purchases and sales.
f. Security transactions and investment income
Security transactions are recorded on trade date. Realized gains and losses are computed using the specific cost of the security sold. Interest income is recorded on the accrual basis and includes accretion of discounts and amortization of premiums. Dividend income is recorded on the ex-
25
NOTES TO FINANCIAL STATEMENTS (unaudited) continued
dividend date or in the case of some foreign securities, on the date when the Fund is made aware of the dividend. Foreign income and capital gains realized on some securities may be subject to foreign taxes, which are accrued as applicable.
g. Federal taxes
The Fund intends to continue to qualify as a regulated investment company and distribute all of its taxable income, including any net capital gains (which have already been offset by available capital loss carryovers). Accordingly, no provision for federal taxes is required.
h. Distributions
Distributions to shareholders from net investment income and net realized gains, if any, are recorded on the ex-dividend date. Such distributions are determined in conformity with income tax regulations, which may differ from generally accepted accounting principles.
i. Class allocations
Income, common expenses and realized and unrealized gains and losses are allocated to the classes based on the relative net assets of each class. Distribution fees, if any, are calculated daily at the class level based on the appropriate net assets of each class and the specific expense rates applicable to each class.
3. ADVISORY FEE AND OTHER TRANSACTIONS WITH AFFILIATES
Evergreen Investment Management Company, LLC ("EIMC"), an indirect, wholly-owned subsidiary of Wachovia Corporation ("Wachovia"), is the investment advisor to the Fund and is paid an annual fee starting at 0.55% and declining to 0.40% as average daily net assets increase.
Tattersall Advisory Group, Inc., an indirect, wholly-owned subsidiary of Wachovia, is the investment sub-advisor to the fixed income portion of the Fund and is paid by EIMC for its services to the Fund.
From time to time, EIMC may voluntarily or contractually waive its fee and/or reimburse expenses in order to limit operating expenses. For fee waivers and/or reimbursements made after January 1, 2003, EIMC may recoup certain amounts waived and/or reimbursed up to a period of three years following the end of the fiscal year in which the fee waivers and/or reimbursements were made. During the six months ended September 30, 2004, EIMC waived its fee in the amount of $278,018 which represents 0.05% of the Fund's average daily net assets (on an annualized basis). As of September 30, 2004 the Fund had $278,018 in advisory fee waivers subject to recoupment.
Evergreen Investment Services, Inc. ("EIS"), an indirect, wholly-owned subsidiary of Wachovia, is the administrator to the Fund. As administrator, EIS provides the Fund with facilities, equipment and personnel and is paid an annual rate determined by applying percentage rates to the aggregate average daily net assets of the Evergreen funds (excluding money market funds), starting at 0.10% and declining to 0.05% as the aggregate average daily net assets of the Evergreen funds (excluding money market funds) increase.
26
NOTES TO FINANCIAL STATEMENTS (unaudited) continued
Evergreen Service Company, LLC ("ESC"), an indirect, wholly-owned subsidiary of Wachovia, is the transfer and dividend disbursing agent for the Fund. ESC receives account fees that vary based on the type of account held by the shareholders in the Fund. For the six months ended September 30, 2004, the transfer agent fees were equivalent to an annual rate of 0.37% of the Fund's average daily net assets.
The Fund has placed a portion of its portfolio transactions with brokerage firms that are affiliates of Wachovia. During the six months ended September 30, 2004 the Fund paid brokerage commissions of $124,624 to Wachovia Securities, LLC.
4. DISTRIBUTION PLANS
EIS also serves as distributor of the Fund's shares. Prior to May 1, 2004, Evergreen Distributor, Inc., a wholly-owned subsidiary of BISYS Fund Services, Inc., served as the Fund's distributor.
The Fund has adopted Distribution Plans, as allowed by Rule 12b-1 of the 1940 Act, for each class of shares, except Class I. Under the Distribution Plans, distribution fees are paid at an annual rate of 0.30% of the average daily net assets for Class A shares and 1.00% of the average daily net assets for each of Class B and Class C shares.
For the six months ended September 30, 2004, EIS received $2,492 from the sale of Class A shares and $262,920 and $1,511 in contingent deferred sales charges from redemptions of Class B and Class C shares, respectively.
5. SECURITIES TRANSACTIONS
Cost of purchases and proceeds from sales of investment securities (excluding short-term securities) were as follows for the six months ended September 30, 2004:
| | | | | | |
| Cost of Purchases | | Proceeds from Sales |
| |
|
| U.S. | | Non-U.S. | | U.S. | | Non-U.S. |
| Government | | Government | | Government | | Government |
|
| $ 401,461,780 | | $ 371,448,830 | | $ 424,576,819 | | $ 457,631,861 |
|
During the six months ended September 30, 2004, the Fund loaned securities to certain brokers. At September 30, 2004, the value of securities on loan and the value of collateral amounted to $18,729,437 and $19,054,335, respectively. During the six months ended September 30, 2004, the Fund earned $5,754 in income from securities lending which is included in dividend income on the Statement of Operations.
On September 30, 2004, the aggregate cost of securities for federal income tax purposes was $996,597,993. The gross unrealized appreciation and depreciation on securities based on tax cost was $95,571,132 and $17,396,901, respectively, with a net unrealized appreciation of $78,174,231.
As of March 31, 2004, the Fund had $131,889,876 in capital loss carryovers for federal income tax purposes with $19,206,168 expiring in 2010, $96,896,643 expiring in 2011 and $15,787,065 expiring in 2012.
27
NOTES TO FINANCIAL STATEMENTS (unaudited) continued
For income tax purposes, currency losses incurred after October 31 within the Fund's fiscal year are deemed to arise on the first business day of the following fiscal year. As of March 31, 2004, the Fund incurred and elected to defer post-October currency losses of $16,670.
6. INTERFUND LENDING
Pursuant to an Exemptive Order issued by the SEC, the Fund may participate in an interfund lending program with certain funds in the Evergreen fund family. This program allows the Fund to borrow from, or lend money to, other participating funds. During the six months ended September 30, 2004 the Fund did not participate in the interfund lending program.
7. EXPENSE REDUCTIONS
Through expense offset arrangements with ESC and the Fund's custodian, a portion of fund expenses has been reduced.
8. DEFERRED TRUSTEES' FEES
Each Trustee of the Fund may defer any or all compensation related to performance of their duties as Trustees. The Trustees' deferred balances are allocated to deferral accounts, which are included in the accrued expenses for the Fund. The investment performance of the deferral accounts are based on the investment performance of certain Evergreen funds. Any gains earned or losses incurred in the deferral accounts are reported in the Fund's Trustees' fees and expenses. At the election of the Trustees, the deferral account will be paid either in one lump sum or in quarterly installments for up to ten years.
9. FINANCING AGREEMENT
The Fund and certain other Evergreen funds share in a $150 million unsecured revolving credit commitment for temporary and emergency purposes, including the funding of redemptions, as permitted by each participating fund's borrowing restrictions. Borrowings under this facility bear interest at 0.50% per annum above the Federal Funds rate. All of the participating funds are charged an annual commitment fee of 0.09% of the unused balance, which is allocated pro rata. During the six months ended September 30, 2004, the Fund had no borrowings under this agreement.
10. LITIGATION
From time to time, the Fund and EIMC are involved in various legal actions in the normal course of business. In EIMC's opinion, based upon the opinions of counsel, the Fund is not involved in any legal action that will have a material effect on the Fund's financial position and results of operations.
11. REGULATORY MATTERS
Since September 2003, governmental and self-regulatory authorities have instituted numerous ongoing investigations of various practices in the mutual fund industry, including investigations relating to revenue sharing, market-timing, late trading and record retention, among other things. The investigations cover investment advisors, distributors and transfer agents to mutual funds, as well as other firms. EIMC, EIS and ESC (collectively, "Evergreen") have received subpoenas and
28
NOTES TO FINANCIAL STATEMENTS (unaudited) continued
other requests for documents and testimony relating to these investigations, are endeavoring to comply with those requests, and are cooperating with the investigations. Evergreen is continuing its own internal review of policies, practices, procedures and personnel, and is taking remedial action where appropriate.
In connection with one of these investigations, on July 28, 2004, the staff of the Securities and Exchange Commission ("SEC") informed Evergreen that the staff intends to recommend to the SEC that it institute an enforcement action against Evergreen. The SEC staff's proposed allegations relate to (i) an arrangement pursuant to which a broker at one of EIMC's affiliated broker-dealers had been authorized, apparently by an EIMC officer (no longer with EIMC), to engage in short-term trading, on behalf of a client, in Evergreen Mid Cap Growth Fund (formerly Evergreen Small Company Growth Fund and prior to that, known as Evergreen Emerging Growth Fund) during the period from December 2000 through April 2003, in excess of the limitations set forth in this fund's prospectus, (ii) short-term trading from September 2001 through January 2003, by a former Evergreen portfolio manager of Evergreen Precious Metals Fund, a fund he managed at the time, (iii) the sufficiency of systems for monitoring exchanges and enforcing exchange limitations as stated in each fund's prospectuses, and (iv) the adequacy of e-mail retention practices. In connection with the activity in Evergreen Mid Cap Growth Fund, EIMC reimbursed this fund $378,905, plus an additional $25,242, representing what EIMC calculated at that time to be the client's net gain and the fees earned by EIMC and the expenses incurred by this fund on the client's account. In connection with the activity in Evergreen Precious Metals Fund, EIMC reimbursed this fund $70,878, plus an additional $3,075, representing what EIMC calculated at that time to be the portfolio manager's net gain and the fees earned by EIMC and expenses incurred by this fund on the portfolio manager's account. Evergreen currently intends to make a written Wells submission explaining why it believes that no such enforcement action should be instituted, and Evergreen also intends to engage in discussions with the staff of the SEC concerning its recommendation.
Any resolution of these matters with regulatory authorities may include, but not be limited to, sanctions, penalties or injunctions regarding Evergreen, restitution to mutual fund shareholders and/or other financial penalties and structural changes in the governance or management of Evergreen's mutual fund business. Any penalties or restitution will be paid by Evergreen and not by the Evergreen funds.
Evergreen does not believe the foregoing investigations and action will have a material adverse impact on the Evergreen funds. There can be no assurance, however, that these matters and any publicity surrounding or resulting from them will not result in reduced sales or increased redemptions of fund shares, which could increase fund transaction costs or operating expenses, or have other adverse consequences on the Evergreen funds.
29
This page left intentionally blank
30
This page left intentionally blank
31
TRUSTEES AND OFFICERS
TRUSTEES1
| | |
| Charles A. Austin III | | Principal occupations: Investment Counselor, Anchor Capital Advisors, Inc. (investment advice); |
| Trustee | | Director, The Andover Companies (insurance); Trustee, Arthritis Foundation of New England; |
| DOB: 10/23/1934 | | Director, The Francis Ouimet Society; Former Director, Health Development Corp. (fitness- |
| Term of office since: 1991 | | wellness centers); Former Director, Mentor Income Fund, Inc.; Former Trustee, Mentor Funds and |
| Other directorships: None | | Cash Resource Trust; Former Investment Counselor, Appleton Partners, Inc. (investment advice); |
| | | Former Director, Executive Vice President and Treasurer, State Street Research & Management |
| | | Company (investment advice) |
|
| Shirley L. Fulton | | Principal occupations: Partner, Helms, Henderson & Fulton, P.A. (law firm); Retired Senior |
| Trustee | | Resident Superior Court Judge, 26th Judicial District, Charlotte, NC |
| DOB: 1/10/1952 | | |
| Term of office since: 2004 | | |
| Other directorships: None | | |
|
| K. Dun Gifford | | Principal occupations: Chairman and President, Oldways Preservation and Exchange Trust |
| Trustee | | (education); Trustee, Treasurer and Chairman of the Finance Committee, Cambridge College; |
| DOB: 10/23/1938 | | Former Chairman of the Board, Director, and Executive Vice President, The London Harness |
| Term of office since: 1974 | | Company (leather goods purveyor); Former Director, Mentor Income Fund, Inc.; Former Trustee, |
| Other directorships: None | | Mentor Funds and Cash Resource Trust |
|
| Dr. Leroy Keith, Jr. | | Principal occupations: Partner, Stonington Partners, Inc. (private investment firm); Trustee of |
| Trustee | | Phoenix Series Fund, Phoenix Multi-Portfolio Fund, and The Phoenix Big Edge Series Fund; |
| DOB: 2/14/1939 | | Former Chairman of the Board and Chief Executive Officer, Carson Products Company |
| Term of office since: 1983 | | (manufacturing); Director, Obagi Medical Products Co.; Director, Lincoln Educational Services; |
| Other directorships: Trustee, | | Director, Diversapack Co.; Former President, Morehouse College; Former Director, Mentor |
| Phoenix Series Fund, Phoenix | | Income Fund, Inc.; Former Trustee, Mentor Funds and Cash Resource Trust |
| Multi-Portfolio Fund, and The | | |
| Phoenix Big Edge Series Fund | | |
|
| Gerald M. McDonnell | | Principal occupations: Manager of Commercial Operations, SMI STEEL Co. – South Carolina |
| Trustee | | (steel producer); Former Sales and Marketing Management, Nucor Steel Company; Former |
| DOB: 7/14/1939 | | Director, Mentor Income Fund, Inc.; Former Trustee, Mentor Funds and Cash Resource Trust |
| Term of office since: 1988 | | |
| Other directorships: None | | |
|
| William Walt Pettit | | Principal occupations: Partner and Vice President, Kellam & Pettit, P.A. (law firm); Former |
| Trustee | | Director, Mentor Income Fund, Inc.; Former Trustee, Mentor Funds and Cash Resource Trust |
| DOB: 8/26/1955 | | |
| Term of office since: 1984 | | |
| Other directorships: None | | |
|
| David M. Richardson | | Principal occupations: President, Richardson, Runden LLC (executive recruitment business |
| Trustee | | development/consulting company); Consultant, Kennedy Information, Inc. (executive |
| DOB: 9/19/1941 | | recruitment information and research company); Consultant, AESC (The Association of Retained |
| Term of office since: 1982 | | Executive Search Consultants); Trustee, NDI Technologies, LLP (communications); Director, J&M |
| Other directorships: None | | Cumming Paper Co. (paper merchandising); Former Vice Chairman, DHR International, Inc. |
| | | (executive recruitment); Former Director, Mentor Income Fund, Inc.; Former Trustee, Mentor |
| | | Funds and Cash Resource Trust |
|
| Dr. Russell A. Salton III | | Principal occupations: President/CEO, AccessOne MedCard; Former Medical Director, Healthcare |
| Trustee | | Resource Associates, Inc.; Former Medical Director, U.S. Health Care/Aetna Health Services; |
| DOB: 6/2/1947 | | Former Director, Mentor Income Fund, Inc.; Former Trustee, Mentor Funds and Cash Resource |
| Term of office since: 1984 | | Trust |
| Other directorships: None | | |
|
32
TRUSTEES AND OFFICERS continued
| | |
| Michael S. Scofield | | Principal occupations: Attorney, Law Offices of Michael S. Scofield; Former Director, Mentor |
| Trustee | | Income Fund, Inc.; Former Trustee, Mentor Funds and Cash Resource Trust |
| DOB: 2/20/1943 | | |
| Term of office since: 1984 | | |
| Other directorships: None | | |
|
| Richard J. Shima | | Principal occupations: Independent Consultant; Director, Trust Company of CT; Trustee, Saint |
| Trustee | | Joseph College (CT); Director, Hartford Hospital; Trustee, Greater Hartford YMCA; Former |
| DOB: 8/11/1939 | | Director, Enhance Financial Services, Inc.; Former Director, Old State House Association; Former |
| Term of office since: 1993 | | Director of CTG Resources, Inc. (natural gas); Former Director, Mentor Income Fund, Inc.; Former |
| Other directorships: None | | Trustee, Mentor Funds and Cash Resource Trust |
|
| Richard K. Wagoner, CFA 2 | | Principal occupations: Member and Former President, North Carolina Securities Traders |
| Trustee | | Association; Member, Financial Analysts Society; Former Consultant to the Boards of Trustees of |
| DOB: 12/12/1937 | | the Evergreen funds; Former Trustee, Mentor Funds and Cash Resource Trust |
| Term of office since: 1999 | | |
| Other directorships: None | | |
|
| |
| OFFICERS | | |
| |
| Dennis H. Ferro 3 | | Principal occupations: President and Chief Executive Officer, Evergreen Investment Company, |
| President | | Inc. and Executive Vice President, Wachovia Bank, N.A.; former Chief Investment Officer, |
| DOB: 6/20/1945 | | Evergreen Investment Company, Inc. |
| Term of office since: 2003 | | |
|
| Carol Kosel 4 | | Principal occupations: Senior Vice President, Evergreen Investment Services, Inc. |
| Treasurer | | |
| DOB: 12/25/1963 | | |
| Term of office since: 1999 | | |
|
| Michael H. Koonce 4 | | Principal occupations: Senior Vice President and General Counsel, Evergreen Investment |
| Secretary | | Services, Inc.; Senior Vice President and Assistant General Counsel, Wachovia Corporation |
| DOB: 4/20/1960 | | |
| Term of office since: 2000 | | |
|
| James Angelos 4 | | Principal occupations: Chief Compliance Officer, Senior Vice President and Director of |
| Chief Compliance Officer | | Compliance, Evergreen Investment Services, Inc. |
| DOB: 9/2/1947 | | |
| Term of office since: 2004 | | |
|
|
| 1 Each Trustee serves until a successor is duly elected or qualified or until his death, resignation, retirement or removal from office. Each |
| Trustee oversees 93 Evergreen funds. Correspondence for each Trustee may be sent to Evergreen Board of Trustees, P.O. Box 20083, |
| Charlotte, North Carolina 28202. |
| 2 Mr. Wagoner is an "interested person" of the Fund because of his ownership of shares in Wachovia Corporation, the parent to the |
| Fund's investment advisor. |
| 3 The address of the Officer is 401 S. Tryon Street, 20th Floor, Charlotte, NC 28288. |
| 4 The address of the Officer is 200 Berkeley Street, Boston, MA 02116. |
Additional information about the Fund's Board of Trustees and Officers can be found in the Statement of Additional Information (SAI) and is available upon request without charge by calling 800.343.2898.
33
568009 rv1 11/2004
Item 2 - Code of Ethics
(a) The Registrant has adopted a code of ethics that applies to the Registrant's principal executive officer and principal financial officer.
(b) During the period covered by this report, there were no amendments to the provisions of the code of ethics adopted in 2.(a) above.
(c) During the period covered by this report, there were no implicit or explicit waivers to the provisions of the code of ethics adopted in 2.(a) above.
Item 3 - Audit Committee Financial Expert
Charles A. Austin III and K. Dun Gifford have been determined by the Registrant's Board of Trustees to be audit committee financial experts within the meaning of Section 407 of the Sarbanes-Oxley Act. These financial experts are independent of management.
Items 4 – Principal Accountant Fees and Services
Applicable for annual reports only
Items 5 – Audit Committee of Listed Registrants
If applicable, not applicable at this time. Applicable for annual reports covering periods ending on or after the compliance date for the listing standards applicable to the particular issuer. Listed issuers must be in compliance with the new listing rules by the earlier of the registrant's first annual shareholders meeting after January 15, 2004 or October 31, 2004.
Item 6 – Schedule of Investments
Please see schedule of investments contained in the Report to Stockholders included under Item 1 of this Form N-CSR.
Item 7 – Disclosure of Proxy Voting Policies and Procedures for Closed-End Management Investment Companies.
If applicable, not applicable at this time. Applicable for annual reports filed on or after July 1, 2003.
Item 8 – Purchases of Equity Securities by Closed-End Management Investment Company and Affiliated Purchasers
Not applicable at this time. Applicable for closed-end funds only.
Item 9 – Submission of Matters to a Vote of Security Holders
If applicable, not applicable at this time.
Item 10 - Controls and Procedures
(a) The Registrant's Principal Executive Officer and Principal Financial Officer have evaluated the Registrant's disclosure controls and procedures within 90 days of this filing and have concluded that the Registrant's disclosure controls and procedures were effective, as of that date, in ensuring that information required to be disclosed by the Registrant in this Form N-CSR was recorded, processed, summarized, and reported timely.
(b) There were no significant changes in the Registrant's internal controls or other factors that could significantly affect these controls subsequent to the date of their evaluation, including any corrective actions with regard to significant deficiencies and material weaknesses.
Item 11 - Exhibits
File the exhibits listed below as part of this Form. Letter or number the exhibits in the sequence indicated.
(a) Any code of ethics, or amendment thereto, that is the subject of the disclosure required by Item 2, to the extent that the registrant intends to satisfy the Item 2 requirements through filing of an exhibit.
(b)(1) Separate certifications for the Registrant's principal executive officer and principal financial officer, as required by Section 302 of the Sarbanes-Oxley Act of 2002 and Rule 30a-2(a) under the Investment Company Act of 1940, are attached as EX99.CERT.
(b)(2) Separate certifications for the Registrant's principal executive officer and principal financial officer, as required by Section 1350 of Title 18 of United States Code, as adopted pursuant to Section 906 of the Sarbanes-Oxley Act of 2002, and Rule 30a-2(b) under the Investment Company Act of 1940, are attached as EX99.906CERT. The certifications furnished pursuant to this paragraph are not deemed to be "filed" for purposes of Section 18 of the Securities Exchange Act of 1934, or otherwise subject to the liability of that section. Such certifications are not deemed to be incorporated by reference into any filing under the Securities Act of 1933 or the Securities Exchange Act of 1934, except to the extent that the Registrant specifically incorporates them by reference.
Pursuant to the requirements of the Securities Exchange Act of 1934 and the Investment Company Act of 1940, the Registrant has duly caused this report to be signed on its behalf by the undersigned, thereunto duly authorized.
Evergreen Equity Trust
By: _______________________
Dennis H. Ferro,
Principal Executive Officer
Date: 11/29/2004
Pursuant to the requirements of the Securities Exchange Act of 1934 and the Investment Company Act of 1940, this report has been signed below by the following persons on behalf of the Registrant and in the capacities and on the dates indicated.
By: _______________________
Dennis H. Ferro,
Principal Executive Officer
Date: 11/29/2004
By: ________________________
Carol A. Kosel
Principal Financial Officer
Date: 11/24/2004