__________________________________________________________________________________
SECURITIES AND EXCHANGE COMMISSION
Washington, D.C. 20549
_______________
FORM 6-K
REPORT OF FOREIGN ISSUER
PURSUANT TO RULE 13a-16 OR 15d-16 OF
THE SECURITIES EXCHANGE ACT OF 1934
Date: For the period ending 27 February 2003
TELSTRA CORPORATION LIMITED
ACN 051 775 556
242 Exhibition Street
Melbourne Victoria 3000
Australia
Indicate by check mark whether the registrant files or will file annual reports under cover of Form 20-F or Form 40-F.
| Form 20-F | X | Form 40-F |
Indicate by check mark whether the registrant by furnishing the information contained in this Form is also thereby furnishing the information to the Commission pursuant to Rule 12g3-2(b) under the Securities Exchange Act of 1934
| Yes | No | X |
If "Yes" is marked, indicate below the file number assigned to the registrant in connection with Rule 12g3-2(b):
| 27/02/2003
| Office of the Company Secretary
Level 41
Telephone 03 9634 6400 Facsimile 03 9632 3215
|
ELECTRONIC LODGEMENT
Dear Sir or Madam
Re: Telstra Corporation Limited Financial Results for the Half Year ended 31 December 2002
In accordance with Listing Rules I enclose the following for immediate release:
- ASX Appendix 4B - half yearly report;
- Half year results and operations review - financial highlights and normalisation schedule;
- Media release;
- Half year financial report for the half year ended 31 Dec 2002; and
- Directors' report.
Yours sincerely
/s/ Douglas Gration
Douglas Gration
Company Secretary
| Telstra Corporation Limited ACN 051 775 556 ABN 33 051 775 556 |
| Rules 4.1, 4.3 |
| Appendix 4B |
| Half yearly report |
| Introduced 30/6/2002. |
| Name of entity |
| Telstra Corporation Limited ABN 33 051 775 556 |
| ABN | Half yearly | Preliminary final | Half year ('current period') | |||||||||
| 33 051 775 556 | X | X | 31 December 2002 | |||||||||
| For announcement to market | ||||
| Extracts from this report for announcement to the market (see note 1). | $A millions | |||
| Revenues from ordinary activities (item 1.1) | up | 7.5% | to | 11,406 |
| Profit (loss) from ordinary activities after tax attributable to members (item 1.22) | down | (43.6)% | to | 1,184 |
| Profit (loss) from extraordinary items after tax attributable to members (item 2.5(d)) | - | - | ||
| Net profit (loss) for the period attributable to members (item 1.11) | down | (43.6)% | to | 1,184 |
| Dividends (distributions) | Amount per security | Franked amount per security | ||
| (cents) | (cents) | |||
| Final dividend (Preliminary final report only - item 15.4) Interim dividend (Half yearly report only - item 15.6) | 12.0 | 12.0 | ||
| Special dividend (Item 15.7 (a)) | 3.0 | 3.0 | ||
| Previous corresponding period (Preliminary final report - item 15.5; half yearly report - item 15.7) | 11.0 | 11.0 | ||
| Record date for determining entitlements to the dividend, (in the case of a trust, distribution) (see item 15.2) | 21 March 2003 | |||
| Brief explanation of omission of any of the figures reported above (see Note 1) and short details of any bonus or cash issue or other item(s) of importance not previously released to the market: | ||||
| Nil | ||||
| Condensed consolidated statement of financial performance | |||||||||||
| Current period | Previous | ||||||||||
| Half yearly report | corresponding | ||||||||||
| period | |||||||||||
| $A millions | $A millions | ||||||||||
| 1.1 | Revenues from ordinary activities (see item 1.23) | 11,406 | 10,612 | ||||||||
| 1.2 | Expenses from ordinary activities (see item 1.23) | (7,848) | -7,009 | ||||||||
| 1.3 | Borrowing costs | (471) | -417 | ||||||||
| 1.4 | Share of net profits (losses) of associates and joint venture entities (see item 16.7) | (969) | -93 | ||||||||
| 1.5 | Profit (loss) from ordinary activities before tax | 2,118 | 3,093 | ||||||||
| 1.6 | Income tax on ordinary activities | (968) | -992 | ||||||||
| 1.7 | Profit (loss) from ordinary activities after tax | 1,150 | 2,101 | ||||||||
| 1.8 | Profit (loss) from extraordinary items after tax (see item 2.5) | - | - | ||||||||
| 1.9 | Net profit (loss) | 1,150 | 2,101 | ||||||||
| 1.10 | Net (profit) loss attributable to outside equity interests | 34 | (3) | ||||||||
| 1.11 | Net profit (loss) for the period attributable to members | 1,184 | 2,098 | ||||||||
| Non owner transaction changes in equity | |||||||||||
| 1.12 | Increase (decrease) in revaluation reserves | ||||||||||
| 1.13 | Net exchange differences recognised in equity (controlled entities) | (10) | (9) | ||||||||
| 1.14 (a) | Other revenue, expense and initial adjustments recognised directly in equity (attach details) | ||||||||||
| 1.14 (b) | Fair value reserve recognised on acquisition of controlling interest in joint venture entity | (1) | - | ||||||||
| 1.14 (c) | Reserves recognised on equity accounting our interest in joint ventures and associates | 5 | (2) | ||||||||
| 1.14 (d) | Adjustment to opening retained earnings due to change in accounting standard | 1,415 | - | ||||||||
| 1.15 | Initial adjustments from UIG transitional provisions | - | - | ||||||||
| 1.16 | Total transactions and adjustments recognised directly in equity (items 1.12 to 1.15) | 1,409 | (11) | ||||||||
| 1.17 | Total changes in equity not resulting from transactions with owners as owners attributable to members | ||||||||||
| owners attributable to members | 2,593 | 2,087 | |||||||||
| Earnings per security (EPS) | Current period | Previous corresponding period | |||||||||
| 1.18 | Basic EPS (in cents) | 9.2 | 16.3 | ||||||||
| 1.19 | Diluted EPS (in cents) | 9.2 | 16.3 | ||||||||
| Notes to the condensed consolidated statement of financial performance | |||||||||||
| Profit (loss) from ordinary activities attributable to members | |||||||||||
| Current Period $A millions | Previous corresponding period $A millions | ||||||||||
| 1.20 | Profit (loss) from ordinary activities after tax (item 1.7) | 1,150 | 2,101 | ||||||||
| 1.21 | Plus (less) outside equity interests | 34 | -3 | ||||||||
| 1.22 | Profit (loss) from ordinary activities after tax, attributable to members | 1,184 | 2,098 | ||||||||
| Revenue and expenses from ordinary activities | |||||||||||
| AASB 1004 requires disclosure of specific categories of revenue and AASB 1018 requires disclosure of expenses from ordinary activities according to either their nature or function. Entities must report details of revenue and expenses from ordinary activities using the layout employed in their accounts. See also items 12.1 to 12.6. | |||||||||||
| $A millions | Previous corresponding period $A millions | ||||||||||
| 1.23 | Details of revenue and expenses (including specific items) | ||||||||||
| Revenues | |||||||||||
| Interest revenue | |||||||||||
| -joint ventures and associated entities | 1 | 1 | |||||||||
| -other entities | 38 | 66 | |||||||||
| 39 | 67 | ||||||||||
| Dividend revenue | |||||||||||
| -other entities | 1 | - | |||||||||
| Revenue from the sale of: | |||||||||||
| - property, plant and equipment | 757 | 76 | |||||||||
| - investments in controlled entities | 17 | - | |||||||||
| - investment in joint venture entities | 3 | - | |||||||||
| - investments in listed securities and other corporations | 7 | 20 | |||||||||
| - businesses | 4 | 29 | |||||||||
| 788 | 125 | ||||||||||
| Expenses | |||||||||||
| Borrowing costs | |||||||||||
| - other entities | 522 | 471 | |||||||||
| - financing charges relating to finance leases | 1 | - | |||||||||
| 523 | 471 | ||||||||||
| - borrowing costs capitalised | (52) | (54) | |||||||||
| 471 | 417 | ||||||||||
| Revenue and expenses from ordinary activities | |||||||||||
| (continued) | Current Period $A millions | Previous corresponding period $A millions | |||||||||
| Net book value of assets we have sold/disposed: | |||||||||||
| - property, plant and equipment | 578 | 93 | |||||||||
| - investments in controlled entities | 12 | - | |||||||||
| - investments in listed securities and other corporations | 9 | 18 | |||||||||
| - businesses | (6) | 2 | |||||||||
| 593 | 113 | ||||||||||
| Provisions: | |||||||||||
| - reduction in value of investments | 3 | 26 | |||||||||
| Net (profit)/loss on sale of: | |||||||||||
| - property, plant and equipment | (179) | 17 | |||||||||
| - investments in controlled entities | (5) | - | |||||||||
| - investment in joint venture entities | (3) | - | |||||||||
| - investments in listed securities and other corporations | 2 | (2) | |||||||||
| - businesses | (10) | (27) | |||||||||
| (195) | (12) | ||||||||||
| Capitalised outlays | |||||||||||
| 1.24 | Interest costs capitalised in asset values | (52) | (54) | ||||||||
| 1.25 | Outlays capitalised in intangibles (unless arising from an | ||||||||||
| acquisition of a business) | (2) | - | |||||||||
| Consolidated retained profits | |||||||||||
| Current period $A millions | Previous corresponding period $A millions | ||||||||||
| 1.26 | Retained profits (accumulated losses) at the beginning of the financial period | 7,661 | 6,795 | ||||||||
| 1.27 | Net profit (loss) attributable to members (item 1.11) | 1,184 | 2,098 | ||||||||
| 1.28 | Net transfers from (to) reserves (details if material) | - | 29 | ||||||||
| 1.29 | Net effect of changes in accounting policies | 1,415 | - | ||||||||
| (due to AASB 1044: "Provisions, Contingent Liabilities and Contingent | |||||||||||
| Assets") | |||||||||||
| 1.30 | Dividends and other equity distributions paid or payable | (1,415) | -1,415 | ||||||||
| 1.30a | Other | 1 | - | ||||||||
| 1.31 | Retained profits (accumulated losses) at the end of financial period | 8,846 | 7,507 | ||||||||
| Intangible and extraordinary items | |||||||||||
| Consolidated - current period | |||||||||||
| Before tax $A millions | Related tax $A millions | Related outside equity interests $A millions | Amount (after tax) attributable to members $A millions | ||||||||
| 2.1 | Amortisation of goodwill | 57 | - | - | 57 | ||||||
| 2.2 | Amortisation of other intangibles | 72 | 4 | 2 | 66 | ||||||
| 2.3 | Total amortisation of intangibles | 129 | 4 | 2 | 123 | ||||||
| 2.4 | Extraordinary items (details) | - | - | - | - | ||||||
| 2.5 | Total extraordinary items | - | - | - | - | ||||||
| Comparison of half year profits | Current year $A millions | Previous year $A millions | |||||||||
| (Preliminary final report only) | |||||||||||
| 3.1 | Consolidated profit (loss) from ordinary activities after tax attributable to members reported for the 1st half year (item 1.23 in the half yearly report) | Not applicable | Not applicable | ||||||||
| 3.2 | Consolidated profit (loss) from ordinary activities after tax attributable to members for the 2nd half year | Not applicable | Not applicable | ||||||||
| Condensed consolidated statement of financial position | |||||||||||
| At end of current period $A millions | As shown in last annual report $A millions | As in last half yearly report $A millions | |||||||||
| Current Assets | |||||||||||
| 4.1 | Cash assets | 1,365 | 1,070 | 652 | |||||||
| 4.2 | Receivables | 3,875 | 4,063 | 3,930 | |||||||
| 4.3 | Investments | - | - | - | |||||||
| 4.4 | Inventories | 252 | 204 | 286 | |||||||
| 4.5 | Other (provide details if material) | 553 | 1,038 | 656 | |||||||
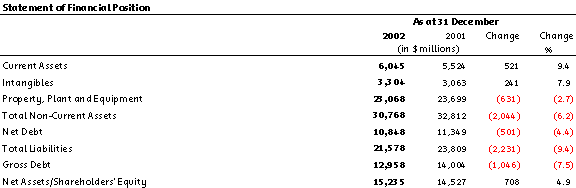
| 4.6 | Total current assets | 6,045 | 6,375 | 5,524 | |||||||
| Non-current assets | |||||||||||
| 4.7 | Receivables | 1,618 | 1,341 | 2,567 | |||||||
| 4.8 | Investments (equity accounted) | 240 | 1,197 | 1,084 | |||||||
| 4.9 | Other investments | 97 | 105 | 111 | |||||||
| 4.10 | Inventories | 6 | 20 | 22 | |||||||
| 4.11 | Exploration and evaluation expenditure capitalised (see para .71 of AASB 1022) | - | - | - | |||||||
| 4.12 | Development properties (mining entities) | - | - | - | |||||||
| 4.13 | Other property, plant and equipment (net) | 23,068 | 23,421 | 23,699 | |||||||
| 4.14 | Intangibles (net) | 3,304 | 3,421 | 3,063 | |||||||
| 4.15 (a) | Other (provide details if material) | 2,375 | 2,206 | 2,171 | |||||||
| 4.15 (b) | Future income tax benefit | 60 | 132 | 95 | |||||||
| 4.16 | Total non-current assets | 30,768 | 31,843 | 32,812 | |||||||
| 4.17 | Total assets | 36,813 | 38,218 | 38,336 | |||||||
| Current liabilities | |||||||||||
| 4.18 | Payables | 2,377 | 2,762 | 2,503 | |||||||
| 4.19 | Interest-bearing liabilities | 2,080 | 1,895 | 3,526 | |||||||
| 4.20 (a) | Income tax payable | 599 | 632 | 476 | |||||||
| 4.20 (b) | Provisions | 381 | 1,903 | 1,904 | |||||||
| 4.21 | Revenue received in advance | 840 | 1,037 | 859 | |||||||
| 4.22 | Total current liabilities | 6,277 | 8,229 | 9,268 | |||||||
| Non-current liabilities | |||||||||||
| 4.23 | Payables | 91 | 129 | 95 | |||||||
| 4.24 | Interest-bearing liabilities | 11,857 | 12,481 | 11,197 | |||||||
| 4.25 (a) | Income tax payable | - | - | 45 | |||||||
| 4.25 (b) | Provisions | 843 | 848 | 862 | |||||||
| 4.26 | Deferred income tax | 2,077 | 1,987 | 1,880 | |||||||
| 4.26 | Revenue received in advance | 433 | 438 | 462 | |||||||
| 4.27 | Total non-current liabilities | 15,301 | 15,883 | 14,541 | |||||||
| 4.28 | Total liabilities | 21,578 | 24,112 | 23,809 | |||||||
| 4.29 | Net assets | 15,235 | 14,106 | 14,527 | |||||||
| Consolidated statement of financial position continued | |||||||||||
| At end of current period $A millions | As shown in last annual report $A millions | As in last half yearly report $A millions | |||||||||
| Equity | |||||||||||
| 4.30 | Capital/contributed equity | 6,433 | 6,433 | 6,433 | |||||||
| 4.31 | Reserves | 7 | 14 | 56 | |||||||
| 4.32 | Retained profits (accumulated losses) | 8,846 | 7,661 | 7,507 | |||||||
| 4.33 | Equity attributable to members of the parent entity | 15,286 | 14,108 | 13,996 | |||||||
| 4.34 | Outside equity interests in controlled entities | (51) | (2) | 531 | |||||||
| 4.35 | Total equity | 15,235 | 14,106 | 14,527 | |||||||
| 4.36 | Preference capital included as part of 4.33 | - | - | - | |||||||
| Notes to the condensed consolidated statement of financial position | |||||||||||
| Exploration and evaluation expenditure capitalised | |||||||||||
| (To be completed only by entities with mining interests if amounts are material. Include all expenditure incurred.) | |||||||||||
| Current period $A millions | Previous corresponding period $A millions | ||||||||||
| 5.1 | Opening balance | Not applicable | Not applicable | ||||||||
| 5.2 | Expenditure incurred during current period | ||||||||||
| 5.3 | Expenditure written off during current period | ||||||||||
| 5.4 | Acquisitions, disposals, revaluation increments, etc. | ||||||||||
| 5.5 | Expenditure transferred to Development Properties | ||||||||||
| 5.6 | Closing balance as shown in the consolidated balance sheet (item 4.11) | Not applicable | Not applicable | ||||||||
| Development properties | |||||||||||
| (To be completed only by entities with mining interests if amounts are material) | |||||||||||
| Current period $A millions | Previous corresponding period $A millions | ||||||||||
| 6.1 | Opening balance | Not applicable | Not applicable | ||||||||
| 6.2 | Expenditure incurred during current period | ||||||||||
| 6.3 | Expenditure transferred from exploration and evaluation | ||||||||||
| 6.4 | Expenditure written off during current period | ||||||||||
| 6.5 | Acquisitions, disposals, revaluation increments, etc. | ||||||||||
| 6.6 | Expenditure transferred to mine properties | ||||||||||
| 6.7 | Closing balance as shown in the consolidated balance sheet (item 4.12) | Not applicable | Not applicable | ||||||||
| Condensed consolidated statement of cash flows | |||||||||||
| Current period $A millions | Previous corresponding period $A millions | ||||||||||
| Cash flows related to operating activities | |||||||||||
| 7.1 | Receipts from customers (inclusive of GST) | 11,356 | 11,003 | ||||||||
| 7.2 | Payments to suppliers and employees (inclusive of GST) | -6,513 | -6,356 | ||||||||
| 7.3 | Dividends received from associates | - | 4 | ||||||||
| 7.4 | Other dividends received | 1 | - | ||||||||
| 7.5 | Interest and other items of similar nature received | 27 | 37 | ||||||||
| 7.6 | Interest and other costs of finance paid | -529 | -476 | ||||||||
| 7.7 | Income taxes paid | -839 | -893 | ||||||||
| 7.8 | GST remitted to the Australian Taxation Office (ATO) (net) | -552 | (463) | ||||||||
| 7.9 | Net operating cash flows | 2,951 | 2,856 | ||||||||
| Cash flows related to investing activities | |||||||||||
| 7.10 | Payment for purchases of property, plant and equipment | -1,231 | -1,391 | ||||||||
| 7.11 | Proceeds from sale of property, plant and equipment | 692 | 76 | ||||||||
| 7.12 | Payment for purchases of equity investments | -15 | -53 | ||||||||
| 7.13 | Proceeds from sale of equity investments | 3 | - | ||||||||
| 7.14 | Loans to other entities | - | - | ||||||||
| 7.15 | Loans repaid by other entities | - | - | ||||||||
| 7.16 (a) | Payment for patents, trademarks and licences | (2) | - | ||||||||
| 7.16 (b) | Payment for capitalised software | -297 | -269 | ||||||||
| 7.16 (c) | Proceeds from sale of business | 4< | 29 | ||||||||
| 7.16 (d) | Proceeds from sale of listed securities and share in other corporations | 7 | 174 | ||||||||
| 7.16 (e) | Payment for deferred expenditure | - | (2) | ||||||||
| 7.16 (f) | Other (provide details if material) | 4 | (47) | ||||||||
| 7.17 | Net investing cash flows | -835 | -1,483 | ||||||||
| Cash flows related to financing activities | |||||||||||
| 7.18 | Proceeds from issues of securities (shares, options, etc) | - | - | ||||||||
| 7.19 | Proceeds from borrowings | 4,302 | 9,204 | ||||||||
| 7.20 | Repayment of borrowings | -4,710 | -9,631 | ||||||||
| 7.21 | Dividends paid | -1,415 | -1,415 | ||||||||
| 7.22 (b) | Other (provide details if material) | 5 | 13 | ||||||||
| 7.23 | Net financing cash flows | -1,818 | -1,829 | ||||||||
| 7.24 | Net increase (decrease) in cash held | 298 | -456 | ||||||||
| 7.25 | Cash at beginning of period (see Reconciliation of cash) | 1,070 | 1,067 | ||||||||
| 7.26 | Exchange rate adjustments to item 7.25. | -3 | - | ||||||||
| 7.27 | Cash at end of period (see Reconciliation of cash) | 1,365 | 611 | ||||||||
| Non-cash financing and investing activities | |||||||||||
| Details of financing and investing transactions which have had a material effect on consolidated assets and liabilities but did not involve cash flows are as follows. If an amount is quantified, show comparative amount. | |||||||||||
| Refer to Attachment 2 for details of non cash financing and investing activities. | |||||||||||
| Reconciliation of cash | |||||||||||
| Reconciliation of cash at the end of the period (as shown in the consolidated statement of cash flows) to the related items in the accounts is as follows. | Current period $A millions | Previous corresponding period $A millions | |||||||||
| 8.1 | Cash on hand and at bank | 135 | 219 | ||||||||
| 8.2 | Deposits at call | 1,230 | 433 | ||||||||
| 8.3 | Bank overdraft | - | (41) | ||||||||
| 8.4 | Other (provide details) | - | - | ||||||||
| 8.5 | Total cash at end of period (item 7.27) | 1,365 | 611 | ||||||||
| Other notes to the condensed financial statements | |||||||||||
| Ratios | Current period | Previous corresponding period | |||||||||
| % | % | ||||||||||
| Profit before tax / revenue | |||||||||||
| 9.1 | Consolidated profit (loss) from ordinary activities before tax (item 1.5) as a percentage of revenue (item 1.1) | 18.6% | 29.1% | ||||||||
| Profit after tax / equity interests | |||||||||||
| 9.2 | Consolidated net profit (loss) from ordinary activities after tax attributable to members (item 1.11) as a percentage of equity (similarly attributable) at the end of the period (item 4.33) | 7.7% | 15.0% | ||||||||
| Earnings per share (EPS) | |||||||||||
| 10 | Details of basic and diluted EPS reported separately in accordance with paragraph 9 and 18 of AASB 1027: | ||||||||||
| Earnings Per Share are as follows. | |||||||||||
| Current period (cents) | Previous corresponding period (cents) | ||||||||||
| Calculation of the following in accordance with AASB 1027: | |||||||||||
| Earnings per Share | |||||||||||
| (a) Basic EPS (in cents) | 9.2 | 16.3 | |||||||||
| (b) Diluted EPS (if materially different from (a)) (in cents) | |||||||||||
| (c) Weighted average number of ordinary shares outstanding | 12,866,600,200 | 12,866,600,200 | |||||||||
| during the period used in the calculation of the Basic EPS | |||||||||||
| NTA backing (See note 7) | Current period (cents) | Previous corresponding period (cents) | |||||||||
| 11.1 | Net tangible asset backing per ordinary security (in cents) | 108.8 | 98.8 | ||||||||
| Discontinuing Operations | |||||||||||
| (Entities must report a description of any significant activities or events relating to discontinuing operations in | |||||||||||
| accordance with paragraph 7.5 (g) of AASB 1029: Interim Financial Reporting, or, the details of discontinuing | |||||||||||
| operations they have disclosed in their accounts in accordance with AASB 1042: Discontinuing Operations | |||||||||||
| (see note 17).) | |||||||||||
| 12.1 | Discontinuing Operations | ||||||||||
| Not applicable. | |||||||||||
| Control gained over entities having material effect | |||||||||||
| 13.1 | Name of entity (or group of entities) | Not applicable | |||||||||
| 13.2 | Consolidated profit (loss) from ordinary activities and extraordinary items after tax of the entity (or group of entities) since the date in the current period on which control was acquired | Not applicable | |||||||||
| 13.3 | Date from which such profit has been calculated | Not applicable | |||||||||
| 13.4 | Profit (loss) from ordinary activities and extraordinary items after tax of the entity (or group of entities) for the whole of the previous corresponding period | Not applicable | |||||||||
| Loss of control of entities having material effect | |||||||||||
| 14.1 | Name of entity (or group of entities) | Not applicable | |||||||||
| 14.2 | Consolidated profit (loss) from ordinary activities and extraordinary items after tax of the entity (or group of entities) for the current period to the date of loss of control | Not applicable | |||||||||
| 14.3 | Date to which the profit (loss) in item 14.2 has been calculated | Not applicable | |||||||||
| 14.4 | Consolidated profit (loss) from ordinary activities and extraordinary items after tax of the entity (or group of entities) while controlled during the whole of the previous corresponding period | Not applicable | |||||||||
| 14.5 | Contribution to consolidated profit (loss) from ordinary activities and extraordinary items from sale of interest leading to loss of control | Not applicable | |||||||||
| Dividends (in the case of a trust, distributions) | |||||||||||
| 15.1 | Date the dividend (distribution) is payable | 30 April 2003 | |||||||||
| 15.2 | Record date to determine entitlements to the dividend (distribution) (ie, on the basis of registrable transfers received by 5.00 pm if securities are not CHESS approved, or security holding balances established by 5:00pm or such later time permitted by SCH Business Rules if securities are CHESS approved) | 21 March 2003 | |||||||||
| 15.3 | If it is a final dividend, has it been declared? (Preliminary final report only) | Not applicable | |||||||||
| Amount per security | |||||||||||
| Amount per security | Franked amount per security at 30% tax (2001: 34% tax) | Amount per security of foreign source dividend | |||||||||
| (cents) | (cents) | (cents) | |||||||||
| 15.4 | (Preliminary final report only) Final dividend: | Current year | 11.0 | 11.0 | Not applicable | ||||||
| 15.5 | Previous year | 11.0 | 11.0 | Not applicable | |||||||
| 15.4 | (Preliminary final report only) Final dividend: | Current year | Not applicable | Not applicable | Not applicable | ||||||
| 15.5 | Previous year | Not applicable | Not applicable | Not applicable | |||||||
| 15.6 | (Half yearly and preliminary final reports) Interim dividend: | Current year | 12.0 | 12.0 | Not applicable | ||||||
| 15.7 | Previous year | 11.0 | 11.0 | Not applicable | |||||||
| 15.7 (a) | Special dividend: | Current year | 3.0 | 3.0 | Not applicable | ||||||
| 15.7 (b) | Previous year | - | - | Not applicable | |||||||
| In previous financial years, our accounting policy has been to provide for dividends in the statement of financial position when that dividend was declared after the reporting date but before the completion of the financial report. Due to the first time application of accounting standard AASB 1044: "Provisions, Contingent Liabilities and Contingent Assets", a provision can no longer be raised at balance date if the dividend is declared after that date. As a result, we have changed our accounting policy to reflect this position and we now provide for the dividend in the period which it is declared. We will now disclose the declaration of a dividend after the reporting date as an event occurring after balance date. | |||||||||||
| Total dividend (distribution) per security (interim plus final) | |||||||||||
| (Preliminary final report only) | |||||||||||
| Current year | Previous year | ||||||||||
| (cents) | (cents) | ||||||||||
| 15.8 | Ordinary securities | Not applicable | Not applicable | ||||||||
| 15.9 | Preference securities | Not applicable | Not applicable | ||||||||
| Half-yearly report - interim dividend (distribution) on all securities | |||||||||||
| Current period | Previous corresponding period | ||||||||||
| $A millions | $A millions | ||||||||||
| 15.10 | Ordinary securities (each class separately) | 1,930 | 1,415 | ||||||||
| 15.11 | Preference securities (each class separately) | - | - | ||||||||
| 15.12 | Other equity instruments (each class separately) | - | - | ||||||||
| 15.13 | Total | 1,930 | 1,415 | ||||||||
| The dividend or distribution plans shown below are in operation. | |||||||||||
| Not applicable | |||||||||||
| The last date(s) for receipt of election notices for the dividend or distribution plans | Not applicable | ||||||||||
| Any other disclosures in relation to dividends (distributions) | |||||||||||
| Not applicable | |||||||||||
| Details of aggregate share of profits (losses) of joint venture entities | |||||||||||
| Current period | Previous corresponding period | ||||||||||
| Telstra's share of joint venture entities: | $A millions | $A millions | |||||||||
| 16.1A | Profit (loss) from ordinary activities before income tax | 47 | (88) | ||||||||
| 16.2A | Income tax on ordinary activities | (14) | (1) | ||||||||
| 16.3A | Profit (loss) from ordinary activities after income tax | 33 | (89) | ||||||||
| 16.4A | Extraordinary items net of tax | - | - | ||||||||
| 16.5A | Net profit (loss) | 33 | (89) | ||||||||
| 16.6A | Adjustments (i) | (1,003) | - | ||||||||
| 16.7A | Share of net profit (loss) of joint ventures | (970) | (89) | ||||||||
| Details of aggregate share of profits (losses) of associates | |||||||||||
| Current period | Previous corresponding period | ||||||||||
| Telstra's share of associated entities: | $A millions | $A millions | |||||||||
| 16.1B | Profit (loss) from ordinary activities before income tax | 6 | (4) | ||||||||
| 16.2B | Income tax on ordinary activities | (5) | - | ||||||||
| 16.3B | Profit (loss) from ordinary activities after income tax | 1 | (4) | ||||||||
| 16.4B | Extraordinary items net of tax | - | - | ||||||||
| 16.5B | Net profit (loss) | 1 | (4) | ||||||||
| 16.6B | Adjustments | - | - | ||||||||
| 16.7B | Share of net profit (loss) of associates | 1 | (4) | ||||||||
| Current period | Previous corresponding period | ||||||||||
| $A millions | $A millions | ||||||||||
| (i) | Adjustments comprise: | ||||||||||
| - Write off of investment in Reach Limited | (965) | - | |||||||||
| - Other | (38) | - | |||||||||
| (1,003) | - | ||||||||||
| Material interests in entities which are not controlled entities | |||||||||||
| The economic entity has an interest (that is material to it) in the following entities. If the interest was acquired or disposed of during either the current or previous corresponding period, indicate date of acquisition ("from xx/xx/xx") or disposal ("to xx/xx/xx"). | |||||||||||
| Name of entity | Percentage of ownership interest held at end of period or date of disposal | Contribution to net profit (loss) (item 1.9) | |||||||||
| 17.1A | Equity accounted joint venture entities | Current period | Previous corresponding period | Current period | Previous corresponding period | ||||||
| % | % | $A millions | $A millions | ||||||||
| TelstraClear Limited (from 12 December 2001) | 58.4 | 58.4 | - | (75) | |||||||
| Xantic B.V. | 35.0 | 35.0 | (2) | - | |||||||
| FOXTEL Partnerships | 50.0 | 50.0 | (23) | (24) | |||||||
| Customer Services Pty Ltd | 50.0 | 50.0 | - | - | |||||||
| FOXTEL Management Pty Ltd | 50.0 | 50.0 | - | - | |||||||
| FOXTEL Cable Television Pty Ltd | 80.0 | 80.0 | - | - | |||||||
| Stellar Call Centres Pty Ltd | 50.0 | 50.0 | 1 | 2 | |||||||
| Investment 2000 Pty Ltd | 25.0 | 25.0 | - | - | |||||||
| Harmony Telecommunications Pte Ltd (to 1 April 2001) | - | - | - | - | |||||||
| Reach Limited | 50.0 | 50.0 | (946) | 20 | |||||||
| Dynegy Connect L.P. (to 20 August 2001) | - | - | - | (12) | |||||||
| DataOne Corporation Pte Ltd (to 29 November 2002) | - | 20.0 | - | - | |||||||
| TNAS Limited | 50.0 | 50.0 | - | - | |||||||
| IDC Limited (to 27 December 2002) | - | 50.0 | - | - | |||||||
| 17.1A | Total | (970) | (89) | ||||||||
| Name of entity | Percentage of ownership interest held at end of period or date of disposal | Contribution to net profit (loss) (item 1.9) | |||||||||
| 17.1B | Equity accounted associated entities | Current period | Previous corresponding period | Current period | Previous corresponding period | ||||||
| % | % | $A millions | $A millions | ||||||||
| IBM Global Services Australia Limited | 22.6 | 22.6 | 5 | 4 | |||||||
| Australian - Japan Cable Limited | 39.9 | 39.9 | 2 | (3) | |||||||
| Solution 6 Holdings Limited | 13.2 | 19.1 | (2) | (2) | |||||||
| Ecard Pty Ltd | 50.0 | 41.0 | (6) | (3) | |||||||
| PT Mitra Global Telekomunikasi Indonesia | 20.4 | 20.4 | 2 | - | |||||||
| Telstra Super Pty Ltd | 100.0 | 100.0 | - | - | |||||||
| Myinternet Limited (formerly myinternet.com.au Pty Ltd) | 21.1 | 21.1 | - | - | |||||||
| Keycorp Limited (from 28 June 2002) | 47.9 | 47.9 | - | - | |||||||
| CityLink Limited (from 12 December 2001) | 27.1 | 27.1 | - | - | |||||||
| Telstra Foundation Limited (from 13 March 2002) | 100.0 | - | - | - | |||||||
| 17.1B | Total | 1 | (4) | ||||||||
| 17.2 | Total | (969) | (93) | ||||||||
| 17.3 | Other material interests | - | - | - | - | ||||||
| 17.4 | Total | (969) | (93) | ||||||||
| Issued and quoted securities at end of current period | |||||||||||
| Description includes rate of interest and any redemption or conversion rights together with prices and dates. | |||||||||||
| Category of securities | Total Number | Number quoted | Issue price per security (see note 15) | Amount paid-up per security (see note 15) | |||||||
| (cents) | (cents) | ||||||||||
| 18.1 | Preference securities | Nil | Nil | Nil | Nil | ||||||
| 18.2 | Changes during current period (a) Increases through issues (b) Decreases through returns of capital, buybacks, redemptions | Nil | Nil | Nil | Nil | ||||||
| 18.3 | Ordinary securities | 12,866,600,200 | 6,420,604,706 | 50 | 50 | ||||||
| 18.4 | Changes during current period | ||||||||||
| Opening Balance - 30 June 2001 | 12,866,600,200 | 6,420,604,706 | |||||||||
| (a) Increases through issues | Nil | Nil | Nil | Nil | |||||||
| (b) Decreases through returns of capital, buybacks | Nil | Nil | Nil | Nil | |||||||
| Closing Balance - 30 June 2002 | 12,866,600,200 | 6,420,604,706 | |||||||||
| 18.5 | Convertible debt securities (description and conversion factor) | Nil | Nil | Nil | Nil | ||||||
| 18.6 | Changes during current period | Nil | Nil | Nil | Nil | ||||||
| (a) Increases through issues | Nil | Nil | Nil | Nil | |||||||
| (b) Decreases through securities - matured, converted | Nil | Nil | Nil | Nil | |||||||
| 18.7 | Options (description and conversion factor) | Exercise price | Expiry date (if any) | ||||||||
| Nil | Nil | Nil | Nil | ||||||||
| 18.8 | Issued during current period | Nil | Nil | Nil | Nil | ||||||
| 18.9 | Exercised during current period | Nil | Nil | Nil | Nil | ||||||
| 18.10 | Expired during current period | Nil | Nil | Nil | Nil | ||||||
| 18.11 | Debentures (totals only) | Nil | Nil | ||||||||
| 18.12 | Unsecured notes (totals only) | 2,613,517,389 | 2,336,108,834 | ||||||||
| Segment Reporting | |||||||||||
| (Information on the business and geographical segments of the entity must be reported for the current period in accordance with AASB 1005: Segment Reporting and for half year reports, AASB 1029: Interim Financial Reporting. Because entities employ different structures a pro forma cannot be provided. Segment information in the layout employed in the entity's accounts should be reported separately and attached to this report). | |||||||||||
| Refer to Attachment 3 for segment information | |||||||||||
| Comments by directors | |||||||||||
| Comments on the following matters are required by ASX or, in relation to the half yearly report, by AASB 1029: Half-Year Accounts and Consolidated Accounts. The comments do not take the place of the directors' report and statement (as required by the Corporations Law) and may be incorporated into the directors' report and statement. For both half yearly and preliminary final reports, if there are no comments in a section, state NIL. If there is insufficient space to comment, attach notes to this report. | |||||||||||
| Basis of financial report preparation | |||||||||||
| If this report is a half yearly report, it is a general purpose financial report prepared in accordance with the listing rules and AASB 1029: Half-Year Accounts and Consolidated Accounts. It should be read in conjunction with the last annual report and any announcements to the market made by the entity during that period. | |||||||||||
| Material factors affecting the revenues and expenses of the economic entity for the current period. In a half yearly report, provide explanatory comments about any seasonal or irregular factors affecting operations. | |||||||||||
| Refer Attachment 4 for specific items | |||||||||||
| A description of each event since the end of the current period which has had a material effect and which is not already reported elsewhere in this Appendix or in attachments, with the financial effect quantified (if possible). | |||||||||||
| Refer to Attachment 5 for details of events after balance date | |||||||||||
| Franking credits available and prospects for paying fully or partly franked dividends for at least the next year | |||||||||||
| With the introduction of the Simplified Imputation System that became operative from 1 July 2002, the Telstra Entity's and Telstra Group's franking surpluses as at the year ended 30 June 2002 have been converted into franking credits that reflect a tax paid basis rather than an after-tax distributable profits basis. The amount of franking credits represent the imputation tax credits that are available for distribution. At 31 December 2002, the Telstra Entity had $648 million of franking credits. The Telstra Group had $719 million of franking credits. Additional franking credits will arise when the Telstra Entity and its Australian controlled entities pay tax instalments during the fiscal 2003 year relating to the 2003 income tax year as well as the deferral instalments relating to the 2000 income tax year. The 31 December 2002 interim dividend is scheduled to be paid on 30 April 2003 and will be fully franked at an income tax rate of 30% reflecting the current company tax rate. At present, it is expected that income tax payments in the future will be sufficient to enable Telstra to fully frank declared ordinary dividends out of fiscal 2003 earnings. However, the directors can give no assurance as to the future level of dividends, if any, or of franking of dividends. This is because it depends upon, among other factors, our earnings, Government legislation and announcements, and our tax position. | |||||||||||
| Unless disclosed below, the accounting policies, estimation methods and measurement bases used in this report are the same as those used in the last annual report. Any changes in accounting policies, estimation methods and measurement bases since the last annual report are disclosed as follows. | |||||||||||
| (Disclose changes in the half yearly report in accordance with AASB 1029: Half-Year Accounts and Consolidated Accounts. Disclose changes in the preliminary final report in accordance with AASB 1001: Accounting Policies-Disclosure.) | |||||||||||
| Refer to Attachment 1 for accounting policy changes | |||||||||||
| Revisions of estimates of amounts reported in the previous interim periods. For half yearly reports the nature and amount of the revisions in estimates of amounts reported in previous annual reports if those revisions have a material effect in this half year. | |||||||||||
| Not applicable | |||||||||||
| Changes in contingent liabilities or assets. For half yearly reports, changes in contingent liabilities and contingent assets since the last annual report. | |||||||||||
| Refer to Attachment 6 for details of contingent liabilities and assets. | |||||||||||
| Additional disclosure for trusts | |||||||||||
| 20.1 | Number of units held by the management company or responsible entity or their related parties. | Not applicable | |||||||||
| 20.2 | A statement of the fees and commissions payable to the management company or responsible entity. | Not applicable | |||||||||
| Identify: | |||||||||||
| l | initial service charges | Not applicable | |||||||||
| l | management fees | ||||||||||
| l | other fees | ||||||||||
| Annual meeting | |||||||||||
| (Preliminary final report only) | |||||||||||
| The annual meeting will be held as follows: | |||||||||||
| Place | (Principal location) | Not applicable | |||||||||
| Date | Not applicable | ||||||||||
| Time | Not applicable | ||||||||||
| Approximate date the annual report will be available | Not applicable | ||||||||||
| Compliance statement | |||||||
| Half yearly report | |||||||
| 1 | This report has been prepared in accordance with AASB Standards, other AASB authoritative pronouncements and Urgent Issues Group Consensus Views or other standards acceptable to ASX (see note 12) | ||||||
| Identify other standards used | Not applicable | ||||||
| 2 | This report, and the accounts upon which the report is based (if separate), use the same accounting policies. | ||||||
| 3 | This report does give a true and fair view of the matters disclosed (see note 2). | ||||||
| 4 | This report is based on accounts to which one of the following applies. | ||||||
| The accounts have been audited. | The accounts have been subject to review. | X | |||||
| The accounts are in the process of being audited or subject to review. | The accounts have not yet been audited or reviewed. | ||||||
| 5 | If the audit report or review by the auditor is not attached, details of any qualifications are attached. | ||||||
| 6 | The entity has a formally constituted audit committee. | ||||||
| Sign here: | s/ Douglas Gration | Date: 27 February 2003 | |||||
| (Company secretary) | |||||||
| Print name: | Douglas Gration | ||||||
Attachment 1
Summary of accounting policies
In this financial report, we, us, our, Telstra and the Telstra Group - all mean Telstra Corporation Limited, an Australian corporation and its controlled entities as a whole. Telstra Entity is the legal entity, Telstra Corporation Limited.
Our half-year financial report is a general purpose financial report and is to be read in conjunction with our Annual Financial Report as at 30 June 2002. This should also be read together with any public announcements made by us in accordance with the continuous disclosure obligations arising under Australian Stock Exchange listing rules and the Corporations Act 2001, up to the date of the Directors' Declaration.
1.1. Basis of preparation of the financial report
The half-year financial report has been prepared in accordance with the requirements of the Australian Corporations Act 2001, Accounting Standards applicable in Australia including AASB 1029: "Interim Financial Reporting", other authoritative pronouncements of the Australian Accounting Standards Board, and Urgent Issues Group Consensus Views.
Our half-year financial report does not include all notes of the type normally included in the Annual Financial Report. Therefore, it cannot be expected to provide as full an understanding of the financial performance, financial position and financing and investing activities of the Telstra Group as a full financial report.
This half-year financial report is prepared in accordance with historical cost, except for some categories of investments which are equity accounted.
For the purpose of preparing the half-year financial report, the half-year has been treated as a discrete reporting period.
1.2. Changes in accounting policy
The accounting policies adopted are consistent with those applied in the financial year ended 30 June 2002, apart from:
(a) In previous financial years, our accounting policy has been to provide for dividends in the statement of financial position when that dividend was declared after reporting date but before the completion of the financial report. Due to the first time application of accounting standard AASB 1044: "Provisions, Contingent Liabilities and Contingent Assets", a provision can no longer be raised at balance date if the dividend is declared after that date. As a result, we have changed our accounting policy to reflect this position and we now provide for the dividend in the period in which it is declared. When the declaration date is after balance date but before completion of the financial report, we disclose the dividend as an event occurring after balance date.
The transitional provisions of this standard require a write back of the provision raised as at 30 June 2002 to opening retained profits in the current financial year. This adjustment amounted to $1,415 million.
No adjustment has been made to the prior year statement of financial performance, statement of financial position or cash flows.
(b) In accordance with AASB 1012: "Foreign Currency Translation" we revalue the principal of our cross currency swaps to take into account movements in foreign currency. As these cross currency swaps are designated as hedges, we had previously included the swap balances with the underlying borrowings in the statement of financial position.
To enhance disclosure of our financial instruments, we have now separated these foreign currency swaps and recorded them as separate financial assets and liabilities. This reflects the fact that the swap contracts, although specifically hedging our borrowings, are made with different counterparties and as such are separate financial assets and liabilities in their own right.
On a similar basis, we have reviewed the treatment of our interest rate swaps to ensure that interest receivable and payable are set off only where our dealings are with the same couterparty and we have a legally recognised right to do so. Adjustments required for our interest rate swaps have not had a significant effect on our statement of financial position.
To appropriately assess our price risk from foreign currency borrowings, hedge receivables and hedge payables arising from cross currency swaps and accruals arising from interest rate swaps should continue to be viewed in the context of movements in the underlying borrowings being hedged.
This change in accounting policy has no impact on our statement of financial performance or our net assets in the statement of financial position, however we have changed comparative figures to reflect the disclosure in the current half-year. For further details on movements in our half-year statement of financial position resulting from the change in cross currency swap treatment, refer to attachment 4.
(c) Revised accounting standard AASB 1028: "Accounting for Employee Entitlements" became applicable from 1 July 2002. The main changes surrounding this standard were specific recognition criteria for wages and salaries (including non-monetary benefits), compensated absences, profit sharing and bonus plans, termination benefits and some post employment benefits. We have assessed the changes in this accounting standard that are applicable for our half-year reporting and there has been no significant impact on our statement of financial performance or statement of financial position. As a result, there has been no adjustment required to opening retained earnings.
Attachment 2
Financing and investing activities that involve components of non cash
Property, plant and equipment
Our property, plant and equipment includes capitalised borrowing costs of $38 million for the half-year ended 31 December 2002 (2001: $38 million). This amount has been reclassified into cash flows from operating activities.
Software assets (internal use software assets)
Our software assets developed for internal use include capitalised borrowing costs of $14 million for the half-year ended 31 December 2002 (2001: $16 million). This amount has been reclassified into cash flows from operating activities.
Acquisitions and disposals
There were no significant acquisitions or disposals of investments during the half-year ending 31 December 2002. We did however dispose of our Sri Lankan controlled entity, Mobitel (Pvt) Limited during October 2002, however this disposal did not have a significant effect on our statement of financial position or statement of financial performance.
In the half-year ended 31 December 2001, we increased our holding in our joint venture entity TelstraClear Limited (TelstraClear) by 8.43%. As a result, our 58.43% interest represented a controlling interest in this company. We consequently ceased equity accounting and consolidated the financial position, financial performance and cash flows of the TelstraClear Group from 1 December 2001.
Consideration for this acquisition was A$40 million (NZD$50 million) for which we received an additional 52,500,000 shares in TelstraClear.
The amount of cash, other assets and liabilities we acquired as a result of obtaining this increased interest are presented in the following table.
| Acquisition of TelstraClear | |||
| Half-year ended 31 December | 2001 | A$m | |
| Consideration for acquisition | |||
| Cash | 40 | ||
| Fair value of assets and liabilities acquired by major class | |||
| Net overdraft held by TelstraClear on gaining control | (5) | ||
| Receivables | 64 | ||
| Inventories | 18 | ||
| Property, plant and equipment | 794 | ||
| Identifiable intangible assets | 238 | ||
| Other assets | 6 | ||
| Payables | (55) | ||
| Borrowings | (406) | ||
| Amounts owed to Telstra Corporation Ltd (a) | (367) | ||
| Provisions | (97) | ||
| Finance lease liability | (6) | ||
| Other liabilities | (72) | ||
| Fair value of net assets on gaining control | 112 | ||
| Outside equity interest (41.57%) | (47) | ||
| Original 50% interest in fair value of net assets prior to obtaining increased shareholding | (56) | ||
| Net assets acquired | 9 | ||
| Goodwill on acquisition | 31 | ||
| 40 | |||
| Outflow of cash on acquisition | |||
| Consideration for acquisition | (40) | ||
| Net overdraft held by TelstraClear on gaining control | (5) | ||
| (45) | |||
(a) For the half-year ended 31 December 2001 our repayment of borrowings in the statement of cash flows included a $367 million loan provided to TelstraClear. This funding was used to facilitate the purchase of the Clear Communications Limited group.
There were no significant disposals of entities in the half-year ended 31 December 2001.
Attachment 3
Segment information
We report our segment information on the basis of business segments as our risks and returns are affected predominantly by differences in the products and services we provide through those segments.
Business segments
Our business structure was adjusted throughout the half-year ended 31 December 2002. The Infrastructure Services group has been divided to form the Telstra Technology group and the Infrastructure Services group. The former has been incorporated into the "Other" segment. We have restated our comparative information at balance date as if the new business segments existed in prior years.
Telstra Retail
Telstra Retail's primary activities are sales and billing. This covers residential, business and government customers who receive our services, other than wholesale services (which are provided by Telstra Wholesale), mobile services (which are provided by Telstra Mobile), and those customers included in Telstra Country Wide. This business unit:
- manages our information, connection and payphone services as well as our print and online directories business;
- sells and provides customer services for a comprehensive range of products, services and customer-driven solutions ranging from basic telephony services to complex voice and data networks; and
- manages our interests in our North American, Japanese and European retail operations.
Telstra Country Wide is responsible for:
- addressing the telecommunication needs of consumer and business customers that reside and operate outside the mainland state capital cities and in Tasmania and the Northern Territory; and
- the specific needs of these customers which are not as readily addressed as for customers in metropolitan areas.
Telstra Mobile is responsible for:
- our mobile and wireless networks and associated systems within Australia; and
- all mobile retail sales and after sales support, customer service, product development and pricing.
Telstra International manages our interests in:
- the Asia-Pacific region, including our operations in Hong Kong, Vietnam, India, China, New Zealand, and Sri Lanka.
Infrastructure Services responsibilities include:
- management and delivery of telecommunications infrastructure and related services;
- operational service and delivery of the entire fixed and mobile networks, along with online products and platforms; and
- Network, Design and Construction's capability for end-to-end project management, planning, design, construction, integration, operations and maintenance of communications networks and systems for Telstra and other telecommunications companies.
Telstra Wholesale is responsible for:
- the provision of domestic wholesale products and services to other carriers and carriage service providers.
Telstra Technology is responsible for:
- the overall planning, design, and construction management of our domestic fixed communication networks and associated systems to deliver technology solutions to support our products, services and customer support.
Corporate Centre is responsible for:
- Legal and Regulatory - provides legal services and has responsibility for regulatory positioning and negotiation;
- Corporate Relations - responsible for managing our relationships and positioning with key groups such as our customers, the media, governments, industry, community groups and staff;
- Human Resources - responsibilities include recruitment, learning and development, and human resources management; and
- Finance and Administration - encompasses the functions of finance, treasury, productivity, risk management and assurance, acquisitions, investments and strategic development, investor relations, corporate services, and the office of the Telstra Chief Information Officer. It also includes the financial management of the majority of the Telstra Entity fixed assets (including network assets) through the Asset Accounting Group. Telstra Technology manages the annual capital expenditure of these assets on behalf of our other business segments.
Telstra Country Wide and Telstra Retail have been combined as a single reportable business segment for reconciliation and disclosure purposes as they are considered substantially similar. The Corporate Centre and Telstra Technology groups are not reportable segments and have been aggregated in the "Other" segment.
Since 31 December 2002, there have been further adjustments to our business structure. The three groups of Telstra Retail, Telstra Mobile and Telstra Country Wide have been restructured. From this restructure the scope of Telstra Country Wide has been increased and two new groups have emerged, being Telstra Consumer and Marketing and Telstra Business and Government. These changes will be reflected in our 30 June 2003 financial report.
The following tables detail the major segments, based on the reporting structure as at 31 December 2002.
| Half-year ended 31 December 2002 | ||||||||
|---|---|---|---|---|---|---|---|---|
| Business Units | Telstra Retail | Telstra Mobile | Telstra International | Infrastructure Services | Telstra Wholesale | Other | Eliminations | Total of segments |
| $m | $m | $m | $m | $m | $m | $m | $m | |
| Sales revenue from external customers | 6,527 | 1,827 | 768 | 144 | 1,174 | 28 | - | 10,468 |
| Other revenue from external customers (before interest) | 56 | 1 | 52 | 7 | - | 783 | - | 899 |
| Total revenue from external customers (before interest) | 6,583 | 1,828 | 820 | 151 | 1,174 | 811 | - | 11,367 |
| Less revenues from sale of investments and dividends | 3 | - | 29 | - | - | - | - | 32 |
| Segment revenue from external customers | 6,580 | 1,828 | 791 | 151 | 1,174 | 811 | - | 11,335 |
| Add inter-segment revenue (a) | 198 | 1 | 13 | 1,032 | 527 | 681 | (2,452) | - |
| Segment revenue | 6,778 | 1,829 | 804 | 1,183 | 1,701 | 1,492 | (2,452) | 11,335 |
| Segment result | 3,975 | 794 | (23) | 12 | 1,086 | (370) | (1,972) | 3,502 |
| Less share of equity accounted net losses | 25 | - | 944 | - | - | - | - | 969 |
| Less net book value of investments sold | (6) | - | 21 | - | - | - | - | 15 |
| Add revenues from sale of investments and dividends | 3 | - | 29 | - | - | - | - | 32 |
| Earnings before interest and income tax expense (EBIT) | 3,959 | 794 | (959) | 12 | 1,086 | (370) | (1,972) | 2,550 |
| Half-year ended 31 December 2001 | ||||||||
|---|---|---|---|---|---|---|---|---|
| Business Units | Telstra Retail | Telstra Mobile | Telstra International | Infrastructure Services | Telstra Wholesale | Other | Eliminations | Total of segments |
| $m | $m | $m | $m | $m | $m | $m | $m | |
| Sales revenue from external customers | 6,472 | 1,767 | 688 | 97 | 1,210 | 32 | - | 10,266 |
| Other revenue from external customers (before interest) | 124 | 5 | 18 | 8 | 4 | 120 | - | 279 |
| Total revenue from external customers (before interest) | 6,596 | 1,772 | 706 | 105 | 1,214 | 152 | - | 10,545 |
| Less revenues from sale of investments and dividends | 39 | - | 10 | - | - | - | - | 49 |
| Segment revenue from external customers | 6,557 | 1,772 | 696 | 105 | 1,214 | 152 | - | 10,496 |
| Add inter-segment revenue (a) | 242 | 2 | 1 | 1,150 | 510 | 684 | (2,589) | - |
| Segment revenue | 6,799 | 1,774 | 697 | 1,255 | 1,724 | 836 | (2,589) | 10,496 |
| Segment result | 3,767 | 720 | 27 | (50) | 1,120 | (2,017) | (60) | 3,507 |
| Less share of equity accounted net losses | 24 | - | 69 | - | - | - | - | 93 |
| Less net book value of investments sold | 11 | - | 9 | - | - | - | - | 20 |
| Add revenues from sale of investments and dividends | 39 | - | 10 | - | - | - | - | 49 |
| Earnings before interest and income tax expense (EBIT) | 3,771 | 720 | (41) | (50) | 1,120 | (2,017) | (60) | 3,443 |
(a) Generally most internal charges between business segments are made on a direct cost recovery basis. All internal telecommunications usage is accounted for at market value. We account for all international transactions between Australian and non-Australian businesses at market value.
| Half-year ended 31 December | |||
|---|---|---|---|
| 2002 | 2001 | ||
| Information about our products and services | $m | $m | |
| Sales revenue from | |||
| Basic access | 1,559 | 1,417 | |
| Local calls | 796 | 872 | |
| PSTN value added services | 138 | 131 | |
| National long distance calls | 582 | 611 | |
| Fixed to mobile | 753 | 707 | |
| Outgoing international calls | 162 | 174 | |
| Mobile services | 1,632 | 1,631 | |
| Mobile terminals | 170 | 118 | |
| Data | 525 | 544 | |
| ISDN (Access and Calls) | 496 | 539 | |
| Internet and IP solutions | 389 | 275 | |
| Directory services | 731 | 698 | |
| Intercarrier services | 593 | 568 | |
| Inbound calling products | 250 | 299 | |
| Solutions management | 239 | 221 | |
| Various controlled entities | 971 | 936 | |
| Customer Premises Equipment | 105 | 122 | |
| Payphones | 75 | 78 | |
| Other sales and services | 302 | 325 | |
| 10,468 | 10,266 | ||
Product definitions have been revised in the half-year period ended 31 December 2002, and we have adjusted comparative figures to align with the changes in presentation products and services information.
Attachment 4
| Half-year ended 31 December | ||
| 2002 | 2001 | |
| $m | $m | |
| Items requiring specific disclosure | ||
| The following items form part of the ordinary operations of our business and are considered relevant to explaining the financial performance of the group. | ||
| Profit before income tax expense has been calculated after crediting/(charging) specific revenue and expense items included in our ordinary activities as follows: | ||
| Item included in other revenue: | ||
| - proceeds on sale of properties (i) | 570 | - |
| Item included in other expenses: | ||
| - book value of sale of properties (i) | (439) | - |
| Item included in share of net losses of associates and joint venture entities | ||
| - write off of the carrying value of our investment in Reach Limited (ii) | (965) | - |
| Net specific items | (834) | - |
| Income tax expense | (41) | - |
| Net specific items after income tax expense | (875) | - |
(i) On 1 August 2002, we sold a portfolio of seven office properties for $570 million. The carrying value of these properties was $439 million at the time of sale. We entered into operating leases totalling $518 million in relation to these properties on normal commercial terms of between five and twelve years, most of which commenced on 19 August 2002.
(ii) As at 31 December 2002, we have made the decision to write off the carrying amount of our investment in our 50% owned joint venture, Reach Limited (Reach).
This has resulted in a reduction of our investments accounted for using the equity method in our statement of financial position and an increase to our share of net losses of associates and joint venture entities in the statement of financial performance amounting to $965 million.
The write off has occurred due to the depressed conditions in the global market for international internet capacity resulting in high levels of excess capacity, intense price competition and lower than expected traffic volumes.
In addition, Reach has been in negotiations with its syndicate banks for the refinancing of debt totalling US$1,500 million. The syndicate banks have given Reach a waiver of its debt covenants to 28 February 2003, and discussions are continuing in relation to extending this waiver to permit an orderly refinancing of the debt. This debt is non recourse to Telstra.
The following items had a significant impact on our statement of financial position during the half-year ending 31 December 2002.
(iii) As per the change in accounting policy described in attachment 1, we have separated out the net position of our cross currency swaps from the underlying hedged borrowings in our statement of financial position.
This has not affected our net asset position but has increased both total assets and total liabilities as at 31 December 2002. We have restated the comparative figures for both 30 June 2002 and 31 December 2001 to reflect this change in disclosure.
The balances relating to cross currency swaps in our asset and liability classes are as follows:
| Telstra Group | ||||
|---|---|---|---|---|
| as at | ||||
| 31 Dec | 30 June | 31 Dec | ||
| 2002 | 2002 | 2001 | ||
| $m | $m | $m | ||
| Receivables - current | 102 | 29 | 17 | |
| Receivables - non current | 877 | 622 | 702 | |
| 979 | 651 | 719 | ||
| Interest-bearing liabilities - non current | 131 | 114 | 28 | |
| Net cross currency swaps separated out from interest-bearing liabilities | 848 | 537 | 691 | |
To appropriately assess our price risk arising from foreign currency borrowings, hedge receivables and hedge payables should be viewed in the context of movements in the underlying borrowings.
The net position of our borrowings after including all foreign currency swaps is as follows:
| �� | Telstra Group | |||
|---|---|---|---|---|
| as at | ||||
| 31 Dec | 30 June | 31 Dec | ||
| 2002 | 2002 | 2001 | ||
| $m | $m | $m | ||
| Interest-bearing liabilities - current | 2,080 | 1,895 | 3,526 | |
| less hedge receivable - current | (102) | (29) | (17) | |
| 1,978 | 1,866 | 3,509 | ||
| Interest-bearing liabilities before cross currency swaps - non current | 11,726 | 12,367 | 11,169 | |
| less hedge receivable - non current | (877) | (622) | (702) | |
| add hedge payable - non current | 131 | 114 | 28 | |
| 10,980 | 11,859 | 10,495 | ||
| Interest-bearing liabilities net of cross currency swaps | 12,958 | 13,725 | 14,004 | |
(iv) Due to the first time application of AASB 1044: "Provisions, Contingent Liabilities and Contingent Assets" we no longer recognise a provision for dividend at reporting date when the dividend is actually declared after that date. The provision raised for the final dividend at 30 June 2002 was $1,415 million, whereas there has been no provision raised as at 31 December 2002. This has resulted in a significant change to our current provisions compared with our comparative reported periods.
Refer to attachment 1 for additional information on this change in accounting policy.
There are no transactions that required specific disclosure for the half-year ending 31 December 2001.
Attachment 5
Events after balance date
The directors are not aware of any matter or circumstance that has occurred since 31 December 2002 that, in their opinion, has significantly affected or may significantly affect in future years:
- our operations;
- the results of those operations; or
- the state of affairs;
other than:
On 27 February 2003, the directors of Telstra Corporation Limited declared a fully franked interim dividend of 12 cents per ordinary share and a fully franked special dividend of 3 cents per ordinary share, payable on 30 April 2003 to those shareholders on record at 21 March 2003. A provision for dividend payable has been raised as at this date amounting to $1,930 million.
Attachment 6
Contingent liabilities and contingent assets
There have been no significant changes from 30 June 2002 to guarantees, indemnities and support provided by us, or to legal actions we are involved in, which gave rise to contingent liabilities or contingent assets apart from:
Our 50% owned pay television joint venture FOXTEL, and Optus entered into a content supply agreement in March 2002 which allows Optus to provide a number of FOXTEL pay TV channels over the Optus cable network. This agreement became unconditional in November 2002 and was effective as of 1 December 2002. Under this agreement, FOXTEL assumes some of Optus' financial obligations under its movie and other content arrangements. Our share of these commitments is $195 million.
As we are subject to joint and several liability in relation to agreements entered into by the FOXTEL partnership, we would be contingently liable if our partners in this relationship (The News Corporation Limited and Publishing and Broadcasting Limited, and Telstra Media Pty Ltd and its partner, Sky Cable Pty Ltd) failed to meet any of their obligations. As a result, our contingent liabilities arising from the content sharing agreement have also increased by $195 million.
Our 50% owned joint venture Reach Limited (Reach) has capacity obligations with Australian-Japan Cable Holdings Limited (AJC) to a maximum of $263 million (30 June 2002: $265 million). We have guaranteed these arrangements as was the case prior to the formation of the joint venture. The contractual arrangement between Reach and AJC is in relation to Reach's utilisation of cable capacity to December 2006.
The commitments of Reach under the contractual agreement are:
| As at | |||
|---|---|---|---|
| 31 Dec | 30 June | ||
| 2002 | 2001 | ||
| $m | $m | Within 1 year | 35 | 36 |
| Within 1-2 years | 86 | 87 | |
| Within 2-3 years | 80 | 80 | |
| Within 3-4 years | 62 | 62 | |
| 263 | 265 | ||
Telstra Corporation Limited
Half Year results and operations review
Half Year ended 31 December 2002
| Strong cashflow and balance sheet settings despite challenging environment |
Financial highlights
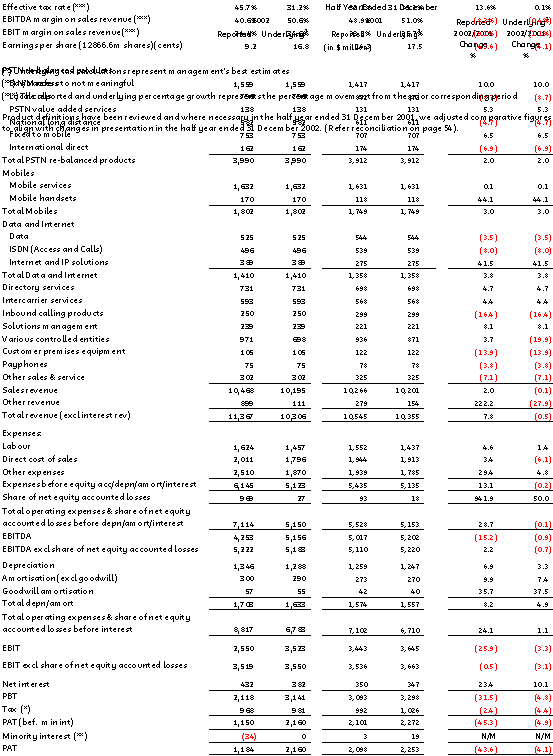
Reported earnings before interest and tax (EBIT) decreased by 25.9% to $2.6 billion with reported revenues increasing by 7.8% to $11.4 billion, and reported total expenses increasing by 24.1% to $8.8 billion. Reported net profit after tax and minorities (NPAT) decreased by 43.6% to $1.2 billion. The decrease in reported EBIT and NPAT is largely attributable to the write down of the investment in Reach Ltd, of $965 million.
Underlying1 sales revenue was relatively flat, declining slightly by 0.1% to $10.2 billion, with growth across mobiles, fixed to mobile, and internet and IP products, offset by a decline in ISDN, data and controlled entities revenue. Underlying1 total revenue (excluding interest) declined 0.5% to $10.3 billion.
Underlying1 operating expenses (before depreciation, amortisation and interest) declined by 0.1% to $5.2 billion, driven by a reduction in direct cost of sales. Underlying1 total expenses (including depreciation and amortisation but before interest and tax) increased by 1.1% to $6.8 billion.
Underlying 1 earnings before interest and tax decreased by 3.3% to $3.5 billion, from the combination of flat revenues and underlying depreciation and amortisation growth of 4.9%.
Underlying1 profit after tax and minorities decreased by 4.1% to $2.2 billion.
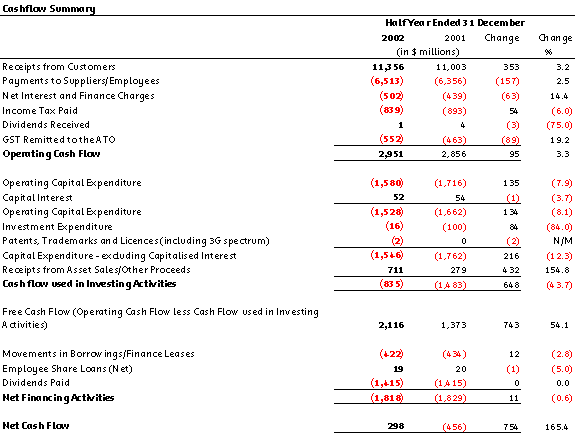
Operating capital expenditure declined by 7.9% to $1.6 billion and represents 15% of sales revenue.
Free cash flow 2 increased by 54% to $2.1 billion driven by reduced capital expenditure and increased proceeds from asset and investment sales.
A fully franked interim dividend of 12 cents per share and a fully franked special dividend of 3 cents per share has been declared and is payable on 30 April 2003. This represents an increase of 36%.
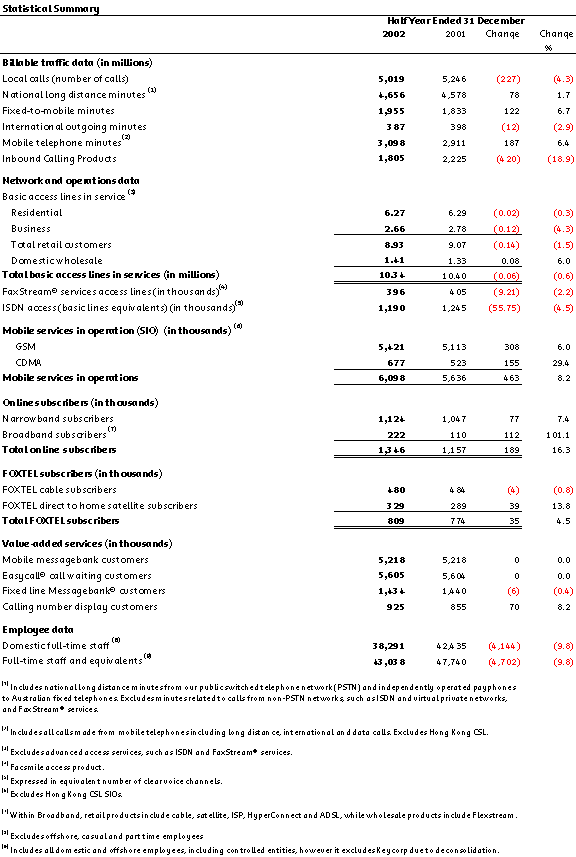
Telstra's performance across both customer service guarantee and non customer service guarantee indicators remains high, particularly connections and fault restoration in rural and remote areas.
All results stated in $A unless otherwise indicated.
All statistical data represents management's best estimates and excludes all Telstra internal usage statistics.
Footnotes:
1. Underlying results are produced to allow like for like comparison by removing those items which are either;
i) not of a comparable nature owing to structural changes to the business e.g. acquisitions/consolidations;
ii) significant and non recurring; or
iii) not part of the core operations of the business.
Underlying results EXCLUDE:
(a) The half years ended 31 December 2002 and 2001 proceeds from asset/investment sales and book value of asset/investment sales, and diminution in value of investments;
(b) The half years ended 31 December 2002 and 2001 revenue and expenses from new business ventures, namely Keycorp Ltd - July 2001 to December 2001 and TelstraClear - December 2001 and July 2002 to December 2002;
(c) TelstraSaturn equity loss and TelstraClear pre-acquisition costs from the half year ended 31 December 2001;
(d) Costs associated with restructuring of the business; and
(e) The write down in the investment in Reach and Reach contract exit transactions.
2 Free cash flow = operating cash flow less cash used in Investing activities.
Statement of financial performance _____________________________________________________ 3
Cash flow summary__________________________________________________________________ 4
Statement of financial position_________________________________________________________ 4
Statistical data summary______________________________________________________________ 5
Summary of operating results__________________________________________________________ 6
Results of operations________________________________________________________________ 8
Operating revenues____________________________________________________________________________ 9
Basic access____________________________________________________________________________ 10
Local Calls______________________________________________________________________________ 11
PSTN value add services___________________________________________________________________ 11
National long distance calls_________________________________________________________________ 12
Fixed to mobile calls_______________________________________________________________________ 12
International direct_______________________________________________________________________ 13
Mobile goods and services_________________________________________________________________ 14
Data__________________________________________________________________________________ 16
ISDN__________________________________________________________________________________ 17
Internet and IP solutions___________________________________________________________________ 18
Directory services________________________________________________________________________ 19
Intercarrier services_______________________________________________________________________ 19
Inbound calling products___________________________________________________________________ 20
Solutions management_____________________________________________________________________ 20
Various controlled entities__________________________________________________________________ 21
Customer premises equipment_______________________________________________________________ 22
Payphones_____________________________________________________________________________ 22
Other sales and services___________________________________________________________________ 23
Other revenue___________________________________________________________________________ 24
Operating expenses___________________________________________________________________________ 25
Labour expense__________________________________________________________________________ 26
Direct cost of sales_______________________________________________________________________ 27
Other expenses__________________________________________________________________________ 29
Share of net equity accounted losses__________________________________________________________ 30
Depreciation and amortisation_______________________________________________________________ 31
International_________________________________________________________________________________ 32
Hong Kong CSL Financial Summary___________________________________________________________ 32
Reach Financial Summary__________________________________________________________________ 33
TelstraClear Financial Summary______________________________________________________________ 34
Net Interest Expense_______________________________________________________________ 35
Income Tax Expense_______________________________________________________________ 35
Dividends________________________________________________________________________ 35
Liquidity and Capital Resources______________________________________________________
Cash flow_________________________________________________________________________ 37
Corporate Governance and Board Practices_____________________________________________ 39
Application of critical accounting policies_______________________________________________ 45
Related Party Transactions__________________________________________________________ 49
Normalisation Schedule_____________________________________________________________ 51
Normalisation Schedule (cont'd)______________________________________________________ 52
Quarterly Data____________________________________________________________________ 53
Product Reconciliation______________________________________________________________ 54
Statement of financial performance for the half year ended 31 December 2002
Cash flow summary for the half year ended 31 December 2002
Statement of financial position as at 31 December 2002
Statistical data summary for the half year ended 31 December 2002
Summary of operating results for the half year ended 31 December 2002
Telstra Corporation Limited reported a profit after tax and minorities (PAT) of $1,184 million for the half year ended 31 December 2002, representing a decrease of 43.6% over the prior corresponding half year. The decrease was driven by the write down of the investment in Reach Ltd of $965 million, partly offset by the sale of a number of assets and investments (inclusive of seven commercial properties) for $788 million resulting in an after tax contribution of $159 million.
After adjusting to allow like for like comparisons with the half year ended 31 December 2001, underlying1 PAT declined 4.1% to $2,160 million. Underlying1 EBIT declined 3.3% to $3,523 million, and underlying1EBITDA declined 0.9% to $5,156 million.
Revenue
Reported sales revenue increased 2% to $10,468 million for the half year ended 31 December 2002. The increase was mainly driven by the inclusion of TelstraClear revenue for the full six months, TelstraClear was acquired in December 2001, and therefore only one month of consolidated results were included in the half year ended 31 December 2001. Reported total revenue increased 7.8% to $11,367 million, further driven by the sale of seven commercial properties for $570 million.
Underlying1 sales revenue was relatively flat, declining slightly by 0.1%, to $10,195 million. Mobiles and fixed to mobiles growth has been driven by continued mobile SIO growth, and the continuing impact of rebalancing initiatives has resulted in an increase in basic access revenue partly offset by decreases in local call and national long distance revenues. Online subscriber growth is driving increased internet and IP revenues. Offsetting these gains were declines in ISDN due to increased competition and data due to over capacity in the market, and various controlled entity revenues, due to lower Hong Kong CSL revenue including foreign exchange impacts. Underlying1 total revenue declined 0.5% to $10,306 million.
Expenses
Reported total expenses (including depreciation and amortisation but before interest) increased 24.1%, to $8,817 million for the half year ended 31 December 2002. The increase was largely driven by the write down of the investment in Reach Ltd, cost of asset and investment sales, and the inclusion of Telstra Clear expenses for six months.
Underlying1 operating expenses (before depreciation, amortisation and interest) declined 0.1% to $5,150 million largely due to a 6.1% decline in underlying1 direct cost of sales, driven by reduced network payment rates and savings in mobiles direct cost of sales. This was mostly offset by an increase in underlying1 other expenses due to higher service contracts and agreements, driven by the reclassification of costs previously capitalised and higher volumes. Underlying1 total expenses (including depreciation and amortisation but before interest) increased 1.1% to $6,783 million with depreciation and amortisation growth of 4.9%.
Reported net interest expense increased 23.4% to $432 million driven by additional borrowing commitments relating to TelstraClear and re-financing to reduce long term risk.
Reported tax expense decreased 2.4% to $968 million.
Free cash flow2 increased from $1,373 million to $2,116 million driven by lower operating capital expenditure and increased proceeds from asset and investment sales.
Treasury operations
Telstra financial position remains strong with credit ratings of AA-, Aa3 and AA- from S and P, Moody's and Fitch respectively. Telstra's credit quality ranks amongst the highest in the world in the telecommunications sector.
Dividends
A fully franked interim dividend of 12 cents per share and a fully franked special dividend of 3 cents per share has been declared and is payable on 30 April 2003. This represents an increase of 36%.
For enquiries on these results contact:
David Moffatt
Chief Financial Officer
Telstra Corporation Limited
Wayne Treeby
General Manager, Investor Relations
Telstra Corporation Limited
Phone: 61 3 9634 8014
Email: Investor.relations@team.telstra.com
Operating and Financial Review and Prospects
Results of operations
The following table illustrates reported and underlying1 results for the half years ended 31 December 2002 and 2001.

Reported earnings before interest and tax or "EBIT" for the half year ended 31 December 2002 was $2,550 million compared with $3,443 million for the half year ended 31 December 2001. A number of items in both the half year ended 31 December 2002 and the half year ended 31 December 2001 occurred that make like-for-like comparisons difficult. After adjusting for these items, underlying1 EBIT for the half year ended 31 December 2002 was $3,523 million representing a 3.3% decline from $3,645 million of underlying1 EBIT for the half year ended 31 December 2001.
The items requiring adjustment for this comparison consist of:
- The write down of investments of $968 million, largely comprising the write down of the investment in Reach Ltd of $965 million;
- Reach contract exit costs generated a loss before interest and tax of $41 million in the half year ended 31 December 2002;
- Restructuring expenses for employee redundancies of $125 million in the half year ended 31 December 2002 charged directly to profits compared with $93 million in the half year ended 31 December 2001;
- Asset and investment sales, generated an EBIT of $194 million in the half year ended 31 December 2002 and an EBIT of $12 million in the half year ended 31 December 2001;
- In December 2001, Telstra increased its ownership interest in TelstraSaturn Limited and began consolidating its results. At the same time, TelstraSaturn acquired Clear Communications Limited and its name was changed to TelstraClear Limited. The consolidated results of TelstraClear for the half year ended 31 December 2002 generated a loss before interest and tax of $32 million. Telstra Clear consolidated results for the half year ended 31 December 2001 generated a $14 million loss before interest and tax, and TelstraSaturn's equity accounted loss for the half year ended 31 December 2001 was $75 million (including $48 million of TelstraClear pre acquisition costs);
- Keycorp contributed a loss before interest and tax of $6 million in the half year ended 31 December 2001. As of 28 June 2002, Keycorp was no longer a controlled entity, and is now accounted for as an associated entity.
Operating revenues
The following table includes reported and underlying1 operating revenues for the half years ended 31 December 2002 and 2001.
Reported operating revenue was $11,367 million for the half year ended 31 December 2002, representing an increase of 7.8% when compared to reported operating revenue of $10,545 million for the half year ended 31 December 2001. The principal reason for this increase was:
- Asset and investment sales revenue in the half year ended 31 December 2002 was $788 million, and in the half year ended 31 December 2001 was $125 million. The increase is primarily due to the sale of seven commercial properties, in the half year ended 31 December 2002 for $570 million;
- TelstraClear revenue for the half year ended 31 December 2002 was $273 million, and $39 million in the half year ended 31 December 2001. TelstraClear was acquired in December 2001 (through an increase in ownership interest in TelstraSaturn), and therefore only one month of consolidated results are included in the half year ended 31 December 2001.
- The increase is partly offset by Keycorp revenue of $26 million in the half year ended 31 December 2001. As of 28 June 2002, Keycorp was no longer a controlled entity, and therefore has not contributed any revenue in the half year ended 31 December 2002.
After excluding these items, operating revenue was $10,306 million for the half year ended 31 December 2002, and $10,355 million for the half year ended 31 December 2001 representing a decline of 0.5%.
The continuing impact of rebalancing initiatives has resulted in an increase in basic access revenue offset by decreases in local call and national long distance revenues. Growth in mobiles, fixed to mobiles, internet and IP products and intercarrier revenues were offset by a decline in ISDN, data, controlled entity revenues and inbound calling product revenues.
Basic access
The following table shows information about basic access revenues.
Basic access revenue increased 10.0% in the half year ended 31 December 2002 when compared with the half year ended 31 December 2001, primarily due to the continuation of access price rebalancing first introduced in March 2000. The increase is partially offset by lower call charges. As part of rebalancing initiatives, Telstra has been introducing new pricing packages that have had a positive effect on basic access revenue growth, despite an overall decrease of 0.6% in basic access lines in service.
Some of these pricing initiatives include, introduction of Telstra HomelineTM options in February 2001, and Telstra BusinesslineTM packaging in June 2001. Since inception, continual review of these packages has resulted in pricing adjustments.
The decline in basic telephone access lines is due to competition, particularly in the business segment. There has also been migration to other products such as ISDN, internet and mobiles.
Local Calls
The following table shows information about local calls.
Local call revenue declined 8.7% in the half year ended 31 December 2002 when compared with the half year ended 31 December 2001, due to rebalancing initiatives. Telstra is offering customers a number of pricing packages as part of the rebalancing initiatives, which has lowered local call prices by an average of 4.5%. For example, HomelineTM Plus package allows customers to choose lower call price options that carry higher access charges. HomelineTM Plus customers have increased 20% to approximately 3 million in the half year ended 31 December 2002 compared with the half year ended 31 December 2001.
The number of local calls has been negatively impacted by competition and migration to other products such as ISDN, internet, mobiles, and fixed to mobile.
PSTN value add services
The following table shows information about PSTN value add services revenue.

Revenue for PSTN value add services increased by 5.3% in the half year ended 31 December 2002 when compared with the half year ended 31 December 2001, reflecting the attractiveness of the pricing and packaging initiatives particularly to retail customers. This is reflected by increases in calling number display and call return services, partly offset by a decline in other minor products.
National long distance calls
The following table shows information about national long distance calls.
Revenue for national long distance calls declined 4.7% in the half year ended 31 December 2002 when compared with the half year ended 31 December 2001 due to continued strong competition, despite minutes of use increasing marginally. Volumes were maintained by introducing offerings such as "1 cent Saturdays", and the increased take-up of packages with capped price calls. This positive impact on volumes has been offset by a reduction in the effective price paid by customers resulting from these various offerings and the rebalancing of access and call product prices. With the continued growth of mobiles in the Australian market, national long distance revenues have also been impacted by customer migration to mobile and fixed to mobile services.
Fixed to mobile calls
The following table shows information about fixed to mobile calls.

Fixed to mobile revenue increased 6.5% in the half year ended 31 December 2002 when compared with the half year ended 31 December 2001, largely due to continued growth in the number of mobile services in the Australian market. Volumes have increased driven by promotions such as "1 cent Saturdays" introduced in October 2002 for a limited time, and a reduction in capped call prices from August 2002. Yield per minute has decreased as a result of these promotions, however this has been partly offset by an increase in call connection fees from August 2002.
International direct
The following table shows information about international direct calls.

International direct revenue declined 6.9% in the half year ended 31 December 2002 when compared with the half year ended 31 December 2001. This is primarily due to the continued competitive pressure on per minute prices, and an increase in the number of customers using offerings such as 0018 Free half hour and 10 minute capped calls under Telstra's Homeline rebalancing initiatives. Call connection fee increases in September 2001 and August 2002 have partly compensated for the decrease in effective yield per minute.
Minutes of use have fallen slightly, despite largely maintaining share in the overall market. International direct calls have also been negatively impacted by migration to other products such as ISDN, internet and mobiles.
Mobile goods and services
The following table shows information about mobile goods and services.
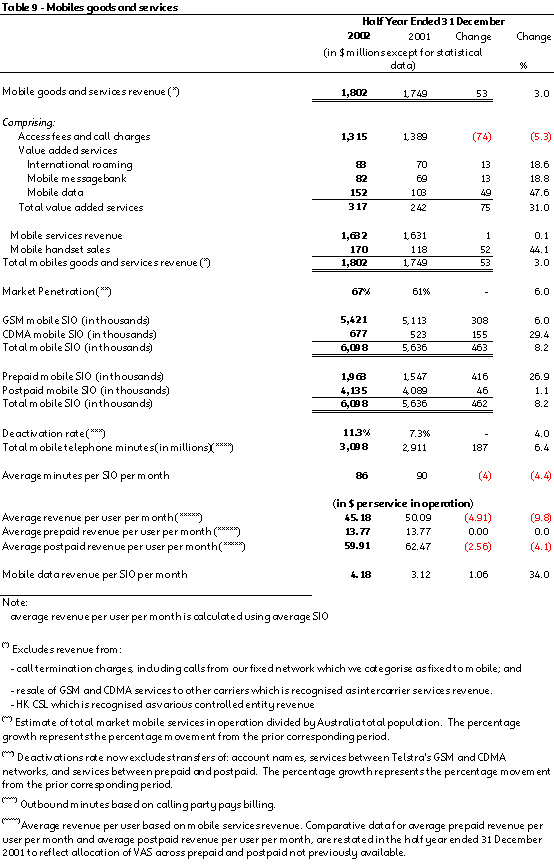
Mobile services revenue remained relatively flat in the half year ended 31 December 2002 when compared with the half year ended 31 December 2001. The growth in mobile services in operation and total minutes of use did not have a corresponding increase in access fees and call charges and average revenue per user due to:
- the change in the mobiles business model replacing handset subsidies with the introduction of loyalty bonuses which reduced the revenue line by $33 million in the half year ended 31 December 2002;
- increased utilisation of included calls by customers. The 'more 4 you' and 'more 4 business' offerings advocate the use of included calls by facilitating the grouping of services to one customer account, where customers can better utilise the access and free call allowance. This has resulted in increased use of this grouping facility of 20%;
- a decline in early termination charges (ETC) attributable to customers on subsidised contracts coming out of the contract term. With the introduction of New World programs, there is no ETC applicable as customers are purchasing handsets outright.
- the higher percentage of new customers connecting to pre-paid services. Pre-paid customers display a diverse usage patterns and there are a high number of low use customers. At December 2002, pre-paid SIOs comprised 32.2% of total SIOs, compared with 27.4% at December 2001.
Given the growth in the prepaid customer base over recent times, we undertook a review of customer profiles to determine customers outside the existing 12 month contractual recharge only period. Consequently 226,000 prepaid services were deactivated in the first quarter ended 30 September 2002, to reflect active and revenue generating customer base. Since then Telstra has introduced a 6 month recharge only period for new prepaid services, with a further 113,000 prepaid customers deactivated. The SIO base and key performance indicators are reported net of these 339,000 prepaid deactivations for the half year ended 31 December 2002, representing a SIO growth of 8.2% to 6.1 million.
The deactivation rate increase of 4.0% in the half year ended 31 December 2002 when compared with the half year ended 31 December 2001 was driven by the 339,000 prepaid customers deactivated. Excluding these prepaid deactivations the deactivation rate declined by 1.7% to 5.6%, indicating that mobile number portability has not had a material impact on services in operation since its introduction.
CDMA services comprised approximately 11% of mobile services, compared with 9.3% at December 2001, and continued to grow strongly at 29.4% in the half year ended 31 December 2002. This was mostly in response to marketing campaigns and new program offers.
Strong positive trends continued across the value added service products:
- international roaming from additional roaming partners;
- mobile messagebank due to an increase in SIOs and a reclassification from access fees and call charges;
- mobile data, such as our short message service (SMS). SMS penetrated approximately 36% of Telstra's mobile customer base at the half year ended 31 December 2002 and 632 million messages were sent compared with 483 million in the half year ended 31 December 2001, a growth rate of 30.6%.
Mobile services revenues in the second quarter declined 2.6%, after a first quarter increase of 2.9%. This reflected the increased impact of loyalty bonuses, included call usage and ETC's.
Handset sales increased in the half year ended 31 December 2002 when compared with the half year ended 31 December 2001. This was due to the removal of handset subsidies and customers purchasing handsets outright, following the change in handset subsidy offerings under the 'more 4 you' and 'more 4 business' promotions. Loyalty schemes and repayment options contributed to the increase.
Data
The following table shows information about data revenues.
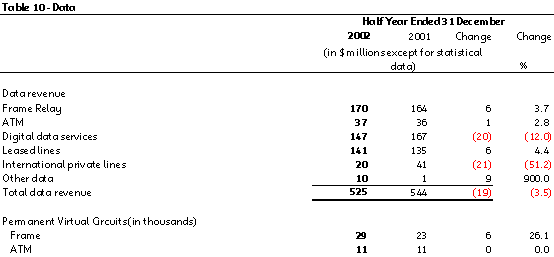
Data revenue decreased 3.5% in the half year ended 31 December 2002 when compared with the half year ended 31 December 2001 due to lower demand across the market and strong competition leading to yield erosion.
Domestic Frame Relay revenue grew by 4.8% in the retail market. There has been strong growth in the number of services, driven by WAN and migration from DDS and ISDN, however competitive pricing mostly offset this growth. In the retail market, Domestic ATM revenue grew by 7.7%. The wholesale market revenue for both Domestic Frame Relay and Domestic ATM remained flat.
The global market for international data services remains subdued. International Frame Relay and Global ATM revenue in total declined by 10.5% in the half year ended 31 December 2002 when compared with the half year ended 31 December 2001. However, revenue for International Frame Relay has grown 15% in the half year ended 31 December 2002 when compared with the half year ending 30 June 2002, indicating a reversal of the trend.
Digital Data Service revenue fell by 12.0% in the half year ended 31 December 2002. This is a mature product and customers are migrating to newer technologies and greater bandwidth to meet application needs.
Leased lines are generally mature products experiencing decline. However, reported growth has been distorted due to the Transend product revenue of $16 million being reported in Data revenue in the half year ended 31 December 2002. In the half year ended 31 December 2001, Transend product revenue was reported in various controlled entities revenue, as it was generated by Keycorp a controlled entity at the time.
International private line revenues fell due to multiple participants and excess capacity in the market driving prices down.
Other data growth was distorted due to the Argent product revenue of $19 million being reported in data revenue in the half year ended 31 December 2002. In the half year ended 31 December 2001, the Argent product revenue was reported in various controlled entities revenue as it was generated by Keycorp a controlled entity at that time.
ISDN
The following table shows information about ISDN revenue.
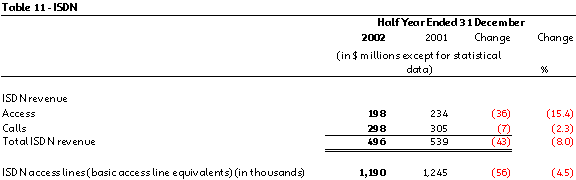
ISDN revenue decreased by 8.0% in the half year ended 31 December 2002, when compared with the half year ended 31 December 2001.
The decline of 15.4% in ISDN access revenue was driven by:
- ISDN access volumes (basic access line equivalents) decreased by 4.4%. This has largely occurred with our primary rate access services which were down 10.3%. We experienced losses to competitors, particularly during the migration from our old technology ISDN platform which was closed in November 2002. There was also some migration to other products such as Frame Relay and wholesale DSL. However, basic rate access services grew by 11.2%;
- Effective yield was down slightly as the old ISDN products had higher charges than our newer ETSI standard products (OnRamp);
- Fees for the semi permanent circuit option on the old platform were treated as access revenue. The monthly fees allowed customers to have free calls. The equivalent offering on the newer ETSI platform allows customers to have discounted and capped call prices. These plan fees are treated entirely as call revenue.
The decline of 2.3% in call revenue was driven by:
- A decrease in data call revenue of 8.2%. Minutes declined, generally in line with the fall in overall access lines in service. There was also a reduction in average call charges, despite there being less free calls under the semi permanent circuit plans;
- Partially offset by an increase in voice call revenue of 5.6%. Volumes were up approximately 12% however this was partially offset by continuing downward pressure on call charges. ISDN to some extent was impacted by rebalancing.
Internet and IP solutions
The following table shows information about Internet and IP solutions.
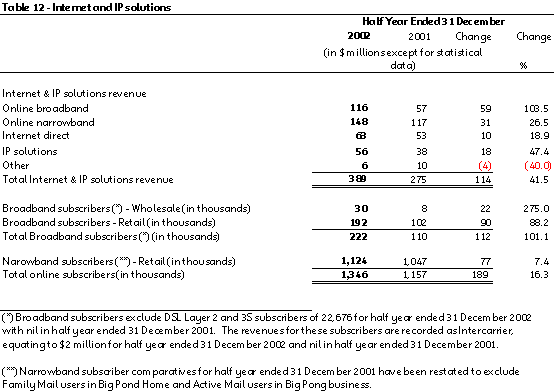
Internet and IP solutions revenue increased 41.5% in the half year ended 31 December 2002 when compared with the half year ended 31 December 2001 driven by:
- Continued strong growth in both retail and wholesale broadband subscribers of 101.1% combined with the introduction of excess usage billing for our BigPond broadband customers;
- Continued growth in our narrowband subscribers of 7.4%. As the dial-up market matures, we have been focusing not only on acquisition, but also on retention. For example, in October 2002, BigPond Business customers benefited from a 15% price reduction with increased hours of use and a reduced additional hourly charge for each plan;
- Internet Direct revenues grew by 18.9% primarily due to the growth in a highly competitive market of Internet Direct services by approximately 16.7% in the half year ended 31 December 2002. Growth has been achieved via simplified packages offering customers integrated internet and connectivity solutions, flexibility with an unequalled breadth of access connection types and pricing campaigns that encourage customers to upgrade both access type and speed.
- IP solutions grew by 47.4% driven by our portfolio of new generation IP services performing strongly in a market characterised by aggressive price behaviour. Private IP, which was launched in July 2000 grew by 70% and gained market share in the half year ended 31 December 2002. The majority of this data business is new rather than migration from the existing data business. Wideband IP, launched in November 2000, has also shown strong growth of approximately 150% in the emerging metro Ethernet market. Dial IP, though a mature product, continued to grow at 17%, serving remote networking requirements and telecommuting needs. Telstra Wholesale MegaPopTM growth is flat. We lowered MegaPop access tariffs in November 2002 as a result of aggressive price competition in this segment.
Directory services
The following table shows information about directory services revenue.

Directory services revenue increased 4.7% in the half year ended 31 December 2002 when compared with the half year ended 31 December 2001. The launching of new print features in Yellow Pages including Red Bold, Colour in Column and Banner Ads assisted revenue growth in Yellow Pages of 1.7%. The split of residential and business customers in the Sydney, Adelaide and Brisbane metropolitan books has increased White Pages revenue by 14.6%. In addition, online and electronic products experienced growth of 50%, albeit from a low base. This was largely due to new customers and product enhancements for Yellow Pages OnLine and the acquisition of CitySearch.
Intercarrier services
The following table shows information about intercarrier service revenue.
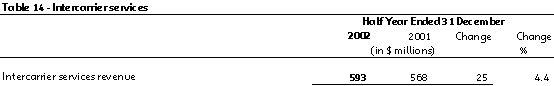
Intercarrier services revenue has increased 4.4% in the half year ended 31 December 2002 when compared with the half year ended 31 December 2001. This growth has been driven by:
This is partly offset by decreasing yield in wholesale leased transmission due to excess capacity within the industry.
Intercarrier services revenue in the second quarter increased 1.0%, following a first quarter increase of 7.9%. This reflects the continued decline in wholesale leased transmission and the slow down of international voice refile traffic.
Inbound calling products
The following table shows information about inbound calling products.
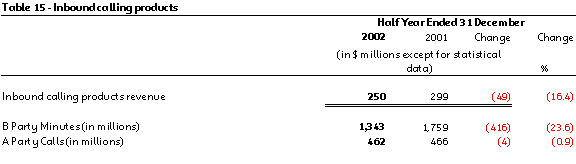
Inbound calling product revenue declined 16.4% in the half year ended 31 December 2002 when compared with the half year ended 31 December 2001, primarily due to the introduction of Inbound Number Portability (INP) in November 2000. This has created a more competitive environment which has negatively affected our prices and volumes.
The main INP impact has been on revenue derived from our Freecall 1800 product and the B party (called party) revenue of our Priority One3 and Priority 1300 products. These products consist of a base of major customers and have been significantly affected by competition.
Revenue from A party (calling party) calls to 13 and 1300 numbers has remained fairly flat with little movement in the number of calls and effective yield.
Solutions management
The following table shows information about solutions management revenue.

Revenue from solutions management is derived from managing all or part of a customer's information technology or telecommunications services. Solutions management revenue increased 8.1% in the half year ended 31 December 2002 when compared with the half year ended 31 December 2001 primarily due to:
- an increase of 12.8% in the Telstra Managed Services business primarily due to a combination of once off exit penalties and the renewal of long-standing customer contracts;
- managed WAN (IMS) revenue increased 4.5% reflecting increased demand for IP products and associated router management services;
- SME and corporate hosting revenue also increased 26%, however this was from a relatively small base.
This growth was partly offset by a decline of 16.6% in managed radio revenue due to the completion of the South Australian government radio network, in the half year ended 31 December 2001.
Solutions management revenues in the second quarter increased 13.6%, after a first quarter growth of 2.7%. The second quarter was impacted by the recognition of exit penalties and the change in treatment of revenues on the Westpac NZ contract. This revenue was previously recorded by TelstraClear.
Various controlled entities
The following table shows information about various controlled entities revenue.

Reported revenue from various controlled entities increased by 3.7% in the half year ended 31 December 2002 when compared with the half year ended 31 December 2001. After excluding TelstraClear in the half years ended 31 December 2002 and 2001, and Keycorp in the half year ended 31 December 2001, underlying1 various controlled entities revenue decreased by 19.9%.
Hong Kong CSL sales revenue decreased in the half year ended 31 December 2002 when compared with the half year ended December 2001, due to a decrease in local service revenue caused by the economic downturn in Hong Kong, and also a $49 million foreign exchange impact as a result of the Hong Kong dollar depreciating against the Australian dollar.
In addition, Vietnam and Cambodia Business Co-operation Contract (BCC) revenue sharing ended in March 2002 as expected, resulting in lower revenues. This venture contributed $49 million revenue in the half year ended 31 December 2001. The inclusion of the Transend and Argent product revenue of $35 million in the half year ended 31 December 2001, through Telstra's interest in Keycorp is also driving this decline. As Keycorp is no longer a controlled entity, the Transend and Argent product revenues are reported in Data revenues in the half year ended 31 December 2002.
The decrease in various controlled entities revenue was partly offset by increased NDC revenue, due to a concerted effort to increase NDC's exposure in the external and international market following a general slow down of the domestic construction market.
Customer premises equipment
The following table shows information about our customer premises equipment revenue.
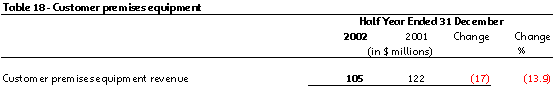
Revenue from customer premises equipment products and services declined 13.9% in the half year ended 31 December 2002 when compared with the half year ended 31 December 2001. This was principally due to the sale of PABX business in the half year ended 31 December 2001, consistent with Telstra's strategy to exit the customer premises equipment market, and the continued competition in the market with an expanding range of products. There has also been a continuing decline in revenue from rental telephones and associated fee for service business, offset partially by an increase in revenue from the sale of consumer products.
Payphones
The following table shows information about the payphones business.
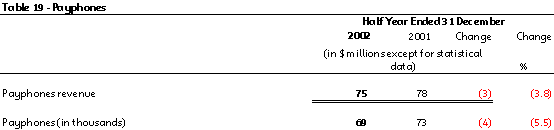
Payphones revenue decreased 3.8% in the half year ended 31 December 2002 when compared with the half year ended 31 December 2001. This movement was largely driven by:
- a reduction in the number of Telstra operated payphones of 2.8% due to increased competition and the gradual removal of old phones;
- a reduction in the number of privately operated payphone services of 5.5%;
- substitution to other products, in particular mobiles; and
- the decrease in effective price yields for non local calls.
Other sales and services
The following table shows information about other sales and services revenue.
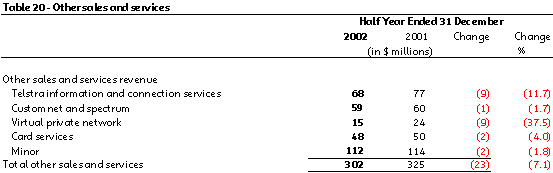
Revenues from other sales and services decreased 7.1% in the half year ended 31 December 2002 when compared with the half year ended 31 December 2001.
Telstra information and connection services are traditional voice services and the product group has shown declining revenue growth. Operator assisted and directory services calls have declined as customers move to more cost efficient alternatives, such as online directory services.
Virtual private network (VPN), in both our domestic and international VPN products also declined. This was primarily driven by domestic VPN with a decline in SIOs and migration to other products.
Other revenue
The following table shows information about other revenue.
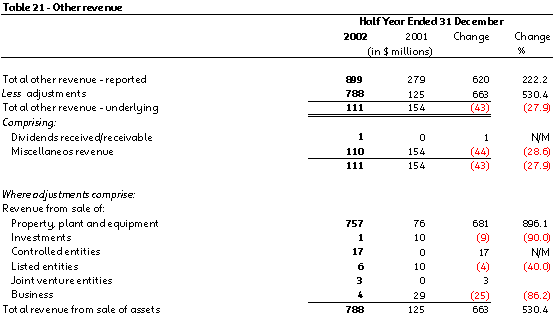
Reported other revenue increased 222.2% in the half year ended 31 December 2002 when compared with the half year ended 31 December 2001, primarily due to the sale of assets, including the sale of seven commercial properties for $570 million.
Excluding this revenue and other revenue generated from sales of assets, investments and interests in listed entities, other revenue declined 27.9% in the half year ended 31 December 2002 when compared with the half year ended 31 December 2001. This is primarily due to a decline in miscellaneous revenue driven by the lower government tender revenues in the half year ended 31 December 2002.
Operating expenses
The following table illustrates reported and underlying1 expenses for half years ended 31 December 2002 and 2001.

Reported operating expenses were $8,817 million for the half year ended 31 December 2002, representing an increase of 24.1% when compared with reported operating expenses of $7,102 million for the half year ended 31 December 2001. The principal reason for this increase was:
- $965 million write down in the investment in Reach Ltd
- $41 million Reach contract exit costs;
- $305 million of expenses from Telstra Clear included in the half year ended 31 December 2002;
- $594 million of costs relating to our asset and investment sales;
- $3 million for the write down of investments; and
- $125 million of costs relating to restructuring.
In comparison, the half year ended 31 December 2001 included:
- $53 million of expenses from TelstraClear
- $75 million from TelstraSaturn (including TelstraClear pre-acquisition costs of $48 million);
- $32 million from Keycorp;
- $113 million of costs relating to our asset and investment sales;
- $26 million for the write down of investments; and
- $93 million of costs relating to restructuring
After excluding these items, operating expenses increased 1.1% in the half year ended 31 December 2002 when compared with the half year ended 31 December 2001. Excluding depreciation and amortisation, operating expenses decreased 0.1% to $5,150 million in the half year ended 31 December 2002 from $5,153 million in the half year ended 31 December 2001.
The following tables provide information about each expense grouping.
Labour expense
The following table shows information about labour expenses.
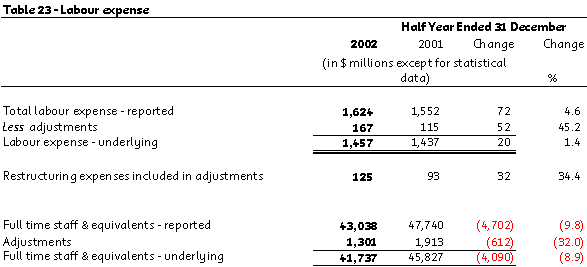
Reported labour expenses increased 4.6% in the half year ended 31 December 2002 when compared with the half year ended 31 December 2001 primarily due to an increase in restructuring costs that have been charged against profit in the half year ended 31 December 2002. Reported labour expenses excluding restructuring costs have increased 2.7%, reflecting the inclusion of labour expenses relating to TelstraClear for non-comparable periods.
After excluding the impact of the labour expenses relating to TelstraClear, Keycorp and restructuring costs, labour expenses increased by 1.4% in the half year ended 31 December 2002 when compared with the half year ended 31 December 2001. This increase was driven by:
- an increase resulting from the change in treatment of motor vehicle salary package costs as these costs were recognised in other expenses in the half year ended 31 December 2001;
- the adoption of AGAAP accounting for Annual Leave and Superannuation expenses by Hong Kong CSL in the half year ended 31 December 2002;
- a lower 10 year bond rate in the half year ended 31 December 2002 when compared with the half year ended 31 December 2001 driving higher employee provisions;
- The introduction of deferred share purchases to replace the options plan;
- staff on individual contracts received an average increase of 2.9 % in October 2002 after an average increase of 5% in October 2001;
- award staff received an average increase of 2% in December 2002 in accordance with the current enterprise agreement, compared with the 4% average increase in December 2001.
These increases were partly offset by:
- a reduction in reported full time staff and equivalents from 47,740 to 43,038.
Based on the latest actuarial advice provided on the financial position of the Telstra Superannuation Scheme as at 30 June 2000, it is expected that a surplus in the superannuation scheme will continue. However this depends on the performance of the fund. There has been a reduction in the value of the assets of the fund over the period and therefore Telstra is closely monitoring the situation in light of current financial market performance.
Direct cost of sales
The following table shows information about direct cost of sales.
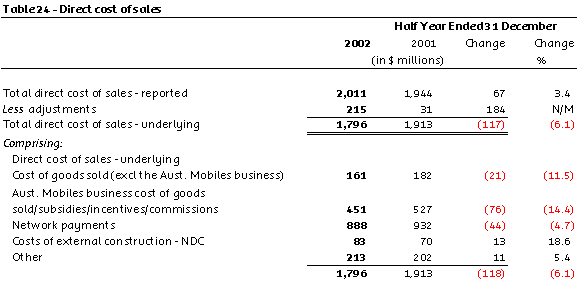
Reported direct cost of sales increased by 3.4% in the half year ended 31 December 2002 when compared with the half year ended 31 December 2001. Included in the reported results are costs relating to TelstraClear and Keycorp for non-comparable periods, and costs relating to the exit of the Reach contract.
After excluding these items, direct costs of sales declined 6.1% in the half year ended 31 December 2002 when compared with the half year ended 31 December 2001.
The main drivers behind this decrease in direct costs of sales were:
- Lower activity in the Hong Kong mobile market and stronger competitive pressures.
- Network payments decreased in the half year ended 31 December 2002 when compared with the half year ended 31 December 2001 due to a reduction in charges from Reach for international network connections, particularly in relation to switched voice and internet charges. The new pricing structure came into effect in January 2002. There was also the additional benefit from the more favourable $US exchange rate in the latter period.
- Australian mobile cost of goods sold/subsidies/incentives/commissions have decreased in the half year ended 31 December 2002 when compared with the half year ended 31 December 2001 mainly due to;
- Mobile subsidies declined following the change in handset subsidy offerings under the 'more 4 you' and 'more 4 business' promotions launched in January 2002. This has resulted in a decrease of new connections and upgrades of existing handsets;
- Mobiles dealer incentives/fees declined due to a reduction in the average incentive rate per connection, and the channel mix of new connections increasingly favouring internal channels.
- Mobiles commissions declined due to the internal management of a group of Mobilenet customers previously managed externally, and the re-negotiation of major external dealer contracts. These savings were partly offset by increased prepaid usage commissions attributable to an increase in the prepaid SIO base.
Partly offsetting the above decreases were:
- An increase in mobiles cost of goods sold due to the removal of handset subsidies and customers purchasing handsets outright, following the change in handset subsidies offerings under the 'more 4 you' and 'more 4 business' promotions. In addition, CDMA has increased its portion of the changing product mix, where CDMA handsets have a higher average cost than GSM handsets.
An increase in costs of external construction (primarily costs of activities provided by NDC to external parties) in the half year ended 31 December 2002 when compared with the half year ended 31 December 2001, was due to a concerted effort in the half year ended 31 December 2002 to increase NDC's exposure in the external market, which corresponds to an increase in NDC's external revenue.
Other expenses
The following table shows information about other expenses.
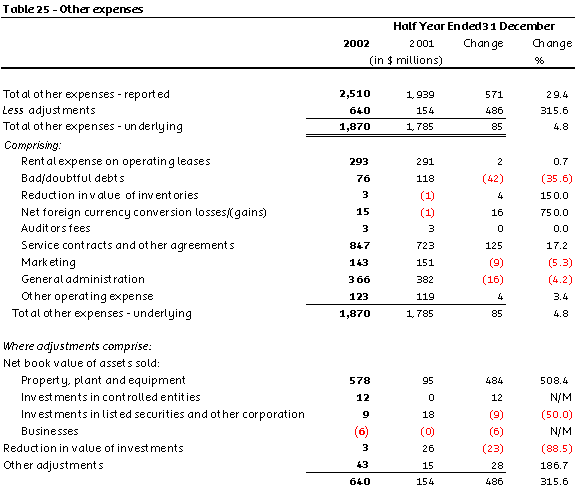
Reported other expenses increased 29.4% in the half year ended 31 December 2002 when compared with the half year ended 31 December 2001.
The increase was driven by the cost of asset and investment sales of $594 million, which includes the sale of seven commercial properties in the half year ended 31 December 2002. Adding to the increase was the impairment of investments of $3 million, and other expenses relating to TelstraClear of $43 million in the half year ended 31 December 2002. In the half year ended 31 December 2001, asset and investment sale expenses were $113 million, impairment of investments were $26 million and other expenses relating to Telstra Clear and Keycorp were $6 million and $9 million respectively.
After excluding the cost of asset and investment sales, impairment of investments and other expenses relating to TelstraClear and Keycorp, other expenses increased in the half year ended 31 December 2002 by 4.8% when compared with the half year ended 31 December 2001. The increase was driven by:
- Service contracts and agreements increased in the half year ended 31 December 2002 compared with the half year ended 31 December 2001 largely due the reclassification of Wideband and associated recovery costs of $46 million, (capitalised in the full year ended 30 June 2002). A further $20 million of these costs have been recognised in the half year ended 31 December 2002. Service contracts and agreements also increased due to network and emergency maintenance, relating to the maintenance and repair of mobiles and radio equipment to restore service, in line with the increased size of the mobile network. In addition, in the half year ended 31 December 2002 we outsourced the management of our mobiles National Activation Centre, thereby increasing costs in this category. The National Activation Centre was managed internally and incurred as labour and associated costs in the half year ended 31 December 2001.
Currency conversion costs increased in the half year ended 31 December 2002 compared with the half year ended 31 December 2001 primarily due to the revaluation of borrowings to reflect the fluctuation in exchange rates.
The increases were partly offset by the following declines:
- Bad debts decreased in the half year ended 31 December 2002 compared with the half year ended 31 December 2001. These movements were primarily due to the higher write downs of long outstanding debt in the half year ended 31 December 2001, combined with lower provision requirements in the half year ended 31 December 2002.
- Marketing and general administration expenses continued to decrease in line with cost reduction initiatives.
- The change in treatment of motor vehicle salary package costs as these costs were recognised in labour expenses in the half year ended 31 December 2002.
Share of net equity accounted losses
The following table shows information about share of net equity accounted losses.
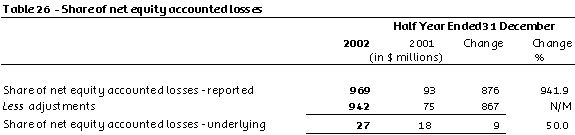
Reported net equity accounted losses increased 941.9% in the half year ended 31 December 2002 when compared with the half year ended 31 December 2001. The increase was primarily due to the write down of the investment in Reach Ltd of $965 million. This was partly offset by the impact of Reach contract exit benefit to the equity accounted result for the half year ended 31 December 2002, TelstraClear pre-acquisition costs and TelstraSaturn equity accounted losses totalling $75 million included in the half year ended 31 December 2001, for non-comparable periods.
After excluding these items, equity accounted losses increased 50.0% in the half year ended 31 December 2002 when compared with the half year ended 31 December 2001. For the half year ended 31 December 2002, Reach recorded an equity loss of $5 million compared to an equity profit of $20 million in prior period. Following the write down in the investment of Reach Ltd, equity accounting will be suspended.
The growth in equity accounted losses was partly offset by a decline in Australian Japan Cable losses, and a decrease in Dynegy losses. Dynegy is no longer equity accounted as we exercised a put option requiring Dynegy Inc. to return our 20% investment in Dynegy Connect LP.
Depreciation and amortisation
The following table shows information about depreciation and amortisation.
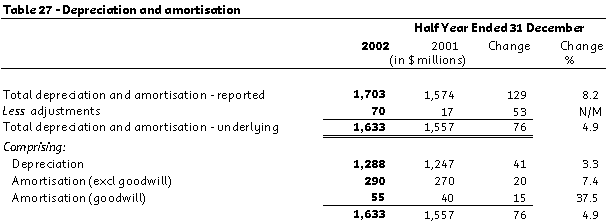
Reported depreciation and amortisation increased by 8.2% in the half year ended 31 December 2002 when compared with the half year ended 31 December 2001. The increase was mainly attributable to the growth in the communications plant asset base and capitalised software development, which was consistent with the level of capital expenditure over recent years. The inclusion of depreciation and amortisation for TelstraClear has also contributed towards the increase.
After excluding TelstraClear and Keycorp, depreciation and amortisation for the half year ended 31 December 2002 increased 4.9% when compared with the half year ended 31 December 2001. Included in this was an increase in amortisation of goodwill of 37.5% in the half year ended 31 December 2002 when compared with the half year ended 31 December 2001 mostly due to our increased shareholding in Hong Kong CSL.
International
Hong Kong CSL Financial Summary
The following table shows information about Hong Kong CSL.
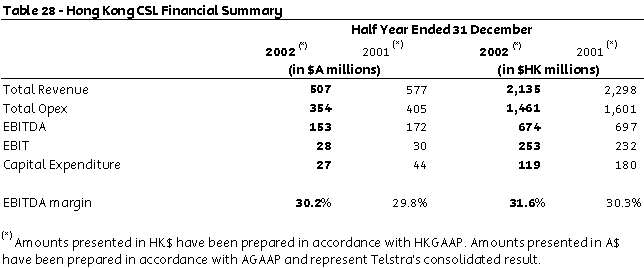
Under the depressed economic environment and saturated mobile market, the key business focus of Hong Kong (HK) CSL is to grow net profits by providing supreme value added services and innovative data applications to our customers, instead of competing on price. On top of the reduced handset subsidy, the increased operating efficiency fostered its EBIT growth by 9.0% to HK$253 million.
Revenue decline in A$ has been exaggerated by the depreciating HK$ against the A$.
HK CSL maintains tight control on its capital expenditure program and spends as per business needs. The capital expenditure to sales ratio was below 6.0%.
Being the most profitable operator in Hong Kong, HK CSL will rely on its high share of premium and business customers as a solid platform to further boost the data revenue. Since launching MMS in April 2002, HK CSL has already achieved some early success in both take-up rate and usage of these services. With an increasing population of data enabled devices in the Hong Kong market, HK CSL is well positioned to drive revenue growth by introducing new mobile services ranging from business and financial applications to entertainment contents.
Reach Financial Summary
The following table shows information about Reach.
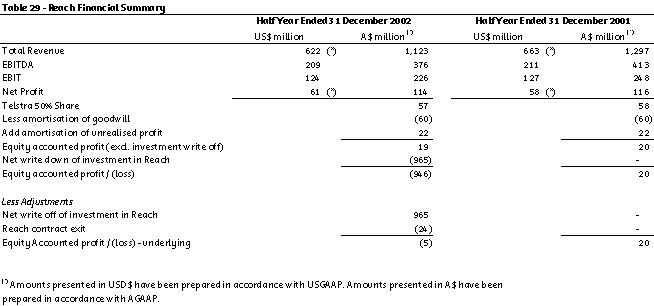
Reach, Asia's largest international carrier of combined voice, private line and IP data services, was formed in February 2001 from the merger of Telstra's and PCCW's international connectivity and assets.
Reach was formed with expectations of steady growth in voice traffic and strong growth in internet bandwith. Voice traffic has continued broadly in line with expectations, but internet traffic, though still growing, has fallen short of volume forecasts and the business has been dramatically and adversely impacted by steep price declines.
In view of the extent of the market pressure on the global connectivity business, Telstra has written down the investment in Reach, and will suspend equity accounting of Reach accordingly.
The above figures include payments made by Telstra and PCCW as part of arrangements that committed to substantial purchase levels up to 31 December 2002. (Refer to Related Party transactions section).
TelstraClear Financial Summary
The following table shows information about TelstraClear.
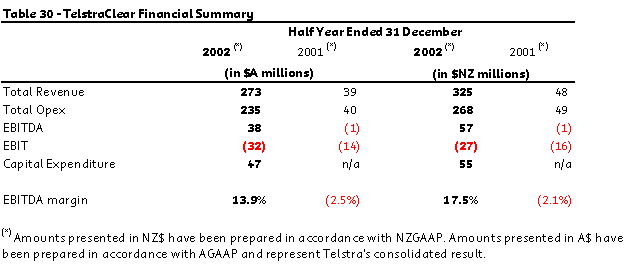
TelstraClear, the second largest full service carrier in New Zealand, has been operative since December 2001.
TelstraClear and Telstra have been working together to provide customers on both sides of the Tasman with seamless communication and information technology solutions, providing IP connectivity to 50 other countries.
TelstraClear is focused on strengthening its customer base whilst continuing to contain operational and capital expenditure.
TelstraClear has recently obtained favourable outcomes on regulatory decisions and commercial negotiations.
Net Interest Expense
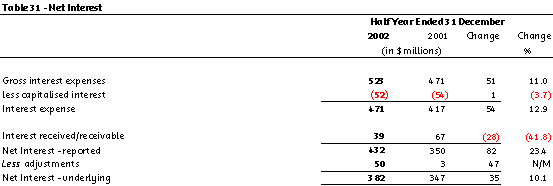
Reported net interest increased 23.4% largely due to additional borrowing associated with the consolidation of TelstraClear. After taking this into account underlying1 net interest increased 10.1% driven by higher rates associated with the re-financing of our debt portfolio to reduce long term risk, and the close out of some interest rate swaps.
Income Tax Expense
Reported income tax expense declined 2.4% despite profit before tax declining 31.5%. This was due to the non deductibility of the write down of the investment in Reach Ltd of $965 million. After taking this into account and adjusting to allow like for like comparisons, underlying1 income tax expense declined 4.4% which was consistent with a decline in underlying1 profit before tax of 4.8%.
Dividends
A fully franked interim dividend of 12 cents per share and a fully franked special dividend of 3 cents per share has been declared and is payable on 30 April 2003. This represents an increase of 36%.
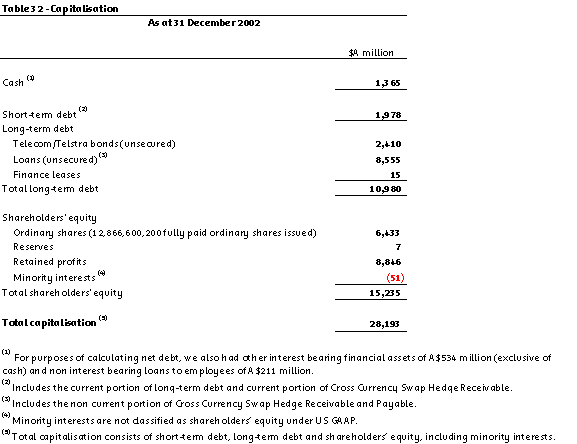
Liquidity and Capital Resources
Cash and cash equivalents at the end of the current half year were $1,365 million, compared with $652 million at the end of the half year ended 31 December 2001. At 31 December 2002, gross interest bearing debt was $12,958 million with net debt of $10,848 million after deducting cash of $135 million, other interest bearing financial assets of $1,764 million and loans to employees of $211 million. Approximately 23% of total debt consisted of domestic borrowings with the balance sourced from a variety of offshore markets. Current debt that matures in less than 12 months comprised approximately 15% of total debt, which had an average maturity of approximately five and a half years.
Telstra has access to A$550 million and US$200 million of committed standby bank lines and A$1.25 billion and US$600 million of committed, but not drawn, syndicated loans available until September 2005. These standby lines comprise bilateral arrangements with seven banks which fall due for renewal at various times throughout the year. Telstra has four commercial paper programmes with a total borrowing capacity of A$2 billion, US$4 billion, Euro 4 billion and NZ$ Unlimited. In each case, Telstra issues a commercial paper through an established panel of dealers as funding requirements arise. Commercial paper facilities are not committed and do not provide guaranteed access to funds.
Other than borrowings in foreign currency specifically held as hedges against foreign currency assets, all foreign currency borrowings are fully hedged at draw down to A$ equivalents using cross currency swaps and we do not use derivatives for speculative purposes. Foreign currency exchange risk is managed centrally through Telstra's treasury group.
Net current liabilities are A$124 million as at the half year ended 31 December 2002, compared with A$3,745 million as at the half year ended 31 December 2001. The reduction is primarily due to:
- an increase in cash and cash equivalent assets for December 2002;
- a shift in interest bearing liabilities from current to non-current; and
- a reduction in provisions due to a change in accounting standards for December 2002, directing that a dividend provision can only be raised once declared by the board.
Cash flow
The following table includes information about cash flows.
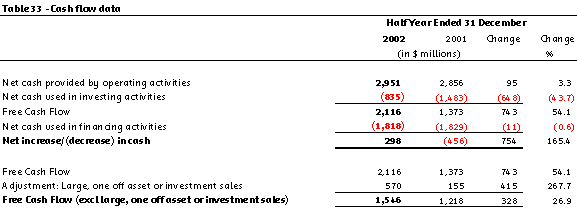
Free cash flow for the period increased by 54.1% to $2.1 billion, reflecting the ability of the business to continue to generate substantial cash flows. After removing the impact of the sale of seven commercial properties in the half year ended 31 December 2002 and the sale of Computershare in the half year ended 31 December 2001, free cash increased by 26.9% or $328 million.
Net cash provided by operating activities increased by $95 million or 3.3%, principally driven by increased revenue from customers. This growth was offset in part by higher payments to suppliers and employees, and higher net interest payments.

Net cash used in investing activities decreased 43.7% to $835 million driven by increased proceeds from asset and investment sales and a decline in capital expenditure.
The increased proceeds from asset and investment sales in the half year ended 31 December 2002 was due mainly to the sale of seven commercial properties for $570 million. In the half year ended 31 December 2001 asset and investment proceeds included the sale of Computershare for $155 million.
Operational capital expenditure for the half year ended 31 December 2002, excluding any investments, has reduced by 7.9% to $1.6 billion and is 15% of sales revenue. The reduction in capital expenditure is due to tighter control over the capital expenditure program as a result of improved processes. The key areas of movement from half year ended 31 December 2002 compared with the half year ended 31 December 2001 include:
- Reduced expenditure on Customer Access Network (CAN) from process improvement reducing proactive rehabilitation works and improved performance in meeting customer demand;
- Reduced expenditure on domestic switching and transmission due to a more demand driven program of work, and the inclusion of costs in the half year ended 31 December 2001 as capital which in the half year ended 31 December 2002 have been reclassified as expense ($46 million);
- Spend on international networks increased due to TelstraClear being consolidated for the six months ending 31 December 2002 compared with only one month of consolidation in the half year ended 31 December 2001. This was in part offset by the absence of any capital expenditure in Vietnam in the current period;
- An increase in the number of GSM and CDMA base stations.
Investment expenditure in the half year ended 31 December 2002 was mainly limited to a $15 million Foxtel equity injection. Investment expenditure in the half year ended 31 December 2001 included the TelstraClear acquisition of $40 million and equity injections into Foxtel $28 million and TelstraSaturn $26 million. Foxtel equity injections are lower in the current period due to improved performance.
Corporate Governance and Board Practices
The Telstra board aims for best practice in the area of corporate governance.This section describes the main corporate governance practices in place during the half year ended 31 December 2002.
While the Commonwealth holds more than a 50% share, we will remain subject to various ministerial and other controls to which other publicly listed companies are not subject. This includes a ministerial power to give us written directions that the Communications Minister believes are in the public interest (Section 9 of the Telstra Corporation Act). Within these constraints, the board continues to strive to achieve best corporate governance practice.
The board
The board is accountable to shareholders for the management of the business and affairs of Telstra and delegates responsibility for day-to-day management to the chief executive officer (CEO). The CEO is an executive director and the chairman, the deputy chairman and other members of the board are non-executive directors.
The maximum number of directors provided for by the constitution is thirteen. Telstra currently has twelve directors. A casual vacancy to the board may be filled or an additional director appointed, up to the maximum number of directors, either:
- by the directors after consulting with the Communications Minister; or
- by an ordinary resolution of shareholders.
The tenure of the CEO is linked to his executive office, while one third of all other directors are subject to retirement by rotation each year. Directors who retire by rotation may be re-elected. A director other than the CEO, cannot retain office for more than three calendar years, or beyond the third Annual General Meeting following the director's election, whichever is the longer period, without submitting himself/herself for re-election. A director appointed by the directors is subject to re-election at the next annual general meeting. The board's general policy on board membership for non-executive directors is:
- the maximum retirement age is 72 years; and
- the maximum tenure is 12 years (i.e. four terms of three years).
Non-executive directors' remuneration is determined in accordance with Telstra's constitution.
Directors and board committees are able to obtain professional advice independent of management or Telstra's advisers, at Telstra's cost.
Telstra's share trading policy prohibits directors and senior management (and their associates) from engaging in short-term trading of our securities. This policy also restricts the buying or selling of securities to three "window" periods (between 24 hours and 30 working days following the release of the annual results, the release of the half-yearly results and the close of the annual general meeting) and at such other times as the board permits. In addition, directors and senior management must notify the company secretary before they or their close relatives buy or sell our securities. Changes to the interests of directors in our securities are, as required by law, notified to the ASX.
Furthermore, as required by law, buying or selling of Telstra securities is not permitted at any time by any person who possesses price-sensitive information which is not generally available in relation to those securities.
The Corporations Act and Telstra's constitution require directors to disclose any conflicts of interest and to generally abstain from participating in any discussion or voting on matters in which they have a material personal interest. In addition, the board has developed procedures to be followed by a director who believes he or she may have a conflict of interest or material personal interest in a matter.
The board has a charter that incorporates these board governance policies.
Meetings of the board
The board normally meets for both scheduled meetings and on other occasions to deal with specific matters that require attention between scheduled meetings.
The regular business of the board includes:
- business investments and strategic matters;
- governance and compliance;
- chief executive officer's report;
- financial reports; and
- on a rotational basis, business unit reviews.
The board also liaises with senior management as required and may consult with other Telstra employees and advisers and seek additional information.
Committees of the board
The board also operates through committees that hold responsibility for particular areas. The two main committees are the Audit Committee and the Appointments and Compensations Committee. Each committee operates in accordance with a written charter, operating principles and Telstra's constitution.
Audit Committee is a committee of the board of directors whose primary functions are to:
- assist the board in its oversight of the reliability and integrity of accounting policies and financial reporting and disclosure practices;
- provide advice to the board on financial statements, due diligence, financial systems integrity and business risks to enable the board to fulfil its fiduciary and stewardship obligations; and
- assist the board in establishing and maintaining processes to ensure that there is:
- compliance with all applicable laws, regulations and company policies; and
- an adequate system of internal control, management of business risks and safeguard of assets.
These functions are carried out by:
- reviewing the appropriateness of the accounting principles adopted by management in the composition and presentation of financial reports;
- overseeing the financial reports and the results of the external audit of these reports;
- reviewing the external and internal audit and risk management program and monitoring those results;
- monitoring compliance with a code of conduct covering individual and company ethics that recognises Telstra's business, environmental and statutory responsibilities;
- reviewing, monitoring and assessing the propriety of related party transactions;
- overseeing the establishment and management of risk limits and tolerances across and within the business units and operations of Telstra;
- evaluating the independence of non-executive directors and the external auditor;
- reviewing the external auditor's qualifications and independence; and
- reviewing the performance of the external auditor and the company's internal audit function.
Subject to the role of the Auditor-General (as explained below), the Audit Committee (not management) is also responsible for approving all audit engagement fees and programs, as well as all non-audit engagements by Telstra's external auditors.
Membership of the committee
The Audit Committee is comprised of three or more non-executive directors who are independent of Telstra management and free from any relationship that, in the business judgment of the board, would interfere with the exercise of their independent judgment as a member of the committee. Each member must have a working familiarity with basic finance and accounting practices and at least one member of the committee must have accounting or related financial management expertise.
The members of the Audit Committee are all non-executive directors and, during the half year ended 31 December 2002 were:
- John Stocker (Chairman);
- John Ralph;
- Charles Macek;
- Belinda Hutchinson; and
- Anthony Clark.
Meetings
The Audit Committee meets at least four times per year or more frequently as circumstances require. The quorum for such meetings is two members of the committee. Any other board member may attend such meetings as he or she wishes. The committee may ask management and/or others to attend these meetings and provide such input and advice as required.
Relationship with the external auditor
In accordance with section 36 of the Telstra Corporation Act:
- the auditor of the Telstra group for Australian financial reporting purposes is required by law to be the Auditor-General. The Auditor-General, in consultation with the Telstra Audit Committee and board, subcontracts this work to an accounting firm. The incumbent is Ernst and Young who have had the contract since fiscal 2000; and
- the Audit Committee appoints the external auditor for financial reporting purposes outside of Australia.
The Auditor-General, as auditor of Telstra, owes duties to Telstra and its shareholders as a whole. The Auditor-General also owes statutory duties as an independent officer of the Commonwealth.
The auditor appointed by the Telstra Audit Committee for financial reporting purposes outside Australia is accountable to the board of directors, Audit Committee and shareholders.
Subject to the role of the Auditor-General, the Audit Committee has the responsibility for appointing, evaluating and, where appropriate, replacing the external auditor for filings outside of Australia and for authorising any non-audit engagements of the external auditors.
A number of processes have been put in place to ensure the independence of the external auditor. These include the following:
- Telstra's external auditors must not perform any of the following non-audit services for Telstra:
- bookkeeping services and other services related to preparing Telstra's accounting records or financial statements
- financial information system design and implementation services;
- appraisal or valuation services, fairness opinions, or contribution-in-kind reports;
- actuarial services;
- internal audit services;
- management functions or human resources;
- broker or dealer, investment adviser, or investment banking services; and
- legal services or expert services unrelated to the audit.
All other non-audit services may only be provided if the Audit Committee and the Auditor General have expressly approved the provision of the non-audit service and the performance of the non-audit service will not cause the total annual revenue to the external auditor from non-audit work to exceed the aggregate annual amount of the external auditor's total fees. The Audit Committee must not approve the provision of a non-audit service by the external auditor if the provision of the service would compromise the external auditor's independence.
The Audit Committee requires the external auditor to submit annually to the Audit Committee a formal written statement delineating all relationships between the external auditor and Telstra or any of its controlled entities. The statement includes a report of all audit and non-audit fees billed by the external auditor and a statement of whether the external auditor is satisfied that the provision of the audit and non-audit services is compatible with auditor independence.
The Audit Committee considers whether the external auditor's provision of non-audit services to the company is compatible with maintaining the independence of the external auditor. The Audit Committee also submits annually to the board a formal written report describing any non-audit services rendered by the external auditor during the most recent fiscal year, the fees paid for those non-audit services and explaining why the provision of those non-audit services is compatible with auditor independence. If applicable, the Audit Committee recommends that the board take appropriate action in response to the Audit Committee's report to satisfy itself of the external auditor's independence.
Recurring processes
The Audit Committee is required to, on an annual basis:
- review its charter and operating principles to determine its adequacy for current circumstances and recommend to the board the formal adoption of the revised charter and operating principles for future operations of the Audit Committee;
- meet separately with the internal auditor, the Auditor-General and the external auditor, with and without management, to discuss the results of their audits;
- prepare or consider any report or other disclosures to be included in the company's annual report or other communications to shareholders on the relationships between the external auditors and the company; and
- review with management, the Auditor-General and the external auditor, the financial report to be included in the annual report including:
- the Auditor-General's and the external auditor's responsibilities under generally accepted auditing standards;
- significant accounting policies;
- management judgments and accounting estimates;
- adjustments arising from the audit; and
- the Auditor General's and the external auditor's judgments about the quality, not just the acceptability, of accounting principles as applied in the financial report.
The Appointments and Compensation Committee is a committee of the board of directors whose primary function is to advise the board on matters regarding the composition and remuneration of the board, remuneration and appointment of the CEO and senior management, Telstra remuneration strategies and practices generally and the performance of the CEO.
The members of the Appointments and Compensation Committee are all non-executive directors and, during the half year ended 31 December 2002, were:
- John Ralph;
- Donald McGauchie; and
- Robert Mansfield.
Business values and code of conduct
Guidance is provided to employees on how to deal with business issues through the company values and code of conduct policies. Through these policies the standards of ethical behaviour are reinforced and expected by all employees, which is aimed at understanding and complying with the spirit and letter of legal and regulatory standards. A mandatory ethics training program is run for all employees to reinforce these standards. Assistance is also provided to employees on the application and interpretation of the company values and code of conduct policies through employee help lines.
Business risk
Telstra is committed to the management of risks throughout its operations to protect its employees, the environment, assets, markets, earnings, reputation and shareholder value. The Audit Committee provides advice to the board on the status of business risks to Telstra through an integrated risk management and assurance function.
The risk management and assurance function has promoted a common language and approach used by business units in identifying, measuring and prioritising business risks. The Audit Committee receives reports independently prepared by the Risk Management and Assurance group, on significant business risks and the strategies to manage these risks.
In addition, Telstra uses risk financing techniques including insurance to reduce the financial impact of uncontrollable and catastrophic risks. A central treasury function manages the financial exposures to reduce the volatility of cash flows and asset values arising from interest rate and exchange rate movements in accordance with board approved limits.
Proposed changes
The Audit Committee is committed to continually reviewing and updating its practices. Many new corporate governance requirements and guidance notes have been recently issued by the New York Stock Exchange, the Securities and Exchange Commission and the Australian Stock Exchange. The Board, the Audit Committee and the Appointments and Compensation Committee have evaluated and, where appropriate, implemented these proposals to ensure that we continue to maintain best practice in corporate governance.
Continuous disclosure
We have in place a comprehensive continuous disclosure procedure which is reviewed and updated on a regular basis. The aim of the procedure is to ensure that we release price-sensitive information in a timely fashion to the various stock exchanges on which our shares and debt securities are listed. Our procedure runs as follows:
- ultimate management responsibility for continuous disclosure rests with the CEO and the Chief Financial Officer (CFO). All announcements must be first approved by either the CEO or the CFO;
- the Continuous Disclosure Committee (Committee), chaired by the Group General Counsel, advises the CFO and the CEO on disclosure matters. The Committee is responsible for an internal disclosure system which ensures that information that might be disclosable is identified and reviewed quickly. The Committee's membership includes the Group General Counsel, the Managing Director - Corporate Relations, the General Counsel - Finance and Administration, the Director of Finance, the Director of Legal, the General Manager - Investor Relations Unit and the Company Secretary;
- senior management (including the CEO, the CFO, all other group managing directors and their direct reports, all group controllers and all legal and regulatory counsel) must immediately inform the Committee of any potentially price-sensitive information or proposal as soon as they become aware of it;
- a collective recommendation regarding disclosure is then made to the CFO and the CEO. If the matter is disclosable, an announcement is prepared and immediately sent via the Company Secretary's office electronically to all relevant stock exchanges;
- we implement several practices internally to reinforce the importance of Telstra's continuous disclosure obligations and the need to keep the Committee informed about potentially disclosable matters. These practices are reviewed regularly and include the following:
- every director is made aware of continuous disclosure obligations upon taking office and each member of senior management undertakes training with Telstra's General Counsel - Finance and Administration, in relation to Telstra's continuous disclosure obligations;
- a weekly e-mail is sent to all senior management reminding them to notify the Committee immediately if they become aware of any potentially price-sensitive information or proposals;
- the Committee maintains a list of issues which, although not yet disclosable, are monitored in case they become disclosable;
- all proposed media releases and external speeches and presentations to be made by senior management are reviewed by internal counsel to see if they should be disclosed;
- an internal policy is in place governing communications with and provision of information to shareholders, brokers, analysts and financial media; and
- the office of the Company Secretary maintains a record of all market announcements made.
The announcements are also posted on Telstra's web site telstra.com after market release is confirmed.
Application of critical accounting policies
The consolidated half-year financial statements have been prepared in accordance with accounting principles generally accepted in Australia. The preparation of these financial statements requires management to make estimates and assumptions that affect the reported amounts of assets, liabilities, revenues and expenses and the disclosure of contingent assets and liabilities. We continually evaluate our estimates and judgements including those related to customer incentives, bad debts, inventories, investments, intangible assets, income taxes, financing activities, restructuring costs, retirement benefits, contingencies and litigation. We base our estimates and judgments on historical experience and on various other assumptions we believe to be reasonable under the circumstances. This forms the basis for making judgements about the carrying values of assets and liabilities that are not readily apparent from other sources. Actual results may differ from these estimates under different assumptions.
The accounting policies have been developed over many years as the telecommunications industry and Generally Accepted Accounting Principles or "GAAP" have evolved. As the financial statements are prepared under AGAAP our accounting policies are necessarily compliant with all aspects of AGAAP. AGAAP is based on a 'substance over form' conceptual framework that requires us to look through the legal interpretation of an arrangement or transaction to its underlying purpose and to reflect it in our financial statements on that basis.
In developing accounting policies, in addition to AGAAP requirements, we also consider telecommunications industry practice in other countries. Where there is no conflict with AGAAP we also align our accounting policies with generally accepted accounting principles in the United States (USGAAP). This reduces the number of AGAAP/USGAAP reconciliation differences required to be adjusted in note 11 to our half-year financial statements.
In all material respects the accounting policies are applied consistently across the Telstra group. To the extent that the accounting policies of entities we account for under the equity accounting method differ materially from ours, adjustments are made to the results of those entities, to align them with our accounting policies. The critical accounting policies discussed below generally apply to all segments of the company. Management has discussed the development and selection of these critical accounting policies and estimates with the audit committee of our board of directors.
The following are the critical accounting policies we apply in producing our AGAAP financial statements:
Carrying value of investments, goodwill, and other intangible assets
We assess the carrying value of our investments in controlled entities, associates, partnerships and other investments, including acquired goodwill and other intangible assets, for impairment at least bi-annually. Our assessments vary depending on the nature of the particular investment concerned and generally include methodologies such as discounted cash flow analysis, review of comparable entities' revenue or earnings multiples, or in the case of listed investees, monitoring of share prices. These methodologies sometimes rely on factors such as forecasts of future performance and long-term growth rates of the investee, selection of discount rates and appropriate risk weightings, and determination of appropriate comparable entities and multiples. If these forecasts and assumptions prove to be incorrect, we may be required to write down our investments.
As a result of these assessments, we have written down the carrying value of our investment in Reach which gave rise to a charge of $965 million for the half year ended 31 December 2002. No such write downs occurred during the half year ended 31 December 2001.
As we assess these values bi-annually we believe that as at 31 December 2002 our investments, goodwill and other intangible assets are recoverable at the amounts at which they are stated in our half-year financial statements.
Capitalisation of costs
When we incur costs we classify them as either operating expenses or capital costs. We expense operating expenses to the statement of financial performance as they are incurred. We only capitalise costs where we consider that they will generate future economic benefits. Capital costs are recorded as assets and shown in our statement of financial position based on the asset class considered most appropriate to those costs. Management judgement is used in determining costs to be capitalised in relation to the following major asset categories:
- Deferred expenditure
We defer significant items of expenditure to the extent that they are recoverable from future revenue and will contribute to our future earning capacity. Expenditure is not deferred if it only relates to revenue that has already been recorded. We amortise this deferred expenditure over the average period in which the related benefits are expected to be realised, which is 5 years. Each year we also review expenditure deferred in previous periods to determine the amount, if any, that is no longer recoverable. The amount of deferred expenditure that is no longer recoverable is written off as an expense in the statement of financial performance. Our deferred expenditure after amortisation, including deferred mobile handset subsidies and deferred terminal subsidies, was $719 million at 31 December 2002 and $938 million at 31 December 2001.
- Capitalisation of software assets developed for internal use
We capitalise direct costs associated with the development of network and business software for internal use where we regard the success of a project to be probable. Management apply judgement to assess this probability.
We capitalise costs such as external direct costs of materials and services consumed, payroll and direct payroll-related costs for employees and contractors directly associated with a project and borrowing costs incurred while developing the software.
At 31 December 2002 our capitalised software assets for internal use, after amortisation, were $1,974 million and $1,731 million at 31 December 2001. If management has incorrectly assessed the probability of the success of a project we may be required to write down the value of the software assets we have recorded.
- Constructed property, plant and equipment
The cost of our constructed property, plant and equipment includes purchased materials, direct labour, direct and indirect overheads, and borrowing costs. Indirect overheads and borrowing costs cannot be directly attributed to constructed assets. As a result of this, the allocation of these costs between capital assets and operating expenses involves a degree of management judgement.
Indirect overheads are generally attributable to the construction of assets and do not usually vary with construction activity volumes. Examples of indirect costs include planning and design of construction projects, and the management of construction contracts. Where the role of a part of the work force is predominantly management, design and construction of communication assets, we allocate all indirect overheads associated with the operations and management of that work force to the projects undertaken by them. Where some projects undertaken by an organisational area do not relate to capital projects, indirect overheads are only allocated to capital projects based on the proportion that capital projects make up of the total costs of that organisational area. The remaining costs of that work force are expensed as incurred.
Borrowing costs are capitalised on all assets constructed. We do not specifically borrow to fund construction of assets due to the constant nature of our construction process. As a result the allocation of borrowing costs to these assets is general and does not reflect funds specifically borrowed for each asset.
Refer "Critical accounting policies applied in our USGAAP reconciliation" for discussion on amounts capitalised under USGAAP which have not been capitalised under AGAAP.
Carrying value and depreciation of property, plant and equipment assets and software assets developed for internal use
Property, plant and equipment assets make up 62.7% of our total assets at 31 December 2002 and 61.8% at 31 December 2001. We therefore consider our accounting policies around the carrying value and depreciation of these assets to be critical. We have adopted the cost basis of recording our property, plant and equipment, rather than the fair value basis. We assess the recoverable amounts of our fixed assets bi-annually based on expected future net cash flows discounted to present value. Where assets can be shown to be working together to generate net cash flows, this assessment is performed over the group of assets rather than individually. If our estimates of future cash flows prove to be incorrect we may be required to write down assets in the future. In applying this policy we have not written down property, plant and equipment assets during the half-year ended 31 December 2002.
In addition, we assess the appropriateness of the service lives of our property, plant and equipment assets on an annual basis. This includes a comparison against our service life estimates and international trends for other telecommunications companies. In relation to communications assets this assessment includes a determination of when the asset may be superseded technologically. If our assessments of useful life prove to be incorrect, we may incur either higher or lower depreciation charges in the future, or in certain circumstances be required to write down these assets.
Software developed for internal use is an exception to the above annual revision of service lives. With reference to global industry practice, it was judged that, for administrative simplicity, internally developed software on average would have a useful life of 5 years. We have reviewed this policy and adjusted the useful life of some major systems to periods of between 5 and 10 years. This resulted in a decrease in amortisation expense of $23 million for the six months ended 31 December 2002.
Doubtful debts
We maintain provisions for doubtful debts based on an estimate of the inability of our customers to pay amounts due to us for services rendered to them. These provisions are based on historical trends and management's assessment of general economic conditions. If the financial condition of our customers deteriorates these provisions may not be sufficient and may lead to an increase in bad and doubtful debt expenses. We have no reason to believe that the provisions we have raised will not sufficiently cover bad debts arising out of the receivables we currently have on hand.
Our provision for doubtful debts was $201 million at 31 December 2002 and $208 million at 31 December 2001. Trade debtors were $2,389 million at 31 December 2002 and $2,724 million at 31 December 2001.
Critical accounting policies applied in our USGAAP reconciliation
We disclose our AGAAP/USGAAP reconciliation differences in note 11 to our 31 December 2002 financial statements. The adjustments that we believe have the most significant impact on the USGAAP reconciliation, which we discuss in more detail below, are:
- capitalisation of indirect overheads and borrowing costs prior to 1 July 1996 for property, plant and equipment which we have not capitalised under AGAAP;
- addition of defined benefit plan prepaid pension asset into the statement of financial position and associated retirement benefit gain into the statement of financial performance (asset of $4,154 million as at 31 December 2002 and $73 million gain for the six months ended 31 December 2002);
- the use of Telstra applicable yield curves for the purposes of calculating the fair value of our derivative financial instruments; and
- the use of certain estimates and assumptions concerning the calculation of compensation expense relating to remuneration based share option plans.
Capitalisation of indirect overheads and borrowing costs before 1 July 1996 for property, plant and equipment
Under AGAAP we did not capitalise indirect overheads and borrowing costs pre 1 July 1996. However under USGAAP we were required to retrospectively reflect the policy as if we had always capitalised indirect overheads and borrowing costs. This involved the use of estimation techniques and the reconstructing of records as far back as 1980. Due to the fact that we used estimation techniques to reconstruct the balances, the actual balance may have been greater or less than the adjustment calculated. This impacts the addition to property, plant and equipment adjustment made each year and the resulting annual amortisation expense.
As at 31 December 2002 property, plant and equipment with a net book value of $750 million has been capitalised for USGAAP purposes, which was not capitalised under AGAAP.
Defined benefit plan prepaid pension asset and retirement benefit gain
We engage an actuary to assist in the determination of our prepaid pension asset and retirement benefit gain. The following assumptions are used to calculate the adjustment:
- discount rate;
- rate of increase on salary levels; and
- expected long-term rate of return on assets
There is no requirement under AGAAP to recognise these assets or gains.
Use of Telstra applicable yield curves for the purposes of calculating the fair value of our derivative financial instruments
We are not required to fair value our derivative financial instruments for AGAAP. When we make our USGAAP adjustment we are required to fair value our derivative financial instruments. To perform these calculations we use a market adjusted yield curve to take into consideration the cost of funding for Telstra. We adjust the base curve for Telstra's borrowing margin. If an unadjusted market yield curve was applied this would result in larger adjustments being made.
Use of certain estimates and assumptions concerning the calculation of compensation expense relating to remuneration based share option plans
Under AGAAP we do not expense the fair value of our executive option plans or employee share plans. We are required to expense these.
Our compensation expense is calculated by using various assumptions and variables. For example:
- risk free rates;
- dividend yield;
- expected stock volatility;
- expected life of the options;
- probability that performance hurdles will be met; and
- estimated forfeiture.
Related Party Transactions
The following discussion summarises our significant transactions with related parties, other than our controlled entities.
Reach
Reach, our 50:50 joint venture with PCCW, provides wholesale voice, data and internet connectivity services in the Asia-Pacific region.
We and PCCW have had contractual arrangements with Reach for the provision of voice, data and internet connectivity services since we formed the joint venture. We use these services primarily in connection with our retail international telecommunications business.
We acquire substantial cross-border connectivity services supplied by Reach and expect to continue to require these services to support our domestic business. Without access to these services we would potentially have short to medium term vulnerability.
We and PCCW entered into further arrangements with Reach whereby we committed to substantial purchase levels to the end of December 2002. Reach's prices under these agreements were adjusted to levels we believe were in line with market prices.
In the half year ended 31 December 2002 we recorded expenses of $377 million in relation to the capacity and connectivity services that Reach provides to us. The corresponding amount for the half year ended 31 December 2001 was $394 million. The capacity and connectivity services supplied by Reach were priced in line with market rates. However, the volume of services for which we had committed to pay was substantially greater than our actual usage requirements, with the consequence that a portion of the cost of the excess may not be tax deductible.
During the half year ended 31 December 2002 and 31 December 2001 we recorded revenue of $78 million and $56 million respectively from Reach, mainly in relation to intercarrier services.
We have written down the carrying value of our investment in Reach, which gave rise to a charge of $965 million for the half year ended 31 December 2002.
FOXTEL
FOXTEL, our 50% owned pay television joint venture, uses capacity on our HFC cable network. As part of the partnership arrangements, we are the exclusive longterm supplier of cable distribution services for FOXTEL's pay television services in our cabled areas, and we receive a share of FOXTEL's cable pay television revenues.
The agreement we and FOXTEL entered into in February 2002 enables us to bundle FOXTEL's pay TV service with Telstra's telephone, internet or other services and charge customers for them on a single Telstra bill.
FOXTEL and various SingTel Optus entities (Optus) entered into a content supply agreement in March 2002, which allows Optus to sell a number of FOXTEL pay TV channels on the Optus cable network. This agreement was subject to conditions precedent, and became unconditional in November 2002. Under this agreement FOXTEL has assumed some of Optus' financial obligations under its movie and other content arrangements, commencing from 1 December 2002. Telstra's share of these additional commitments is $195 million. FOXTEL also supplies some Optus content via the FOXTEL platforms. FOXTEL pay TV channels have been available to Optus customers since 1 December 2002.
Telstra and its FOXTEL partners are considering, subject to regulatory approval, transitioning FOXTEL into a fully digital service with more than 120 channels and in time developing opportunities offered by interactive television. We expect this to increase the appeal of FOXTEL and the penetration of Pay TV generally.
IBMGSA
We have a 22.6% interest in IBM Global Services Australia Limited (IBMGSA). We have outsourced our data centre operations and a proportion of our applications maintenance and enhancement activities to IBMGSA for a ten-year period, which commenced in July 1997.
Normalisation Schedule
attached
Quarterly Data
attached
Product Reconciliation
| Telstra Corporation Limited (ABN 033 051 775 556) | ||||||||||||||||||||||
| Half Year Ended 31 December 2002 | ||||||||||||||||||||||
| Normalisation Schedule | ||||||||||||||||||||||
| This schedule details the adjustments made to the reported results for the fiscal of years ended 31 December 2002 and 2001 to arrive at the underlying business performance. | ||||||||||||||||||||||
| $m | Fiscal Half Year Reported Dec 02/03 | A | B | C | D | E | Total Adjust. | Fiscal Half Year Underlying Dec 02/03 | Fiscal Half Year Reported Dec 01/02 | A | A | A | B | C | D | Fiscal Half Year Underlying Dec 01/02 | Reported Growth | Underlying Growth | Underlying M/ment | |||
| TelstraClear | Asset / Investment Sales | Restructuring charges | Diminution | Reach contract exit | TelstraClear | Keycorp | Saturn and T/Clear pre acqu costs | Asset / Investment Sales | Restructuring Costs | Diminution | Total Adjust. | |||||||||||
| PSTN re-balanced products | ||||||||||||||||||||||
| - Basic access | 1,559 | 0 | 1,559 | 1,417 | 0 | 1,417 | 10.0% | 10.0% | 142 | |||||||||||||
| - Local calls | 796 | 0 | 796 | 872 | 0 | 872 | (8.7%) | (8.7%) | (76) | |||||||||||||
| PSTN value added services | 138 | 0 | 138 | 131 | 0 | 131 | 5.3% | 5.3% | 7 | |||||||||||||
| National long distance calls | 582 | 0 | 582 | 611 | 0 | 611 | (4.7%) | (4.7%) | (29) | |||||||||||||
| Fixed to mobile | 753 | 0 | 753 | 707 | 0 | 707 | 6.5% | 6.5% | 46 | |||||||||||||
| International direct | 162 | 0 | 162 | 174 | 0 | 174 | (6.9%) | (6.9%) | (12) | |||||||||||||
| Total PSTN re-balanced products | 3,990 | 0 | 3,990 | 3,912 | 3,912 | 2.0% | 2.0% | 78 | ||||||||||||||
| Mobiles | ||||||||||||||||||||||
| Mobile services | 1,632 | 0 | 1,632 | 1,631 | 0 | 1,631 | 0.1% | 0.1% | 1 | |||||||||||||
| Mobile handsets | 170 | 0 | 170 | 118 | 0 | 118 | 44.1% | 44.1% | 52 | |||||||||||||
| Total Mobiles | 1,802 | 0 | 1,802 | 1,749 | 1,749 | 3.0% | 3.0% | 53 | ||||||||||||||
| Data | 525 | 0 | 525 | 544 | 0 | 544 | (3.5%) | (3.5%) | (19) | |||||||||||||
| ISDN (Access and Calls) | 496 | 0 | 496 | 539 | 0 | 539 | (8.0%) | (8.0%) | (43) | |||||||||||||
| Internet and IP solutions | 389 | 0 | 389 | 275 | 0 | 275 | 41.5% | 41.5% | 114 | |||||||||||||
| Total Data and Internet | 1,410 | 0 | 1,410 | 1,358 | 1,358 | 3.8% | 3.8% | 52 | ||||||||||||||
| Directory services | 731 | 0 | 731 | 698 | 0 | 698 | 4.7% | 4.7% | 33 | |||||||||||||
| Intercarrier services | 593 | 0 | 593 | 568 | 0 | 568 | 4.4% | 4.4% | 25 | |||||||||||||
| Inbound products | 250 | 0 | 250 | 299 | 0 | 299 | (16.4%) | (16.4%) | (49) | |||||||||||||
| Solutions management | 239 | 0 | 239 | 221 | 0 | 221 | 8.1% | 8.1% | 18 | |||||||||||||
| Various controlled entities | 971 | (273) | (273) | 698 | 936 | (39) | (26) | (65) | 871 | 3.7% | (19.9%) | (173) | ||||||||||
| Customer premises equipment | 105 | 0 | 105 | 122 | 0 | 122 | (13.9%) | (13.9%) | (17) | |||||||||||||
| Payphones | 75 | 0 | 75 | 78 | 0 | 78 | (3.8%) | (3.8%) | (3) | |||||||||||||
| Other sales and service | 302 | 0 | 302 | 325 | 0 | 325 | (7.1%) | (7.1%) | (23) | |||||||||||||
| Sales revenue | 10,468 | (273) | 0 | 0 | 0 | 0 | (273) | 10,195 | 10,266 | (39) | (26) | 0 | 0 | 0 | 0 | (65) | 10,201 | 2.0% | (0.1%) | (6) | ||
| Other revenue | 899 | 0 | (788) | (788) | 111 | 279 | 0 | 0 | (125) | (125) | 154 | 222.2% | (27.9%) | (43) | ||||||||
| Total revenue | 11,367 | (273) | (788) | 0 | 0 | 0 | (1,061) | 10,306 | 10,545 | (39) | (26) | 0 | (125) | 0 | 0 | (190) | 10,355 | 7.8% | (0.5%) | (49) | ||
| Expenses | ||||||||||||||||||||||
| Labour | 1,624 | (42) | (125) | (167) | 1,457 | 1,552 | (9) | (13) | (93) | (115) | 1,437 | 4.6% | 1.4% | 20 | ||||||||
| Direct cost of sales | 2,011 | (150) | (65) | (215) | 1,796 | 1,944 | (25) | (6) | (31) | 1,913 | 3.4% | (6.1%) | (117) | |||||||||
| Other expenses | 2,510 | (43) | (594) | (3) | (640) | 1,870 | 1,939 | (6) | (9) | (113) | (26) | (154) | 1,785 | 29.4% | 4.8% | 85 | ||||||
| Expenses before equity acc/depn/amort/interest | 6,145 | (235) | (594) | (125) | (3) | (65) | (1,087) | 5,123 | 5,435 | (40) | (28) | 0 | (113) | (93) | (26) | (300) | 5,135 | 13.1% | (0.2%) | (12) | ||
| Share of net equity accounted losses | 969 | 0 | (965) | 24 | (942) | 27 | 93 | 0 | 0 | (75) | (75) | 18 | 941.9% | 50.0% | 9 | |||||||
| Total operating expenses and share of net equity accounted losses before depn/amort/interest | 7,114 | (235) | (594) | (125) | (968) | (41) | (2,029) | 5,150 | 5,528 | (40) | (28) | (75) | (113) | (93) | (26) | (375) | 5,153 | 28.7% | (0.1%) | (3) | ||
| EBITDA | 4,253 | (38) | (194) | 125 | 968 | 41 | 968 | 5,156 | 5,017 | 1 | 2 | 75 | (12) | 93 | 26 | 185 | 5,202 | (15.2%) | (0.9%) | (46) | ||
| EBITDA excl share of net equity accounted losses | 5,222 | (38) | (194) | 125 | 3 | 65 | 26 | 5,183 | 5,110 | 1 | 2 | 0 | (12) | 93 | 26 | 110 | 5,220 | 2.2% | (0.7%) | (37) | ||
| Depreciation | 1,346 | (58) | (58) | 1,288 | 1,259 | (11) | (1) | (12) | 1,247 | 6.9% | 3.3% | 41 | ||||||||||
| Amortisation (excl goodwill) | 300 | (10) | (10) | 290 | 273 | (1) | (2) | (3) | 270 | 9.9% | 7.4% | 20 | ||||||||||
| Goodwill amortisation | 57 | (2) | (2) | 55 | 42 | (1) | (1) | (2) | 40 | 35.7% | 37.5% | 15 | ||||||||||
| Total depn/amort | 1,703 | (70) | 0 | 0 | 0 | 0 | (70) | 1,633 | 1,574 | (13) | (4) | 0 | 0 | 0 | 0 | (17) | 1,557 | 8.2% | 4.9% | 76 | ||
| Total operating expenses and share of net equity accounted losses before interest | 8,817 | (305) | (594) | (125) | (968) | (41) | (2,099) | 6,783 | 7,102 | (53) | (32) | (75) | (113) | (93) | (26) | (392) | 6,710 | 24.1% | 1.1% | 73 | ||
| EBIT | 2,550 | 32 | (194) | 125 | 968 | 41 | 973 | 3,523 | 3,443 | 14 | 6 | 75 | (12) | 93 | 26 | 202 | 3,645 | (25.9%) | (3.3%) | (122) | ||
| EBIT excl share of net equity accounted losses | 3,519 | 32 | (194) | 125 | 3 | 65 | 96 | 3,550 | 3,536 | 14 | 6 | 0 | (12) | 93 | 26 | 127 | 3,663 | (0.5%) | (3.1%) | (113) | ||
| Net interest | 432 | (50) | (50) | 382 | 350 | (3) | 0 | (3) | 347 | 23.4% | 10.1% | 35 | ||||||||||
| PBT | 2,118 | 82 | (194) | 125 | 968 | 41 | 1,023 | 3,141 | 3,093 | 17 | 6 | 75 | (12) | 93 | 26 | 205 | 3,298 | (31.5%) | (4.8%) | (157) | ||
| Tax (1) | 968 | 0 | (35) | 38 | 10 | 13 | 981 | 992 | 0 | 0 | 6 | 28 | 34 | 1,026 | (2.4%) | (4.4%) | (45) | |||||
| PAT (bef. min int) | 1,150 | 82 | (159) | 87 | 968 | 32 | 1,010 | 2,160 | 2,101 | 17 | 6 | 75 | (18) | 65 | 26 | 171 | 2,272 | (45.3%) | (4.9%) | (112) | ||
| Minority interest | (34) | 34 | 34 | 0 | 3 | 7 | 9 | 16 | 19 | N/M | N/M | (19) | ||||||||||
| PAT | 1,184 | 48 | (159) | 87 | 968 | 32 | 976 | 2,160 | 2,098 | 10 | -3 | 75 | (18) | 65 | 26 | 155 | 2,253 | (43.6%) | (4.1%) | (93) | ||
| Effective tax rate (2) | 45.7% | 31.2% | 32.1% | 31.1% | 13.6% | 0.1% | ||||||||||||||||
| EBITDA margin on sales revenue (2) | 40.6% | 50.6% | 48.9% | 51.0% | (8.3%) | (0.4%) | ||||||||||||||||
| EBIT margin on sales revenue (2) | 24.4% | 34.6% | 33.5% | 35.7% | (9.1%) | (1.1%) | ||||||||||||||||
| Earnings per share (12866.6m shares) | 9.2 | cents | align=right16.8 | 16.3 | 17.5 | (43.6%) | (4.1%) | |||||||||||||||
| (1) Underlying tax calculations represent management's best estimates | ||||||||||||||||||||||
| (2) The reported and underlying percentage growth represents the percentage movement from the prior corresponding period | ||||||||||||||||||||||
| N/M refers to not meaningful | ||||||||||||||||||||||
| Adjustments to derive Underlying results | ||||||||||||||||||||||
| (A) New Business Ventures | ||||||||||||||||||||||
| The effects of new business ventures for non comparable periods have been removed from reported results. TelstraClear has been excluded in fiscal 2003 half year and fiscal 2002 half year, and Keycorp and Saturn excluded from fiscal 2002 half year. (The results are net of any asset/investments sales, dimunition and restructuring charges as these are reflected in the columns B, C and D) | ||||||||||||||||||||||
| A controlling interest in Keycorp was acquired in December 2000 and consolidated its results from 1 January 2001. On June 28, 2002 control was relinquished and Keycorp results are no longer consolidated. | ||||||||||||||||||||||
| In December 2001 Telstra increased ownership in TelstraSaturn and began consolidating its results. At the same time TelstraSaturn acquired Clear Communications and was renamed to TelstraClear. TelstraClear net interest adjustment of $50m represented by $19m incurred for the closeout of external loans, and the remaining $31m represents Telstra treasury financing costs required to raise and hedge $1.2b of NZD loans." In December 2001 Telstra increased ownership in TelstraSaturn and began consolidating its results. At the same time TelstraSaturn acquired Clear Communications and was renamed to TelstraClear. TelstraClear net interest adjustment of $50m represented by $19m incurred for the closeout of external loans, and the remaining $31m represents Telstra treasury financing costs required to raise and hedge $1.2b of NZD loans. | ||||||||||||||||||||||
| 31 December 2002 | 31 December 2001 | |||||||||||||||||||||
| (B) Asset Sales ($m) | Tax Effect | Profit | (B) Asset Sales ($m) | Tax Effect | Profit | |||||||||||||||||
| Proceeds | NBV | Profit | @30% | after | Proceeds | NBV | Profit | @30% | after | |||||||||||||
| Investments | if applicable | tax | Investments | if applicable | tax | |||||||||||||||||
| Mobitel | 17 | 12 | 5 | 0 | 5 | Sausage shares | 6 | 5 | 1 | 0 | 1 | |||||||||||
| DataOne | 3 | 0 | 3 | 0 | 3 | Sausage options | 4 | 4 | 0 | 0 | 0 | |||||||||||
| New Skies - partial sale | 6 | 10 | (4) | 0 | (4) | New Skies | 10 | 9 | 1 | 0 | 1 | |||||||||||
| Various | 1 | 0 | 1 | 0 | 1 | |||||||||||||||||
| Sale of listed and other investments | 27 | 22 | 5 | 0 | 5 | Sale of listed and other investments | 20 | 18 | 2 | 0 | 2 | |||||||||||
| Sale of PABX business | 2 | (6) | 8 | 0 | 8 | Sale of PABX business | 29 | 2 | 27 | 0 | 27 | |||||||||||
| Sale of Cambodian Internet Business | 2 | 0 | 2 | 0 | 2 | |||||||||||||||||
| Total Investment sales | 31 | 16 | 15 | 0 | 15 | Total Investment sales | 49 | 20 | 29 | 0 | 29 | |||||||||||
| Property sales | 680 | 510 | 170 | 11 | 159 | |||||||||||||||||
| Fleet | 20 | 22 | -2 | -1 | -1 | PC Lease | 23 | 24 | (1) | 0 | (1) | |||||||||||
| Other Plant and Equipment | 57 | 46 | 11 | 25 | -14 | Asset sales | 53 | 69 | (16) | (6) | (10) | |||||||||||
| Total Asset sales | 757 | 578 | 179 | 35 | 144 | Total Asset sales | 76 | 93 | (17) | (6) | (11) | |||||||||||
| Total Asset/Investment Sales | 788 | 594 | 194 | 35 | 159 | Total Asset/Investment Sales | 125 | 113 | 12 | (6) | 18 | |||||||||||
| (C) Restructuring Costs | ||||||||||||||||||||||
| We incurred restructuring costs for employee redundancies of $125 million in fiscal 2003 half year and $93 million in fiscal 2002 half year. | ||||||||||||||||||||||
| (D) Diminution ($m) | Diminution | Associates | Total | (D) Diminution ($m) | Diminution | |||||||||||||||||
| Solution 6 | 9 | |||||||||||||||||||||
| PT Mitra | 3 | 3 | Corprocure | 7 | ||||||||||||||||||
| Reach | 965 | 965 | CPI Card Group (Keycorp investment) | 9 | ||||||||||||||||||
| Sausage shares | 1 | |||||||||||||||||||||
| Total | 3 | 965 | 968 | Total | 26 | |||||||||||||||||
| (E) Reach contract exit ($m) | ||||||||||||||||||||||
| Contract exit payments made to Reach Ltd | -65 | |||||||||||||||||||||
| Reach equity accounted losses reflecting the exit payments | 24 | |||||||||||||||||||||
| Total | -41 | |||||||||||||||||||||
| (G) Tax rate Change | ||||||||||||||||||||||
| From 1 July 2001 the Company tax rate reduced to 30%. This adjustment restates the deferred tax balances at 30 June 2001 to 30%. | ||||||||||||||||||||||
| Telstra Corporation Limited (ABN 033 051 775 556) |
| Half Year Ended 31 December 2002 |
| Summary Underlying1 Quarterly Data | Q1 | QTR PCP Growth | Q2 | QTR PCP Growth | Half 1 YTD | YTD PCP Growth | Q3 | QTR PCP Growth | Q3 YTD | YTD PCP Growth | Q4 QTR | QTR PCP Growth | FY | YTD PCP Growth | Q1 Actual | QTR PCP2 Growth | Q2 Actual | QTR PCP2 Growth | Half Actual | YTD PCP2 Growth |
| Sep-01 | Sep-01 | Dec-01 | Dec-01 | Dec-01 | Dec-01 | Mar-02 | Mar-02 | Mar-02 | Mar-02 | Jun-02 | Jun-02 | Jun-02 | Jun-02 | Sep-02 | Sep-02 | Dec-02 | Dec-02 | Dec-02 | Dec-02 | |
| PSTN re-balanced products | ||||||||||||||||||||
| - Basic access | 694 | 11.6% | 723 | 21.5% | 1,417 | 16.4% | 719 | 14.5% | 2,136 | 15.8% | 744 | 14.6% | 2,880 | 15.5% | 765 | 10.2% | 794 | 9.8% | 1,559 | 10.0% |
| - Local calls | 446 | -9.0% | 426 | -10.7% | 872 | -9.8% | 385 | -13.3% | 1,257 | -10.9% | 386 | -11.9% | 1,643 | -11.1% | 398 | -10.8% | 398 | -6.6% | 796 | -8.7% |
| - PSTN value added services | 66 | 3.1% | 65 | -4.4% | 131 | -0.8% | 66 | 0.0% | 197 | -0.5% | 64 | -1.5% | 261 | -0.8% | 68 | 3.0% | 70 | 7.7% | 138 | 5.3% |
| - National long distance | 304 | -9.5% | 307 | -10.0% | 611 | -9.7% | 307 | -7.8% | 918 | -9.1% | 298 | -5.7% | 1,216 | -8.3% | 285 | -6.3% | 297 | -3.3% | 582 | -4.7% |
| - Fixed to mobile | 345 | 10.6% | 362 | 13.1% | 707 | 12.0% | 354 | 7.6% | 1,061 | 10.5% | 358 | 9.5% | 1,419 | 10.3% | 371 | 7.5% | 382 | 5.5% | 753 | 6.5% |
| - International direct | 87 | -1.1% | 87 | -2.2% | 174 | -1.7% | 81 | -4.7% | 255 | -2.7% | 81 | -3.6% | 336 | -2.9% | 81 | -6.9% | 81 | -6.9% | 162 | -6.9% |
| Total PSTN re-balanced products | 1,942 | 1.6% | 1,970 | 4.2% | 3,912 | 2.9% | 1,912 | 1.4% | 5,824 | 2.4% | 1,931 | 2.8% | 7,755 | 2.5% | 1,968 | 1.3% | 2,022 | 2.6% | 3,990 | 2.0% |
| Mobiles | ||||||||||||||||||||
| - Mobile services | 794 | 12.3% | 837 | 14.0% | 1,631 | 13.2% | 786 | 6.2% | 2,417 | 10.8% | 825 | 8.7% | 3,242 | 10.3% | 817 | 2.9% | 815 | -2.6% | 1,632 | 0.1% |
| - Mobile handsets | 44 | -15.4% | 74 | 23.3% | 118 | 5.4% | 50 | 0.0% | 168 | 3.7% | 58 | 16.0% | 226 | 6.6% | 69 | 56.8% | 101 | 36.5% | 170 | 44.1% |
| Total Mobiles | 838 | 10.4% | 911 | 14.7% | 1,749 | 12.6% | 836 | 5.8% | 2,585 | 10.3% | 883 | 9.1% | 3,468 | 10.0% | 886 | 5.7% | 916 | 0.5% | 1,802 | 3.0% |
| Data and Internet | ||||||||||||||||||||
| - Data | 276 | -8.0% | 268 | -18.8% | 544 | -13.7% | 243 | -13.2% | 787 | -13.5% | 263 | -4.0% | 1,050 | -11.3% | 263 | -4.7% | 262 | -2.2% | 525 | -3.5% |
| - ISDN (Access and Calls) | 277 | -3.1% | 262 | -5.4% | 539 | -4.3% | 253 | -7.0% | 792 | -5.1% | 245 | -5.8% | 1,037 | -5.3% | 255 | -7.9% | 241 | -8.0% | 496 | -8.0% |
| - Internet and IP solutions | 130 | 21.5% | 145 | 43.6% | 275 | 31.6% | 150 | 64.8% | 425 | 41.7% | 180 | 40.6% | 605 | 41.4% | 190 | 46.2% | 199 | 37.2% | 389 | 41.5% |
| Total Data and Internet | 683 | -1.4% | 675 | -4.7% | 1,358 | -3.1% | 646 | 0.5% | 2,004 | -2.0% | 688 | 3.9% | 2,692 | -0.6% | 708 | 3.7% | 702 | 4.0% | 1,410 | 3.8% |
| Directory services | 149 | 3.5% | 549 | -2.0% | 698 | -0.7% | 179 | 2.3% | 877 | -0.1% | 258 | 9.8% | 1,135 | 2.0% | 169 | 13.4% | 562 | 2.4% | 731 | 4.7% |
| Intercarrier service | 278 | 15.4% | 290 | 3.2% | 568 | 8.6% | 273 | -16.5% | 841 | -1.1% | 283 | -9.0% | 1,124 | -3.2% | 300 | 7.9% | 293 | 1.0% | 593 | 4.4% |
| Inbound products | 152 | -17.4% | 147 | -6.4% | 299 | -12.3% | 141 | -17.1% | 440 | -13.9% | 122 | -17.0% | 562 | -14.6% | 126 | -17.1% | 124 | -15.6% | 250 | -16.4% |
| Solutions management | 111 | 22.0% | 110 | -0.9% | 221 | 9.4% | 107 | 8.1% | 328 | 9.0% | 150 | 18.1% | 478 | 11.7% | 114 | 2.7% | 125 | 13.6% | 239 | 8.1% |
| Various controlled entities (Excl CSL) | 140 | -29.3% | 154 | -11.0% | 294 | -21.0% | 142 | -15.0% | 436 | -19.1% | 138 | -2.8% | 574 | -15.7% | 119 | -15.0% | 95 | -38.3% | 214 | -27.2% |
| Hong Kong CSL (2) | - | - | - | - | - | - | - | - | - | - | - | - | - | - | 244 | -17.0% | 240 | -15.0% | 484 | -16.1% |
| Customer premises equipment | 51 | -29.2% | 71 | -1.4% | 122 | -14.7% | 43 | -36.8% | 165 | -21.8% | 55 | -12.7% | 220 | -19.7% | 52 | 2.0% | 53 | -25.4% | 105 | -13.9% |
| Payphones | 38 | -13.6% | 40 | 0.0% | 78 | -7.1% | 39 | -9.3% | 117 | -7.9% | 37 | -5.1% | 154 | -7.2% | 37 | -2.6% | 38 | -5.0% | 75 | -3.8% |
| Other sales and service | 139 | -4.8% | 187 | 10.0% | 325 | 2.8% | 120 | 8.1% | 445 | 4.2% | 162 | 35.0% | 607 | 11.0% | 145 | 4.3% | 157 | -16.0% | 302 | -7.1% |
| Sales revenue | 4,521 | 0.8% | 5,104 | 3.0% | 9,624 | 1.9% | 4,438 | -0.9% | 14,062 | 1.0% | 4,707 | 3.8% | 18,769 | 1.7% | 4,868 | 1.1% | 5,327 | -1.1% | 10,195 | -0.1% |
| Other revenue (excluding Interest) | 100 | 78.6% | 54 | -34.1% | 154 | 12.0% | 51 | -14.2% | 205 | 4.1% | 87 | 13.0% | 292 | 6.6% | 54 | -46.0% | 57 | 5.6% | 111 | -27.9% |
| Total revenue | 4,621 | 1.8% | 5,158 | 2.4% | 9,778 | 2.1% | 4,489 | -1.1% | 14,267 | 1.1% | 4,794 | 4.0% | 19,061 | 1.8% | 4,922 | 0.1% | 5,384 | -1.0% | 10,306 | -0.5% |
| Selected statistical data (3) | ||||||||||||||||||||
| Basic access lines in service | 10.44 | -1.0% | 10.40 | -0.9% | 10.40 | -0.9% | 10.43 | -0.6% | 10.43 | -0.6% | 10.41 | -0.6% | 10.41 | -0.6% | 10.39 | -0.6% | 10.34 | -0.6% | 10.34 | -0.6% |
| Local calls (number of calls) | 2,629 | -3.4% | 2,617 | -3.4% | 5,246 | -3.4% | 2,501 | -5.2% | 7,748 | -4.0% | 2,521 | -4.0% | 10,269 | -4.0% | 2,527 | -3.9% | 2,491 | -4.8% | 5,019 | -4.3% |
| National long distance minutes | 2,270 | -0.8% | 2,308 | 0.1% | 4,578 | -0.4% | 2,285 | 1.1% | 6,863 | 0.1% | 2,307 | 3.6% | 9,170 | 1.0% | 2,346 | 3.4% | 2,310 | 0.1% | 4,656 | 1.7% |
| Fixed to mobile minutes | 897 | 14.4% | 936 | 14.5% | 1,833 | 14.5% | 919 | 10.4% | 2,752 | 13.1% | 939 | 12.8% | 3,691 | 13.0% | 970 | 8.1% | 985 | 5.3% | 1,955 | 6.7% |
| International direct minutes | 196 | 15.5% | 203 | 14.1% | 398 | 14.5% | 192 | 14.5% | 591 | 14.7% | 191 | 7.5% | 782 | 12.9% | 191 | -2.7% | 196 | -3.7% | 387 | -2.9% |
| Mobile telephone minutes | 1,422 | 6.5% | 1,489 | 12.5% | 2,911 | 9.5% | 1,414 | 7.9% | 4,325 | 8.9% | 1,455 | 11.3% | 5,780 | 9.5% | 1,518 | 6.8% | 1,580 | 6.1% | 3,098 | 6.4% |
| Mobile services in operation (thousands) | 5,414 | 23.2% | 5,636 | 20.1% | 5,636 | 20.1% | 5,790 | 17.6% | 5,790 | 17.6% | 5,942 | 14.8% | 5,942 | 14.8% | 5,884 | 8.7% | 6,098 | 8.2% | 6,098 | 8.2% |
| ISDN access (basic lines equivalents) (thousands) | 1,242 | 12.0% | 1,245 | 6.0% | 1,245 | 6.0% | 1,228 | 1.8% | 1,228 | 1.8% | 1,268 | 2.7% | 1,268 | 2.7% | 1,225 | -1.3% | 1,190 | -4.5% | 1,190 | -4.5% |
| Narrowband subscribers | 972 | 59.9% | 1,047 | 57.2% | 1,047 | 57.2% | 1,081 | 45.8% | 1,081 | 45.8% | 1,075 | 22.6% | 1,075 | 20.8% | 1,105 | 15.4% | 1,124 | 7.4% | 1,124 | 7.4% |
| Broadband subscribers | 93 | 168.6% | 110 | 150.0% | 110 | 150.0% | 128 | 120.6% | 128 | 120.6% | 166 | 112.9% | 166 | 113.1% | 197 | 120.1% | 222 | 101.1% | 222 | 101.1% |
| Total On-line subscribers (thousands) | 1,066 | 65.8% | 1,157 | 63.0% | 1,157 | 63.0% | 1,209 | 51.3% | 1,209 | 51.3% | 1,241 | 30.0% | 1,241 | 28.2% | 1,302 | 24.4% | 1,346 | 16.3% | 1,346 | 16.3% |
| A party calls | 234 | -0.8% | 233 | 1.2% | 466 | 0.2% | 222 | -4.9% | 688 | -1.5% | 231 | -0.6% | 919 | -1.3% | 230 | -1.3% | 232 | -0.5% | 462 | -0.9% |
| B party minutes | 905 | -11.2% | 855 | -11.1% | 1,759 | -11.1% | 831 | -14.6% | 2,590 | -12.3% | 755 | -17.8% | 3,345 | -13.6% | 684 | -24.4% | 660 | -22.8% | 1,343 | -23.6% |
| 1. Underlying numbers exclude Telstra Clear, Keycorp, and Asset and Investment Sales | ||||||||||||||||||||
| 2. Hong Kong CSL has been excluded from underlying revenue in fiscal 2001/2002 as it was acquired in February 2001, and as such the periods 2000/2001 and 2001/2002 are non comparable | ||||||||||||||||||||
| 3. Statistical data is represented in millions unless otherwise stated | ||||||||||||||||||||
| Telstra Corporation Limited (ABN 033 051 775 556) | |||||||
| Half Year Ended 31 December 2002 | |||||||
| Product reconciliation to align comparative figures with the reported format for half year ended 31 December 2001 | |||||||
| Underlying1 | Underlying1 | ||||||
| previously | New Hierarchy | ||||||
| released | |||||||
| Dec-01 | Dec-01 | Movement | Amount | Amount | |||
| $m | $m | $m | Included | $m | Excluded | $m | |
| PSTN re-balanced products | |||||||
| Basic access | 1,343 | 1,417 | 74 | Faxstream | 77 | Miscellaneous | 3 |
| Local calls | 1,023 | 872 | (151) | Faxstream | 39 | Inbound A party | 106 |
| Misc | 4 | Local Call VAS (call number display, call return etc) | 88 | ||||
| PSTN value added services | - | 131 | 131 | Local Call VAS | 88 | ||
| Fixed Line Voicemail | 25 | ||||||
| Silent Line | 17 | ||||||
| Misc | 1 | ||||||
| National long distance calls | 588 | 611 | 23 | Faxstream | 23 | ||
| Fixed to mobile | 707 | 707 | - | ||||
| International direct | 216 | 174 | (42) | Faxstream | 3 | International Operator Assisted Calls | 22 |
| Telecard | 17 | ||||||
| International VPN | 6 | ||||||
| Total PSTN re-balanced products | 3,877 | 3,912 | 35 | ||||
| Mobiles | |||||||
| Mobile services | 1,631 | 1,631 | - | ||||
| Mobile handsets | 122 | 118 | (4) | ||||
| Total Mobiles | 1,753 | 1,749 | (4) | Misc | 4 | ||
| Data and Internet | |||||||
| Data | - | 544 | 544 | ||||
| ISDN (Access and Calls) | - | 539 | 539 | ||||
| Internet and IP solutions | - | 275 | 275 | ||||
| Total Data and Internet | 1,580 | 1,358 | (222) | Faxstream | 142 | ||
| Customnet Spectrum | 60 | ||||||
| Corp VPN | 19 | ||||||
| Misc | 1 | ||||||
| Directory services | 714 | 698 | (16) | Misc | 1 | Silent Line | 17 |
| Intercarrier services | 568 | 568 | - | ||||
| Inbound products | 193 | 299 | 106 | Inbound A party calls | 106 | ||
| Solutions management | 162 | 221 | 59 | Radio services | 33 | ||
| Internetwork Management Services | 19 | ||||||
| Misc | 7 | ||||||
| Various controlled entities | 286 | 871 | 585 | HK CSL not included in prior year underlying1 base | 577 | ||
| Misc | 8 | ||||||
| Customer premises equipment | 125 | 122 | (3) | Misc | 3 | ||
| Payphones | 78 | 78 | - | ||||
| Other sales and service | 289 | 325 | 36 | Customnet Spectrum | 60 | Radio Services | 33 |
| Corp VPN | 19 | Internetwork Management Services | 19 | ||||
| Telecard | 17 | Fixed Line Voicemail | 25 | ||||
| International VPN | 6 | Misc | 11 | ||||
| International Operator Assisted Calls | 22 | ||||||
| Sales revenue | 9,625 | 10,201 | 576 | HK CSL not included in prior year underlying1 base | 577 | Misc | 1 |
| Other revenue | 154 | 154 | - | ||||
| Total revenue | 9,779 | 10,355 | 576 | HK CSL not included in prior year underlying1 base | 577 | Misc | 1 |
| 1 Underlying numbers exclude TelstraClear, Keycorp, and Asset and Investment sales | |||||||
| 575 | 578 | ||||||
27 February 2002 61/2003
Strong cash flow and capital management delivers increased dividends
Telstra today announced a one-off special dividend of 3 cents per share for its 1.8 million shareholders as a result of cash received from the sale of a portfolio of properties in 2002.
Telstra also announced that its ordinary interim dividend increased to 12 cents from 11 cents in the prior corresponding half, bringing the total declared payment to shareholders for the half to $1.9 billion, an increase of 36 per cent.
Both dividends will be fully franked at a tax rate of 30 percent. The dividends will have a record date of 21 March, 2003 with payment to be made on 30 April, 2003.
Telstra's delivery of the increased dividend comes as the company reported that total free cash flow grew by 54 percent ($743 million) to $2.1 billion in the six months to 31 December 2002 as a result of cash received from the sale of properties, careful capital and cash management, improved company operating activities, a sustainable decrease in capital expenditure.
Telstra Chief Executive Officer, Dr Ziggy Switkowski, said that on a normalised basis, Telstra's results show that after adjusting for one off items, its sales revenue for the half declined by 0.1 percent to $10.2 billion, with total revenue excluding interest decreasing by 0.5 percent to $10.3 billion.
Telstra's underlying operating expenses, before depreciation, amortisation, and borrowing costs decreased by 0.1 percent to $5.2 billion, and total underlying expenses before borrowing costs increased 1.1 percent to $6.8 billion.
This resulted in underlying earnings before interest and tax being $3.5 billion compared to the 2001 figure of $3.6 billion, a decrease of 3.3 percent over the previous half year.
Dr Switkowski said the underlying revenue result was flat, as predicted, and this was expected to continue into the second half. He said that year end underlying EBIT is forecast to be similar to the figure for the previous 2001/2002 year.
He said core domestic operating capital expenditure had declined by $136 million to $1.6 billion and the expected full year investment would be approximately $3.3 billion.
Telstra reported profit after tax and minorities of $1.184 billion for the half represented a decrease of 43.6 percent over the prior corresponding period due to the recent write down of the investment in Reach of $965 million. Telstra's reported revenues increased 7.8 percent to $11.4 billion.
"On the formation of Reach Telstra recorded a profit on the sale of its global wholesale business of $1.7 billion and received cash of $680 million as part of recapitalisation. After taking account of the write down of $965 million and the cash contributed to Reach to date, Telstra is cash positive on this transaction," Dr Switkowski said.
In addition, Dr Switkowski said Telstra had many operational highlights in the period, including substantial service improvements especially in connections and fault restorations in rural and remote areas, the bundling of Foxtel with Telstra services, the launch of 1x wireless data, and the continuing roll out of Broadband services nationally.
"The responses to floods, fires, and tragedies by Telstra people has been quite magnificent, and our service to customers has gone from strength to strength. This will continue to improve as we strive to earn the continuing support and trust of all Australians," Dr Switkowski said.
"The first report under the Government's new regulation known as Network Reliability Framework shows that more than 99 percent of all services covered by the Customer Service Guarantee experienced no faults in January," he said.
Media inquiries
Stephen Morrison
Media Relations Manager
03 9634 5611
Mobile: 0417 053 501
stephen.morrison@team.telstra.com
Telstra Media Releases are regularly posted on the Telstra newsroom:
http://www.telstra.com.au/newsroom
| Telstra Corporation Limited and controlled entities |
| Australian Business Number (ABN): 33 051 775 556 |
| Half-Year Financial Report | ||||
| for the half-year ended 31 December 2002 | ||||
| Page number | ||||
| Half-Year Financial Statements | ||||
| Statement of Financial Performance | 2 | |||
| Statement of Financial Position | 3 | |||
| Statement of Cash Flows | 4 | |||
| Statement of Changes in Shareholders' Equity | 7 | |||
| Notes to the Half-Year Financial Statements | ||||
| Note 1 | - Summary of accounting policies | 9 | ||
| Note 2 | - Profit from ordinary activities | 12 | ||
| Note 3 | - Items requiring specific disclosure | 13 | ||
| Note 4 | - Income tax expense | 15 | ||
| Note 5 | - Dividends | 16 | ||
| Note 6 | - Segment information | 17 | ||
| Note 7 | - Share of net losses of associates and joint venture entities | 21 | ||
| Note 8 | - Investment changes | 23 | ||
| Note 9 | - Contingent liabilities and contingent assets | 25 | ||
| Note 10 | - Events after balance date | 26 | ||
| Note 11 | - United States generally accepted accounting principles disclosures | 27 | ||
| Directors' Declaration | 32 | |||
| Independent Review Report | 33 | |||
Statement of Financial Performance for the half-year ended 31 December 2002
| Telstra Group | ||
|---|---|---|
| Half-year ended 31 December | ||
| 2002 | 2001 | |
| Note | $m | $m |
| Ordinary activities | ||
| Revenue | ||
| Sales revenue | 10,468 | 10,266 |
| Other revenue (excluding interest revenue) 3 | 899 | 279 |
| 11,367 | 10,545 | |
| Expenses | ||
| Labour | 1,624 | 1,552 |
| Direct cost of sales | 2,011 | 1,944 |
| Other expenses 3 | 2,510 | 1,939 |
| 6,145 | 5,435 | |
| Share of net losses of associates and joint venture entities 3,7 | 969 | 93 |
| 7,114 | 5,528 | |
| Earnings before interest, income tax expense, depreciation and amortisation (EBITDA) | 4,253 | 5,017 |
| Depreciation and amortisation | 1,703 | 1,574 |
| Earnings before interest and income tax expense (EBIT) | 2,550 | 3,443 |
| Interest revenue 2 | 39 | 67 |
| Borrowing costs 2 | 471 | 417 |
| Net borrowing costs | 432 | 350 |
| Profit before income tax expense 2 | 2,118 | 3,093 |
| Income tax expense 4 | 968 | 992 |
| Net profit | 1,150 | 2,101 |
| Outside equity interests in net (profit)/loss | 34 | (3) |
| Net profit available to Telstra Entity shareholders | 1,184 | 2,098 |
| Other valuation adjustments to equity | ||
| Net exchange differences on translation of non-Australian controlled entities' financial statements | (10) | (9) |
| Reserves recognised on equity accounting our interest in associates and joint ventures | 5 | (2) |
| Fair value reserve recognised on acquisition of controlling interest in joint venture entity | (1) | - |
| Adjustment to opening retained earnings due to change in accounting standard | 1,415 | - |
| Valuation adjustments available to Telstra Entity shareholders and recognised directly in equity | 1,409 | (11) |
| Total changes in equity other than those resulting from transactions with Telstra Entity shareholders as owners | 2,593 | 2,087 |
| cents | cents | |
| Interim dividends per share (cents) | ||
| - ordinary dividend 5,10 | 12.0 | 11.0 |
| - special dividend 5,10 | 3.0 | - |
| Total interim dividends per share | 15.0 | 11.0 |
| Basic and diluted earnings per share (cents) | 9.2 | 16.3 |
The notes following the half-year financial statements form part of the half-year financial report.
Statement of Financial Position as at 31 December 2002
| Telstra Group | |||||
|---|---|---|---|---|---|
| as at | |||||
| 31 Dec | 30 June | 31 Dec | |||
| 2002 | 2002 | 2001 | |||
| Note | $m | $m | $m | ||
| Current assets | |||||
| Cash assets | 1,365 | 1,070 | 652 | ||
| Receivables 3 Inventories | 3,875 | 4,063 | 3,930 | ||
| 252 | 204 | 286 | |||
| Other assets Total current assets | 553 | 1,038 | 656 | ||
| 6,045 | 6,375 | 5,524 | |||
| Non current assets | |||||
| Receivables 3 | 1,618 | 1,341 | 2,567 | ||
| Inventories | 6 | 20 | 22 | ||
| Investments - accounted for using the equity method 3 | 240 | 1,197 | 1,084 | ||
| Investments - other | 97 | 105 | 111 | ||
| Property, plant and equipment | 23,068 | 23,421 | 23,699 | ||
| Future income tax benefit | 60 | 132 | 95 | ||
| Intangible assets | 3,304 | 3,421 | 3,063 | ||
| Other assets | 2,375 | 2,206 | 2,171 | ||
| Total non current assets | 30,768 | 31,843 | 32,812 | ||
| Total assets | 36,813 | 38,218 | 38,336 | ||
| Current liabilities | |||||
Payables Interest - bearing liabilities 3 Income tax payable Provisions 3 Revenue received in advance Total current liabilities | 2,377 | ||||
Interest - bearing liabilities 3
Income tax payable
Deferred income tax
Provisions
Revenue received in advance
Total non current liabilities
Total liabilities
Net assets
Contributed equity (12,866,600,200 shares of 50 cents each)
Reserves
Retained profits
Shareholders' equity available to Telstra Entity shareholders
Contributed equity
Reserves
Accumulated losses
Total outside equity interests
Total shareholders' equity
The notes following the half-year financial statements form part of the half-year financial report.
Statement of Cash Flows for the half-year ended 31 December 2002
| Telstra Group | ||
|---|---|---|
| Half-year ended 31 December | ||
| 2002 | 2001 | |
| $m | $m | |
| Cash flows from operating activities | ||
| Receipts from trade and other receivables (inclusive of goods and services tax (GST) (ii)) | 11,356 | 11,003 |
| Payments of accounts payable and to employees (inclusive of GST (ii)) | (6,513) | (6,356) |
| Interest received | 27 | 37 |
| Borrowing costs paid | (529) | (476) |
| Dividends received | 1 | 4 |
| Income taxes paid | (839) | (893) |
| GST remitted to the Australian Taxation Office (ATO) (net) | (552) | (463) |
| Net cash provided by operating activities | 2,951 | 2,856 |
| Cash flows from investing activities | ||
| Payments for: | ||
| - property, plant and equipment | (1,231) | (1,391) |
| - internal use software assets | (297) | (269) |
| - patents, trademarks and licences | (2) | - |
| - deferred expenditure | - | (2) |
| Capital expenditure (before investments) | (1,530) | (1,662) |
| - shares in controlled entities | - | (45) |
| - investment in joint venture entities | (15) | (53) |
| - shares in listed securities and in other investments | (1) | (2) |
| Investment expenditure | (16) | (100) |
| Total capital expenditure | (1,546) | (1,762) |
| Proceeds from: | ||
| - sale of property, plant and equipment | 692 | 76 |
| - sale of shares in controlled entities | 5 | - |
| - sale of joint venture entities | 3 | - |
| - sale of listed securities and in other investments | 7 | 174 |
| - sale of business | 4 | 29 |
| Net cash used in investing activities | (835) | (1,483) |
| Cash flows from financing activities | ||
| Proceeds from: | ||
| - borrowings | 4,302 | 8,710 |
| - Telstra bonds | - | 494 |
| Repayment of: | ||
| - borrowings (iv) | (4,129) | (9,593) |
| - Telstra bonds | (581) | (38) |
| - finance leases principal amount | (14) | (7) |
| Employee share loans | 19 | 20 |
| Dividends paid | (1,415) | (1,415) |
| Net cash used in financing activities | (1,818) | (1,829) |
| Net increase/(decrease) in cash | 298 | (456) |
| Foreign currency conversion | (3) | - |
| Cash at the beginning of the period | 1,070 | 1,067 |
| Cash at the end of the period (i) | 1,365 | 611 |
The notes following the half-year financial statements form part of the half-year financial report.
Cash flow notes
(i) Cash at the end of the period as shown in the statement of cash flows agrees to the net amount of the following items:
| Telstra Group | |||
|---|---|---|---|
| As at 31 December | |||
| 2002 | 2001 | ||
| $m | $m | ||
| Cash | 1,365 | 652 | |
| Bank overdraft | - | (41) | |
| 1,365 | 611 | ||
(ii) Goods and Services Tax (GST) and other like taxes
Our receipts from trade and other receivables includes estimated GST of $1,002 million (2001: $932 million) collected by us as agent for the ATO. Our payments of accounts payable and to employees include estimated GST payments made by us for goods and services obtained in undertaking both operating and investing activities. Estimated GST paid associated with operating activities amounted to $308 million (2001: $302 million) and estimated GST paid in relation to investing activities amounted to $142 million (2001: $167 million).
(iii) Financing and investing activities that involve components of non cash
Property, plant and equipment
Our property, plant and equipment includes capitalised borrowing costs of $38 million for the half-year ended 31 December 2002 (2001: $38 million). This amount has been reclassified into cash flows from operating activities.
Software assets (internal use software assets)
Our software assets developed for internal use include capitalised borrowing costs of $14 million for the half-year ended 31 December 2002 (2001: $16 million). This amount has been reclassified into cash flows from operating activities.
(iv) Acquisitions and disposals
There were no significant acquisitions or disposals of investments during the half-year ending 31 December 2002. We did however dispose of our Sri Lankan controlled entity, Mobitel (Pvt) Limited during October 2002, however this disposal did not have a significant effect on our statement of financial position or statement of financial performance.
In the half-year ended 31 December 2001, we increased our holding in our joint venture entity TelstraClear Limited (TelstraClear) by 8.43%. As a result, our 58.43% interest represented a controlling interest in this company. We consequently ceased equity accounting and consolidated the financial position, financial performance and cash flows of the TelstraClear Group from 1 December 2001.
Consideration for this acquisition was A$40 million (NZD$50 million) for which we received an additional 52,500,000 shares in TelstraClear.
The amount of cash, other assets and liabilities we acquired as a result of obtaining this increased interest are presented in the following table.
| Acquisition of TelstraClear | |||
|---|---|---|---|
| Half-year ended 31 December | |||
| 2001 | |||
| A$m | |||
| Consideration for acquisition | |||
| Cash | 40 | ||
| Fair value of assets and liabilities acquired by major class | |||
| Net bank overdraft held by TelstraClear on gaining control | (5) | ||
| Receivables | 64 | ||
| Inventories | 18 | ||
| Property, plant and equipment | 794 | ||
| Identifiable intangible assets | 238 | ||
| Other assets | 6 | ||
| Payables | (55) | ||
| Borrowings | (406) | ||
| Amounts owed to Telstra Corporation Ltd (a) | (367) | ||
| Provisions | (97) | ||
| Finance lease liability | (6) | ||
| Other liabilities | (72) | ||
| Fair value of net assets on gaining control | 112 | ||
| Outside equity interest (41.57%) | (47) | ||
| Original 50% interest in fair value of net assets prior to obtaining increased shareholding | (56) | ||
| Net assets acquired | 9 | ||
| Goodwill on acquisition | 31 | ||
| 40 | |||
| Outflow of cash on acquisition | |||
| Consideration for acquisition | 40) | ||
| Net bank overdraft held by TelstraClear on gaining control | (5) | ||
| (45) | |||
(a) For the half-year ended 31 December 2001 our repayment of borrowings in the statement of cash flows included a $367 million loan provided to TelstraClear. This funding was used to facilitate the purchase of the Clear Communications Limited group.
There were no significant disposals of entities in the half-year ended 31 December 2001.
Statement of Changes in Shareholders' Equity for the half-year ended 31 December 2002
| Telstra Group | |||||||||
|---|---|---|---|---|---|---|---|---|---|
| Reserves | |||||||||
(i) Franked at 30% tax rate
(ii) Due to the first time application of accounting standard AASB 1044: "Provisions, Contingent Liabilities and Contingent Assets", we have adjusted the opening balance of retained profits by the amount of the dividend provided for at 30 June 2002. Refer to note 1 for additional information on this change.
The notes following the half-year financial statements form part of the half-year financial report.
Notes to the Half-Year Financial Statements
1. Summary of accounting policies
In this financial report, we, us, our, Telstra and the Telstra Group - all mean Telstra Corporation Limited, an Australian corporation and its controlled entities as a whole. Telstra Entity is the legal entity, Telstra Corporation Limited.
Our half-year financial report is a general purpose financial report and is to be read in conjunction with our Annual Financial Report as at 30 June 2002. This should also be read together with any public announcements made by us in accordance with the continuous disclosure obligations arising under Australian Stock Exchange listing rules and the Corporations Act 2001, up to the date of the Directors' Declaration.
1.1. Basis of preparation of this financial report
This half-year financial report has been prepared in accordance with the requirements of the Australian Corporations Act 2001, Accounting Standards applicable in Australia, including AASB 1029: "Interim Financial Reporting", other authoritative pronouncements of the Australian Accounting Standards Board, and Urgent Issues Group Consensus Views.
Our half-year financial report does not include all notes of the type normally included in the Annual Financial Report. Therefore, it cannot be expected to provide as full an understanding of the financial performance, financial position and financing and investing activities of the Telstra Group as a full financial report.
This half-year financial report is prepared in accordance with historical cost, except for some categories of investments which are equity accounted.
For the purpose of preparing this half-year financial report, each half-year has been treated as a discrete reporting period.
1.2. Changes in accounting policy
The accounting policies adopted are consistent with those applied in the financial year ended 30 June 2002, apart from:
(a) In previous financial years, our accounting policy has been to provide for dividends in the statement of financial position when that dividend was declared after reporting date but before the completion of the financial report. Due to the first time application of accounting standard AASB 1044: "Provisions, Contingent Liabilities and Contingent Assets", a provision can no longer be raised at balance date if the dividend is declared after that date. As a result, we have changed our accounting policy to reflect this position and we now provide for the dividend in the period in which it is declared. When the declaration date is after balance date but before completion of the financial report, we disclose the dividend as an event occurring after balance date.
The transitional provisions of this standard require a write-back of the provision raised as at 30 June 2002 to opening retained profits in the current financial year. This adjustment amounted to $1,415 million. No adjustment has been made to the prior year statement of financial performance, statement of financial position or cash flows.
(b) In accordance with AASB 1012: "Foreign Currency Translation" we revalue the principal of our cross currency swaps to take into account movements in foreign currency. As these cross currency swaps are designated as hedges, we had previously included the swap balances with the underlying borrowings in the statement of financial position.
To enhance disclosure of our financial instruments, we have now separated these foreign currency swaps and recorded them as separate financial assets and liabilities. This reflects the fact that the swap contracts, although specifically hedging our borrowings, are made with different counterparties and as such are separate financial assets and liabilities in their own right.
On a similar basis, we have reviewed the treatment of our interest rate swaps to ensure that interest receivable and payable are set off only where our dealings are with the same couterparty and we have a legally recognised right to do so. Adjustments required for our interest rate swaps have not had a significant effect on our statement of financial position.
To appropriately assess our price risk from foreign currency borrowings, hedge receivables and hedge payables arising from cross currency swaps and accruals arising from interest rate swaps should continue to be viewed in the context of movements in the underlying borrowings being hedged.
This change in accounting policy has no impact on our statement of financial performance or our net assets in the statement of financial position, however we have changed comparative figures to reflect the disclosure in the current half-year. For further details on movements in our half-year statement of financial position resulting from the change in cross currency swap treatment, refer to note 3. Additional details on our financial instruments (including derivatives) can be found in note 29 of our 30 June 2002 Annual Financial Report.
(c) Revised accounting standard AASB 1028: "Accounting for Employee Entitlements" became applicable from 1 July 2002. The main changes surrounding this standard were specific recognition criteria for wages and salaries (including non-monetary benefits), compensated absences, profit sharing and bonus plans, termination benefits and some post employment benefits. We have assessed the changes in this accounting standard that are applicable for our half-year reporting and there has been no significant impact on our statement of financial performance or statement of financial position. As a result, there has been no adjustment required to our opening retained earnings.
1.3. Further clarification of terminology used in our statement of financial performance
Under the requirements of the revised AASB 1018: "Statement of Financial Performance" we must classify all of our expenses (apart from any borrowing costs and shares of net losses of associates and joint venture entities) according to either the nature (type) of the expense or the function (activity to which the expense relates). We have chosen to classify our expenses using the nature classification as it more accurately reflects the type of operations we undertake. On this basis, our direct cost of sales includes payments made to other carriers to terminate international and domestic outgoing calls and international transit traffic, cost of the purchase of goods sold and the purchase cost of mobile handsets from third party suppliers. This cost does not include any indirect costs and therefore is not identical to the functional expense category of "cost of sales".
1.4. Rounding
All dollar amounts in this financial report (except where indicated) have been rounded to the nearest million dollars ($m) for presentation. This has been done in accordance with Australian Securities and Investments Commission (ASIC) Class Order 98/100, dated 10 July 1998, issued under Section 341(1) of the Corporations Act 2001, and subsequent amending class orders 99/90 and 00/321.
1.5. Comparative figures
Where necessary, we adjust comparative figures to align with changes in presentation in the current half-year.
1.6. Adoption of International Financial Reporting Accounting Standards
The Australian Financial Reporting Council (FRC) has announced formalised support for the adoption by Australia of International Financial Reporting Standards (IFRS) by 1 January 2005. This will involve completing a first time set of financial statements measured under IFRS for the financial year ended 30 June 2006. Comparatives will also be measured under IFRS for the years ending 30 June 2005 and 30 June 2004. We have commenced planning the transition to compliance with these standards by the date specified.
| Half-year ended 31 December | ||
| 2002 | 2001 | |
| $m | $m | |
| 2. Profit from ordinary activities | ||
| Our profit before income tax expense (including items considered to require additional specific disclosure) has been calculated after: | ||
| (i) crediting | ||
| Interest revenue: | ||
| - joint ventures and associated entities | 1 | 1 |
| - other entities | 38 | 66 |
| 39 | 67 | |
| Dividend revenue: | ||
| - other entities | 1 | - |
| Revenue from the sale of: | ||
| - property, plant and equipment | 757 | 76 |
| - investments in controlled entities | 17 | - |
| - investments in joint venture entities | 3 | - |
| - investments in listed securities and other corporations | 7 | 20 |
| - businesses | 4 | 29 |
| 788 | 125 | |
| (ii) charging | ||
| Borrowing costs: | ||
| - other entities | 522 | 471 |
| - finance charges relating to finance leases | 1 | - |
| 523 | 471 | |
| - borrowing costs capitalised | (52) | (54) |
| 471 | 417 | |
| Net book value of assets sold/disposed: | ||
| - property, plant and equipment | 578 | 93 |
| - investments in controlled entities | 12 | - |
| - investments in listed securities and other corporations | 9 | 18 |
| - businesses | (6) | 2 |
| 593 | 113 | |
| Provisions: | ||
| - reduction in value of investments | 3 | 26 |
| Net (profit)/loss made on the sale of: | ||
| - property, plant and equipment | (179) | 17 |
| - investments in controlled entities | (5) | - |
| - investments in joint venture entities | (3) | - |
| - investments in listed entities and other corporations | 2 | (2) |
| - businesses | (10) | (27) |
| (195) | (12) | |
| 3. Items requiring specific disclosure | ||
| The following items form part of the ordinary operations of our business and are considered relevant to explaining the financial performance of the group. | ||
| Profit before income tax expense has been calculated after crediting/(charging) specific revenue and expense items included in our ordinary activities as follows: | ||
| Item included in other revenue: | ||
| - proceeds on sale of properties (i) | 570 | - |
| Item included in other expenses: | ||
| - book value on sale of properties (i) | (439) | - |
| Item included in share of net losses of associates and joint venture entities | ||
| - write off of the carrying value of our investment in Reach Limited (ii) | (965) | - |
| Net specific items | (834) | - |
| Income tax expense | (41) | - |
| Net specific items after income tax expense | (875) | - |
(i) On 1 August 2002, we sold a portfolio of seven office properties for $570 million. The carrying value of these properties was $439 million at the time of sale. We entered into operating leases totalling $518 million in relation to these properties on normal commercial terms of between five and twelve years, most of which commenced on 19 August 2002.
(ii) As at 31 December 2002, we have made the decision to write off the carrying amount of our investment in our 50% owned joint venture, Reach Limited (Reach).
This has resulted in a reduction of our investments accounted for using the equity method in our statement of financial position and an increase to our share of net losses of associates and joint venture entities in the statement of financial performance amounting to $965 million.
The write off has occurred due to the depressed conditions in the global market for international internet capacity resulting in high levels of excess capacity, intense price competition and lower than expected traffic volumes.
In addition, Reach has been in negotiations with its syndicate banks for the refinancing of debt totalling US$1,500 million. The syndicate banks have given Reach a waiver of its debt covenants to 28 February 2003, and discussions are continuing in relation to extending this waiver to permit an orderly refinancing of the debt. This debt is non recourse to Telstra.
The following items had a significant impact on our statement of financial position during the half-year ending 31 December 2002.
(iii) As per the change in accounting policy described in note 1, we have separated out the net position of our cross currency swaps from the underlying hedged borrowings in our statement of financial position.
This has not affected our net asset position but has increased both total assets and total liabilities as at 31 December 2002. We have restated the comparative figures for both 30 June 2002 and 31 December 2001 to reflect this change in disclosure.
The balances relating to cross currency swaps in our asset and liability classes are as follows:
| Telstra Group | ||||
|---|---|---|---|---|
| as at | ||||
| 31 Dec | 30 June | 31 Dec | ||
| 2002 | 2002 | 2001 | ||
| $m | $m | $m | ||
| Receivables - current | 102 | 29 | 17 | |
| Receivables - non current | 877 | 622 | 702 | |
| 979 | 651 | 719 | ||
| Interest-bearing liabilities - non current | 131 | 114 | 28 | |
| Net cross currency swaps separated out from interest-bearing liabilities | 848 | 537 | 691 | |
To appropriately assess our price risk arising from foreign currency borrowings, hedge receivables and hedge payables should be viewed in the context of movements in the underlying borrowings.
The net position of our borrowings after including all foreign currency swaps is as follows:
| Telstra Group | ||||
|---|---|---|---|---|
| as at | ||||
| 31 Dec | 30 June | 31 Dec | ||
| 2002 | 2002 | 2001 | ||
| $m | $m | $m | ||
| Interest-bearing liabilities - current | 2,080 | 1,895 | 3,526 | |
| less hedge receivable - current | (102) | (29) | (17) | |
| 1,978 | 1,866 | 3,509 | ||
| Interest-bearing liabilities before cross currency swaps - non current | 11,726 | 12,367 | 11,169 | |
| less hedge receivable - non current | (877) | (622) | (702) | |
| add hedge payable - non current | 131 | 114 | 28 | |
| 10,980 | 11,859 | 10,495 | ||
| Interest-bearing liabilities net of cross currency swaps | 12,958 | 13,725 | 14,004 | |
(iv) Due to the first time application of AASB 1044: "Provisions, Contingent Liabilities and Contingent Assets" we no longer recognise a provision for dividend at reporting date when the dividend is actually declared after that date. The provision raised for the final dividend at 30 June 2002 was $1,415 million, whereas there has been no provision raised as at 31 December 2002. This has resulted in a significant change to our current provisions compared with our comparative reported periods.
Refer to note 1 and note 5 for additional information on this change in accounting policy.
There are no transactions that required specific disclosure for the half-year ending 31 December 2001.
| Half-year ended 31 December | ||
|---|---|---|
| 2002 | 2001 | |
| $m | $m | |
| 4. Income tax expense | ||
| Notional income tax expense on profit agrees to actual income tax expense recorded as follows: | ||
| Profit before income tax expense | 2,118 | 3,093 |
| Australian statutory rate of taxation | 30% | 30% |
| Notional income tax expense on profit | 635 | 928 |
| Which is adjusted by the tax effect of: | ||
| Effect of lower rates of tax on overseas income | (14) | (11) |
| Research and development concessions | (3) | (4) |
| Share of net losses of associates and joint venture entities | 294 | 18 |
| Profit on sale of property, plant and equipment | (21) | (1) |
| Non-deductible depreciation and amortisation | 16 | (1) |
| Reduction in the value of investments and intercompany receivables | 12 | 8 |
| Estimated non-deductible expenditure | 37 | 32 |
| Assessable foreign source income not included in accounting profit | 34 | 12 |
| Under/(over) provision of tax in prior years | (26) | 21 |
| Other adjustments | 4 | (10) |
| Income tax expense | 968 | 992 |
| Our income tax expense contains the following items: | ||
| Current taxation provision | 929 | 737 |
| Movement in future income tax benefit | (25) | (71) |
| Movement in deferred income tax liability | 90 | 305 |
| Under/(over) provision of tax in prior years | (26) | 21 |
| 968 | 992 | |
Urgent Issues Group Abstract 39: "Effect of Proposed Tax Consolidation on Deferred Tax Balances" requires the effect of a tax consolidation Bill to be considered in assessing deferred tax assets and liabilities, when the Bill has been enacted or substantively enacted. As at 31 December 2002, the New Business Tax System (Consolidation) Act (No. 1) 2002, the New Business Tax System (Consolidation, Value Shifting, Demergers and Other Measures) Act 2002 and the New Business Tax System (Consolidation and Other Measures) Act (No. 1) 2002 were considered substantively enacted for financial reporting purposes. As a result, we have considered the effect of these tax consolidation acts on our deferred tax balances. There has been no significant impact arising from this change.
5. Dividends
Due to the first time application of the new accounting standard AASB 1044: "Provisions, Contingent Liabilities and Contingent Assets", a difference has arisen between reporting periods regarding the timing and the recognition of dividends declared in our statement of financial performance and statement of financial position. There has been no change in the timing of dividends declared by the directors. The following table highlights the effect of requirements under the new accounting standard:
| Half-year ended 31 December | ||
|---|---|---|
| 2002 | 2001 | |
| $m | $m | |
| Ordinary shares | ||
| Final dividend provided for at 30 June and paid during the interim period (i) | 1,415 | 1,415 |
| Interim dividend provided for at 31 December (ii) | - | 1,415 |
| Dividends provided for or paid during the interim period | 1,415 | 2,830 |
| Dividends per share (cents) | ||
| Final dividend provided for at 30 June and paid during the interim period (i) | 11.0 | 11.0 |
| Interim dividend provided for at 31 December (ii) | - | 11.0 |
| Dividends provided for or paid during the interim period | 11.0 | 22.0 |
(i) Under the new accounting standard AASB 1044: "Provisions, Contingent Liabilities and Contingent Assets", the provision for final dividend raised at 30 June has been reversed to opening retained profits in the current period statement of financial position (refer to the statement of changes in shareholders' equity).
(ii) As the interim dividend has not been declared, determined or publicly recommended as at 31 December 2002, no provision for dividend has been raised prior to that date in the statement of financial position. The interim dividend is now reported as an event after balance date (refer note 10).
6. Segment information
We report our segment information on the basis of business segments as our risks and returns are affected predominantly by differences in the products and services we provide through those segments.
Business segments
Our business structure was adjusted throughout the half-year ended 31 December 2002. The Infrastructure Services group has been divided to form the Telstra Technology group and the Infrastructure Services group. The former has been incorporated into the "Other" segment. We have restated our comparative information at balance date as if the new business segments existed in prior years.
- Telstra Retail's primary activities are sales and billing. This covers residential, business and government customers who receive our services, other than wholesale services (which are provided by Telstra Wholesale), mobile services (which are provided by Telstra Mobile), and those customers included in Telstra Country Wide.
This business unit:
- manages our information, connection and payphone services as well as our print and online directories business;
- sells and provides customer services for a comprehensive range of products, services and customer-driven solutions ranging from basic telephony services to complex voice and data networks; and
- manages our interests in our North American, Japanese and European retail operations.
- Telstra Country Wide is responsible for:
- addressing the telecommunication needs of consumer and business customers that reside and operate outside the mainland state capital cities and in Tasmania and the Northern Territory; and
- the specific needs of these customers which are not as readily addressed as for customers in metropolitan areas.
- Telstra Mobile is responsible for:
- our mobile and wireless networks and associated systems within Australia; and
- all mobile retail sales and after sales support, customer service, product development and pricing.
- Telstra International manages our interests in:
- the Asia-Pacific region, including our operations in Hong Kong, Vietnam, India, China, New Zealand, and Sri Lanka.
- Infrastructure Services responsibilities include:
- management and delivery of telecommunications infrastructure and related services;
- operational service and delivery of the entire fixed and mobile networks, along with online products and platforms; and
- Network, Design and Construction's capability for end-to-end project management, planning, design, construction, integration, operations and maintenance of communications networks and systems for Telstra and other telecommunications companies.
- Telstra Wholesale is responsible for:
- the provision of domestic wholesale products and services to other carriers and carriage service providers.
- Telstra Technology is responsible for:
- the overall planning, design, and construction management of our domestic fixed communication networks and associated systems to deliver technology solutions to support our products, services and customer support.
- Corporate Centre is responsible for:
- Legal and Regulatory - provides legal services and has responsibility for regulatory positioning and negotiation;
- Corporate Relations - responsible for managing our relationships and positioning with key groups such as our customers, the media, governments, industry, community groups and staff;
- Human Resources - responsibilities include recruitment, learning and development, and human resources management; and
- Finance and Administration - encompasses the functions of finance, treasury, productivity, risk management and assurance, acquisitions, investments and strategic development, investor relations, corporate services, and the office of the Telstra Chief Information Officer. It also includes the financial management of the majority of the Telstra Entity fixed assets (including network assets) through the Asset Accounting Group. Telstra Technology manages the annual capital expenditure of these assets on behalf of our other business segments.
Telstra Country Wide and Telstra Retail have been combined as a single reportable business segment for reconciliation and disclosure purposes as they are considered substantially similar. The Corporate Centre and Telstra Technology groups are not reportable segments and have been aggregated in the "Other" segment.
Since 31 December 2002, there have been further adjustments to our business structure. The three groups of Telstra Retail, Telstra Mobile and Telstra Country Wide have been restructured. From this restructure the scope of Telstra Country Wide has been increased and two new groups have emerged, being Telstra Consumer and Marketing and Telstra Business and Government. These changes will be reflected in our 30 June 2003 financial report.
The following tables detail the major segments, based on the reporting structure as at 31 December 2002.
| Half-year ended 31 December 2002 | ||||||||
|---|---|---|---|---|---|---|---|---|
| Business Units | Telstra Retail | Telstra Mobile | Telstra Inter-national | Infra-structure Services | Telstra Whole-sale | Other | Elimina-tions | Total of segments |
| $m | $m | $m | $m | $m | $m | $m | $m | |
| Sales revenue from external customers | 6,527 | 1,827 | 768 | 144 | 1,174 | 28 | - | 10,468 |
| Other revenue from external customers (before interest) | 56 | 1 | 52 | 7 | - | 783 | - | 899 |
| Total revenue from external customers (before interest) | 6,583 | 1,828 | 820 | 151 | 1,174 | 811 | - | 11,367 |
| Less revenues from sale of investments and dividends | 3 | - | 29 | - | - | - | - | 32 |
| Segment revenue from external customers | 6,580 | 1,828 | 791 | 151 | 1,174 | 811 | - | 11,335 |
| Add inter-segment revenue (a) | 198 | 1 | 13 | 1,032 | 527 | 681 | (2,452) | - |
| Segment revenue | 6,778 | 1,829 | 804 | 1,183 | 1,701 | 1,492 | (2,452) | 11,335 |
| Segment result | 3,975 | 794 | (23) | 12 | 1,086 | (370) | (1,972) | 3,502 |
| Less share of equity accounted net losses | 25 | - | 944 | - | - | - | - | 969 |
| Less net book value of investments sold | (6) | - | 21 | - | - | - | - | 15 |
| Add revenues from sale of investments and dividends | 3 | - | 29 | - | - | - | - | 32 |
| Earnings before interest and income tax expense (EBIT) | 3,959 | 794 | (959) | 12 | 1,086 | (370) | (1,972) | 2,550 |
| Half-year ended 31 December 2001 | ||||||||
|---|---|---|---|---|---|---|---|---|
| Business Units | Telstra Retail | Telstra Mobile | Telstra Inter-national | Infra-structure Services | Telstra Whole-sale | Other | Elimina-tions | Total of segments |
| $m | $m | $m | $m | $m | $m | $m | $m | |
| Sales revenue from external customers | 6,472 | 1,767 | 688 | 97 | 1,210 | 32 | - | 10,266 |
| Other revenue from external customers (before interest) | 124 | 5 | 18 | 8 | 4 | 120 | - | 279 |
| Total revenue from external customers (before interest) | 6,596 | 1,772 | 706 | 105 | 1,214 | 152 | - | 10,545 |
| Less revenues from sale of investments and dividends | 39 | - | 10 | - | - | - | - | 49 |
| Segment revenue from external customers | 6,557 | 1,772 | 696 | 105 | 1,214 | 152 | - | 10,496 |
| Add inter-segment revenue (a) | 242 | 2 | 1 | 1,150 | 510 | 684 | (2,589) | - |
| Segment revenue | 6,799 | 1,774 | 697 | 1,255 | 1,724 | 836 | (2,589) | 10,496 |
| Segment result | 3,767 | 720 | 27 | (50) | 1,120 | (2,017) | (60) | 3,507 |
| Less share of equity accounted net losses | 24 | - | 69 | - | - | - | - | 93 |
| Less net book value of investments sold | 11 | - | 9 | - | - | - | - | 20 |
| Add revenues from sale of investments and dividends | 39 | - | 10 | - | - | - | - | 49 |
| Earnings before interest and income tax expense (EBIT) | 3,771 | 720 | (41) | (50) | 1,120 | (2,017) | (60) | 3,443 |
(a) Generally most internal charges between business segments are made on a direct cost recovery basis. All internal telecommunications usage is accounted for at market value. We account for all international transactions between Australian and non-Australian businesses at market value.
| Half-year ended 31 December | |||
|---|---|---|---|
| 2002 | 2001 | ||
| Information about our products and services | $m | $m | |
| Sales revenue from | |||
| Basic access | 1,559 | 1,417 | |
| Local calls | 796 | 872 | |
| PSTN value added services | 138 | 131 | |
| National long distance calls | 582 | 611 | |
| Fixed to mobile | 753 | 707 | |
| Outgoing international calls | 162 | 174 | |
| Mobile services | 1,632 | 1,631 | |
| Mobile terminals | 170 | 118 | |
| Data | 525 | 544 | |
| ISDN (Access and Calls) | 496 | 539 | |
| Internet and IP solutions | 389 | 275 | |
| Directory services | 731 | 698 | |
| Intercarrier services | 593 | 568 | |
| Inbound calling products | 250 | 299 | |
| Solutions management | 239 | 221 | |
| Various controlled entities | 971 | 936 | |
| Customer Premises Equipment | 105 | 122 | |
| Payphones | 75 | 78 | |
| Other sales and services | 302 | 325 | |
| 10,468 | 10,266 | ||
Product definitions have been revised in the half-year period ended 31 December 2002, and we have adjusted comparative figures to align with the changes in presentation products and services information.
7. Share of net losses of associates and joint venture entities
| Ownership interest as at 31 December | Half-year ended 31 December | |||
|---|---|---|---|---|
| 2002 | 2001 | 2002 | 2001 | |
| Note | % | % | $m | $m |
| Our net loss from associates and joint venture entities has been contributed by the following entities: | ||||
| Joint venture entities | ||||
| - FOXTEL Partnerships | 50.0 | 50.0 | 23 | 24 |
| - Stellar Call Centres Pty Ltd | 50.0 | 50.0 | (1) | (2) |
| - TelstraClear Limited (i) | 58.4 | 58.4 | - | 75 |
| - Xantic B.V. | 35.0 | 35.0 | 2 | - |
| - Dynegy Connect LP (ii) | - | - | - | 12 |
| - Reach Limited (iii) | 50.0 | 50.0 | 946 | (20) |
| - DataOne Corporation Pte Ltd (iv) | - | 20.0 | - | - |
| 970 | 89 | |||
| Associated entities | ||||
| - IBM Global Services Australia Limited | 22.6 | 22.6 | (5) | (4) |
| - Australian-Japan Cable Holdings Limited | 39.9 | 39.9 | (2) | 3 |
| - Solution 6 Holdings Limited (v) | 13.2 | 19.1 | 2 | 2 |
| - ECard Pty Ltd (vi) | 50.0 | 41.0 | 6 | 3 |
| - PT Mitra Global Telekomunikasi Indonesia | 20.4 | 20.4 | (2) | - |
| - Keycorp Limited (vii) | 47.9 | 47.9 | - | - |
| (1) | 4 | |||
| 969 | 93 | |||
(i) During the half-year ended 31 December 2001, we acquired a controlling interest in TelstraClear Limited (TelstraClear). Subsequent to this, TelstraClear is a controlled entity and as such nil share of (profits)/losses is recorded for equity accounting purposes in the current period.
(ii) During the half-year ended 31 December 2001, we exercised a put option for the return of our investment in Dynegy Connect LP (Dynegy). Subsequent to this, Dynegy is no longer a joint venture entity.
(iii) Included in our net loss from Reach Limited are the following components:
| Half-year ended | ||
|---|---|---|
| 31 Dec | ||
| 2002 | ||
| Note | $m | |
| Share of net profits | (19) | |
| Write off of the carrying value of our investment 3 | 965 | |
| 946 | ||
(iv) On 29 November 2002, we exercised a put option for the sale of our shares in DataOne Corporation Pty Limited (DataOne). As a result, we no longer hold any interest in this investment. Prior to this date, we had suspended equity accounting due to losses being incurred by the entity and the investment was carried at nil value in the statement of financial position.
(v) Our ownership interest in Solution 6 Holdings Limited decreased during the half-year ending 31 December 2002 due to dilution in our shareholding.
(vi) On 14 November 2002, our ownership interest in ECard Pty Ltd increased due to the completion of a share buy back transaction.
(vii) On 28 June 2002, Keycorp Limited (Keycorp) was reclassified from a controlled entity to an associated entity. Equity accounting is suspended due to losses made by Keycorp and as such nil share of net (profits)/losses are recorded in the current period and the investment is carried at nil value in the statement of financial position.
8. Investment changes
Below is a list of changes in the composition of the Telstra Group from 30 June 2002.
| Immediate parent | |||||
|---|---|---|---|---|---|
Name of entity |
|
Country of incorporation |
Date of change in investment | % acquired/disposed/diluted | % of equity held after change in investment |
Additions |
| ||||
| Controlled entities | |||||
| Customer Contact Technologies Pty Ltd (i) | Australia | 30 July 2002 | 100.0 | 100.0 | |
| Data and Text Mining Technologies Pty Ltd (i) | Australia | 30 July 2002 | 100.0 | 100.0 | |
| Lyrebird Technologies Pty Ltd (i) | Australia | 30 July 2002 | 100.0 | 100.0 | |
| Telstra Singapore Pte Ltd (ii) | Singapore | 12 November 2002 | 100.0 | 100.0 | |
| Disposals and liquidations | |||||
| Controlled entities | |||||
| CLEAR Communications (Australia) Pty Ltd (iii) | Australia | 30 September 2002 | 100.0 | - | |
| Kiwi Cable Company Limited (iii) | New Zealand | 11 November 2002 | 100.0 | - | |
| Telstra New Zealand Limited (iii) | New Zealand | 11 November 2002 | 100.0 | - | |
| Saturn Communications Limited (iii) | New Zealand | 7 August 2002 | 100.0 | - | |
| Paradise.Net Limited (iii) | New Zealand | 7 August 2002 | 100.0 | - | |
| Netlink Limited (iii) | New Zealand | 7 August 2002 | 100.0 | - | |
| ZFREE Limited (iii) | New Zealand | 7 August 2002 | 100.0 | - | |
| ZTALK Limited (iii) | New Zealand | 7 August 2002 | 100.0 | - | |
| Mobitel (Pvt) Limited (iv) | Sri Lanka | 31 October 2002 | 60.0 | - | |
| Joint venture entities | |||||
| DataOne Corporation Pte Ltd (v) | Singapore | 29 November 2002 | 20.0 | - | |
| IDC Limited (iii) | Bermuda | 27 December 2002 | 50.0 | - | |
| Other significant investment changes | |||||
| Sensis Pty Ltd (vi) | Australia | 19 August 2002 | |||
| Solution 6 Holdings Limited (vii) | Australia | 2.0 | 13.2 | ||
(i) Newly incorporated entities (incorporated 30 July 2002) which have not yet commenced operating. These companies have only nominal funds invested.
(ii) Telstra Singapore Pte Ltd was incorporated on 12 November 2002 for the purpose of providing sales support to multinational corporate customers.
(iii) Non-operating companies which were de-registered or dissolved.
(iv) Telstra sold its 60% stake in the Sri Lankan mobile carrier, Mobitel (Pvt) Limited, on 31 October 2002 for US$9m (A$17m).
(v) We exercised our put option under the Joint Venture Agreement between Telstra Holdings Pty Ltd, DataOne Corporation Pte Limited (DataOne) and other venture parties for the sale of our shares in DataOne for a total consideration of SGD$3m (A$3m).
(vi) Pacific Access Pty Ltd changed its name to Sensis Pty Ltd on 19 August 2002.
(vii) Our interest in Solution 6 has decreased to 13.2% (from 15.2% at 30 June 2002) due to 6 separate dilutions in our shareholding. We have maintained significant influence of the company on the basis that we are the largest single shareholder and are entitled to appoint a director to the board of directors. As such we have continued to record the investment as an associated entity.
9. Contingent liabilities and contingent assets
There have been no significant changes from 30 June 2002 to guarantees, indemnities and support provided by us, or to legal actions we are involved in, which gave rise to contingent liabilities or contingent assets apart from:
Our 50% owned pay television joint venture FOXTEL, and Optus entered into a content supply agreement in March 2002 which allows Optus to provide a number of FOXTEL pay TV channels over the Optus cable network. This agreement became unconditional in November 2002 and was effective as of 1 December 2002. Under this agreement, FOXTEL assumes some of Optus' financial obligations under its movie and other content arrangements. Our share of these commitments is $195 million.
As we are subject to joint and several liability in relation to agreements entered into by the FOXTEL partnership, we would be contingently liable if our partners in this relationship (The News Corporation Limited and Publishing and Broadcasting Limited, and Telstra Media Pty Ltd and its partner, Sky Cable Pty Ltd) failed to meet any of their obligations. As a result, our contingent liabilities arising from the content sharing agreement have also increased by $195 million.
Our 50% owned joint venture Reach Limited (Reach) has capacity obligations with Australian-Japan Cable Holdings Limited (AJC) to a maximum of $263 million (30 June 2002: $265 million). We have guaranteed these arrangements as was the case prior to the formation of the joint venture. The contractual arrangement between Reach and AJC is in relation to Reach's utilisation of cable capacity to December 2006.
The commitments of Reach under the contractual agreement are:
| As at | |||
|---|---|---|---|
| 31 Dec | 30 June | ||
| 2002 | 2001 | ||
| $m | $m | ||
| Within 1 year | 35 | 36 | |
| Within 1-2 years | 86 | 87 | |
| Within 2-3 years | 80 | 80 | |
| Within 3-4 years | 62 | 62 | |
| 263 | 265 | ||
10. Events after balance date
The directors are not aware of any matter or circumstance that has occurred since 31 December 2002 that, in their opinion, has significantly affected or may significantly affect in future years:
- our operations;
- the results of those operations; or
- the state of our affairs;
other than:
On 27 February 2003, the directors of Telstra Corporation Limited declared a fully franked interim dividend of 12 cents per ordinary share and a fully franked special dividend of 3 cents per ordinary share, payable on 30 April 2003 to those shareholders on record at 21 March 2003. A provision for dividend payable has been raised as at this date amounting to $1,930 million.
11. United States generally accepted accounting principles disclosures
Reconciliations to financial reports prepared using USGAAP
Our consolidated financial report is prepared in accordance with accounting principles generally accepted in Australia (AGAAP). The principles of AGAAP differ in certain respects from accounting principles generally accepted in the United States (USGAAP).
For an explanation of the significant differences between AGAAP and USGAAP, refer to note 30 of the 30 June 2002 financial statements. The following tables are provided to supplement those disclosures for the half-year ended 31 December 2002.
| Half-year ended 31 December | ||
|---|---|---|
| 2002 | 2001 | |
| $m | $m | |
| Reconciliation of net income to USGAAP | ||
| AGAAP net income reported in statement of financial performance | 1,184 | 2,098 |
| Adjustments required to agree with USGAAP | ||
| Property, plant and equipment | (223) | (94) |
| Retirement benefit gain | 73 | 161 |
| Income tax benefit | 101 | 43 |
| Employee compensation expense | - | (25) |
| Mobile phone subsidies | - | 15 |
| Redundancy and restructuring provision | - | (71) |
| Derivative financial instruments and hedging activities | (182) | (83) |
| PCCW converting (2001:convertible) note | (7) | (34) |
| Equity accounting adjustment for Reach Ltd (a) | 767 | 16 |
| Consolidation adjustments for Regional Wireless Company (RWC) (a) | (309) | (27) |
| General reserve adjustments | 6 | - |
| Reversal of AGAAP goodwill amortisation (a) | 118 | - |
| Net income per USGAAP | 1,528 | 1,999 |
| Statement of financial performance measured and classified per USGAAP | ||
| Operating revenue | 10,468 | 10,266 |
| Operating expenses: | ||
| Labour | 1,551 | 1,480 |
| Direct cost of sales | 1,834 | 1,774 |
| Depreciation and amortisation | 1,728 | 1,696 |
| Other operating expenses | 2,079 | 2,006 |
| Total operating expenses | 7,192 | 6,956 |
| Operating income | 3,276 | 3,310 |
| Net interest expense | (475) | (398) |
| Dividend income | 1 | - |
| Share of net profits/(losses) of associates and joint venture entities | 27 | (55) |
| Other (expense)/income (a) | (169) | 98 |
| Net income before income tax expense and minority interests | 2,660 | 2,955 |
| Income tax expense | 857 | 953 |
| Net income before minority interests and cumulative effect adjustments | 1,803 | 2,002 |
| Minority interests | 34 | (3) |
| Net income before cumulative effect adjustments | 1,837 | 1,999 |
| Cumulative effect of change in accounting principles (net of tax) (a) | (309) | - |
| Net income per USGAAP | 1,528 | 1,999 |
| USGAAP Earnings per share | ||
| Net income per USGAAP | 1,528 | 1,999 |
| ¢ | ¢ | |
| Basic earnings per share before cumulative effect of change in accounting principles | 14.4 | 15.6 |
| Cumulative effect of change in accounting principles (net of tax): | ||
| Transition impairment of RWC goodwill (a) | (2.4) | - |
| Basic earnings per share per USGAAP (cents) | 12.0 | 15.6 |
| Dilutive earnings per share before cumulative effect of change in accounting principles | 14.3 | 15.6 |
| Cumulative effect of change in accounting principles (net of tax): | ||
| Transition impairment of RWC goodwill (a) | (2.4) | - |
| Diluted earnings per share per USGAAP (cents) | 11.9 | 15.6 |
| Reconciliation of weighted average number of ordinary shares and common share equivalents used for earnings per share calculations | Number (in millions) | |
| Number of shares used for AGAAP earnings per share calculations | 12,867 | 12,867 |
| Adjusted for weighted average TESOP 97 and 99 options outstanding during the period | (76) | (87) |
| Number of shares used for USGAAP basic earnings per share calculations | 12,791 | 12,780 |
| Weighted average number of employee share options exercised during the period | 37 | 44 |
| Number of shares used for USGAAP diluted earnings per share calculations | 12,828 | 12,824 |
| Total comprehensive income disclosure | ||
| Net income per USGAAP | 1,528 | 1,999 |
| USGAAP other comprehensive income / (loss) | (256) | (372) |
| USGAAP Total comprehensive income | 1,272 | 1,627 |
| Reconciliation of shareholders' equity to USGAAP | ||
| AGAAP shareholders' equity per statement of financial position | 15,235 | 14,527 |
| Cumulative adjustments required to agree with USGAAP | ||
| Property, plant and equipment | 196 | 529 |
| Listed investments | 80 | 112 |
| Dividend payable (note 1) | - | 1,415 |
| Retirement benefits | 4,160 | 3,776 |
| Income tax | (1,159) | (1,220) |
| Minority interests | 51 | (531) |
| Employee share loans | (211) | (250) |
| Mobile phone subsidies | - | (15) |
| Redundancy and restructuring provision | - | 23 |
| Derivative financial instruments and hedging activities | (310) | (209) |
| PCCW convertible note | 7 | (251) |
| Sale of Global Wholesale Business to Reach Ltd | (882) | (882) |
| Equity accounting adjustment for Reach Ltd (a) | 792 | 33 |
| Consolidation adjustment for Regional Wireless Company | 508 | 1,092 |
| General reserve adjustments | (58) | (46) |
| Reversal of AGAAP goodwill amortisation (a) | 118 | - |
| Shareholders' equity per USGAAP | 18,527 | 18,103 |
| Statement of financial position measured and classified per USGAAP | ||
| Current assets | ||
| Cash | 1,365 | 652 |
| Accounts receivable, net | 3,859 | 3,903 |
| Inventories | 252 | 286 |
| Deferred tax asset | 244 | 221 |
| Other assets | 553 | 641 |
| Total current assets | 6,273 | 5,703 |
| Non current assets | ||
| Receivables | 202 | 116 |
| Derivative financial instruments | 1,372 | 1,223 |
| Inventories | 6 | 22 |
| Investments - accounted for using the equity method | 241 | 265 |
| Investments - other non current | 528 | 1,509 |
| Property, plant and equipment | 43,642 | 43,505 |
| Accumulated depreciation of property, plant and equipment | (20,194) | (19,282) |
| Goodwill, net | 2,483 | 2,586 |
| Intangible assets, net | 1,298 | 1,480 |
| Prepaid pension assets | 4,154 | 3,776 |
| Other assets | 2,375 | 2,171 |
| Total non current assets | 36,107 | 37,371 |
| Total assets | 42,380 | 43,074 |
| Current liabilities | ||
| Payables | 2,371 | 2,525 |
| Borrowings - short term debt | 1,259 | 2,424 |
| Borrowings - long term debt due within one year | 821 | 1,085 |
| Income tax payable | 599 | 476 |
| Provisions | 381 | 446 |
| Revenue received in advance | 858 | 859 |
| Total current liabilities | 6,289 | 7,815 |
| Non current liabilities | ||
| Payables | 91 | 164 |
| Derivative financial instruments | 420 | 1,370 |
| Borrowings - long term debt | 12,255 | 10,495 |
| Income tax payable | - | 45 |
| Deferred tax liability | 3,420 | 3,226 |
| Provisions | 843 | 858 |
| Revenue received in advance | 586 | 462 |
| Total non current liabilities | 17,615 | 16,620 |
| Total liabilities | 23,904 | 24,435 |
| Minority interests | (51) | 536 |
| Shareholders' equity | ||
| Contributed equity | 6,433 | 6,433 |
| Share loan to employees | (211) | (250) |
| Additional paid in capital from employee share plans | 333 | 317 |
| Total share capital | 6,555 | 6,500 |
| Accumulated other comprehensive (loss) / income | (51) | 205 |
| Retained earnings | 12,023 | 11,398 |
| Total shareholders' equity | 18,527 | 18,103 |
| Total liabilities and shareholders' equity | 42,380 | 43,074 |
(a) Additional explanation of significant differences between AGAAP and USGAAP
Business Combinations, Goodwill and other intangible assets
As discussed in note 30(u) "Recently issued United States accounting standards" of the 30 June 2002 financial statements, on 1 July 2002 we adopted Statement of Financial Accounting Standards No. 141, "Business Combinations" (SFAS 141) and Statement of Financial Accounting Standards No. 142, "Goodwill and Other Intangible Assets" (SFAS 142) in the reconciliations to financial reports prepared using USGAAP.
Under SFAS 142, goodwill is no longer amortised but tested for impairment annually, or more frequently if impairment indicators arise. Goodwill is tested for impairment at a "reporting unit" level using a two-step approach. For the purposes of performing the annual impairment tests, goodwill has been assigned to reporting units in accordance with the net goodwill balances by legal entity included in Note 13 of the 30 June 2002 financial statements. Under the transition provisions of SFAS 142, we are required to complete a transitional goodwill impairment test within six months of adoption of SFAS 142.
Telstra calculated the fair value of the reporting units with assigned goodwill using a discounted cash flow technique that identified an impairment in the carrying value of goodwill of its subsidiary Regional Wireless Company (RWC). Therefore, on adoption, Telstra recognised as a cumulative effect of a change in accounting principle, a charge of $309 million relating to the USGAAP carrying value of the goodwill in RWC.
An impairment of the RWC goodwill carrying value under AGAAP had already been recognised in the 30 June 2001 financial statements. An impairment was not recognised under USGAAP in the 30 June 2001 or 30 June 2002 financial statements as the undiscounted cash flows were greater than the carrying value of RWC, in accordance with Statement of Financial Accounting Standards No. 121, "Accounting for the Impairment of Long-Lived Assets and for Long-Lived Assets to Be Disposed Of".
Under AGAAP, goodwill is still amortised over its useful life and we have reversed the goodwill amortised for the half-year ended 31 December 2002 of $118 million in
both the reconciliation of net income to USGAAP and the reconciliation of shareholders' equity to USGAAP.
Write down of Reach investment
As at 31 December 2002, based on impairment tests conducted in accordance with APB 18 `The Equity Method of Accounting for Investments in Common Stock' paragraph 19(h), we have written off the entire carrying amount of our investment in our 50% owned joint venture, Reach Limited (Reach). For AGAAP, this resulted in a write off of $965 million. However, under USGAAP the carrying value of the investment was $178 million, due to GAAP differences that existed at inception and on equity accounting the Reach results to 31 December 2002. Therefore, an additional net adjustment in the reconciliation of net income and shareholders equity of $787 million was recognised for USGAAP, included in the equity accounting adjustment for Reach. Please refer to note 3 for further explanation of the write down made under AGAAP.
Directors' Declaration
The directors of Telstra Corporation Limited have made a resolution that declared:
| (a) the financial statements and notes, set out on pages 2 to 31, of the Telstra Group: | |
| (i) comply with the Accounting Standards, the Corporations Regulations 2001 and Urgent Issues Group Consensus Views; | |
| (ii) give a true and fair view of the financial position as at 31 December 2002 and performance, as represented by the results of the operations and cash flows, for the half-year ended 31 December 2002; and | |
| (iii) in the directors' opinion, have been made out in accordance with the Corporations Act 2001. | |
| (b) at the date of this declaration, in the directors' opinion, there are reasonable grounds to believe that Telstra Corporation Limited will be able to pay its debts as and when they become due and payable. |
For and on behalf of the Board
| /s/ Robert C Mansfield Robert C Mansfield Chairman Date: 27 February 2003 Melbourne, Australia | /s/ Ziggy E Switkowski Ziggy Switkowski Chief Executive Officer and Managing Director Date: 27 February 2003 Melbourne, Australia |
Independent Review Report
To the Members of Telstra Corporation Limited
Scope
I have reviewed the financial report of Telstra Corporation Limited (the Telstra Entity) for the half-year ended 31 December 2002 as set out on pages 2 to 32, including the Directors' Declaration. The financial report includes the consolidated financial statements of the Telstra Entity and the entities it controlled at the end of the half-year, or during the half-year (the Telstra Group). The Telstra Entity directors are responsible for the financial report. I have conducted an independent review of the financial report in order to state whether, on the basis of the procedures described, anything has come to my attention that would indicate that the financial report is not presented fairly in accordance with Accounting Standard AASB 1029 "Interim Financial Reporting" and other mandatory professional reporting requirements in Australia and statutory requirements so as to present a view which is consistent with my understanding of the Telstra Group's financial position, and performance as represented by the results of its operations and its cashflows. I have also conducted my independent review in order for the Telstra Entity to lodge the financial report with the Australian Securities and Investment Commission.
My review has been conducted in accordance with the Australian National Audit Office Auditing Standards, which incorporate the Australian Auditing Standards, applicable to review engagements. The review was limited primarily to inquiries of the Telstra Group's personnel and conduct of analytical review procedures applied to the financial data. These review procedures do not provide all the evidence that would be required in an audit. Thus the level of assurance provided is less than that given in an audit. Consequently, I have not performed an audit and, accordingly, I do not express an audit opinion.
I have also reviewed the quantification of the major differences between accounting principles generally accepted in Australia compared to accounting principles generally accepted in the United States of America, which is presented in note 11 to the financial report. I have reviewed note 11 in order to state whether, in all material respects, anything has come to my attention that would indicate that it does not present fairly, the major differences between accounting principles generally accepted in Australia and accounting principles generally accepted in the United States of America, in so far as they apply to the Telstra Group.
Review Statement
As a result of my review, which is not an audit, I have not become aware of any matter that makes me believe that the half-year financial report of the Telstra Group is not in accordance with:
(a) the Corporations Act 2001, including:
(i) giving a true and fair view of the Telstra Group's financial position as at 31 December 2002 and its performance for the half-year ended on that date; and
(ii) complying with Accounting Standard AASB 1029 "Interim Financial Reporting" and the Corporations Regulations 2001; and
(b) other mandatory professional reporting requirements in Australia.
Further, as a result of my review, I have not become aware of any matter that makes me believe that note 11 does not present fairly the major differences between accounting principles generally accepted in Australia and accounting principles generally accepted in the United States of America, in so far as they apply to the Telstra Group.
/s/ PJ Barrett
PJ Barrett
Auditor-General
Date: 27 February 2003
Canberra, Australia
Directors' report
The directors present their report on the consolidated entity (Telstra or Telstra Group) consisting of Telstra Corporation Limited (Telstra Entity) and the entities it controlled at the end of or during the half-year ended 31 December 2002. Financial comparisons used in this report are of results for the half-year ended 31 December 2002 compared with the half-year ended 31 December 2001.
Results of operations
Telstra's net profit for the half-year was $1,184 million (2001: $2,098 million). This was after:
- deducting income tax expense of $968 million (2001: $992 million); and
- adjusting for net losses attributable to outside equity interests in controlled entities of $34 million (2001: net profit of $3 million).
Earnings before interest and income tax expense was $2,550 million, representing an $893 million decrease from the prior corresponding period's result of $3,443 million.
Review of operations
The decrease in net profit is attributable to the write off of the carrying value of our 50% investment in Reach Limited (Reach). This investment write off resulted in an increase to our share of net losses of associates and joint venture entities in the statement of financial performance of $965 million. This has been partially offset by modest revenue growth and the profit from the sale of seven office properties of $131 million before tax.
Sales revenue increased by $202 million to $10,468 million due to:
- the continuing impact of our rebalancing initiatives resulting in an increase in basic access revenue ($142 million) and a decrease in local call ($76 million) and national long distance revenues ($29 million);
- growth in mobile handsets ($52 million), fixed to mobiles ($46 million) and internet and IP solutions ($114 million). Partially offsetting this growth has been a decline in ISDN (access and calls) ($43 million) and inbound calling product revenue ($49 million); and
- the inclusion of a full six months of revenue from our controlled entity TelstraClear Limited.
The increase in other revenue by $620 million to $899 million is primarily due to the inclusion of $570 million from the sale of seven office properties.
Operating expenses (excluding borrowing costs, share of net losses of associates and joint venture entities and income tax expense) increased by $839 million to $7,848 million with the following major influences:
- higher other expenses due mainly to the book value of property, plant and equipment sold including $439 million for the sale of our office properties. In addition, spending on service contracts and agreements was higher ($125 million) due to an increase in network and emergency maintenance and the outsourcing of our mobiles National Activation Centre;
- depreciation and amortisation has increased ($129 million) due to continued growth in our communications plant asset base and capitalised software development; and
- an increase in labour expenses primarily due to higher restructuring costs (an increase of $32 million) and the inclusion of a full six months of labour expense from TelstraClear Limited.
Share of net losses of associates and joint venture entities increased by $876 million to $969 million due mainly to the write off of the carrying amount of our investment in Reach. The decision to write off our investment was made due to the depressed conditions in the global market for international internet capacity, resulting in high levels of excess capacity, intense price competition and lower than expected traffic volumes.
Net borrowing costs have increased by $82 million to $432 million due to lower interest revenue derived from the converting note issued by PCCW compared with the convertible note held in the prior year. Higher borrowing costs have also been incurred due to restructuring of our debt portfolio.
Our free cash flow has increased by $743 million to $2,116 million primarily due to the proceeds from the sale of property, plant and equipment of $692 million. Additionally, there has been improved cash flow from our operating activities and a decrease in capital and investing expenditure. Operating capital expenditure (before capitalised interest) declined by $132 million to $1,530 million after continued tight control over our capital expenditure program.
Underlying results from operations
We have taken the reported results and adjusted for the once off items that have occurred in the half-year ending 31 December 2002 and the corresponding period in fiscal 2002, so that a like for like comparison of results can be made. On a normalised basis:
- our sales revenue has declined by 0.1% to $10,195 million confirming our guidance of flat performance with total underlying revenue (excluding interest revenue) decreasing by 0.5% to $10,306 million.
- our underlying operating expenses (before depreciation, amortisation and borrowing costs) decreased by 0.1% to $5,150 million. Total underlying expenses (before borrowing costs) increased by 1.1% to $6,783 million.
This has resulted in underlying earnings before interest and tax of $3,523 million (2001: $3,645 million), a decrease of 3.3% over the previous half-year.
Dividends
Directors have declared a fully franked interim dividend of 12 cents per share ($1,544 million) and a fully franked special dividend of 3 cents per share ($386 million). The dividend will have a record date of 21 March 2003 with the payment to be made on 30 April 2003. The dividend will be franked at a tax rate of 30%.
At present, it is expected that Telstra will be able to fully frank declared ordinary dividends out of fiscal 2003 earnings. However, the directors can give no assurance as to the future level of dividends, if any, or of franking of dividends. This is because it depends upon, among other factors, our earnings, Government legislation and our tax position.
Directors
Directors who held office during the half year
Robert C Mansfield - chairman and director
John T Ralph - deputy chairman and director
Zygmunt E Switkowski - chief executive officer and managing director
Samuel H Chisholm
Anthony J Clark
John E Fletcher
Belinda J Hutchinson
Catherine B Livingstone
Charles Macek
Donald G McGauchie
William A Owens
John W Stocker
There were no changes to the directors holding office at the annual general meeting held on 14 November 2002.
This report is made in accordance with a resolution of the directors.
/s/ Robert C Mansfield
Robert C Mansfield
Chairman
/s/ Ziggy Switkowski
Ziggy Switkowski
Chief Executive Officer and Managing Director
27 February 2003
__________________________________________________________________
SIGNATURES
Pursuant to the requirements of the Securities Exchange Act of 1934, the registrant has duly caused this report to be signed on its behalf by the undersigned, thereunto duly authorized.
TELSTRA CORPORATION LIMITED
/s/ DOUGLAS GRATION
________________________________
Douglas Gration
Title: Company Secretary
Date: 27 February 2003