Exhibit 17(d)
Goldman
Sachs Variable Insurance Trust
GOLDMAN SACHS ASSET MANAGEMENT 32 OLD SLIP, NEW YORK, NEW YORK 10005
Annual Report
December 31, 2002
GOLDMAN SACHS VARIABLE INSURANCE TRUST GROWTH AND INCOME FUND
Shareholder Letter
Dear Shareholders:
This report provides an overview on the performance of the Goldman Sachs Variable Insurance Trust – Growth and Income Fund for the one-year period that ended December 31, 2002.
Market Review
2002 experienced continued volatility in the equity markets. The market underwent considerable changes — from large corporate bankruptcies to corporate governance issues and sell-side analyst scrutiny. On the economic front, mixed signals prevailed as stocks finished their third year in a row in negative territory. Despite lower consumer confidence and an uncertain outlook for job security, lower borrowing costs seemed to keep consumer spending from falling off. Confidence in the health of the world economy has been stifled by concerns about a U.S.-led war on Iraq and additional terrorist attacks.
In market declines, such as in 2002, investors often sell for emotional reasons, which usually results in valuations compressing within industries as investors engage in the market equivalent of “throwing out the baby with the bath water.” During these times, as prepared investors we seek to upgrade our portfolios as higher quality companies become available to us at very attractive prices. The Fund’s management team avoided some of the market’s major “torpedoes,” which we attribute to our strong research governance. We adhere to a principle of not compromising on our fundamental research process, which can help us to put only quality names into our portfolios. In summary, we continue to emphasize balance sheet quality, cash flow stability, and companies with superior management teams.
Performance Review
Over the one-year period that ended December 31, 2002, the Fund generated a cumulative total return of -11.34%. Over the same time period, the Fund’s benchmark, the Standard & Poor’s 500 Index (with dividends reinvested) generated a cumulative total return of
- -22.10%. While the Fund could not escape the widespread market weakness, it did significantly outperform its benchmark due to strong stock selection. The Fund’s quality bias and emphasis on price and future prospects, not merely price, has been well founded during the challenging investing environment in 2002.
During the reporting period, the Fund’s holdings in the Financials, Industrials, Utilities, and Insurance sectors were particularly strong. Bank of America Corp. (“Bank of America”) was a top contributor to performance. Bank of America, the Fund’s largest holding as of December 31, 2002, provides a diversified range of banking and non-banking financial services and products. The company has been experiencing earnings-per-share growth and continues to find ways to help expand its asset base and strengthen relationships with current customers.
Citigroup, Inc. (“Citigroup”) was a negative contributor to performance due in part to investor concern over the amount of bad debt exposure and highly publicized research fines. We see the current problems as short term and continue to hold Citigroup due to the strength of its diverse business mix across products lines and international markets.
Currently our portfolio is underweight in Utilities and Consumer stocks and overweight in Insurance and Industrials. The environment continues to be a difficult one for Utilities as
1
GOLDMAN SACHS VARIABLE INSURANCE TRUST GROWTH AND INCOME FUND
Shareholder Letter (continued)
certain segments face over-capacity and decreasing demand. In the Consumer area, volatility has increased as investors react to short-term sales announcements. We typically like to invest in Consumer companies that we know have strong product pipelines and do not have to rely solely on price increases in order to increase revenues. In Insurance, as of December 31, 2002 we were overweight in the Life Insurance industry with names like Metropolitan Life Insurance Co. (“MetLife”) and in the Property Insurance industry with companies such as RenaissanceRe Holdings and PartnerRe Ltd. In the Industrial Sector, we have exposure in the Defense/ Aerospace and Industrial Parts industries.
Prior to the fourth quarter, the Fund had been extremely underweight in the Telecom industry due to concerns over excess capacity, increased competition, and regulatory constraints, all of which plagued the industry. While other value managers were attracted to the industry because of dividend yields, we thought that the businesses were in decline and felt that the industry was expensive. More recently, as companies have been reducing capital expenditures and the regulatory environment has been showing signs of improvement, we have found opportunities to increase positions in those companies that have improving cash flows, balance sheets and quality managements. Examples of holdings in this area include SBC Communications Inc. and BellSouth Corp. We believe that these companies, when compared to their peers, offer a better, more attractive risk/reward profile.
Investment Objective
The Fund seeks long-term growth of capital and growth of income through a diversified portfolio of equity securities.
Portfolio Composition
Top 10 Portfolio Holdings as of December 31, 2002*
| | | | | | | |
| | | | % of Total |
| Company | | Business | | Net Assets |
| |
| |
|
| Bank of America Corp. | | Banks | | | 3.8 | % |
| SBC Communications, Inc. | | Telephone | | | 3.3 | |
| Citigroup, Inc. | | Banks | | | 3.1 | |
| Exxon Mobil Corp. | | Energy Resources | | | 2.6 | |
| Fox Entertainment Group, Inc. | | Media | | | 2.4 | |
| Philip Morris Companies, Inc. | | Tobacco | | | 2.3 | |
| U.S. Bancorp | | Banks | | | 2.2 | |
| Freddie Mac | | Financial Services | | | 2.1 | |
| Pfizer, Inc. | | Drugs | | | 2.1 | |
| BellSouth Corp. | | Telephone | | | 2.1 | |
* Opinions expressed in this report represent our present opinions only. Reference to individual securities should not be construed as a commitment that such securities will be retained in the Fund. From time to time, the Fund may change the individual securities it holds, the number or types of securities held and the markets in which it invests. References to individual securities do not constitute a recommendation to the investor to buy, hold or sell such securities. In addition, references to past performance of the Fund do not indicate future returns, which are not guaranteed and will vary. Furthermore, the value of shares of the Fund may fall as well as rise.
2
GOLDMAN SACHS VARIABLE INSURANCE TRUST GROWTH AND INCOME FUND
Portfolio Outlook
Economists generally believe that the economy will expand in 2003, but increasing global tensions may stifle the growth. Although we do not attempt to predict market movements, we continue to view firsthand fundamental research as the most important part of our investment process. In addition, our team-based approach gives each team member industry/sector-specific responsibility and allows these individuals to provide in-depth industry expertise. Our continued focus on price and fundamentals allows us to buy quality companies with future prospects when we believe temporary situations cause the stock price to fall. We believe our consistent investment philosophy will help allow our portfolios to perform well in a variety of market conditions.
We thank you for your investment and look forward to your continued confidence.
Goldman Sachs Value Portfolio Management Team
January 9, 2003
3
GOLDMAN SACHS VARIABLE INSURANCE TRUST GROWTH AND INCOME FUND
Performance Summary
December 31, 2002
The following graph shows the value as of December 31, 2002, of a $10,000 investment made on January 12, 1998 (commencement of operations). For comparative purposes, the performance of the Fund’s benchmark (the Standard and Poor’s 500 Index (“S&P 500 Index”)) is shown. This performance data represents past performance and should not be considered indicative of future performance which will fluctuate with changes in market conditions. These performance fluctuations will cause an investor’s shares, when redeemed, to be worth more or less than their original cost. Returns do not reflect the deduction of taxes that a shareholder would pay on fund distributions or the redemption of fund shares.
| Growth and Income Fund’s Lifetime Performance |
Growth of a $10,000 Investment, Distributions Reinvested from January 12, 1998 to December 31, 2002.
| | | | | | | |
| | Since Inception | | One Year | | |
|
|
|
|
Average Annual Total Return Through December 31, 2002 |
|
|
|
|
Growth and Income Fund (commenced January 12, 1998) | | -3.17% | | -11.34% | | |
|
4
GOLDMAN SACHS VARIABLE INSURANCE TRUST GROWTH AND INCOME FUND
Statement of Investments
December 31, 2002
| | | | | | | | | | | |
| | | | | | |
| | Shares | | Description | | Value |
| | |
Common Stocks – 96.9% |
|
| | | Airlines – 0.5% |
| | | | 12,936 | | | Southwest Airlines Co. | | $ | 179,810 | |
| | |
|
| | | Alcohol – 0.6% |
| | | | 4,196 | | | Anheuser-Busch Companies, Inc. | | | 203,086 | |
| | |
|
| | | Apartments – 2.0% |
| | | | 10,775 | | | Archstone-Smith Trust | | | 253,644 | |
| | | | 20,075 | | | Equity Residential Properties Trust | | | 493,443 | |
| | | | | | | | | |
| |
| | | | | | | | | | 747,087 | |
| | |
|
| | | Banks – 16.5% |
| | | | 20,075 | | | Bank of America Corp. | | | 1,396,618 | |
| | | | 6,798 | | | Charter One Financial, Inc. | | | 195,306 | |
| | | | 32,459 | | | Citigroup, Inc. | | | 1,142,232 | |
| | | | 28,650 | | | KeyCorp | | | 720,261 | |
| | | | 3,099 | | | M&T Bank Corp. | | | 245,906 | |
| | | | 3,927 | | | Mellon Financial Corp. | | | 102,534 | |
| | | | 10,600 | | | National City Corp. | | | 289,592 | |
| | | | 38,704 | | | U.S. Bancorp | | | 821,299 | |
| | | | 13,900 | | | Wachovia Corp. | | | 506,516 | |
| | | | 14,144 | | | Wells Fargo & Co. | | | 662,929 | |
| | | | | | | | | |
| |
| | | | | | | | | | 6,083,193 | |
| | |
|
| | | Brokers – 0.5% |
| | | | 5,225 | | | Merrill Lynch & Co., Inc. | | | 198,289 | |
| | |
|
| | | Chemicals – 1.4% |
| | | | 8,725 | | | Praxair, Inc. | | | 504,043 | |
| | |
|
| | | Computer Hardware – 1.4% |
| | | | 25,300 | | | Apple Computer, Inc.* | | | 362,549 | |
| | | | 10,400 | | | Cisco Systems, Inc.* | | | 136,240 | |
| | | | | | | | | |
| |
| | | | | | | | | | 498,789 | |
| | |
|
| | | Computer Software – 0.8% |
| | | | 5,800 | | | Microsoft Corp.* | | | 299,860 | |
| | |
|
| | | Defense/ Aerospace – 3.2% |
| | | | 8,375 | | | General Dynamics Corp. | | | 664,724 | |
| | | | 8,614 | | | United Technologies Corp. | | | 533,551 | |
| | | | | | | | | |
| |
| | | | | | | | | | 1,198,275 | |
| | |
|
| | | Department Stores – 0.9% |
| | | | 14,904 | | | The May Department Stores Co. | | | 342,494 | |
| | |
|
| | | Drugs – 3.6% |
| | | | 24,800 | | | Pfizer, Inc. | | | 758,136 | |
| | | | 15,000 | | | Wyeth | | | 561,000 | |
| | | | | | | | | |
| |
| | | | | | | | | | 1,319,136 | |
| | |
|
| | | Electrical Utilities – 5.6% |
| | | | 27,358 | | | Energy East Corp. | | | 604,338 | |
| | | | 5,457 | | | Entergy Corp. | | | 248,785 | |
| | | | 6,099 | | | Exelon Corp. | | | 321,844 | |
| | | | 11,260 | | | FirstEnergy Corp. | | | 371,242 | |
| | | | 3,275 | | | FPL Group, Inc. | | | 196,926 | |
| | | | 9,221 | | | PPL Corp. | | | 319,784 | |
| | | | | | | | | |
| |
| | | | | | | | | | 2,062,919 | |
| | |
|
| | | Energy Resources – 10.6% |
| | | | 6,500 | | | Apache Corp. | | | 370,435 | |
| | | | 9,500 | | | BP PLC ADR | | | 386,175 | |
| | | | 15,300 | | | ConocoPhillips | | | 740,367 | |
| | | | 27,431 | | | Exxon Mobil Corp. | | | 958,439 | |
| | | | 12,200 | | | Murphy Oil Corp. | | | 522,770 | |
| | | | 33,150 | | | Ocean Energy, Inc. | | | 662,005 | |
| | | | 10,379 | | | Pioneer Natural Resources Co.* | | | 262,070 | |
| | | | | | | | | |
| |
| | | | | | | | | | 3,902,261 | |
| | |
|
| | | Environmental Services – 0.7% |
| | | | 11,573 | | | Waste Management, Inc. | | | 265,253 | |
| | |
|
| | | Financial Services – 4.5% |
| | | | 8,921 | | | Countrywide Credit Industries, Inc. | | | 460,770 | |
| | | | 1,743 | | | Fannie Mae | | | 112,127 | |
| | | | 13,282 | | | Freddie Mac | | | 784,302 | |
| | | | 2,971 | | | SLM Corp. | | | 308,568 | |
| | | | | | | | | |
| |
| | | | | | | | | | 1,665,767 | |
| | |
|
| | | Food & Beverage – 3.3% |
| | | | 26,975 | | | ConAgra Foods, Inc. | | | 674,645 | |
| | | | 13,127 | | | H.J. Heinz Co. | | | 431,484 | |
| | | | 1,490 | | | Hershey Foods Corp. | | | 100,486 | |
| | | | | | | | | |
| |
| | | | | | | | | | 1,206,615 | |
| | |
|
| | | Forest – 1.1% |
| | | | 9,386 | | | Bowater, Inc. | | | 393,743 | |
| | |
|
| | | Gas Utilities – 1.0% |
| | | | 10,752 | | | KeySpan Corp. | | | 378,901 | |
| | |
|
| | | Heavy Electrical – 0.8% |
| | | | 2,254 | | | 3M Co. | | | 277,918 | |
| | |
|
| | | Heavy Machinery – 1.0% |
| | | | 7,948 | | | Deere & Co. | | | 364,416 | |
| | |
|
| | | Home Products – 4.3% |
| | | | 9,300 | | | Avon Products, Inc. | | | 500,991 | |
| | | | 7,740 | | | Kimberly-Clark Corp. | | | 367,418 | |
| | | | 8,466 | | | The Procter & Gamble Co. | | | 727,568 | |
| | | | | | | | | |
| |
| | | | | | | | | | 1,595,977 | |
| | |
|
| | | Industrial Parts – 2.3% |
| | | | 5,325 | | | American Standard Companies, Inc.* | | | 378,821 | |
| | | | 7,500 | | | Illinois Tool Works, Inc. | | | 486,450 | |
| | | | | | | | | |
| |
| | | | | | | | | | 865,271 | |
| | |
|
| | | Information Services – 1.7% |
| | | | 35,595 | | | Accenture Ltd.* | | | 640,354 | |
| | |
|
| | | Life Insurance – 2.8% |
| | | | 12,001 | | | John Hancock Financial Services, Inc. | | | 334,828 | |
| | | | 11,100 | | | MetLife, Inc. | | | 300,144 | |
| | | | 12,650 | | | The Principal Financial Group, Inc. | | | 381,144 | |
| | | | | | | | | |
| |
| | | | | | | | | | 1,016,116 | |
| | |
|
| | | Media – 3.7% |
| | | | 7,650 | | | Cox Communications, Inc.* | | | 217,260 | |
| | | | 33,579 | | | Fox Entertainment Group, Inc.* | | | 870,704 | |
| | | | 25,100 | | | General Motors Corp. Class H* | | | 268,570 | |
| | | | | | | | | |
| |
| | | | | | | | | | 1,356,534 | |
| | |
|
The accompanying notes are an integral part of these financial statements. 5
GOLDMAN SACHS VARIABLE INSURANCE TRUST GROWTH AND INCOME FUND
Statement of Investments (continued)
December 31, 2002
| | | | | | | | | | | |
| | | | | | |
| | Shares | | Description | | Value |
| | |
Common Stocks – (continued) |
|
| | | Mining – 0.5% |
| | | | 8,185 | | | Alcoa, Inc. | | $ | 186,454 | |
| | |
|
| | | Office Industrial – 2.4% |
| | | | 7,425 | | | Boston Properties, Inc. | | | 273,686 | |
| | | | 15,775 | | | Equity Office Properties Trust | | | 394,059 | |
| | | | 6,864 | | | Liberty Property Trust | | | 219,236 | |
| | | | | | | | | |
| |
| | | | | | | | | | 886,981 | |
| | |
|
| | | Oil Services – 1.0% |
| | | | 11,200 | | | BJ Services Co.* | | | 361,872 | |
| | |
|
| | | Other REIT – 0.3% |
| | | | 3,900 | | | iStar Financial, Inc. | | | 109,395 | |
| | |
|
| | | Property Insurance – 5.8% |
| | | | 12,725 | | | PartnerRe Ltd. | | | 659,410 | |
| | | | 17,742 | | | RenaissanceRe Holdings Ltd. | | | 702,583 | |
| | | | 5,900 | | | The St. Paul Companies, Inc. | | | 200,895 | |
| | | | 7,468 | | | XL Capital Ltd. | | | 576,903 | |
| | | | | | | | | |
| |
| | | | | | | | | | 2,139,791 | |
| | |
|
| | | Publishing – 0.5% |
| | | | 4,440 | | | Dow Jones & Co., Inc. | | | 191,941 | |
| | |
|
| | | Railroads – 0.8% |
| | | | 6,913 | | | Canadian National Railway Co. | | | 287,304 | |
| | |
|
| | | Retail – 1.0% |
| | | | 11,150 | | | Simon Property Group, Inc. | | | 379,881 | |
| | |
|
| | | Security/ Asset Management – 1.3% |
| | | | 15,875 | | | Alliance Capital Management Holding L.P. | | | 492,125 | |
| | |
|
| | | Telephone – 5.7% |
| | | | 4,908 | | | AT&T Corp. | | | 128,148 | |
| | | | 29,300 | | | BellSouth Corp. | | | 757,991 | |
| | | | 45,400 | | | SBC Communications, Inc. | | | 1,230,794 | |
| | | | | | | | | |
| |
| | | | | | | | | | 2,116,933 | |
| | |
|
| | | Tobacco – 2.8% |
| | | | 21,218 | | | Philip Morris Companies, Inc. | | | 859,966 | |
| | | | 5,400 | | | UST, Inc. | | | 180,522 | |
| | | | | | | | | |
| |
| | | | | | | | | | 1,040,488 | |
| | |
|
| | | TOTAL COMMON STOCKS |
| | | (Cost $36,605,804) | | $ | 35,759,272 | |
| | |
|
| | | | | | | | | | | | | | | | | |
| | | | | | | | |
| | Principal | | Interest | | Maturity | | |
| | Amount | | Rate | | Date | | |
| | | | | | | | Value |
| | |
Repurchase Agreement – 3.2% |
|
| | | Joint Repurchase Agreement Account II^ |
| | | $ | 1,200,000 | | | | 1.25 | % | | | 01/02/2003 | | | $ | 1,200,000 | |
| | | Maturity Value: $1,200,083 |
| | |
|
| | | TOTAL REPURCHASE AGREEMENT |
| | | (Cost $1,200,000) | | $ | 1,200,000 | |
| | |
|
| | | TOTAL INVESTMENTS BEFORE SECURITIES LENDING COLLATERAL |
| | | (Cost $37,805,804) | | $ | 36,959,272 | |
| | |
|
| | | | | | | | | | | |
| | | | | | |
| | Shares | | Description | | Value |
| | |
Securities Lending Collateral – 1.3% |
|
| | | | 480,000 | | | Boston Global Investment Trust – Enhanced Portfolio | | $ | 480,000 | |
| | |
|
| | | TOTAL SECURITIES LENDING COLLATERAL |
| | | (Cost $480,000) | | $ | 480,000 | |
| | |
|
| | | TOTAL INVESTMENTS |
| | | (Cost $38,285,804) | | $ | 37,439,272 | |
| | |
|
| | |
| * | | Non-income producing security. |
| |
| ^ | | Joint repurchase agreement was entered into on December 31, 2002. |
| |
| | The percentage shown for each investment category reflects the value of investments in that category as a percentage of total net assets. |
| | | | | | | |
| | |
|
| | | Investment Abbreviation: |
| | | ADR | | — | | American Depositary Receipt |
| | | REIT | | — | | Real Estate Investment Trust |
| | |
|
6 The accompanying notes are an integral part of these financial statements.
GOLDMAN SACHS VARIABLE INSURANCE TRUST CORE U.S. EQUITY FUND
Shareholder Letter
Dear Shareholders:
This report provides an overview on the performance of the Goldman Sachs Variable Insurance Trust — CORE U.S. Equity Fund for the one-year period that ended December 31, 2002.
Market Review
All 13 sectors in the S&P 500 Index (the “Index”) posted negative performance, with Telecommunications posting the largest absolute negative returns, followed by the heavily weighted Technology, which also contributed (weight times performance) most negatively to the Index performance over the period.
Performance Review
Over the one-year period that ended December 31, 2002, the Fund generated a cumulative total return of -21.89%. Over the same time period, the Fund’s benchmark, the Standard & Poor’s 500 Index (with dividends reinvested) generated a cumulative total return of
- -22.10%.
The goal of the Fund is to very closely match the benchmark, both at the sector and the security level, reproducing the risk characteristics and sector exposures of the Index. We seek to outperform the benchmark by maintaining a similar risk profile but overweighting stocks we expect to outperform the benchmark, and underweighting those that we think may lag. The result is that the Fund’s absolute returns will generally track the Index’s fairly closely.
2002 was a difficult one for the U.S. equity market. The world economy continued to be plagued by political uncertainty, and financial scandals undermined investor confidence. Since in managing the Fund we do not take market timing bets but typically construct a portfolio that has industry exposure, size, and style characteristics that are very similar to its benchmark, the Fund was down significantly in absolute terms along with the Index.
Similar to the Index, all 13 sectors posted negative absolute returns in the Fund, particularly the Telecommunications sector, followed by the Commercial Services sector. The heavily weighted Technology sector, however, contributed (weight times performance) the most to the Fund’s negative absolute return over the year.
The outperformance of the Fund relative to the Index was largely due to the CORE stock selection criteria. Profitability and Momentum added the most to outperformance versus the benchmark, followed by Valuation. Earnings Quality and Fundamental Research also contributed positively to excess returns over the Index, albeit more modestly, for the period.
In terms of sectors, the Fund’s holdings in 6 of the 13 sectors had better results than their peers in the Index. Outperformance, particularly in heavily weighted sectors such as Financial, Technology and Health Care, outweighed the losses in other areas over the period and helped the Fund to slightly outperform its benchmark. On the downside, the Fund’s holdings in the Telecommunications sector detracted the most from relative returns for the year.
7
GOLDMAN SACHS VARIABLE INSURANCE TRUST CORE U.S. EQUITY FUND
Shareholder Letter (continued)
Investment Objective and Strategies
The Fund seeks long-term capital growth and dividend income through a broadly diversified portfolio of large-cap and blue chip equity securities representing all major sectors of the U.S. economy.
The portfolio employs a disciplined approach that combines fundamental investment research provided by Goldman, Sachs & Co.’s Global Investment Research Department and consensus opinions with quantitative analysis generated by the Asset Management Division’s proprietary model. This quantitative system evaluates each stock using many different criteria, including valuation measures, price momentum, earnings quality and profitability measures. While maintaining a profile close to that of the benchmark, those stocks ranked highly by the CORE multifactor model are selected to have overweight positions in the portfolio.
Portfolio Composition
Top 10 Portfolio Holdings as of December 31, 2002*
| | | | | | | |
| | | | % of Total |
| Company | | Business | | Net Assets |
| |
| |
|
| Microsoft Corp. | | Computer Software | | | 4.3 | % |
| Wal-Mart Stores, Inc | | Department Stores | | | 3.6 | % |
| Citigroup, Inc. | | Banks | | | 3.0 | % |
| Johnson & Johnson | | Drugs | | | 2.6 | % |
| Exxon Mobil Corp. | | Energy Resources | | | 2.6 | % |
| Bank of America Corp. | | Banks | | | 2.3 | % |
| General Electric Co. | | Financial Services | | | 2.2 | % |
| The Procter & Gamble Co. | | Home Products | | | 2.2 | % |
| Pfizer, Inc. | | Drugs | | | 2.1 | % |
| International Business Machines Corp. | | Computer Software | | | 1.9 | % |
* Opinions expressed in this report represent our present opinions only. Reference to individual securities should not be construed as a commitment that such securities will be retained in the Fund. From time to time, the Fund may change the individual securities it holds, the number or types of securities held and the markets in which it invests. References to individual securities do not constitute a recommendation to the investor to buy, hold or sell such securities. In addition, references to past performance of the Fund do not indicate future returns, which are not guaranteed and will vary. Furthermore, the value of shares of the Fund may fall as well as rise.
8
GOLDMAN SACHS VARIABLE INSURANCE TRUST CORE U.S. EQUITY FUND
Portfolio Outlook
Looking ahead, we continue to believe that cheaper stocks should outpace more expensive ones and good momentum stocks should do better than poor momentum stocks. We also prefer stocks about which fundamental research analysts are becoming more positive and companies with strong profit margins and sustainable earnings. As such, we anticipate remaining fully invested and expect that the value we add over time will be due to stock selection, as opposed to sector or size allocations.
We thank you for your investment and look forward to your continued confidence.
Goldman Sachs Quantitative Equity Portfolio Management Team
January 9, 2003
9
GOLDMAN SACHS VARIABLE INSURANCE TRUST CORE U.S. EQUITY FUND
Performance Summary
December 31, 2002
The following graph shows the value as of December 31, 2002, of a $10,000 investment made on February 13, 1998 (commencement of operations). For comparative purposes, the performance of the Fund’s benchmark (the Standard and Poor’s 500 Index (“S&P 500 Index”)) is shown. This performance data represents past performance and should not be considered indicative of future performance which will fluctuate with changes in market conditions. These performance fluctuations will cause an investor’s shares, when redeemed, to be worth more or less than their original cost. Returns do not reflect the deduction of taxes that a shareholder would pay on fund distributions or the redemption of fund shares.
| CORE U.S. Equity Fund’s Lifetime Performance |
Growth of a $10,000 Investment, Distributions Reinvested from February 13, 1998 to December 31, 2002.

| | | | | | | |
| | Since Inception | | One Year | | |
|
|
|
|
Average Annual Total Return Through December 31, 2002 |
|
|
|
|
CORE U.S. Equity Fund (commenced February 13, 1998) | | -2.44% | | -21.89% | | |
|
10
GOLDMAN SACHS VARIABLE INSURANCE TRUST CORE U.S. EQUITY FUND
Statement of Investments
December 31, 2002
| | | | | | | | | | | |
| | | | | | |
| | Shares | | Description | | Value |
| | |
Common Stocks – 99.3% |
|
| | | Airlines – 0.1% |
| | | | 12,100 | | | Delta Air Lines, Inc. | | $ | 146,410 | |
| | |
|
| | | Apparel – 0.2% |
| | | | 14,900 | | | Sara Lee Corp. | | | 335,399 | |
| | |
|
| | | Banks – 10.4% |
| | | | 10,600 | | | Associated Banc-Corp. | | | 359,764 | |
| | | | 47,231 | | | Bank of America Corp. | | | 3,285,861 | |
| | | | 8,800 | | | Bank One Corp. | | | 321,640 | |
| | | | 124,166 | | | Citigroup, Inc. | | | 4,369,401 | |
| | | | 31,300 | | | J.P. Morgan Chase & Co. | | | 751,200 | |
| | | | 1,800 | | | M&T Bank Corp. | | | 142,830 | |
| | | | 4,600 | | | Marshall & Ilsley Corp. | | | 125,948 | |
| | | | 4,200 | | | Regions Financial Corp. | | | 140,112 | |
| | | | 6,900 | | | SouthTrust Corp. | | | 171,465 | |
| | | | 25,700 | | | SunTrust Banks, Inc. | | | 1,462,844 | |
| | | | 61,900 | | | U.S. Bancorp | | | 1,313,518 | |
| | | | 8,400 | | | Union Planters Corp. | | | 236,376 | |
| | | | 51,100 | | | Wachovia Corp. | | | 1,862,084 | |
| | | | 6,600 | | | Wells Fargo & Co. | | | 309,342 | |
| | | | | | | | | |
| |
| | | | | | | | | | 14,852,385 | |
| | |
|
| | | Biotechnology – 2.4% |
| | | | 11,452 | | | Amgen, Inc.* | | | 553,590 | |
| | | | 36,900 | | | Applera Corp. – Applied Biosystems Group | | | 647,226 | |
| | | | 11,000 | | | Biogen, Inc.* | | | 440,660 | |
| | | | 17,500 | | | Chiron Corp.* | | | 658,000 | |
| | | | 32,600 | | | Gilead Sciences, Inc.* | | | 1,108,400 | |
| | | | | | | | | |
| |
| | | | | | | | | | 3,407,876 | |
| | |
|
| | | Brokers – 1.6% |
| | | | 21,100 | | | Merrill Lynch & Co., Inc. | | | 800,745 | |
| | | | 24,000 | | | The Bear Stearns Companies, Inc. | | | 1,425,600 | |
| | | | | | | | | |
| |
| | | | | | | | | | 2,226,345 | |
| | |
|
| | | Chemicals – 0.9% |
| | | | 5,500 | | | Air Products and Chemicals, Inc. | | | 235,125 | |
| | | | 3,600 | | | Avery Dennison Corp. | | | 219,888 | |
| | | | 3,300 | | | Carlisle Companies, Inc. | | | 136,554 | |
| | | | 3,100 | | | Ecolab, Inc. | | | 153,450 | |
| | | | 5,400 | | | Rohm & Haas Co. | | | 175,392 | |
| | | | 13,100 | | | The Goodyear Tire & Rubber Co. | | | 89,211 | |
| | | | 9,500 | | | The Sherwin-Williams Co. | | | 268,375 | |
| | | | | | | | | |
| |
| | | | | | | | | | 1,277,995 | |
| | |
|
| | | Clothing – 0.2% |
| | | | 20,900 | | | Limited Brands | | | 291,137 | |
| | |
|
| | | Computer Hardware – 4.2% |
| | | | 19,000 | | | Cisco Systems, Inc.* | | | 248,900 | |
| | | | 93,200 | | | Dell Computer Corp.* | | | 2,492,168 | |
| | | | 121,000 | | | Hewlett-Packard Co. | | | 2,100,560 | |
| | | | 83,500 | | | Ingram Micro, Inc.* | | | 1,031,225 | |
| | | | 5,400 | | | Tech Data Corp.* | | | 145,584 | |
| | | | | | | | | |
| |
| | | | | | | | | | 6,018,437 | |
| | |
|
| | | Computer Software – 7.2% |
| | | | 10,000 | | | Electronic Arts, Inc.* | | | 497,700 | |
| | | | 35,000 | | | International Business Machines Corp. | | | 2,712,500 | |
| | | | 118,800 | | | Microsoft Corp.* | | | 6,141,960 | |
| | | | 89,800 | | | Oracle Corp.* | | | 969,840 | |
| | | | | | | | | |
| |
| | | | | | | | | | 10,322,000 | |
| | |
|
| | | Defense/ Aerospace – 1.0% |
| | | | 7,600 | | | Honeywell International, Inc. | | | 182,400 | |
| | | | 5,400 | | | ITT Industries, Inc. | | | 327,726 | |
| | | | 4,700 | | | Lockheed Martin Corp. | | | 271,425 | |
| | | | 14,800 | | | Raytheon Co. | | | 455,100 | |
| | | | 4,500 | | | The Boeing Co. | | | 148,455 | |
| | | | | | | | | |
| |
| | | | | | | | | | 1,385,106 | |
| | |
|
| | | Department Stores – 4.1% |
| | | | 8,200 | | | Dillard’s, Inc. | | | 130,052 | |
| | | | 5,200 | | | Federated Department Stores, Inc.* | | | 149,552 | |
| | | | 9,100 | | | J. C. Penney Co., Inc. | | | 209,391 | |
| | | | 11,200 | | | Target Corp. | | | 336,000 | |
| | | | 101,000 | | | Wal-Mart Stores, Inc. | | | 5,101,510 | |
| | | | | | | | | |
| |
| | | | | | | | | | 5,926,505 | |
| | |
|
| | | Drugs – 10.4% |
| | | | 16,200 | | | Abbott Laboratories | | | 648,000 | |
| | | | 11,200 | | | AmerisourceBergen Corp. | | | 608,272 | |
| | | | 24,600 | | | Cardinal Health, Inc. | | | 1,456,074 | |
| | | | 5,100 | | | Forest Laboratories, Inc.* | | | 500,922 | |
| | | | 70,500 | | | Johnson & Johnson | | | 3,786,555 | |
| | | | 50,700 | | | McKesson Corp. | | | 1,370,421 | |
| | | | 47,500 | | | Merck & Co., Inc. | | | 2,688,975 | |
| | | | 96,650 | | | Pfizer, Inc. | | | 2,954,591 | |
| | | | 22,400 | | | Pharmacia Corp. | | | 936,320 | |
| | | | | | | | | |
| |
| | | | | | | | | | 14,950,130 | |
| | |
|
| | | Electrical Equipment – 0.6% |
| | | | 20,700 | | | Agilent Technologies, Inc.* | | | 371,772 | |
| | | | 10,700 | | | Fisher Scientific International, Inc.* | | | 321,856 | |
| | | | 5,700 | | | Jabil Circuit, Inc.* | | | 102,144 | |
| | | | 22,600 | | | Solectron Corp.* | | | 80,230 | |
| | | | | | | | | |
| |
| | | | | | | | | | 876,002 | |
| | |
|
| | | Electrical Utilities – 2.0% |
| | | | 22,100 | | | American Electric Power Co., Inc. | | | 603,993 | |
| | | | 5,100 | | | Constellation Energy Group, Inc. | | | 141,882 | |
| | | | 13,000 | | | Edison International* | | | 154,050 | |
| | | | 33,400 | | | Entergy Corp. | | | 1,522,706 | |
| | | | 13,800 | | | PG&E Corp.* | | | 191,820 | |
| | | | 6,400 | | | Progress Energy, Inc. | | | 277,440 | |
| | | | | | | | | |
| |
| | | | | | | | | | 2,891,891 | |
| | |
|
The accompanying notes are an integral part of these financial statements. 11
GOLDMAN SACHS VARIABLE INSURANCE TRUST CORE U.S. EQUITY FUND
Statement of Investments (continued)
December 31, 2002
| | | | | | | | | | | |
| | | | | | |
| | Shares | | Description | | Value |
| | |
Common Stocks – (continued) |
|
| | | Energy Resources – 4.8% |
| | | | 41,023 | | | ConocoPhillips | | $ | 1,985,103 | |
| | | | 107,212 | | | Exxon Mobil Corp. | | | 3,745,987 | |
| | | | 39,600 | | | Occidental Petroleum Corp. | | | 1,126,620 | |
| | | | | | | | | |
| |
| | | | | | | | | | 6,857,710 | |
| | |
|
| | | Entertainment – 1.3% |
| | | | 47,373 | | | Viacom, Inc. Class B* | | | 1,930,923 | |
| | |
|
| | | Environmental Services – 0.4% |
| | | | 26,700 | | | Waste Management, Inc. | | | 611,964 | |
| | |
|
| | | Financial Services – 4.3% |
| | | | 46,200 | | | American Express Co. | | | 1,633,170 | |
| | | | 2,800 | | | Countrywide Credit Industries, Inc. | | | 144,620 | |
| | | | 4,000 | | | Dun & Bradstreet Corp.* | | | 137,960 | |
| | | | 3,400 | | | Freddie Mac | | | 200,770 | |
| | | | 131,800 | | | General Electric Co. | | | 3,209,330 | |
| | | | 3,200 | | | Marsh & McLennan Companies, Inc. | | | 147,872 | |
| | | | 33,600 | | | MBNA Corp. | | | 639,072 | |
| | | | | | | | | |
| |
| | | | | | | | | | 6,112,794 | |
| | |
|
| | | Food & Beverage – 4.6% |
| | | | 28,200 | | | Archer-Daniels-Midland Co. | | | 349,680 | |
| | | | 28,000 | | | ConAgra Foods, Inc. | | | 700,280 | |
| | | | 36,600 | | | Kraft Foods, Inc. | | | 1,424,838 | |
| | | | 16,400 | | | PepsiCo, Inc. | | | 692,408 | |
| | | | 38,500 | | | SUPERVALU, INC. | | | 635,635 | |
| | | | 56,300 | | | Sysco Corp. | | | 1,677,177 | |
| | | | 11,100 | | | The Coca-Cola Co. | | | 486,402 | |
| | | | 55,100 | | | Tyson Foods, Inc. | | | 618,222 | |
| | | | | | | | | |
| |
| | | | | | | | | | 6,584,642 | |
| | |
|
| | | Forest – 0.3% |
| | | | 4,100 | | | International Paper Co. | | | 143,377 | |
| | | | 6,300 | | | Weyerhaeuser Co. | | | 310,023 | |
| | | | | | | | | |
| |
| | | | | | | | | | 453,400 | |
| | |
|
| | | Gas Utilities – 0.2% |
| | | | 16,300 | | | ONEOK, Inc. | | | 312,960 | |
| | |
|
| | | Gold – 0.2% |
| | | | 8,900 | | | Freeport-McMoRan Copper & Gold, Inc. Class B* | | | 149,342 | |
| | | | 4,800 | | | Newmont Mining Corp., Holding Co. | | | 139,344 | |
| | | | | | | | | |
| |
| | | | | | | | | | 288,686 | |
| | |
|
| | | Heavy Electrical – 1.5% |
| | | | 12,600 | | | 3M Co. | | | 1,553,580 | |
| | | | 10,700 | | | Emerson Electric Co. | | | 544,095 | |
| | | | | | | | | |
| |
| | | | | | | | | | 2,097,675 | |
| | |
|
| |
| | | Heavy Machinery – 0.3% |
| | | | 8,900 | | | Deere & Co. | | | 408,065 | |
| | |
|
| | | Home Products – 4.1% |
| | | | 21,500 | | | Avon Products, Inc. | | | 1,158,205 | |
| | | | 7,300 | | | Colgate-Palmolive Co. | | | 382,739 | |
| | | | 20,500 | | | Newell Rubbermaid Inc. | | | 621,765 | |
| | | | 14,300 | | | The Clorox Co. | | | 589,875 | |
| | | | 36,300 | | | The Procter & Gamble Co. | | | 3,119,622 | |
| | | | | | | | | |
| |
| | | | | | | | | | 5,872,206 | |
| | |
|
| | | Industrial Parts – 0.3% |
| | | | 7,100 | | | W.W. Grainger, Inc. | | | 366,005 | |
| | |
|
| | | Information Services – 1.1% |
| | | | 38,200 | | | Moody’s Corp. | | | 1,577,278 | |
| | |
|
| | | Internet – 0.2% |
| | | | 19,400 | | | Yahoo!, Inc.* | | | 317,190 | |
| | |
|
| | | Leisure – 0.6% |
| | | | 20,400 | | | Eastman Kodak Co. | | | 714,816 | |
| | | | 3,100 | | | Harley-Davidson, Inc. | | | 143,220 | |
| | | | | | | | | |
| |
| | | | | | | | | | 858,036 | |
| | |
|
| | | Life Insurance – 3.2% |
| | | | 19,000 | | | Aetna, Inc. | | | 781,280 | |
| | | | 4,600 | | | John Hancock Financial Services, Inc. | | | 128,340 | |
| | | | 51,900 | | | MetLife, Inc. | | | 1,403,376 | |
| | | | 15,500 | | | Nationwide Financial Services, Inc. | | | 444,075 | |
| | | | 6,000 | | | Principal Financial Group, Inc. | | | 180,780 | |
| | | | 51,000 | | | Prudential Financial, Inc. | | | 1,618,740 | |
| | | | | | | | | |
| |
| | | | | | | | | | 4,556,591 | |
| | |
|
| | | Media – 3.5% |
| | | | 187,450 | | | AOL Time Warner, Inc.* | | | 2,455,595 | |
| | | | 39,495 | | | Comcast Corp.* | | | 930,897 | |
| | | | 54,300 | | | Fox Entertainment Group, Inc.* | | | 1,407,999 | |
| | | | 12,900 | | | PanAmSat Corp.* | | | 188,856 | |
| | | | | | | | | |
| |
| | | | | | | | | | 4,983,347 | |
| | |
|
| | | Medical Products – 0.9% |
| | | | 23,100 | | | Boston Scientific Corp.* | | | 982,212 | |
| | | | 3,600 | | | Medtronic, Inc. | | | 164,160 | |
| | | | 4,500 | | | Zimmer Holdings, Inc.* | | | 186,840 | |
| | | | | | | | | |
| |
| | | | | | | | | | 1,333,212 | |
| | |
|
| | | Medical Providers – 1.2% |
| | | | 7,900 | | | Health Net, Inc.* | | | 208,560 | |
| | | | 13,400 | | | PacifiCare Health Systems, Inc.* | | | 376,540 | |
| | | | 14,100 | | | UnitedHealth Group, Inc. | | | 1,177,350 | |
| | | | | | | | | |
| |
| | | | | | | | | | 1,762,450 | |
| | |
|
12 The accompanying notes are an integral part of these financial statements.
GOLDMAN SACHS VARIABLE INSURANCE TRUST CORE U.S. EQUITY FUND
| | | | | | | | | | | |
| | | | | | |
| | Shares | | Description | | Value |
| | |
Common Stocks – (continued) |
|
| | | Motor Vehicle – 3.2% |
| | | | 83,900 | | | AutoNation, Inc.* | | $ | 1,053,784 | |
| | | | 19,200 | | | Ford Motor Co. | | | 178,560 | |
| | | | 49,300 | | | General Motors Corp. | | | 1,817,198 | |
| | | | 18,300 | | | Johnson Controls, Inc. | | | 1,467,111 | |
| | | | 19,100 | | | Visteon Corp. | | | 132,936 | |
| | | | | | | | | |
| |
| | | | | | | | | | 4,649,589 | |
| | |
|
| | | Office Industrial – 0.2% |
| | | | 10,800 | | | Equity Office Properties Trust | | | 269,784 | |
| | |
|
| | | Oil Refining – 0.9% |
| | | | 7,600 | | | Marathon Oil Corp. | | | 161,804 | |
| | | | 30,200 | | | Valero Energy Corp. | | | 1,115,588 | |
| | | | | | | | | |
| |
| | | | | | | | | | 1,277,392 | |
| | |
|
| | | Oil Services – 1.1% |
| | | | 7,400 | | | Halliburton Co. | | | 138,454 | |
| | | | 63,000 | | | Transocean, Inc. | | | 1,461,600 | |
| | | | | | | | | |
| |
| | | | | | | | | | 1,600,054 | |
| | |
|
| | | Property Insurance – 2.6% |
| | | | 6,300 | | | American Financial Group, Inc. | | | 145,341 | |
| | | | 21,206 | | | American International Group, Inc. | | | 1,226,767 | |
| | | | 22,100 | | | CNA Financial Corp.* | | | 565,760 | |
| | | | 34,900 | | | Loews Corp. | | | 1,551,654 | |
| | | | 18,421 | | | Travelers Property Casualty Corp. Class B* | | | 269,868 | |
| | | | | | | | | |
| |
| | | | | | | | | | 3,759,390 | |
| | |
|
| | | Publishing – 1.2% |
| | | | 23,700 | | | Deluxe Corp. | | | 997,770 | |
| | | | 12,200 | | | The McGraw-Hill Companies, Inc. | | | 737,368 | |
| | | | | | | | | |
| |
| | | | | | | | | | 1,735,138 | |
| | |
|
| | | Securities/ Asset Management – 1.3% |
| | | | 11,200 | | | Franklin Resources, Inc. | | | 381,696 | |
| | | | 21,800 | | | Lehman Brothers Holdings, Inc. | | | 1,161,722 | |
| | | | 3,500 | | | Morgan Stanley | | | 139,720 | |
| | | | 5,300 | | | The John Nuveen Co. | | | 134,355 | |
| | | | | | | | | |
| |
| | | | | | | | | | 1,817,493 | |
| | |
|
| | | Semiconductors – 2.0% |
| | | | 34,000 | | | Arrow Electronics, Inc.* | | | 434,860 | |
| | | | 57,200 | | | Avnet, Inc.* | | | 619,476 | |
| | | | 86,400 | | | Intel Corp. | | | 1,345,248 | |
| | | | 15,200 | | | SanDisk Corp.* | | | 308,560 | |
| | | | 13,000 | | | Vishay Intertechnology, Inc.* | | | 145,340 | |
| | | | | | | | | |
| |
| | | | | | | | | | 2,853,484 | |
| | |
|
| | | Specialty Retail – 1.4% |
| | | | 1,900 | | | AutoZone, Inc.* | | | 134,235 | |
| | | | 14,300 | | | CVS Corp. | | | 357,071 | |
| | | | 41,600 | | | Office Depot, Inc.* | | | 614,016 | |
| | | | 51,800 | | | Staples, Inc.* | | | 947,940 | |
| | | | | | | | | |
| |
| | | | | | | | | | 2,053,262 | |
| | |
|
| | | Telecommunications Equipment – 0.6% |
| | | | 60,600 | | | Motorola, Inc. | | | 524,190 | |
| | | | 10,000 | | | QUALCOMM Inc.* | | | 363,900 | |
| | | | | | | | | |
| |
| | | | | | | | | | 888,090 | |
| | |
|
| | | Telephone – 3.6% |
| | | | 14,013 | | | AT&T Corp. | | | 365,879 | |
| | | | 17,100 | | | BellSouth Corp. | | | 442,377 | |
| | | | 47,422 | | | SBC Communications, Inc. | | | 1,285,610 | |
| | | | 83,600 | | | Sprint Corp. | | | 1,210,528 | |
| | | | 49,194 | | | Verizon Communications, Inc. | | | 1,906,268 | |
| | | | | | | | | |
| |
| | | | | | | | | | 5,210,662 | |
| | |
|
| | | Tobacco – 1.2% |
| | | | 7,200 | | | Loews Corp. - Carolina Group | | | 145,944 | |
| | | | 3,500 | | | Philip Morris Companies, Inc. | | | 141,855 | |
| | | | 33,600 | | | R.J. Reynolds Tobacco Holdings, Inc. | | | 1,414,896 | |
| | | | | | | | | |
| |
| | | | | | | | | | 1,702,695 | |
| | |
|
| | | Truck Freight – 0.6% |
| | | | 5,600 | | | FedEx Corp. | | | 303,632 | |
| | | | 7,900 | | | United Parcel Service, Inc. | | | 498,332 | |
| | | | | | | | | |
| |
| | | | | | | | | | 801,964 | |
| | |
|
| | | Wireless – 1.1% |
| | | | 22,600 | | | ALLTEL Corp. | | | 1,152,600 | |
| | | | 48,124 | | | AT&T Wireless Services, Inc.* | | | 271,901 | |
| | | | 2,400 | | | Telephone & Data Systems, Inc. | | | 112,848 | |
| | | | 500 | | | United States Cellular Corp.* | | | 12,510 | |
| | | | | | | | | |
| |
| | | | | | | | | | 1,549,859 | |
| | |
|
| | | TOTAL COMMON STOCKS |
| | | (Cost $156,928,749) | | $ | 142,361,608 | |
| | |
|
The accompanying notes are an integral part of these financial statements. 13
GOLDMAN SACHS VARIABLE INSURANCE TRUST CORE U.S. EQUITY FUND
Statement of Investments (continued)
December 31, 2002
| | | | | | | | | | | | | | | | | |
| | | | | | | | |
| | Principal | | Interest | | Maturity | | |
| | Amount | | Rate | | Date | | Value |
| | |
Repurchase Agreement – 0.2% |
|
| | | Joint Repurchase Agreement Account II^ |
| | | $ | 300,000 | | | | 1.25% | | | | 01/02/2003 | | | $ | 300,000 | |
| | | Maturity Value: $300,021 |
| | |
|
| | | TOTAL REPURCHASE AGREEMENT |
| | | (Cost $300,000) | | $ | 300,000 | |
| | |
|
| | | TOTAL INVESTMENTS |
| | | (Cost $157,228,749) | | $ | 142,661,608 | |
| | |
|
| | |
| * | | Non-income producing security. |
| ^ | | Joint repurchase agreement was entered into on December 31, 2002. |
| |
| | The percentage shown for each investment category reflects the value of investments in that category as a percentage of total net assets. |
14 The accompanying notes are an integral part of these financial statements.
GOLDMAN SACHS VARIABLE INSURANCE TRUST CORE SMALL CAP EQUITY FUND
Shareholder Letter
Dear Shareholders:
This report provides an overview on the performance of the Goldman Sachs Variable Insurance Trust — CORE Small Cap Equity Fund for the one-year period that ended December 31, 2002.
Market Review
Within the Russell 2000 Index (the “Index”), only one sector — Financials — generated positive absolute returns for the year. Telecommunications emerged as the worst absolute performer, down 62%, followed by the heavily weighted Technology, which contributed (weight times performance) the most to the Index decline.
Performance Review
Over the one-year period that ended December 31, 2002, the Fund generated a cumulative total return of -14.97%. Over the same time period, the Fund’s benchmark, the Russell 2000 Index (with dividends reinvested), generated a cumulative total return of -20.48%.
The goal of the Fund is to very closely match the benchmark, both at the sector and the security level, reproducing the risk characteristics and sector exposures of the Index. We seek to outperform the benchmark by maintaining a similar risk profile but overweighting stocks we expect to outperform the benchmark, and underweighting those that we think may lag. The result is that the Fund’s absolute returns will generally track the Index’s fairly closely.
2002 was a difficult one for the U.S. equity market. The world economy continued to be plagued by political uncertainty, and financial scandals undermined investor confidence. Since in managing the Fund we do not take market timing bets but typically construct a portfolio that has industry exposure, size, and style characteristics that are very similar to its benchmark, the Fund was down significantly in absolute terms along with the Index.
Similar to the Index, absolute sector performance in the Fund was weak, with only 1 (Financial) of 13 sectors posting a positive return. Telecommunications was the worst absolute performer, followed by Technology, which was also the biggest negative contributor (weight times performance) to the Fund’s negative absolute return for the year.
The outperformance of the Fund relative to the Index was largely due to the CORE stock selection criteria Profitability contributed the most to outperformance versus the benchmark. Following at some distance was Momentum, which struggled in the fourth quarter 2002. Valuation and Earnings Quality also contributed positively to excess returns over the Index, while returns to Fundamental Research were flatter for the year.
In terms of sectors, the Fund’s holdings in 8 of the 13 sectors had better performance than their peers in the Index. While the Fund’s holdings in the weighted Technology and Healthcare sectors declined in value, they outperformed those areas in the benchmark on a relative basis. Conversely, the Fund’s holdings in the Energy and Consumer Non-Cyclicals sectors detracted the most from relative performance.
15
GOLDMAN SACHS VARIABLE INSURANCE TRUST CORE SMALL CAP EQUITY FUND
Shareholder Letter (continued)
Investment Objective
The Fund seeks long-term capital growth, primarily through a broadly diversified portfolio of equity securities of U.S. issuers with risk characteristics similar to those of the Russell 2000 Index.
The portfolio employs a disciplined approach that combines fundamental investment research provided by Goldman, Sachs & Co.’s Global Investment Research Department and consensus opinions with quantitative analysis generated by the Asset Management Division’s proprietary model. This quantitative system evaluates each stock using many different criteria, including valuation measures, price momentum, earnings quality and profitability measures. While maintaining a profile close to that of the benchmark, those stocks ranked highly by the CORE multifactor model are selected to have overweight positions in the portfolio.
Portfolio Composition
Top 10 Portfolio Holdings as of December 31, 2002*
| | | | | | | |
| | | | % of Total |
| Company | | Business | | Net Assets |
| |
| |
|
| ONEOK, Inc. | | Gas Utilities | | | 1.1 | % |
| Techne Corp. | | Biotechnology | | | 0.8 | |
| Benchmark Electronics, Inc | | Electrical Equipment | | | 0.8 | |
| Pioneer-Standard Electronics, Inc. | | Electrical Equipment | | | 0.7 | |
| The Toro Co. | | Consumer Durables | | | 0.7 | |
| Western Digital Corp. | | Computer Hardware | | | 0.7 | |
| IDEXX Laboratories, Inc. | | Drugs | | | 0.7 | |
| Anixter International, Inc. | | Electrical Equipment | | | 0.6 | |
| IDT Corp. | | Telephone | | | 0.6 | |
| Carlisle Companies, Inc. | | Chemicals | | | 0.6 | |
* Opinions expressed in this report represent our present opinions only. Reference to individual securities should not be construed as a commitment that such securities will be retained in the Fund. From time to time, the Fund may change the individual securities it holds, the number or types of securities held and the markets in which it invests. References to individual securities do not constitute a recommendation to the investor to buy, hold or sell such securities. In addition, references to past performance of the Fund do not indicate future returns, which are not guaranteed and will vary. Furthermore, the value of shares of the Fund may fall as well as rise.
Portfolio Outlook
Looking ahead, we continue to believe that cheaper stocks should outpace more expensive ones and good momentum stocks should do better than poor momentum stocks. We also prefer stocks about which fundamental research analysts are becoming more positive and companies with strong profit margins and sustainable earnings. As such, we anticipate remaining fully invested and expect that the value we add over time will be due to stock selection as opposed to sector or size allocations.
We thank you for your investment and look forward to your continued confidence.
Goldman Sachs Quantitative Equity Management Team
January 9, 2003
16
GOLDMAN SACHS VARIABLE INSURANCE TRUST CORE SMALL CAP EQUITY FUND
Performance Summary
December 31, 2002
The following graph shows the value as of December 31, 2002, of a $10,000 investment made February 13, 1998 (commencement of operations). For comparative purposes, the performance of the Fund’s benchmark (the Russell 2000 Index) is shown. All performance data shown represents past performance and should not be considered indicative of future performance which will fluctuate with changes in market conditions. These performance fluctuations will cause an investor’s shares, when redeemed, to be worth more or less than their original cost. Returns do not reflect the deduction of taxes that a shareholder would pay on fund distributions or the redemption of fund shares.
| CORE Small Cap Equity Fund’s Lifetime Performance |
Growth of a $10,000 investment, Distributions Reinvested from February 13, 1998 to December 31, 2002.

| | | | | | | |
| | Since Inception | | One Year | | |
|
|
|
|
Average Annual Total Return Through December 31, 2002 |
|
|
|
|
CORE Small Cap Equity Fund (commenced February 13, 1998) | | -0.74% | | -14.97% | | |
|
17
GOLDMAN SACHS VARIABLE INSURANCE TRUST CORE SMALL CAP EQUITY FUND
Statement of Investments
December 31, 2002
| | | | | | | | | | | |
| | | | | | |
| | Shares | | Description | | Value |
| | |
Common Stocks – 99.2% |
|
| | | Airlines – 0.4% |
| | | | 3,700 | | | Alaska Air Group, Inc.* | | $ | 80,105 | |
| | | | 6,200 | | | Continental Airlines, Inc. Class B* | | | 44,950 | |
| | | | 4,200 | | | Delta Air Lines, Inc. | | | 50,820 | |
| | | | 4,600 | | | Midwest Express Holdings, Inc.* | | | 24,610 | |
| | | | | | | | | |
| |
| | | | | | | | | | 200,485 | |
| | |
|
| | | Alcohol – 0.2% |
| | | | 2,400 | | | The Robert Mondavi Corp.* | | | 74,400 | |
| | |
|
| | | Apartment – 0.2% |
| | | | 4,600 | | | Mid-America Apartment Communities, Inc. | | | 112,470 | |
| | |
|
| | | Apparel – 0.9% |
| | | | 7,100 | | | Kellwood Co. | | | 184,600 | |
| | | | 3,800 | | | Quaker Fabric Corp.* | | | 26,410 | |
| | | | 27,300 | | | Skechers U.S.A., Inc.* | | | 231,777 | |
| | | | | | | | | |
| |
| | | | | | | | | | 442,787 | |
| | |
|
| | | Banks – 6.7% |
| | | | 1,500 | | | Bank of Hawaii Corp. | | | 45,585 | |
| | | | 3,200 | | | Berkshire Hills Bancorp, Inc. | | | 75,360 | |
| | | | 2,200 | | | Capital City Bank Group, Inc. | | | 86,218 | |
| | | | 11,100 | | | Commercial Federal Corp. | | | 259,185 | |
| | | | 5,300 | | | Corus Bankshares, Inc. | | | 231,398 | |
| | | | 5,500 | | | East West Bancorp, Inc. | | | 198,440 | |
| | | | 1,700 | | | First BanCorp. | | | 38,420 | |
| | | | 2,800 | | | First Citizens BancShares, Inc. | | | 270,480 | |
| | | | 3,100 | | | Flushing Financial Corp. | | | 50,772 | |
| | | | 3,237 | | | Fulton Financial Corp. | | | 57,165 | |
| | | | 2,300 | | | GBC Bancorp | | | 44,528 | |
| | | | 4,300 | | | Hancock Holding Co. | | | 191,995 | |
| | | | 6,000 | | | Independence Community Bank Corp. | | | 152,280 | |
| | | | 6,900 | | | OceanFirst Financial Corp. | | | 154,905 | |
| | | | 5,066 | | | Pacific Capital Bancorp | | | 128,930 | |
| | | | 2,700 | | | Port Financial Corp. | | | 120,474 | |
| | | | 4,200 | | | Prosperity Bancshares, Inc. | | | 79,800 | |
| | | | 2,900 | | | Provident Financial Group, Inc. | | | 75,487 | |
| | | | 2,600 | | | Silicon Valley Bancshares* | | | 47,450 | |
| | | | 4,200 | | | Sterling Bancorp | | | 110,544 | |
| | | | 3,200 | | | Sterling Bancshares, Inc. | | | 39,104 | |
| | | | 5,800 | | | Susquehanna Bancshares, Inc. | | | 120,878 | |
| | | | 1,300 | | | Texas Regional Bancshares, Inc. | | | 46,203 | |
| | | | 6,600 | | | Trustmark Corp. | | | 156,618 | |
| | | | 3,570 | | | UMB Financial Corp. | | | 136,592 | |
| | | | 4,600 | | | Unizan Financial Corp. | | | 90,850 | |
| | | | 4,950 | | | Wintrust Financial Corp. | | | 155,034 | |
| | | | | | | | | |
| |
| | | | | | | | | | 3,164,695 | |
| | |
|
| | | Biotechnology – 5.3% |
| | | | 1,800 | | | Affymetrix, Inc.* | | | 41,202 | |
| | | | 3,100 | | | Albany Molecular Research, Inc.* | | | 45,852 | |
| | | | 2,200 | | | Alexion Pharmaceuticals, Inc.* | | | 31,064 | |
| | | | 9,600 | | | Applera Corp. — Celera Genomics Group* | | | 91,680 | |
| | | | 1,900 | | | Bio-Rad Laboratories, Inc.* | | | 73,530 | |
| | | | 7,400 | | | Celgene Corp.* | | | 158,878 | |
| | | | 6,600 | | | Cell Genesys, Inc.* | | | 73,597 | |
| | | | 5,400 | | | Cephalon, Inc.* | | | 262,807 | |
| | | | 1,500 | | | Charles River Laboratories International, Inc.* | | | 57,720 | |
| | | | 10,500 | | | Connetics Corp.* | | | 126,210 | |
| | | | 6,700 | | | Corixa Corp.* | | | 42,813 | |
| | | | 3,300 | | | Enzo Biochem, Inc.* | | | 46,200 | |
| | | | 8,200 | | | Gene Logic, Inc.* | | | 51,578 | |
| | | | 8,450 | | | Immucor, Inc.* | | | 171,112 | |
| | | | 12,800 | | | Isis Pharmaceuticals, Inc.* | | | 84,352 | |
| | | | 7,800 | | | Kos Pharmaceuticals, Inc.* | | | 148,200 | |
| | | | 4,700 | | | Lexicon Genetics, Inc.* | | | 22,231 | |
| | | | 3,300 | | | Maxygen, Inc.* | | | 25,146 | |
| | | | 4,800 | | | Protein Design Labs, Inc.* | | | 40,800 | |
| | | | 3,200 | | | Scios, Inc.* | | | 104,256 | |
| | | | 10,800 | | | Serologicals Corp.* | | | 118,800 | |
| | | | 8,900 | | | SICOR, Inc.* | | | 141,065 | |
| | | | 13,200 | | | Techne Corp.* | | | 377,098 | |
| | | | 3,500 | | | United Therapeutics Corp.* | | | 58,450 | |
| | | | 6,300 | | | Vertex Pharmaceuticals, Inc.* | | | 99,855 | |
| | | | 3,500 | | | Vical, Inc.* | | | 12,145 | |
| | | | | | | | | |
| |
| | | | | | | | | | 2,506,641 | |
| | |
|
| | | Brokers – 0.2% |
| | | | 3,800 | | | LaBranche & Co., Inc.* | | | 101,232 | |
| | |
|
| | | Chemicals – 3.0% |
| | | | 12,900 | | | A. Schulman, Inc. | | | 240,069 | |
| | | | 11,400 | | | Arch Chemicals, Inc. | | | 208,050 | |
| | | | 3,000 | | | Brady Corp. | | | 100,050 | |
| | | | 6,700 | | | Carlisle Companies, Inc. | | | 277,246 | |
| | | | 7,600 | | | Crompton Corp. | | | 45,220 | |
| | | | 5,700 | | | Great Lakes Chemical Corp. | | | 136,116 | |
| | | | 3,700 | | | H.B. Fuller Co. | | | 95,756 | |
| | | | 1,900 | | | Jarden Corp.* | | | 45,353 | |
| | | | 5,700 | | | Millennium Chemicals, Inc. | | | 54,264 | |
| | | | 16,500 | | | PolyOne Corp. | | | 64,680 | |
| | | | 2,400 | | | Rogers Corp.* | | | 53,400 | |
| | | | 2,100 | | | The Scotts Co.* | | | 102,984 | |
| | | | | | | | | |
| |
| | | | | | | | | | 1,423,188 | |
| | |
|
| | | Clothing – 0.9% |
| | | | 45,900 | | | Charming Shoppes, Inc.* | | | 191,862 | |
| | | | 900 | | | Payless ShoeSource, Inc.* | | | 46,323 | |
| | | | 3,400 | | | Shoe Carnival, Inc.* | | | 47,637 | |
| | | | 8,000 | | | Stein Mart, Inc.* | | | 48,800 | |
| | | | 9,300 | | | The Finish Line, Inc.* | | | 98,115 | |
| | | | | | | | | |
| |
| | | | | | | | | | 432,737 | |
| | |
|
| | | Computer Hardware – 4.0% |
| | | | 15,900 | | | 3Com Corp.* | | | 73,617 | |
| | | | 4,400 | | | Checkpoint Systems, Inc.* | | | 45,496 | |
| | | | 2,000 | | | Coinstar, Inc.* | | | 45,300 | |
| | | | 12,600 | | | CompuCom Systems, Inc.* | | | 70,686 | |
| | | | 6,500 | | | Computer Network Technology Corp.* | | | 46,150 | |
18 The accompanying notes are an integral part of these financial statements.
GOLDMAN SACHS VARIABLE INSURANCE TRUST CORE SMALL CAP EQUITY FUND
| | | | | | | | | | | |
| | | | | | |
| | Shares | | Description | | Value |
| | |
Common Stocks – (continued) |
|
| | | Computer Hardware – (continued) |
| | | | 6,400 | | | Daisytek International Corp.* | | $ | 50,752 | |
| | | | 6,100 | | | Foundry Networks, Inc.* | | | 42,944 | |
| | | | 22,800 | | | Gateway, Inc.* | | | 71,592 | |
| | | | 2,600 | | | Global Imaging Systems, Inc.* | | | 47,788 | |
| | | | 7,100 | | | Hutchinson Technology, Inc.* | | | 146,970 | |
| | | | 6,100 | | | IKON Office Solutions, Inc. | | | 43,615 | |
| | | | 5,600 | | | Imation Corp.* | | | 196,448 | |
| | | | 6,100 | | | InFocus Corp.* | | | 37,576 | |
| | | | 6,100 | | | Ingram Micro, Inc.* | | | 75,335 | |
| | | | 10,000 | | | Iomega Corp.* | | | 78,500 | |
| | | | 27,500 | | | Maxtor Corp.* | | | 139,150 | |
| | | | 3,200 | | | PC Connection, Inc.* | | | 16,224 | |
| | | | 2,600 | | | RadiSys Corp.* | | | 20,748 | |
| | | | 1,300 | | | ScanSource, Inc.* | | | 64,090 | |
| | | | 3,400 | | | Storage Technology Corp.* | | | 72,828 | |
| | | | 5,400 | | | Symbol Technologies, Inc. | | | 44,388 | |
| | | | 2,300 | | | Take-Two Interactive Software, Inc.* | | | 54,027 | |
| | | | 2,700 | | | Tech Data Corp.* | | | 72,792 | |
| | | | 48,400 | | | Western Digital Corp.* | | | 309,276 | |
| | | | | | | | | |
| |
| | | | | | | | | | 1,866,292 | |
| | |
|
| | | Computer Software – 3.7% |
| | | | 3,300 | | | Acxiom Corp.* | | | 50,754 | |
| | | | 16,500 | | | Aspen Technology, Inc.* | | | 46,695 | |
| | | | 9,400 | | | Avid Technology, Inc.* | | | 215,730 | |
| | | | 3,900 | | | Borland Software Corp.* | | | 47,970 | |
| | | | 6,400 | | | DocuCorp International, Inc.* | | | 42,374 | |
| | | | 2,550 | | | EPIQ Systems, Inc.* | | | 39,066 | |
| | | | 3,700 | | | FileNET Corp.* | | | 45,140 | |
| | | | 5,000 | | | Hyperion Solutions Corp.* | | | 128,350 | |
| | | | 2,700 | | | IDX Systems Corp.* | | | 45,981 | |
| | | | 13,700 | | | Intergraph Corp.* | | | 243,312 | |
| | | | 4,200 | | | JDA Software Group, Inc.* | | | 40,572 | |
| | | | 12,800 | | | Mentor Graphics Corp.* | | | 100,608 | |
| | | | 9,700 | | | MSC.Software Corp.* | | | 74,884 | |
| | | | 4,600 | | | NetIQ Corp.* | | | 56,810 | |
| | | | 3,000 | | | Network Associates, Inc.* | | | 48,270 | |
| | | | 28,600 | | | Novell, Inc.* | | | 95,524 | |
| | | | 6,000 | | | Pharmacopeia, Inc.* | | | 53,520 | |
| | | | 6,500 | | | Phoenix Technologies Ltd.* | | | 37,505 | |
| | | | 3,300 | | | Pinnacle Systems, Inc.* | | | 44,913 | |
| | | | 5,000 | | | Radiant Systems, Inc.* | | | 48,150 | |
| | | | 22,600 | | | ScanSoft, Inc.* | | | 117,520 | |
| | | | 2,400 | | | SERENA Software, Inc.* | | | 37,896 | |
| | | | 1,600 | | | SRA International, Inc.* | | | 43,344 | |
| | | | 11,900 | | | VitalWorks, Inc.* | | | 45,815 | |
| | | | | | | | | |
| |
| | | | | | | | | | 1,750,703 | |
| | |
|
| | | Construction – 0.8% |
| | | | 800 | | | American Woodmark Corp. | | | 38,000 | |
| | | | 8,000 | | | Fleetwood Enterprises, Inc.* | | | 62,800 | |
| | | | 4,650 | | | Griffon Corp.* | | | 63,333 | |
| | | | 3,700 | | | Hovnanian Enterprises, Inc.* | | | 117,290 | |
| | | | 1,700 | | | M/I Schottenstein Homes, Inc. | | | 47,260 | |
| | | | 150 | | | NVR, Inc.* | | | 48,825 | |
| | | | | | | | | |
| |
| | | | | | | | | | 377,508 | |
| | |
|
| | | Consumer Durables – 1.1% |
| | | | 11,900 | | | Interface, Inc. | | | 36,533 | |
| | | | 7,900 | | | Kimball International, Inc. Class B | | | 112,575 | |
| | | | 4,300 | | | Steelcase, Inc. | | | 47,128 | |
| | | | 4,900 | | | The Toro Co. | | | 313,110 | |
| | | | 92 | | | Vialta, Inc.* | | | 28 | |
| | | | | | | | | |
| |
| | | | | | | | | | 509,374 | |
| | |
|
| | | Defense/ Aerospace – 1.1% |
| | | | 8,100 | | | Aviall, Inc.* | | | 65,205 | |
| | | | 2,500 | | | Curtiss-Wright Corp. | | | 159,550 | |
| | | | 1,600 | | | Moog, Inc.* | | | 49,664 | |
| | | | 1,400 | | | Sequa Corp.* | | | 54,754 | |
| | | | 3,800 | | | Stewart & Stevenson Services, Inc. | | | 53,732 | |
| | | | 4,500 | | | Teledyne Technologies, Inc.* | | | 70,560 | |
| | | | 2,100 | | | United Defense Industries, Inc.* | | | 48,930 | |
| | | | | | | | | |
| |
| | | | | | | | | | 502,395 | |
| | |
|
| | | Department Stores – 1.0% |
| | | | 2,700 | | | Dillard’s, Inc. | | | 42,822 | |
| | | | 15,200 | | | Saks, Inc.* | | | 178,448 | |
| | | | 18,500 | | | Shopko Stores, Inc.* | | | 230,325 | |
| | | | | | | | | |
| |
| | | | | | | | | | 451,595 | |
| | |
|
| | | Drugs – 1.8% |
| | | | 9,700 | | | Alpharma, Inc. | | | 115,527 | |
| | | | 2,800 | | | American Pharmaceutical Partners, Inc.* | | | 49,840 | |
| | | | 2,700 | | | Biosite, Inc.* | | | 91,854 | |
| | | | 1,700 | | | CIMA Labs, Inc.* | | | 41,125 | |
| | | | 4,600 | | | D & K Healthcare Resources, Inc. | | | 47,109 | |
| | | | 2,000 | | | Eon Labs, Inc.* | | | 37,820 | |
| | | | 9,400 | | | IDEXX Laboratories, Inc.* | | | 308,790 | |
| | | | 9,500 | | | Perrigo Co.* | | | 115,425 | |
| | | | 2,072 | | | Priority Healthcare Corp. Class B* | | | 48,070 | |
| | | | | | | | | |
| |
| | | | | | | | | | 855,560 | |
| | |
|
| | | Electrical Equipment – 5.4% |
| | | | 3,300 | | | 3D Systems Corp.* | | | 25,740 | |
| | | | 17,500 | | | Allen Telecom, Inc.* | | | 165,725 | |
| | | | 8,700 | | | Anaren Microwave, Inc.* | | | 76,560 | |
| | | | 12,100 | | | Anixter International, Inc.* | | | 281,325 | |
| | | | 22,000 | | | Arris Group, Inc.* | | | 78,540 | |
| | | | 16,000 | | | Audiovox Corp.* | | | 165,456 | |
| | | | 4,900 | | | BEI Technologies, Inc. | | | 54,831 | |
| | | | 13,100 | | | Benchmark Electronics, Inc.* | | | 375,446 | |
| | | | 10,500 | | | C-COR.net Corp.* | | | 34,860 | |
| | | | 2,800 | | | Coherent, Inc.* | | | 55,860 | |
| | | | 2,700 | | | DSP Group, Inc.* | | | 42,714 | |
| | | | 4,700 | | | Esterline Technologies Corp.* | | | 83,049 | |
| | | | 2,100 | | | Fisher Scientific International, Inc.* | | | 63,168 | |
| | | | 1,600 | | | FLIR Systems, Inc.* | | | 78,080 | |
| | | | 5,500 | | | Harvard Bioscience, Inc.* | | | 18,139 | |
| | | | 3,700 | | | II-VI, Inc.* | | | 59,422 | |
| | | | 7,600 | | | Inrange Technologies Corp. Class B* | | | 17,860 | |
| | | | 8,100 | | | Inter-Tel, Inc. | | | 169,371 | |
| | | | 2,000 | | | Itron, Inc.* | | | 38,340 | |
The accompanying notes are an integral part of these financial statements. 19
GOLDMAN SACHS VARIABLE INSURANCE TRUST CORE SMALL CAP EQUITY FUND
Statement of Investments (continued)
December 31, 2002
| | | | | | | | | | | |
| | | | | | |
| | Shares | | Description | | Value |
| | |
Common Stocks – (continued) |
|
| | | Electrical Equipment – (continued) |
| | | | 6,100 | | | MTS Systems Corp. | | $ | 61,122 | |
| | | | 34,500 | | | Pioneer-Standard Electronics, Inc. | | | 316,710 | |
| | | | 4,900 | | | Planar Systems, Inc.* | | | 101,087 | |
| | | | 6,800 | | | Plexus Corp.* | | | 59,704 | |
| | | | 4,500 | | | Trimble Navigation Ltd.* | | | 56,205 | |
| | | | 10,600 | | | Turnstone Systems, Inc.* | | | 28,620 | |
| | | | 5,900 | | | Vicor Corp.* | | | 48,681 | |
| | | | | | | | | |
| |
| | | | | | | | | | 2,556,615 | |
| | |
|
| | | Electrical Utilities – 1.5% |
| | | | 14,900 | | | Avista Corp. | | | 172,244 | |
| | | | 1,000 | | | CH Energy Group, Inc. | | | 46,630 | |
| | | | 7,500 | | | Energy East Corp. | | | 165,675 | |
| | | | 12,900 | | | Integrated Electrical Services, Inc.* | | | 49,665 | |
| | | | 4,500 | | | Northeast Utilities | | | 68,265 | |
| | | | 2,000 | | | PNM Resources, Inc. | | | 47,640 | |
| | | | 9,200 | | | Sierra Pacific Resources | | | 59,800 | |
| | | | 4,200 | | | Westar Energy, Inc. | | | 41,580 | |
| | | | 1,700 | | | WPS Resources Corp. | | | 65,994 | |
| | | | | | | | | |
| |
| | | | | | | | | | 717,493 | |
| | |
|
| | | Energy Resources – 1.8% |
| | | | 2,100 | | | Energen Corp. | | | 61,110 | |
| | | | 7,500 | | | Patina Oil & Gas Corp. | | | 237,375 | |
| | | | 1,900 | | | Pogo Producing Co. | | | 70,775 | |
| | | | 2,900 | | | Remington Oil & Gas Corp.* | | | 47,589 | |
| | | | 3,400 | | | The Houston Exploration Co.* | | | 104,040 | |
| | | | 7,200 | | | Vintage Petroleum, Inc. | | | 75,960 | |
| | | | 1,300 | | | Western Gas Resources, Inc. | | | 47,905 | |
| | | | 7,200 | | | XTO Energy, Inc. | | | 177,840 | |
| | | | | | | | | |
| |
| | | | | | | | | | 822,594 | |
| | |
|
| | | Entertainment – 0.4% |
| | | | 8,500 | | | Handleman Co.* | | | 97,750 | |
| | | | 11,200 | | | World Wrestling Federation Entertainment, Inc.* | | | 90,160 | |
| | | | | | | | | |
| |
| | | | | | | | | | 187,910 | |
| | |
|
| | | Environmental Services – 0.5% |
| | | | 6,600 | | | Casella Waste Systems, Inc.* | | | 58,674 | |
| | | | 7,900 | | | Republic Services, Inc.* | | | 165,742 | |
| | | | | | | | | |
| |
| | | | | | | | | | 224,416 | |
| | |
|
| | | Financial Services – 2.2% |
| | | | 2,100 | | | American Financial Holdings, Inc. | | | 62,748 | |
| | | | 2,400 | | | Clark/ Bardes, Inc.* | | | 46,200 | |
| | | | 3,200 | | | Credit Acceptance Corp.* | | | 20,419 | |
| | | | 2,600 | | | Financial Federal Corp.* | | | 65,338 | |
| | | | 19,200 | | | Fremont General Corp. | | | 86,208 | |
| | | | 2,200 | | | FTI Consulting, Inc.* | | | 88,330 | |
| | | | 14,400 | | | Insignia Financial Group, Inc.* | | | 104,400 | |
| | | | 2,900 | | | InterCept, Inc.* | | | 49,100 | |
| | | | 8,000 | | | LendingTree, Inc.* | | | 103,040 | |
| | | | 2,900 | | | NCO Group, Inc.* | | | 46,255 | |
| | | | 5,500 | | | New Century Financial Corp. | | | 139,645 | |
| | | | 4,800 | | | Novastar Financial, Inc. | | | 148,944 | |
| | | | 11,200 | | | Providian Financial Corp.* | | | 72,688 | |
| | | | | | | | | |
| |
| | | | | | | | | | 1,033,315 | |
| | |
|
| | | Food & Beverage – 2.6% |
| | | | 4,600 | | | Corn Products International, Inc. | | | 138,598 | |
| | | | 12,300 | | | Fleming Companies, Inc. | | | 80,811 | |
| | | | 4,500 | | | Flowers Foods, Inc. | | | 87,795 | |
| | | | 4,600 | | | International Multifoods Corp.* | | | 97,474 | |
| | | | 8,000 | | | Interstate Bakeries Corp. | | | 122,000 | |
| | | | 3,500 | | | J & J Snack Foods Corp.* | | | 124,985 | |
| | | | 8,200 | | | Nash-Finch Co. | | | 63,386 | |
| | | | 2,000 | | | Performance Food Group Co.* | | | 67,918 | |
| | | | 9,900 | | | Pilgrim’s Pride Corp. | | | 81,180 | |
| | | | 4,200 | | | Ralcorp Holdings, Inc.* | | | 105,588 | |
| | | | 3,300 | | | The J.M. Smucker Co. | | | 131,373 | |
| | | | 4,000 | | | United Natural Foods, Inc.* | | | 101,400 | |
| | | | | | | | | |
| |
| | | | | | | | | | 1,202,508 | |
| | |
|
| | | Forest – 1.6% |
| | | | 4,300 | | | Chesapeake Corp. | | | 76,755 | |
| | | | 2,100 | | | Greif Bros. Corp. | | | 49,980 | |
| | | | 6,200 | | | Longview Fibre Co.* | | | 44,826 | |
| | | | 8,100 | | | Louisiana-Pacific Corp.* | | | 65,286 | |
| | | | 1,800 | | | Potlatch Corp. | | | 42,984 | |
| | | | 3,900 | | | Rock-Tenn Co. | | | 52,572 | |
| | | | 3,700 | | | Schweitzer-Mauduit International, Inc. | | | 90,650 | |
| | | | 7,100 | | | United Stationers, Inc.* | | | 204,487 | |
| | | | 6,800 | | | Universal Forest Products, Inc. | | | 144,983 | |
| | | | | | | | | |
| |
| | | | | | | | | | 772,523 | |
| | |
|
| | | Gas Utilities – 1.6% |
| | | | 2,500 | | | Cascade Natural Gas Corp. | | | 50,000 | |
| | | | 6,700 | | | NorthWestern Corp. | | | 34,036 | |
| | | | 2,800 | | | NUI Corp. | | | 48,328 | |
| | | | 27,300 | | | ONEOK, Inc. | | | 524,160 | |
| | | | 2,700 | | | South Jersey Industries, Inc. | | | 89,154 | |
| | | | | | | | | |
| |
| | | | | | | | | | 745,678 | |
| | |
|
| | | Gold – 0.1% |
| | | | 2,200 | | | Royal Gold, Inc. | | | 54,826 | |
| | |
|
| | | Grocery – 0.7% |
| | | | 11,100 | | | Pathmark Stores, Inc.* | | | 56,277 | |
| | | | 7,000 | | | Ruddick Corp. | | | 95,830 | |
| | | | 16,600 | | | The Great Atlantic & Pacific Tea Co., Inc.* | | | 133,796 | |
| | | | 4,100 | | | Wild Oats Markets, Inc.* | | | 42,312 | |
| | | | | | | | | |
| |
| | | | | | | | | | 328,215 | |
| | |
|
| | | Heavy Electrical – 0.6% |
| | | | 5,200 | | | Belden, Inc. | | | 79,144 | |
| | | | 6,800 | | | Cable Design Technologies Corp.* | | | 40,120 | |
| | | | 900 | | | EMCOR Group, Inc.* | | | 47,709 | |
20 The accompanying notes are an integral part of these financial statements.
GOLDMAN SACHS VARIABLE INSURANCE TRUST CORE SMALL CAP EQUITY FUND
| | | | | | | | | | | |
| | | | | | |
| | Shares | | Description | | Value |
| | |
Common Stocks – (continued) |
|
| | | Heavy Electrical – (continued) |
| | | | 3,400 | | | LSI Industries, Inc. | | $ | 47,090 | |
| | | | 1,600 | | | Woodward Governor Co. | | | 69,600 | |
| | | | | | | | | |
| |
| | | | | | | | | | 283,663 | |
| | |
|
| | | Heavy Machinery – 0.4% |
| | | | 4,500 | | | NACCO Industries, Inc. | | | 196,965 | |
| | |
|
| | | Home Products – 1.2% |
| | | | 7,700 | | | Central Garden & Pet Co.* | | | 142,527 | |
| | | | 3,000 | | | Chattem, Inc.* | | | 61,650 | |
| | | | 21,400 | | | Nu Skin Enterprises, Inc. | | | 256,158 | |
| | | | 4,100 | | | The Dial Corp. | | | 83,517 | |
| | | | | | | | | |
| |
| | | | | | | | | | 543,852 | |
| | |
|
| | | Hotels – 1.0% |
| | | | 24,100 | | | FelCor Lodging Trust, Inc. | | | 275,704 | |
| | | | 25,000 | | | La Quinta Corp.* | | | 110,000 | |
| | | | 12,400 | | | MeriStar Hospitality Corp. | | | 81,840 | |
| | | | | | | | | |
| |
| | | | | | | | | | 467,544 | |
| | |
|
| | | Industrial Parts – 3.7% |
| | | | 9,300 | | | A.O. Smith Corp. | | | 251,193 | |
| | | | 2,400 | | | Applied Films Corp.* | | | 47,976 | |
| | | | 12,900 | | | Applied Industrial Technologies, Inc. | | | 243,810 | |
| | | | 1,700 | | | Briggs & Stratton Corp. | | | 72,199 | |
| | | | 2,200 | | | CoorsTek, Inc.* | | | 56,210 | |
| | | | 6,200 | | | Hughes Supply, Inc. | | | 169,384 | |
| | | | 5,400 | | | Kaman Corp. | | | 59,400 | |
| | | | 18,900 | | | Lennox International, Inc. | | | 237,195 | |
| | | | 1,900 | | | Lindsay Manufacturing Co. | | | 40,660 | |
| | | | 3,100 | | | Lufkin Industries, Inc. | | | 72,695 | |
| | | | 1,400 | | | Nortek Holdings, Inc.* | | | 64,050 | |
| | | | 2,000 | | | SPS Technologies, Inc.* | | | 47,500 | |
| | | | 3,000 | | | Tecumseh Products Co. | | | 132,390 | |
| | | | 3,300 | | | The Shaw Group, Inc.* | | | 54,285 | |
| | | | 3,000 | | | The Timken Co. | | | 57,300 | |
| | | | 9,300 | | | Watsco, Inc. | | | 152,334 | |
| | | | | | | | | |
| |
| | | | | | | | | | 1,758,581 | |
| | |
|
| | | Industrial Services – 2.7% |
| | | | 1,700 | | | Bright Horizons Family Solutions, Inc.* | | | 47,804 | |
| | | | 7,600 | | | CDI Corp.* | | | 205,048 | |
| | | | 3,900 | | | Corinthian Colleges, Inc.* | | | 147,654 | |
| | | | 3,800 | | | Corrections Corp. of America* | | | 65,170 | |
| | | | 4,700 | | | Dollar Thrifty Automotive Group, Inc.* | | | 99,405 | |
| | | | 5,800 | | | EGL, Inc.* | | | 82,650 | |
| | | | 7,200 | | | ITT Educational Services, Inc.* | | | 169,560 | |
| | | | 12,100 | | | Kforce, Inc.* | | | 51,062 | |
| | | | 11,400 | | | Labor Ready, Inc.* | | | 73,188 | |
| | | | 18,000 | | | MPS Group, Inc.* | | | 99,720 | |
| | | | 30,800 | | | Spherion Corp.* | | | 206,360 | |
| | | | | | | | | |
| |
| | | | | | | | | | 1,247,621 | |
| | |
|
| | | Information Services – 4.2% |
| | | | 5,600 | | | Allscripts Heathcare Solutions, Inc.* | | | 13,384 | |
| | | | 4,100 | | | American Management Systems, Inc.* | | | 49,159 | |
| | | | 6,200 | | | Arbitron, Inc.* | | | 207,700 | |
| | | | 1,600 | | | BARRA, Inc.* | | | 48,528 | |
| | | | 13,500 | | | BearingPoint, Inc.* | | | 93,150 | |
| | | | 1,800 | | | CACI International, Inc.* | | | 64,152 | |
| | | | 1,000 | | | Cognizant Technology Solutions Corp.* | | | 72,230 | |
| | | | 4,700 | | | Daktronics, Inc.* | | | 62,886 | |
| | | | 5,900 | | | FactSet Research Systems, Inc. | | | 166,793 | |
| | | | 1,200 | | | Fair, Isaac & Co., Inc. | | | 51,240 | |
| | | | 8,200 | | | Fidelity National Information Solutions, Inc.* | | | 141,450 | |
| | | | 6,400 | | | Lightbridge, Inc.* | | | 39,360 | |
| | | | 2,500 | | | Manhattan Associates, Inc.* | | | 59,150 | |
| | | | 2,000 | | | MICROS Systems, Inc.* | | | 44,840 | |
| | | | 7,250 | | | Pegasus Systems, Inc.* | | | 72,718 | |
| | | | 4,000 | | | Pre-Paid Legal Services, Inc.* | | | 104,800 | |
| | | | 5,500 | | | PRG-Schultz International, Inc.* | | | 48,950 | |
| | | | 4,700 | | | Quintiles Transnational Corp.* | | | 56,870 | |
| | | | 1,900 | | | StarTek, Inc.* | | | 52,440 | |
| | | | 12,400 | | | Stewart Enterprises, Inc.* | | | 69,080 | |
| | | | 13,400 | | | TeleTech Holdings, Inc.* | | | 97,284 | |
| | | | 7,300 | | | Tetra Tech, Inc.* | | | 89,060 | |
| | | | 3,400 | | | The Advisory Board Co.* | | | 101,660 | |
| | | | 6,800 | | | The TriZetto Group, Inc.* | | | 41,752 | |
| | | | 6,100 | | | Watson Wyatt & Co. Holdings* | | | 132,675 | |
| | | | | | | | | |
| |
| | | | | | | | | | 1,981,311 | |
| | |
|
| | | Internet – 1.8% |
| | | | 7,700 | | | AsiaInfo Holdings, Inc.* | | | 48,818 | |
| | | | 7,800 | | | DoubleClick, Inc.* | | | 44,148 | |
| | | | 25,500 | | | EarthLink, Inc.* | | | 138,975 | |
| | | | 5,700 | | | eSPEED, Inc.* | | | 96,564 | |
| | | | 7,800 | | | Inet Technologies, Inc.* | | | 47,580 | |
| | | | 22,600 | | | Interland, Inc.* | | | 29,380 | |
| | | | 3,700 | | | j2 Global Communications, Inc.* | | | 70,448 | |
| | | | 6,600 | | | NetFlix, Inc.* | | | 72,666 | |
| | | | 2,600 | | | Overture Services, Inc.* | | | 71,006 | |
| | | | 10,400 | | | SonicWall, Inc.* | | | 37,752 | |
| | | | 3,700 | | | United Online, Inc.* | | | 58,982 | |
| | | | 4,100 | | | Vastera, Inc.* | | | 23,169 | |
| | | | 3,300 | | | Verity, Inc.* | | | 44,190 | |
| | | | 2,700 | | | WebEx Communications, Inc.* | | | 40,500 | |
| | | | | | | | | |
| |
| | | | | | | | | | 824,178 | |
| | |
|
| | | Leisure – 0.9% |
| | | | 5,590 | | | Dover Downs Gaming & Entertainment, Inc. | | | 50,813 | |
| | | | 3,500 | | | JAKKS Pacific, Inc.* | | | 47,145 | |
| | | | 4,800 | | | Oakley, Inc.* | | | 49,296 | |
| | | | 1,300 | | | Polaris Industries, Inc. | | | 76,180 | |
| | | | 1,600 | | | SCP Pool Corp.* | | | 46,720 | |
| | | | 7,300 | | | Ticketmaster Class B* | | | 154,906 | |
| | | | | | | | | |
| |
| | | | | | | | | | 425,060 | |
| | |
|
The accompanying notes are an integral part of these financial statements. 21
GOLDMAN SACHS VARIABLE INSURANCE TRUST CORE SMALL CAP EQUITY FUND
Statement of Investments (continued)
December 31, 2002
| | | | | | | | | | | |
| | | | | | |
| | Shares | | Description | | Value |
| | |
Common Stocks – (continued) |
|
| | | Life Insurance – 0.8% |
| | | | 2,800 | | | AmerUs Group Co. | | $ | 79,156 | |
| | | | 1,200 | | | Delphi Financial Group, Inc. | | | 45,552 | |
| | | | 1,300 | | | National Western Life Insurance Co.* | | | 124,800 | |
| | | | 2,000 | | | The MONY Group, Inc. | | | 47,880 | |
| | | | 8,500 | | | The Phoenix Cos., Inc. | | | 64,600 | |
| | | | | | | | | |
| |
| | | | | | | | | | 361,988 | |
| | |
|
| | | Media – 1.5% |
| | | | 4,400 | | | ADVO, Inc.* | | | 144,452 | |
| | | | 2,900 | | | Cox Radio, Inc.* | | | 66,149 | |
| | | | 3,200 | | | Cumulus Media, Inc.* | | | 47,584 | |
| | | | 6,400 | | | Hearst-Argyle Television, Inc.* | | | 154,304 | |
| | | | 2,100 | | | Hispanic Broadcasting Corp.* | | | 43,155 | |
| | | | 9,700 | | | Sinclair Broadcast Group, Inc.* | | | 112,811 | |
| | | | 5,900 | | | Spanish Broadcasting System, Inc.* | | | 42,480 | |
| | | | 2,600 | | | The Liberty Corp. | | | 100,880 | |
| | | | | | | | | |
| |
| | | | | | | | | | 711,815 | |
| | |
|
| | | Medical Products – 2.6% |
| | | | 2,400 | | | Arrow International, Inc. | | | 97,608 | |
| | | | 4,100 | | | Cantel Medical Corp.* | | | 51,906 | |
| | | | 2,500 | | | Henry Schein, Inc.* | | | 112,500 | |
| | | | 3,300 | | | Invacare Corp. | | | 109,890 | |
| | | | 2,000 | | | Mentor Corp. | | | 77,000 | |
| | | | 2,300 | | | Ocular Sciences, Inc.* | | | 35,696 | |
| | | | 13,100 | | | Owens & Minor, Inc. | | | 215,102 | |
| | | | 1,400 | | | PolyMedica Corp.* | | | 43,176 | |
| | | | 22,700 | | | PSS World Medical, Inc.* | | | 155,268 | |
| | | | 4,100 | | | Respironics, Inc.* | | | 124,767 | |
| | | | 2,200 | | | SangStat Medical Corp.* | | | 24,860 | |
| | | | 2,000 | | | STERIS Corp.* | | | 48,500 | |
| | | | 2,300 | | | Varian Medical Systems, Inc.* | | | 65,987 | |
| | | | 2,100 | | | Ventana Medical Systems, Inc.* | | | 48,405 | |
| | | | | | | | | |
| |
| | | | | | | | | | 1,210,665 | |
| | |
|
| | | Medical Providers – 1.7% |
| | | | 3,700 | | | American Healthways, Inc.* | | | 64,750 | |
| | | | 3,600 | | | American Medical Security Group, Inc.* | | | 50,328 | |
| | | | 1,400 | | | Centene Corp.* | | | 47,026 | |
| | | | 3,000 | | | Dynacq International, Inc.* | | | 43,104 | |
| | | | 15,500 | | | Gentiva Health Services, Inc. | | | 136,555 | |
| | | | 3,000 | | | Kindred Healthcare, Inc.* | | | 54,453 | |
| | | | 7,300 | | | PacifiCare Health Systems, Inc.* | | | 205,130 | |
| | | | 3,900 | | | Sierra Health Services, Inc.* | | | 46,839 | |
| | | | 16,200 | | | US Oncology, Inc.* | | | 140,454 | |
| | | | | | | | | |
| |
| | | | | | | | | | 788,639 | |
| | |
|
| | | Mining – 1.8% |
| | | | 16,600 | | | Allegheny Technologies, Inc. | | | 103,418 | |
| | | | 7,900 | | | Crown Cork & Seal Co., Inc.* | | | 62,805 | |
| | | | 3,600 | | | Owens-Illinois, Inc.* | | | 52,488 | |
| | | | 1,600 | | | Quanex Corp. | | | 53,600 | |
| | | | 4,000 | | | Reliance Steel & Aluminum Corp. | | | 83,360 | |
| | | | 15,500 | | | RTI International Metals, Inc.* | | | 156,550 | |
| | | | 3,400 | | | Steel Dynamics, Inc.* | | | 40,902 | |
| | | | 9,400 | | | United States Steel Corp. | | | 123,328 | |
| | | | 31,000 | | | USEC, Inc. | | | 186,620 | |
| | | | | | | | | |
| |
| | | | | | | | | | 863,071 | |
| | |
|
| | | Motor Vehicle – 0.8% |
| | | | 10,104 | | | Dura Automotive Systems, Inc.* | | | 101,444 | |
| | | | 2,900 | | | Oshkosh Truck Corp. | | | 178,350 | |
| | | | 4,400 | | | United Auto Group, Inc.* | | | 54,868 | |
| | | | 8,400 | | | Visteon Corp. | | | 58,464 | |
| | | | | | | | | |
| |
| | | | | | | | | | 393,126 | |
| | |
|
| | | Office Industrial – 1.7% |
| | | | 8,700 | | | Brandywine Realty Trust | | | 189,747 | |
| | | | 5,700 | | | Corporate Office Properties Trust | | | 79,971 | |
| | | | 5,000 | | | EastGroup Properties, Inc. | | | 127,500 | |
| | | | 10,600 | | | Glenborough Realty Trust, Inc. | | | 188,892 | |
| | | | 3,200 | | | Keystone Property Trust | | | 54,304 | |
| | | | 5,600 | | | PS Business Parks, Inc. | | | 178,080 | |
| | | | | | | | | |
| |
| | | | | | | | | | 818,494 | |
| | |
|
| | | Oil Refining – 0.2% |
| | | | 15,200 | | | Tesoro Petroleum Corp.* | | | 68,704 | |
| | |
|
| | | Oil Services – 1.6% |
| | | | 2,500 | | | Atwood Oceanics, Inc.* | | | 75,250 | |
| | | | 1,500 | | | CARBO Ceramics, Inc. | | | 50,550 | |
| | | | 10,500 | | | Global Industries Ltd.* | | | 43,785 | |
| | | | 3,800 | | | Hydril Co.* | | | 89,566 | |
| | | | 4,900 | | | Key Energy Services, Inc.* | | | 43,953 | |
| | | | 3,900 | | | Oceaneering International, Inc.* | | | 96,486 | |
| | | | 22,200 | | | Parker Drilling Co.* | | | 49,284 | |
| | | | 2,400 | | | TETRA Technologies, Inc.* | | | 51,288 | |
| | | | 4,500 | | | Universal Compression Holdings, Inc.* | | | 86,085 | |
| | | | 19,200 | | | Veritas DGC, Inc.* | | | 151,680 | |
| | | | | | | | | |
| |
| | | | | | | | | | 737,927 | |
| | |
|
| | | Other REIT – 3.0% |
| | | | 12,600 | | | Anthracite Capital, Inc. | | | 137,340 | |
| | | | 6,700 | | | Apex Mortgage Capital, Inc. | | | 43,818 | |
| | | | 2,500 | | | Capital Automotive REIT | | | 59,250 | |
| | | | 3,400 | | | Capstead Mortgage Corp. | | | 83,810 | |
| | | | 3,200 | | | Correctional Properties Trust | | | 69,440 | |
| | | | 8,700 | | | Healthcare Realty Trust, Inc. | | | 254,475 | |
| | | | 20,000 | | | HRPT Properties Trust | | | 164,800 | |
| | | | 4,500 | | | Impac Mortgage Holdings, Inc. | | | 51,750 | |
| | | | 11,300 | | | National Health Investors, Inc. | | | 181,704 | |
| | | | 4,800 | | | Nationwide Health Properties, Inc. | | | 71,664 | |
| | | | 7,800 | | | Redwood Trust, Inc. | | | 216,060 | |
| | | | 4,400 | | | Thornburg Mortgage, Inc. | | | 88,440 | |
| | | | | | | | | |
| |
| | | | | | | | | | 1,422,551 | |
| | |
|
| | | Property Insurance – 2.1% |
| | | | 4,800 | | | Fidelity National Financial, Inc. | | | 157,584 | |
| | | | 11,200 | | | First American Corp. | | | 248,640 | |
| | | | 3,200 | | | Harleysville Group, Inc. | | | 84,576 | |
| | | | 7,400 | | | LandAmerica Financial Group, Inc. | | | 262,330 | |
22 The accompanying notes are an integral part of these financial statements.
GOLDMAN SACHS VARIABLE INSURANCE TRUST CORE SMALL CAP EQUITY FUND
| | | | | | | | | | | |
| | | | | | |
| | Shares | | Description | | Value |
| | |
Common Stocks – (continued) |
|
| | | Property Insurance – (continued) |
| | | | 3,000 | | | PMA Capital Corp. | | $ | 42,990 | |
| | | | 1,300 | | | The Commerce Group, Inc. | | | 48,737 | |
| | | | 7,000 | | | The Midland Co. | | | 133,000 | |
| | | | | | | | | |
| |
| | | | | | | | | | 977,857 | |
| | |
|
| | | Publishing – 1.8% |
| | | | 2,300 | | | Consolidated Graphics, Inc.* | | | 51,175 | |
| | | | 1,700 | | | Deluxe Corp. | | | 71,570 | |
| | | | 2,300 | | | John H. Harland Co. | | | 50,899 | |
| | | | 3,200 | | | Paxar Corp.* | | | 47,200 | |
| | | | 5,400 | | | Pulitzer, Inc. | | | 242,730 | |
| | | | 3,500 | | | The McClatchy Co. | | | 198,555 | |
| | | | 5,200 | | | The Standard Register Co. | | | 93,600 | |
| | | | 3,400 | | | Wallace Computer Services, Inc. | | | 73,134 | |
| | | | | | | | | |
| |
| | | | | | | | | | 828,863 | |
| | |
|
| | | Railroads – 0.1% |
| | | | 5,300 | | | Kansas City Southern* | | | 63,600 | |
| | |
|
| | | Real Estate Services – 0.1% |
| | | | 1,600 | | | LNR Property Corp. | | | 56,640 | |
| | |
|
| | | Restaurants – 1.4% |
| | | | 3,000 | | | Bob Evans Farms, Inc. | | | 70,050 | |
| | | | 2,500 | | | California Pizza Kitchen, Inc.* | | | 63,000 | |
| | | | 12,900 | | | CKE Restaurants, Inc.* | | | 55,470 | |
| | | | 10,700 | | | Dave & Buster’s, Inc.* | | | 92,555 | |
| | | | 6,400 | | | Landry’s Restaurants, Inc. | | | 135,936 | |
| | | | 7,600 | | | Lone Star Steakhouse & Saloon, Inc. | | | 146,984 | |
| | | | 1,800 | | | Papa John’s International, Inc.* | | | 50,184 | |
| | | | 5,300 | | | Ryan’s Family Steak Houses, Inc.* | | | 60,155 | |
| | | | | | | | | |
| |
| | | | | | | | | | 674,334 | |
| | |
|
| | | Retail – 1.0% |
| | | | 6,200 | | | Amli Residential Properties Trust | | | 131,936 | |
| | | | 5,200 | | | CBL & Associates Properties, Inc. | | | 208,260 | |
| | | | 11,700 | | | JDN Realty Corp. | | | 128,115 | |
| | | | | | | | | |
| |
| | | | | | | | | | 468,311 | |
| | |
|
| | | Securities/ Asset Management – 1.5% |
| | | | 9,100 | | | Ameritrade Holding Corp.* | | | 51,506 | |
| | | | 2,200 | | | BlackRock, Inc.* | | | 86,680 | |
| | | | 5,900 | | | Gabelli Asset Management, Inc.* | | | 177,236 | |
| | | | 14,500 | | | Knight Trading Group, Inc.* | | | 69,455 | |
| | | | 4,800 | | | R&G Financial Corp. Class B | | | 111,600 | |
| | | | 4,700 | | | SWS Group, Inc. | | | 63,732 | |
| | | | 6,000 | | | The John Nuveen Co. | | | 152,100 | |
| | | | | | | | | |
| |
| | | | | | | | | | 712,309 | |
| | |
|
| | | Semiconductors – 2.8% |
| | | | 16,100 | | | Arrow Electronics, Inc.* | | | 205,919 | |
| | | | 14,550 | | | Avnet, Inc.* | | | 157,577 | |
| | | | 23,000 | | | Bell Microproducts, Inc.* | | | 127,420 | |
| | | | 11,100 | | | ChipPAC, Inc.* | | | 39,405 | |
| | | | 18,000 | | | Cirrus Logic, Inc.* | | | 51,840 | |
| | | | 5,900 | | | Cohu, Inc. | | | 86,730 | |
| | | | 4,000 | | | Cree, Inc.* | | | 65,400 | |
| | | | 4,700 | | | InterDigital Communications Corp.* | | | 68,432 | |
| | | | 12,200 | | | PTEK Holdings, Inc.* | | | 53,680 | |
| | | | 6,100 | | | Rainbow Technologies, Inc.* | | | 43,737 | |
| | | | 5,800 | | | REMEC, Inc.* | | | 22,504 | |
| | | | 9,100 | | | SanDisk Corp.* | | | 184,730 | |
| | | | 9,200 | | | Silicon Image, Inc.* | | | 55,200 | |
| | | | 12,000 | | | Silicon Storage Technology, Inc.* | | | 48,480 | |
| | | | 4,800 | | | Skyworks Solutions, Inc.* | | | 41,376 | |
| | | | 8,400 | | | TriQuint Semiconductor, Inc.* | | | 35,616 | |
| | | | 3,600 | | | Veeco Instruments, Inc.* | | | 41,616 | |
| | | | | | | | | |
| |
| | | | | | | | | | 1,329,662 | |
| | |
|
| | | Specialty Retail – 2.3% |
| | | | 5,300 | | | 1-800-FLOWERS.COM, Inc.* | | | 33,125 | |
| | | | 10,000 | | | Brown Shoe Co., Inc. | | | 238,300 | |
| | | | 5,100 | | | Duane Reade, Inc.* | | | 86,700 | |
| | | | 10,300 | | | GameStop Corp.* | | | 100,940 | |
| | | | 2,600 | | | Guitar Center, Inc.* | | | 43,056 | |
| | | | 6,000 | | | Hollywood Entertainment Corp.* | | | 90,600 | |
| | | | 3,300 | | | J. Jill Group, Inc.* | | | 46,134 | |
| | | | 2,300 | | | Longs Drug Stores Corp. | | | 47,702 | |
| | | | 26,100 | | | OfficeMax, Inc.* | | | 130,500 | |
| | | | 2,600 | | | PETsMART, Inc.* | | | 44,538 | |
| | | | 6,900 | | | Rent-Way, Inc.* | | | 24,150 | |
| | | | 5,200 | | | Sonic Automotive, Inc.* | | | 77,324 | |
| | | | 1,100 | | | Tractor Supply Co.* | | | 41,360 | |
| | | | 4,100 | | | West Marine, Inc.* | | | 56,129 | |
| | | | | | | | | |
| |
| | | | | | | | | | 1,060,558 | |
| | |
|
| | | Telecommunications Equipment – 0.2% |
| | | | 3,900 | | | EMS Technologies, Inc.* | | | 60,883 | |
| | | | 2,900 | | | Plantronics, Inc.* | | | 43,877 | |
| | | | | | | | | |
| |
| | | | | | | | | | 104,760 | |
| | |
|
| | | Telephone – 0.8% |
| | | | 2,500 | | | Commonwealth Telephone Enterprises, Inc.* | | | 89,600 | |
| | | | 16,100 | | | IDT Corp.* | | | 278,369 | |
| | | | | | | | | |
| |
| | | | | | | | | | 367,969 | |
| | |
|
| | | Thrifts – 0.8% |
| | | | 4,100 | | | BankUnited Financial Corp.* | | | 66,338 | |
| | | | 1,700 | | | Capitol Federal Financial | | | 48,960 | |
| | | | 4,800 | | | Staten Island Bancorp, Inc. | | | 96,672 | |
| | | | 5,300 | | | W Holding Co., Inc. | | | 86,973 | |
| | | | 3,600 | | | Westcorp | | | 75,600 | |
| | | | | | | | | |
| |
| | | | | | | | | | 374,543 | |
| | |
|
| | | Tobacco – 0.2% |
| | | | 2,600 | | | Universal Corp. | | | 96,096 | |
| | |
|
| | | Truck Freight – 1.7% |
| | | | 9,400 | | | Airborne, Inc. | | | 139,402 | |
| | | | 3,900 | | | Arkansas Best Corp.* | | | 101,326 | |
| | | | 6,400 | | | J.B. Hunt Transport Services, Inc.* | | | 187,520 | |
| | | | 900 | | | Landstar System, Inc.* | | | 52,524 | |
The accompanying notes are an integral part of these financial statements. 23
GOLDMAN SACHS VARIABLE INSURANCE TRUST CORE SMALL CAP EQUITY FUND
Statement of Investments (continued)
December 31, 2002
| | | | | | | | | | | |
| | | | | | |
| | Shares | | Description | | Value |
| | |
Common Stocks – (continued) |
|
| | | Truck Freight – (continued) |
| | | | 5,800 | | | Roadway Corp. | | $ | 213,498 | |
| | | | 3,800 | | | Werner Enterprises, Inc. | | | 81,814 | |
| | | | | | | | | |
| |
| | | | | | | | | | 776,084 | |
| | |
|
| | | Wireless – 0.5% |
| | | | 5,900 | | | Boston Communications Group, Inc.* | | | 74,989 | |
| | | | 5,600 | | | United States Cellular Corp.* | | | 140,112 | |
| | | | | | | | | |
| |
| | | | | | | | | | 215,101 | |
| | |
|
| | | TOTAL COMMON STOCKS |
| | | (Cost $49,479,691) | | $ | 46,630,597 | |
| | |
|
| | | TOTAL INVESTMENTS BEFORE SECURITIES LENDING COLLATERAL |
| | | (Cost $49,479,691) | | $ | 46,630,597 | |
| | |
|
| | |
Securities Lending Collateral – 2.2% |
|
| | | | 1,052,400 | | | Boston Global Investment Trust – Enhanced Portfolio | | $ | 1,052,400 | |
| | |
|
| | | TOTAL SECURITIES LENDING COLLATERAL |
| | | (Cost $1,052,400) | | $ | 1,052,400 | |
| | |
|
| | | TOTAL INVESTMENTS |
| | | (Cost $50,532,091) | | $ | 47,682,997 | |
| | |
|
| | |
| * | | Non-income producing security. |
| |
| | The percentage shown for each investment category reflects the value of investments in that category as a percentage of total net assets. |
| | | | | | | |
| | |
|
| | | Investment Abbreviation: |
| | | REIT | | — | | Real Estate Investment Trust |
| | |
|
24 The accompanying notes are an integral part of these financial statements.
GOLDMAN SACHS VARIABLE INSURANCE TRUST CAPITAL GROWTH FUND
Shareholder Letter
Dear Shareholders:
This report provides an overview on the performance of the Goldman Sachs Variable Insurance Trust — Capital Growth Fund for the one-year period that ended December 31, 2002.
Market Review
The U.S. equity markets fell for the third consecutive year in 2002, a streak that last occurred in the 1939-1941 period. The weakness, which prevailed across every major market sector, was first driven by the corporate accounting scandals and the resulting distrust of business leaders. The downturn was exacerbated by the sluggish economic recovery, despite consensus gross domestic product (“GDP”) growth of 2.4% for 2002. Investors initially anticipated that the historically low interest rate environment would spur corporate investment, thus stimulating overall growth. Unfortunately, many companies simply did not need to make additional purchases, as global demand did not warrant ramping up production or hiring additional workers. As a result, the rebound has been gradual, and has not been without some disappointments, including the threat of deflation and rising unemployment. The tensions in several regions in the world also contributed to the weak environment this year.
Performance Review
Over the one-year period that ended December 31, 2002, the Fund generated a cumulative total return of -24.33%. Over the same time period, the Fund’s benchmark, the Standard & Poor’s 500 Index (with dividends reinvested), generated a cumulative total return of
- -22.10%.
As these returns indicate, it was a very difficult period in the equity market and for the Fund. In particular, the underperformance of AOL Time Warner Inc., Crown Castle International Corp., and Sprint PCS Group (“Sprint”) detracted from results. In the case of Sprint, increasing competition in the wireless space has been detrimental to its growth prospects. Although we believe that industry consolidation could alleviate some of these pressures, developments in this particular area have been slow to materialize. Absent such reprieve, industry fundamentals deteriorated over the year and we subsequently eliminated the holding from the portfolio.
A number of the Fund’s pharmaceutical holdings also fell during the period, including Wyeth, Bristol-Myers Squibb Co. (“Bristol-Myers”), and Schering-Plough Corp. Bristol-Myers, for example, experienced a sharp decline as a number of company-specific issues weighed on the stock price. Towards the middle of the year, it was reported that the SEC had made an inquiry into Bristol-Myers’ revenue recognition policy for 2001. Although the company has yet to be charged with any impropriety, there were concerns that Bristol-Myers would be the next company to be formally investigated by a regulatory agency. Despite the recent difficulties, we continue to believe in pharmaceutical companies since aging population demographics in the U.S. and abroad should support strong growth over the foreseeable future.
25
GOLDMAN SACHS VARIABLE INSURANCE TRUST CAPITAL GROWTH FUND
Shareholder Letter (continued)
While the Technology sector fell sharply again in 2002, the Fund’s performance versus the benchmark enhanced relative results. Examples of holdings that met our criteria for a high quality growth investment were Microsoft Corp., Dell Computer Corp., and Intuit Inc. Within the Consumer Staples sector, we added value through the strong performance of The Procter & Gamble Co., Energizer Holdings, Inc., and Avon Products, Inc. Despite the overall rotation out of equities, investors found companies in this area to be attractive as they were partially insulated from much of the accounting scandals and industry-specific weakness that weighed on other sectors.
Investment Objective
The Fund seeks long-term capital growth, primarily through investments in a diversified portfolio of companies that the investment adviser believes to have long-term capital appreciation potential.
Portfolio Composition
Top 10 Portfolio Holdings as of December 31, 2002*
| | | | | | | |
| | | | % of Total |
| Company | | Business | | Net Assets |
| |
| |
|
| Microsoft Corp. | | Computer Software | | | 5.4 | % |
| Wal-Mart Stores, Inc. | | Specialty Retail | | | 3.9 | |
| Pfizer, Inc. | | Drugs | | | 3.6 | |
| Exxon Mobil Corp. | | Energy Resources | | | 3.4 | |
| Viacom, Inc. | | Media | | | 2.9 | |
| General Electric Co. | | Industrial Parts | | | 2.8 | |
| PepsiCo, Inc. | | Food & Beverage | | | 2.7 | |
| Freddie Mac | | Financial Services | | | 2.6 | |
| Johnson & Johnson | | Drugs | | | 2.6 | |
| Fannie Mae | | Financial Services | | | 2.5 | |
* Opinions expressed in this report represent our present opinions only. Reference to individual securities should not be construed as a commitment that such securities will be retained in the Fund. From time to time, the Fund may change the individual securities it holds, the number or types of securities held and the markets in which it invests. References to individual securities do not constitute a recommendation to the investor to buy, hold or sell such securities. In addition, references to past performance of the Fund do not indicate future returns, which are not guaranteed and will vary. Furthermore, the value of shares of the Fund may fall as well as rise.
26
GOLDMAN SACHS VARIABLE INSURANCE TRUST CAPITAL GROWTH FUND
Portfolio Outlook
After a third straight year of market declines, many investors anticipate a more favorable environment for U.S. equity investing in 2003. Throughout the downturn, U.S. companies have been plagued by an abrupt economic slowdown and deterioration in investor confidence. In recent years, a convergence of negative factors led to the prolonged decline in stock prices. As the economy emerges from its downturn, U.S. businesses could begin to produce earnings that may exceed the market’s expectations. Although valuations have been compressed, we believe high operating leverage and increased market share could lead to strong stock price performance for the Fund’s holdings. There are an increasing number of signs that the economy is recovering as evidenced by GDP growth. However, investors have questioned the timing and pace of the rebound. Our team does not attempt to predict this time frame as we are intently focused on the compounding growth that could occur in the companies we hold over the long term.
During the past year we have aggressively challenged our assumptions about the companies in the portfolio to ensure that they still meet our investment criteria, which include strong free cash flow, dominant market share, pricing control, recurring revenue stream, and excellent management. Despite the market’s attention to the short term, we are more concerned with the ability of our companies to grow over a longer period of time. We contend that one quarter or even one year is not sufficient time in which to evaluate an investment. Going forward, we will continue to invest in businesses that we believe are strategically positioned to grow over full market cycles.
We thank you for your investment and look forward to your continued confidence.
Goldman Sachs Growth Portfolio Management Team
January 9, 2003
27
GOLDMAN SACHS VARIABLE INSURANCE TRUST CAPITAL GROWTH FUND
Performance Summary
December 31, 2002
The following graph shows the value as of December 31, 2002, of a $10,000 investment made on April 30, 1998 (commencement of operations). For comparative purposes, the performance of the Fund’s benchmark (the Standard and Poor’s 500 Index (“S&P 500 Index”)) is shown. This performance data represents past performance and should not be considered indicative of future performance which will fluctuate with changes in market conditions. These performance fluctuations will cause an investor’s shares, when redeemed, to be worth more or less than their original cost. Returns do not reflect the deduction of taxes that a shareholder would pay on fund distributions or the redemption of fund shares.
| Capital Growth Fund’s Lifetime Performance |
Growth of a $10,000 investment, Distributions Reinvested from April 30, 1998 to December 31, 2002.
| | | | | | | |
| | Since Inception | | One Year | | |
|
|
|
|
Average Annual Total Return Through December 31, 2002 |
|
|
|
|
Capital Growth Fund (commenced April 30, 1998) | | -3.20% | | -24.33% | | |
|
28
GOLDMAN SACHS VARIABLE INSURANCE TRUST CAPITAL GROWTH FUND
Statement of Investments
December 31, 2002
| | | | | | | | | | | |
| | | | | | |
| | Shares | | Description | | Value |
| | |
Common Stocks – 97.8% |
|
| | | Banks – 4.9% |
| | | | 3,600 | | | Bank of America Corp. | | $ | 250,452 | |
| | | | 11,633 | | | Citigroup, Inc. | | | 409,365 | |
| | | | 1,500 | | | The Bank of New York Co., Inc. | | | 35,940 | |
| | | | 4,100 | | | Wells Fargo & Co. | | | 192,167 | |
| | | | | | | | | |
| |
| | | | | | | | | | 887,924 | |
| | |
|
| | | Biotechnology – 0.8% |
| | | | 2,900 | | | Amgen, Inc.* | | | 140,186 | |
| | |
|
| | | Brokers – 0.3% |
| | | | 1,500 | | | Merrill Lynch & Co., Inc. | | | 56,925 | |
| | |
|
| | | Chemicals – 1.0% |
| | | | 4,067 | | | E.I. du Pont de Nemours & Co. | | | 172,441 | |
| | |
|
| | | Computer Hardware – 5.3% |
| | | | 25,200 | | | Cisco Systems, Inc.* | | | 330,120 | |
| | | | 11,800 | | | Dell Computer Corp.* | | | 315,532 | |
| | | | 14,600 | | | EMC Corp.* | | | 89,644 | |
| | | | 2,800 | | | International Business Machines Corp. | | | 217,000 | |
| | | | | | | | | |
| |
| | | | | | | | | | 952,296 | |
| | |
|
| | | Computer Software – 7.5% |
| | | | 4,700 | | | Intuit, Inc.* | | | 220,524 | |
| | | | 19,000 | | | Microsoft Corp.* | | | 982,300 | |
| | | | 6,600 | | | Oracle Corp.* | | | 71,280 | |
| | | | 4,900 | | | Sabre Holdings Corp.* | | | 88,739 | |
| | | | | | | | | |
| |
| | | | | | | | | | 1,362,843 | |
| | |
|
| | | Defense/ Aerospace – 0.4% |
| | | | 900 | | | Lockheed Martin Corp. | | | 51,975 | |
| | | | 900 | | | Raytheon Co. | | | 27,675 | |
| | | | | | | | | |
| |
| | | | | | | | | | 79,650 | |
| | |
|
| | | Drugs – 12.0% |
| | | | 8,500 | | | Bristol-Myers Squibb Co. | | | 196,775 | |
| | | | 5,300 | | | Eli Lilly & Co. | | | 336,550 | |
| | | | 8,700 | | | Johnson & Johnson | | | 467,277 | |
| | | | 3,200 | | | Merck & Co., Inc. | | | 181,152 | |
| | | | 21,275 | | | Pfizer, Inc. | | | 650,377 | |
| | | | 2,700 | | | Schering-Plough Corp. | | | 59,940 | |
| | | | 7,400 | | | Wyeth | | | 276,760 | |
| | | | | | | | | |
| |
| | | | | | | | | | 2,168,831 | |
| | |
|
| | | Energy Resources – 3.9% |
| | | | 1,000 | | | Anadarko Petroleum Corp. | | | 47,900 | |
| | | | 700 | | | Apache Corp. | | | 39,893 | |
| | | | 17,584 | | | Exxon Mobil Corp. | | | 614,385 | |
| | | | | | | | | |
| |
| | | | | | | | | | 702,178 | |
| | |
|
| | | Entertainment – 0.3% |
| | | | 4,400 | | | Metro-Goldwyn-Mayer, Inc.* | | | 57,200 | |
| | |
|
| | | Environmental Services – 0.2% |
| | | | 1,600 | | | Waste Management, Inc. | | | 36,672 | |
| | |
|
| | | Financial Services – 7.7% |
| | | | 7,000 | | | Fannie Mae | | | 450,310 | |
| | | | 8,000 | | | Freddie Mac | | | 472,400 | |
| | | | 12,250 | | | MBNA Corp. | | | 232,995 | |
| | | | 400 | | | SLM Corp. | | | 41,544 | |
| | | | 4,900 | | | State Street Corp. | | | 191,100 | |
| | | | | | | | | |
| |
| | | | | | | | | | 1,388,349 | |
| | |
|
| | | Food & Beverage – 5.7% |
| | | | 11,590 | | | PepsiCo, Inc. | | | 489,330 | |
| | | | 6,500 | | | The Coca-Cola Co. | | | 284,830 | |
| | | | 4,800 | | | Wm. Wrigley Jr. Co. | | | 263,424 | |
| | | | | | | | | |
| |
| | | | | | | | | | 1,037,584 | |
| | |
|
| | | Forest – 1.0% |
| | | | 3,100 | | | International Paper Co. | | | 108,407 | |
| | | | 1,400 | | | Weyerhaeuser Co. | | | 68,894 | |
| | | | | | | | | |
| |
| | | | | | | | | | 177,301 | |
| | |
|
| | | Heavy Electrical – 1.2% |
| | | | 1,700 | | | 3M Co. | | | 209,610 | |
| | |
|
| | | Home Products – 5.3% |
| | | | 2,900 | | | Avon Products, Inc. | | | 156,223 | |
| | | | 4,800 | | | Colgate-Palmolive Co. | | | 251,664 | |
| | | | 5,900 | | | Energizer Holdings, Inc.* | | | 164,610 | |
| | | | 3,700 | | | The Gillette Co. | | | 112,332 | |
| | | | 3,200 | | | The Procter & Gamble Co. | | | 275,008 | |
| | | | | | | | | |
| |
| | | | | | | | | | 959,837 | |
| | |
|
| | | Hotels – 4.4% |
| | | | 19,000 | | | Cendant Corp.* | | | 199,120 | |
| | | | 6,900 | | | Harrah’s Entertainment, Inc.* | | | 273,240 | |
| | | | 5,800 | | | Marriott International, Inc. | | | 190,646 | |
| | | | 5,500 | | | Starwood Hotels & Resorts Worldwide, Inc. | | | 130,570 | |
| | | | | | | | | |
| |
| | | | | | | | | | 793,576 | |
| | |
|
| | | Industrial Parts – 3.1% |
| | | | 20,500 | | | General Electric Co. | | | 499,175 | |
| | | | 1,000 | | | United Technologies Corp. | | | 61,940 | |
| | | | | | | | | |
| |
| | | | | | | | | | 561,115 | |
| | |
|
| | | Information Services – 2.4% |
| | | | 2,200 | | | Automatic Data Processing, Inc. | | | 86,350 | |
| | | | 7,600 | | | First Data Corp. | | | 269,116 | |
| | | | 500 | | | The McGraw-Hill Cos., Inc. | | | 30,220 | |
| | | | 4,800 | | | TMP Worldwide, Inc.* | | | 54,288 | |
| | | | | | | | | |
| |
| | | | | | | | | | 439,974 | |
| | |
|
The accompanying notes are an integral part of these financial statements. 29
GOLDMAN SACHS VARIABLE INSURANCE TRUST CAPITAL GROWTH FUND
Statement of Investments (continued)
December 31, 2002
| | | | | | | | | | | |
| | | | | | |
| | Shares | | Description | | Value |
| | |
Common Stocks – (continued) |
|
| | | Media – 8.5% |
| | | | 19,050 | | | AOL Time Warner, Inc.* | | $ | 249,555 | |
| | | | 4,674 | | | Cablevision Systems New York Group* | | | 78,243 | |
| | | | 4,152 | | | Clear Channel Communications, Inc.* | | | 154,828 | |
| | | | 1,700 | | | Cox Communications, Inc.* | | | 48,280 | |
| | | | 6,300 | | | EchoStar Communications Corp.* | | | 140,238 | |
| | | | 17,900 | | | Liberty Media Corp. Series A* | | | 160,026 | |
| | | | 7,100 | | | Univision Communications, Inc.* | | | 173,950 | |
| | | | 12,972 | | | Viacom, Inc. Class B* | | | 528,739 | |
| | | | | | | | | |
| |
| | | | | | | | | | 1,533,859 | |
| | |
|
| | | Oil Refining – 1.1% |
| | | | 3,054 | | | ChevronTexaco Corp. | | | 203,030 | |
| | |
|
| | | Oil Services – 0.3% |
| | | | 1,100 | | | Schlumberger Ltd. | | | 46,299 | |
| | |
|
| | | Property Insurance – 3.8% |
| | | | 6,300 | | | AMBAC Financial Group, Inc. | | | 354,312 | |
| | | | 5,600 | | | American International Group, Inc. | | | 323,960 | |
| | | | | | | | | |
| |
| | | | | | | | | | 678,272 | |
| | |
|
| | | Publishing – 1.7% |
| | | | 1,300 | | | Gannett Co., Inc. | | | 93,340 | |
| | | | 3,100 | | | The New York Times Co. | | | 141,763 | |
| | | | 2,200 | | | Valassis Communications, Inc.* | | | 64,746 | |
| | | | | | | | | |
| |
| | | | | | | | | | 299,849 | |
| | |
|
| | | Securities/ Asset Management – 1.2% |
| | | | 1,300 | | | Morgan Stanley | | | 51,896 | |
| | | | 15,050 | | | The Charles Schwab Corp. | | | 163,292 | |
| | | | | | | | | |
| |
| | | | | | | | | | 215,188 | |
| | |
|
| | | Semiconductors – 2.8% |
| | | | 20,000 | | | Intel Corp. | | | 311,400 | |
| | | | 8,800 | | | Texas Instruments, Inc. | | | 132,088 | |
| | | | 3,000 | | | Xilinx, Inc.* | | | 61,800 | |
| | | | | | | | | |
| |
| | | | | | | | | | 505,288 | |
| | |
|
| | | Specialty Retail – 6.0% |
| | | | 3,700 | | | Family Dollar Stores, Inc. | | | 115,477 | |
| | | | 2,000 | | | Lowe’s Companies, Inc. | | | 75,000 | |
| | | | 2,050 | | | The Home Depot, Inc. | | | 49,118 | |
| | | | 13,800 | | | Wal-Mart Stores, Inc. | | | 697,038 | |
| | | | 4,900 | | | Walgreen Co. | | | 143,031 | |
| | | | | | | | | |
| |
| | | | | | | | | | 1,079,664 | |
| | |
|
| | | Telephone – 1.8% |
| | | | 6,700 | | | SBC Communications, Inc. | | | 181,637 | |
| | | | 3,928 | | | Verizon Communications, Inc. | | | 152,210 | |
| | | | | | | | | |
| |
| | | | | | | | | | 333,847 | |
| | |
|
| | | Thrifts – 0.2% |
| | | | 1,000 | | | Washington Mutual, Inc. | | | 34,530 | |
| | |
|
| | | Tobacco – 0.8% |
| | | | 3,700 | | | Philip Morris Companies, Inc. | | | 149,961 | |
| | |
|
| | | Wireless – 2.2% |
| | | | 12,500 | | | Crown Castle International Corp.* | | | 46,875 | |
| | | | 9,380 | | | QUALCOMM, Inc.* | | | 341,338 | |
| | | | | | | | | |
| |
| | | | | | | | | | 388,213 | |
| | |
|
| | | TOTAL COMMON STOCKS |
| | | (Cost $22,619,655) | | $ | 17,652,492 | |
| | |
|
| | | | | | | | | | | | | | | | | |
| | | | | | | | |
| | Principal | | Interest | | Maturity | | |
| | Amount | | Rate | | Date | | Value |
| | |
Repurchase Agreement – 3.9% |
|
| | | Joint Repurchase Agreement Account II^ |
| | | $ | 700,000 | | | | 1.25 | % | | | 01/02/2003 | | | $ | 700,000 | |
| | | Maturity Value: $700,049 |
| | |
|
| | | TOTAL REPURCHASE AGREEMENT |
| | | (Cost $700,000) | | $ | 700,000 | |
| | |
|
| | | TOTAL INVESTMENTS |
| | | (Cost $23,319,655) | | $ | 18,352,492 | |
| | |
|
* Non-income producing security.
| |
| ^ | Joint repurchase agreement was entered into on December 31, 2002. |
| |
| | The percentage shown for each investment category reflects the value of investments in that category as a percentage of total net assets. |
30 The accompanying notes are an integral part of these financial statements.
GOLDMAN SACHS VARIABLE INSURANCE TRUST MID CAP VALUE FUND
Shareholder Letter
Dear Shareholders:
This report provides an overview on the performance of the Goldman Sachs Variable Insurance Trust — Mid Cap Value Fund for the one-year period that ended December 31, 2002.
Market Review
2002 experienced continued volatility in the equity markets. The market underwent considerable changes—from large corporate bankruptcies to corporate governance issues and sell-side analyst scrutiny. On the economic front, mixed signals prevailed as stocks finished their third year in a row in negative territory. Despite lower consumer confidence and an uncertain outlook for job security, lower borrowing costs seemed to keep consumer spending from falling off. Confidence in the health of the world economy has been stifled by concerns about a U.S.-led war on Iraq and additional terrorist attacks.
In market declines, such as in 2002, investors often sell for emotional reasons, which usually results in valuations compressing within industries as investors engage in the market equivalent of “throwing out the baby with the bath water.” During these times, as prepared investors we seek to upgrade our portfolios as higher quality companies become available to us at very attractive prices. The Fund’s management team avoided some of the market’s major “torpedoes,” which we attribute to our strong research governance. We adhere to a principle of not compromising on our fundamental research process, which can help us to put only quality names into our portfolios. In summary, we continue to emphasize balance sheet quality, cash flow stability, and companies with superior management teams.
Performance Review
Over the one-year period that ended December 31, 2002, the Fund generated a cumulative total return of -4.69%. Over the same time period, the Fund’s benchmark, the Russell Midcap Value Index (with dividends reinvested) generated a cumulative total return of
–9.64%. While the Fund could not totally escape the weakness that permeated the markets, it did significantly outperform its benchmark due to strong stock selection. Our quality bias and emphasis on price and future prospects, not merely price, has been well founded during the challenging investing environment in 2002.
The Fund’s strongest returns were in the Insurance, Utilities, and Services sectors. Pioneer Natural Resources Co. (“Pioneer”) was one example of a top performer. Pioneer, an oil and gas exploration and production company, benefited from the positive returns from its new wells. Among the Consumer stocks, Ross Stores, Inc. (“Ross Stores”) performed well. Ross Stores generated solid returns due to its solid business fundamentals and attractive valuation.
The weakest contributors to the Fund during the period were Industrials sector stocks. Pentair, Inc. suffered due to the difficulty it faced in a difficult competitive pricing environment. Terex Corp. was weak in part because it lowered guidance due to the longer time it will take the firm to realize cost savings after recent acquisitions. Both stocks were recently eliminated from the portfolio.
Dover Corp. (“Dover”), a diversified industrial manufacturing company, was a new position added to the Fund. The company has taken significant action to downsize its capacity as well
31
GOLDMAN SACHS VARIABLE INSURANCE TRUST MID CAP VALUE FUND
Shareholder Letter (continued)
as lower its cost structure across its business lines. In addition, despite weak end-market conditions, Dover was able to show earnings per share and operating margin improvement. We believe that Dover has a strong, high quality management team that focuses on return on invested capital and cash generation.
Currently the Fund is underweight in Utilities and Consumer stocks and overweight in Energy and Services. The environment continues to be a difficult one for Utilities as certain segments face overcapacity and decreasing demand. In the Consumer area, volatility has increased as investors react to short-term sales announcements. We like to invest in Consumer companies that we know have strong product pipelines and don’t have to rely solely on price increases in order to increase revenues. In the Energy sector, we have found attractive investments in the Energy Resources and Oil Services segments while, in Services, we have found attractive investment ideas in the Media space.
Investment Objective
The Fund seeks long-term capital appreciation, primarily through equity securities of companies within the range of market capitalization constituting the Russell Midcap Value Index (generally companies with public stock market capitalizations between $60 million and $16 billion at the time of investment).
Portfolio Composition
Top 10 Portfolio Holdings as of December 31, 2002*
| | | | | | | |
| | | | % of Total |
| | | | Net Assets |
| Company | | Business | |
|
| |
| | |
| Energy East Corp. | | Electrical Utilities | | | 2.6 | % |
| PartnerRe Ltd. | | Property Insurance | | | 2.4 | |
| Praxair, Inc. | | Chemicals | | | 2.3 | |
| KeyCorp | | Banks | | | 2.0 | |
| Ocean Energy, Inc | | Energy Resources | | | 2.0 | |
| Rockwell Collins, Inc. | | Defense/ Aerospace | | | 2.0 | |
| UST, Inc. | | Tobacco | | | 1.9 | |
| Countrywide Credit Industries, Inc. | | Financial Services | | | 1.9 | |
| RenaissanceRe Holdings Ltd. | | Property Insurance | | | 1.9 | |
| The Stanley Works | | Consumer Durables | | | 1.8 | |
* Opinions expressed in this report represent our present opinions only. Reference to individual securities should not be construed as a commitment that such securities will be retained in the Fund. From time to time, the Fund may change the individual securities it holds, the number or types of securities held and the markets in which it invests. References to individual securities do not constitute a recommendation to the investor to buy, hold or sell such securities. In addition, references to past performance of the Fund do not indicate future returns, which are not guaranteed and will vary. Furthermore, the value of shares of the Fund may fall as well as rise.
32
GOLDMAN SACHS VARIABLE INSURANCE TRUST MID CAP VALUE FUND
Portfolio Outlook
Economists believe that the economy will expand in 2003, but increasing global tensions may stifle the growth. Although we do not attempt to predict market movements, we continue to view first-hand fundamental research as the most important part of our investment process. In addition, our team-based approach gives each team member industry/sector-specific responsibility and allows these individuals to provide in-depth industry expertise. Our continued focus on price and fundamentals allows us to buy quality companies with future prospects when we believe temporary situations cause the stock price to fall. We believe our consistent investment philosophy will help allow our portfolios to perform well in a variety of market conditions.
As in the past, we thank you for your continued confidence.
Goldman Sachs Value Portfolio Management Team
January 9, 2003
33
GOLDMAN SACHS VARIABLE INSURANCE TRUST MID CAP VALUE FUND
Performance Summary
December 31, 2002
The following graph shows the value as of December 31, 2002, of a $10,000 investment made on May 1, 1998 (commencement of operations). For comparative purposes, the performance of the Fund’s benchmark (the Russell Mid Cap Value Index) is shown. This performance data represents past performance and should not be considered indicative of future performance which will fluctuate with changes in market conditions. These performance fluctuations will cause an investor’s shares, when redeemed, to be worth more or less than their original cost. Returns do not reflect the deduction of taxes that a shareholder would pay on fund distributions or the redemption of fund shares.
| Mid Cap Value Fund’s Lifetime Performance |
Growth of a $10,000 investment, Distributions Reinvested from May 1, 1998 to December 31, 2002.
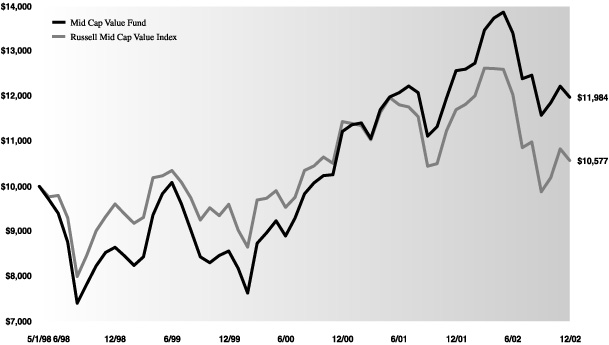
| | | | | | | |
| | Since Inception | | One Year | | |
|
|
|
|
Average Annual Total Return Through December 31, 2002 |
|
|
|
|
Mid Cap Value Fund (commenced May 1, 1998) | | 3.95% | | -4.69% | | |
|
34
GOLDMAN SACHS VARIABLE INSURANCE TRUST MID CAP VALUE FUND
Statement of Investments
December 31, 2002
| | | | | | | | | | | |
| | | | | | |
| | Shares | | Description | | Value |
| | |
Common Stocks – 96.4% |
|
| | | Airlines – 0.4% |
| | | | 57,737 | | | JetBlue Airways Corp.* | | $ | 1,558,899 | |
| | |
|
| | | Apartments – 1.9% |
| | | | 67,700 | | | AvalonBay Communities, Inc. | | | 2,649,778 | |
| | | | 174,497 | | | Equity Residential Properties Trust | | | 4,289,136 | |
| | | | | | | | | |
| |
| | | | | | | | | | 6,938,914 | |
| | |
|
| | | Apparel – 1.7% |
| | | | 171,834 | | | Jones Apparel Group, Inc.* | | | 6,089,797 | |
| | |
|
| | | Banks – 10.2% |
| | | | 198,757 | | | Banknorth Group, Inc. | | | 4,491,908 | |
| | | | 151,629 | | | Charter One Financial, Inc. | | | 4,356,301 | |
| | | | 290,377 | | | KeyCorp | | | 7,300,078 | |
| | | | 68,407 | | | M&T Bank Corp. | | | 5,428,095 | |
| | | | 131,200 | | | North Fork Bancorporation, Inc. | | | 4,426,688 | |
| | | | 177,587 | | | SouthTrust Corp. | | | 4,413,037 | |
| | | | 190,070 | | | Wilmington Trust Corp. | | | 6,021,418 | |
| | | | | | | | | |
| |
| | | | | | | | | | 36,437,525 | |
| | |
|
| | | Brokers – 0.8% |
| | | | 48,061 | | | The Bear Stearns Companies, Inc. | | | 2,854,823 | |
| | |
|
| | | Chemicals – 3.3% |
| | | | 53,885 | | | Potash Corp. of Saskatchewan, Inc. | | | 3,426,547 | |
| | | | 143,500 | | | Praxair, Inc. | | | 8,289,995 | |
| | | | | | | | | |
| |
| | | | | | | | | | 11,716,542 | |
| | |
|
| | | Clothing – 3.2% |
| | | | 139,500 | | | Ross Stores, Inc. | | | 5,913,405 | |
| | | | 277,371 | | | The TJX Companies, Inc. | | | 5,414,282 | |
| | | | | | | | | |
| |
| | | | | | | | | | 11,327,687 | |
| | |
|
| | | Computer Hardware – 2.4% |
| | | | 317,009 | | | Apple Computer, Inc.* | | | 4,542,739 | |
| | | | 62,600 | | | Storage Technology Corp.* | | | 1,340,892 | |
| | | | 50,132 | | | Zebra Technologies Corp.* | | | 2,872,564 | |
| | | | | | | | | |
| |
| | | | | | | | | | 8,756,195 | |
| | |
|
| | | Computer Software – 1.4% |
| | | | 32,500 | | | Electronic Arts, Inc.* | | | 1,617,525 | |
| | | | 118,545 | | | NetIQ Corp.* | | | 1,464,031 | |
| | | | 47,143 | | | Symantec Corp.* | | | 1,909,763 | |
| | | | | | | | | |
| |
| | | | | | | | | | 4,991,319 | |
| | |
|
| | | Construction – 0.6% |
| | | | 116,006 | | | D.R. Horton, Inc. | | | 2,012,704 | |
| | |
|
| | | Consumer Durables – 1.8% |
| | | | 190,475 | | | The Stanley Works | | | 6,586,626 | |
| | |
|
| | | Defense/ Aerospace – 2.0% |
| | | | 308,642 | | | Rockwell Collins, Inc. | | | 7,179,013 | |
| | |
|
| |
| | | Department Stores – 1.3% |
| | | | 161,540 | | | Federated Department Stores, Inc.* | | | 4,645,890 | |
| | |
|
| | | Electrical Equipment – 1.0% |
| | | | 122,500 | | | Dover Corp. | | | 3,572,100 | |
| | |
|
| | | Electrical Utilities – 9.0% |
| | | | 70,500 | | | Consolidated Edison, Inc. | | | 3,018,810 | |
| | | | 422,756 | | | Energy East Corp. | | | 9,338,680 | |
| | | | 93,921 | | | Entergy Corp. | | | 4,281,858 | |
| | | | 194,339 | | | FirstEnergy Corp. | | | 6,407,357 | |
| | | | 82,688 | | | FPL Group, Inc. | | | 4,972,030 | |
| | | | 28,355 | | | Pinnacle West Capital Corp. | | | 966,622 | |
| | | | 95,863 | | | PPL Corp. | | | 3,324,529 | |
| | | | | | | | | |
| |
| | | | | | | | | | 32,309,886 | |
| | |
|
| | | Energy Resources – 7.6% |
| | | | 64,700 | | | Apache Corp. | | | 3,687,253 | |
| | | | 143,590 | | | EOG Resources, Inc. | | | 5,732,113 | |
| | | | 130,600 | | | Murphy Oil Corp. | | | 5,596,210 | |
| | | | 359,918 | | | Ocean Energy, Inc. | | | 7,187,563 | |
| | | | 200,101 | | | Pioneer Natural Resources Co.* | | | 5,052,550 | |
| | | | | | | | | |
| |
| | | | | | | | | | 27,255,689 | |
| | |
|
| | | Environmental Services – 1.7% |
| | | | 297,276 | | | Republic Services, Inc.* | | | 6,236,851 | |
| | |
|
| | | Financial Services – 1.9% |
| | | | 132,356 | | | Countrywide Credit Industries, Inc. | | | 6,836,187 | |
| | |
|
| | | Food & Beverage – 1.4% |
| | | | 195,261 | | | ConAgra Foods, Inc. | | | 4,883,478 | |
| | |
|
| | | Forest – 2.7% |
| | | | 266,474 | | | Packaging Corp. of America* | | | 4,860,486 | |
| | | | 212,639 | | | Sonoco Products Co. | | | 4,875,812 | |
| | | | | | | | | |
| |
| | | | | | | | | | 9,736,298 | |
| | |
|
| | | Gas Utilities – 0.9% |
| | | | 94,544 | | | KeySpan Corp. | | | 3,331,731 | |
| | |
|
| | | Heavy Electrical – 0.8% |
| | | | 138,900 | | | Rockwell Automation, Inc. | | | 2,876,619 | |
| | |
|
| | | Home Products – 0.5% |
| | | | 65,440 | | | The Estee Lauder Companies, Inc. | | | 1,727,616 | |
| | |
|
| | | Hotels – 2.5% |
| | | | 88,671 | | | Harrah’s Entertainment, Inc.* | | | 3,511,372 | |
| | | | 148,543 | | | Hilton Hotels Corp. | | | 1,887,981 | |
| | | | 148,468 | | | Starwood Hotels & Resorts Worldwide, Inc. | | | 3,524,630 | |
| | | | | | | | | |
| |
| | | | | | | | | | 8,923,983 | |
| | |
|
The accompanying notes are an integral part of these financial statements. 35
GOLDMAN SACHS VARIABLE INSURANCE TRUST MID CAP VALUE FUND
Statement of Investments (continued)
December 31, 2002
| | | | | | | | | | | |
| | | | | | |
| | Shares | | Description | | Value |
| | |
Common Stocks – (continued) |
|
| | | Industrial Parts – 3.0% |
| | | | 80,464 | | | American Standard Companies, Inc.* | | $ | 5,724,209 | |
| | | | 100,825 | | | W.W. Grainger, Inc. | | | 5,197,529 | |
| | | | | | | | | |
| |
| | | | | | | | | | 10,921,738 | |
| | |
|
| | | Information Services – 1.3% |
| | | | 86,900 | | | Affiliated Computer Services, Inc.* | | | 4,575,285 | |
| | |
|
| | | Life Insurance – 1.1% |
| | | | 126,864 | | | The Principal Financial Group, Inc. | | | 3,822,412 | |
| | |
|
| | | Media – 1.3% |
| | | | 139,255 | | | Lamar Advertising Co.* | | | 4,685,931 | |
| | |
|
| | | Medical Providers – 1.2% |
| | | | 96,816 | | | Universal Health Services, Inc. Class B* | | | 4,366,402 | |
| | |
|
| | | Mining – 0.9% |
| | | | 75,529 | | | Nucor Corp. | | | 3,119,348 | |
| | |
|
| | | Motor Vehicle – 1.2% |
| | | | 30,939 | | | Johnson Controls, Inc. | | | 2,480,379 | |
| | | | 53,878 | | | Lear Corp.* | | | 1,793,060 | |
| | | | | | | | | |
| |
| | | | | | | | | | 4,273,439 | |
| | |
|
| | | Office Industrial – 2.6% |
| | | | 178,913 | | | Duke-Weeks Realty Corp. | | | 4,553,336 | |
| | | | 145,074 | | | Liberty Property Trust | | | 4,633,663 | |
| | | | | | | | | |
| |
| | | | | | | | | | 9,186,999 | |
| | |
|
| | | Oil Services – 2.1% |
| | | | 152,300 | | | BJ Services Co.* | | | 4,920,813 | |
| | | | 72,743 | | | Noble Corp.* | | | 2,556,916 | |
| | | | | | | | | |
| |
| | | | | | | | | | 7,477,729 | |
| | |
|
| | | Other REIT – 2.1% |
| | | | 206,562 | | | iStar Financial, Inc. | | | 5,794,064 | |
| | | | 67,853 | | | Plum Creek Timber Co., Inc. | | | 1,601,331 | |
| | | | | | | | | |
| |
| | | | | | | | | | 7,395,395 | |
| | |
|
| | | Property Insurance – 7.2% |
| | | | 30,054 | | | AMBAC Financial Group, Inc. | | | 1,690,237 | |
| | | | 165,430 | | | PartnerRe Ltd. | | | 8,572,583 | |
| | | | 170,942 | | | RenaissanceRe Holdings Ltd. | | | 6,769,303 | |
| | | | 61,400 | | | The St. Paul Companies, Inc. | | | 2,090,670 | |
| | | | 225,330 | | | Willis Group Holdings Ltd.* | | | 6,460,211 | |
| | | | | | | | | |
| |
| | | | | | | | | | 25,583,004 | |
| | |
|
| | | Publishing – 1.0% |
| | | | 174,822 | | | A.H. Belo Corp. | | | 3,727,205 | |
| | |
|
| | | Railroads – 0.3% |
| | | | 24,044 | | | Canadian National Railway Co. | | | 999,269 | |
| | |
|
| | | Restaurants – 1.8% |
| | | | 164,930 | | | Darden Restaurants, Inc. | | | 3,372,818 | |
| | | | 122,354 | | | Yum! Brands, Inc.* | | | 2,963,414 | |
| | | | | | | | | |
| |
| | | | | | | | | | 6,336,232 | |
| | |
|
| | | Retail – 0.8% |
| | | | 83,146 | | | Simon Property Group, Inc. | | | 2,832,784 | |
| | |
|
| | | Security/ Asset Management – 1.1% |
| | | | 143,812 | | | T. Rowe Price Group, Inc. | | | 3,923,191 | |
| | |
|
| | | Semiconductors – 0.8% |
| | | | 152,000 | | | Integrated Circuit Systems, Inc.* | | | 2,774,000 | |
| | |
|
| | | Telephone – 1.0% |
| | | | 118,000 | | | CenturyTel, Inc. | | | 3,466,840 | |
| | |
|
| | | Thrifts – 1.3% |
| | | | 101,462 | | | GreenPoint Financial Corp. | | | 4,584,053 | |
| | |
|
| | | Tobacco – 1.9% |
| | | | 204,645 | | | UST, Inc. | | | 6,841,282 | |
| | |
|
| | | Truck Freight – 1.4% |
| | | | 63,110 | | | Landstar System, Inc.* | | | 3,683,099 | |
| | | | 59,479 | | | Ryder System, Inc. | | | 1,334,709 | |
| | | | | | | | | |
| |
| | | | | | | | | | 5,017,808 | |
| | |
|
| | | TOTAL COMMON STOCKS |
| | | (Cost $342,480,053) | | $ | 344,696,718 | |
| | |
|
36 The accompanying notes are an integral part of these financial statements.
GOLDMAN SACHS VARIABLE INSURANCE TRUST MID CAP VALUE FUND
| | | | | | | | | | | | | | | | | |
| | | | | | | | |
| | Principal | | Interest | | Maturity | | |
| | Amount | | Rate | | Date | | Value |
| | |
Repurchase Agreement – 3.4% |
|
| | | Joint Repurchase Agreement Account II^ |
| | | $ | 12,100,000 | | | | 1.25 | % | | | 01/02/2003 | | | $ | 12,100,000 | |
| | | Maturity Value: $12,100,840 |
| | |
|
| | | TOTAL REPURCHASE AGREEMENT |
| | | (Cost $12,100,000) | | $ | 12,100,000 | |
| | |
|
| | | TOTAL INVESTMENTS |
| | | (Cost $354,580,053) | | $ | 356,796,718 | |
| | |
|
* Non-income producing security.
| |
| ^ | Joint repurchase agreement was entered into on December 31, 2002. |
| |
| | The percentage shown for each investment category reflects the value of investments in that category as a percentage of total net assets. |
| | | | | | | |
| | |
|
| | | Investment Abbreviation: |
| | | REIT | | — | | Real Estate Investment Trust |
| | |
|
The accompanying notes are an integral part of these financial statements. 37
GOLDMAN SACHS VARIABLE INSURANCE TRUST INTERNATIONAL EQUITY FUND
Shareholder Letter
Dear Shareholders:
This report provides an overview on the performance of the Goldman Sachs Variable Insurance Trust — International Equity Fund for the one-year period that ended December 31, 2002.
Market Overview
Disappointing earnings and uncertainty drove the poor equity returns of 2002, with the global economic recovery being the predominant macro-level theme. In the first three quarters of 2002, we noted investors’ increasing reluctance to distinguish quality businesses from the rest of the market. Fear, doubt, and uncertainty — the results of corporate scandals, earnings disappointments, and geopolitical risk — exerted broad downward pressure on markets. Stocks fell, regardless of fundamental strength, underpinning individual businesses. In the fourth quarter of the year, three key drivers lent stability to the global equity markets — expectation for the global economy, hope for core earnings, and the market’s return to a rational valuation level. Some positive economic news provided a basis for cautious investor optimism and countered concerns of a double-dip recession. The appearance of increased spending in the government sector and a rebuilding of inventories allayed fears surrounding economic growth prospects.
Performance Review
Over the one-year period that ended December 31, 2002, the Fund generated a cumulative total return of -18.34%. Over the same time period, the Fund’s benchmark, the MSCI EAFE Index (unhedged with dividends reinvested), generated a cumulative total return of
- -15.66%.
As these returns indicate, it has been a challenging period in the financial markets, and for the Fund in particular. In this environment, defensive sectors continued to outperform at the expense of more economically sensitive cyclical sectors. The Fund’s overall returns and underperformance versus its benchmark were due largely to an overweight position in Information Technology (IT) and Health Care. Investor risk aversion to high-beta sectors hurt overall IT performance while Health Care sector underperformance was driven by drug patent litigation issues and a lower number of FDA approvals. However, we maintained an overweight position in the Consumer Discretionary sector, which enhanced results due to the resilience of specific media stocks, including VNU NV and British Sky Broadcasting Group PLC.
Investment Objective
The Fund seeks long-term capital appreciation, primarily through equity securities of companies that are organized outside the United States or whose securities are principally traded outside the United States.
38
GOLDMAN SACHS VARIABLE INSURANCE TRUST INTERNATIONAL EQUITY FUND
Portfolio Composition
Top 10 Portfolio Holdings as of December 31, 2002*
| | | | | | | | | |
| | | | | | % of Total |
| Company | | Country | | Business | | Net Assets |
| |
| |
| |
|
| Royal Bank of Scotland Group PLC | | United Kingdom | | Banks | | | 4.0 | % |
| Vodafone Group PLC | | United Kingdom | | Wireless | | | 3.9 | % |
| GlaxoSmithKline PLC | | United Kingdom | | Drugs | | | 3.9 | % |
| Novartis AG | | Switzerland | | Health | | | 3.7 | % |
| Total Fina Elf SA Class B | | France | | Energy Resources | | | 3.6 | % |
| UniCredito Italiano SpA | | Italy | | Banks | | | 3.3 | % |
| VNU NV | | Netherlands | | Media | | | 3.1 | % |
| Takeda Chemical Industries, Ltd. | | Japan | | Drugs | | | 2.6 | % |
| Tesco PLC | | United Kingdom | | Specialty Retail | | | 2.5 | % |
| Nestle SA | | Switzerland | | Food & Beverage | | | 2.5 | % |
* Opinions expressed in this report represent our present opinions only. Reference to individual securities should not be construed as a commitment that such securities will be retained in the Fund. From time to time, the Fund may change the individual securities it holds, the number or types of securities held and the markets in which it invests. References to individual securities do not constitute a recommendation to the investor to buy, hold or sell such securities. In addition, references to past performance of the Fund do not indicate future returns, which are not guaranteed and will vary. Furthermore, the value of shares of the Fund may fall as well as rise.
Portfolio Outlook
As we look forward, we are uncertain about the imminent direction of the equity markets. We feel that today it is harder for companies to produce earnings growth than it has been over the last decade. As a result, dividend yields have consequently regained status and the potential repeal of the individual shareholder tax on dividends in the U.S. may make this an even more striking reality. We believe that regardless of whether earnings growth will be in the single- or double-digits, and whether markets as a whole rise or fall, the key to long-term performance is owning quality businesses with excellent management teams. Such companies tend to have enduring business models, strong competitive positioning, and management teams that are able to execute their strategies in very difficult operating environments. In our bottom-up, fundamental research-driven portfolio construction process, we continue to remain focused on precisely these types of companies.
We thank you for your investment and look forward to your continued confidence.
Goldman Sachs International Equity Portfolio Management Team
January 9, 2003
39
GOLDMAN SACHS VARIABLE INSURANCE TRUST INTERNATIONAL EQUITY FUND
Performance Summary
December 31, 2002
The following graph shows the value as of December 31, 2002, of a $10,000 investment made on January 12, 1998 (commencement of operations). For comparative purposes, the performance of the Fund’s benchmark (the Morgan Stanley Capital International Europe, Australasia and Far East Index, (“MSCI EAFE (unhedged)”) is shown. This performance data represents past performance and should not be considered indicative of future performance which will fluctuate with changes in market conditions. These performance fluctuations will cause an investor’s shares, when redeemed, to be worth more or less than their original cost. Returns do not reflect the deduction of taxes that a shareholder would pay on fund distributions or the redemption of fund shares.
| International Equity Fund’s Lifetime Performance |
Growth of a $10,000 investment, Distributions Reinvested from January 12, 1998 to December 31, 2002.

| | | | | | | |
| | Since Inception | | One Year | | |
|
|
|
|
Average Annual Total Return through December 31, 2002 |
|
|
|
|
International Equity Fund (commenced January 12, 1998) | | -2.71% | | -18.34% | | |
|
40
GOLDMAN SACHS VARIABLE INSURANCE TRUST INTERNATIONAL EQUITY FUND
Statement of Investments
December 31, 2002
| | | | | | | | | | | |
| | | | | | |
| | Shares | | Description | | Value |
| | | | | | |
| | |
Common Stocks – 97.0% |
|
| | | Australia – 0.4% |
| | | | 32,181 | | | Insurance Australia Group Ltd. (Insurance) | | $ | 49,621 | |
| | |
|
| | | Denmark – 0.2% |
| | | | 1,025 | | | Group 4 Falck A/S (Business Services) | | | 21,631 | |
| | |
|
| | | Finland – 2.4% |
| | | | 20,151 | | | Nokia Oyj (Technology Hardware & Equipment) | | | 320,155 | |
| | |
|
| | | France – 6.9% |
| | | | 7,280 | | | BNP Paribas SA (Banks) | | | 296,449 | |
| | | | 1,876 | | | Lafarge SA (Materials) | | | 141,256 | |
| | | | 3,335 | | | Total Fina Elf SA Class B (Energy Resources) | | | 475,998 | |
| | | | | | | | | |
| |
| | | | | | | | | | 913,703 | |
| | |
|
| | | Germany – 1.9% |
| | | | 2,176 | | | Bayerische Motoren Werke (BMW) AG (Auto) | | | 65,995 | |
| | | | 2,342 | | | SAP AG (Computer Software) | | | 185,481 | |
| | | | | | | | | |
| |
| | | | | | | | | | 251,476 | |
| | |
|
| | | Hong Kong – 0.5% |
| | | | 6,800 | | | Hang Seng Bank Ltd. (Banks) | | | 72,373 | |
| | |
|
| | | Ireland – 3.1% |
| | | | 15,848 | | | Allied Irish Banks PLC (Banks) | | | 215,206 | |
| | | | 19,075 | | | Bank of Ireland (Banks) | | | 195,242 | |
| | | | | | | | | |
| |
| | | | | | | | | | 410,448 | |
| | |
|
| | | Italy – 4.8% |
| | | | 9,534 | | | ENI SpA (Energy Resources) | | | 151,474 | |
| | | | 6,315 | | | Telecom Italia SpA (Telecommunications) | | | 47,881 | |
| | | | 108,500 | | | UniCredito Italiano SpA (Banks) | | | 433,517 | |
| | | | | | | | | |
| |
| | | | | | | | | | 632,872 | |
| | |
|
| | | Japan – 19.0% |
| | | | 4,700 | | | C&S Co., Ltd. (Food & Drug Retailing) | | | 61,105 | |
| | | | 14,100 | | | Chugai Pharmaceutical Co. Ltd. (Health) | | | 134,161 | |
| | | | 32 | | | Dentsu, Inc. (Media) | | | 97,541 | |
| | | | 9,000 | | | Fuji Photo Film Co. Ltd. (Consumer Durables & Apparel) | | | 293,281 | |
| | | | 7,000 | | | Honda Motor Co. Ltd. (Auto) | | | 258,757 | |
| | | | 6,100 | | | Isetan Co. Ltd. (Retail-Major Department Store) | | | 41,810 | |
| | | | 12,000 | | | Kao Corp. (Consumer Products) | | | 263,220 | |
| | | | 35,000 | | | Mitsui O.S.K. Lines Ltd. (Transportation-Shipping) | | | 72,499 | |
| | | | 1,000 | | | NGK INSULATORS, LTD. (Capital Goods) | | | 5,457 | |
| | | | 6,000 | | | Nomura Holdings, Inc. (Financial Services) | | | 67,397 | |
| | | | 1,700 | | | ORIX Corp. (Consumer Finance) | | | 109,507 | |
| | | | 17,000 | | | RICOH CO., LTD (Computer Hardware) | | | 278,705 | |
| | | | 900 | | | ROHM CO., LTD. (Semiconductors) | | | 114,508 | |
| | | | 8,000 | | | Shin-Etsu Chemical Co. Ltd. (Materials) | | | 262,041 | |
| | | | 2,500 | | | SKYLARK CO., LTD (Restaurants) | | | 33,134 | |
| | | | 1,000 | | | Sumitomo Corp. (Capital Goods) | | | 4,294 | |
| | | | 2 | | | Sumitomo Mitsui Financial Group, Inc. (Banks) | | | 6,248 | |
| | | | 8,200 | | | Takeda Chemical Industries Ltd. (Drugs) | | | 342,472 | |
| | | | 6,200 | | | Toppan Forms Co. Ltd. (Commercial Services & Supplies) | | | 69,643 | |
| | | | | | | | | |
| |
| | | | | | | | | | 2,515,780 | |
| | |
|
| | | Mexico – 2.3% |
| | | | 168,902 | | | Grupo Financiero BBVA Bancomer SA de CV Class B* | | | 128,216 | |
| | | | | | | (Financial Services) | | | | |
| | | | 1,800 | | | Grupo Televisa SA ADR* (Media) | | | 50,274 | |
| | | | 4,000 | | | Telefonos de Mexico SA de CV ADR (Telecommunications) | | | 127,920 | |
| | | | | | | | | |
| |
| | | | | | | | | | 306,410 | |
| | |
|
| | | Netherlands – 7.9% |
| | | | 16,242 | | | European Aeronautic Defence & Space Co. (Capital Goods) | | | 167,775 | |
| | | | 2,606 | | | Gucci Group (Apparel) | | | 238,993 | |
| | | | 9,838 | | | ING Groep NV (Financial Services) | | | 166,518 | |
| | | | 809 | | | Royal Dutch Petroleum Co. (Energy Resources) | | | 35,590 | |
| | | | 3,790 | | | Vedior NV (Business Services) | | | 21,622 | |
| | | | 15,786 | | | VNU NV (Media) | | | 411,386 | |
| | | | | | | | | |
| |
| | | | | | | | | | 1,041,884 | |
| | |
|
| | | Singapore – 2.4% |
| | | | 1,185 | | | Haw Par Corp. Ltd. (Multi-Industrial) | | | 2,227 | |
| | | | 58,000 | | | Keppel Corp. Ltd. (Financial Services) | | | 123,714 | |
| | | | 29,000 | | | United Overseas Bank Ltd. (Banks) | | | 197,273 | |
| | | | | | | | | |
| |
| | | | | | | | | | 323,214 | |
| | |
|
| | | South Korea – 1.9% |
| | | | 6,860 | | | Hana Bank GDR (Banks) | | | 94,325 | |
| | | | 5,100 | | | Hyundai Motor Co. Ltd. GDR (Auto) | | | 61,200 | |
| | | | 700 | | | Samsung Electronics Co. Ltd. GDR† (Electronic Components & Instruments) | | | 93,450 | |
| | | | | | | | | |
| |
| | | | | | | | | | 248,975 | |
| | |
|
The accompanying notes are an integral part of these financial statements. 41
GOLDMAN SACHS VARIABLE INSURANCE TRUST INTERNATIONAL EQUITY FUND
Statement of Investments (continued)
December 31, 2002
| | | | | | | | | | | |
| | | | | | |
| | Shares | | Description | | Value |
| | | | | | |
| | |
Common Stocks – (continued) |
|
| | | Spain – 2.2% |
| | | | 5,480 | | | Industria de Diseno Textil SA (Retailing) | | $ | 129,362 | |
| | | | 17,512 | | | Telefonica de Espana SA* (Telecommunications) | | | 156,652 | |
| | | | | | | | | |
| |
| | | | | | | | | | 286,014 | |
| | |
|
| | | Sweden – 2.1% |
| | | | 4,105 | | | Eniro AB (Media) | | | 25,969 | |
| | | | 21,302 | | | Securitas AB Series B (Business Services) | | | 254,820 | |
| | | | | | | | | |
| |
| | | | | | | | | | 280,789 | |
| | |
|
| | | Switzerland – 9.8% |
| | | | 4,308 | | | Adecco SA (Business Services) | | | 168,819 | |
| | | | 4,795 | | | Converium Holding AG* (Insurance) | | | 232,279 | |
| | | | 1,541 | | | Nestle SA (Food & Beverage) | | | 326,450 | |
| | | | 13,468 | | | Novartis AG (Health) | | | 491,259 | |
| | | | 1,295 | | | Syngenta AG (Materials) | | | 74,951 | |
| | | | | | | | | |
| |
| | | | | | | | | | 1,293,758 | |
| | |
|
| | | United Kingdom – 29.2% |
| | | | 15,174 | | | Amey PLC (Business Services) | | | 6,350 | |
| | | | 4,128 | | | AstraZeneca PLC (Pharmaceuticals) | | | 147,497 | |
| | | | 22,741 | | | BAA PLC (Airport Services) | | | 184,472 | |
| | | | 16,334 | | | Barclays PLC (Banks) | | | 101,215 | |
| | | | 9,712 | | | BP PLC (Energy Resources) | | | 66,746 | |
| | | | 24,884 | | | British Sky Broadcasting Group PLC* (Media) | | | 255,925 | |
| | | | 22,078 | | | Capita Group PLC (Business Services) | | | 87,948 | |
| | | | 27,922 | | | Diageo PLC (Food & Beverage) | | | 303,348 | |
| | | | 23,933 | | | Exel PLC (Transportation) | | | 265,019 | |
| | | | 26,979 | | | GlaxoSmithKline PLC (Drugs) | | | 517,598 | |
| | | | 89,936 | | | International Power PLC* (Electrical Utilities) | | | 138,600 | |
| | | | 86,532 | | | Legal & General Group PLC (Insurance) | | | 133,702 | |
| | | | 7,496 | | | Reckitt Benckiser PLC (Household & Personal Products) | | | 145,381 | |
| | | | 21,907 | | | Royal Bank of Scotland Group PLC (Banks) | | | 524,659 | |
| | | | 107,402 | | | Tesco PLC (Specialty Retail) | | | 335,355 | |
| | | | 285,406 | | | Vodafone Group PLC (Wireless) | | | 520,226 | |
| | | | 15,660 | | | WPP Group PLC (Advertising) | | | 119,597 | |
| | | | | | | | | |
| |
| | | | | | | | | | 3,853,638 | |
| | |
|
| | | TOTAL COMMON STOCKS |
| | | (Cost $15,147,145) | | $ | 12,822,741 | |
| | |
|
| | | TOTAL INVESTMENTS BEFORE SECURITIES |
| | | LENDING COLLATERAL |
| | | (Cost $15,147,145) | | $ | 12,822,741 | |
| | |
|
| | |
Securities Lending Collateral – 1.2% |
|
| | | | 153,180 | | | Boston Global Investment Trust – Enhanced Portfolio | | $ | 153,180 | |
| | |
|
| | | TOTAL SECURITIES LENDING COLLATERAL |
| | | (Cost $153,180) | | $ | 153,180 | |
| | |
|
| | | TOTAL INVESTMENTS |
| | | (Cost $15,300,325) | | $ | 12,975,921 | |
| | |
|
| | |
| * | | Non-income producing security. |
| |
| † | | Securities are exempt from registration under Rule 144A of the Securities Act of 1933. Such securities may be resold, normally to qualified institutional buyers in transactions exempt from registration. Total market value of Rule 144A securities amounted to $93,450, which represents 0.71% of net assets as of December 31, 2002. |
| |
| | The percentage shown for each investment category reflects the value of investments in that category as a percentage of total net assets. |
| | | | | | | |
| | |
|
| | | Investment Abbreviation: |
| | | ADR | | — | | American Depositary Receipt |
| | | GDR | | — | | Global Depository Receipt |
| | |
|
42 The accompanying notes are an integral part of these financial statements.
GOLDMAN SACHS VARIABLE INSURANCE TRUST INTERNATIONAL EQUITY FUND
| | | | | | | |
| | | | As a % of |
| | | | Total |
| | | | Net Assets |
| | |
Common Stock Industry Classifications† |
|
| | | Advertising | | | 0.9 | % |
| | | Airport Services | | | 1.4 | |
| | | Apparel | | | 1.8 | |
| | | Auto | | | 2.9 | |
| | | Banks | | | 16.2 | |
| | | Business Services | | | 4.3 | |
| | | Capital Goods | | | 1.3 | |
| | | Commercial Services & Supplies | | | 0.5 | |
| | | Computer Hardware | | | 2.1 | |
| | | Computer Software | | | 1.4 | |
| | | Consumer Durables & Apparel | | | 2.2 | |
| | | Consumer Finance | | | 0.8 | |
| | | Consumer Products | | | 2.0 | |
| | | Drugs | | | 6.5 | |
| | | Electrical Utilities | | | 1.1 | |
| | | Electronic Components & Instruments | | | 0.7 | |
| | | Energy Resources | | | 5.5 | |
| | | Financial Services | | | 3.7 | |
| | | Food & Beverage | | | 4.8 | |
| | | Food & Drug Retailing | | | 0.5 | |
| | | Health | | | 4.7 | |
| | | Household & Personal Products | | | 1.1 | |
| | | Insurance | | | 3.1 | |
| | | Materials | | | 3.6 | |
| | | Media | | | 6.4 | |
| | | Pharmaceuticals | | | 1.1 | |
| | | Restaurants | | | 0.3 | |
| | | Retail-Major Department Store | | | 0.3 | |
| | | Retailing | | | 1.0 | |
| | | Semiconductors | | | 0.9 | |
| | | Specialty Retail | | | 2.5 | |
| | | Technology Hardware & Equipment | | | 2.4 | |
| | | Telecommunications | | | 2.5 | |
| | | Transportation | | | 2.0 | |
| | | Transportation-Shipping | | | 0.6 | |
| | | Wireless | | | 3.9 | |
| | |
|
| | | TOTAL COMMON STOCKS | | | 97.0 | % |
| | |
|
| | |
| † | | Industry concentrations greater than one tenth of one percent are disclosed. |
The accompanying notes are an integral part of these financial statements. 43
GOLDMAN SACHS VARIABLE INSURANCE TRUST
Statements of Assets and Liabilities
December 31, 2002
| | | | | | | | | | | | |
| | | | Growth and | | CORE U.S. |
| | | | Income Fund | | Equity Fund |
| |
| | | Assets: |
|
| | | Investment in securities, at value (identified cost $37,805,804, $157,228,749, $49,479,691, $23,319,655, $354,580,053 and $15,147,145, respectively) | | $ | 36,959,272 | | | $ | 142,661,608 | |
| | | Securities lending collateral, at value | | | 480,000 | | | | — | |
| | | Cash, at value(a) | | | 68,330 | | | | 893,065 | |
| | | Receivables: | | | | | | | | |
| | | | Investment securities sold | | | — | | | | — | |
| | | | Dividends and interest, at value | | | 57,145 | | | | 174,007 | |
| | | | Fund shares sold | | | 38,333 | | | | 267,951 | |
| | | | Forward foreign currency exchange contracts | | | — | | | | — | |
| | | | Variation margin(b) | | | — | | | | 1,855 | |
| | | | Reimbursement from adviser | | | 10,697 | | | | — | |
| | | | Securities lending income | | | 84 | | | | 17 | |
| | | Deferred organization expenses, net | | | — | | | | — | |
| | |
|
| | | Total assets | | | 37,613,861 | | | | 143,998,503 | |
| | |
|
| | | Liabilities: |
|
| | | Payables: | | | | | | | | |
| | | | Investment securities purchased | | | 74,327 | | | | — | |
| | | | Fund shares repurchased | | | 69,956 | | | | 408,003 | |
| | | | Amounts owed to affiliates | | | 25,008 | | | | 91,713 | |
| | | | Payable upon return of securities loaned | | | 480,000 | | | | — | |
| | | | Forward foreign currency exchange contracts | | | — | | | | — | |
| | | Accrued expenses and other liabilities | | | 53,877 | | | | 59,704 | |
| | |
|
| | | Total liabilities | | | 703,168 | | | | 559,420 | |
| | |
|
| | | Net Assets: |
|
| | | Paid-in capital | | | 47,657,936 | | | | 211,090,770 | |
| | | Accumulated undistributed (distributions in excess of) net investment income | | | — | | | | — | |
| | | Accumulated net realized loss on investment, futures and foreign currency related transactions | | | (9,900,711 | ) | | | (53,073,063 | ) |
| | | Net unrealized gain (loss) on investments, futures and translation of assets and liabilities denominated in foreign currencies | | | (846,532 | ) | | | (14,578,624 | ) |
| | |
|
| | | NET ASSETS | | $ | 36,910,693 | | | $ | 143,439,083 | |
| | |
|
| | | Total shares of beneficial interest outstanding, no par value (unlimited shares authorized) | | | 4,536,470 | | | | 16,902,291 | |
| | | Net asset value, offering and redemption price per share | | $ | 8.14 | | | $ | 8.49 | |
| | |
|
| | |
| (a) | | Includes restricted cash of $850,000 and $310,000 for CORE U.S. Equity Fund and CORE Small Cap Equity Fund, respectively, relating to initial margin requirements on futures transactions. |
| |
| (b) | | Includes restricted cash of $280,000 on deposit with the broker as collateral for futures transactions on the International Equity Fund. |
44 The accompanying notes are an integral part of these financial statements.
GOLDMAN SACHS VARIABLE INSURANCE TRUST
| | | | | | | | | | | | | | | | | |
| | | | | | | | |
| | CORE Small Cap | | Capital | | Mid Cap | | International |
| | Equity Fund | | Growth Fund | | Value Fund | | Equity Fund |
| |
| | | |
|
| | | $ | 46,630,597 | | | $ | 18,352,492 | | | $ | 356,796,718 | | | $ | 12,822,741 | |
| | | | 1,052,400 | | | | — | | | | — | | | | 153,180 | |
| | | | 427,434 | | | | 43,133 | | | | 72,806 | | | | 78,722 | |
| | | | — | | | | 701,019 | | | | 1,545,522 | | | | 22,322 | |
| | | | 66,720 | | | | 23,428 | | | | 546,352 | | | | 33,986 | |
| | | | 40,151 | | | | 30,042 | | | | 629,899 | | | | 44,657 | |
| | | | — | | | | — | | | | — | | | | 301,519 | |
| | | | 100 | | | | — | | | | — | | | | 288,141 | |
| | | | 19,808 | | | | 11,551 | | | | — | | | | 12,163 | |
| | | | 1,381 | | | | 21 | | | | 295 | | | | 189 | |
| | | | — | | | | — | | | | 195 | | | | 1,335 | |
| | |
|
| | | | 48,238,591 | | | | 19,161,686 | | | | 359,591,787 | | | | 13,758,955 | |
| | |
|
| | | |
|
| | | | 40,061 | | | | 1,056,207 | | | | 972,328 | | | | 33,056 | |
| | | | 47,598 | | | | 3,509 | | | | 741,625 | | | | 6,773 | |
| | | | 32,018 | | | | 12,220 | | | | 257,440 | | | | 11,648 | |
| | | | 1,052,400 | | | | — | | | | — | | | | 153,180 | |
| | | | — | | | | — | | | | — | | | | 273,220 | |
| | | | 61,712 | | | | 37,755 | | | | 83,273 | | | | 67,108 | |
| | |
|
| | | | 1,233,789 | | | | 1,109,691 | | | | 2,054,666 | | | | 544,985 | |
| | |
|
| | | |
|
| | | | 53,931,455 | | | | 25,937,569 | | | | 368,075,027 | | | | 24,452,803 | |
| | | | 2,950 | | | | — | | | | 63,062 | | | | (4,085 | ) |
| | | | (4,077,604 | ) | | | (2,918,411 | ) | | | (12,817,633 | ) | | | (8,933,107 | ) |
| | | | (2,851,999 | ) | | | (4,967,163 | ) | | | 2,216,665 | | | | (2,301,641 | ) |
| | |
|
| | | $ | 47,004,802 | | | $ | 18,051,995 | | | $ | 357,537,121 | | | $ | 13,213,970 | |
| | |
|
| | | | 5,113,555 | | | | 2,324,281 | | | | 33,712,276 | | | | 1,822,922 | |
| | | $ | 9.19 | | | $ | 7.77 | | | $ | 10.61 | | | $ | 7.25 | |
| | |
|
The accompanying notes are an integral part of these financial statements. 45
GOLDMAN SACHS VARIABLE INSURANCE TRUST
Statements of Operations
For the Year Ended December 31, 2002
| | | | | | | | | | | | |
| | | | Growth and | | CORE U.S. |
| | | | Income Fund | | Equity Fund |
| |
| | | Investment income: |
|
| | | Dividends(a) | | $ | 959,287 | | | $ | 2,205,608 | |
| | | Interest (including securities lending income of $197, $659, $11,970, $31, $8,644 and $10,181, respectively) | | | 26,547 | | | | 20,782 | |
| | |
|
| | | Total income | | | 985,834 | | | | 2,226,390 | |
| | |
|
| | | Expenses: |
|
| | | Management fees | | | 288,101 | | | | 1,075,955 | |
| | | Custodian fees | | | 68,768 | | | | 85,497 | |
| | | Professional fees | | | 35,747 | | | | 35,747 | |
| | | Printing fees | | | 27,403 | | | | 19,308 | |
| | | Transfer agent fees | | | 22,519 | | | | 36,714 | |
| | | Trustee fees | | | 10,286 | | | | 10,286 | |
| | | Deferred organization expenses | | | 3,186 | | | | 3,432 | |
| | | Other | | | 31,943 | | | | 47,434 | |
| | |
|
| | | Total expenses | | | 487,953 | | | | 1,314,373 | |
| | |
|
| | | Less — expense reductions | | | (83,818 | ) | | | (10,178 | ) |
| | |
|
| | | Net expenses | | | 404,135 | | | | 1,304,195 | |
| | |
|
| | | NET INVESTMENT INCOME | | | 581,699 | | | | 922,195 | |
| | |
|
| | | Realized and unrealized gain (loss) on investment, futures and foreign currency transactions: |
|
| | | Net realized gain (loss) from: | | | | | | | | |
| | | | Investment transactions | | | (4,544,880 | ) | | | (28,141,255 | ) |
| | | | Futures transactions | | | — | | | | (526,482 | ) |
| | | | Foreign currency related transactions | | | — | | | | — | |
| | | Net change in unrealized gain (loss) on: | | | | | | | | |
| | | | Investments | | | (960,402 | ) | | | (11,598,754 | ) |
| | | | Futures | | | — | | | | (19,119 | ) |
| | | | Translation of assets and liabilities denominated in foreign currencies | | | — | | | | — | |
| | |
|
| | | Net realized and unrealized loss on investment, futures and foreign currency transactions | | | (5,505,282 | ) | | | (40,285,610 | ) |
| | |
|
| | | NET DECREASE IN NET ASSETS RESULTING FROM OPERATIONS | | $ | (4,923,583 | ) | | $ | (39,363,415 | ) |
| | |
|
| | |
| (a) | | For the Growth and Income, CORE U.S. Equity, CORE Small Cap Equity, Capital Growth, Mid Cap Value, and International Equity Funds, foreign taxes withheld on dividends were $2,569, $7,545, $296, $702, $10,252 and $32,007, respectively. |
46 The accompanying notes are an integral part of these financial statements.
GOLDMAN SACHS VARIABLE INSURANCE TRUST
| | | | | | | | | | | | | | | | | |
| | CORE Small Cap | | Capital | | Mid Cap | | International |
| | Equity Fund | | Growth Fund | | Value Fund | | Equity Fund |
| |
| | | |
|
| | | $ | 664,766 | | | $ | 208,363 | | | $ | 6,705,549 | | | $ | 255,595 | |
| | | | 15,377 | | | | 9,653 | | | | 245,409 | | | | 23,143 | |
| | |
|
| | | | 680,143 | | | | 218,016 | | | | 6,950,958 | | | | 278,738 | |
| | |
|
| | | |
|
| | | | 394,097 | | | | 129,442 | | | | 2,636,097 | | | | 156,515 | |
| | | | 155,553 | | | | 61,988 | | | | 107,503 | | | | 173,196 | |
| | | | 35,747 | | | | 35,247 | | | | 34,747 | | | | 37,047 | |
| | | | 19,308 | | | | 19,308 | | | | 101,318 | | | | 24,603 | |
| | | | 23,945 | | | | 20,012 | | | | 64,248 | | | | 19,491 | |
| | | | 10,286 | | | | 10,286 | | | | 10,286 | | | | 10,286 | |
| | | | 3,432 | | | | 4,089 | | | | 4,143 | | | | 4,143 | |
| | | | 34,380 | | | | 24,511 | | | | 45,461 | | | | 37,500 | |
| | |
|
| | | | 676,748 | | | | 304,883 | | | | 3,003,803 | | | | 462,781 | |
| | |
|
| | | | (129,886 | ) | | | (114,823 | ) | | | (11,190 | ) | | | (234,535 | ) |
| | |
|
| | | | 546,862 | | | | 190,060 | | | | 2,992,613 | | | | 228,246 | |
| | |
|
| | | | 133,281 | | | | 27,956 | | | | 3,958,345 | | | | 50,492 | |
| | |
|
| | | |
|
| | | | (2,097,040 | ) | | | (1,725,376 | ) | | | (12,108,793 | ) | | | (2,483,670 | ) |
| | | | (68,210 | ) | | | — | | | | — | | | | (64,209 | ) |
| | | | — | | | | — | | | | — | | | | 123,650 | |
| | | | (6,658,376 | ) | | | (3,211,807 | ) | | | (15,466,767 | ) | | | (810,369 | ) |
| | | | (4,600 | ) | | | — | | | | — | | | | (48,915 | ) |
| | | | — | | | | — | | | | — | | | | 18,140 | |
| | |
|
| | | | (8,828,226 | ) | | | (4,937,183 | ) | | | (27,575,560 | ) | | | (3,265,373 | ) |
| | |
|
| | | $ | (8,694,945 | ) | | $ | (4,909,227 | ) | | $ | (23,617,215 | ) | | $ | (3,214,881 | ) |
| | |
|
The accompanying notes are an integral part of these financial statements. 47
GOLDMAN SACHS VARIABLE INSURANCE TRUST
Statements of Changes in Net Assets
For the Year Ended December 31, 2002
| | | | | | | | | | | |
| | | | | | |
| | | | Growth and | | CORE U.S. |
| | | | Income Fund | | Equity Fund |
| |
| | | From operations: |
|
| | | Net investment income | | $ | 581,699 | | | $ | 922,195 | |
| | | Net realized loss on investment, futures and foreign currency related transactions | | | (4,544,880 | ) | | | (28,667,737 | ) |
| | | Net change in unrealized gain (loss) on investments, futures and translation of assets and liabilities denominated in foreign currencies | | | (960,402 | ) | | | (11,617,873 | ) |
| | |
|
| | | Net decrease in net assets resulting from operations | | | (4,923,583 | ) | | | (39,363,415 | ) |
| | |
|
| | | Distributions to shareholders: |
|
| | | From net investment income | | | (594,255 | ) | | | (927,555 | ) |
| | | From net realized gain on investment, futures and foreign currency related transactions | | | — | | | | — | |
| | |
|
| | | Total distributions to shareholders | | | (594,255 | ) | | | (927,555 | ) |
| | |
|
| | | From share transactions: |
|
| | | Proceeds from sales of shares | | | 14,862,099 | | | | 37,886,405 | |
| | | Reinvestment of dividends and distributions | | | 594,255 | | | | 927,555 | |
| | | Cost of shares repurchased | | | (13,620,580 | ) | | | (18,988,344 | ) |
| | |
|
| | | Net increase (decrease) in net assets resulting from share transactions | | | 1,835,774 | | | | 19,825,616 | |
| | |
|
| | | TOTAL INCREASE (DECREASE) | | | (3,682,064 | ) | | | (20,465,354 | ) |
| | |
|
| | | Net assets: |
|
| | | Beginning of year | | | 40,592,757 | | | | 163,904,437 | |
| | |
|
| | | End of year | | $ | 36,910,693 | | | $ | 143,439,083 | |
| | |
|
| | | Accumulated undistributed (distributions in excess of) net investment income | | $ | — | | | $ | — | |
| | |
|
| | | Summary of share transactions: |
|
| | | Shares sold | | | 1,719,473 | | | | 3,923,158 | |
| | | Shares issued on reinvestment of dividends and distributions | | | 72,647 | | | | 108,233 | |
| | | Shares repurchased | | | (1,605,512 | ) | | | (2,117,889 | ) |
| | |
|
| | | TOTAL INCREASE (DECREASE) | | | 186,608 | | | | 1,913,502 | |
| | |
|
48 The accompanying notes are an integral part of these financial statements.
GOLDMAN SACHS VARIABLE INSURANCE TRUST
| | | | | | | | | | | | | | | | | |
| | CORE Small Cap | | Capital | | Mid Cap | | International |
| | Equity Fund | | Growth Fund | | Value Fund | | Equity Fund |
| |
| | | |
|
| | | $ | 133,281 | | | $ | 27,956 | | | $ | 3,958,345 | | | $ | 50,492 | |
| | | | (2,165,250 | ) | | | (1,725,376 | ) | | | (12,108,793 | ) | | | (2,424,229 | ) |
| | | |
(6,662,976 | ) | | | (3,211,807 | ) | | | (15,466,767 | ) | | | (841,144 | ) |
| | |
|
| | | | (8,694,945 | ) | | | (4,909,227 | ) | | | (23,617,215 | ) | | | (3,214,881 | ) |
| | |
|
| | | |
|
| | | | (141,224 | ) | | | (37,758 | ) | | | (3,899,154 | ) | | | (161,774 | ) |
| | | | — | | | | — | | | | (1,137,534 | ) | | | — | |
| | |
|
| | | | (141,224 | ) | | | (37,758 | ) | | | (5,036,688 | ) | | | (161,774 | ) |
| | |
|
| | | |
|
| | | | 9,833,705 | | | | 10,640,320 | | | | 203,015,816 | | | | 2,820,438 | |
| | | | 141,224 | | | | 37,758 | | | | 5,036,688 | | | | 161,774 | |
| | | | (8,498,535 | ) | | | (3,944,659 | ) | | | (65,381,986 | ) | | | (4,164,843 | ) |
| | |
|
| | | | 1,476,394 | | | | 6,733,419 | | | | 142,670,518 | | | | (1,182,631 | ) |
| | |
|
| | | | (7,359,775 | ) | | | 1,786,434 | | | | 114,016,615 | | | | (4,559,286 | ) |
| | |
|
| | | |
|
| | | | 54,364,577 | | | | 16,265,561 | | | | 243,520,506 | | | | 17,773,256 | |
| | |
|
| | | $ | 47,004,802 | | | $ | 18,051,995 | | | $ | 357,537,121 | | | $ | 13,213,970 | |
| | |
|
| | | $ | 2,950 | | | $ | — | | | $ | 63,062 | | | $ | (4,085 | ) |
| | |
|
| | | |
|
| | | | 931,766 | | | | 1,198,946 | | | | 17,617,800 | | | | 337,661 | |
| | | | 15,351 | | | | 4,791 | | | | 475,159 | | | | 22,817 | |
| | | | (849,107 | ) | | | (461,265 | ) | | | (5,954,752 | ) | | | (513,576 | ) |
| | |
|
| | | | 98,010 | | | | 742,472 | | | | 12,138,207 | | | | (153,098 | ) |
| | |
|
The accompanying notes are an integral part of these financial statements. 49
GOLDMAN SACHS VARIABLE INSURANCE TRUST
Statements of Changes in Net Assets
For the Year Ended December 31, 2001
| | | | | | | | | | | |
| | | | | | |
| | | | Growth and | | CORE U.S. |
| | | | Income Fund | | Equity Fund |
| |
| | | From operations: |
|
| | | Net investment income | | $ | 190,293 | | | $ | 724,755 | |
| | | Net realized gain (loss) on investment, futures and foreign currency related transactions | | | (4,069,491 | ) | | | (21,543,051 | ) |
| | | Net change in unrealized gain (loss) on investments, futures and translation of assets and liabilities denominated in foreign currencies | | | 38,097 | | | | 1,697,455 | |
| | |
|
| | | Net increase (decrease) in net assets resulting from operations | | | (3,841,101 | ) | | | (19,120,841 | ) |
| | |
|
| | | Distributions to shareholders: |
|
| | | From net investment income | | | (192,388 | ) | | | (737,656 | ) |
| | | From net realized gain on investment, futures and foreign currency related transactions | | | — | | | | — | |
| | | From tax return of capital | | | — | | | | — | |
| | |
|
| | | Total distributions to shareholders | | | (192,388 | ) | | | (737,656 | ) |
| | |
|
| | | From share transactions: |
|
| | | Proceeds from sales of shares | | | 13,288,998 | | | | 55,342,887 | |
| | | Reinvestment of dividends and distributions | | | 192,388 | | | | 737,656 | |
| | | Cost of shares repurchased | | | (5,971,356 | ) | | | (11,620,753 | ) |
| | |
|
| | | Net increase (decrease) in net assets resulting from share transactions | | | 7,510,030 | | | | 44,459,790 | |
| | |
|
| | | TOTAL INCREASE (DECREASE) | | | 3,476,541 | | | | 24,601,293 | |
| | |
|
| | | Net assets: |
|
| | | Beginning of year | | | 37,116,216 | | | | 139,303,144 | |
| | |
|
| | | End of year | | $ | 40,592,757 | | | $ | 163,904,437 | |
| | |
|
| | | Accumulated undistributed (distributions in excess of) net investment income | | $ | 1,811 | | | $ | — | |
| | |
|
| | | Summary of share transactions: |
|
| | | Shares sold | | | 1,391,584 | | | | 4,820,468 | |
| | | Shares issued on reinvestment of dividends and distributions | | | 20,665 | | | | 67,487 | |
| | | Shares repurchased | | | (650,969 | ) | | | (1,062,345 | ) |
| | |
|
| | | TOTAL INCREASE (DECREASE) | | | 761,280 | | | | 3,825,610 | |
| | |
|
50 The accompanying notes are an integral part of these financial statements.
GOLDMAN SACHS VARIABLE INSURANCE TRUST
| | | | | | | | | | | | | | | | | |
| | CORE Small Cap | | Capital | | Mid Cap | | International |
| | Equity Fund | | Growth Fund | | Value Fund | | Equity Fund |
| |
| | | |
|
| | | $ | 117,087 | | | $ | 22,343 | | | $ | 2,119,489 | | | $ | 111,277 | |
| | | | (1,171,422 | ) | | | (1,116,432 | ) | | | 7,597,234 | | | | (5,906,031 | ) |
| | | |
3,044,583 | | | | (1,402,370 | ) | | | 9,147,130 | | | | (411,101 | ) |
| | |
|
| | | | 1,990,248 | | | | (2,496,459 | ) | | | 18,863,853 | | | | (6,205,855 | ) |
| | |
|
| | | |
|
| | | | (76,934 | ) | | | (26,444 | ) | | | (2,112,836 | ) | | | (175,062 | ) |
| | | | — | | | | (53,974 | ) | | | (10,913,278 | ) | | | (60,696 | ) |
| | | | (74,291 | ) | | | — | | | | — | | | | (82,175 | ) |
| | |
|
| | | | (151,225 | ) | | | (80,418 | ) | | | (13,026,114 | ) | | | (317,933 | ) |
| | |
|
| | | |
|
| | | | 18,234,164 | | | | 9,588,008 | | | | 161,692,684 | | | | 7,631,321 | |
| | | | 151,225 | | | | 80,418 | | | | 13,026,114 | | | | 317,933 | |
| | | | (6,421,071 | ) | | | (7,600,880 | ) | | | (38,692,901 | ) | | | (12,913,245 | ) |
| | |
|
| | | | 11,964,318 | | | | 2,067,546 | | | | 136,025,897 | | | | (4,963,991 | ) |
| | |
|
| | | | 13,803,341 | | | | (509,331 | ) | | | 141,863,636 | | | | (11,487,779 | ) |
| | |
|
| | | |
|
| | | | 40,561,236 | | | | 16,774,892 | | | | 101,656,870 | | | | 29,261,035 | |
| | |
|
| | | $ | 54,364,577 | | | $ | 16,265,561 | | | $ | 243,520,506 | | | $ | 17,773,256 | |
| | |
|
| | | $ | 5,302 | | | $ | — | | | $ | — | | | $ | (21,181 | ) |
| | |
|
| | | |
|
| | | | 1,763,231 | | | | 888,325 | | | | 14,502,257 | | | | 755,369 | |
| | | | 14,160 | | | | 7,787 | | | | 1,175,647 | | | | 35,965 | |
| | | | (663,729 | ) | | | (702,136 | ) | | | (3,633,018 | ) | | | (1,299,233 | ) |
| | |
|
| | | | 1,113,662 | | | | 193,976 | | | | 12,044,886 | | | | (507,899 | ) |
| | |
|
The accompanying notes are an integral part of these financial statements. 51
GOLDMAN SACHS VARIABLE INSURANCE TRUST
Financial Highlights
Selected Data for a Share Outstanding Throughout Each Period
| | | | | | | | | | | | | | | | | | | | | | | | | | | | | | | | | | | | | | | | | |
| | | | | | | | | | | | | | | | | | |
| | | | | | Income (loss) from | | | | |
| | | | | | investment operations | | Distributions to shareholders | | |
| | | | | |
| |
| | |
| | | | | | | | Net | | | | | | |
| | | | Net asset | | | | realized | | | | | | In excess | | From | | From | | | | |
| | | | value, | | Net | | and | | Total from | | From net | | of net | | tax | | net | | | | |
| | | | beginning | | investment | | unrealized | | investment | | investment | | investment | | return of | | realized | | Total | | |
| | | | of period | | income | | gain (loss) | | operations | | income | | income | | capital | | gain | | distributions | | |
| |
| | | |
|
| | | Growth and Income Fund | | | | | | | | | | | | | | | | | | | | | | | | | | | | | | | | | | | | | | |
| | | For the year ended December 31, 2002 | | $ | 9.33 | | | $ | 0.13 | (c) | | $ | (1.19 | ) | | $ | (1.06 | ) | | $ | (0.13 | ) | | $ | — | | | $ | — | | | $ | — | | | $ | (0.13 | ) | | |
| | | For the year ended December 31, 2001 | | | 10.34 | | | | 0.05 | (c) | | | (1.02 | ) | | | (0.97 | ) | | | (0.04 | ) | | | — | | | | — | | | | — | | | | (0.04 | ) | | |
| | | For the year ended December 31, 2000 | | | 10.89 | | | | 0.04 | (c) | | | (0.55 | ) | | | (0.51 | ) | | | (0.04 | ) | | | — | | | | — | | | | — | | | | (0.04 | ) | | |
| | | For the year ended December 31, 1999 | | | 10.45 | | | | 0.12 | | | | 0.44 | | | | 0.56 | | | | (0.12 | ) | | | — | | | | — | | | | — | | | | (0.12 | ) | | |
| | | For the period ended December 31, 1998 (commenced January 12) | | | 10.00 | | | | 0.09 | | | | 0.45 | | | | 0.54 | | | | (0.09 | ) | | | — | | | | — | | | | — | | | | (0.09 | ) | | |
| | |
|
| | | CORE U.S. Equity Fund | | | | | | | | | | | | | | | | | | | | | | | | | | | | | | | | | | | | | | |
| | | For the year ended December 31, 2002 | | $ | 10.94 | | | $ | 0.06 | (c) | | $ | (2.45 | ) | | $ | (2.39 | ) | | $ | (0.06 | ) | | $ | — | | | $ | — | | | $ | — | | | $ | (0.06 | ) | | |
| | | For the year ended December 31, 2001 | | | 12.48 | | | | 0.05 | (c) | | | (1.54 | ) | | | (1.49 | ) | | | (0.05 | ) | | | — | | | | — | | | | — | | | | (0.05 | ) | | |
| | | For the year ended December 31, 2000 | | | 13.98 | | | | 0.11 | (c) | | | (1.46 | ) | | | (1.35 | ) | | | (0.08 | ) | | | — | | | | — | | | | (0.07 | ) | | | (0.15 | ) | | |
| | | For the year ended December 31, 1999 | | | 11.42 | | | | 0.05 | | | | 2.72 | | | | 2.77 | | | | (0.05 | ) | | | — | | | | — | | | | (0.16 | ) | | | (0.21 | ) | | |
| | | For the period ended December 31, 1998 (commenced February 13) | | | 10.00 | | | | 0.05 | | | | 1.42 | | | | 1.47 | | | | (0.05 | ) | | | — | | | | — | | | | — | | | | (0.05 | ) | | |
| | |
|
| | | CORE Small Cap Equity Fund | | | | | | | | | | | | | | | | | | | | | | | | | | | | | | | | | | | | | | |
| | | For the year ended December 31, 2002 | | $ | 10.84 | | | $ | 0.03 | (c) | | $ | (1.65 | ) | | $ | (1.62 | ) | | $ | (0.03 | ) | | $ | — | | | $ | — | | | $ | — | | | $ | (0.03 | ) | | |
| | | For the year ended December 31, 2001 | | | 10.40 | | | | 0.03 | (c) | | | 0.44 | | | | 0.47 | | | | (0.02 | ) | | | — | | | | (0.01 | ) | | | — | | | | (0.03 | ) | | |
| | | For the year ended December 31, 2000 | | | 10.60 | | | | 0.06 | (c) | | | 0.09 | | | | 0.15 | | | | (0.04 | ) | | | — | | | | — | | | | (0.31 | ) | | | (0.35 | ) | | |
| | | For the year ended December 31, 1999 | | | 9.04 | | | | 0.02 | | | | 1.56 | | | | 1.58 | | | | (0.02 | ) | | | — | | | | — | | | | — | | | | (0.02 | ) | | |
| | | For the period ended December 31, 1998 (commenced February 13) | | | 10.00 | | | | 0.02 | | | | (0.95 | ) | | | (0.93 | ) | | | (0.02 | ) | | | (0.01 | ) | | | — | | | | — | | | | (0.03 | ) | | |
| | |
|
| | | Capital Growth Fund | | | | | | | | | | | | | | | | | | | | | | | | | | | | | | | | | | | | | | |
| | | For the year ended December 31, 2002 | | $ | 10.28 | | | $ | 0.01 | (c) | | $ | (2.50 | ) | | $ | (2.49 | ) | | $ | (0.02 | ) | | $ | — | | | $ | — | | | $ | — | | | $ | (0.02 | ) | | |
| | | For the year ended December 31, 2001 | | | 12.09 | | | | 0.02 | (c) | | | (1.78 | ) | | | (1.76 | ) | | | (0.02 | ) | | | — | | | | — | | | | (0.03 | ) | | | (0.05 | ) | | |
| | | For the year ended December 31, 2000 | | | 14.01 | | | | 0.01 | (c) | | | (1.16 | ) | | | (1.15 | ) | | | (0.01 | ) | | | — | | | | — | | | | (0.76 | ) | | | (0.77 | ) | | |
| | | For the year ended December 31, 1999 | | | 11.31 | | | | 0.01 | | | | 3.04 | | | | 3.05 | | | | (0.01 | ) | | | — | | | | — | | | | (0.34 | ) | | | (0.35 | ) | | |
| | | For the period ended December 31, 1998 (commenced April 30) | | | 10.00 | | | | 0.03 | | | | 1.31 | | | | 1.34 | | | | (0.03 | ) | | | — | | | | — | | | | — | | | | (0.03 | ) | | |
| | |
|
| | | Mid Cap Value Fund | | | | | | | | | | | | | | | | | | | | | | | | | | | | | | | | | | | | | | |
| | | For the year ended December 31, 2002 | | $ | 11.29 | | | $ | 0.14 | (c) | | $ | (0.67 | ) | | $ | (0.53 | ) | | $ | (0.12 | ) | | $ | — | | | $ | — | | | $ | (0.03 | ) | | $ | (0.15 | ) | | |
| | | For the year ended December 31, 2001 | | | 10.67 | | | | 0.14 | (c) | | | 1.14 | | | | 1.28 | | | | (0.11 | ) | | | — | | | | — | | | | (0.55 | ) | | | (0.66 | ) | | |
| | | For the year ended December 31, 2000 | | | 8.42 | | | | 0.15 | (c) | | | 2.45 | | | | 2.60 | | | | (0.08 | ) | | | — | | | | — | | | | (0.27 | ) | | | (0.35 | ) | | |
| | | For the year ended December 31, 1999 | | | 8.57 | | | | 0.07 | | | | (0.15 | ) | | | (0.08 | ) | | | (0.07 | ) | | | — | | | | — | | | | — | | | | (0.07 | ) | | |
| | | For the period ended December 31, 1998 (commenced May 1) | | | 10.00 | | | | 0.07 | | | | (1.43 | ) | | | (1.36 | ) | | | (0.07 | ) | | | — | | | | — | | | | — | | | | (0.07 | ) | | |
| | |
|
| | | International Equity Fund | | | | | | | | | | | | | | | | | | | | | | | | | | | | | | | | | | | | | | |
| | | For the year ended December 31, 2002 | | $ | 8.99 | | | $ | 0.03 | (c) | | $ | (1.68 | ) | | $ | (1.65 | ) | | $ | (0.09 | ) | | $ | — | | | $ | — | | | $ | — | | | $ | (0.09 | ) | | |
| | | For the year ended December 31, 2001 | | | 11.78 | | | | 0.05 | (c) | | | (2.68 | ) | | | (2.63 | ) | | | (0.09 | ) | | | — | | | | (0.04 | ) | | | (0.03 | ) | | | (0.16 | ) | | |
| | | For the year ended December 31, 2000 | | | 14.47 | | | | 0.05 | (c) | | | (1.99 | ) | | | (1.94 | ) | | | — | | | | — | | | | — | | | | (0.75 | ) | | | (0.75 | ) | | |
| | | For the year ended December 31, 1999 | | | 11.91 | | | | 0.07 | | | | 3.66 | | | | 3.73 | | | | (0.07 | ) | | | (0.13 | ) | | | — | | | | (0.97 | ) | | | (1.17 | ) | | |
| | | For the period ended December 31, 1998 (commenced January 12) | | | 10.00 | | | | 0.02 | | | | 1.98 | | | | 2.00 | | | | — | | | | — | | | | — | | | | (0.09 | ) | | | (0.09 | ) | | |
| | |
|
| | |
| (a) | | Assumes investment at the net asset value at the beginning of the period, reinvestment of all distributions and a complete redemption of the investment at the net asset value at the end of period. Total returns for periods less than one full year are not annualized. Returns do not reflect the deduction of taxes that a shareholder would pay on fund distributions or the redemption of fund shares. |
| |
| (b) | | Annualized. |
| |
| (c) | | Calculated based on the average shares outstanding methodology. |
52 The accompanying notes are an integral part of these financial statements.
GOLDMAN SACHS VARIABLE INSURANCE TRUST
| | | | | | | | | | | | | | | | | | | | | | | | | | | | | | | | | | | |
| | | | | | | | | | | | | | | | |
| | | | | | | | | | | | Ratios assuming no | | | | |
| | | | | | | | | | | | expense reductions | | | | |
| | | | | | | | | | | |
| | | | |
| | | | | | | | | | Ratio of | | | | Ratio of | | | | |
| | | | | | Net | | Ratio of | | net | | | | net | | | | |
| | Net asset | | | | assets | | net | | investment | | Ratio of | | investment | | | | |
| | value, | | | | at end | | expenses | | income | | expenses | | income (loss) | | Portfolio | | |
| | end of | | Total | | of period | | to average | | to average | | to average | | to average | | turnover | | |
| | period | | return(a) | | (in 000s) | | net assets | | net assets | | net assets | | net assets | | rate | | |
| |
| | | |
|
| | | $ | 8.14 | | | | (11.34 | )% | | $ | 36,911 | | | | 1.05 | % | | | 1.51 | % | | | 1.27 | % | | | 1.29 | % | | | 98 | % | | |
| | | | 9.33 | | | | (9.34 | ) | | | 40,593 | | | | 1.00 | | | | 0.49 | | | | 1.17 | | | | 0.32 | | | | 48 | | | |
| | | | 10.34 | | | | (4.69 | ) | | | 37,116 | | | | 0.99 | | | | 0.40 | | | | 1.22 | | | | 0.17 | | | | 68 | | | |
| | | | 10.89 | | | | 5.41 | | | | 25,989 | | | | 0.90 | | | | 1.44 | | | | 1.65 | | | | 0.69 | | | | 121 | | | |
| | | | 10.45 | | | | 5.47 | | | | 13,814 | | | | 0.90 | (b) | | | 1.85 | (b) | | | 2.69 | (b) | | | 0.06 | (b) | | | 88 | | | |
|
| | | $ | 8.49 | | | | (21.89 | )% | | $ | 143,439 | | | | 0.85 | % | | | 0.60 | % | | | 0.86 | % | | | 0.59 | % | | | 84 | % | | |
| | | | 10.94 | | | | (11.94 | ) | | | 163,904 | | | | 0.81 | | | | 0.48 | | | | 0.82 | | | | 0.47 | | | | 72 | | | |
| | | | 12.48 | | | | (9.62 | ) | | | 139,303 | | | | 0.85 | | | | 0.87 | | | | 0.87 | | | | 0.85 | | | | 32 | | | |
| | | | 13.98 | | | | 24.30 | | | | 52,058 | | | | 0.80 | | | | 0.70 | | | | 1.52 | | | | (0.02 | ) | | | 70 | | | |
| | | | 11.42 | | | | 14.73 | | | | 9,809 | | | | 0.80 | (b) | | | 0.70 | (b) | | | 2.83 | (b) | | | (1.33 | )(b) | | | 75 | | | |
|
| | | $ | 9.19 | | | | (14.97 | )% | | $ | 47,005 | | | | 1.04 | % | | | 0.25 | % | | | 1.29 | % | | | 0.00 | % | | | 128 | % | | |
| | | | 10.84 | | | | 4.53 | | | | 54,365 | | | | 1.00 | | | | 0.32 | | | | 1.22 | | | | 0.10 | | | | 105 | | | |
| | | | 10.40 | | | | 1.75 | | | | 40,561 | | | | 0.99 | | | | 0.59 | | | | 1.55 | | | | 0.03 | | | | 91 | | | |
| | | | 10.60 | | | | 17.54 | | | | 13,488 | | | | 0.90 | | | | 0.35 | | | | 4.22 | | | | (2.97 | ) | | | 101 | | | |
| | | | 9.04 | | | | (9.30 | ) | | | 4,841 | | | | 0.90 | (b) | | | 0.30 | (b) | | | 3.92 | (b) | | | (2.72 | )(b) | | | 74 | | | |
|
| | | $ | 7.77 | | | | (24.33 | )% | | $ | 18,052 | | | | 1.10 | % | | | 0.16 | % | | | 1.77 | % | | | (0.51 | )% | | | 24 | % | | |
| | | | 10.28 | | | | (14.46 | ) | | | 16,266 | | | | 1.00 | | | | 0.15 | | | | 1.69 | | | | (0.54 | ) | | | 39 | �� | | |
| | | | 12.09 | | | | (7.98 | ) | | | 16,775 | | | | 0.99 | | | | 0.13 | | | | 1.84 | | | | (0.72 | ) | | | 37 | | | |
| | | | 14.01 | | | | 27.13 | | | | 10,450 | | | | 0.90 | | | | 0.04 | | | | 3.13 | | | | (2.19 | ) | | | 34 | | | |
| | | | 11.31 | | | | 13.40 | | | | 4,463 | | | | 0.90 | (b) | | | 0.42 | (b) | | | 4.92 | (b) | | | (3.60 | )(b) | | | 20 | | | |
|
| | | $ | 10.61 | | | | (4.69 | )% | | $ | 357,537 | | | | 0.91 | % | | | 1.20 | % | | | 0.91 | % | | | 1.20 | % | | | 95 | % | | |
| | | | 11.29 | | | | 12.05 | | | | 243,521 | | | | 0.93 | | | | 1.27 | | | | 0.94 | | | | 1.26 | | | | 82 | | | |
| | | | 10.67 | | | | 31.07 | | | | 101,657 | | | | 1.04 | | | | 1.60 | | | | 1.22 | | | | 1.42 | | | | 101 | | | |
| | | | 8.42 | | | | (0.95 | ) | | | 21,882 | | | | 0.95 | | | | 1.30 | | | | 2.19 | | | | 0.06 | | | | 103 | | | |
| | | | 8.57 | | | | (13.56 | ) | | | 5,604 | | | | 0.95 | (b) | | | 1.74 | (b) | | | 4.79 | (b) | | | (2.10 | )(b) | | | 38 | | | |
|
| | | $ | 7.25 | | | | (18.34 | )% | | $ | 13,214 | | | | 1.46 | % | | | 0.32 | % | | | 2.96 | % | | | (1.18 | )% | | | 86 | % | | |
| | | | 8.99 | | | | (22.26 | ) | | | 17,773 | | | | 1.35 | | | | 0.47 | | | | 2.05 | | | | (0.23 | ) | | | 76 | | | |
| | | | 11.78 | | | | (13.19 | ) | | | 29,261 | | | | 1.34 | | | | 0.37 | | | | 1.99 | | | | (0.28 | ) | | | 70 | | | |
| | | | 14.47 | | | | 31.85 | | | | 20,159 | | | | 1.25 | | | | 0.41 | | | | 2.57 | | | | (0.91 | ) | | | 87 | | | |
| | | | 11.91 | | | | 20.07 | | | | 11,206 | | | | 1.25 | (b) | | | 0.23 | (b) | | | 2.97 | (b) | | | (1.49 | )(b) | | | 76 | | | |
|
The accompanying notes are an integral part of these financial statements. 53
GOLDMAN SACHS VARIABLE INSURANCE TRUST
Notes to Financial Statements
December 31, 2002
Goldman Sachs Variable Insurance Trust (the “Trust”) is a Delaware business trust registered under the Investment Company Act of 1940, as amended (“the Act”) as an open-end, management investment company. The Trust includes Goldman Sachs Growth and Income Fund (“Growth and Income”), Goldman Sachs CORE U.S. Equity Fund (“CORE U.S. Equity”), Goldman Sachs CORE Small Cap Equity Fund (“CORE Small Cap Equity”), Goldman Sachs Capital Growth Fund (“Capital Growth”), Goldman Sachs Mid Cap Value Fund (“Mid Cap Value”) and Goldman Sachs International Equity Fund (“International Equity”), collectively, “the Funds” or individually a “Fund”. Each Fund is diversified under the Act. On May 1, 2002, the Goldman Sachs CORE Large Cap Growth Fund, Goldman Sachs Global Income Fund and Goldman Sachs Internet Tollkeeper Fund, separate portfolios of the Trust, were terminated.
Shares of the Trust may be purchased and held by separate accounts of participating life insurance companies for the purpose of funding variable annuity contracts and variable life insurance policies. Shares of the Trust are not offered directly to the general public.
| 2. SIGNIFICANT ACCOUNTING POLICIES |
The following is a summary of significant accounting policies consistently followed by the Funds. The preparation of financial statements in conformity with accounting principles generally accepted in the United States requires management to make estimates and assumptions that may affect the reported amounts. Actual results could differ from those estimates.
A. Investment Valuation — Investments in securities traded on a U.S. or foreign securities exchange or the nasdaq system are valued daily at their last sale price on the principal exchange on which they are traded. If no sale occurs, securities are valued at the last bid price. Debt securities are valued at prices supplied by independent pricing services, broker/dealer-supplied valuations or matrix pricing systems. Unlisted equity and debt securities for which market quotations are available are valued at the last sale price on valuation date, or if no sale occurs, at the last bid price. Short-term debt obligations maturing in sixty days or less are valued at amortized cost, which approximates market value. Securities for which quotations are not readily available are valued at fair value using methods approved by the Board of Trustees. In addition, the impact of events that occur after the publication of market quotations used by a Fund to price its securities but before the close of regular trading on the New York Stock Exchange will not be reflected in the Fund’s next determined NAV unless the Trust, in its discretion, determines to make an adjustment in light of the nature and significance of the event, consistent with applicable regulatory guidance.
B. Securities Transactions and Investment Income — Securities transactions are recorded as of the trade date. Realized gains and losses on sales of portfolio securities are calculated using the identified-cost basis. Dividend income is recorded on the ex-dividend date, net of foreign withholding taxes including reclaims, where applicable. Certain dividends from foreign securities may be recorded subsequent to the ex-dividend date as soon as the Fund is informed of such dividends. Interest income is determined on the basis of interest accrued, premium amortized and discount accreted. In addition, it is the Funds’ policy to accrue for estimated capital gains taxes on foreign securities held by the Funds, which are subject to such taxes.
C. Federal Taxes — It is each Fund’s policy to comply with the requirements of the Internal Revenue Code applicable to regulated investment companies and to distribute each year substantially all of its investment company taxable income to its shareholders. Accordingly, no federal tax provisions are required. Income distributions and capital gains distributions, if any, are declared and paid annually.
The characterization of distributions to shareholders for financial reporting purposes is determined in accordance with income tax rules. Therefore, the source of a portfolio’s distributions may be shown in the accompanying financial statements as either from net investment income or net realized gain on investment transactions, or from paid-in-capital, depending on the type of book/tax differences that may exist.
54
GOLDMAN SACHS VARIABLE INSURANCE TRUST
| 2. SIGNIFICANT ACCOUNTING POLICIES — continued |
D. Deferred Organization Expenses — Organization-related costs are being amortized on a straight-line basis over a period of five years. At December 31, 2002, deferred organization costs have been fully amortized for the Growth and Income, CORE U.S. Equity, CORE Small Cap Equity and Capital Growth Funds.
E. Expenses — Expenses incurred by the Trust that do not specifically relate to an individual Fund of the Trust are generally allocated to the Funds on a straight-line or pro rata basis depending upon the nature of the expense.
F. Foreign Currency Translations — The books and records of each Fund are maintained in U.S. dollars. Amounts denominated in foreign currencies are translated into U.S. dollars on the following basis: (i) investment valuations, foreign currency and other assets and liabilities initially expressed in foreign currencies are converted each business day into U.S. dollars based upon current exchange rates; and (ii) purchases and sales of foreign investments, income and expenses are converted into U.S. dollars based upon currency exchange rates prevailing on the respective dates of such transactions.
Net realized and unrealized gain (loss) on foreign currency transactions will represent: (i) foreign exchange gains and losses from the sale and holdings of foreign currencies; (ii) gains and losses between trade date and settlement date on investment securities transactions and forward exchange contracts; and (iii) gains and losses from the difference between amounts of interest, dividends and foreign withholding taxes recorded and the amounts actually received. The effect of changes in foreign currency exchange rates on securities and derivative instruments are not segregated in the Statement of Operations from the effects of changes in market prices of those securities and derivative instruments, but are included with the net realized and unrealized gain or loss on securities and derivative instruments. Net unrealized foreign exchange gains and losses arising from changes in the value of other assets and liabilities as a result of changes in foreign exchange rates are included as increases and decreases in unrealized appreciation/depreciation on foreign currency related transactions.
G. Segregation Transactions — As set forth in the prospectus, certain Funds may enter into derivative transactions to seek to increase total return. Forward foreign currency exchange contracts, futures contracts, written options, when-issued securities and forward commitments are examples of such transactions. As a result of entering into those transactions, the Funds are required to segregate liquid assets on the accounting records equal to or greater than the market value of the corresponding transactions.
H. Repurchase Agreements — Repurchase agreements involve the purchase of securities subject to the seller’s agreement to repurchase them at a mutually agreed upon date and price. During the term of a repurchase agreement, the value of the underlying securities, including accrued interest, is required to equal or exceed the value of the repurchase agreement, including accrued interest. The underlying securities for all repurchase agreements are held in safekeeping at the Funds’ custodian or designated subcustodians.
55
GOLDMAN SACHS VARIABLE INSURANCE TRUST
Notes to Financial Statements (continued)
December 31, 2002
Pursuant to the Investment Management Agreement (the “Agreement”), Goldman Sachs Asset Management (“GSAM”), a business unit of the Investment Management Division of Goldman, Sachs & Co. (“Goldman Sachs”), serves as the investment adviser for Growth and Income, CORE U.S. Equity, CORE Small Cap Equity, Capital Growth and Mid Cap Value Funds. Goldman Sachs Asset Management International (“GSAMI”), an affiliate of Goldman Sachs, serves as the investment adviser for the International Equity Fund. Under the Agreement, the advisers, subject to the general supervision of the Trust’s Board of Trustees, manage the Funds’ portfolios (GSAM and GSAMI are each referred to herein as the “investment adviser”). As compensation for the services rendered pursuant to the Agreement, the assumption of the expenses related thereto and administering the Funds’ business affairs, including providing facilities, the investment adviser is entitled to a fee, computed daily and payable monthly at an annual rate of the average daily net assets as follows:
| | | | | | | |
| Fund | | Fee | | |
|
|
| Growth and Income | | | 0.75 | % | | |
|
| CORE U.S. Equity | | | 0.70 | | | |
|
| CORE Small Cap Equity | | | 0.75 | | | |
|
| Capital Growth | | | 0.75 | | | |
|
| Mid Cap Value | | | 0.80 | | | |
|
| International Equity | | | 1.00 | | | |
|
The investment advisers have voluntarily agreed to limit certain “Other Expenses” of the Funds (excluding management fees, taxes, interest, brokerage fees, litigation and indemnification, shareholder meeting, other extraordinary expenses and transfer agent fees after August 31, 2002) to the extent that such expenses exceed ..25%, .20%, .25%, .25%, .25% and .35% of the average daily net assets of Growth and Income, CORE U.S. Equity, CORE Small Cap Equity, Capital Growth, Mid Cap Value and International Equity, respectively.
Goldman Sachs also serves as the transfer agent of the Funds and has voluntarily waived a portion of its transfer agent fees. Goldman Sachs may discontinue or modify this waiver in the future at its discretion. Effective September 1, 2002, the fees charged for such transfer agency services are calculated daily and payable monthly at an annual rate of 0.04% of the average daily net assets of each Fund. Goldman Sachs serves as the distributor of each Fund’s shares at no cost to the Funds.
For the year ended December 31, 2002, the investment adviser reimbursed and waived certain expenses and the Funds have entered into expense offset arrangements with the custodian resulting in a reduction in expenses as follows (amounts in thousands):
| | | | | | | | | | | | | | | | | |
| | Investment Adviser | | Custody Fee | | Transfer Agent | | |
| Fund | | Reimbursement | | Reduction | | Fee Waiver | | Total |
|
|
| Growth and Income | | $ | 73 | | | $ | 1 | | | $ | 10 | | | $ | 84 | |
|
| CORE U.S. Equity | | | — | | | | 1 | | | | 9 | | | | 10 | |
|
| CORE Small Cap Equity | | | 119 | | | | 1 | | | | 10 | | | | 130 | |
|
| Capital Growth | | | 104 | | | | 1 | | | | 10 | | | | 115 | |
|
| Mid Cap Value | | | — | | | | 1 | | | | 10 | | | | 11 | |
|
| International Equity | | | 225 | | | | — | | | | 10 | | | | 235 | |
|
56
GOLDMAN SACHS VARIABLE INSURANCE TRUST
| 3. AGREEMENTS — continued |
At December 31, 2002, the amounts owed to affiliates were as follows (in thousands):
| | | | | | | | | | | | | |
| | Management | | Transfer Agent | | |
| Fund | | Fees | | Fees | | Total |
|
|
| Growth and Income | | $ | 24 | | | $ | 1 | | | $ | 25 | |
|
| CORE U.S. Equity | | | 87 | | | | 5 | | | | 92 | |
|
| CORE Small Cap Equity | | | 30 | | | | 2 | | | | 32 | |
|
| Capital Growth | | | 11 | | | | 1 | | | | 12 | |
|
| Mid Cap Value | | | 245 | | | | 12 | | | | 257 | |
|
| International Equity | | | 11 | | | | 1 | | | | 12 | |
|
| 4. PORTFOLIO SECURITY TRANSACTIONS |
Cost of purchases and proceeds of sales and maturities of long-term securities for the year ended December 31, 2002, were as follows:
| | | | | |
| | | | Sales and |
| Fund | | Purchases | | Maturities |
|
|
| Growth and Income | | $39,207,553 | | $36,455,421 |
|
| CORE U.S. Equity | | 148,525,627 | | 128,110,993 |
|
| CORE Small Cap Equity | | 69,487,209 | | 67,212,964 |
|
| Capital Growth | | 10,584,151 | | 4,016,324 |
|
| Mid Cap Value | | 438,706,914 | | 299,620,400 |
|
| International Equity | | 12,857,671 | | 13,136,886 |
|
Forward Foreign Currency Exchange Contracts — Growth and Income, Capital Growth, Mid Cap Value and International Equity may enter into forward foreign currency exchange contracts for the purchase or sale of a specific foreign currency at a fixed price on a future date as a hedge or cross-hedge against either specific transactions or portfolio positions. International Equity may also purchase and sell forward contracts to seek to increase total return. All commitments are “marked-to-market” daily at the applicable translation rates. The Funds record realized gains or losses at the time the forward contract is offset by entry into a closing transaction or extinguished by delivery of the currency. Risks may arise upon entering into these contracts from the potential inability of counterparties to meet the terms of their contracts and from unanticipated movements in the value of a foreign currency relative to the U.S. dollar.
57
GOLDMAN SACHS VARIABLE INSURANCE TRUST
Notes to Financial Statements (continued)
December 31, 2002
| 4. PORTFOLIO SECURITY TRANSACTIONS — continued |
At December 31, 2002, the International Equity Fund had outstanding forward foreign currency exchange contracts as follows:
| | | | | | | | | | | | | | | | | | | |
| | | | Value on | | | | | | |
| Open Foreign Currency | | Expiration | | Settlement | | Current | | Unrealized | | Unrealized |
| Purchase Contracts | | Date | | Date | | Value | | Gain | | Loss |
|
|
| Australian Dollar | | 01/16/2003 | | $ | 589,181 | | | $ | 594,571 | | | $ | 5,390 | | | $ | — | |
| | | 01/17/2003 | | | 585,334 | | | | 599,660 | | | | 14,326 | | | | — | |
| | | 01/17/2003 | | | 85,000 | | | | 84,881 | | | | — | | | | 119 | |
| Canadian Dollar | | 01/17/2003 | | | 335,000 | | | | 332,931 | | | | — | | | | 2,069 | |
| | | 01/17/2003 | | | 85,000 | | | | 85,344 | | | | 344 | | | | — | |
| Danish Krone | | 01/24/2003 | | | 96,861 | | | | 104,463 | | | | 7,602 | | | | — | |
| Euro Currency | | 01/17/2003 | | | 648,000 | | | | 684,484 | | | | 36,484 | | | | — | |
| | | 01/24/2003 | | | 568,940 | | | | 596,109 | | | | 27,169 | | | | — | |
| Hong Kong Dollar | | 03/11/2003 | | | 185,998 | | | | 186,016 | | | | 18 | | | | — | |
| Japanese Yen | | 01/17/2003 | | | 754,000 | | | | 776,119 | | | | 22,119 | | | | — | |
| | | 01/31/2003 | | | 440,656 | | | | 455,535 | | | | 14,879 | | | | — | |
| Norwegian Krone | | 01/17/2003 | | | 1,008,392 | | | | 1,078,861 | | | | 70,469 | | | | — | |
| | | 01/30/2003 | | | 94,502 | | | | 101,068 | | | | 6,566 | | | | — | |
| Pound Sterling | | 01/17/2003 | | | 422,969 | | | | 436,099 | | | | 13,130 | | | | — | |
| | | 01/23/2003 | | | 353,616 | | | | 362,233 | | | | 8,617 | | | | — | |
| Singapore Dollar | | 01/27/2003 | | | 65,682 | | | | 66,821 | | | | 1,139 | | | | — | |
| Swedish Krona | | 01/17/2003 | | | 606,985 | | | | 644,282 | | | | 37,297 | | | | — | |
| Swiss Franc | | 01/17/2003 | | | 504,000 | | | | 535,537 | | | | 31,537 | | | | — | |
|
TOTAL OPEN FOREIGN CURRENCY
PURCHASE CONTRACTS | | | | $ | 7,430,116 | | | $ | 7,725,014 | | | $ | 297,086 | | | $ | 2,188 | |
|
|
| | | | | | | | | | | | | | | | | | | |
| | | | Value on | | | | | | |
| Open Foreign Currency | | Expiration | | Settlement | | Current | | Unrealized | | Unrealized |
| Sales Contracts | | Date | | Date | | Value | | Gain | | Loss |
|
|
| Australian Dollar | | 01/17/2003 | | $ | 337,000 | | | $ | 342,392 | | | $ | — | | | $ | 5,392 | |
| Canadian Dollar | | 01/17/2003 | | | 544,579 | | | | 549,142 | | | | — | | | | 4,563 | |
| | | 01/17/2003 | | | 127,000 | | | | 126,283 | | | | 717 | | | | — | |
| Euro Currency | | 01/17/2003 | | | 899,514 | | | | 953,453 | | | | — | | | | 53,939 | |
| | | 01/24/2003 | | | 233,646 | | | | 242,086 | | | | — | | | | 8,440 | |
| Japanese Yen | | 01/17/2003 | | | 594,177 | | | | 618,999 | | | | — | | | | 24,822 | |
| | | 01/31/2003 | | | 168,066 | | | | 174,757 | | | | — | | | | 6,691 | |
| Mexican Peso | | 03/20/2003 | | | 310,667 | | | | 306,951 | | | | 3,716 | | | | — | |
| Norwegian Krone | | 01/17/2003 | | | 664,000 | | | | 717,009 | | | | — | | | | 53,009 | |
| Pound Sterling | | 01/17/2003 | | | 252,000 | | | | 259,903 | | | | — | | | | 7,903 | |
| | | 01/23/2003 | | | 488,554 | | | | 500,957 | | | | — | | | | 12,403 | |
| Singapore Dollar | | 01/27/2003 | | | 285,218 | | | | 292,039 | | | | — | | | | 6,821 | |
| Swedish Krona | | 01/17/2003 | | | 190,000 | | | | 197,799 | | | | — | | | | 7,799 | |
| | | 03/18/2003 | | | 98,485 | | | | 101,202 | | | | — | | | | 2,717 | |
| Swiss Franc | | 01/17/2003 | | | 1,212,597 | | | | 1,289,130 | | | | — | | | | 76,533 | |
|
TOTAL OPEN FOREIGN CURRENCY SALE
CONTRACTS | | | | $ | 6,405,503 | | | $ | 6,672,102 | | | $ | 4,433 | | | $ | 271,032 | |
|
58
GOLDMAN SACHS VARIABLE INSURANCE TRUST
| 4. PORTFOLIO SECURITY TRANSACTIONS — continued |
The contractual amounts of forward foreign currency exchange contracts do not necessarily represent the amounts potentially subject to risk. The measurement of the risks associated with these instruments is meaningful only when all related and offsetting transactions are considered. At December 31, 2002, the International Equity Fund had segregated sufficient cash and/or securities to cover any commitments under these contracts.
Futures Contracts — The Funds may enter into futures transactions to hedge against changes in interest rates, securities prices, currency exchange rates or to seek to increase total return. Futures contracts are valued at the last settlement price at the end of each day on the board of trade or exchange upon which they are traded. Upon entering into a futures contract, the Funds are required to deposit with a broker an amount of cash or securities equal to the minimum “initial margin” requirement of the associated futures exchange. Subsequent payments for futures contracts (“variation margin”) are paid or received by the Funds daily, dependent on the daily fluctuations in the value of the contracts, and are recorded for financial reporting purposes as unrealized gains or losses. When contracts are closed, the Funds realize a gain or loss which is reported in the Statements of Operations.
The use of futures contracts involve, to varying degrees, elements of market and counterparty risk which may exceed the amounts recognized in the Statements of Assets and Liabilities. Changes in the value of the futures contract may not directly correlate with changes in the value of the underlying securities. This risk may decrease the effectiveness of the Funds’ strategies and potentially result in a loss. At December 31, 2002, open futures contracts were as follows:
| | | | | | | | | | | | | | | | | |
| | | | Number of | | | | | | |
| | | | Contracts | | Settlement | | Market | | Unrealized |
| Fund | | Type | | Long | | Month | | Value | | Gain (Loss) |
|
|
| CORE U.S. Equity | | S & P 500 Index | | | 26 | | | March 2003 | | $ | 1,142,570 | | | $ | (11,483 | ) |
|
| CORE Small Cap Equity | | Russell 2000 Index | | | 1 | | | March 2003 | | $ | 191,600 | | | $ | (2,905 | ) |
|
| International Equity | | Eurex Deutschland 50 | | | 11 | | | March 2003 | | $ | 276,280 | | | $ | (10,325 | ) |
|
For the year ended December 31, 2002, Goldman Sachs earned brokerage commissions from portfolio transactions, including futures, executed on behalf of the Funds in the following amounts:
| | | | | |
| | Brokerage |
| Fund | | Commissions |
|
|
| Growth and Income | | $ | 3,518 | |
|
| CORE U.S. Equity | | | 1,490 | |
|
| CORE Small Cap Equity | | | 350 | |
|
| Capital Growth | | | 96 | |
|
| Mid Cap Value | | | 26,390 | |
|
| International Equity | | | 1,208 | |
|
59
GOLDMAN SACHS VARIABLE INSURANCE TRUST
Notes to Financial Statements (continued)
December 31, 2002
Pursuant to exemptive relief granted by the SEC and the terms and conditions contained therein, the Funds may lend their securities through their securities lending agent, Boston Global Advisers (BGA) — a wholly owned subsidiary of Goldman Sachs, to certain qualified borrowers including Goldman Sachs. The loans are collateralized at all times with cash and/or securities with a market value at least equal to the securities on loan. As with other extensions of credit, the Funds bear the risk of delay on recovery or loss of rights in the collateral should the borrower of the securities fail financially.
Both the Funds and BGA receive compensation relating to the lending of the Funds’ securities. The amount earned by the Funds for the year ended December 31, 2002 is reported parenthetically on the Statement of Operations. The table below details the following items as of December 31, 2002: 1) market value of the securities on loan by Funds, 2) the amount of cash collateral received for loan transactions, 3) BGA earnings as securities lending agent, 4) compensation earned by the Funds from lending its securities to Goldman Sachs and 5) the amount payable to Goldman Sachs upon return of securities loaned (collateral value). The Funds invest the cash collateral received in connection with securities lending transactions in the Enhanced Portfolio of Boston Global Investment Trust, a Delaware Business Trust. The Enhanced Portfolio is exempt from registration under Section 3(c)(7) of the Investment Company Act of 1940 and is managed by GSAM. The Enhanced Portfolio invests in high quality money market instruments. The Funds bear the risk of incurring a loss from the investment of cash collateral due to either credit or market factors.
| | | | | | | | | | | | | | | | | | | | | |
| | | | | | Earnings of BGA | | Earnings Received | | |
| | Market Value | | Cash Collateral | | Relating to | | From Lending to | | Amount Payable to |
| | of Securities | | Received for Loans | | Securities Loaned | | Goldman Sachs | | Goldman Sachs Upon |
| | on loan as of | | Outstanding as of | | for the Year Ended | | for the Year Ended | | Return of |
| Fund | | December 31, 2002 | | December 31, 2002 | | December 31, 2002 | | December 31, 2002 | | Securities Loaned |
|
|
| Growth and Income | | $ | 465,000 | | | $ | 480,000 | | | $ | 35 | | | $ | 149 | | | $ | 480,000 | |
|
CORE U.S. Equity(a) | | | — | | | | — | | | | 116 | | | | 330 | | | | — | |
|
| CORE Small Cap Equity | | | 977,640 | | | | 1,052,400 | | | | 2,111 | | | | 673 | | | | 214,600 | |
|
Capital Growth(a) | | | — | | | | — | | | | 5 | | | | — | | | | — | |
|
Mid Cap Value(a) | | | — | | | | — | | | | 1,525 | | | | 386 | | | | — | |
|
| International Equity | | | 146,202 | | | | 153,180 | | | | 1,796 | | | | 215 | | | | 75,250 | |
|
| | |
| (a) | | While there was lending activity during the year ended December 31, 2002, there were no loans outstanding as of December 31, 2002. |
60
GOLDMAN SACHS VARIABLE INSURANCE TRUST
| 6. JOINT REPURCHASE AGREEMENT ACCOUNT |
The Funds, together with other registered investment companies having management agreements with GSAM or their affiliates, transfer uninvested cash into joint accounts, the daily aggregate balance of which is invested in one or more repurchase agreements.
At December 31, 2002, the Growth and Income, CORE U.S. Equity, Capital Growth and Mid Cap Value Funds had undivided interests in the repurchase agreements in Joint Account II which equaled $1,200,000, $300,000, $700,000 and $12,100,000, respectively, in principal amount. At December 31, 2002, the following repurchase agreements held in this Joint Account were fully collateralized by Federal Agency obligations.
| | | | | | | | | | | | | | | |
| | Principal | | Interest | | Maturity | | Maturity |
| Repurchase Agreements | | Amount | | Rate | | Date | | Value |
|
|
| Banc of America Securities LLC | | $ | 460,600,000 | | | | 1.20 | % | | 01/02/2003 | | $ | 460,630,707 | |
|
| Banc of America Securities LLC | | | 750,000,000 | | | | 1.26 | | | 01/02/2003 | | | 750,052,500 | |
|
| Barclays Capital PLC | | | 500,000,000 | | | | 1.25 | | | 01/02/2003 | | | 500,034,722 | |
|
| Bear Stearns Companies, Inc. | | | 1,000,000,000 | | | | 1.25 | | | 01/02/2003 | | | 1,000,069,444 | |
|
| Deutsche Bank Securities, Inc. | | | 500,000,000 | | | | 1.25 | | | 01/02/2003 | | | 500,034,722 | |
|
| Greenwich Capital Markets | | | 1,500,000,000 | | | | 1.25 | | | 01/02/2003 | | | 1,500,104,167 | |
|
| J.P. Morgan Chase & Co., Inc. | | | 1,000,000,000 | | | | 1.24 | | | 01/02/2003 | | | 1,000,068,889 | |
|
| Lehman Brothers | | | 1,400,000,000 | | | | 1.27 | | | 01/02/2003 | | | 1,400,098,778 | |
|
| Morgan Stanley | | | 1,579,400,000 | | | | 1.25 | | | 01/02/2003 | | | 1,579,509,681 | |
|
| UBS Warburg LLC | | | 2,500,000,000 | | | | 1.25 | | | 01/02/2003 | | | 2,500,173,611 | |
|
TOTAL JOINT REPURCHASE
AGREEMENT ACCOUNT II | | $ | 11,190,000,000 | | | | | | | | | $ | 11,190,777,221 | |
|
| 7. LINE OF CREDIT FACILITY |
The Funds participate in a $350,000,000 committed, unsecured revolving line of credit facility. Under the most restrictive arrangement, each Fund must own securities having a market value in excess of 400% of the total bank borrowings. This facility is to be used solely for temporary or emergency purposes. The interest rate on borrowings is based on the federal funds rate. The committed facility also requires a fee to be paid by the Funds based on the amount of the commitment which has not been utilized. During the year ended December 31, 2002, the Funds did not have any borrowings under this facility.
61
GOLDMAN SACHS VARIABLE INSURANCE TRUST
Notes to Financial Statements (continued)
December 31, 2002
| 8. ADDITIONAL TAX INFORMATION |
The tax character of distributions paid during the fiscal year ended December 31, 2001 was as follows:
| | | | | | | | | | | | | | | | | | | | | | | | | | |
| | Growth and | | CORE U.S. | | CORE Small Cap | | Capital | | Mid Cap | | International |
| | Income Fund | | Equity Fund | | Equity Fund | | Growth Fund | | Value Fund | | Equity Fund |
| | |
| |
|
|
|
|
|
| Distributions paid from: | | | | | | | | | | | | | | | | | | | | | | | | |
| Ordinary income | | $ | 192,388 | | | $ | 737,655 | | | $ | 76,934 | | | $ | 26,502 | | | $ | 11,870,004 | | | $ | 190,595 | |
| Net long-term capital gains | | | — | | | | — | | | | — | | | | 53,916 | | | | 1,156,110 | | | | 45,163 | |
|
| | Total taxable distributions | | $ | 192,388 | | | $ | 737,655 | | | $ | 76,934 | | | $ | 80,418 | | | $ | 13,026,114 | | | $ | 235,758 | |
| Tax return of capital | | $ | — | | | $ | — | | | $ | 74,291 | | | $ | — | | | $ | — | | | $ | 82,175 | |
|
The tax character of distributions paid during the fiscal year ended December 31, 2002 was as follows:
| | | | | | | | | | | | | | | | | | | | | | | | | | |
| | Growth and | | CORE U.S. | | CORE Small Cap | | Capital | | Mid Cap | | International |
| | Income Fund | | Equity Fund | | Equity Fund | | Growth Fund | | Value Fund | | Equity Fund |
| | |
| |
|
|
|
|
|
| Distributions paid from: | | | | | | | | | | | | | | | | | | | | | | | | |
| Ordinary income | | $ | 594,255 | | | $ | 927,555 | | | $ | 141,224 | | | $ | 37,758 | | | $ | 4,357,670 | | | $ | 161,774 | |
| Net long-term capital gains | | | — | | | | — | | | | — | | | | — | | | | 679,018 | | | | — | |
|
| | Total taxable distributions | | $ | 594,255 | | | $ | 927,555 | | | $ | 141,224 | | | $ | 37,758 | | | $ | 5,036,688 | | | $ | 161,774 | |
| Tax return of capital | | $ | — | | | $ | — | | | $ | — | | | $ | — | | | $ | — | | | $ | — | |
|
As of December 31, 2002, the components of accumulated earnings (losses) on a tax basis were as follows:
| | | | | | | | | | | | | | | | | | | | | | | | | |
| | Growth and | | CORE U.S. | | CORE Small Cap | | Capital | | Mid Cap | | International |
| | Income Fund | | Equity Fund | | Equity Fund | | Growth Fund | | Value Fund | | Equity Fund |
| | |
| |
|
| Undistributed ordinary income — net | | $ | — | | | $ | — | | | $ | — | | | $ | — | | | $ | 63,089 | | | $ | 22,771 | |
|
| Total undistributed earnings | | $ | — | | | $ | — | | | $ | — | | | $ | — | | | $ | 63,089 | | | $ | 22,771 | |
| Capital loss carryforward | | | (9,096,947 | ) | | | (48,380,189 | ) | | | (2,941,900 | ) | | | (2,436,906 | ) | | | (2,846,355 | ) | | | (8,203,948 | ) |
| Timing differences (post October losses) | | | (238,972 | ) | | | (3,241,642 | ) | | | (692,321 | ) | | | (239,570 | ) | | | (8,416,037 | ) | | | (519,273 | ) |
| Unrealized gains (losses) — net | | | (1,411,324 | ) | | | (16,029,856 | ) | | | (3,292,432 | ) | | | (5,209,098 | ) | | | 661,397 | | | | (2,538,383 | ) |
|
| Total accumulated losses — net | | $ | (10,747,243 | ) | | $ | (67,651,687 | ) | | $ | (6,926,653 | ) | | $ | (7,885,574 | ) | | $ | (10,537,906 | ) | | $ | (11,238,833 | ) |
|
| Capital loss carryforward years of expiration | | | 2006–2010 | | | | 2008–2010 | | | | 2009–2010 | | | | 2009–2010 | | | | 2010 | | | | 2009–2010 | |
At December 31, 2002, the Fund’s aggregate security unrealized gains and losses based on cost for U.S. federal income tax purposes were as follows:
| | | | | | | | | | | | | | | | | | | | | | | | | |
| | Growth and | | CORE U.S. | | CORE Small Cap | | Capital | | Mid Cap | | International |
| | Income Fund | | Equity Fund | | Equity Fund | | Growth Fund | | Value Fund | | Equity Fund |
| | |
| |
|
| Tax Cost | | $ | 38,370,596 | | | $ | 158,691,464 | | | $ | 49,923,029 | | | $ | 23,561,590 | | | $ | 356,135,321 | | | $ | 15,357,031 | |
|
| Gross unrealized gain | | | 1,446,055 | | | | 5,168,836 | | | | 3,197,618 | | | | 323,864 | | | | 12,998,300 | | | | 270,856 | |
| Gross unrealized loss | | | (2,857,379 | ) | | | (21,198,692 | ) | | | (6,490,050 | ) | | | (5,532,962 | ) | | | (12,336,903 | ) | | | (2,805,146 | ) |
|
| Net unrealized security gain (loss) | | $ | (1,411,324 | ) | | $ | (16,029,856 | ) | | $ | (3,292,432 | ) | | $ | (5,209,098 | ) | | $ | 661,397 | | | $ | (2,534,290 | ) |
|
The difference between book-basis and tax-basis unrealized gains (losses) is attributable primarily to wash sales.
62
GOLDMAN SACHS VARIABLE INSURANCE TRUST
| 9. CERTAIN RECLASSIFICATIONS |
In order to present the capital accounts on a tax basis, certain reclassifications have been recorded to the Funds’ accounts. These reclassifications have no impact on the net asset value of the Funds and are designed to present the Funds’ capital accounts on a tax basis. Reclassifications result primarily from the difference in the tax treatment of foreign currency transactions and organization costs.
| | | | | | | | | | | | | |
| | | | | | Accumulated | |
| | | | Accumulated | | | Undistributed |
| | | | Net Realized | | Net Investment |
| Fund | | Paid-in-Capital | | | Gain (Loss) | | Income |
|
|
| Growth and Income | | | (10,740 | ) | | | (5 | ) | | | 10,745 | |
|
| CORE U.S. Equity | | | (5,360 | ) | | | — | | | | 5,360 | |
|
| CORE Small Cap Equity | | | (5,591 | ) | | | — | | | | 5,591 | |
|
| Capital Growth | | | (9,802 | ) | | | — | | | | 9,802 | |
|
| Mid Cap Value | | | (4,143 | ) | | | 272 | | | | 3,871 | |
|
| International Equity | | | (4,728 | ) | | | (123,650 | ) | | | 128,378 | |
|
63
GOLDMAN SACHS VARIABLE INSURANCE TRUST
Report of Ernst & Young LLP, Independent Auditors
To the Shareholders and Board of Trustees
Goldman Sachs Variable Insurance Trust
We have audited the accompanying statements of assets and liabilities, including the statements of investments, of Goldman Sachs Variable Insurance Trust (comprising, respectively, Goldman Sachs Growth and Income Fund, Goldman Sachs CORE U.S. Equity Fund, Goldman Sachs CORE Small Cap Equity Fund, Goldman Sachs Capital Growth Fund, Goldman Sachs Mid Cap Value Fund and Goldman Sachs International Equity Fund) (the “Trust”) as of December 31, 2002, the related statements of operations for the year then ended, the statements of changes in net assets for each of the two years in the period then ended and the financial highlights for each of the three years in the period then ended. These financial statements and financial highlights are the responsibility of the Trust’s management. Our responsibility is to express an opinion on these financial statements and financial highlights based on our audits. The financial highlights for each of the periods ended December 31, 1998 and 1999 were audited by other auditors whose report, dated February 10, 2000, expressed an unqualified opinion on those financial highlights.
We conducted our audits in accordance with auditing standards generally accepted in the United States. Those standards require that we plan and perform the audit to obtain reasonable assurance about whether the financial statements and financial highlights are free of material misstatement. An audit includes examining, on a test basis, evidence supporting the amounts and disclosures in the financial statements and financial highlights. Our procedures included confirmation of securities owned as of December 31, 2002 by correspondence with the custodian and others. An audit also includes assessing the accounting principles used and significant estimates made by management, as well as evaluating the overall financial statement presentation. We believe that our audits provide a reasonable basis for our opinion.
In our opinion, the financial statements and financial highlights, audited by us, referred to above present fairly, in all material respects, the financial position of each of the respective funds constituting Goldman Sachs Variable Insurance Trust at December 31, 2002, the results of their operations, the changes in their net assets, and the financial highlights for the periods indicated above, in conformity with accounting principles generally accepted in the United States.
New York, New York
February 5, 2003
64
GOLDMAN SACHS VARIABLE INSURANCE TRUST
Trustees and Officers (Unaudited)
Independent Trustees
| | | | | | | | | | | |
| | | | | | | | Number of | | |
| | Position(s) | | Term of | | | | Portfolios in | | |
| | Held with | | Office and | | | | Fund Complex | | Other |
| Name, | | Goldman Sachs Trust | | Length of | | Principal Occupation(s) | | Overseen by | | Directorships |
| Address and Age1 | | (the “Trust”)2 | | Time Served3 | | During Past 5 Years | | Trustee4 | | Held by Trustee5 |
|
|
Ashok N. Bakhru
Age: 60 | | Chairman & Trustee | | Since 1991 | | President, ABN Associates (July 1994-March 1996 and November 1998 to present); Executive Vice President—Finance and Administration and Chief Financial Officer, Coty Inc. (manufacturer of fragrances and cosmetics) (April 1996-November 1998); Director of Arkwright Mutual Insurance Company (1984-1999); Trustee of International House of Philadelphia (program center and residential community for students and professional trainees from the United States and foreign countries) (since 1989); Member of Cornell University Council (since 1992); Trustee of the Walnut Street Theater (since 1992); Trustee, Citizens Scholarship Foundation of America (since 1998); Director, Private Equity Investors-III and IV (since November 1998) and Equity-Limited Investors II (since April 2002); and Chairman, Lenders Service Inc. (provider of mortgage lending services) (since 2000).
Chairman of the Board and Trustee—Goldman Sachs Mutual Fund Complex (registered investment companies). | | 61 | | None |
|
Patrick T. Harker
Age: 44 | | Trustee | | Since 2000 | | Dean and Reliance Professor of Operations and Information Management, The Wharton School, University of Pennsylvania (since February 2000); Interim and Deputy Dean, The Wharton School, University of Pennsylvania (since July 1999); and Professor and Chairman of Department of Operations and Information Management, The Wharton School, University of Pennsylvania (July 1997-August 2000).
Trustee—Goldman Sachs Mutual Fund Complex (registered investment companies). | | 61 | | None |
|
Mary Patterson McPherson
Age: 67 | | Trustee | | Since 1997 | | Vice President, The Andrew W. Mellon Foundation (provider of grants for conservation, environmental and educational purposes) (since October 1997); Director, Smith College (since 1998); Director, Josiah Macy, Jr. Foundation (health educational programs) (since 1977); Director, Philadelphia Contributionship (insurance) (since 1985); Director Emeritus, Amherst College (1986-1998); Director, The Spencer Foundation (educational research) (since 1993); member of PNC Advisory Board (banking) (1993-1998); and Director, American School of Classical Studies in Athens (since 1997).
Trustee—Goldman Sachs Mutual Fund Complex (registered investment companies). | | 61 | | None |
|
Wilma J. Smelcer
Age: 53 | | Trustee | | Since 2001 | | Chairman, Bank of America, Illinois (banking) (1998-January 2001); and Governor, Board of Governors, Chicago Stock Exchange (national securities exchange) (since April 2001).
Trustee—Goldman Sachs Mutual Fund Complex (registered investment companies). | | 61 | | None |
|
Richard P. Strubel
Age: 63 | | Trustee | | Since 1987 | | President, COO and Director, Unext, Inc. (provider of educational services via the internet) (since 1999); Director, Cantilever Technologies, Inc. (a private software company) (since 1999); Trustee, The University of Chicago (since 1987); and Managing Director, Tandem Partners, Inc. (management services firm) (1990-1999).
Trustee—Goldman Sachs Mutual Fund Complex (registered investment companies). | | 61 | | Gildan Activewear Inc. (an activewear clothing marketing and manufacturing company); Unext, Inc. (provider of educational services via the internet); the Northern Mutual Fund Complex (57 Portfolios). |
|
65
GOLDMAN SACHS VARIABLE INSURANCE TRUST
Interested Trustees
| | | | | | | | | | | |
| | | | | | | | Number of | | |
| | Position(s) | | Term of | | | | Portfolios in | | |
| | Held with | | Office and | | | | Fund Complex | | Other |
| Name, | | Goldman Sachs Trust | | Length of | | Principal Occupation(s) | | Overseen by | | Directorships |
| Address and Age1 | | the Trust2 | | Time Served3 | | During Past 5 Years | | Trustee4 | | Held by Trustee5 |
|
|
*Gary D. Black
Age: 41 | | Trustee | | Since 2002 | | Managing Director, Goldman, Sachs & Co. (“Goldman Sachs”) (since June 2001); President—Goldman Sachs Mutual Fund Complex (registered investment companies) (2001-2002); Executive Vice President, AllianceBernstein (October 2000-June 2001); Managing Director, Global Institutional Investment Management, Sanford Bernstein (January 1999-October 2000) and Senior Research Analyst Sanford Bernstein (February 1992-December 1998).
Trustee—Goldman Sachs Mutual Fund Complex (registered investment companies). | | 61 | | None |
|
*James A. McNamara
Age: 40 | | Trustee
&
Vice President | | Since 2002 | | Managing Director, Goldman Sachs (since December 1998); Director of Institutional Fund Sales, Goldman Sachs Asset Management (“GSAM”) (April 1998-December 2000); Senior Vice President and Manager, Dreyfus Institutional Service Corporation (January 1993-April 1998). | | 61 | | None |
| |
| | | | | Since 2001 | | Vice President—Goldman Sachs Mutual Fund Complex (registered investment companies).
Trustee—Goldman Sachs Mutual Fund Complex (registered investment companies). | | | | |
|
*Alan A. Shuch
Age: 53 | | Trustee | | Since 1990 | | Advisory Director—GSAM (since May 1999); Consultant to GSAM (December 1994-May 1999); and Limited Partner, Goldman Sachs (December 1994-May 1999).
Trustee—Goldman Sachs Mutual Fund Complex (registered investment companies). | | 61 | | None |
|
*Kaysie P. Uniacke
Age: 41 | | President
&
Trustee | | Since 2002 | | President—Goldman Sachs Mutual Fund Complex (registered investment companies) (since 2002). Trustee—Goldman Sachs Mutual Fund Complex (registered investment companies) (since 2001). | | 61 | | None |
| |
| | | | | Since 2001 | | Managing Director, GSAM (since 1997). Assistant Secretary—Goldman Sachs Mutual Fund Complex (registered investment companies) (1997-2002). | | | | |
| |
|
| | |
*
| | These persons are considered to be “Interested Trustees” because they hold positions with Goldman Sachs and own securities issued by The Goldman Sachs Group, Inc. Each Interested Trustee holds comparable positions with certain other companies of which Goldman Sachs, GSAM or an affiliate thereof is the investment adviser, administrator and/or distributor. |
1
| | Each Trustee may be contacted by writing to the Trustee, c/o Goldman Sachs Asset Management, 32 Old Slip, New York, New York, 10005, Attn: Howard B. Surloff. |
2
| | The Trust is a successor to a Massachusetts business trust that was combined with the Trust on April 30, 1997. |
3
| | Each Trustee holds office for an indefinite term until the earliest of: (a) the election of his or her successor; (b) the date the Trustee resigns or is removed by the Board of Trustees or shareholders, in accordance with the Trust’s Declaration of Trust; (c) the date the Trustee attains the age of 72 years (in accordance with the current resolutions of the Board of Trustees which may be changed by the Trustees without shareholder vote); or (d) the termination of the Trust. |
4
| | The Goldman Sachs Mutual Fund Complex consists of the Trust and Goldman Sachs Variable Insurance Trust. As of December 31, 2002, the Trust consisted of 55 portfolios and Goldman Sachs Variable Insurance Trust consisted of 6 portfolios. |
5
| | This column includes only directorships of companies required to report to the SEC under the Securities Exchange Act of 1934 (i.e.,“public companies”) or other investment companies registered under the Investment Company Act of 1940. Additional information about the Trustees is available in the Fund’s Statement of Additional Information which can be obtained from Goldman Sachs free of charge by calling this toll-free number (in the United States): 1-800-292-4726. |
66
GOLDMAN SACHS VARIABLE INSURANCE TRUST
Officers of the Trust*
| | | | | | | |
| | |
| | Term of | | |
| | | | Office and | | |
| | Position(s) Held | | Length of | | Principal Occupation(s) |
| Name, Address And Age | | With the Trust | | Time Served1 | | During Past 5 Years |
|
|
Kaysie P. Uniacke
32 Old Slip
New York, NY 10005
Age: 41 | | President &
Trustee | | Since 2002 | | President—Goldman Sachs Mutual Fund Complex (registered investment companies) (since 2002). Trustee—Goldman Sachs Mutual Fund Complex (registered investment companies) (since 2001). |
| | | | | Since 2001 | | Managing Director, GSAM (since 1997). Assistant Secretary—Goldman Sachs Mutual Fund Complex (registered investment companies) (1997-2002) |
|
James A. Fitzpatrick
4900 Sears Tower
Chicago, IL 60606
Age: 42 | | Vice President | | Since 1997 | | Managing Director, Goldman Sachs (since October 1999); and Vice President of GSAM (April 1997-December 1999).
Vice President—Goldman Sachs Mutual Fund Complex (registered investment companies). |
|
James A. McNamara
4900 Sears Tower
Chicago, IL 60606
Age: 40 | | Trustee &
Vice President | | Since 2002 | | Managing Director, Goldman Sachs (since December 1998); Director of Institutional Fund Sales, GSAM (April 1998-December 2000); Senior Vice President and Manager, Dreyfus Institutional Service Corporation (January 1993-April 1998). |
| |
| | | | | Since 2001 | | Vice President—Goldman Sachs Mutual Fund Complex (registered investment companies). Trustee—Goldman Sachs Mutual Fund Complex (registered investment companies). |
|
John M. Perlowski
32 Old Slip
New York, NY 10005
Age: 38 | | Treasurer | | Since 1997 | | Vice President, Goldman Sachs (since July 1995).
Treasurer—Goldman Sachs Mutual Fund Complex (registered investment companies). |
|
Howard B. Surloff
32 Old Slip
New York, NY 10005
Age: 37 | | Secretary | | Since 2001 | | Managing Director, Goldman Sachs (since November 2002) Associate General Counsel, Goldman Sachs and General Counsel to the U.S. Funds Group (since December 1997).
Secretary—Goldman Sachs Mutual Fund Complex (registered investment companies) (since 2001) and Assistant Secretary prior thereto. |
|
| | |
1
| | Officers hold office at the pleasure of the Board of Trustees or until their successors are duly elected and qualified. Each officer holds comparable positions with certain other companies of which Goldman Sachs, GSAM or an affiliate thereof is the investment adviser, administrator and/or distributor. |
*
| | Represents a partial list of officers of the Trust. Additional information about all the officers is available in the Funds’ Statement of Additional Information which can be obtained from Goldman Sachs free of charge by calling this toll-free number (in the United States): 1-800-292-4726. |
67
GOLDMAN SACHS VARIABLE INSURANCE TRUST
Variable Insurance Trust-Tax Information (Unaudited)
For the year ended December 31, 2002, 100.00%, 100.00%, 100.00%, 100.00% and 92.75% of the dividends paid from net investment company taxable income by the Growth and Income, CORE U.S. Equity, CORE Small Cap Equity, Capital Growth and Mid Cap Value Funds respectively, qualify for the dividends received deduction available to corporations.
Pursuant to Section 852 of the Internal Revenue Code, Mid Cap Value designated $679,018 as capital gains dividends paid during its year ended December 31, 2002.
For the 2002 tax year International Equity has elected to pass through a credit for taxes paid to foreign jurisdictions. For the distributions paid during the year ended December 31, 2002, the total amount of income received by the Fund from sources within foreign countries and possessions of the United States was $0.0363 per share, all of which is attributable to qualified passive income. The total amount of taxes paid by the Fund to such countries was $0.0178 per share. The country-by country components of these totals are provided below, as required pursuant to Section 853 of the Internal Revenue Code.
| | | | | | | | | |
| | Foreign | | | Foreign | |
| | Source Income | | Taxes Withheld |
| Country | | Per Share | | Per Share |
|
|
| Australia | | $ | 0.0006 | | | $ | 0.0002 | |
|
| Finland | | | 0.0006 | | | | 0.0004 | |
|
| France | | | 0.0035 | | | | — | |
|
| Germany | | | 0.0003 | | | | 0.0002 | |
|
| Hong Kong | | | 0.0009 | | | | — | |
|
| Ireland | | | 0.0020 | | | | — | |
|
| Italy | | | 0.0043 | | | | 0.0029 | |
|
| Japan | | | 0.0049 | | | | 0.0033 | |
|
| Mexico | | | 0.0004 | | | | — | |
|
| Netherlands | | | 0.0040 | | | | 0.0023 | |
|
| Singapore | | | 0.0020 | | | | 0.0017 | |
|
| Spain | | | 0.0005 | | | | 0.0003 | |
|
| Sweden | | | 0.0004 | | | | 0.0003 | |
|
| Switzerland | | | 0.0019 | | | | 0.0013 | |
|
| United Kingdom | | | 0.0100 | | | | 0.0049 | |
|
68
GOLDMAN SACHS VARIABLE INSURANCE TRUST
Voting Results of Special Meeting of Shareholders (Unaudited)
A Special Meeting of Shareholders of the Goldman Sachs Variable Insurance Trust (the “Trust”) was held on December 16, 2002 (the “Meeting”) for the purpose of electing nine trustees of the Trust.
At the Meeting, Ashok N. Bakhru, Gary D. Black, Patrick T. Harker, James A. McNamara, Mary Patterson McPherson, Alan A. Shuch, Wilma J. Smelcer, Richard P. Strubel and Kaysie P. Uniacke were elected to the Trust’s Board of Trustees. In electing trustees, the Trust’s shareholders voted as follows:
| | | | | | | | | | | | | | | | | |
| | | | | | | | Broker |
| Trustee | | For | | Against | | Abstain | | Non-Votes |
|
|
| Ashok N. Bakhru | | | 57,769,367 | | | | 0 | | | | 3,342,752 | | | | 0 | |
|
| Gary D. Black | | | 57,829,690 | | | | 0 | | | | 3,282,429 | | | | 0 | |
|
| Patrick T. Harker | | | 57,939,661 | | | | 0 | | | | 3,172,458 | | | | 0 | |
|
| James A. McNamara | | | 57,825,213 | | | | 0 | | | | 3,286,906 | | | | 0 | |
|
| Mary Patterson McPherson | | | 57,811,048 | | | | 0 | | | | 3,301,071 | | | | 0 | |
|
| Alan A. Shuch | | | 57,787,004 | | | | 0 | | | | 3,325,115 | | | | 0 | |
|
| Wilma J. Smelcer | | | 57,889,357 | | | | 0 | | | | 3,222,762 | | | | 0 | |
|
| Richard P. Strubel | | | 57,843,785 | | | | 0 | | | | 3,268,334 | | | | 0 | |
|
| Kaysie P. Uniacke | | | 57,755,978 | | | | 0 | | | | 3,356,141 | | | | 0 | |
|
69
| | | |
| TRUSTEES | | OFFICERS |
Ashok N. Bakhru, Chairman | | Kaysie P. Uniacke, President |
| Gary D. Black | | James A. Fitzpatrick, Vice President |
| Patrick T. Harker | | James A. McNamara, Vice President |
| James A. McNamara | | John M. Perlowski, Treasurer |
| Mary Patterson McPherson | | Howard B. Surloff, Secretary |
| Alan A. Shuch | | |
| Wilma J. Smelcer | | |
| Richard P. Strubel | | |
| Kaysie P. Uniacke | | |
| |
GOLDMAN, SACHS & CO.
Distributor and Transfer Agent | | |
| |
GOLDMAN SACHS ASSET MANAGEMENT
Investment Adviser |
| |
GOLDMAN SACHS ASSET MANAGEMENT INTERNATIONAL
133 Peterborough Court
London, England EC4A 2BB |
| |
| | | Toll Free (in U.S.): 800-292-4726 |
| |
This report is prepared for the general information of contract owners and is not an offer of shares of the Goldman
Sachs Variable Insurance Trust: Growth and Income, CORE U.S. Equity, CORE Small
Cap Equity, Capital Growth, Mid Cap Value and International Equity Funds. |
| |
This material is not authorized for distribution to prospective investors unless preceded or accompanied by a
current Prospectus which contains facts concerning the Fund’s objectives, policies, management, expenses and
other information. |
| |
| © Copyright 2002 Goldman, Sachs & Co. All rights reserved. Date of first use: February 14, 2003 |
![[GOLDMAN SACHS LOGO]](https://capedge.com/proxy/N-14/0000950123-03-009958/y89484gldschlg.gif)