Exhibit 99.1
JP Morgan
Gaming and Lodging Conference
May 4, 2005
Disclaimer
Certain matters discussed in this presentation may constitute forward-looking statements within the meaning of the federal securities law. Such statements are based on management’s beliefs, assumptions and expectations, which in turn are based on information currently available to management. Actual performance and results could differ from those expressed in or contemplated by the forward-looking statements due to a number of risks, uncertainties and other factors, many of which are beyond Choice’s ability to predict or control. For further information on factors that could impact Choice and the statements contained herein, we refer you to the filings made by Choice with the Securities and Exchange Commission, including our report on Form 10-K for the period ended December 31, 2004.
Additional corporate information may be found on the Choice Hotels’ Internet site, which may be accessed at www.choicehotels.com
Company Overview
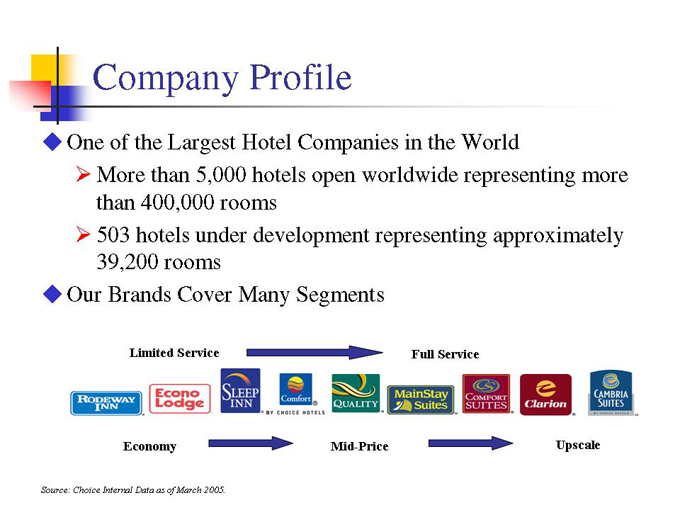
Company Profile
One of the Largest Hotel Companies in the World
More than 5,000 hotels open worldwide representing more than 400,000 rooms 503 hotels under development representing approximately 39,200 rooms
Our Brands Cover Many Segments
Limited Service
Full Service
Economy
Mid-Price
Upscale
Source: Choice Internal Data as of March 2005.
Company Profile (cont.)
Our Focus Is Solely on Hotel Franchising
Highest returning model in the industry (vs. management or ownership) High margin, high cash flow with low capital requirements Scaleable and predictable Provides profitable growth opportunities Highly skilled in this area
Investment Thesis
Strong, Stable and Growing System
5.4% increase in domestic hotels in 2004
552 new hotel contracts signed in 2004 (up from 470) 20 year contracts, barriers to exit
Strong and Growing Annual Earnings and EBITDA
EBITDA—$135 million (8% increase) Adjusted Diluted EPS—$2.16 (16% increase)
Source: Choice Internal Data as of December 2004.
Investment Thesis (cont.)
Management Focused on Creating Value
Share repurchases – 32.8 million repurchased at $20.65 per share as of March 31, 2005; represents more than $676 million since inception of program Dividends – Current quarterly cash dividend of 0.225/share; subject to board approval and business performance, expect to pay future dividends at comparable or increased rate in the future
Equity Performance
5 year annualized share price appreciation in excess of 27%
Source: Choice Internal Data as of December 2004 & March 2005.
Vision and Mission
Vision and Mission
Our Vision: To generate the highest return on investment of any hotel franchise
Our Mission: Deliver a franchise success system of strong brands, exceptional services, vast consumer reach, and size, scale and distribution that delivers guests, satisfies guests, and reduces costs for our hotel owners
Our Passion: Customer Profitability
Management Philosophy
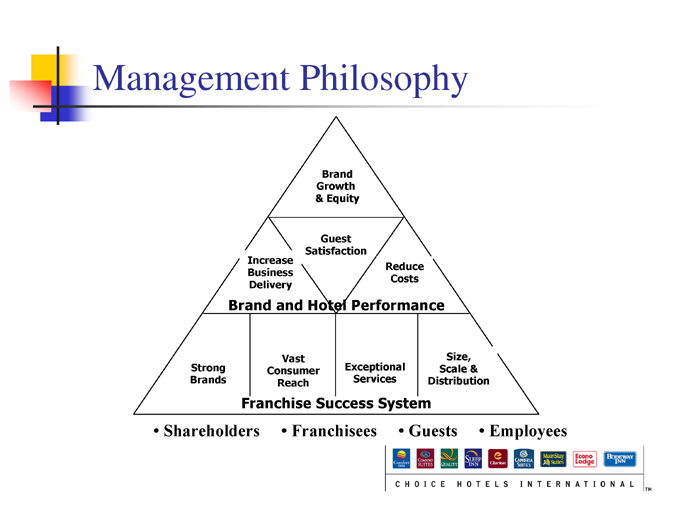
Brand Growth & Equity
Guest Satisfaction
Increase Business Delivery
Reduce Costs
Brand and Hotel Performance
Strong Brands
Vast Consumer Reach
Exceptional Services
Size, Scale & Distribution
Franchise Success System
Shareholders
Franchisees
Guests
Employees
2005 Focus
Aggressively Sell Our Brands
Optimize Development Organization Continue to Align with Brand Strategies Diversify and Develop New Customers
Build Brand Equity
Stronger Consumer Focus
Strengthen Brand Consistency, Quality, and Guest Satisfaction
Bolster Information Systems
Create Opportunities in New Segments
Introduce Cambria Suites
Build Capabilities in Extended Stay Build Capabilities in Upscale Segments Grow Internationally
Improve Brand and Hotel Performance
Stronger Property-Level Support Marketing and Reservations Programs Bolster Information Systems
Strategy
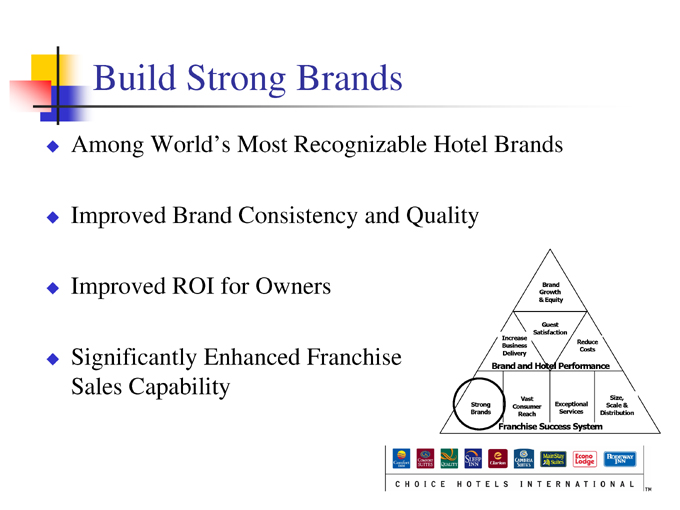
Build Strong Brands
Among World’s Most Recognizable Hotel Brands
Improved Brand Consistency and Quality
Improved ROI for Owners
Significantly Enhanced Franchise Sales Capability
Brand Growth & Equity
Guest Satisfaction
Increase Business Delivery
Reduce Costs
Brand and Hotel Performance
Strong Brands
Vast Consumer Reach
Exceptional Services
Size, Scale & Distribution
Franchise Success System
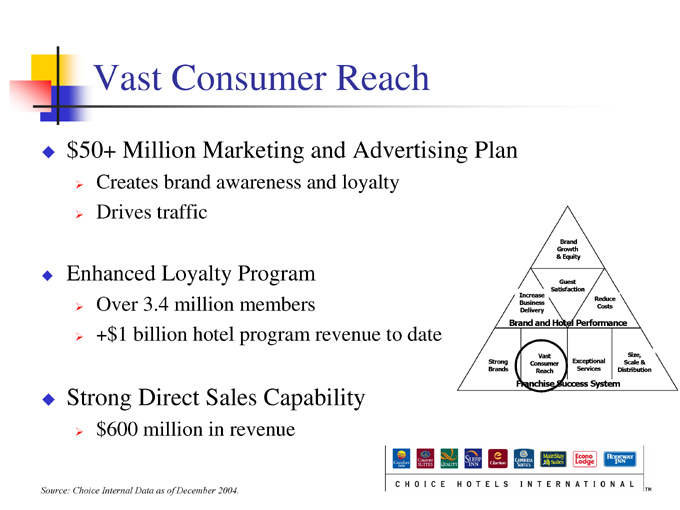
Vast Consumer Reach
$50+ Million Marketing and Advertising Plan
Creates brand awareness and loyalty Drives traffic
Enhanced Loyalty Program
Over 3.4 million members
+$ 1 billion hotel program revenue to date
Strong Direct Sales Capability $600 million in revenue
Brand Growth & Equity
Guest Satisfaction
Increase Business Delivery
Reduce Costs
Brand and Hotel Performance
Strong Brands
Vast Consumer Reach
Exceptional Services
Size, Scale & Distribution
Franchise Success System
Source: Choice Internal Data as of December 2004.
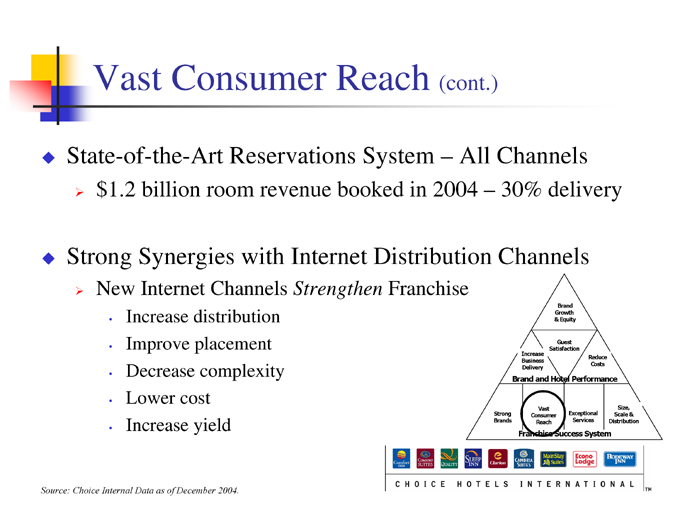
Vast Consumer Reach (cont.)
State-of-the-Art Reservations System – All Channels $1.2 billion room revenue booked in 2004 – 30% delivery
Strong Synergies with Internet Distribution Channels
New Internet Channels Strengthen Franchise
Increase distribution Improve placement Decrease complexity Lower cost Increase yield
Brand Growth & Equity
Guest Satisfaction
Increase Business Delivery
Reduce Costs
Brand and Hotel Performance
Strong Brands
Vast Consumer Reach
Exceptional Services
Size, Scale & Distribution
Franchise Success System
Source: Choice Internal Data as of December 2004.
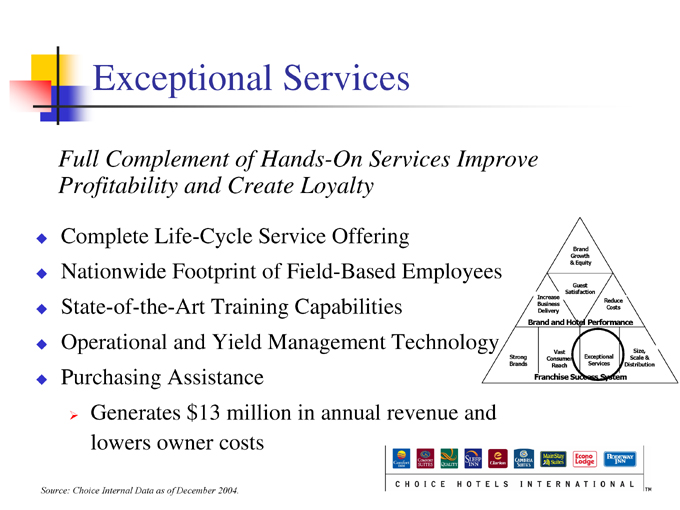
Exceptional Services
Full Complement of Hands-On Services Improve Profitability and Create Loyalty
Complete Life-Cycle Service Offering
Nationwide Footprint of Field-Based Employees State-of-the-Art Training Capabilities Operational and Yield Management Technology
Purchasing Assistance
Generates $13 million in annual revenue and lowers owner costs
Brand Growth & Equity
Guest Satisfaction
Increase Business Delivery
Reduce Costs
Brand and Hotel Performance
Strong Brands
Vast Consumer Reach
Exceptional Services
Size, Scale & Distribution
Franchise Success System
Source: Choice Internal Data as of December 2004.
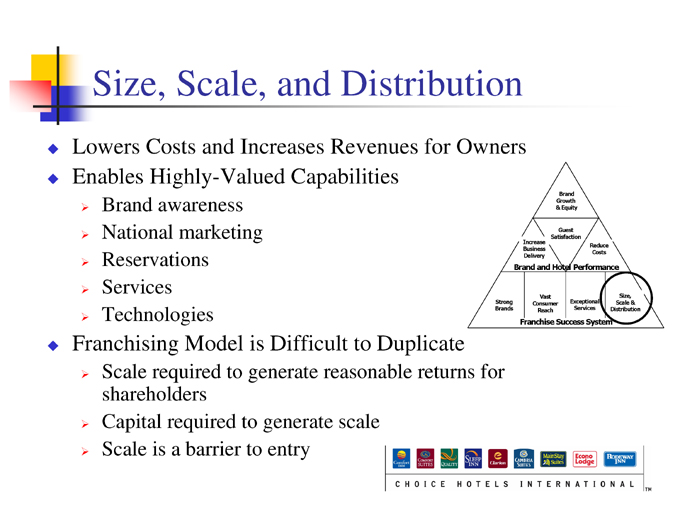
Size, Scale, and Distribution
Lowers Costs and Increases Revenues for Owners Enables Highly-Valued Capabilities
Brand awareness National marketing Reservations Services Technologies
Franchising Model is Difficult to Duplicate
Scale required to generate reasonable returns for shareholders Capital required to generate scale Scale is a barrier to entry
Brand Growth & Equity
Guest Satisfaction
Increase Business Delivery
Reduce Costs
Brand and Hotel Performance
Strong Brands
Vast Consumer Reach
Exceptional Services
Size, Scale & Distribution
Franchise Success System
Performance
Business Focus
Profitably Grow
Improve brand performance –ROI to owners (business delivery, reduced operating and development costs, products, marketing, services) Introduce new concepts (product design/innovation) Increase distribution (franchise development)
Maximize Financial Returns and Create Value for Shareholders
Capital allocation – focus on returns
Capital structure – prudent leverage to maximize returns
• S&P recently upgraded credit rating to BBB from BBB-Share repurchases Dividends
Profitably Grow
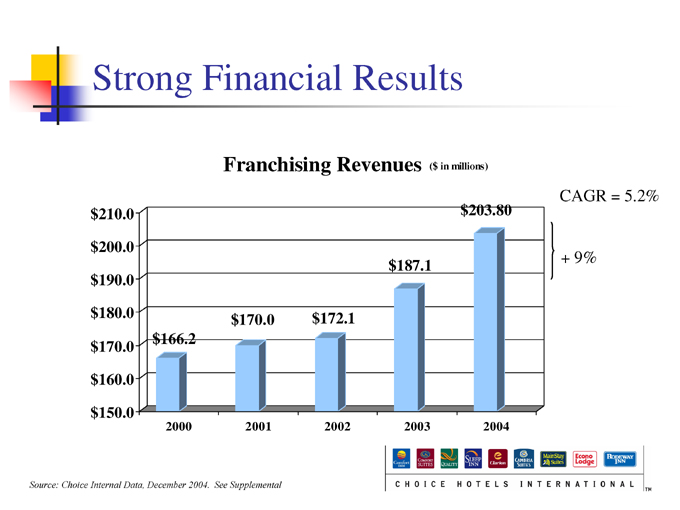
Strong Financial Results
Franchising Revenues ($ in millions)
CAGR = 5.2% $210.0 $200.0 $190.0 $180.0
$170.0 $160.0 $150.0
2000 2001 2002 2003 2004 $166.2 $170.0 $172.1 $187.1 $203.80
+ 9%
Source: Choice Internal Data, December 2004. See Supplemental
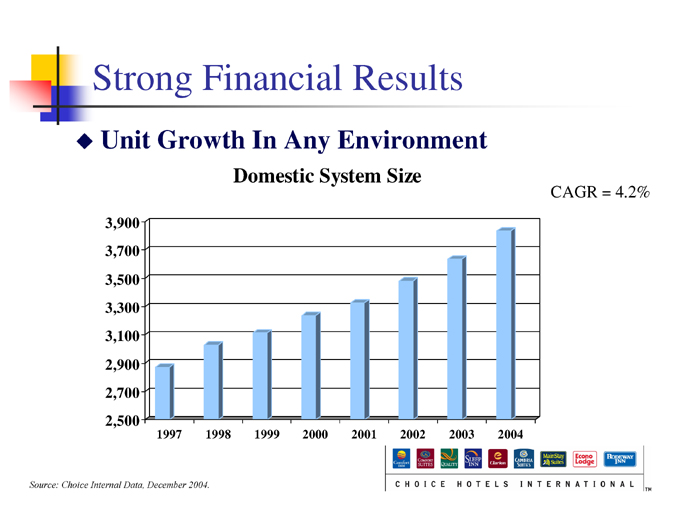
Strong Financial Results
Unit Growth In Any Environment
Domestic System Size
CAGR = 4.2%
3,900 3,700 3,500 3,300 3,100 2,900 2,700 2,500
1997 1998 1999 2000 2001 2002 2003 2004
Source: Choice Internal Data, December 2004.
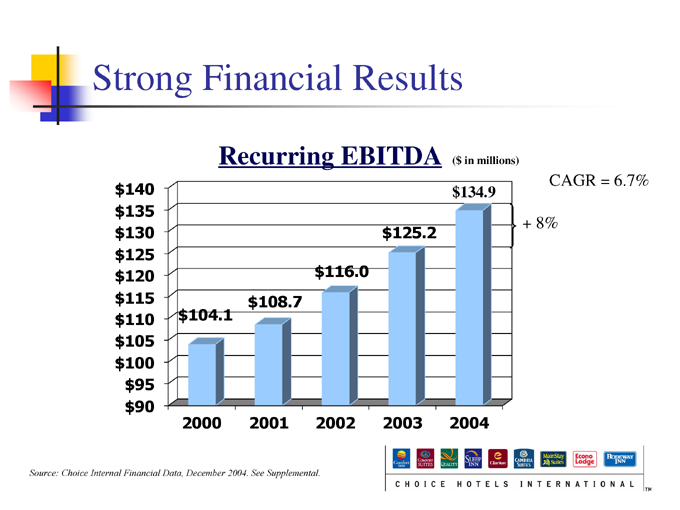
Strong Financial Results
Recurring EBITDA ($ in millions)
$140 $135 $130 $125 $120 $115 $110 $105 $100 $95 $90
2000 2001 2002 2003 2004 $104.1 $108.7 $116.0 $125.2 $134.9
CAGR = 6.7%
+ 8%
Source: Choice Internal Financial Data, December 2004. See Supplemental.
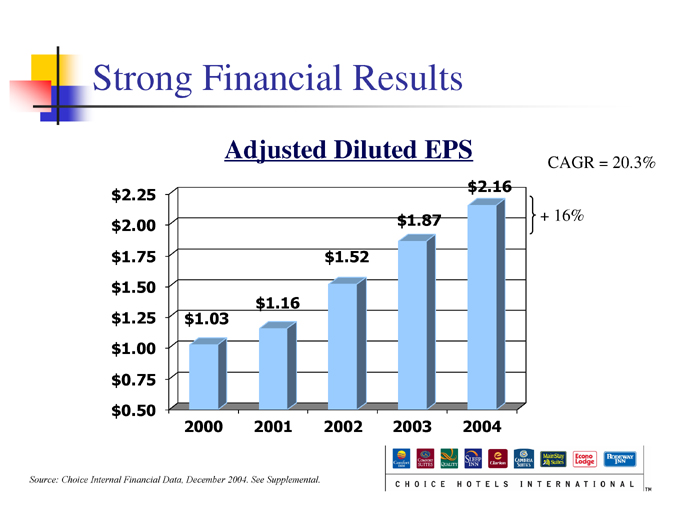
Strong Financial Results
Adjusted Diluted EPS
$2.25 $2.00 $1.75 $1.50 $1.25 $1.00 $0.75 $0.50
2000 2001 2002 2003 2004 $1.03 $1.16 $1.52 $1.87 $2.16
CAGR = 20.3%
+ 16%
Source: Choice Internal Financial Data, December 2004. See Supplemental.
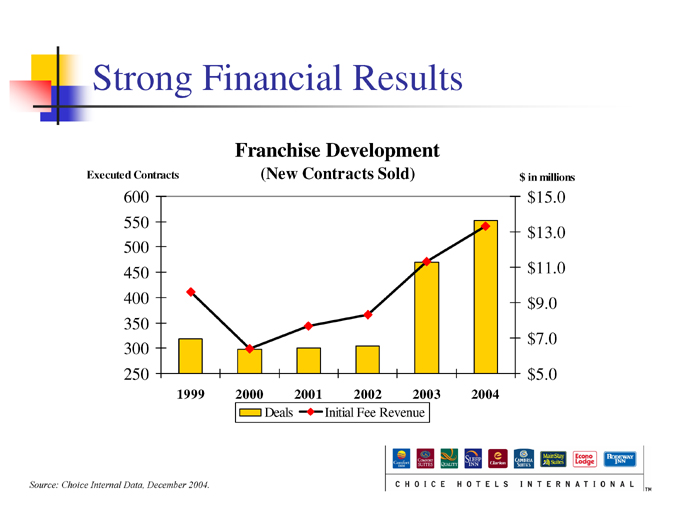
Strong Financial Results
Franchise Development
(New Contracts Sold)
Executed Contracts
600 550 500 450 400 350 300 250
1999 2000 2001 2002 2003 2004 $ in millions $15.0 $13.0 $11.0 $9.0 $7.0 $5.0
Deals Initial Fee Revenue
Source: Choice Internal Data, December 2004.
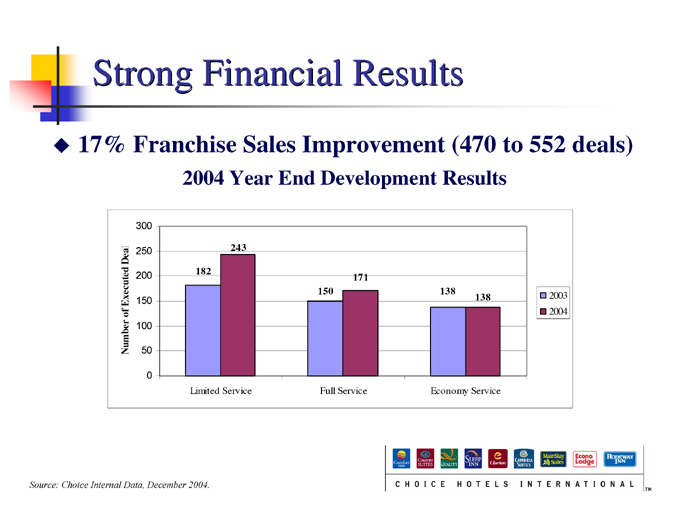
Strong Financial Results
17% Franchise Sales Improvement (470 to 552 deals)
2004 Year End Development Results
Number of Executed Deal
0 50 100 150 200 250 300
Limited Service Full Service Economy Service
182
243
150
171
138
138
2003 2004
Source: Choice Internal Data, December 2004.
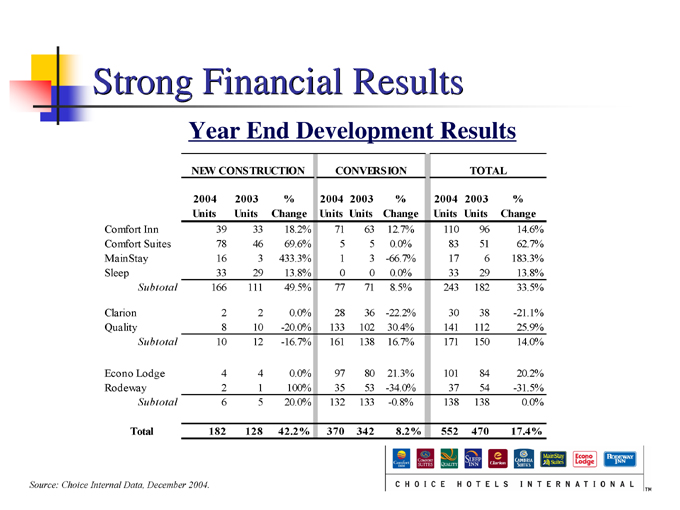
Strong Financial Results
Year End Development Results
NEW CONSTRUCTION CONVERSION TOTAL
2004 2003 % 2004 2003 % 2004 2003 %
Units Units Change Units Units Change Units Units Change
Comfort Inn 39 33 18.2% 71 63 12.7% 110 96 14.6%
Comfort Suites 78 46 69.6% 5 5 0.0% 83 51 62.7%
MainStay 16 3 433.3% 1 3 - -66.7% 17 6 183.3%
Sleep 33 29 13.8% 0 0 0.0% 33 29 13.8%
Subtotal 166 111 49.5% 77 71 8.5% 243 182 33.5%
Clarion 2 2 0.0% 28 36 -22.2% 30 38 -21.1%
Quality 8 10 -20.0% 133 102 30.4% 141 112 25.9%
Subtotal 10 12 -16.7% 161 138 16.7% 171 150 14.0%
Econo Lodge 4 4 0.0% 97 80 21.3% 101 84 20.2%
Rodeway 2 1 100% 35 53 -34.0% 37 54 -31.5%
Subtotal 6 5 20.0% 132 133 -0.8% 138 138 0.0%
Total 182 128 42.2% 370 342 8.2% 552 470 17.4%
Source: Choice Internal Data, December 2004.
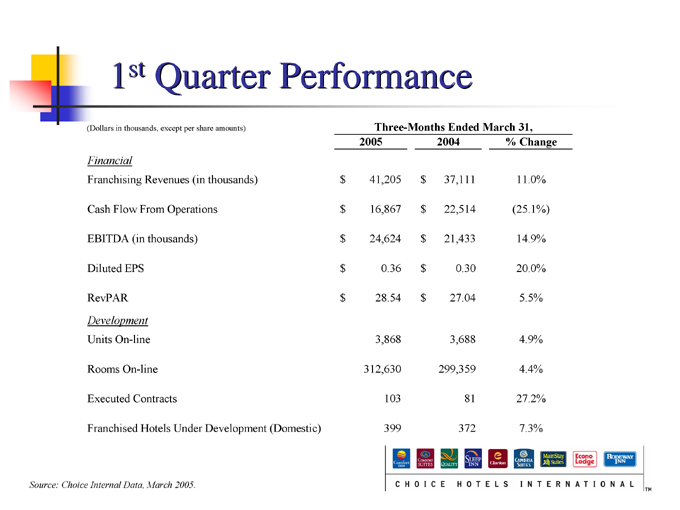
1st Quarter Performance
(Dollars in thousands, except per share amounts) Three-Months Ended March 31,
2005 2004 % Change
Financial
Franchising Revenues (in thousands) $41,205 $37,111 11.0%
Cash Flow From Operations $16,867 $22,514 (25.1%)
EBITDA (in thousands) $24,624 $21,433 14.9%
Diluted EPS $0.36 $0.30 20.0%
RevPAR $28.54 $27.04 5.5%
Development
Units On-line 3,868 3,688 4.9%
Rooms On-line 312,630 299,359 4.4%
Executed Contracts 103 81 27.2%
Franchised Hotels Under Development (Domestic) 399 372 7.3%
Source: Choice Internal Data, March 2005.
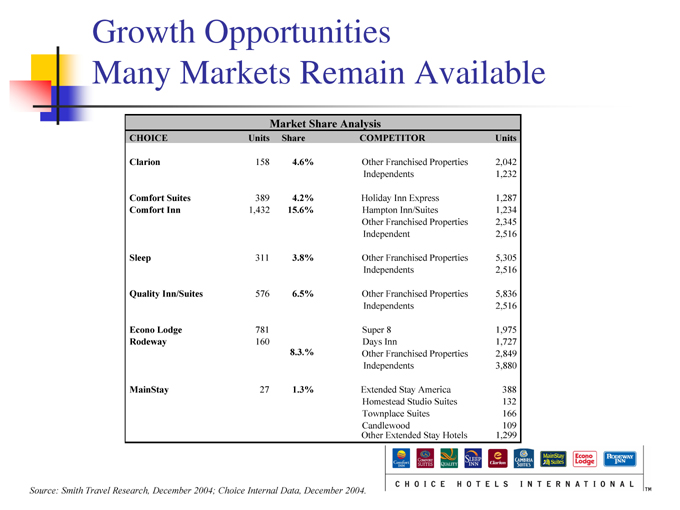
Growth Opportunities
Many Markets Remain Available
Market Share Analysis
CHOICE Units Share COMPETITOR Units
Clarion 158 4.6% Other Franchised Properties 2,042
Independents 1,232
Comfort Suites 389 4.2% Holiday Inn Express 1,287
Comfort Inn 1,432 15.6% Hampton Inn/Suites 1,234
Other Franchised Properties 2,345
Independent 2,516
Sleep 311 3.8% Other Franchised Properties 5,305
Independents 2,516
Quality Inn/Suites 576 6.5% Other Franchised Properties 5,836
Independents 2,516
Econo Lodge 781 Super 8 1,975
Rodeway 160 Days Inn 1,727
8.3.% Other Franchised Properties 2,849
Independents 3,880
MainStay 27 1.3% Extended Stay America 388
Homestead Studio Suites 132
Townplace Suites 166
Candlewood 109
Other Extended Stay Hotels 1,299
Source: Smith Travel Research, December 2004; Choice Internal Data, December 2004.
Maximize Returns
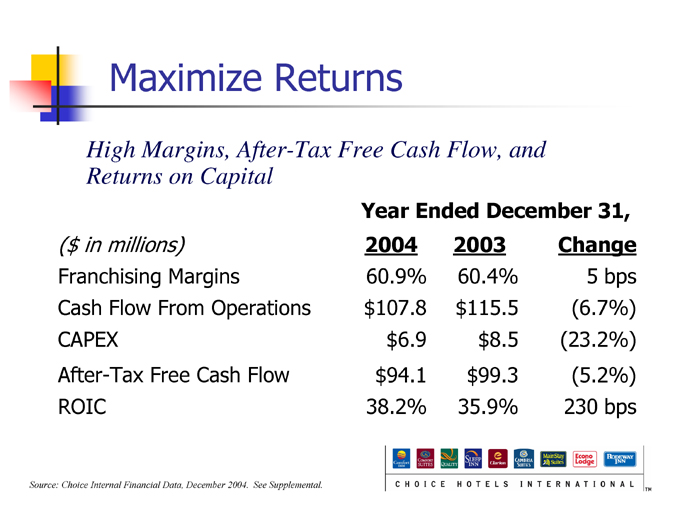
Maximize Returns
High Margins, After-Tax Free Cash Flow, and Returns on Capital
Year Ended December 31,
($ in millions) 2004 2003 Change
Franchising Margins 60.9% 60.4% 5 bps
Cash Flow From Operations $107.8 $115.5 (6.7%)
CAPEX $6.9 $8.5 (23.2%)
After-Tax Free Cash Flow $94.1 $99.3 (5.2%)
ROIC 38.2% 35.9% 230 bps
Source: Choice Internal Financial Data, December 2004. See Supplemental.
Create Value
Create Value
Management Focused on Creating Value
Share repurchases – 32.8 million repurchased at $20.65 per share as of March 31, 2005; represents more than $676 million since inception of program
Dividends – Current quarterly cash dividend of $0.225/share; subject to board approval and business performance, expect to pay future dividends at comparable or increased rate in the future
Equity Performance
5 year annualized share price appreciation in excess of 27%
Source: Choice Internal Data as of March 2005.
Closing Comments
Strong Earnings Per Share, EBITDA, and Cash Flow Growth Proven Earnings Stability Even through Industry/ Economic Downturns Pure-Play Franchise Focus, Highest Returning “Model” in the Industry High Operating Margins Significant Free Cash Flow Experienced Management Team Focused on Shareholder Value
Supplemental
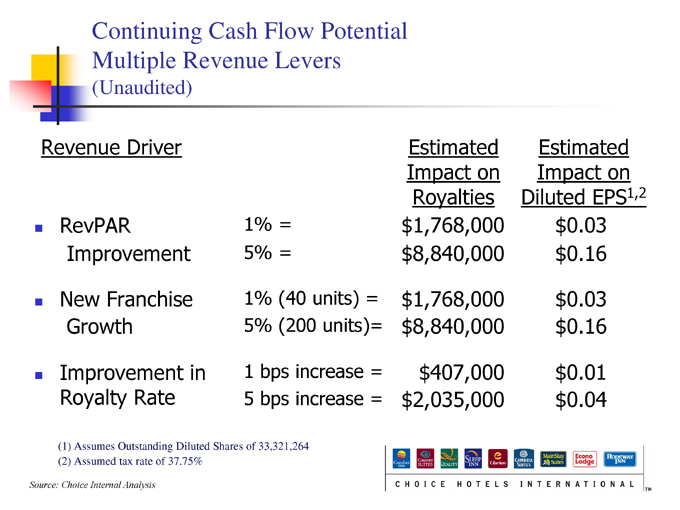
Continuing Cash Flow Potential Multiple Revenue Levers
(Unaudited)
Revenue Driver Estimated Estimated
Impact on Impact on
Royalties Diluted EPS1,2
RevPAR 1% = $1,768,000 $0.03
Improvement 5% = $8,840,000 $0.16
New Franchise 1% (40 units) = $1,768,000 $0.03
Growth 5% (200 units)= $8,840,000 $0.16
Improvement in 1 bps increase = $407,000 $0.01
Royalty Rate 5 bps increase = $2,035,000 $0.04
(1) Assumes Outstanding Diluted Shares of 33,321,264
(2) Assumed tax rate of 37.75%
Source: Choice Internal Analysis
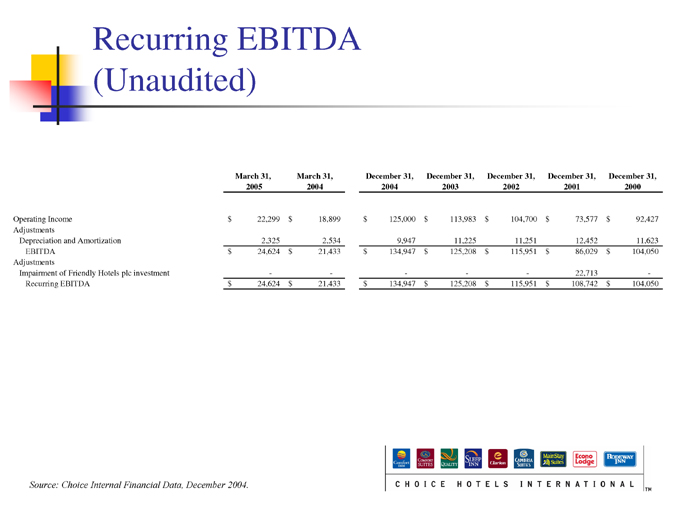
Recurring EBITDA (Unaudited)
March 31, March 31, December 31, December 31, December 31, December 31, December 31,
2005 2004 2004 2003 2002 2001 2000
Operating Income $22,299 $18,899 $125,000 $113,983 $104,700 $73,577 $92,427
Adjustments
Depreciation and Amortization 2,325 2,534 9,947 11,225 11,251 12,452 11,623
EBITDA $24,624 $21,433 $134,947 $125,208 $115,951 $86,029 $104,050
Adjustments
Impairment of Friendly Hotels plc investment - - - - - 22,713 -
Recurring EBITDA $24,624 $21,433 $134,947 $125,208 $115,951 $108,742 $104,050
Source: Choice Internal Financial Data, December 2004.
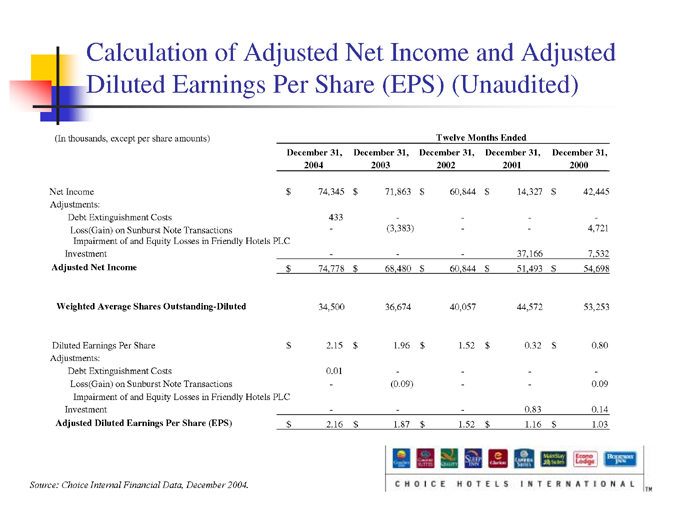
Calculation of Adjusted Net Income and Adjusted Diluted Earnings Per Share (EPS) (Unaudited)
(In thousands, except per share amounts) Twelve Months Ended
December 31, December 31, December 31, December 31, December 31,
2004 2003 2002 2001 2000
Net Income $74,345 $71,863 $60,844 $14,327 $42,445
Adjustments:
Debt Extinguishment Costs 433 - - - -
Loss(Gain) on Sunburst Note Transactions - (3,383) - - 4,721
Impairment of and Equity Losses in Friendly Hotels PLC
Investment - - - 37,166 7,532
Adjusted Net Income $74,778 $68,480 $60,844 $51,493 $54,698
Weighted Average Shares Outstanding-Diluted 34,500 36,674 40,057 44.572 53,253
Diluted Earnings Per Share $2.15 $1.96 $1.52 $0.32 $0.80
Adjustments:
Debt Extinguishment Costs 0.01 - - - -
Loss(Gain) on Sunburst Note Transactions - (0.09) - - 0.09
Impairment of and Equity Losses in Friendly Hotels PLC
Investment - - - 0.83 0.14
Adjusted Diluted Earnings Per Share (EPS) $2.16 $1.87 $1.52 $1.16 $1.03
Source: Choice Internal Financial Data, December 2004.
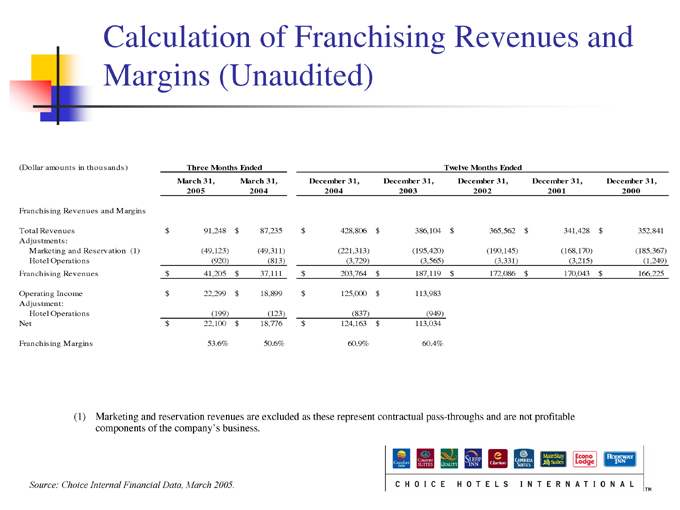
Calculation of Franchising Revenues and Margins (Unaudited)
(Dollar amounts in thousands) Three Months Ended Twelve Months Ended
March 31, March 31, December 31, December 31, December 31, December 31, December 31,
2005 2004 2004 2003 2002 2001 2000
Franchising Revenues and Margins
Total Revenues $91,248 $87,235 $428,806 $386,104 $365,562 $341,428 $352,841
Adjustments:
Marketing and Reservation (1) (49,123) (49,311) (221,313) (195,420) (190,145) (168,170) (185,367)
Hotel Operations (920) (813) (3,729) (3,565) (3,331) (3,215) (1,249)
Franchising Revenues $41,205 $37,111 $203,764 $187,119 $172,086 $170,043 $166,225
Operating Income $22,299 $18,899 $125,000 $113,983
Adjustment:
Hotel Operations (199) (123) (837) (949)
Net $22,100 $18,776 $124,163 $113,034
Franchising Margins 53.6% 50.6% 60.9% 60.4%
(1) Marketing and reservation revenues are excluded as these represent contractual pass-throughs and are not profitable components of the company’s business.
Source: Choice Internal Financial Data, March 2005.
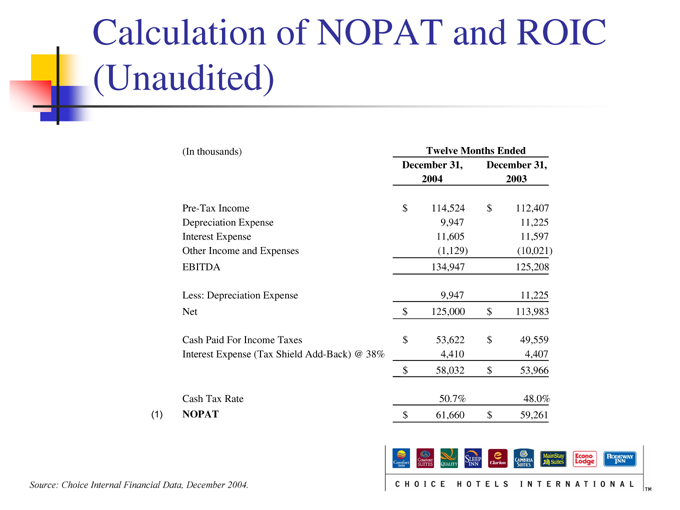
Calculation of NOPAT and ROIC (Unaudited)
(In thousands) Twelve Months Ended
December 31, December 31,
2004 2003
Pre-Tax Income $114,524 $112,407
Depreciation Expense 9,947 11,225
Interest Expense 11,605 11,597
Other Income and Expenses (1,129) (10,021)
EBITDA 134,947 125,208
Less: Depreciation Expense 9,947 11,225
Net $125,000 $113,983
Cash Paid For Income Taxes $53,622 $49,559
Interest Expense (Tax Shield Add-Back) @ 38% 4,410 4,407
$58,032 $53,966
Cash Tax Rate 50.7% 48.0%
(1) NOPAT
Source: Choice Internal Financial Data, December 2004.
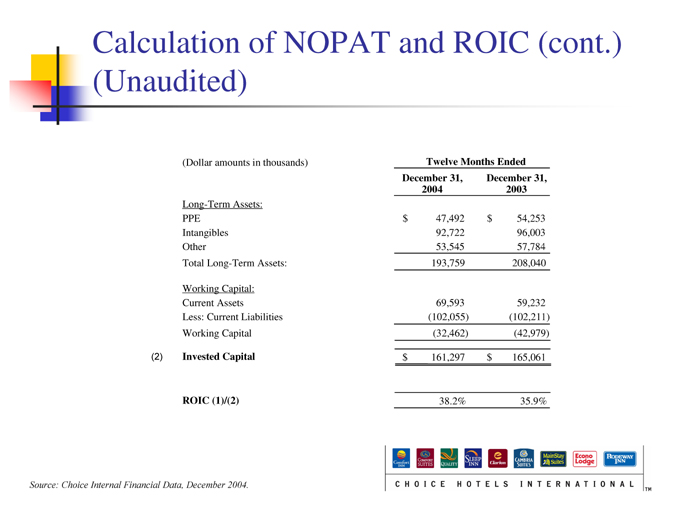
Calculation of NOPAT and ROIC (cont.) (Unaudited)
(Dollar amounts in thousands) Twelve Months Ended
December 31, December 31,
2004 2003
Long-Term Assets:
PPE $47,492 $54,253
Intangibles 92,722 96,003
Other 53,545 57,784
Total Long-Term Assets: 193,759 208,040
Working Capital:
Current Assets 69,593 59,232
Less: Current Liabilities (102,055) (102,211)
Working Capital (32,462) (42,979)
(2) Invested Capital $161,297 $165,061
ROIC (1)/(2) 38.2% 35.9%
Source: Choice Internal Financial Data, December 2004.
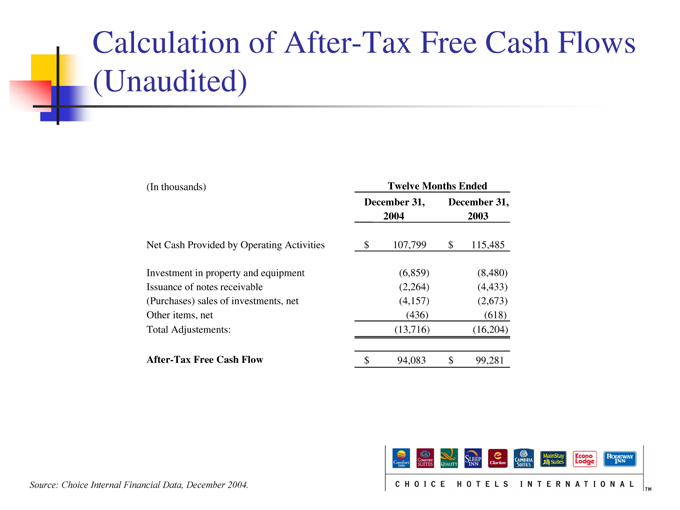
Calculation of After-Tax Free Cash Flows (Unaudited)
(In thousands) Twelve Months Ended
December 31, December 31,
2004 2003
Net Cash Provided by Operating Activities $107,799 $115,485
Investment in property and equipment (6,859) (8,480)
Issuance of notes receivable (2,264) (4,433)
(Purchases) sales of investments, net (4,157) (2,673)
Other items, net (436) (618)
Total Adjustements: (13,716) (16,204)
After-Tax Free Cash Flow $94,083 $99,281
Source: Choice Internal Financial Data, December 2004.
Non-GAAP Financial Measures
Recurring EBITDA, adjusted net income, adjusted diluted earnings per share, franchising revenues and margins, net operating profits after taxes (NOPAT), return on invested capital (ROIC) and after-tax free cash flows are non-GAAP financial measurements. These financial measurements are presented as supplemental disclosures because they are used by management in reviewing and analyzing the company’s performance. This information should not be considered as an alternative to any measure of performance as promulgated under accounting principles generally accepted in the United States (GAAP), such as operating income, net income, diluted earnings per share, total revenues or net cash provided by operating activities. The calculation of these non-GAAP measures may be different from the calculation by other companies and therefore comparability may be limited. The company has included the preceding exhibits which reconcile these measures to the comparable GAAP measurement.