|

CHOICE HOTELS
INTERNATIONAL
CAMBRIA SUITES
BY CHOICE HOTELS SM
COMFORT SUITES
Comfort INN
SLEEP INN
Clarion
Ascend COLLECTION®
QUALITY
MainStay Suites
Suburban
EconoLodge™
RODEWAY INN
Investor Presentation
May 2010
CHOICE HOTELS INVESTOR PRESENTATION
|

DISCLAIMER
Certain matters discussed throughout all of this presentation constitute forward-looking statements within the meaning of the federal securities laws. Generally, our use of words such as “expect,” “estimate,” “believe,” “anticipate,” “will,” “forecast,” “plan,” “project,” “assume” or similar words of futurity identify statements that are forward-looking and that we intend to be included within the Safe Harbor protections provided by Section 27A of the Securities Act and Section 21E of the Securities Exchange Act of 1934. Such forward-looking statements are based on management’s current beliefs, assumptions and expectations regarding future events, which in turn are based on information currently available to management. Such statements may relate to projections for the company’s revenue, earnings and other financial and operational measures, company debt levels, payment of stock dividends, and future operations. We caution you not to place undue reliance on any forward-looking statements, which are made as of the date of this presentation. Forward-looking statements do not guarantee future performance and involve known and unknown risks, uncertainties and other factors.
Several factors could cause actual results, performance or achievements of the company to differ materially from those expressed in or contemplated by the forward-looking statements. Such risks include, but are not limited to, changes to general, domestic and foreign economic conditions; operating risks common in the lodging and franchising industries; changes to the desirability of our brands as viewed by hotel operators and customers; changes to the terms or termination of our contracts with franchisees; our ability to keep pace with improvements in technology utilized for reservations systems and other operating systems; fluctuations in the supply and demand for hotel rooms; and our ability to manage effectively our indebtedness. These and other risk factors are discussed in detail in the Risk Factors section of the company’s Form 10-K for the year ended December 31, 2009, filed with the Securities and Exchange Commission on March 1, 2010. We undertake no obligation to publicly update or revise any forward-looking statement, whether as a result of new information, future events or otherwise.
2 |
|
|
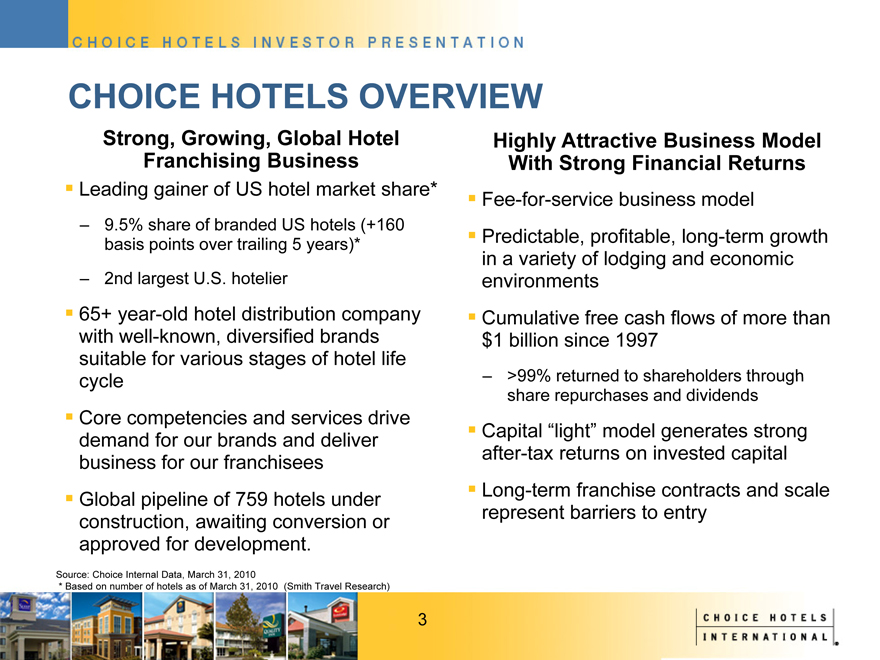
CHOICE HOTELS OVERVIEW
Strong, Growing, Global Hotel Franchising Business
Leading gainer of US hotel market share*
– 9.5% share of branded US hotels (+160 basis points over trailing 5 years)*
– 2nd largest U.S. hotelier
65+ year-old hotel distribution company with well-known, diversified brands suitable for various stages of hotel life cycle Core competencies and services drive demand for our brands and deliver business for our franchisees Global pipeline of 759 hotels under construction, awaiting conversion or approved for development.
Source: Choice Internal Data, March 31, 2010
* |
| Based on number of hotels as of March 31, 2010 (Smith Travel Research) |
Highly Attractive Business Model With Strong Financial Returns
Fee-for-service business model
Predictable, profitable, long-term growth in a variety of lodging and economic environments Cumulative free cash flows of more than $1 billion since 1997
– >99% returned to shareholders through share repurchases and dividends
Capital “light” model generates strong after-tax returns on invested capital Long-term franchise contracts and scale represent barriers to entry
3 |
|
|
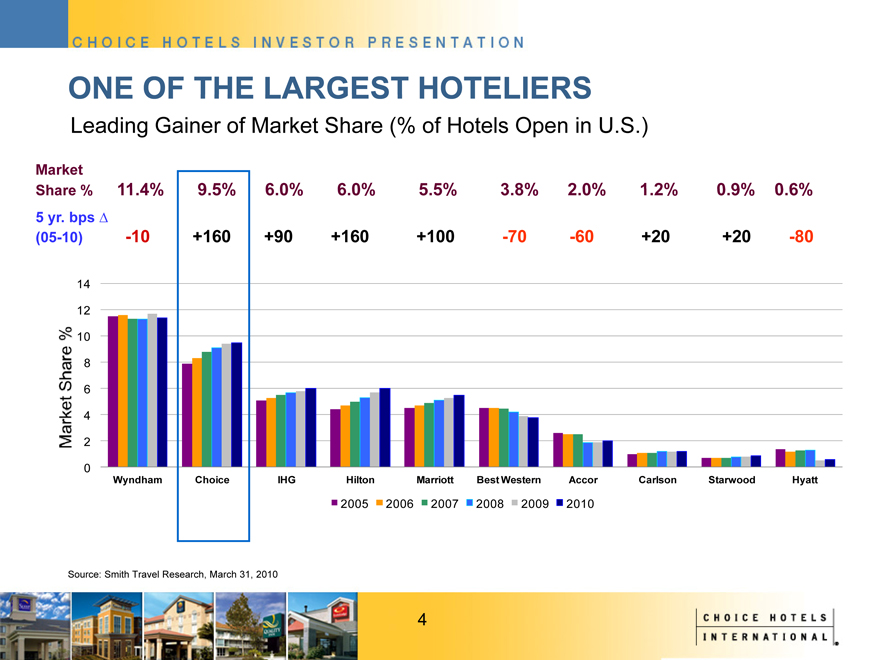
ONE OF THE LARGEST HOTELIERS
Leading Gainer of Market Share (% of Hotels Open in U.S.)
Market Share % 5 yr. bps (05-10)
11.4%
-10
9.5%
+160
6.0% 6.0% 5.5% 3.8% 2.0% 1.2% 0.9% 0.6%
+90 +160 +100 -70 -60 +20 +20 -80
14 12 10 8 6 4 2 0
Market Share %
Wyndham Choice IHG Hilton Marriott Best Western Accor Carlson Starwood Hyatt
2005 2006 2007 2008 2009 2010
Source: Smith Travel Research, March 31, 2010
4 |
|
|
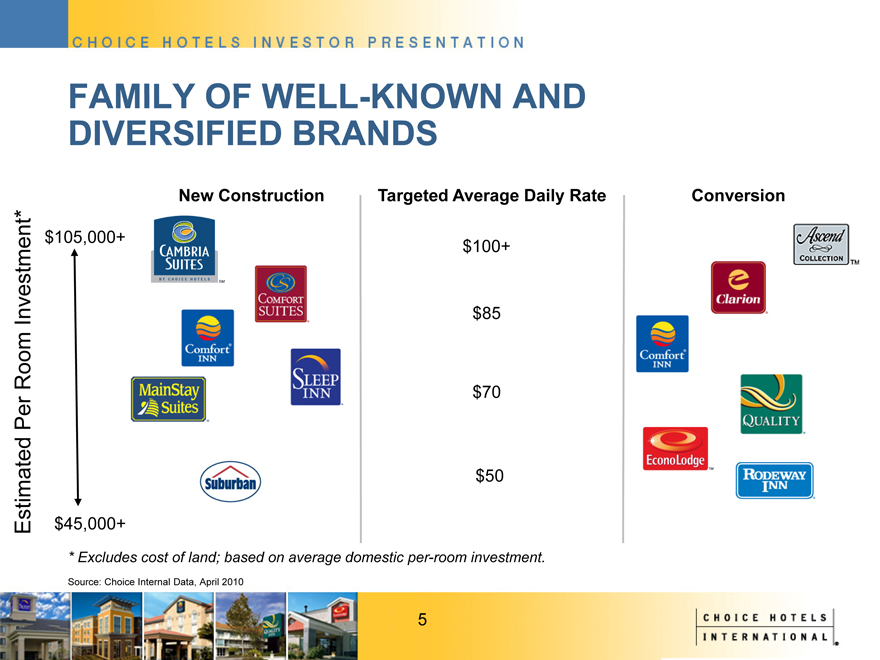
FAMILY OF WELL-KNOWN AND DIVERSIFIED BRANDS
Estimated Per Room Investment*
New Construction
$105,000+ $45,000+ Targeted Average Daily Rate $100+ $85 $70 $50 Conversion * Excludes cost of land; based on average domestic per-room investment. Source: Choice Internal Data, April 2010
5 |
|
|
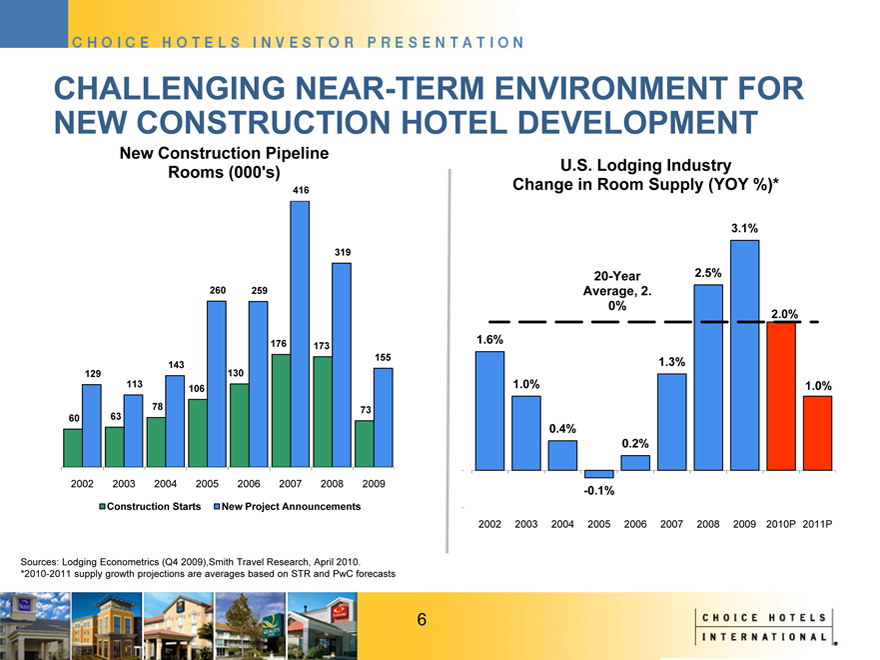
CHALLENGING NEAR-TERM ENVIRONMENT FOR NEW CONSTRUCTION HOTEL DEVELOPMENT
New Construction Pipeline Rooms (000’s)
60 129 63 113 78 143 106 260 130 259 176 416 173 319 155 73
2002 2003 2004 2005 2006 2007 2008 2009
Construction Starts
New Project Announcements
U.S. Lodging Industry Change in Room Supply (YOY %)*
20-Year Average, 2.0%
1.6% 1.0% 0.4% -0.1% 0.2% 1.3% 2.5% 3.1% 2.0% 1.0%
2002 2003 2004 2005 2006 2007 2008 2009 2010P 2011P
Sources: Lodging Econometrics (Q4 2009), Smith Travel Research, April 2010. *2010-2011 supply growth projections are averages based on STR and PwC forecasts
6 |
|
|
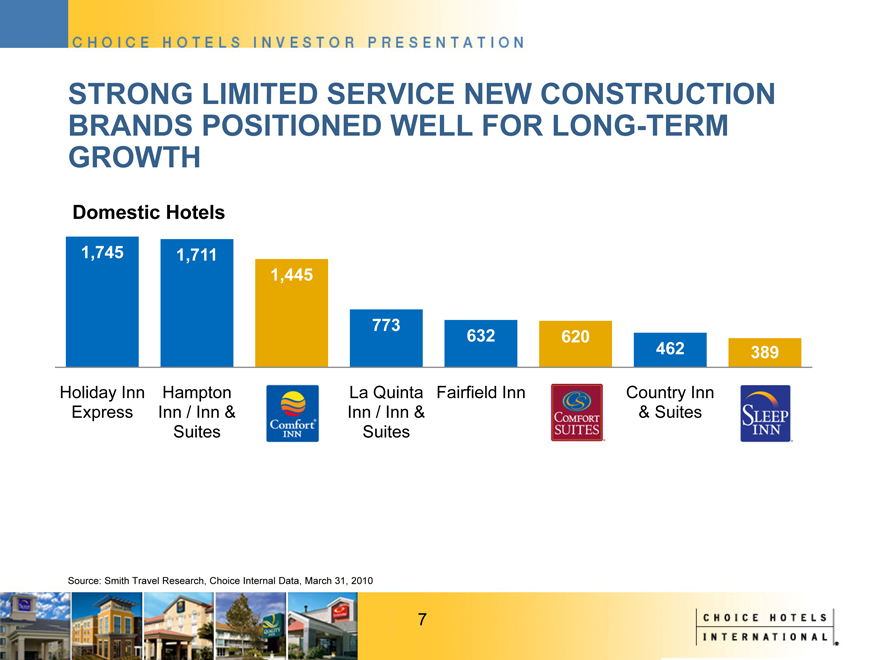
STRONG LIMITED SERVICE NEW CONSTRUCTION BRANDS POSITIONED WELL FOR LONG-TERM GROWTH
Domestic Hotels
1,745 1,711 1,445 773 632 620 462 389
Holiday Inn Express Hampton Inn / Inn & Suites La Quinta Inn / Inn & Suites Fairfield Inn Country Inn & Suites
Source: Smith Travel Research, Choice Internal Data, March 31, 2010
7 |
|
|
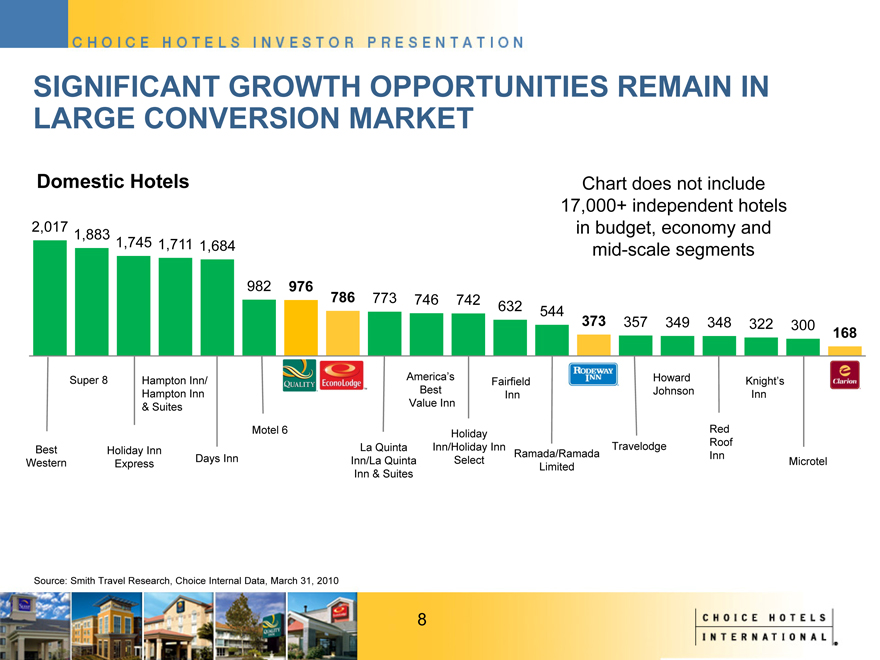
SIGNIFICANT GROWTH OPPORTUNITIES REMAIN IN LARGE CONVERSION MARKET
Domestic Hotels
Chart does not include 17,000+ independent hotels in budget, economy and mid-scale segments
2,017, 1,883, 1,745, 1,711, 1,684, 982, 976, 786, 773, 746, 742, 632, 544, 373, 357, 349, 348, 322, 300, 168
Super 8
Hampton Inn/
Hampton Inn
& Suites
Motel 6
America’s Best Value Inn
Fairfield Inn
Howard Johnson
Knight’s Inn
Best Western
Holiday Inn Express
Days Inn
/Holiday Inn
Holiday Inn
Select
La Quinta
Inn/La Quinta
Inn & Suites
Ramada/Ramada
Limited
Travelodge
Red Roof Inn
Microtel
Source: Smith Travel Research, Choice Internal Data, March 31, 2010
8
|
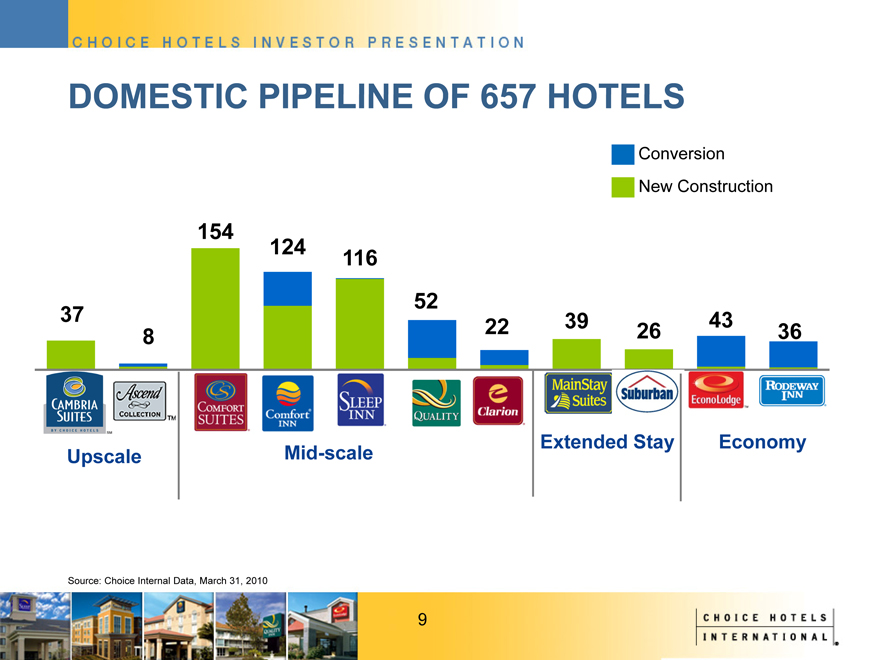
DOMESTIC PIPELINE OF 657 HOTELS
Conversion New Construction
37 8 154 124 116 52 22 39 26 43 36
Extended Stay Economy Upscale Mid-scale
Source: Choice Internal Data, March 31, 2010
9
|

STRONG PRESENCE IN MAJOR TRAVEL MARKETS OUTSIDE OF THE U.S.
1,127 properties in more than 30 countries and territories on 5 continents.
Multi-year investments in IT and marketing planned to enhance value proposition for international hotels.
Significant long-term growth opportunity in underrepresented regions/countries.
163 hotels Scandinavia
280 hotels Canada
243 hotels Continental Europe, UK & Ireland
1 hotel Lebanon
28 hotels India
52 hotels Japan
3 hotels China
1 hotel Singapore
1 hotel Malaysia
269 hotels Australia, New Zealand & Papa New Guinea
54 hotels Brazil
13 hotels Central America
19 hotels Mexico
Source: Choice Internal Data, March 31, 2010
10
|
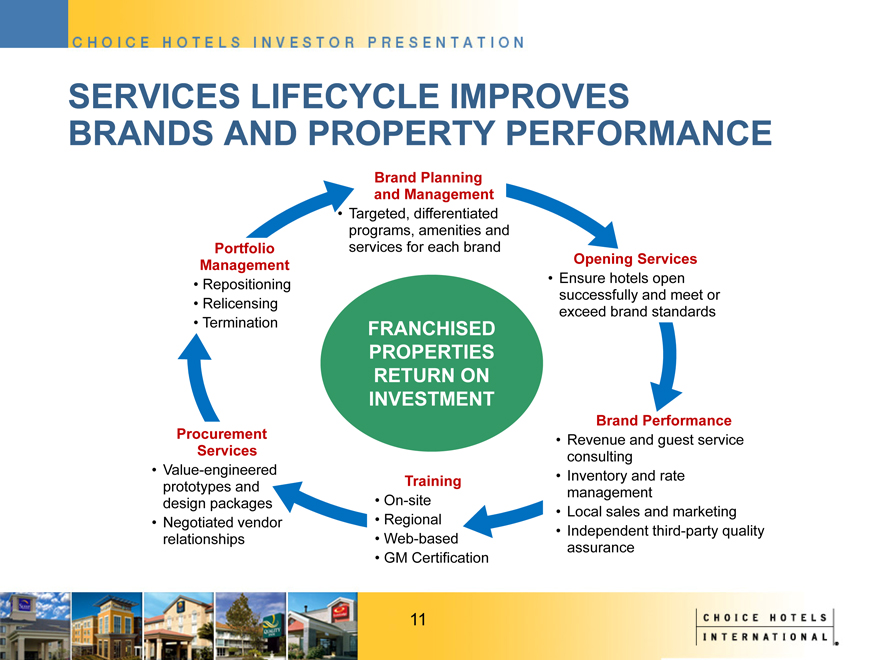
SERVICES LIFECYCLE IMPROVES BRANDS AND PROPERTY PERFORMANCE
Brand Planning and Management
• Targeted, differentiated programs, amenities and services for each brand
Portfolio Management
• Repositioning
• Relicensing
• Termination
Procurement Services
• Value-engineered prototypes and design packages
• Negotiated vendor relationships
Training
• On-site
• Regional
• Web-based
• GM Certification
Brand Performance
• Revenue and guest service consulting
• Inventory and rate management
• Local sales and marketing
• Independent third-party quality assurance
Opening Services
• Ensure hotels open successfully and meet or exceed brand standards
11
|
MARKETING AND CENTRAL RESERVATION SYSTEM LEVERAGES SIZE, SCALE AND DISTRIBUTION
$300-plus million in annual marketing and reservation system fees
Leverage expertise and innovation in on-line, targeted interactive marketing to influence guest hotel stay decisions
Powerful advertising campaigns
Focus on driving guests to Choice central channels Facilitate “one-stop” shopping Strong and growing global loyalty program Increasing brand awareness
Source: Choice Internal Data, December 2009
12
|
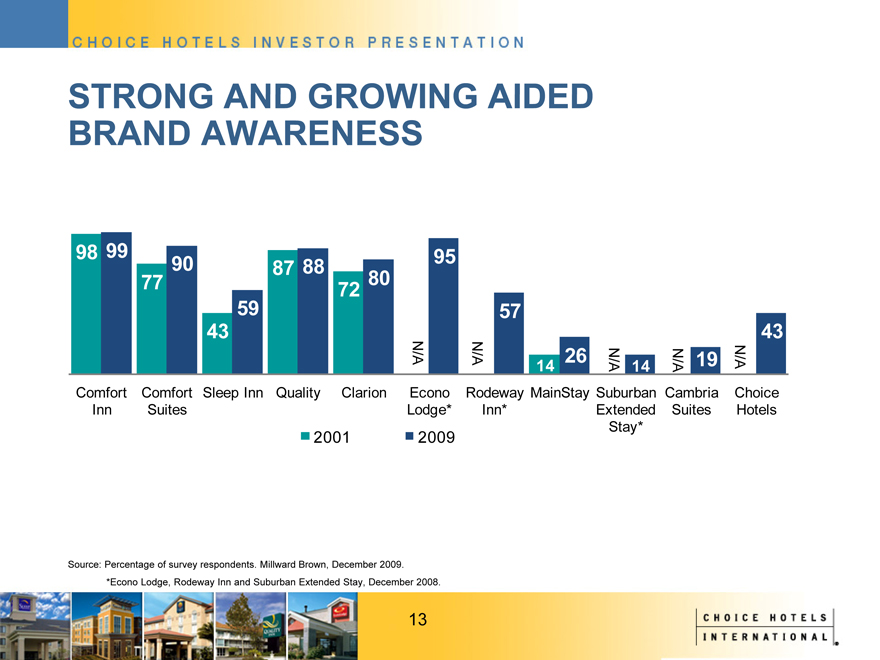
STRONG AND GROWING AIDED BRAND AWARENESS
98 99 95
90 87 88
77 80
59 72
57
43 43
N/A N/A 26 19 N/A
14 N/A 14 N/A
Comfort Inn Comfort Suites Sleep Inn Quality Clarion Econo Lodge* Rodeway Inn* MainStay Suburban Extended Stay* Cambria Suites Choice Hotels
2001 2009
Source: Percentage of survey respondents. Millward Brown, December 2009.
*Econo Lodge, Rodeway Inn and Suburban Extended Stay, December 2008.
13
|
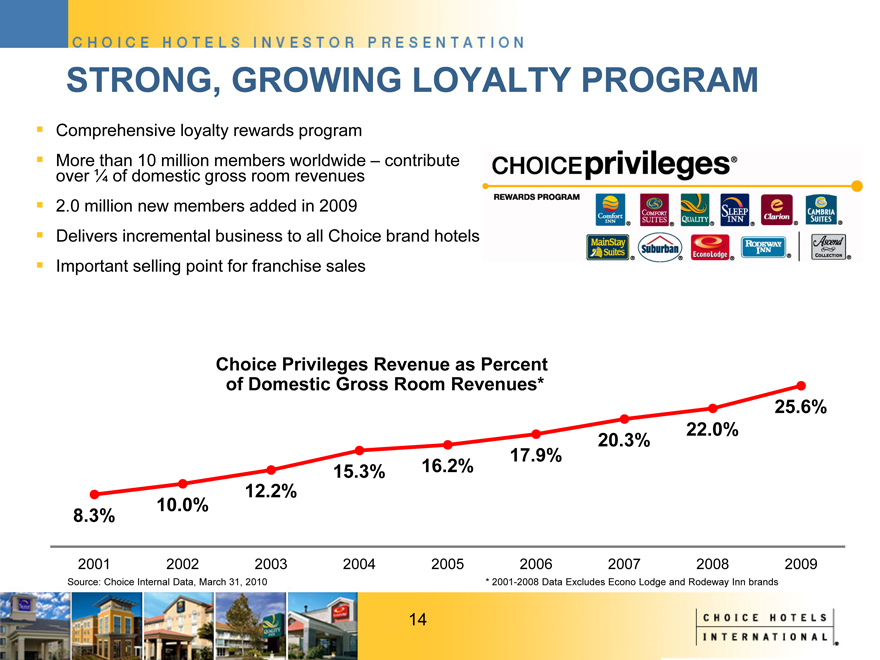
STRONG, GROWING LOYALTY PROGRAM
Comprehensive loyalty rewards program
More than 10 million members worldwide – contribute over 1/4 of domestic gross room revenues
2.0 million new members added in 2009
Delivers incremental business to all Choice brand hotels
Important selling point for franchise sales
Choice Privileges Revenue as Percent of Domestic Gross Room Revenues*
8.3% 10.0% 12.2% 15.3% 16.2% 17.9% 20.3% 22.0% 25.6%
2001 2002 2003 2004 2005 2006 2007 2008 2009
Source: Choice Internal Data, March 31, 2010 *
2001-2008 Data Excludes Econo Lodge and Rodeway Inn brands
14
|
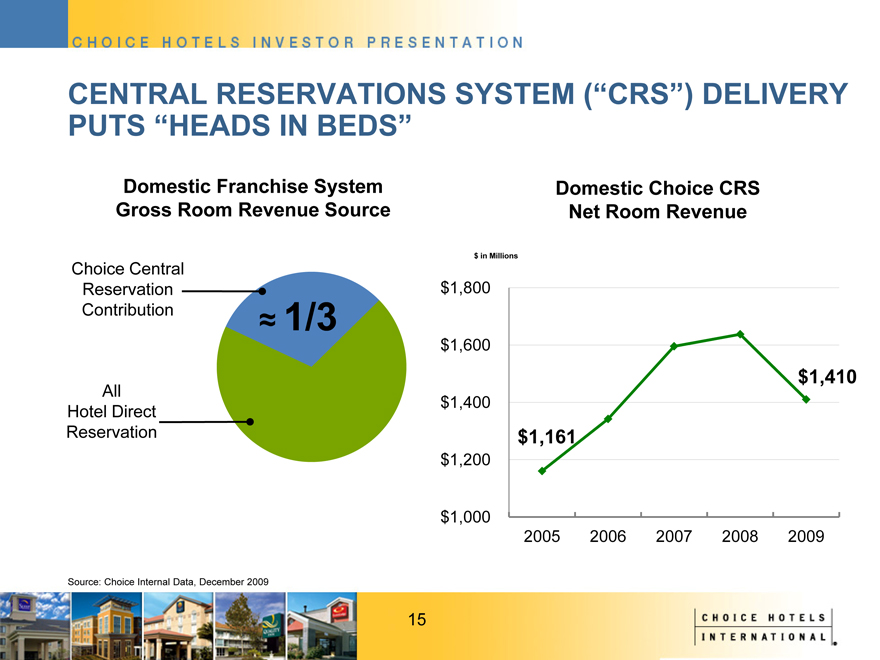
CENTRAL RESERVATIONS SYSTEM (“CRS”) DELIVERY PUTS “HEADS IN BEDS”
Domestic Franchise System Gross Room Revenue Source
Choice Central Reservation Contribution
All Hotel Direct Reservation
= 1/3
$ in Millions
$1,800 $1,600 $1,400 $1,200 $1,000
2005 2006 2007 2008 2009
$1,161 $1,410
Domestic Choice CRS Net Room Revenue
Source: Choice Internal Data, December 2009
15
|
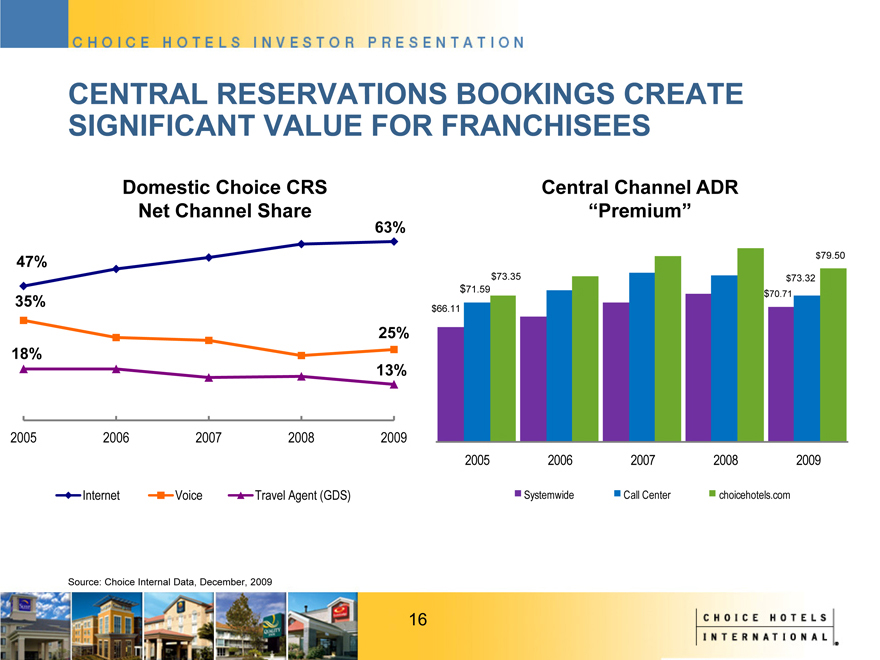
CENTRAL RESERVATIONS BOOKINGS CREATE SIGNIFICANT VALUE FOR FRANCHISEES
Domestic Choice CRS Net Channel Share
Central Channel ADR “Premium”
$79.50
$73.35 $73.32
$71.59
$70.71
$66.11
47% 35% 63% 18% 25% 13%
2005 2006 2007 2008 2009
2005 2006 2007 2008 2009
Systemwide Call Center choicehotels.com
Source: Choice Internal Data, December, 2009
16
|
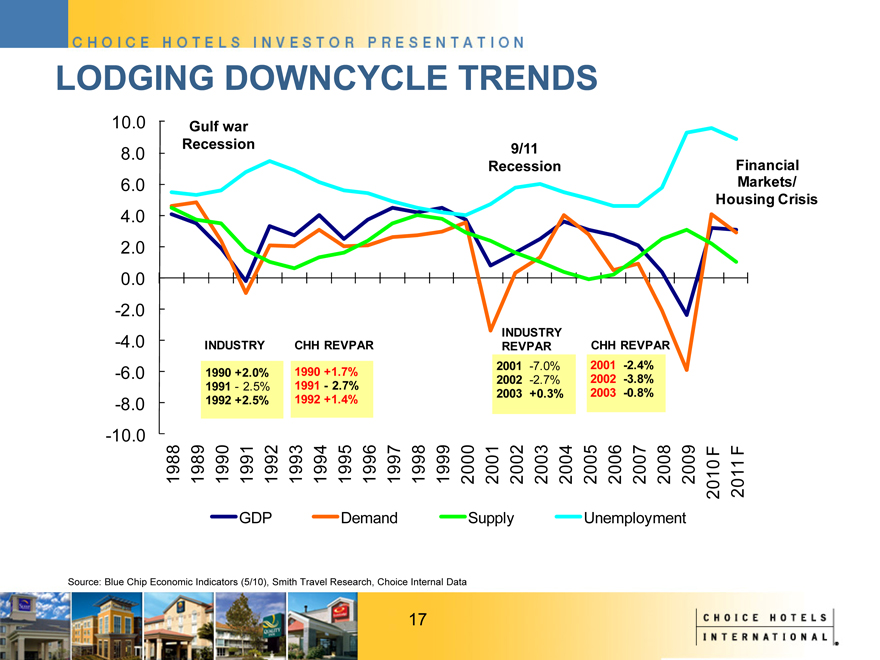
LODGING DOWNCYCLE TRENDS
10.0 8.0 6.0 4.0 2.0 0.0 -2.0 -4.0 -6.0 -8.0 -10.0
Gulf war Recession
9/11 Recession
Financial Markets/ Housing Crisis
INDUSTRY
INDUSTRY CHH REVPAR REVPAR CHH REVPAR
2001 -7.0% 2002 -2.7% 2003 +0.3%
2001 -2.4% % 2002 -3.8% 2003 -0.8%
1990 +1.7% 1991 2.7% 1992 +1.4%
1990 +2.0 1991 2.5% 1992 +2.5%
1988 1989 1990 1991 1992 1993 1994 1995 1996 1997 1998 1999 2000 2001 2002 2003 2004 2005 2006 2007 2008 2009 2010F 2011F
GDP Demand Supply Unemployment
Source: Blue Chip Economic Indicators (5/10), Smith Travel Research, Choice Internal Data
17
|
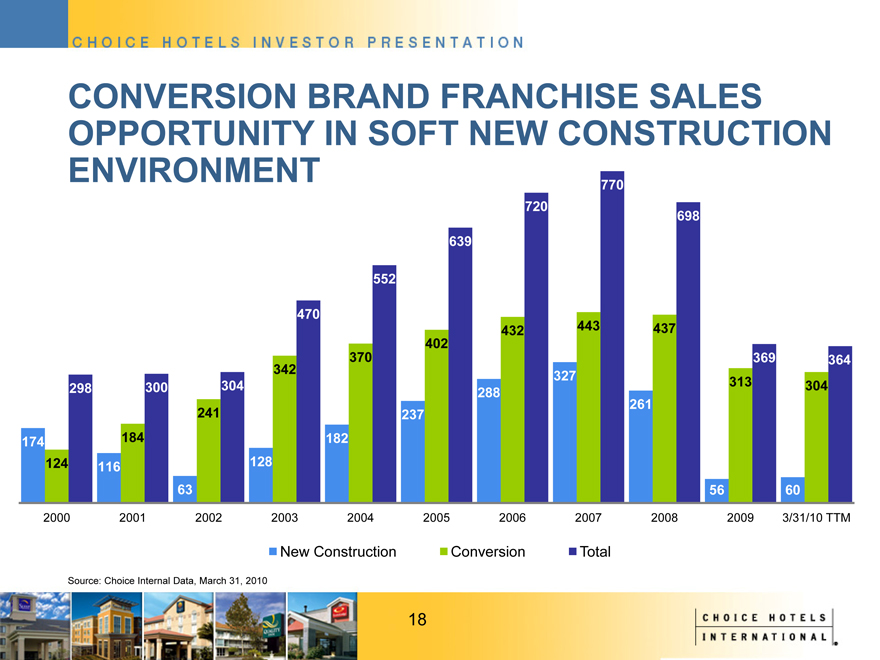
CONVERSION BRAND FRANCHISE SALES OPPORTUNITY IN SOFT NEW CONSTRUCTION ENVIRONMENT
298 300 304 470 552 639 720 770 698 369 364
174 124 116 184 63 241 128 342 182 370 237 402 288 432 327 443 261 437 56 313 60 304
New Construction Conversion Total
Source: Choice Internal Data, March 31, 2010
18
|
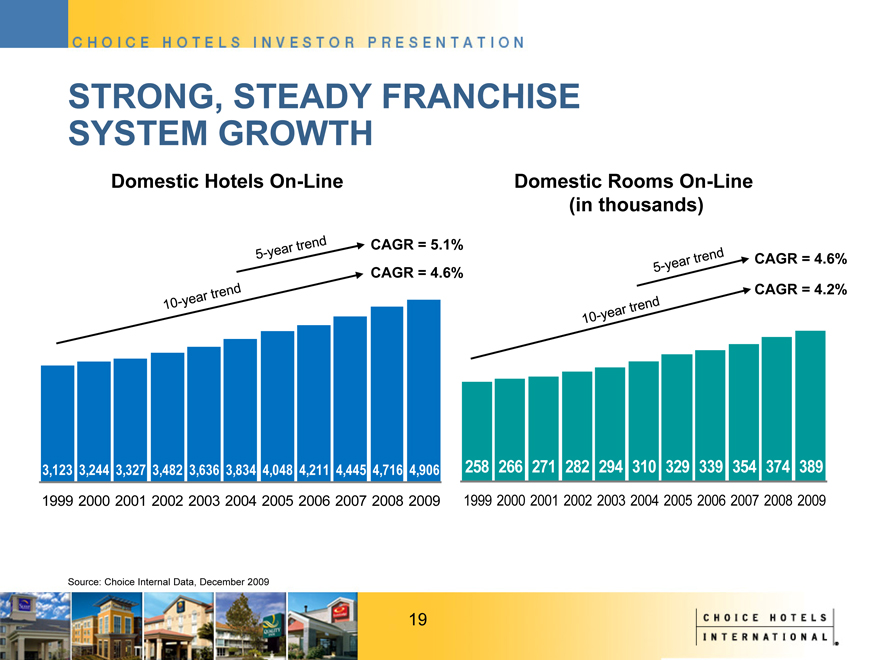
STRONG, STEADY FRANCHISE SYSTEM GROWTH
Domestic Hotels On-Line
Domestic Rooms On-Line (in thousands)
5-year trend
CAGR = 5.1%
10-year trend
5-year trend
CAGR = 4.6%
5-year trend
CAGR = 4.6%
10-year trend
CAGR = 4.2%
3,123 3,244 3,327 3,482 3,636 3,834 4,048 4,211 4,445 4,716 4,906
1999 2000 2001 2002 2003 2004 2005 2006 2007 2008 2009
258 266 271 282 294 310 329 339 354 374 389
1999 2000 2001 2002 2003 2004 2005 2006 2007 2008 2009
Source: Choice Internal Data, December 2009
19
|
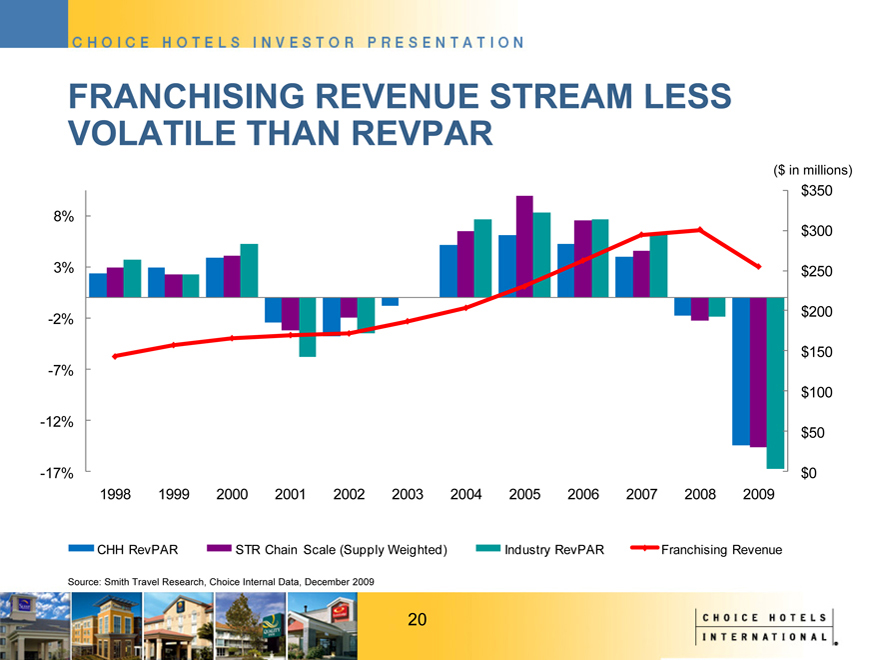
FRANCHISING REVENUE STREAM LESS VOLATILE THAN REVPAR
($ in millions)
8% 3% -2% -7% -12% -17% $350 $300 $250 $200 $150 $100 $50 $0
1998 1999 2000 2001 2002 2003 2004 2005 2006 2007 2008 2009
CHH RevPAR
STR Chain Scale (Supply Weighted)
Industry RevPAR
Franchising Revenue
Source: Smith Travel Research, Choice Internal Data, December 2009
20
|
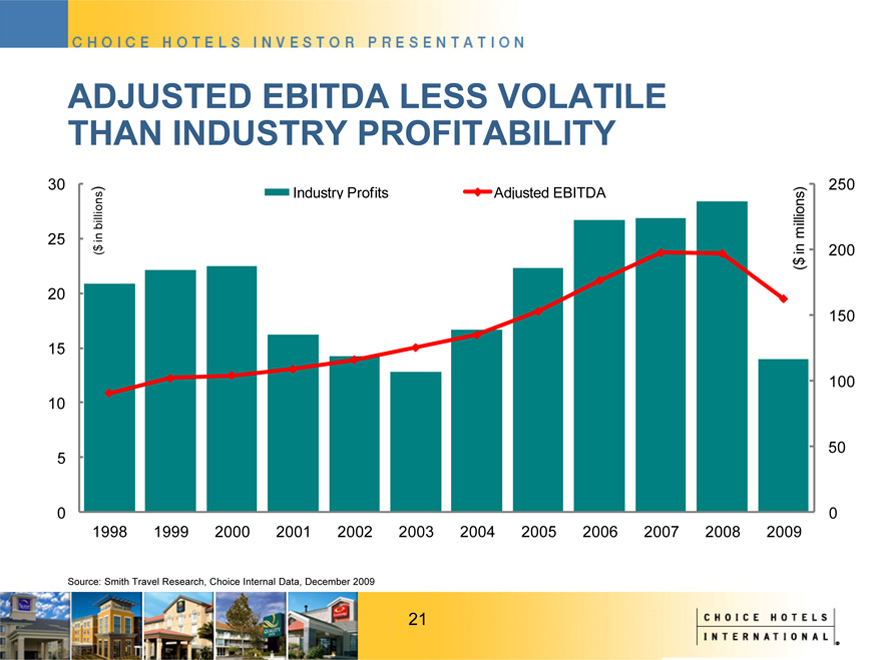
ADJUSTED EBITDA LESS VOLATILE THAN INDUSTRY PROFITABILITY
30 ) 250 Industry Profits Adjusted EBITDA
billions millions) 25in
( $ in 200 $ (
20
150
15
100 10
50 5
0 0 1998 1999 2000 2001 2002 2003 2004 2005 2006 2007 2008 2009
Source: Smith Travel Research, Choice Internal Data, December 2009
21
|
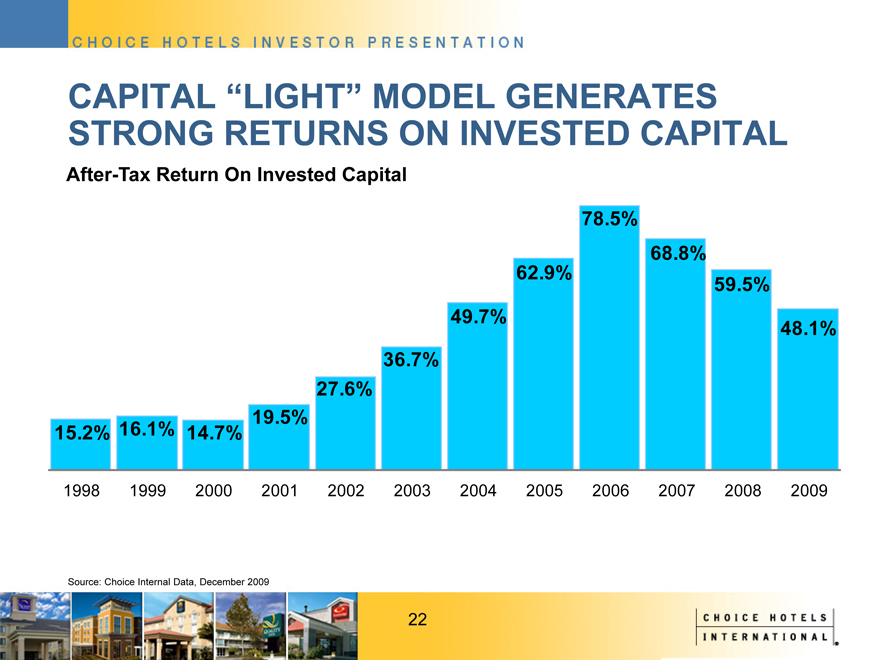
CAPITAL “LIGHT” MODEL GENERATES STRONG RETURNS ON INVESTED CAPITAL
After-Tax Return On Invested Capital 78.5%
68.8%
62.9%
49.7%
36.7%
59.5%
48.1%
27.6%
19.5%
15.2% 16.1% 14.7%
1998 1999 2000 2001 2002 2003 2004 2005 2006 2007 2008 2009
Source: Choice Internal Data, December 2009
22
|
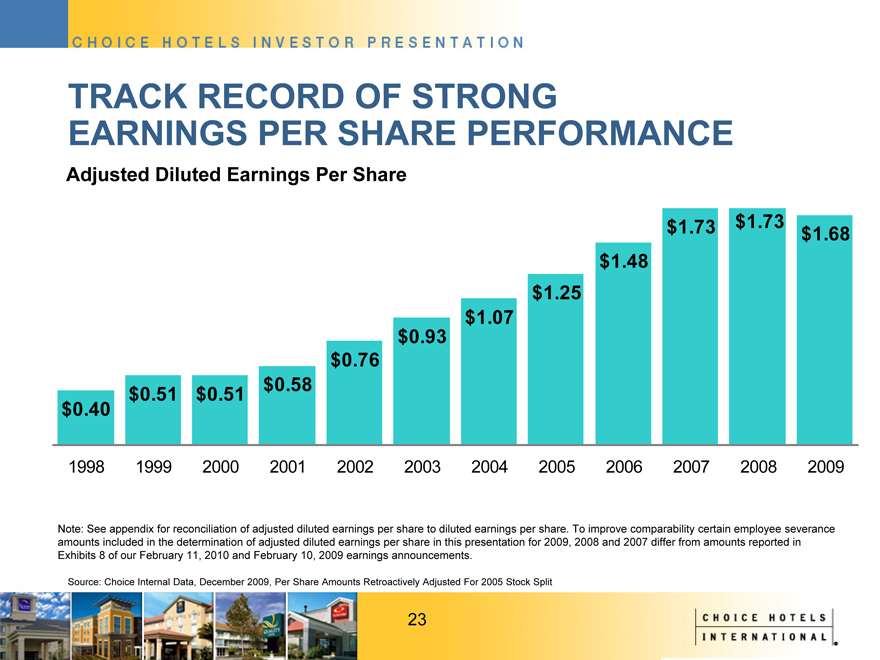
TRACK RECORD OF STRONG
EARNINGS PER SHARE PERFORMANCE
Adjusted Diluted Earnings Per Share
$1.73 $1.73
$1.48
$1.68%
$1.25
$1.07
$0.93
$0.76
$0.58
$0.51 $0.51
$0.40
1998 1999 2000 2001 2002 2003 2004 2005 2006 2007 2008 2009
Note: See appendix for reconciliation of adjusted diluted earnings per share to diluted earnings per share. To improve comparability certain employee severance amounts included in the determination of adjusted diluted earnings per share in this presentation for 2009, 2008 and 2007 differ from amounts reported in Exhibits 8 of our February 11, 2010 and February 10, 2009 earnings announcements.
Source: Choice Internal Data, December 2009, Per Share Amounts Retroactively Adjusted For 2005 Stock Split
23
|
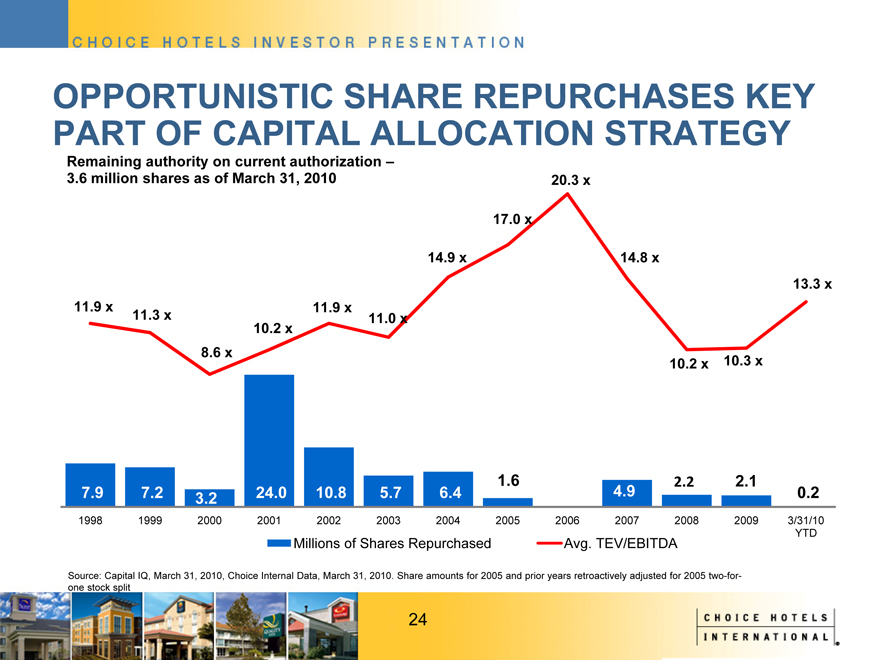
OPPORTUNISTIC SHARE REPURCHASES KEY PART OF CAPITAL ALLOCATION STRATEGY
Remaining authority on current authorization –3.6 million shares as of March 31, 2010
11.9 x 11.3 x 8.6 x 10.2 x 11.9 x 11.0 x 14.9 x 17.0 x 20.3 x 14.8 x 10.2 x 10.3 x 13.3 x
7.9 7.2 3.2 24.0 10.8 5.7 6.4 1.6 4.9 2.2 2.1 0.2
1998 1999 2000 2001 2002 2003 2004 2005 2006 2007 2008 2009 3/31/10 YTD
Millions of Shares Repurchased
Avg. TEV/EBITDA
Source: Capital IQ, March 31, 2010, Choice Internal Data, March 31, 2010. Share amounts for 2005 and prior years retroactively adjusted for 2005 two-for-one stock split
24
|
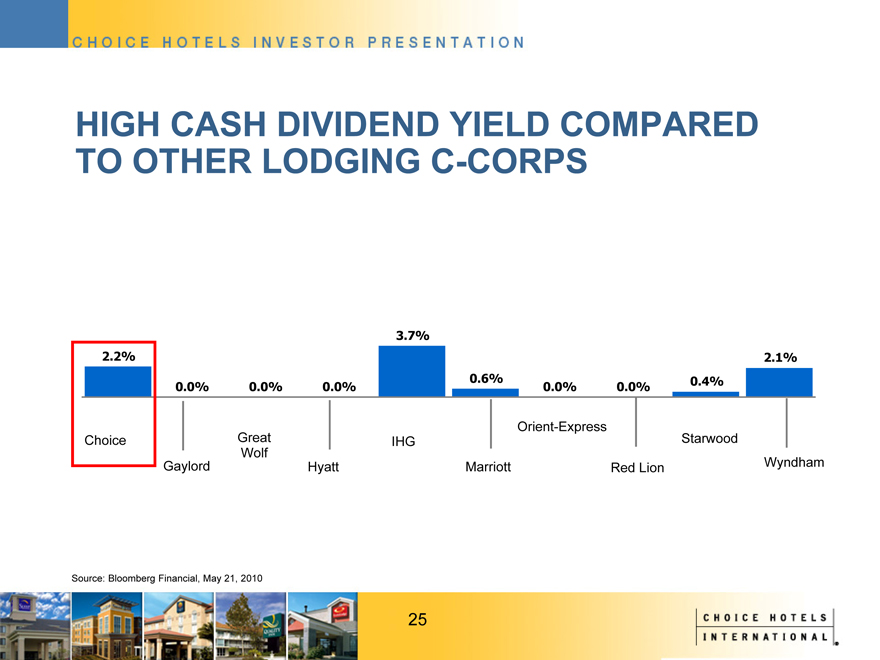
HIGH CASH DIVIDEND YIELD COMPARED TO OTHER LODGING C-CORPS
3.7%
2.2% 2.1% 0.6% 0.4% 0.0% 0.0% 0.0% 0.0% 0.0%
Orient-Express
Choice Great Wolf IHG Starwood
Gaylord Hyatt Marriott Red Lion Wyndham
Source: Bloomberg Financial, May 21, 2010
25
|
STRONG CREDIT POSITION
Investment grade credit rating
– Moody’s Baa3
– Standard & Poor’s BBB
Strong liquidity position
– $350 million committed revolver matures June 2011
– No debt maturities until 2011 Substantial financial flexibility Minimal contingent liability exposure
Source: Choice Internal Data, December 2009
26
|

STRATEGY FOR CHOICE’S BRANDS, GROWTH AND SHAREHOLDERS
Grow and Improve Brands
Continue progress toward long-term goal of domestic market share leadership Increase portfolio profitability of the Comfort brand family Refresh Sleep Inn to improve long-term brand growth potential
Invest in and expand emerging brands/segments – Cambria, Ascend, Extended Stay, International
Enhance Reservations Delivery
Grow Choice Privileges loyalty program – target 2.5+ million new members in 2010 Enhance global sales strategy Deploy revenue management tools designed to improve franchise performance
Allocate Free Cash Flows To “Best And Highest” Use
Continue shareholder-friendly capital allocation policies
Leverage financial capacity/strength to support expansion of emerging brands Evaluate opportunities to enter new segments Invest in IT infrastructure to shore up value proposition for international properties.
27
|
Appendix
Reconciliation of Non-GAAP Financial Measurements to GAAP
28
|
DISCLAIMER
Adjusted franchising margins, adjusted earnings before interest, taxes depreciation and amortization (EBITDA), adjusted net income, adjusted diluted earnings per share (EPS), franchising revenues, net operating profit after tax (NOPAT), return on average invested capital (ROIC) and free cash flows are non-GAAP financial measurements. These financial measurements are presented as supplemental disclosures because they are used by management in reviewing and analyzing the company’s performance. This information should not be considered as an alternative to any measure of performance as promulgated under accounting principles generally accepted in the United States (GAAP), such as operating income, net income, diluted earnings per share, total revenues or net cash provided by operating activities. The calculation of these non-GAAP measures may be different from the calculation by other companies and therefore comparability may be limited. The company has included the following appendix which reconcile these measures to the comparable GAAP measurement.
29
|
FRANCHISING REVENUES AND ADJUSTED FRANCHISING MARGINS
( $ a m o u n t s i n t h o u s a n d s ) Y e a r E n d e d Y e a r E n d e d Y e a r E n d e d Y e a r E n d e d Y e a r E n d e d Y e a r E n d e d Y e a r E n d e d D e c e m b e r 3 1 , D e c e m b e r 3 1 , D e c e m b e r 3 1 , D e c e m b e r 3 1 , D e c e m b e r 3 1 , D e c e m b e r 3 1 , D e c e m b e r 3 1 ,
2 |
| 0 0 9 2 0 0 8 2 0 0 7 2 0 0 6 2 0 0 5 2 0 0 4 2 0 0 3 |
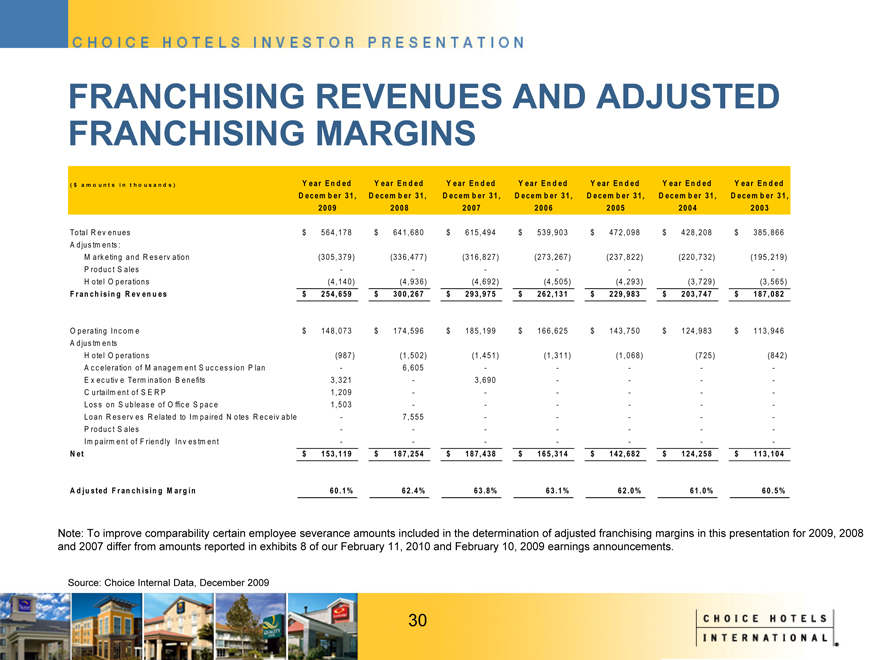
To ta l R e v e n u e s $ 5 6 4 , 1 7 8 $ 6 4 1 , 6 8 0 $ 6 1 5 , 4 9 4 $ 5 3 9 , 9 0 3 $ 4 7 2 , 0 9 8 $ 4 2 8 , 2 0 8 $ 3 8 5 , 8 6 6 A d ju s tm e n ts : M a rk e tin g a n d R e s e rv a tio n (3 0 5 , 3 7 9 ) (3 3 6 , 4 7 7 ) (3 1 6 , 8 2 7 ) (2 7 3 , 2 6 7 ) (2 3 7 , 8 2 2 ) (2 2 0 , 7 3 2 ) (1 9 5 , 2 1 9 ) P ro d u c t S a le s — — — — — — — H o te l O p e ra tio n s (4 , 1 4 0 ) (4 , 9 3 6 ) (4 , 6 9 2 ) (4 , 5 0 5 ) (4 , 2 9 3 ) (3 , 7 2 9 ) (3 , 5 6 5 )
F r a n c h i s i n g R e v e n u e s $ 2 5 4 , 6 5 9 $ 3 0 0 , 2 6 7 $ 2 9 3 ,9 7 5 $ 2 6 2 , 1 3 1 $ 2 2 9 , 9 8 3 $ 2 0 3 , 7 4 7 $ 1 8 7 , 0 8 2
O p e ra tin g I n c o m e $ 1 4 8 , 0 7 3 $ 1 7 4 , 5 9 6 $ 1 8 5 , 1 9 9 $ 1 6 6 , 6 2 5 $ 1 4 3 , 7 5 0 $ 1 2 4 , 9 8 3 $ 1 1 3 , 9 4 6 A d ju s tm e n ts H o te l O p e ra tio n s (9 8 7 ) (1 , 5 0 2 ) (1 , 4 5 1 ) (1 , 3 1 1 ) (1 , 0 6 8 ) (7 2 5 ) (8 4 2 ) A c c e le ra tio n o f M a n a g e m e n t S u c c e s s io n P la n — 6 , 6 0 5 — — — — — E x e c u tiv e Te rm in a tio n B e n e fits 3 , 3 2 1 — 3 , 6 9 0 — — — — C u rta ilm e n t o f S E R P 1 , 2 0 9 — — — — — — L o s s o n S u b le a s e o f O ffic e S p a c e 1 , 5 0 3 — — — — — — L o a n R e s e rv e s R e la te d to I m p a ire d N o te s R e c e iv a b le — 7 , 5 5 5 — — — — — P ro d u c t S a le s — — — — — — — I m p a irm e n t o f F rie n d ly I n v e s tm e n t — — — — — — -
N e t $ 1 5 3 , 1 1 9 $ 1 8 7 , 2 5 4 $ 1 8 7 ,4 3 8 $ 1 6 5 , 3 1 4 $ 1 4 2 , 6 8 2 $ 1 2 4 , 2 5 8 $ 1 1 3 , 1 0 4
A d j u s te d F r a n c h i s in g M a r g i n 6 0 .1 % 6 2 . 4 % 6 3 . 8 % 6 3 .1 % 6 2 .. 0 % 6 1 . 0 % 6 0 .5 %
Note: To improve comparability certain employee severance amounts included in the determination of adjusted franchising margins in this presentation for 2009, 2008 and 2007 differ from amounts reported in exhibits 8 of our February 11, 2010 and February 10, 2009 earnings announcements.
Source: Choice Internal Data, December 2009
30
|

FRANCHISING REVENUES AND ADJUSTED FRANCHISING MARGINS (CONTINUED)
($ amounts in thousands) Year Ended Year Ended Year Ended Year Ended Year Ended Year Ended December 31, December 31, December 31, December 31, December 31, December 31, 2002 2001 2000 1999 1998 1997
Total Revenues Adjustments:
Marketing and Reservation Product Sales Hotel Operations
Franchising Revenues
Operating Income Adjustments Hotel Operations
Acceleration of Management Succession Plan Executive Termination Benefits Loan Reserves Related to Impaired Notes Receivable Product Sales Impairment of Friendly Investment
Net
Adjusted Franchising Margin
$ 365,562
(190,145) - (3,331) $ 172,086
$ 104,700
(385) - - - - - $ 104,315
60.6%
$ 341,428
(168,170) - (3,215) $ 170,043
$ 73,577
(714) - - - - 22,713 $ 95,576
56.2%
$ 352,841
(185,367) - (1,249) $ 166,225
$ 92,427
(640) - - - - - $ 91,787
55.2%
$ 324,203
(162,603) (3,871) - $ 157,729
$ 94,170
- - - - 12 - $ 94,182
59.7%
$ 165,474
- (20,748) (1,098) $ 143,628
$ 85,151
35 - - - (1,216) - $ 83,970
58.5%
$ 175,416
- (23,806) (17,303) $ 134,307
$ 77,068
(1,679) - - - (1,037) - $ 74,352
55.4%
Source: Choice Internal Data, December 2009
31
|
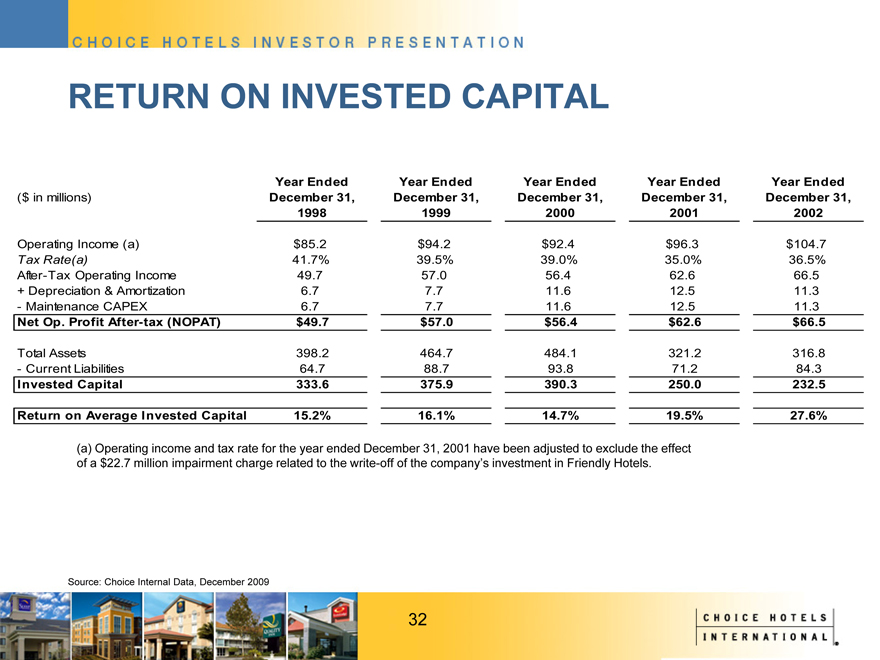
RETURN ON INVESTED CAPITAL
($ in millions)
Operating Income (a)
Tax Rate(a)
After-Tax Operating Income
+ Depreciation & Amortization
- Maintenance CAPEX
Net Op. Profit After-tax (NOPAT)
Total Assets
- Current Liabilities
Invested Capital
Return on Average Invested Capital
Year Ended December 31, 1998
$85.2 41.7% 49.7 6.7 6.7 $49.7
398.2 64.7
333.6
15.2%
Year Ended December 31, 1999
$94.2 39.5% 57.0 7.7 7.7 $57.0
464.7 88.7
375.9
16.1%
Year Ended December 31, 2000
$92.4 39.0% 56.4 11.6 11.6 $56.4
484.1 93.8
390.3
14.7%
Year Ended December 31, 2001
$96.3 35.0% 62.6 12.5 12.5 $62.6
321.2 71.2
250.0
19.5%
Year Ended December 31, 2002
$104.7 36.5% 66.5 11.3 11.3 $66.5
316.8 84.3
232.5
27.6%
(a) Operating income and tax rate for the year ended December 31, 2001 have been adjusted to exclude the effect of a $22.7 million impairment charge related to the write-off of the company’s investment in Friendly Hotels.
Source: Choice Internal Data, December 2009
32
|
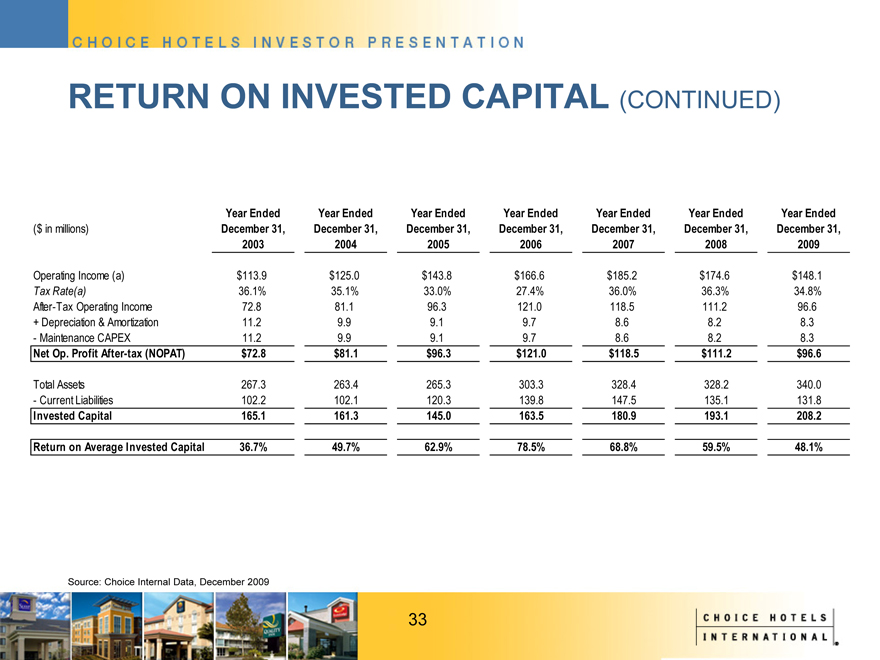
RETURN ON INVESTED CAPITAL (CONTINUED)
($ in millions)
Operating Income (a)
Tax Rate(a)
After-Tax Operating Income
+ Depreciation & Amortization
- Maintenance CAPEX
Net Op. Profit After-tax (NOPAT)
Total Assets
- Current Liabilities
Invested Capital
Return on Average Invested Capital
Year Ended December 31, 2003
$113.9 36.1% 72.8 11.2 11.2 $72.8
267.3 102.2
165.1
36.7%
Year Ended December 31, 2004
$125.0 35.1% 81.1 9.9 9.9 $81.1
263.4 102.1
161.3
49.7%
Year Ended December 31, 2005
$143.8 33.0% 96.3 9.1 9.1 $96.3
265.3 120.3
145.0
62.9%
Year Ended December 31, 2006
$166.6 27.4% 121.0 9.7 9.7 $121.0
303.3 139.8
163.5
78.5%
Year Ended December 31, 2007
$185.2 36.0% 118.5 8.6 8.6 $118.5
328.4 147.5
180.9
68.8%
Year Ended December 31, 2008
$174.6 36.3% 111.2 8.2 8.2 $111.2
328.2 135.1
193.1
59.5%
Year Ended December 31, 2009
$148.1 34.8% 96.6 8.3 8.3 $96.6
340.0 131.8
208.2
48.1%
Source: Choice Internal Data, December 2009
33
|
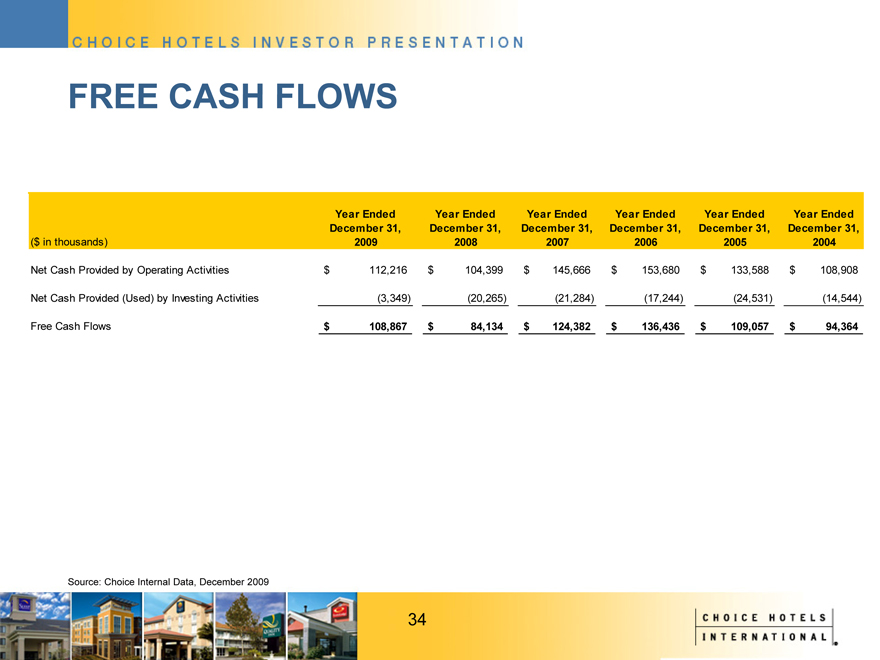
FREE CASH FLOWS
($ in thousands)
Net Cash Provided by Operating Activities Net Cash Provided (Used) by Investing Activities Free Cash Flows
Year Ended December 31, 2009
$ 112,216 (3,349) $ 108,867
Year Ended December 31, 2008
$ 104,399 (20,265) $ 84,134
Year Ended December 31, 2007
$ 145,666 (21,284) $ 124,382
Year Ended December 31, 2006
$ 153,680 (17,244) $ 136,436
Year Ended December 31, 2005
$ 133,588 (24,531) $ 109,057
Year Ended December 31, 2004
$ 108,908 (14,544) $ 94,364
Source: Choice Internal Data, December 2009
34
|
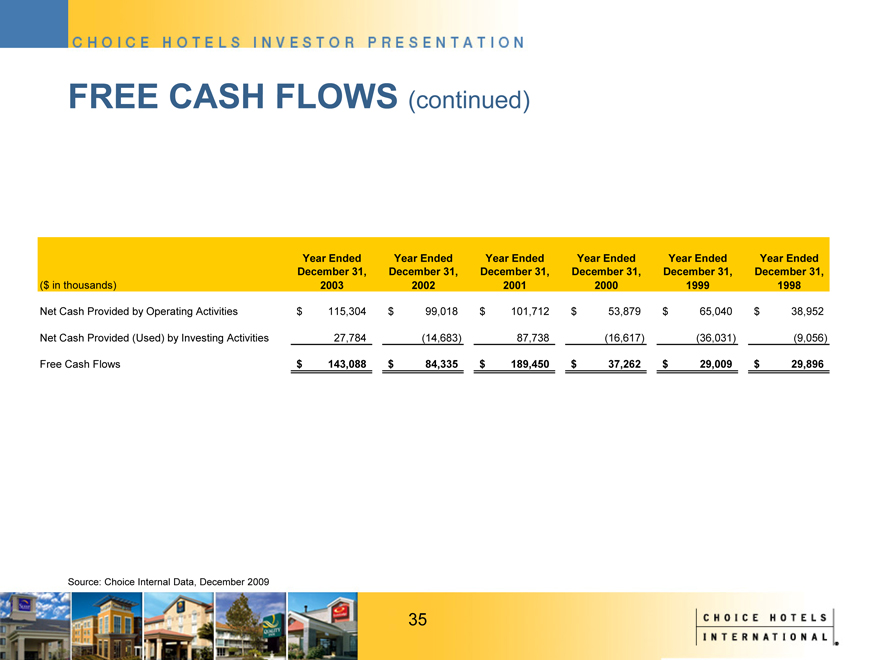
FREE CASH FLOWS (continued)
($ in thousands)
Net Cash Provided by Operating Activities Net Cash Provided (Used) by Investing Activities Free Cash Flows
Year Ended December 31, 2003
$ 115,304 27,784 $ 143,088
Year Ended December 31, 2002
$ 99,018 (14,683) $ 84,335
Year Ended December 31, 2001
$ 101,712 87,738 $ 189,450
Year Ended December 31, 2000
$ 53,879 (16,617) $ 37,262
Year Ended December 31, 1999
$ 65,040 (36,031) $ 29,009
Year Ended December 31, 1998
$ 38,952 (9,056) $ 29,896
Source: Choice Internal Data, December 2009
35
|
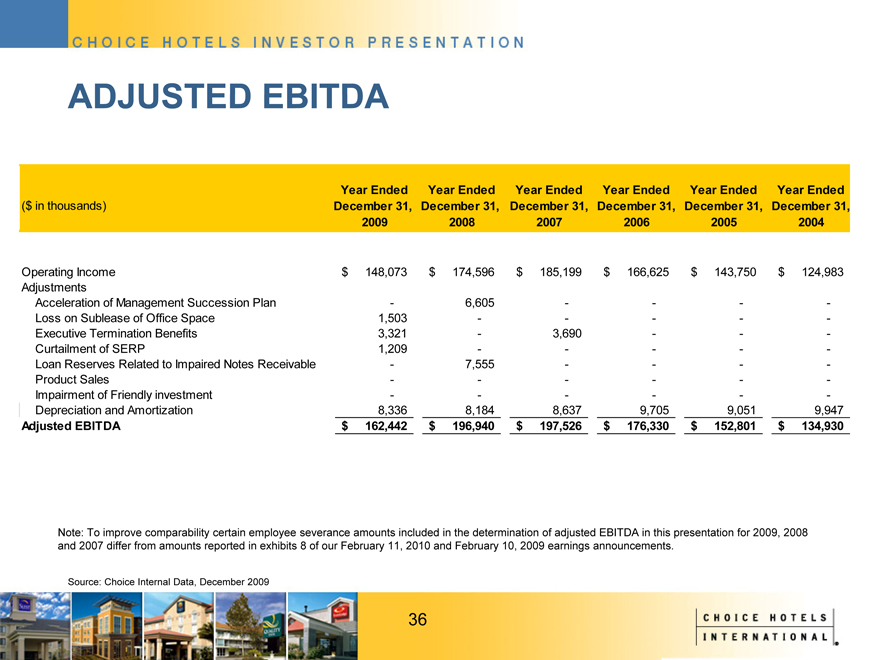
ADJUSTED EBITDA
($ in thousands)
Operating Income Adjustments
Acceleration of Management Succession Plan Loss on Sublease of Office Space Executive Termination Benefits Curtailment of SERP
Loan Reserves Related to Impaired Notes Receivable Product Sales Impairment of Friendly investment Depreciation and Amortization
Adjusted EBITDA
Year Ended December 31, 2009
$ 148,073
- 1,503 3,321 1,209 - - - 8,336 $ 162,442
Year Ended December 31, 2008
$ 174,596
6,605 - - - 7,555 - - 8,184 $ 196,940
Year Ended December 31, 2007
$ 185,199
- - 3,690 - - - - 8,637 $ 197,526
Year Ended December 31, 2006
$ 166,625
- - - - - - - 9,705 $ 176,330
Year Ended December 31, 2005
$ 143,750
- - - - - - - 9,051 $ 152,801
Year Ended December 31, 2004
$ 124,983
- - - - - - - 9,947 $ 134,930
Note: To improve comparability certain employee severance amounts included in the determination of adjusted EBITDA in this presentation for 2009, 2008 and 2007 differ from amounts reported in exhibits 8 of our February 11, 2010 and February 10, 2009 earnings announcements.
Source: Choice Internal Data, December 2009
36
|
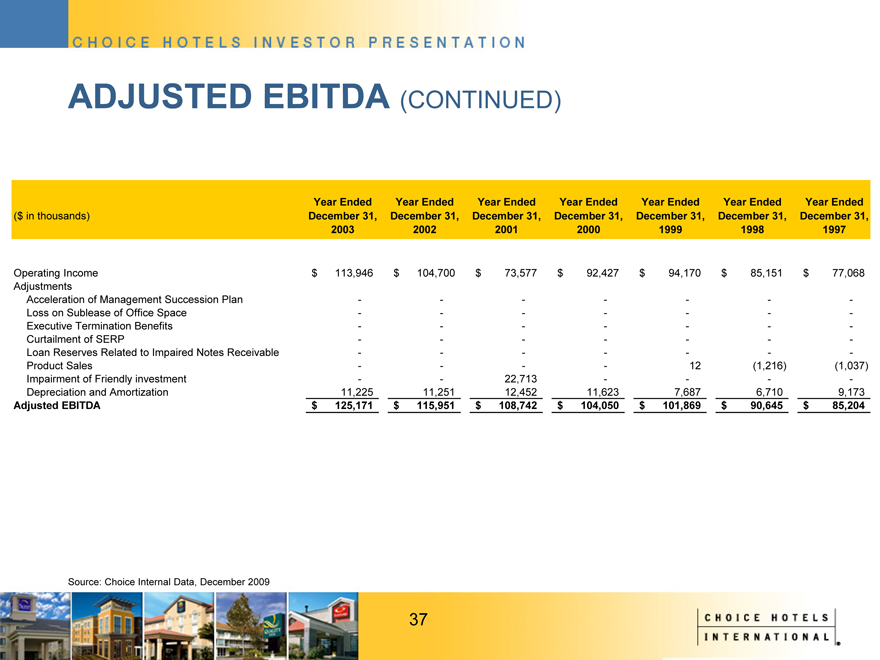
ADJUSTED EBITDA (CONTINUED)
($ in thousands)
Operating Income Adjustments
Acceleration of Management Succession Plan Loss on Sublease of Office Space Executive Termination Benefits Curtailment of SERP
Loan Reserves Related to Impaired Notes Receivable Product Sales Impairment of Friendly investment Depreciation and Amortization
Adjusted EBITDA
Year Ended December 31, 2003
$ 113,946
- - - - - - - 11,225 $ 125,171
Year Ended December 31, 2002
$ 104,700
- - - - - - - 11,251 $ 115,951
Year Ended December 31, 2001
$ 73,577
- - - - - - 22,713 12,452 $ 108,742
Year Ended December 31, 2000
$ 92,427
- - - - - - - 11,623 $ 104,050
Year Ended December 31, 1999
$ 94,170
- - - - - 12 - 7,687 $ 101,869
Year Ended December 31, 1998
$ 85,151
- - - - - (1,216) - 6,710 $ 90,645
Year Ended December 31, 1997
$ 77,068
- - - - - (1,037) - 9,173 $ 85,204
Source: Choice Internal Data, December 2009
37
|
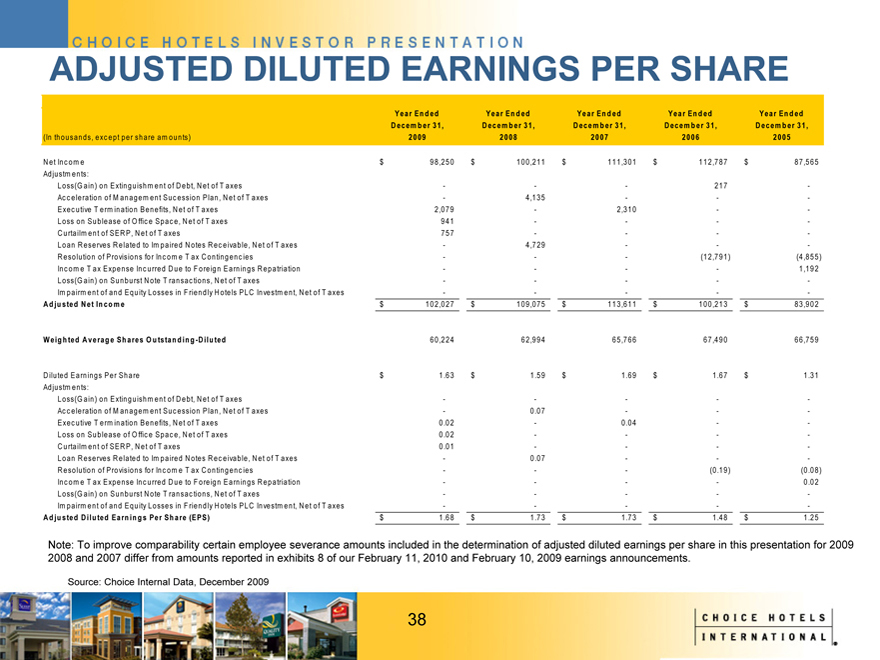
ADJUSTED DILUTED EARNINGS PER SHARE
(In thousands, except per share amounts)
Year Ended December 31, 2009
Year Ended December 31, 2008
Year Ended December 31, 2007
Year Ended December 31, 2006
Year Ended December 31, 2005
Net Income
$98,250
$100,211
$111,301
$112,787
$87,565
Adjustments:
Loss(Gain) on Extinguishment of Debt, Net of Taxes
217
Acceleration of Management Sucession Plan, Net of Taxes
4,135
Executive Termination Benefits, Net of Taxes
2,079
2,310
Loss on Sublease of Office Space, Net of Taxes
941
Curtailment of SERP, Net of Taxes
757
Loan Reserves Related to Impaired Notes Receivable, Net of Taxes
4,729
Resolution of Provisions for Income Tax Contingencies
(12,791)
(4,855)
Income Tax Expense Incurred Due to Foreign Earnings Repatriation
1,192
Loss(Gain) on Sunburst Note Transactions, Net of Taxes
Impairment of and Equity Losses in Friendly Hotels PLC Investment, Net of Taxes
Adjusted Net Income
$102,027
$109,075
$113,611
$100,213
$83,902
Weighted Average Shares Outstanding-Diluted
60,224
62,994
65,766
67,490
66,759
Diluted Earnings Per Share
$1.63
$1.59
$1.69
$1.67
$1.31
Adjustments:
Loss(Gain) on Extinguishment of Debt, Net of Taxes
Acceleration of Management Sucession Plan, Net of Taxes
0.07
Executive Termination Benefits, Net of Taxes
0.02
0.04
Loss on Sublease of Office Space, Net of Taxes
0.02
Curtailment of SERP, Net of Taxes
0.01
Loan Reserves Related to Impaired Notes Receivable, Net of Taxes
0.07
Resolution of Provisions for Income Tax Contingencies
(0.19)
(0.08)
Income Tax Expense Incurred Due to Foreign Earnings Repatriation
0.02
Loss(Gain) on Sunburst Note Transactions, Net of Taxes
Impairment of and Equity Losses in Friendly Hotels PLC Investment, Net of Taxes
Adjusted Diluted Earnings Per Share (EPS)
$1.68
$1.73
$1.73
$1.48
$1.25
Note: To improve comparability certain employee severance amounts included in the determination of adjusted diluted earnings per share in this presentation for 2009 2008 and 2007 differ from amounts reported in exhibits 8 of our February 11, 2010 and February 10, 2009 earnings announcements.
Source: Choice Internal Data, December 2009
38
|
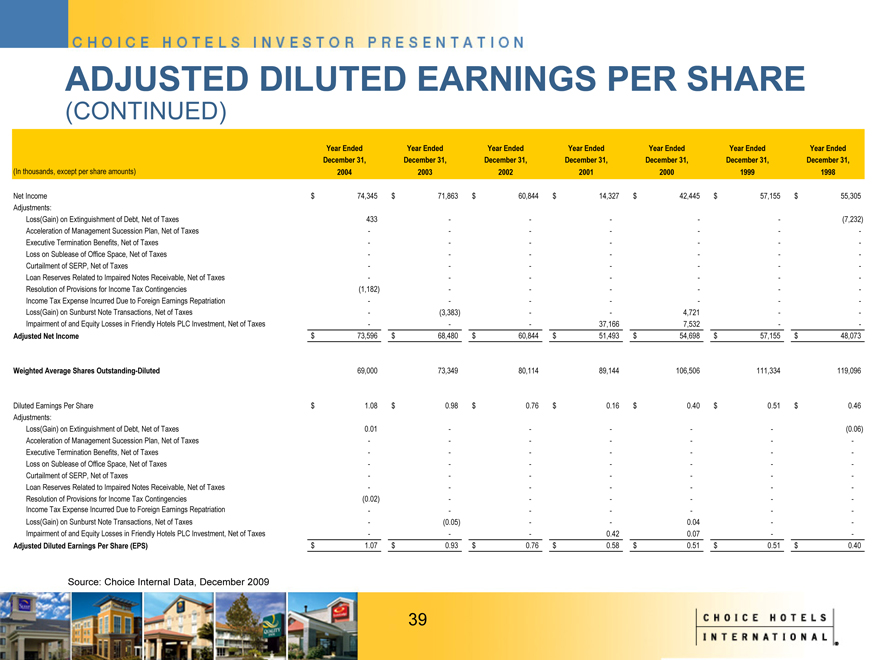
ADJUSTED DILUTED EARNINGS PER SHARE
(CONTINUED)
(In thousands, except per share amounts)
Year Ended December 31, 2004
Year Ended December 31, 2003
Year Ended December 31, 2002
Year Ended December 31, 2001
Year Ended December 31, 2000
Year Ended December 31, 1999
Year Ended December 31, 1998
Net Income
$74,345
$71,863
$60,844
$14,327
$42,445
$57,155
$55,305
Adjustments:
Loss(Gain) on Extinguishment of Debt, Net of Taxes
433
(7,232)
Acceleration of Management Sucession Plan, Net of Taxes
Executive Termination Benefits, Net of Taxes
Loss on Sublease of Office Space, Net of Taxes
Curtailment of SERP, Net of Taxes
Loan Reserves Related to Impaired Notes Receivable, Net of Taxes
Resolution of Provisions for Income Tax Contingencies
(1,182)
Income Tax Expense Incurred Due to Foreign Earnings Repatriation
Loss(Gain) on Sunburst Note Transactions, Net of Taxes
(3,383)
4,721
Impairment of and Equity Losses in Friendly Hotels PLC Investment, Net of Taxes
37,166
7,532
Adjusted Net Income
$73,596
$68,480
$60,844
$51,493
$54,698
$57,155
$48,073
Weighted Average Shares Outstanding-Diluted
69,000
73,349
80,114
89,144
106,506
111,334
119,096
Diluted Earnings Per Share
$1.08
$0.98
$0.76
$0.16
$0.40
$0.51
$0.46
Adjustments:
Loss(Gain) on Extinguishment of Debt, Net of Taxes
0.01
(0.06)
Acceleration of Management Sucession Plan, Net of Taxes
Executive Termination Benefits, Net of Taxes
Loss on Sublease of Office Space, Net of Taxes
Curtailment of SERP, Net of Taxes
Loan Reserves Related to Impaired Notes Receivable, Net of Taxes
Resolution of Provisions for Income Tax Contingencies
(0.02)
Income Tax Expense Incurred Due to Foreign Earnings Repatriation
Loss(Gain) on Sunburst Note Transactions, Net of Taxes
(0.05)
0.04
Impairment of and Equity Losses in Friendly Hotels PLC Investment, Net of Taxes
0.42
0.07
Adjusted Diluted Earnings Per Share (EPS)
$1.07
$0.93
$0.76
$0.58
$0.51
$0.51
$0.40
Source: Choice Internal Data, December 2009
39