 Deutsche Bank 2012 Leveraged Finance Conference Exhibit 99.1 |
 2 Disclaimer Investor Presentation Certain matters discussed throughout all of this presentation constitute forward-looking statements within the meaning of the federal securities laws. Generally, our use of words such as “expect,” “estimate,” “believe,” “anticipate,” “will,” “forecast,” “plan,” “project,” “assume” or similar words of futurity identify statements that are forward-looking and that we intend to be included within the Safe Harbor protections provided by Section 27A of the Securities Act of 1933, as amended, and Section 21E of the Securities Exchange Act of 1934, as amended. Such forward-looking statements are based on management’s current beliefs, assumptions and expectations regarding future events, which in turn are based on information currently available to management. Such statements may relate to, among other things, market trends, the Company’s financial position, business strategy, projected plans and objectives of management for future operations. We caution you not to place undue reliance on any forward-looking statements, which are made as of the date of this presentation. Forward-looking statements do not guarantee future performance and involve known and unknown risks, uncertainties and other factors. Several factors could cause actual results, performance or achievements of the company to differ materially from those expressed in or contemplated by the forward-looking statements. Such risks include, but are not limited to, changes to general, domestic and foreign economic conditions; operating risks common in the lodging and franchising industries; risks associated with acquisitions and development of new brands; changes to the desirability of our brands as viewed by hotel operators and customers; changes to the terms or termination of our contracts with franchisees; deterioration in the financial condition of franchisees; our ability to keep pace with improvements in technology utilized for reservations systems and other operating systems; decrease in brand loyalty due to increasing use of internet reservation channels; fluctuations in the supply and demand for hotel rooms; and our ability to effectively manage our indebtedness. These and other risk factors are discussed in detail in the Risk Factors section of the company’s Form 10-K for the year ended December 31, 2011, filed with the Securities and Exchange Commission on February 29, 2012. We undertake no obligation to publicly update or revise any forward-looking statement, whether as a result of new information, future events or otherwise. |
 3 Investor Presentation Company overview |
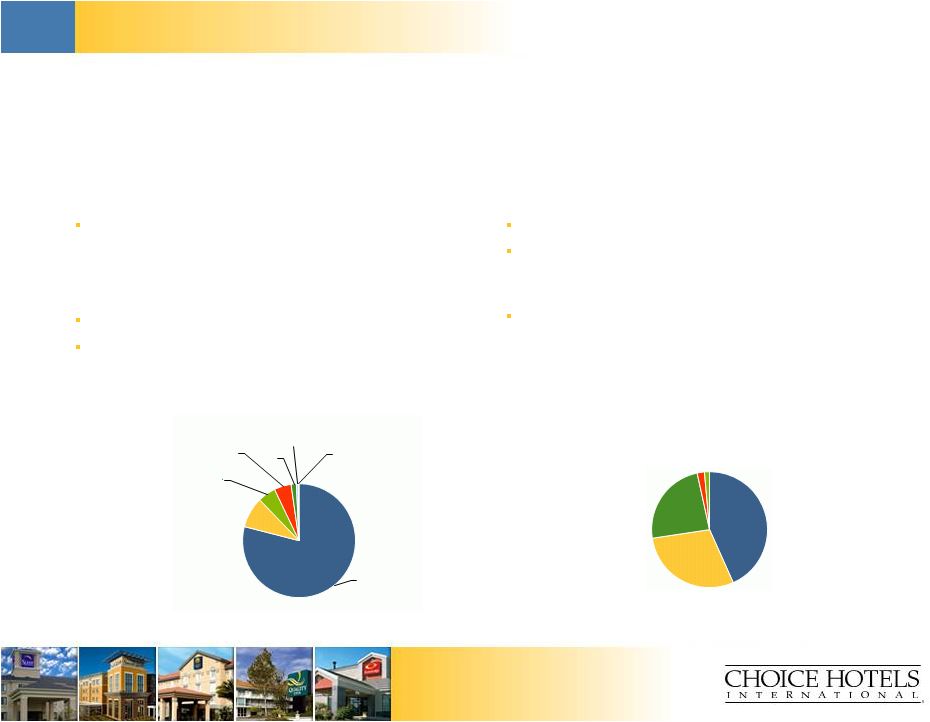 4 Investor Presentation Choice Hotels overview Growing US hotel market share* – 9.6% share of branded US hotels (+60 basis points over trailing 5 years)* – 2 largest U.S. hotelier Well-known, diversified brands Global pipeline of 453 hotels Stable, profitable, long-term growth throughout economic cycles Cumulative free cash flows of ~$1.4 billion since 1997 – 100% returned to shareholders through share repurchases and dividends Capital “light” model generates strong after-tax returns on invested capital Strong, growing, global hotel franchising business Highly attractive business model with strong financial returns Chain scale mix by rooms (Domestic Q2 2012) Geographic property distribution by rooms (Q2 2012) Source: Choice Internal Data as of June 30, 2012 * Based on number of hotels as June 30, 2012 (Smith Travel Research) Upper midscale 43% Midscale 29% Economy 24% Extended Upscale Stay 2% 2% United States & Caribbean 79.0% Europe 8.8% Canada 5.1% Asia Pacific 4.8% South America 1.5% Mexico 0.5% Central America 0.3% nd |
 5 Investor Presentation Diversified global footprint* Source: Choice internal data *As of June 30, 2012. The Company includes its Caribbean properties within domestic operating statistics. Canada Hotels open 308 Hotels under development 37 Rooms open & under dev. 28,407 United States & Caribbean Hotels open Hotels under development Rooms open & under dev. Mexico Hotels open Hotels under development Rooms open & under dev. Central America Hotels open Hotels under development Rooms open & under dev. Middle East Hotels open Hotels under development Rooms open & under dev. South America Hotels open Hotels under development Rooms open & under dev. Europe Hotels open Hotels under development Rooms open & under dev. Asia Pacific Hotels open Hotels under development Rooms open & under dev. 5,024 378 423,968 22 2 2,522 15 5 1,945 1 0 70 59 3 7,917 416 15 45,374 354 13 25,014 |
 6 Investor Presentation Investor Presentation Brand Number of properties Number of rooms Occupancy (%) Average daily room rate (ADR) RevPAR Upscale 52 4,652 61.5% $113.84 $70.03 19 2,221 NA NA NA Upper Midscale 1,379 107,895 58.7% 80.36 47.20 608 46,903 60.6% 84.30 51.08 189 27,534 48.1% 74.30 35.71 Midscale 391 28,327 55.3% 70.89 39.17 1,082 93,655 51.0% 68.47 34.89 Extended Stay 40 3,083 70.4% 67.47 47.50 62 7,260 68.5% 40.58 27.80 Economy 801 49,114 48.2% 55.03 26.52 401 22,671 50.1% 52.38 26.22 Total / Average 5,024 393,315 54.8% $72.58 $39.73 International 1,175 104,522 Total 6,199 497,837 Portfolio overview Note: Number of properties and rooms as of June 30, 2012, all other statistics are LTM as of 6/30/2012 Source: Company’s public filings, management data |
 7 Investor Presentation Investor Presentation Franchise portfolio growth Worldwide hotels* Domestic pipeline* Worldwide unit growth has increased at a CAGR of 1% since Q2 2010 Executed a total of 170 new domestic hotel franchise contracts in Q1 & Q2 2012 Current domestic pipeline consists of 378 hotels representing 30,653 rooms 235 hotels under construction or awaiting development 143 hotels awaiting conversion * As of June 30, 2012 Source: Company’s public filings 6,074 6,091 6,142 6,128 6,117 6,138 6,178 6,174 6,199 Q2 2010 Q3 2010 Q4 2010 Q1 2011 Q2 2011 Q3 2011 Q4 2011 Q1 2012 Q2 2012 26 13 84 65 41 42 15 23 16 21 32 New Construction Conversion Midscale Extended Stay Economy Upscale |
 Investor Presentation 8 Investor Presentation Strategy for Choice’s brands, growth and shareholders Improve and Grow Brands – Increase portfolio profitability of the Comfort brand family – Refresh Sleep Inn to improve long-term brand growth potential – Capture Greater Share of Reservations Via Central Channels – – Continue to enhance ChoiceHotels.com to increase traffic and conversion – Continue balanced debt and shareholder capital allocation policies – Leverage financial capacity/strength to support expansion of emerging brands – Evaluate opportunities to enter new segments – Invest in IT infrastructure to shore up value proposition for international properties Invest in and expand emerging brands/segments – Cambria, Ascend, International Grow Choice Privileges loyalty program – target 2.0 million new members in 2012 Allocate Free Cash Flows To “Best And Highest” Use |
 9 Investor Presentation Investment highlights |
 10 Investor Presentation Investor Presentation Investment highlights Asset light franchising model with strong returns on investment Strong and growing brand awareness Established hotel franchising platform with global scale Resilient fee-for service business model with stable cash flows Strong, growing loyalty program Effective central reservation system Strong pipeline expected to continue to grow as global economy improves |
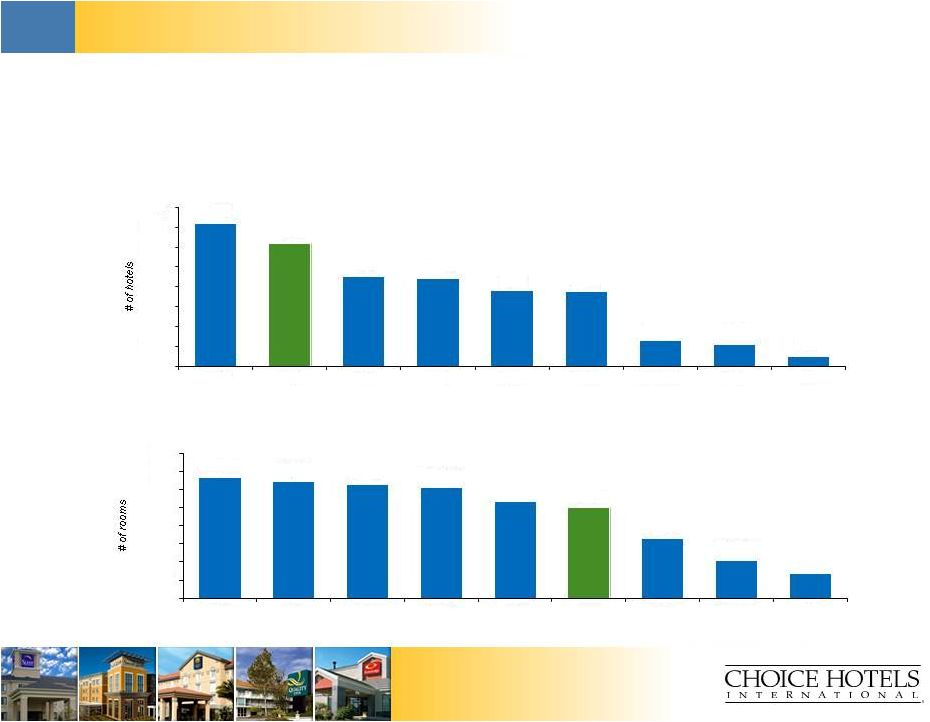 11 Investor Presentation Investor Presentation Established hotel franchising platform with global scale One of the largest hoteliers… … with a significant number of rooms in the portfolio 7,170 6,199 4,542 4,426 3,800 3,748 1,319 1,112 492 0 1,000 2,000 3,000 4,000 5,000 6,000 7,000 8,000 WYN CHH IHG ACC Hilton MAR Carlson HOT H 666,873 646,110 630,000 608,300 531,714 497,837 327,813 208,500 135,327 0 100,000 200,000 300,000 400,000 500,000 600,000 700,000 800,000 IHG MAR Hilton WYN ACC CHH HOT Carlson H Source: Various public companies’ filings as of June 30, 2012, except for ACC and Carlson, which are as of December 31, 2011 |
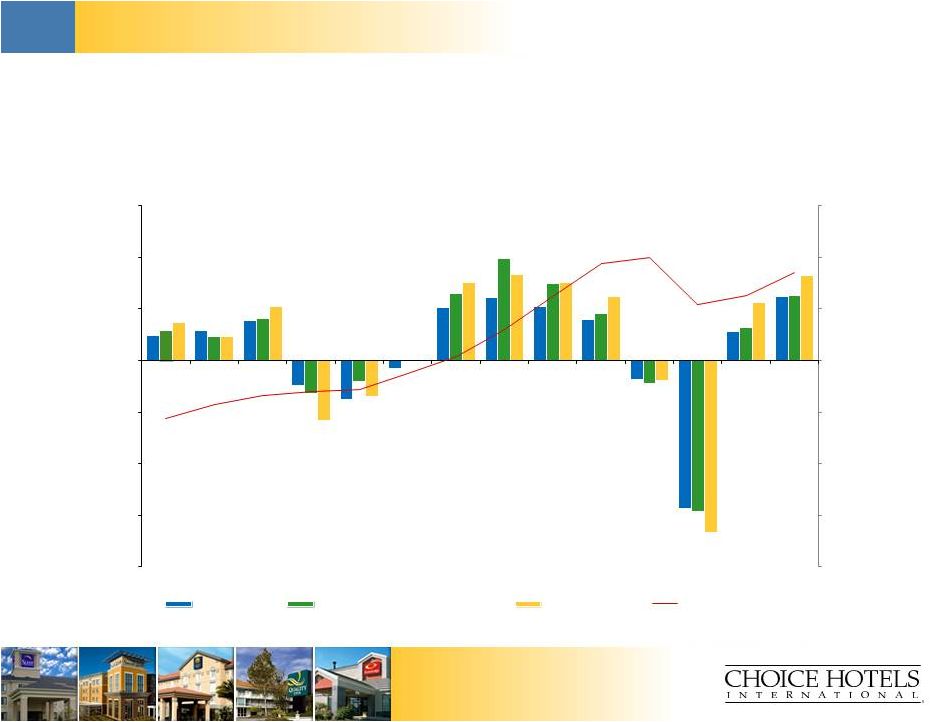 12 Investor Presentation Resilient fee-for-service business model with stable cash flows ($ in millions) Source: Smith Travel Research, Management data, December 2011 $0 $50 $100 $150 $200 $250 $300 $350 (20.0%) (15.0%) (10.0%) (5.0%) 0.0% 5.0% 10.0% 15.0% 1998 1999 2000 2001 2002 2003 2004 2005 2006 2007 2008 2009 2010 2011 CHH RevPAR STR Chain Scale (Supply Weighted) Industry RevPAR CHH Franchising Revenue |
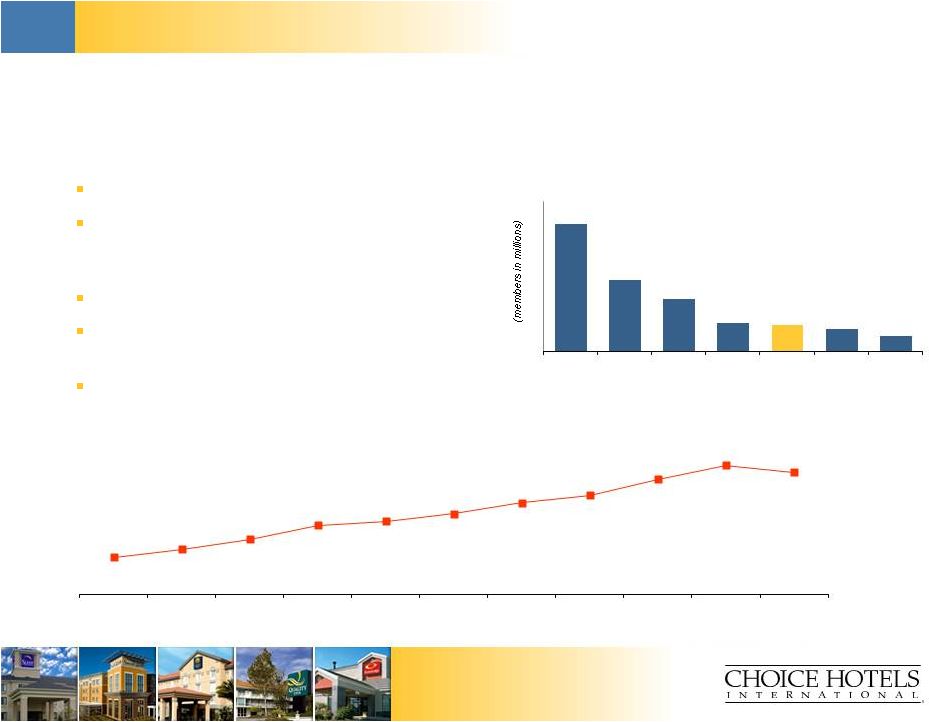 13 Investor Presentation Strong, growing loyalty program Choice Privileges revenue as percent of domestic gross room revenues* Source: Management Data, December 31, 2011, Company’s public filings * 2001-2008 Data Excludes Econo Lodge and Rodeway Inn brands Comprehensive loyalty rewards program 14 million members worldwide – contribute over ¼ of domestic gross room revenues 2.1 million new members added in 2011 Delivers incremental business to all Choice brand hotels Important selling point for franchise sales Loyalty program 68 38 28 15 14 12 8 IHG MAR WYN HOT CHH H ACC 8.3% 10.0% 12.2% 15.3% 16.2% 17.9% 20.3% 22.0% 25.6% 28.7% 27.1% 2001 2002 2003 2004 2005 2006 2007 2008 2009 2010 2011 |
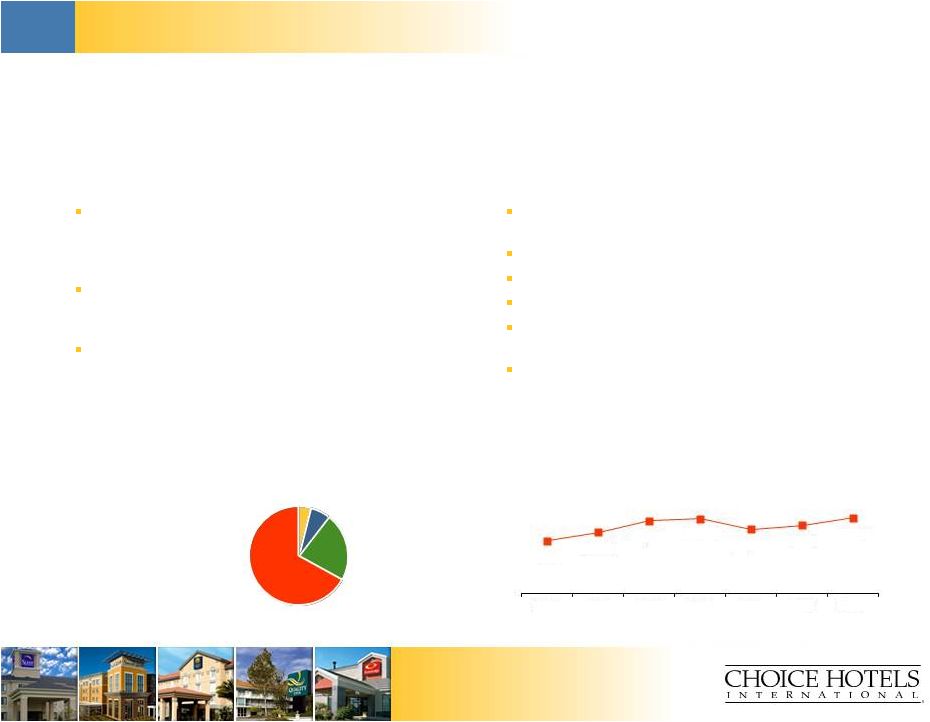 14 Investor Presentation Investor Presentation Effective marketing and central reservation system Consists of the telephone reservation system, proprietary internet site, mobile phone applications, global distribution systems and other internet reservation sites Central Reservation System (“CRS”) provides a data link to the Company’s franchised properties and to airline reservation systems Offers rooms for sale on the Company’s own internet site, as well as other travel companies Expertise and innovation in on-line, targeted interactive marketing to influence guest hotel stay decisions Powerful advertising campaigns Focus on driving guests to Choice central channels Facilitate “one-stop” shopping Reservation agents can match each caller with a Choice-branded hotel $300-plus million in annual marketing and reservation spending Description Size, scale and distribution Domestic franchise system gross room revenue source Domestic Choice CRS net room revenue Source: Company’s public filings as of December 31, 2011, Management data Travel agent (GDS) 4% Voice (call centers) 7% Internet 22% Direct Reservation 67% $1,161 $1,342 $1,596 $1,638 $1,410 $1,501 $1,660 2005 2006 2007 2008 2009 2010 2011 |
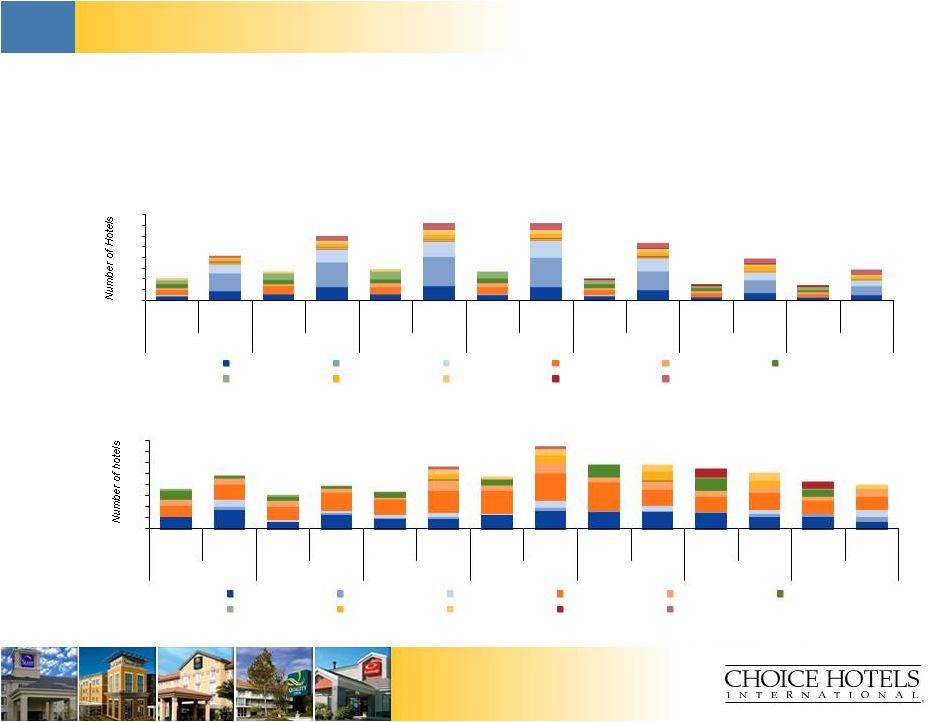 15 Investor Presentation Investor Presentation Strong pipeline expected to continue to grow as the global economy improves Historical international pipeline Source: Company’s public filings, Management data Historical domestic pipeline 0 100 200 300 400 500 600 700 800 Conv. New Const. Conv. New Const. Conv. New Const. Conv. New Const. Conv. New Const. Conv. New Const. Conv. New Const. 2005 2006 2007 2008 2009 2010 2011 Comfort Inn Comfort Suites Sleep Quality Clarion Econo Lodge Rodeway MainStay Suburban Ascend Collection Cambria Suites 190 413 258 602 276 264 194 136 728 723 533 380 131 277 0 10 20 30 40 50 60 70 80 Conv. New Const. Conv. New Const. Conv. New Const. Conv. New Const. Conv. New Const. Conv. New Const. Conv. New Const. 2005 2006 2007 2008 2009 2010 2011 Comfort Inn Comfort Suites Sleep Quality Clarion Econo Lodge Rodeway MainStay Suburban Ascend Collection Cambria Suites 36 48 31 39 33 47 58 54 56 74 58 51 42 40 |
 16 Investor Presentation Investor Presentation Asset light franchising model with strong returns on investment Capital light model generates strong after-tax returns on invested capital Virtually 100% of the properties are franchised* * The Company owns three MainStay Suites hotels that it holds for strategic purposes. Source: Company’s public filings, Management data 0% 20% 40% 60% 80% 100% 100% 94% 86% 67% 46% 25% 38% 6% 14% 31% 48% 56% 15% 1% 5% 19% 47% CHH WYN IHG MAR HOT H ACC Franchised Managed Owned / Leased 15.2% 16.1% 14.7% 19.5% 27.6% 36.7% 49.7% 62.9% 78.5% 68.8% 59.5% 48.1% 48.0% 47.2% 1998 1999 2000 2001 2002 2003 2004 2005 2006 2007 2008 2009 2010 2011 |
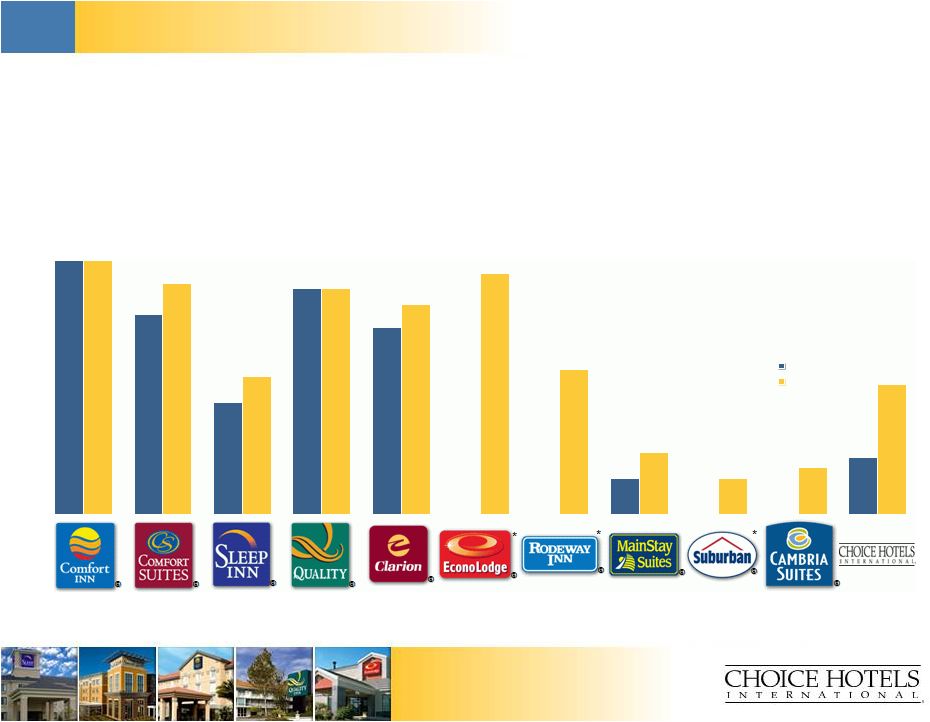 17 Investor Presentation Strong and growing brand awareness Source: Percentage of survey respondents. Millward Brown, December 2011. * Econo Lodge, Rodeway Inn and Suburban Extended Stay measured among economy hotel users. 98% 77% 43% 87% 72% NA NA 14% NA NA 22% 98% 89% 53% 87% 81% 93% 56% 24% 14% 18% 50% 2001 2011 |
 18 Investor Presentation Financial overview |
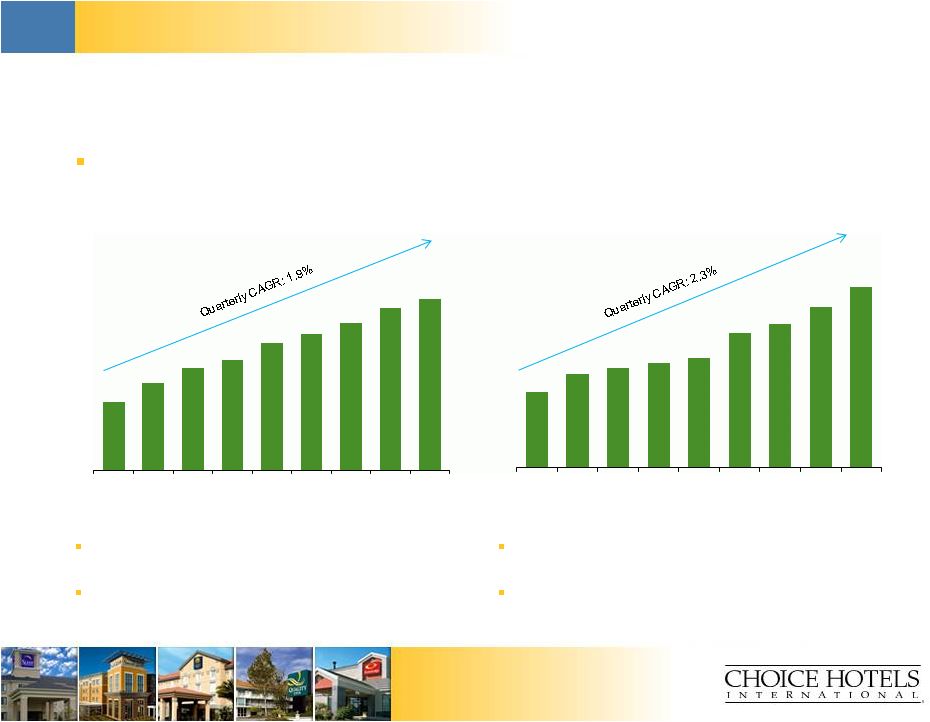 19 Investor Presentation Investor Presentation Choice’s franchise business model provides stable, growing cash flows, driven primarily through unit expansion and RevPAR growth Recent performance LTM Revenue LTM Adjusted EBITDA Choice has experienced consistent revenue growth over the past eight quarters Revenues have increased by 17.2% since Q2 2010 EBITDA margins have increased by 156 bps since Q2 2010 Domestic and international unit growth and improvement in operating performance continues to drive profitability ($ in millions) Source: Company’s public filings Q2 2010 Q3 2010 Q4 2010 Q1 2011 Q2 2011 Q3 2011 Q4 2011 Q1 2012 Q2 2012 Q2 2010 Q3 2010 Q4 2010 Q1 2011 Q2 2011 Q3 2011 Q4 2011 Q1 2012 Q2 2012 $563.9 $581.8 $596.1 $603.9 $619.4 $627.9 $638.8 $652.7 $661.0 $163.5 $169.1 $170.9 $172.3 $173.9 $181.5 $184.3 $189.6 $195.9 |
 20 Investor Presentation Investor Presentation Historical operating metrics RevPAR & occupancy Total worldwide rooms Source: Company’s public filings $41.75 $40.98 $35.18 $36.18 $38.44 $39.73 57.9% 55.3% 49.4% 51.3% 53.5% 54.8% 44.0% 46.0% 48.0% 50.0% 52.0% 54.0% 56.0% 58.0% 60.0% $- $10 $20 $30 $40 $50 $60 2007 2008 2009 2010 2011 LTM Q2 2012 RevPAR (domestic) Occupancy (domestic) 452,027 472,526 487,410 495,145 497,205 497,837 420,000 440,000 460,000 480,000 500,000 2007 2008 2009 2010 2011 LTM Q2 2012 |
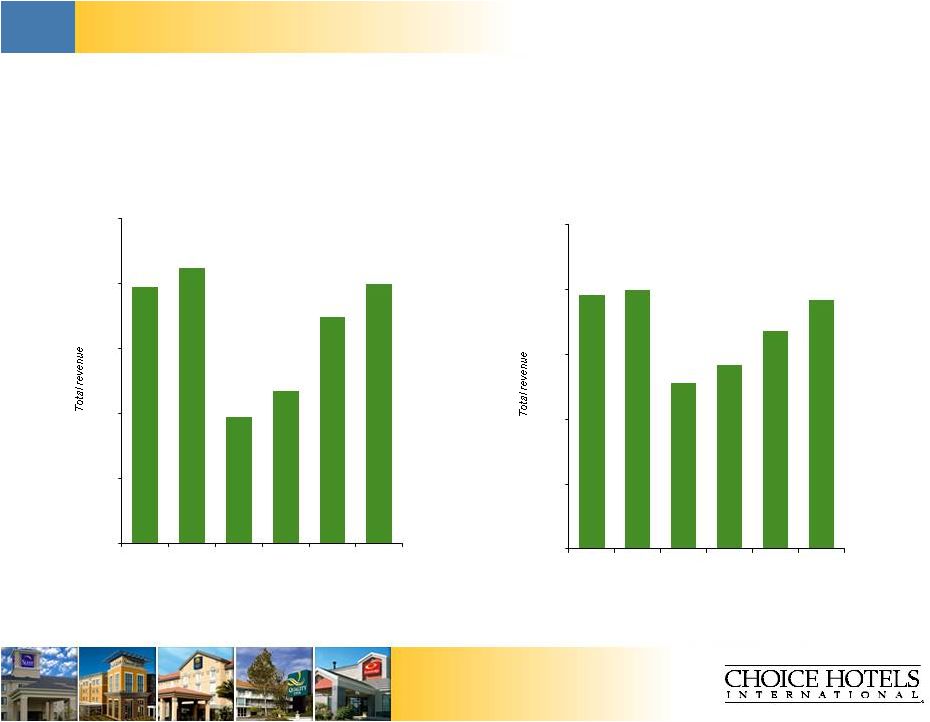 21 Investor Presentation Investor Presentation Historical financial overview Revenue* Adjusted EBITDA *Excludes marketing and reservation revenues ($ in millions) $299 $305 $259 $267 $290 $300 $220 $240 $260 $280 $300 $320 2007 2008 2009 2010 2011 LTM Q2 2012 $198 $200 $164 $171 $184 $196 $100 $125 $150 $175 $200 $225 2007 2008 2009 2010 2011 LTM Q2 2012 Source: Company’s public filings |
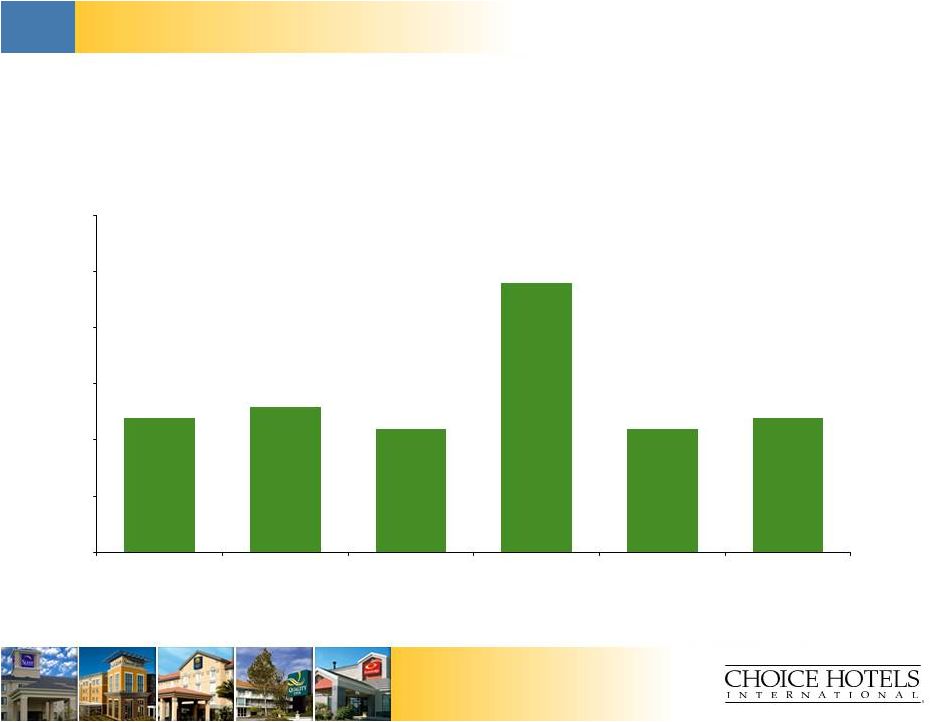 22 Investor Presentation Investor Presentation Historical capital expenditure overview ($ in millions) $12 $13 $11 $24 $11 $12 $0 $5 $10 $15 $20 $25 $30 2007 2008 2009 2010* 2011 LTM Q2 2012 *The spike in 2010 was due to the Company leasing extra space for a new technology center in Phoenix, AZ. Source: Company’s public filings |
 Investor Presentation 23 Investor Presentation Pro forma capitalization – $600 million Special Cash Dividend ($ in millions) Pro forma capitalization As of Mult LTM Pro forma Mult LTM 6/30/2012 Adjusted EBITDA Adjustments 6/30/2012 Adjusted EBITDA Total cash and equivalents $485.4 ($396.1) $89.3 New revolver -- 0.0x $53.9 $53.9 0.3x Term Loan A -- 0.0x 150.0 150.0 0.8x Total secured debt -- 0.0x $200.0 1.1x Existing revolver $ -- $ -- Existing senior notes 250.0 1.3x 250.0 1.3x New senior unsecured notes 400.0 2.0x 400.0 2.0x Other debt 2.4 0.0x 2.6 0.0x Total debt $652.4 3.3x $852.6 4.4x LTM Adjusted EBITDA $195.9 -- $195.9 Interest expense 13.1 $32.5 45.6 Capital expenditures 12.1 -- 12.1 Credit metrics Total debt / Adjusted EBITDA 3.3x 4.4x Net debt / Adjusted EBITDA 0.9x 3.9x Adjusted EBITDA / int. exp. 15.0x 4.3x (Adjusted EBITDA - capex) / int. exp 14.0x 4.0x |
 24 Investor Presentation Questions and answers |
 25 Investor Presentation DISCLAIMER Adjusted earnings before interest, taxes depreciation and amortization (EBITDA), return on average invested capital (ROIC) and free cash flows are non-GAAP financial measurements. These financial measurements are presented as supplemental disclosures because they are used by management in reviewing and analyzing the company’s performance. This information should not be considered as an alternative to any measure of performance as promulgated under accounting principles generally accepted in the United States (GAAP), such as operating income, net income, diluted earnings per share, total revenues or net cash provided by operating activities. The calculation of these non-GAAP measures may be different from the calculation by other companies and therefore comparability may be limited. The company has included the following appendix which reconcile these measures to the comparable GAAP measurement. |
 Investor Presentation 26 FRANCHISING REVENUES Source: Choice Internal Data, December 2011 ($ amounts in thousands) Year Ended Year Ended Year Ended Year Ended Year Ended Year Ended Year Ended December 31, December 31, December 31, December 31, December 31, December 31, December 31, 2011 2010 2009 2008 2007 2006 2005 Total Revenues 638,793 $ 596,076 $ 564,178 $ 641,680 $ 615,494 $ 539,903 $ 472,098 $ Adjustments: Marketing and Reservation (349,036) (329,246) (305,379) (336,477) (316,827) (273,267) (237,822) Product Sales - - - - - - - Hotel Operations (4,356) (4,031) (4,140) (4,936) (4,692) (4,505) (4,293) Franchising Revenues 285,401 $ 262,799 $ 254,659 $ 300,267 $ 293,975 $ 262,131 $ 229,983 $ |
  27 Investor Presentation FRANCHISING REVENUES (Continued) Source: Choice Internal Data, December 2011 ($ amounts in thousands) Year Ended Year Ended Year Ended Year Ended Year Ended Year Ended Year Ended December 31, December 31, December 31, December 31, December 31, December 31, December 31, 2004 2003 2002 2001 2000 1999 1998 Total Revenues 428,208 $ 385,866 $ 365,562 $ 341,428 $ 352,841 $ 324,203 $ 165,474 $ Adjustments: Marketing and Reservation (220,732) (195,219) (190,145) (168,170) (185,367) (162,603) - Product Sales - - - - - (3,871) (20,748) Hotel Operations (3,729) (3,565) (3,331) (3,215) (1,249) - (1,098) Franchising Revenues 203,747 $ 187,082 $ 172,086 $ 170,043 $ 166,225 $ 157,729 $ 143,628 $ |
 28 Investor Presentation RETURN ON INVESTED CAPITAL (a) Operating income and tax rate for the year ended December 31, 2001 have been adjusted to exclude the effect of a $22.7 million impairment charge related to the write-off of the company’s investment in Friendly Hotels. Source: Choice Internal Data, December 2011 Year Ended Year Ended Year Ended Year Ended Year Ended Year Ended Year Ended December 31, December 31, December 31, December 31, December 31, December 31, December 31, ($ in thousands) 2011 2010 2009 2008 2007 2006 2005 Operating Income (a) $171.9 $160.8 $148.1 $174.6 $185.2 $166.6 $143.8 Tax Rate(a) 30.1% 32.1% 34.8% 36.3% 36.0% 27.4% 33.0% After-Tax Operating Income 120.2 109.2 96.6 111.2 118.5 121.0 96.3 + Depreciation & Amortization 8.0 8.3 8.3 8.2 8.6 9.7 9.1 - Maintenance CAPEX 8.0 8.3 8.3 8.2 8.6 9.7 9.1 Net Op. Profit After-tax (NOPAT) $120.2 $109.2 $96.6 $111.2 $118.5 $121.0 $96.3 Total Assets $447.7 $411.7 $340.0 $328.2 $328.4 $303.3 $265.3 - Current Liabilities 184.6 165.3 131.8 135.1 147.5 139.8 120.3 Invested Capital $263.1 $246.4 $208.2 $193.1 $180.9 $163.5 $145.0 Return on Average Invested Capital 47.2% 48.0% 48.1% 59.5% 68.8% 78.5% 62.9% |
  29 Investor Presentation RETURN ON INVESTED CAPITAL (Continued) (a) Operating income and tax rate for the year ended December 31, 2001 have been adjusted to exclude the effect of a $22.7 million impairment charge related to the write-off of the company’s investment in Friendly Hotels. Source: Choice Internal Data, December 2011 Year Ended Year Ended Year Ended Year Ended Year Ended Year Ended Year Ended December 31, December 31, December 31, December 31, December 31, December 31, December 31, ($ in thousands) 2004 2003 2002 2001 2000 1999 1998 Operating Income (a) $125.0 $113.9 $104.7 $96.3 $92.4 $94.2 $85.2 Tax Rate(a) 35.1% 36.1% 36.5% 35.0% 39.0% 39.5% 41.7% After-Tax Operating Income 81.1 72.8 66.5 62.6 56.4 57.0 49.7 + Depreciation & Amortization 9.9 11.2 11.3 12.5 11.6 7.7 6.7 - Maintenance CAPEX 9.9 11.2 11.3 12.5 11.6 7.7 6.7 Net Op. Profit After-tax (NOPAT) $81.1 $72.8 $66.5 $62.6 $56.4 $57.0 $49.7 Total Assets $263.4 $267.3 $316.8 $321.2 $484.1 $464.7 $398.2 - Current Liabilities 102.1 102.2 84.3 71.2 93.8 88.7 64.7 Invested Capital $161.3 $165.1 $232.5 $250.0 $390.3 $375.9 $333.6 Return on Average Invested Capital 49.7% 36.7% 27.6% 19.5% 14.7% 16.1% 15.2% |
 30 Investor Presentation FREE CASH FLOWS Source: Choice Internal Data, June 2012 YTD Ended Year Ended Year Ended Year Ended Year Ended Year Ended Year Ended Year Ended June 30, December 31, December 31, December 31, December 31, December 31, December 31, December 31, ($ in thousands) 2012 2011 2010 2009 2008 2007 2006 2005 Net Cash Provided by Operating Activities 37,802 $ 134,844 $ 144,935 $ 112,216 $ 104,399 $ 145,666 $ 153,680 $ 133,588 $ Net Cash Provided (Used) by Investing Activities (10,387) (23,804) (32,155) (3,349) (20,265) (21,284) (17,244) (24,531) Free Cash Flows 27,415 $ 111,040 $ 112,780 $ 108,867 $ 84,134 $ 124,382 $ 136,436 $ 109,057 $ |
  31 Investor Presentation FREE CASH FLOWS (Continued) Source: Choice Internal Data, June 2012 Year Ended Year Ended Year Ended Year Ended Year Ended Year Ended Year Ended December 31, December 31, December 31, December 31, December 31, December 31, December 31, ($ in thousands) 2004 2003 2002 2001 2000 1999 1998 Net Cash Provided by Operating Activities 108,908 $ 115,304 $ 99,018 $ 101,712 $ 53,879 $ 65,040 $ 38,952 $ Net Cash Provided (Used) by Investing Activities (14,544) 27,784 (14,683) 87,738 (16,617) (36,031) (9,056) Free Cash Flows 94,364 $ 143,088 $ 84,335 $ 189,450 $ 37,262 $ 29,009 $ 29,896 $ |
 32 Investor Presentation Source: Choice Internal Data, June 2012 ADJUSTED EBITDA LTM Year Ended Year Ended Year Ended Year Ended Year Ended ($ in thousands) June 30, December 31, December 31, December 31, December 31, December 31, 2012 2011 2010 2009 2008 2007 Operating Income 183,717 $ 171,863 $ 160,762 $ 148,073 $ 174,596 $ 185,199 $ Adjustments Acceleration of Management Succession Plan - - - - 6,605 - Loss on Sublease of Office Space - - - 1,503 - - Executive Termination Benefits 4,027 4,444 1,730 4,604 3,537 4,250 Curtailment of SERP - �� - - 1,209 - - Loan Reserves Related to Impaired Notes Receivable - - - - 7,555 - Product Sales - - - - - - Impairment of Friendly investment - - - - - - Depreciation and Amortization 8,115 8,024 8,342 8,336 8,184 8,637 Adjusted EBITDA 195,859 $ 184,331 $ 170,834 $ 163,725 $ 200,477 $ 198,086 $ |