UNITED STATES
SECURITIES AND EXCHANGE COMMISSION
Washington, D.C. 20549
FORM 10-K
| þ | ANNUAL REPORT PURSUANT TO SECTION 13 OR 15(d) OF THE SECURITIES EXCHANGE ACT OF 1934 |
For the fiscal year ended December 31, 2006
OR
| ¨ | TRANSITION REPORT PURSUANT TO SECTION 13 OR 15(d) OF THE SECURITIES EXCHANGE ACT OF 1934 |
For the transition period from ________ to _______
Commission file number 001-33192
www.bmhc.com
Building Materials Holding Corporation
Delaware | | 91-1834269 |
| (State of incorporation) | | (IRS Employer Identification No.) |
Four Embarcadero Center, Suite 3200, San Francisco, CA 94111
(415) 627-9100
Securities registered pursuant to Section 12(b) of the Act:
| | | | Name of each exchange |
| | | | |
| | | | |
| | Common Stock, $0.001 par value per share | | New York Stock Exchange |
Securities registered pursuant to Section 12(g) of the Act:
None
Indicate by check mark if the registrant is a well-known seasoned issuer, as defined in Rule 405 of the Securities Act.
Yes ¨ No þ
Indicate by check mark if the registrant is not required to file reports pursuant to Section 13 or Section 15(d) of the Act.
Yes ¨ No þ
Indicate by check mark whether the registrant (1) has filed all reports required to be filed by Section 13 or 15(d) of the Securities Exchange Act of 1934 during the preceding 12 months (or for such shorter period that the registrant was required to file such reports), and (2) has been subject to such filing requirements for the past 90 days.
Yes þ No ¨
Indicate by check mark if disclosure of delinquent filers pursuant to Item 405 of Regulation S-K is not contained herein, and will not be contained, to the best of registrant's knowledge, in definitive proxy or information statements incorporated by reference in Part III of this Form 10-K or any amendment to this Form 10-K. ¨
Indicate by check mark whether the registrant is a large accelerated filer, an accelerated filer, or a non-accelerated filer. See definition of “accelerated filer and large accelerated filer” in Rule 12b-2 of the Exchange Act. (Check one):
| Large accelerated filer þ | Accelerated filer ¨ | Non-accelerated filer ¨ |
Indicate by check mark whether the registrant is a shell company (as defined in Rule 12b-2 of the Act).
Yes ¨ No þ
The aggregate market value of common stock held by non-affiliates of the registrant as of June 30, 2006 was $605,536,534. The market value computation excludes 7,268,622 shares of common stock held by affiliates such as directors, officers and holders of more than 5% of the shares outstanding as of June 30, 2006.
The number of shares outstanding of common stock as of February 20, 2007 was 29,164,105.
Documents Incorporated by Reference
| (1) | Portions of the Proxy Statement to be delivered to shareholders in connection with the Annual Meeting of Shareholders on May 1, 2007, are incorporated by reference in Part III of this Form 10-K. |
FORM 10-K
For the Fiscal Year Ended December 31, 2006
INDEX
| | | | Page |
PART I | | | |
| | | | | 3 |
| | | | | 13 |
| | | | | 17 |
| | | | | 18 |
| | | | | 19 |
| | | | | 20 |
| | | | | |
PART II | | | |
| | | | | 21 |
| | | | | 23 |
| | | | | 24 |
| | | | | 43 |
| | | | | 44 |
| | | | | 78 |
| | | | | 78 |
| | | | | 78 |
| | | | | |
PART III | | | |
| | | | | 79 |
| | | | | 84 |
| | | | | 84 |
| | | | | 84 |
| | | | | 84 |
| | | | | |
PART IV | | | |
| | | | | 85 |
| | | | | |
| | | | | 92 |
Introduction - Risk Factors and Forward-Looking Statements
There are a number of business risks and uncertainties that affect our operations and therefore could cause future results to differ from past financial performance or expected results and ultimately affect the trading price of our common shares. Information regarding these risks and uncertainties is contained in Item 1A of this Form 10-K under the caption Risk Factors.
Certain statements in this Form 10-K including those related to expectations about homebuilding activity in our markets, demographic trends supporting homebuilding and anticipated sales and operating income are forward-looking statements within the meaning of the Private Securities Litigation Reform Act of 1995. Statements that are not historical or current facts, including statements about our expectations, anticipated financial results and future business prospects are forward-looking statements. While these statements represent our current judgment on what the future may hold and we believe these judgments are reasonable, these statements involve risks and uncertainties that are important factors that could cause our actual results to differ materially from those in forward-looking statements. These factors include, but are not limited to, the risks and uncertainties cited in Item 1A of this Form 10-K under the caption Risk Factors. Undue reliance should not be placed on such forward-looking statements, as such statements speak only as of the date of the filing of our 2006 Annual Report on Form 10-K. We undertake no obligation to update forward-looking statements.
PART I
General
Building Materials Holding Corporation is one of the largest providers of residential construction services and building products in the United States, with a focus in the western and southern states. We provide construction services and building products through our two subsidiaries, SelectBuild and BMC West, in 16 of the top 25 single-family residential construction markets. SelectBuild provides construction services to high-volume homebuilders in key growth markets. BMC West markets and sells building materials, manufactures building components and provides construction services to professional builders and contractors through a network of 41 distribution facilities and 60 manufacturing facilities. We have increasingly focused on providing construction services and manufactured building components to our customers.
Incorporated in the state of Delaware in 1987, Building Materials Holding Corporation trades on the NYSE under the ticker symbol BLG and is headquartered in San Francisco, California.
Periodic and current reports are filed with the Securities and Exchange Commission at www.sec.gov and are also available at our website www.bmhc.com.
Industry Overview
The residential construction services and building products industry is dependent on demand for single-family homes. Housing demand is influenced by many factors including the overall condition of the U.S. economy, mortgage and other interest rates, consumer confidence, job formation and demographic trends as well as other factors. The U.S. Census Bureau reported a 15% drop in single-family housing starts to 1.5 million units in 2006 compared to the historic high of 1.7 million units in 2005. Single-family housing starts in 2007 are expected to decline to 1.3 million units according to the National Association of Home Builders. We believe homebuilding is adjusting to a more historically sustainable pace as evidenced by the current climate of slowing demand, higher inventories of new homes and price concessions offered by builders.
Although the industry remains fragmented, consolidation continues to occur among homebuilders, building material distributors and construction service providers. The industry is experiencing the emergence of larger scale operations with improved financial strength, negotiating leverage and other resources. We believe this continued consolidation will favor high-volume homebuilders, our target market, as well as larger, established construction service providers and building material distributors.
 At SelectBuild, we offer construction services to high-volume homebuilders. These builders generally outsource framing and other construction services. Our services include wood framing or concrete block masonry, concrete services, plumbing and other services. Construction services include managing labor and construction schedules as well as sourcing materials. We currently offer these services in the major metropolitan markets of California, Arizona, Nevada, Florida, Illinois and Virginia.
 At BMC West, we market and sell building products, manufacture building components and provide construction services to professional builders and contractors. Products include structural lumber and building materials purchased from manufacturers as well as manufactured building components such as millwork, trusses and wall panels. Construction services include framing and installation of various building products. We serve our customers based on a regional market management approach where strategic locations offer our entire breadth of building products, manufactured building components and construction services to a market area. We currently offer these products and services in the major metropolitan markets of Texas, Colorado, Washington, Idaho, Utah, California, Oregon, Montana and Nevada.
Acquisition Strategy
We grow our business through acquisitions as well as strategically expanding the breadth of our construction services and building products offered to high-volume homebuilders and other professional builders and contractors. In particular, we believe high-volume homebuilders are seeking quality, reliable and cost effective solutions to meet their construction service needs. Our growth over the past several years has been largely due to acquisitions. The fragmented nature of the construction services and building products industry provides us with acquisition opportunities. We clearly define and thoroughly analyze target markets. In attractive markets, acquisitions are evaluated based on their anticipated performance, management depth, cultural fit, industry reputation and long-term potential customer base. We typically enter a market by purchasing all or part of an existing business and seek to rapidly integrate our services and products to capture market share. We assign experienced due diligence teams to review potential acquisition candidates and develop integration plans once we have agreed in principle to the general terms of an acquisition.
Over the past few years, SelectBuild acquired businesses providing construction services to high-volume homebuilders. Specifically, these businesses were as follows:
2006
| · | distribution services in Southern California |
| · | remaining 49% interest in our existing business providing concrete services in Arizona |
| · | window installation services in Phoenix, Arizona |
| · | framing services in Southern California |
| · | concrete services in Northern Arizona |
| · | wall panel and truss manufacturer in Palm Springs, California |
| · | remaining 20% interest in our existing business providing concrete block masonry and concrete services in Florida |
| · | framing services in Palm Springs, California and Reno, Nevada |
2005
| · | framing services in San Diego, California |
| · | concrete and plumbing services in Las Vegas, Nevada and Southern California |
| · | additional 20% interest in our existing business providing concrete block masonry and concrete services in Florida (initial purchase of 60% January 2003) |
| · | 51% interest in concrete services in Arizona |
| · | 73% interest in plumbing services in Phoenix and Tucson, Arizona |
| · | stucco services in Las Vegas, Nevada |
| · | 51% interest in framing services in Chicago, Illinois |
2004
| · | window installation services in Napa, California |
| · | 51% interest in a truss manufacturer in Fort Pierce, Florida |
| · | remaining 49% interest in our existing framing services business in Northern California (initial purchase of 51% July 2002) |
| · | distribution services in Tucson, Arizona |
At BMC West, we are expanding our building products, manufactured building components, millwork and construction services to become a full-service provider to homebuilders. To facilitate this expansion in products and services, BMC West acquired:
2006
| · | building materials distribution and truss manufacturing in Eastern Idaho |
| · | building materials distribution and millwork services in Houston, Texas |
2005
| · | truss manufacturer in McCall, Idaho |
2004
| · | framing services in Denver, Colorado |
As part of our growth strategy, we continue to evaluate acquisition opportunities that strengthen and broaden our construction services and building products as well as our presence in attractive markets.
Both of our business segments customize their respective mix of construction services and building products to meet customer needs in their respective markets. Our acquisition and expansion strategy has changed our sales mix as follows:
| | | 2006 | | 2005 | | 2004 | |
| Construction Services | | | 59 | % | | 54 | % | | 43 | % |
| Building Products | | | 41 | | | 46 | | | 57 | |
| | | | 100 | % | | 100 | % | | 100 | % |
Competitive Strengths
Strategically located in growing and diverse markets. We have focused our business on large rapidly growing market areas, principally in the western and southern states. According to single-family housing permit data from the U.S. Census Bureau, in 2006 we had operations in 16 of the top 25 U.S. metropolitan statistical areas. Due to the number and variety of geographic market areas in which we do business, we believe that we are less subject to regional or local economic downturns than locally focused businesses.
Superior quality turnkey construction services. Through SelectBuild, we provide superior quality and reliable construction services to high-volume homebuilders in our markets. Certifications from the National Association of Home Builders demonstrate our professional credibility, competence, business integrity and solid record of customer satisfaction. Because we provide services to multiple high-volume homebuilders in our markets, we are able to maintain a stable, well-trained workforce to provide our services. We believe our services enable homebuilders to increase profitability by reducing cycle time with higher quality construction at a lower cost.
Full offering of manufactured products and other services. We believe we are well known and respected in our markets for the superior quality and breadth of our products and services. Through BMC West, we have significantly increased our sales of manufactured products, which provide us with higher margins and increased opportunities to cross-sell other products to our customers. By supplying professional builders and contractors with manufactured products and other services as well as key building products, we are able to help them reduce costs and cycle time.
Significant economies of scale. Due to the high volume of materials and other building products we purchase, we negotiate lower prices on materials and further lower costs to our customers. In addition, we have established strong relationships with our suppliers. These strong relationships provide us significant purchasing advantages, including volume rebate programs and preferred customer status when supplies are limited.
Strong balance sheet with access to additional capital. We believe that high-volume homebuilders and other professional builders and contractors prefer to deal with a stable, financially strong company like us to provide their construction services and building materials needs. We actively manage our balance sheet to have low leverage and significant liquidity. In addition, as a larger publicly traded company, we have better access to capital than many of our competitors.
Variable cost structure. We estimate that nearly all of our cost of sales and a large portion of our selling, general and administrative expenses are variable. Additionally, we can maximize free cash flow during industry downturns by reducing capital expenditures due to the fact that a significant portion of our capital expenditures are discretionary.
Experienced management team. We have a dedicated and experienced management team that combines extensive industry experience, local knowledge in the market areas we serve and experience managing a large, sophisticated enterprise. Our senior management team averages approximately 16 years of industry experience.
Focus on Service. Our focus on service is a key factor that distinguishes us from competitors. We employ experienced, service-oriented individuals. Our construction service skills and product knowledge enable customers to rely on our expertise for project implementation and product recommendations. Our quality assurance efforts and initiatives limit callbacks on the services and products we provide. Our dedication to providing superior customer service to builders allows our employees to develop consistent relationships and generate repeat and referral business.
Our Customers
We build relationships with professional homebuilders engaged in single-family residential construction. These builders are generally repeat customers, with high-volume material and labor needs that require materials procurement, manufactured building components, construction services and on-time job-site delivery. These services and products are not typically offered by retailers selling to do-it-yourselfers, home improvement contractors and trades people.
SelectBuild customers are high-volume homebuilders. BMC West customers are primarily local and regional professional homebuilders as well as contractors.
On a consolidated basis, our largest customer accounted for 6.5% of sales in 2006, while the top five customers represented approximately 23% of consolidated sales. At SelectBuild and BMC West, the top five customers accounted for approximately 35% and 15% of each business segment’s sales, respectively.
Competition
Our construction services and products compete with similar offerings in the marketplace and our competitors vary in size, management expertise and financial capabilities. Additionally, the markets in each of our business segments are fragmented and highly competitive. Given the fragmented nature of the industry, consolidation continues to occur among homebuilders, building material distributors and construction service providers. The industry is experiencing the emergence of larger scale operations with improved financial strength, negotiating leverage and other resources.
SelectBuild competitors range from single-crew operations to large well-managed organizations spanning multiple markets. Also, some high-volume homebuilders perform their own framing and other construction services. BMC West competes with local, regional and national building products distributors. Builders generally select suppliers based on competitive pricing, product availability, reliable delivery, service, trade credit and knowledgeable personnel.
Sales and Marketing
Our operations are located in many of the largest and most rapidly growing markets for single-family home construction. Economic strength as well as historical population and migration trends have generally supported the growth of residential construction in our markets. According to the U.S. Census Bureau, housing starts have favored the western and southern regions, contributing over 70% of annual starts over the past three years.
SelectBuild relies on the value and solid reputation of their integrated construction services model to secure and maintain national and regional relationships with high-volume homebuilders.
BMC West attracts customers by consistently providing quality building products and dependable customer service. Sales personnel are dedicated to sourcing new business and maintaining customer relationships. Marketing consists of industry-wide brand communications along with an array of regional marketing events and activities to enhance customer relationships.
Because of weather conditions in some of our markets, our operating results may be affected by slower construction activity during the first and fourth quarters of the year.
Business Segments
The following information is presented for our business segments.
Sales to external customers for construction services and building products are as follows (thousands):
| | | 2006 | | 2005 | | 2004 | |
SelectBuild | | | | | | | | | | |
| Construction services | | $ | 1,691,973 | | $ | 1,358,333 | | $ | 744,932 | |
| Building products | | | 39,841 | | | 35,553 | | | 8,769 | |
| | | $ | 1,731,814 | | $ | 1,393,886 | | $ | 753,701 | |
BMC West | | | | | | | | | | |
| Construction services | | $ | 234,104 | | $ | 228,176 | | $ | 159,430 | |
| Building products | | | 1,279,251 | | | 1,290,098 | | | 1,177,894 | |
| | | $ | 1,513,355 | | $ | 1,518,274 | | $ | 1,337,324 | |
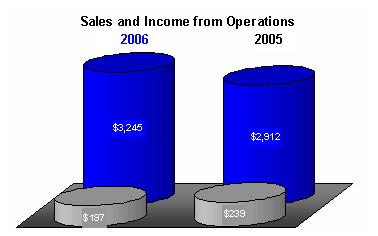
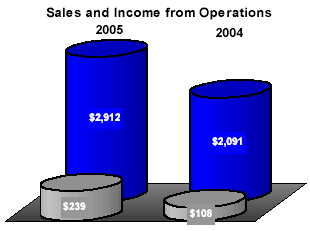
Total | | $ | 3,245,169 | | $ | 2,912,160 | | $ | 2,091,025 | |
Selected financial information is as follows (thousands):
| | | Sales | | Income (1) (Loss) Before Taxes and | | Depreciation | | | | | |
| | | Total | | Inter- Segment | | Trade | | | | | | | | Assets | |
| Year Ended December 31, 2006 | | | | | | | | | | | | | | | | | | | | | | |
| SelectBuild | | $ | 1,744,092 | | $ | (12,278 | ) | $ | 1,731,814 | | $ | 148,416 | | $ | 30,002 | | $ | 33,409 | | $ | 722,328 | |
| BMC West | | | 1,515,121 | | | (1,766 | ) | | 1,513,355 | | | 124,523 | | | 12,178 | | | 33,135 | | | 487,703 | |
| Corporate | | | — | | | — | | | — | | | (75,484 | ) | | 3,104 | | | 6,174 | | | 118,880 | |
| | | $ | 3,259,213 | | $ | (14,044 | ) | $ | 3,245,169 | | | 197,455 | | $ | 45,284 | | $ | 72,718 | | $ | 1,328,911 | |
| Interest Expense | | | | | | | | | | | | 29,082 | | | | | | | | | | |
| | | | | | | | | | | | $ | 168,373 | | | | | | | | | | |
| Year Ended December 31, 2005 | | | | | | | | | | | | | | | | | | | | | | |
| SelectBuild | | $ | 1,395,182 | | $ | (1,296 | ) | $ | 1,393,886 | | $ | 160,957 | | $ | 13,695 | | $ | 62,611 | | $ | 623,877 | |
| BMC West | | | 1,519,903 | | | (1,629 | ) | | 1,518,274 | | | 151,030 | | | 11,218 | | | 17,335 | | | 447,619 | |
| Corporate | | | ― | | | ― | | | ― | | | (72,631 | ) | | 2,450 | | | ― | | | 79,029 | |
| | | $ | 2,915,085 | | $ | (2,925 | ) | $ | 2,912,160 | | | 239,356 | | $ | 27,363 | | $ | 79,946 | | $ | 1,150,525 | |
| Interest Expense | | | | | | | | | | | | 14,420 | | | | | | | | | | |
| | | | | | | | | | | | $ | 224,936 | | | | | | | | | | |
| Year Ended December 31, 2004 | | | | | | | | | | | | | | | | | | | | | | |
| SelectBuild | | $ | 753,956 | | $ | (255 | ) | $ | 753,701 | | $ | 59,689 | | $ | 8,216 | | $ | 14,382 | | $ | 268,498 | |
| BMC West | | | 1,338,470 | | | (1,146 | ) | | 1,337,324 | | | 96,083 | | | 11,740 | | | 17,036 | | | 409,160 | |
| Corporate | | | ― | | | ― | | | ― | | | (47,664 | ) | | 2,859 | | | ― | | | 65,386 | |
| | | $ | 2,092,426 | | $ | (1,401 | ) | $ | 2,091,025 | | | 108,108 | | $ | 22,815 | | $ | 31,418 | | $ | 743,044 | |
| Interest Expense | | | | | | | | | | | | 13,560 | | | | | | | | | | |
| | | | | | | | | | | | $ | 94,548 | | | | | | | | | | |
(1) The following impairments were recognized:
| · | In 2006, $1.8 million for the carrying amount of goodwill and $0.4 million for the carrying amount of certain customer relationships for SelectBuild. |
| · | In 2005, $1.3 million for goodwill and certain customer relationships for SelectBuild. |
| · | In 2004, $1.3 million for the carrying amount of certain properties held for sale and $1.0 million for the carrying amount of goodwill for BMC West. |
(2) Property and equipment from acquisitions are included as capital expenditures.
Operating Strategy
Our business units operate in specific markets and are organized under our business segments, SelectBuild and BMC West. Each regional manager has substantial autonomy and responsibility to address customer needs specific to their markets. The reputation of a construction services provider or building products distributor is often determined locally, where service, product suitability and knowledgeable customer service are critical. Managers are responsible for optimizing business activities in their markets, including the efficient use of personnel, assessing and maintaining working capital and construction labor requirements, identifying potential customers and developing appropriate service and product offerings. Incentive compensation is based on successful growth and financial returns tied to specific market areas and regions.
We focus on improving efficiency and productivity at our business units while giving special attention and support to units that are not meeting strategic objectives. When a business unit fails to meet performance criteria, alternatives include adjusting the mix of products and services, restructuring management, consolidation or liquidation.
Purchasing
We purchase building products from numerous manufacturers and suppliers. Our largest supplier accounted for approximately 9.5% of purchases in 2006. Because commodity wood products are available from several manufacturers and suppliers, we believe the loss of any single supplier would not have a material adverse effect on our financial position, results of operations or cash flows.
In order to meet market specific needs and maintain appropriate inventory levels, purchasing decisions are made at the business unit level. Large volume purchases are made under company-wide guidelines. In addition, we participate in volume discount allowances from our suppliers.
The prices of commodity wood products, concrete, steel and other building products are volatile and may adversely impact financial condition and results of operations when prices rapidly rise or fall. Our information systems allow business unit managers to closely monitor sales and inventory. With this supply and demand information, we generally avoid overstocking commodity wood products. As a result, we turn our commodity wood product inventory on average 11 to 14 times per year. Such rapid inventory turnover limits our potential exposure to inventory loss from commodity price fluctuations.
Management Information Systems
We are standardizing software and infrastructure platforms that support the information needs of our organization. Our standardization effort includes job cost and construction information, estimating, inventory management, reporting, project scheduling and human resource management.
We have developed a project methodology that allows us to efficiently deploy these information systems to our business units and acquisitions. Most acquisitions are on-line with our corporate infrastructure within 30 days of acquisition, enabling access to our network capabilities.
Our job cost and construction information systems are operating in approximately 90% of our SelectBuild business units with full deployment scheduled by mid 2007. We expect our inventory management system to be upgraded by early 2008. We continue to research, recommend and implement new technology solutions to improve information for decision-making and our efficiencies.
We have also made investments in our infrastructure to improve backup capabilities for our network. Because of our rapid growth, we expanded our data center capabilities beyond our facility in Boise, Idaho to also include Las Vegas, Nevada. This will provide redundant services between the two centers and allow for a more seamless disaster recovery capability.
In 2007, we will complete the implementation of the next generation of wide area network technology. This architecture will provide a redundant link between our locations and the data centers, reduce the costs to operate our network and provide us with the capability to rapidly deploy additional bandwidth to meet accelerating business demand.
Safety and Risk Management
Due to our growth in construction services in recent years, the number of employees dedicated to our construction trades has increased. The construction services industry incurs a higher number of accidents and subsequent costs for workers’ compensation claims than typically experienced at building materials distribution facilities. Consequently, we have initiated several programs to enhance safety and reduce the risks encountered by our employees. These programs include instruction and training for truck drivers, construction safety, behavioral safety as well as on-line and instructor led training programs relating to OSHA compliance matters and safety hazards in the workplace. Additionally, our managers are compensated for their effectiveness in reducing the incidence of workers compensation claims.
We maintain comprehensive insurance coverage to mitigate the potential cost of claims. Our estimated cost for automobile, general liability and workers compensation claims is determined by actuarial methods. Claims in excess of certain amounts are insured with third-party insurance carriers. Reserves for claims are recognized based on the estimated costs of these claims as limited by the deductible of the applicable insurance policies.
Employees
Our success is highly dependent on the quality of our employees. Due to competition in attracting and retaining qualified employees, we maintain competitive compensation and benefit programs to attract, motivate and retain top-performers. We also provide extensive product knowledge, customer service and other supervisory/management training programs to achieve our goal of being both the employer and supplier of choice.
We employ approximately 17,000 people. Specifically, SelectBuild employs 12,000 employees, while BMC West employs 5,000. Unions represent approximately 700 or less than 5% of these employees. We have not experienced any strikes or other work interruptions and have maintained generally favorable relations with our employees.
Executive Officers
| Name | | Age | | Position and Business Experience |
| | | | | |
| Robert E. Mellor | | 63 | | Chairman of the Board, President and Chief Executive Officer Mr. Mellor became Chairman of the Board of Directors in 2002 and has been President and Chief Executive Officer since 1997. He has been a director since 1991. He was previously Of Counsel with the law firm of Gibson, Dunn & Crutcher LLP from 1990 to 1997. He is a director for Coeur d’Alene Mines Corporation, The Ryland Group and Monro Muffler Brake. He is also on the board of councilors of Save-the-Redwoods League. He does not serve on the audit committee of any of these boards. Mr. Mellor will not stand for re-election to the Board of Monro Muffler Brake in 2007. |
| William M. Smartt | | 64 | | Senior Vice President and Chief Financial Officer Mr. Smartt has been a Senior Vice President and Chief Financial Officer since April 2004. Prior to joining the Company, he was an independent consultant from August 2001 to March 2004. From 1992 to 2001, he was Executive Vice President, Chief Financial and Administrative Officer of DHL Express, a leader in international air express services. His previous experience as a Chief Financial Officer included 10 years with Di Giorgio Corporation, a Fortune 500 Company, whose product lines included the distribution of building materials, prefabricated components and framing services. |
| | | | | |
| Michael D. Mahre | | 47 | | Senior Vice President - Corporate Development, President and Chief Executive Officer - SelectBuild Mr. Mahre was elected a Senior Vice President in 2003. He was elected Vice President of Corporate Development in 2001 and Chief Executive Officer of SelectBuild in 2002. He joined the Company in 1999 as Director of Financial Planning and Analysis. Mr. Mahre was a principal of The Cambria Group, a private equity investment firm, from 1997 to 1998. |
| | | | | |
| Stanley M. Wilson | | 62 | | Senior Vice President, President and Chief Executive Officer - BMC West Mr. Wilson was elected President and CEO of BMC West in 2004 and was appointed Senior Vice President in 2003. He was elected Vice President in 2000 and was General Manager of the Pacific Division of BMC West from 1993 to 2003. Mr. Wilson has been with the company since its beginning in 1987. His previous experience includes 20 years with the building materials distribution business of Boise Cascade Corporation. |
| | | | | |
| Eric R. Beem | | 37 | | Vice President and Controller Mr. Beem was appointed Vice President in January 2006 and Controller in April 2005. He joined the Company as Accounting Manager in 1996. Mr. Beem is a Certified Public Accountant and his experience includes 3 years with an international public accounting firm. |
| | | | | |
| Mark R. Kailer | | 53 | | Vice President, Treasurer and Investor Relations Mr. Kailer has been Vice President and Treasurer since 2003. He joined the Company in 2000 as Assistant Treasurer. He was previously Senior Manager of Treasury Services at Circle International Group, a publicly-traded global logistics company based in San Francisco, from 1997 to 2000. |
| Jeffrey F. Lucchesi | | 53 | | Senior Vice President, Chief Information Officer Mr. Lucchesi joined the Company in August 2004 as Senior Vice President and Chief Information Officer. From 2000 to 2004, he was Senior Vice President of Worldwide Operations for Corio, Inc., an enterprise application service provider. Mr. Lucchesi also served from 1994 to 2000 as Vice President and Chief Information Officer for DHL Express, a leader in international air express services. |
| | | | | |
| Steven H. Pearson | | 59 | | Senior Vice President - Human Resources Mr. Pearson has been Senior Vice President of Human Resources since 2001. From 1987 through 2001 he served as Vice President of Human Resources. Mr. Pearson has been with the Company since its beginning in 1987. His previous experience also includes 18 years in the human resource function of Boise Cascade Corporation. |
| | | | | |
| Paul S. Street | | 58 | | Senior Vice President, Chief Administrative Officer, General Counsel and Corporate Secretary Mr. Street joined the Company in 1999 as Senior Vice President, General Counsel and Corporate Secretary and has been Chief Administrative Officer since 2001. He previously served as our outside General Counsel & Secretary while a partner of the law firm of Moffatt, Thomas, Barrett, Rock & Fields. |
Risks Related to Our Business
There are a number of business risks and uncertainties that affect our operations and therefore could cause future results to differ from past performance or expected results. These risks or uncertainties may include, but are not limited to the following factors:
Our business is dependent on demand for and supply of single-family homes which is influenced by changes in the overall condition of the U.S. economy, including interest rates, job formation, consumer confidence and other important factors.
The residential construction services and building products industry is highly dependent on demand for single-family homes which is influenced by several factors. These factors include economic changes nationally and locally, mortgage and other interest rates, job formation, consumer confidence, demographic trends, inflation and building permit activity as well as other factors. The construction of new homes may also experience declines due to home inventory levels, the availability and affordability of land in attractive metropolitan areas, shortages of qualified trades people, shortages of materials and regulations that impose restrictive zoning and density requirements. Also, changes to housing patterns may occur, such as an increase in consumer demand for urban living rather than single-family suburban neighborhoods. All of these factors could limit demand for home construction and may adversely impact our financial condition, results of operations or cash flows.
There are risks associated with our business model.
Our business model seeks the strategic growth of construction services and distribution of building products in an effort to provide a comprehensive solution to high-volume and other homebuilders. Providing these services and products includes the risks of availability and cost of qualified labor and claims for construction defects, product liability and workers compensation as well as the timely sourcing and availability of building products. Additionally, there is no guarantee that our efforts to offer these comprehensive solutions will continue to be accepted by the marketplace.
The integration of acquired businesses may not result in anticipated cost savings and revenue synergies being fully realized or may take longer to realize than expected.
Our growth over the past several years has been largely due to acquisitions and we intend to continue this strategy. The integration of acquired businesses may not result in anticipated cost savings and revenue synergies being fully realized or may take longer to realize than expected. The management and acquisition of businesses involves substantial risks including:
| · | the uncertainty that an acquired business will achieve anticipated operating results; |
| · | significant expenses to integrate; |
| · | diversion of management attention; |
| · | departure of key personnel from the acquired business; |
| · | effectively managing entrepreneurial spirit and decision-making; |
| · | integration of different information systems; |
| · | managing new construction service trades; |
| · | unanticipated costs and exposure to unforeseen liabilities; and |
Our growth is dependent upon our ability to identify suitable acquisition candidates.
Our growth over the past several years has been largely due to acquisitions and we intend to continue this strategy. Failure to identify and acquire suitable acquisition candidates could have an adverse effect on our growth. Also, the increasing level of consolidation occurring in the construction services and building products distribution industry may limit the availability and suitability of acquisition candidates.
Our success is dependent upon the availability of and our ability to attract, train and retain qualified individuals.
Competition for employees is especially intense in both construction services and building products distribution. In markets with strong housing demand, we may experience shortages in qualified labor and key personnel, which may limit our ability to complete contracts as well as obtain additional contracts with builders. Additional and perceived enforcement of as well as changes to immigration policies could also limit the availability of qualified labor. We cannot guarantee that we will be successful in recruiting and retaining qualified employees in the future.
An inability to implement and maintain cost structures that align with revenue growth may have an adverse impact on our operating results.
When we experience slower periods of homebuilding activity, acquire new businesses or expand existing operations, we may experience inefficiencies in our cost structures. Our evaluation and changes to expenses in response to declining sales may not occur in a timely manner, leading to higher costs and lower returns on sales.
Changes in the business models of customers may limit our ability to provide construction services and building products required by our customers.
As the business models of our customers evolve, our existing construction service and building product offerings may not meet the needs of certain homebuilders. Additionally, homebuilders may decide to no longer outsource construction services. If we do not timely assess shifts in customer expectations, preferences and demands in a timely manner, our financial condition, results of operations or cash flows could be adversely affected.
Our operating results are affected by fluctuations in our costs and the availability of sourcing channels for commodity wood products, concrete, steel and other building materials.
Prices of commodity wood products, concrete, steel and other building products are historically volatile and are subject to fluctuations arising from changes in domestic and international supply and demand, labor costs, competition, market speculation, government regulations and periodic delays in delivery. Rapid and significant changes in product prices may affect sales as well as margins due to a limited ability to pass on short-term price changes. We do not use derivative financial instruments to hedge commodity price changes.
We may experience shortages of building products as a result of unexpected demand or production difficulties as well as transportation limitations. Any disruption in our sources of supply for key building products could negatively impact our financial condition, results of operations or cash flows.
Our business is subject to intense competition.
We experience competition across all markets for our construction services and building products. Recently, there has been increased consolidation within the construction services and building materials distribution industry. As the industry consolidates, other building materials distributors, including large retail distributors focused on consumers, may aggressively pursue our target market of high-volume homebuilders and other professional builders and contractors. These competitive factors may lead to pricing pressures and cause reductions in sales or margins, increases in operating costs and may limit acquisition opportunities. Loss of significant market share due to competition could result in the closure of facilities.
Weather conditions, including natural catastrophic events, may cause our operating results to fluctuate each quarter.
Our first and fourth quarters historically have been, and are expected to continue to be, adversely affected by weather conditions in some of our markets, causing decreases in operating results due to slower homebuilding activity. In addition, natural catastrophic events may cause our operating results to fluctuate.
The nature of our business exposes us to construction defect and product liability claims as well as other legal proceedings.
We are involved in construction defect and product liability claims relating to our various construction trades and the products we distribute and manufacture. We also operate a large fleet of trucks and other vehicles and therefore face some risk of accidents. Although we believe we maintain adequate insurance, we may not be able to maintain such insurance on acceptable terms or such insurance may not provide adequate protection against potential liabilities. Current or future claims may adversely affect our financial condition, results of operations or cash flows.
We may be adversely affected by disruptions in our information systems.
Our operations are dependent upon information for decision-making and the related information systems. A substantial disruption in our information systems for a prolonged period could result in delays in our services and products and adversely affect our ability to complete contracts and fulfill customer demands. Such delays, problems or costs may have an adverse effect on our financial condition, results of operations or cash flows.
Actual and perceived vulnerabilities as a result of terrorist activities and armed conflict may adversely impact consumer confidence and our business.
Instability in the economy and financial markets as a result of terrorism or war may impact consumer confidence and result in a decrease in homebuilding in our markets. Terrorist attacks may also directly impact our ability to maintain operations and services and may have an adverse effect on our business.
Federal, state and other regulations could impose substantial costs and/or restrictions on our business.
We are subject to various federal, state, local and other regulations, including among other things, work safety regulations promulgated by the Department of Labor’s Occupational Safety and Health Administration, transportation regulations promulgated by the Department of Transportation, employment regulations promulgated by the United States Equal Employment Opportunity Commission and state and local zoning restrictions and building codes. More burdensome regulatory requirements in these or other areas may increase our costs and have an adverse effect on our financial condition, results of operations or cash flows.
Numerous other matters of a local and regional scale, including those of a political, economic, business, competitive or regulatory nature may have an adverse impact on our business.
Many factors shape the homebuilding industry and our business. In addition to the factors previously cited, there are other matters of a local and regional scale, including those of a political, economic, business, competitive or regulatory nature that may have an adverse effect on our business.
Risks Related to Our Shares
Risks related to our shares may include, however are not limited to:
Our share price may fluctuate significantly, which may make it difficult for shareholders to trade our shares when desired or at attractive prices.
The market price of our shares is subject to significant changes as a result of our operating performance and the other factors discussed above as well as perceptions and events that are beyond our control. Price and trading volume fluctuations for our shares may be unrelated or disproportionate to our operating performance. Additionally, our share price could fluctuate based on the expectations and performance of other publicly traded companies in the construction services and building products distribution industry.
Anti-takeover defenses in our governing documents and certain provisions under Delaware law could prevent an acquisition of our company or limit the price that investors might be willing to pay for our shares.
Our governing documents and certain provisions of Delaware law that apply to us could make it difficult for another company to acquire control of our company. For example, we have a shareholder rights plan, commonly known as a “poison pill,” which would make it difficult for someone to acquire our company without the approval of our Board of Directors. Also, our certificate of incorporation allows our Board of Directors to issue, at any time and without shareholder approval, preferred shares with such terms as it may determine. These provisions and others could delay, prevent or allow our Board of Directors to resist an acquisition of our company, even if a majority of our shareholders favored the proposed transaction.
We have no unresolved comments from the Securities and Exchange Commission.
We lease our headquarters in San Francisco, California and our administrative service center in Boise, Idaho. Principal properties include distribution centers for building products, millwork fabrication and distribution sites, truss manufacturing plants, sales and administrative offices. Properties are located in growing metropolitan areas and emerging housing markets. Properties for SelectBuild are 11% owned and 89% leased while at BMC West 69% are owned and 31% are leased. Our properties are in good operating condition and we believe they provide adequate capacity to meet the needs of our customers. Locations operate under the trade names BMHC, SelectBuild and BMC West, as well as other brand names or trademarks. Properties by business segment are as follows:
SelectBuild | | BMC West | | Corporate |
Location | | Properties | | Location | | Properties | | Location | | Properties |
| Arizona | | 15 | | Arizona | | 3 | | California | | 1 |
| California | | 23 | | California | | 7 | | Idaho | | 1 |
| Florida | | 12 | | Colorado | | 18 | | Nevada | | 1 |
| Illinois | | 1 | | Idaho | | 11 | | | | |
| Nevada | | 9 | | Montana | | 6 | | | | |
| Virginia | | 1 | | Nevada | | 3 | | | | |
| | | | | Oregon | | 2 | | | | |
| | | | | Texas | | 27 | | | | |
| | | | | Utah | | 6 | | | | |
| | | | | Washington | | 5 | | | | |
We are involved in litigation and other legal matters arising in the normal course of business. In the opinion of management, the recovery or liability, if any, under any of these matters will not have a material effect on our financial position, results of operations or cash flows.
| ITEM 4. | Submission of Matters to a Vote of Security Holders |
There were no matters submitted to a vote of security holders during the fourth quarter of the fiscal year.
PART II
| Market for Registrant's Common Equity, Related Stockholder Matters and Issuer Purchases of Equity Securities |
Common Shares
Our common shares are traded on the NYSE market under the symbol BLG. The high and low share prices as well as cash dividends for each period were as follows:
| | | 2006 | | 2005 | |
| | | High | | Low | | Cash Dividends Declared | | High | | Low | | Cash Dividends
Declared | |
| | | | | | | | | | | | | | |
| First quarter | | | | | | | | | | | | | | | | | | | |
| Second quarter | | | | | | | | | | | | | | | | | | | |
| Third quarter | | | | | | | | | | | | | | | | | | | |
| Fourth quarter | | | | | | | | | | | | | | | | | | | |
On February 20, 2007, our Board of Directors approved a 2007 first quarter cash dividend of $0.10 per common share. The dividend was payable to shareholders of record as of March 23, 2007 and will be paid on or about April 13, 2007.
On February 14, 2006, our Board of Directors approved a two for one split of our outstanding common shares. Shareholders of record as of February 28, 2006 received a stock dividend of one additional common share for every common share they owned. All share and per share information for all prior periods presented has been adjusted to reflect this share split.
At the annual meeting of shareholders on May 3, 2005, our shareholders voted to increase the number of authorized common shares to 50 million from 20 million.
Dividends are paid at the discretion of the Board of Directors and we expect to continue these payments. The continuation of dividend payments (cash or shares) depends on many factors, including financial position, results of operations or cash flows.
As of February 20, 2007, there were approximately 6,200 shareholders of record and the closing price of our shares was $22.30.
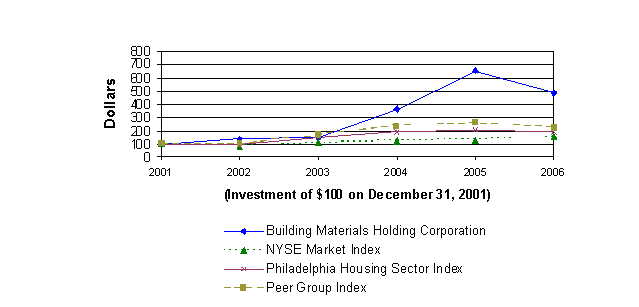
Share Performance Graph
The graph below depicts our cumulative total shareholder returns relative to the performance of:
| · | Philadelphia Housing Sector Index and |
The graph assumes $100 invested at the closing price of our common shares or the applicable index as well as reinvestment of dividends on the date paid. The points of the graph represent year-end index levels based on the last trading day of each year.
Our peer group index is composed of companies that reflect construction services and building products as follows:
· Avatar Holdings Inc. | · Lennar Corp. | · Simpson Manufacturing Co. Inc. |
· Beazer Homes USA | · Masco Corp. | · Standard Pacific Corp. |
· Builders FirstSource | · Meritage Homes Corp. | · Toll Brothers Inc. |
· Brookfield Homes | · MDC Holdings Inc. | · Universal Forest Products, Inc. |
· D.R. Horton Inc. | · NVR Inc. | · USG Corp. RT |
· KB Home | · Ryland Group Inc. | |
Five Year Cumulative Return
The following selected financial data should be read in conjunction with Item 7 - Management’s Discussion and Analysis of Financial Condition and Results of Operations as well as Item 8 - Financial Statements and Supplementary Data. These resources provide further information to understand the comparability of selected financial data.
Selected Financial Data
(thousands, except share data)
| | | Year Ended December 31 | |
| | | 2006 | | 2005 | | 2004 | | 2003 | | 2002 | |
Sales (1) | | | | | | | | | | | |
| Construction services | | $ | 1,926,077 | | $ | 1,586,509 | | $ | 904,362 | | $ | 498,052 | | $ | 293,063 | |
| Building products | | | 1,319,092 | | | 1,325,651 | | | 1,186,663 | | | 917,019 | | | 868,431 | |
| Total sales | | | 3,245,169 | | $ | 2,912,160 | | $ | 2,091,025 | | $ | 1,415,071 | | $ | 1,161,494 | |
| | | | | | | | | | | | | | | | | |
Income from operations (2) | | | 197,455 | | $ | 239,356 | | $ | 108,108 | | $ | 40,429 | | $ | 39,121 | |
| | | | | | | | | | | | | | | | | |
| Net income | | | 102,074 | | $ | 129,507 | | $ | 53,910 | | $ | 19,929 | | $ | 7,015 | (3) |
| | | | | | | | | | | | | | | | | |
Net income per share (4) | | | | | | | | | | | | | | | | |
| Basic | | | | | | | | | | | | | | | | |
| Diluted | | | | | | | | | | | | | | | | |
| | | | | | | | | | | | | | | | | |
| Annual cash dividends declared | | | | | | | | | | | | | | | | |
per share (4) | | | | | | | | | | | | | | | | |
| | | | | | | | | | | | | | | | | |
| Working capital | | | 242,800 | | $ | 304,459 | | $ | 284,173 | | $ | 216,898 | | $ | 170,492 | |
| Total assets | | | 1,328,911 | | $ | 1,150,525 | | $ | 743,044 | | $ | 604,199 | | $ | 503,074 | |
| Long-term debt, net of current portion | | | 349,161 | | $ | 278,169 | | $ | 206,419 | | $ | 186,773 | | $ | 157,375 | |
| Shareholders’ equity | | | 572,629 | | $ | 470,061 | | $ | 327,678 | | $ | 271,010 | | $ | 251,300 | |
| | | | | | | | | | | | | | | | | |
| Cash flows provided by operations | | | 273,418 | | $ | 198,294 | | $ | 33,374 | | $ | 12,479 | | $ | 35,726 | |
| | | 2006 | | 2005 | | 2004 | | 2003 | | 2002 | |
(1) | Acquisitions provided sales of: | | $ | 701,604 | | $ | 403,919 | | $ | 221,407 | | $ | 155,176 | | $ | 117,371 | |
| (2) | Acquisitions provided income | | | | | | | | | | | | | | | | |
| (loss) from operations of: | | $ | 55,454 | | $ | 31,588 | | $ | 2,764 | | $ | (3,628 | ) | $ | 9,827 | |
| (3) | The transitional impairment analysis of goodwill resulted in an impairment of $11.7 million net of tax. |
(4) | All share and per share information for all periods presented has been adjusted to reflect a two for one split of our common shares in February 2006. |
| | |
| ITEM 7. | Management's Discussion and Analysis of Financial Condition and Results of Operations |
The following discussion should be read in conjunction with the Consolidated Financial Statements and related notes that appear in Item 8 of Form 10-K as well as the caption under this item entitled Business Risks and Forward-Looking Statements.
Business Environment and Executive Overview
We are one of the largest providers of residential construction services and building products in the United States, with a focus in the western and southern states. We provide construction services and building products in 16 of the top 25 single-family residential construction markets through our two subsidiaries, SelectBuild and BMC West. SelectBuild provides construction services to high-volume homebuilders in key growth markets. BMC West markets and sells building products, manufactures building components and provides construction services to professional builders and contractors through a network of 41 distribution facilities and 60 manufacturing facilities. We have increasingly focused on providing construction services and manufactured building components to our customers.
New home construction was sharply down in 2006. The U.S. Census Bureau reported single-family housing starts fell 15% to 1.5 million units in 2006 as compared to the historic high of 1.7 million units in 2005. Single-family housing starts in 2007 are expected to decline to 1.3 million units according to the National Association of Home Builders. The housing market is currently adjusting an oversupply of inventory by offering buyers incentives to purchase existing inventory and by severely restricting the construction of new homes.
Our markets for new residential construction and building products have also been dramatically impacted by the national slowdown in homebuilding. Across all our markets and particularly during the second half of 2006, we experienced substantial declines in housing starts and building permits. To counter the effects of the downturn, we have reduced our labor force by more than 30%, decreased variable expenses and focused our efforts to reduce costs by leveraging our scale and shared resources. The overall economic backdrop that historically has supported the homebuilding industry, such as the condition of the U.S. economy, interest rates, job formation and consumer confidence, remain favorable. We believe that the excess inventory of new homes will be gradually absorbed on a market-by-market basis over the next several quarters.
Our operations are located in attractive metropolitan areas that have historically outpaced U.S. averages for residential building permit activity. With construction services and building products offered in California, Texas, Nevada, Arizona, Florida, the Northwest and Intermountain states, Illinois, and Virginia, we believe we are in homebuilding markets supported by positive long-term population growth, household formation and demographic trends.
We grow our business through acquisitions as well as strategically expanding the breadth of our construction services and building products offered to high-volume homebuilders and other professional builders and contractors. In particular, we believe high-volume homebuilders are seeking quality, reliable and cost effective solutions to meet their construction services needs. Our services include framing, concrete, plumbing and other construction services as well as building product distribution and manufactured building components including trusses, millwork and wall panels. In 2006, we completed several acquisitions to expand the trades offered to homebuilders.
Acquisition History
Over the past few years, SelectBuild acquired businesses providing construction services to high-volume homebuilders. Specifically, these businesses were as follows:
2006
| · | distribution services in Southern California |
| · | remaining 49% interest in our existing business providing concrete services in Arizona |
| · | window installation services in Phoenix, Arizona |
| · | framing services in Southern California |
| · | concrete services in Northern Arizona |
| · | wall panel and truss manufacturer in Palm Springs, California |
| · | remaining 20% interest in our existing business providing concrete block masonry and concrete services in Florida |
| · | framing services in Palm Springs, California and Reno, Nevada |
2005
| · | framing services in San Diego, California |
| · | concrete and plumbing services in Las Vegas, Nevada and Southern California |
| · | additional 20% interest in our existing business providing concrete block masonry and concrete services in Florida (initial purchase of 60% January 2003) |
| · | 51% interest in concrete services in Arizona |
| · | 73% interest in plumbing services in Phoenix and Tucson, Arizona |
| · | stucco services in Las Vegas, Nevada |
| · | 51% interest in framing services in Chicago, Illinois |
2004
| · | window installation services in Napa, California |
| · | 51% interest in a truss manufacturer in Fort Pierce, Florida |
| · | remaining 49% interest in our existing framing services business in Northern California (initial purchase of 51% July 2002) |
| · | distribution services in Tucson, Arizona |
At BMC West, we are expanding our building products, manufactured building components, millwork and construction services to become a full-service provider to homebuilders. To facilitate this expansion in products and services, BMC West acquired:
2006
| · | building materials distribution and truss manufacturing in Eastern Idaho |
| · | building materials distribution and millwork services in Houston, Texas |
2005
| · | truss manufacturer in McCall, Idaho |
2004
| · | framing services in Denver, Colorado |
As part of our growth strategy, we continue to evaluate acquisition opportunities that strengthen and broaden our construction services and building products as well as our presence in attractive markets.
Performance Measurements
We measure our operating performance and financial condition based on several factors including:
| ● Sales | ● Management of working capital |
| ● Income from operations | ● Return on investment |
We evaluate our results of operations including and excluding acquisitions not present in comparable periods. We believe this approach enhances an understanding of our acquisitions and operating results for the respective reporting periods.
The discussion of our results of operations and financial condition provides information to assist the reader in understanding our financial statements, changes in key items in those financial statements and the primary factors that accounted for those changes. The discussion of our consolidated financial results is followed by a more detailed review of our business segments.
RESULTS OF OPERATIONS
2006 COMPARED WITH 2005
The following table sets forth the amounts and percentage relationship to sales of certain costs, expenses and income items (millions):
| | | Year Ended December 31 | |
| | | 2006 | | 2005 | |
Sales | | | | | | | | | |
| Construction services | | $ | 1,926 | | | 59.4 | % | $ | 1,586 | | | 54.5 | % |
| Building products | | | 1,319 | | | 40.6 | | | 1,326 | | | 45.5 | |
Total sales | | | 3,245 | | | 100.0 | | | 2,912 | | | 100.0 | |
| | | | | | | | | | | | | | |
Costs and operating expenses | | | | | | | | | | | | | |
| Cost of goods sold | | | | | | | | | | | | | |
| Construction services | | | 1,557 | | | 80.8 | | | 1,286 | | | 81.1 | |
| Building products | | | 961 | | | 72.9 | | | 968 | | | 73.0 | |
| Total cost of goods sold | | | 2,518 | | | 77.6 | | | 2,254 | | | 77.4 | |
| Impairment of assets | | | 2 | | | — | | | 1 | | | ― | |
| Selling, general and administrative expenses | | | 532 | | | 16.4 | | | 421 | | | 14.5 | |
| Other income, net | | | (4 | ) | | (0.1 | ) | | (3 | ) | | (0.1 | ) |
| Total costs and operating expenses | | | 3,048 | | | 93.9 | | | 2,673 | | | 91.8 | |
Income from operations | | | 197 | | | 6.1 | | | 239 | | | 8.2 | |
| | | | | | | | | | | | | | |
| Interest expense | | | 29 | | | 0.9 | | | 14 | | | 0.5 | |
| Income taxes | | | 57 | | | 1.8 | | | 80 | | | 2.8 | |
| Minority interest income, net of income taxes | | | (9 | ) | | (0.3 | ) | | (15 | ) | | (0.5 | ) |
| | | | | | | | | | | | | | |
Net income | | $ | 102 | | | 3.1 | % | $ | 130 | | | 4.4 | % |
| | | | | | | | | | | | | | |
Earnings per diluted share | | | | | | | | | | | | | |
Consolidated Financial Results
Selected financial results are as follows (millions):
| | | 2006 | | 2005 | | $ Change | | % Change | |
Sales | | | | | | | | | |
| Construction services | | $ | 1,926 | | | $ | 1,586 | | | $ | 340 | | | | 21 | % | |
| Building products | | | 1,319 | | | | 1,326 | | | | (7 | ) | | | (1 | )% | |
| | | $ | 3,245 | | | $ | 2,912 | | | $ | 333 | | | | 11 | % | |
| | | | | | | | | | | | | | | | | | |
Income from operations | | $ | 197 | | | $ | 239 | | | $ | (42 | ) | | | (18 | )% | |
A key element of our business strategy for the past several years entails shifting our sales mix to construction services and value added manufactured building components from commodity wood products. We continue to pursue this shift to leverage our competitive advantages and improve our financial performance.
Sales of $3.2 billion increased $333 million or 11%. Sales from acquisitions not present in the prior period were $702 million and were partially offset by a decrease in sales from comparable operations of $369 million. The decrease in sales from comparable operations reflects a sharp decline in both housing starts and building permits in the second half of the year, indicative of a nationwide contraction in homebuilding. According to the U.S. Census Bureau, single-family building permits in our markets were down 20% relative to their historic high in 2005.
Income from operations of $197 million decreased $42 million or 18% from $239 million in the prior year. For comparable operations, income from operations declined $97 million or 41%. The decrease in income from operations was principally due to lower sales from comparable operations as well as higher selling, general and administrative expenses.
Selling, general and administrative expenses increased 26% or $111 million from a year ago. Acquisitions not present in the prior period were $77 million or approximately 70% of the increase. These expenses for comparable operations were higher due to compensation, including the impact of adopting a new accounting principle for share-based compensation, occupancy expenses to support growth and acquisition integration expenses. As a percent of sales, selling, general and administrative expenses were 16.4% from 14.5% a year ago, up 1.9%. The increase in these expenses as a percent of sales, was due to deflation in selling prices, delivery costs to support higher volume and fixed amortization expenses from acquisitions.
Although gross margins improved for construction services and building products, they were overall 22.4% compared to 22.6% in 2005. The decrease in gross margins was due to a higher portion of sales from construction services relative to building products.
Interest Expense
Interest expense of $29 million was up $15 million from the prior year. The increase was due to greater average borrowings of $356 million in 2006 compared to $225 million in 2005 and higher average interest rates of 6.5% in 2006 compared to 5.7% in 2005.
Income Taxes
In 2006 our combined federal and state income tax rate decreased to 33.7% from 35.5% in 2005. The reduction was due to a refinement of the apportioned taxable income to the states in which we operate.
Business Segments
Sales and operating income by business segment are as follows (millions):
| | | 2006 | | 2005 | |
| | | Sales | | Income from Operations | | Sales | | Income from Operations | |
| SelectBuild | | $ | 1,732 | | | $ | 148 | | | $ | 1,394 | | | $ | 161 | | |
| BMC West | | | 1,513 | | | | 124 | | | | 1,518 | | | | 151 | | |
| Corporate | | | — | | | | (75 | ) | | | ― | | | | (73 | ) | |
| | | $ | 3,245 | | | $ | 197 | | | $ | 2,912 | | | $ | 239 | | |
SelectBuild
Selected financial results are as follows (millions):
| | | 2006 | | 2005 | | $ Change | | % Change | |
Sales | | $ | 1,732 | | | $ | 1,394 | | | $ | 338 | | | | 24 | % | |
| Less: Acquisitions | | | (644 | ) | | | — | | | | (644 | ) | | | — | | |
| | | $ | 1,088 | | | $ | 1,394 | | | $ | (306 | ) | | | (22 | )% | |
| | | | | | | | | | | | | | |
Income from operations | | $ | 148 | | | $ | 161 | | | $ | (13 | ) | | | (8 | )% | |
| Less: Acquisitions | | | (54 | ) | | | — | | | | (54 | ) | | | — | | |
| | | $ | 94 | | | $ | 161 | | | $ | (67 | ) | | | (42 | )% | |
Sales increased 24% to $1.7 billion from $1.4 billion a year ago. The increase was due to $644 million in sales from acquisitions not present in the prior period. Sales from comparable operations declined 22% or $306 million and were particularly weak in our Southwest and Pacific regions. Reflective of the reduction in homebuilding in our markets, both starts and building permits were down sharply.
Income from operations decreased 8% to $148 million from $161 million. For comparable operations, income from operations was down 42% or $67 million.
Gross margins were slightly improved at 19.5% of sales from a year ago, however selling, general and administrative expenses were 10.8% of sales compared to 7.7% in 2005. These expenses were higher due to:
| · | reduced operating leverage resulting from a 22% decline in sales from comparable operations, |
| · | compensation and integration expenses associated with a regional operating structure and |
| · | operating expenses and non-cash amortization associated with recent acquisitions. |
BMC West
Selected financial results are as follows (millions):
| | | 2006 | | 2005 | | $ Change | | | % Change | |
Sales | | $ | 1,513 | | | $ | 1,518 | | | $ | (5 | ) | | | — | | |
| Less: Acquisitions | | | (58 | ) | | | — | | | | (58 | ) | | | — | | |
| | | $ | 1,455 | | | $ | 1,518 | | | $ | (63 | ) | | | (4 | )% | |
| | | | | | | | | | | | | | |
Income from operations | | $ | 124 | | | $ | 151 | | | $ | (27 | ) | | | (18 | )% | |
| Less: Acquisitions | | | (1 | ) | | | ― | | | | (1 | ) | | | — | | |
| | | $ | 123 | | | $ | 151 | | | $ | (28 | ) | | | (19 | )% | |
Sales of $1.5 billion were approximately the same as 2005. Sales from comparable operations experienced a decrease in commodity wood product prices and were down 4% or $63 million from a year ago. Strong sales in the Intermountain and Texas regions were offset by lower sales in our Southwest, Colorado and Northwest regions. Indicative of slower homebuilding activity, single-family building permits declined in the second half of the year and were down 8% from a year ago.
Income from operations decreased 18% to $124 million from $151 million. As a percent of sales, gross margins were up 30 basis points over the prior year. However, selling, general and administrative expenses as a percent of sales increased 1.9% to 17.8% primary due to year over year deflation in commodity wood product prices. Total dollars spent in selling, general and administrative expenses were up $29 million as a result of:
| · | compensation expenses for additional personnel to support increased sales volume, |
| · | expenses from acquisitions not present in the prior period and |
| · | higher delivery and occupancy expenses. |
Corporate
Corporate represents expenses to support the operations of our business segments, SelectBuild and BMC West. These costs include administrative functions for information systems, reporting, accounts payable and human resources, executive and senior management, professional fees for regulatory compliance and certain incentive compensation as well as actuarial adjustments for insurance and medical claims. These costs are not allocated to our business segments.
Selected financial results are as follows (millions):
| | | 2006 | | 2005 | | $ Change | | % Change | |
Operating expenses | | | | | | | | | | | | | | | 3 | % | |
Corporate expenses increased 3% to $75 million from $73 million a year ago. Higher compensation including the non-cash impact of share-based compensation from the adoption of a new accounting standard, was partially offset by lower performance based incentive compensation and actuarial adjustments for insurance expense. Corporate expenses at 2.3% of sales were lower than the prior year of 2.5%.
2005 COMPARED WITH 2004
The following table sets forth the amounts and percentage relationship to sales of certain costs, expenses and income items (millions):
| | | Year Ended December 31 | |
| | | 2005 | | 2004 | |
Sales | | | | | | | | | |
| Construction services | | $ | 1,586 | | | 54.5 | % | $ | 904 | | | 43.2 | % |
| Building products | | | 1,326 | | | 45.5 | | | 1,187 | | | 56.8 | |
Total sales | | | 2,912 | | | 100.0 | | | 2,091 | | | 100.0 | |
| | | | | | | | | | | | | | |
Costs and operating expenses | | | | | | | | | | | | | |
| Cost of goods sold | | | | | | | | | | | | | |
| Construction services | | | 1,286 | | | 81.1 | | | 768 | | | 85.0 | |
| Building products | | | 968 | | | 73.0 | | | 898 | | | 75.6 | |
| Total cost of goods sold | | | 2,254 | | | 77.4 | | | 1,666 | | | 79.7 | |
| Impairment of assets | | | 1 | | | ― | | | 2 | | | 0.1 | |
| Selling, general and administrative expenses | | | 421 | | | 14.5 | | | 317 | | | 15.2 | |
| Other income, net | | | (3 | ) | | (0.1 | ) | | (2 | ) | | (0.1 | ) |
| Total costs and operating expenses | | | 2,673 | | | 91.8 | | | 1,983 | | | 94.9 | |
Income from operations | | | 239 | | | 8.2 | | | 108 | | | 5.1 | |
| | | | | | | | | | | | | | |
Net income | | $ | 130 | | | 4.4 | % | $ | 54 | | | 2.6 | % |
| | | | | | | | | | | | | | |
Earnings per diluted share | | | | | | | | | | | | | |
Consolidated Financial Results
Selected financial results are as follows (millions):
| | | 2005 | | 2004 | | $ Change | | % Change | |
Sales | | | | | | | | | |
| Construction services | | $ | 1,586 | | | $ | 904 | | | $ | 682 | | | | 75 | % | |
| Building products | | | 1,326 | | | | 1,187 | | | | 139 | | | | 12 | % | |
| | | $ | 2,912 | | | $ | 2,091 | | | $ | 821 | | | | 39 | % | |
| | | | | | | | | | | | | | |
Income from operations | | $ | 239 | | | $ | 108 | | | $ | 131 | | | | 121 | % | |
Sales increased $821 million to $2.9 billion due to an increase in construction services and the acquisition of construction services businesses. Sales from acquisitions not present in the prior period were $404 million or approximately half of the increase. Strong homebuilding activity was prevalent in most of our markets, particularly the Southwest region. Building permits and housing starts were also higher in most of our markets relative to the prior year.
Income from operations for 2005 increased 121% to $239 million from $108 million in the prior year. Improved margins, particularly from demand for our construction services, were a key factor. Margins as a percent of sales for construction services were up 3.9% while building products also improved 2.7% compared to the prior year. Selling, general and administrative expenses were 14.5% of sales and improved by 70 basis points. These expenses were lower as a percent of sales due to better leveraging of these expenses at our building products operations.
Business Segments
Sales and operating income by business segment are as follows (millions):
| | | 2005 | | 2004 | |
| | | Sales | | Income from Operations | | Sales | | Income from Operations | |
| SelectBuild | | $ | 1,394 | | $ | 161 | | $ | 754 | | $ | 60 | |
| BMC West | | | 1,518 | | | 151 | | | 1,337 | | | 96 | |
| Corporate | | | ― | | | (73 | ) | | ― | | | (48 | ) |
| | | $ | 2,912 | | $ | 239 | | $ | 2,091 | | $ | 108 | |
SelectBuild
Selected financial results are as follows (millions):
| | | 2005 | | 2004 | | $ Change | | % Change | |
Sales | | $ | 1,394 | | $ | 754 | | $ | 640 | | | 85 | % | |
| Less: Acquisitions | | | (385 | ) | | ― | | | (385 | ) | | ― | | |
| | | $ | 1,009 | | $ | 754 | | $ | 255 | | | 34 | % | |
| | | | | | | | | | | | | | |
Income from operations | | $ | 161 | | $ | 60 | | $ | 101 | | | 168 | % | |
| Less: Acquisitions | | | (31 | ) | | ― | | | (31 | ) | | ― | | |
| | | $ | 130 | | $ | 60 | | $ | 70 | | | 117 | % | |
Sales increased $640 million in 2005. Acquisitions of construction services businesses not present in the same periods represented 60% of this increase. Home construction activity was strong in Las Vegas and Phoenix as well as most of our other markets. In addition, housing starts in our markets compared favorably to the prior year.
Income from operations for 2005 improved over $100 million compared to the prior year. Margin improvement was a key factor, improving 4.6% as a percent of sales to 19.3% compared to 14.7% in the prior year. Further market acceptance of the value of our construction services, particularly in the Las Vegas and Phoenix markets as well as improved management of contracts, most notably in our Florida operations, contributed to the improvement. Acquisitions also contributed approximately 30% or $31 million to the increase in operating income. Selling, general and administrative expenses specific to the business segment were $56 million higher with more than half of the increase due to acquisitions completed during the year. As a percent of sales, these expenses were 7.7% compared to 6.8% in the prior year.
BMC West
Selected financial results are as follows (millions):
| | | 2005 | | 2004 | | $ Change | | % Change | |
Sales | | $ | 1,518 | | $ | 1,337 | | $ | 181 | | | 14 | % | |
| Less: Acquisitions | | | (19 | ) | | ― | | | (19 | ) | | ― | | |
| | | $ | 1,499 | | $ | 1,337 | | $ | 162 | | | 12 | % | |
| | | | | | | | | | | | | | |
Income from operations | | $ | 151 | | $ | 96 | | $ | 55 | | | 57 | % | |
| Less: Acquisitions | | | ― | | | ― | | | ― | | | ― | | |
| | | $ | 151 | | $ | 96 | | $ | 55 | | | 57 | % | |
Sales increased $181 million in 2005 as we experienced strong housing construction across all our regions. Building permit activity for single-family homes in our markets was up 13% and compared favorably to the U.S. average of 4%. In particular, our Texas, Northwest and Intermountain regions reported strong increases in sales compared to a year ago. Our continued focus on a regional business model that provides customers with expanded choices for building products and services from multiple locations also contributed to our sales growth.
Income from operations for 2005 increased $55 million due to improved margins. Margins as a percent of sales were 2.1% higher and were 25.7% compared to 23.6% in the prior year. Inventory was effectively managed despite fluctuations during the year in commodity wood product prices. Selling, general and administrative expenses specific to the business segment were approximately $21 million higher than the preceding year. However, these expenses were effectively leveraged as they represented 15.9% of sales compared to 16.5% in the prior year.
Corporate
Corporate represents expenses to support the operations of our business segments, SelectBuild and BMC West. These costs include administrative functions for information systems, reporting, accounts payable and human resources, professional fees for regulatory compliance, executive and senior management, certain incentive compensation as well as actuarial adjustments for insurance and medical claims. These costs are not allocated to our business segments.
Selected financial results are as follows (millions):
| | | 2005 | | 2004 | | $ Change | | % Change | |
Operating expenses | | | | | | | | | | | | | | | 52 | % | |
Corporate and other expenses were $25 million higher in 2005 due to incentive compensation from improved operating performance, professional fees for regulatory compliance and additional personnel to support our expanding business. These expenses were 2.5% of sales compared to 2.3% in 2004.
LIQUIDITY AND CAPITAL RESOURCES
Cash Flows
Our primary need for capital resources is to fund working capital and acquisitions as well as finance capital expenditures. We expect to fund these requirements through a combination of cash flow from operations and seasonal borrowings under our credit facility.
For 2006, cash provided by operations was $273.4 million and funded the majority of acquisitions, capital expenditures and investments in marketable securities. The sections that follow discuss in more detail our operating, investing and financing activities as well as our financing arrangements.
Operations
Cash provided by operating activities was $273.4 million in 2006 compared to $198.3 million a year ago. Net income adjusted for non-cash items decreased $14.5 million due to slower construction activity as homebuilders curtailed production in an effort to align home inventory levels with demand. However, changes in working capital were favorable as requirements were $104.4 million less than a year ago as cash provided from accounts receivable and unbilled receivables as well as improved inventory turns were partially offset by cash used for compensation, accounts payable and billings in excess of costs and estimated earnings.
In 2005, cash provided by operating activities was $198.3 million, a significant increase from $33.4 million in 2004. Strong home construction activity and improved margins in both our construction services and building products segments resulted in higher net income, providing $75.6 million of additional operating cash flow over 2004. Also, working capital requirements were lower in 2005 than 2004 due to lower commodity wood product prices as well as improved inventory turns and days sales outstanding. This improved management of working capital resulted in cash used of $0.8 million compared to $61.3 million of cash used in 2004.
Cash provided by operating activities was $33.4 million in 2004, up significantly from $12.5 million in 2003. Strong home construction activity and our strategy to provide additional construction services resulted in higher net income, providing $34.0 million of additional operating cash flow. Net income adjusted for non-cash items was $80.4 million however, changes in working capital requirements used $61.3 million of this cash flow.
Capital Investment and Acquisitions
Cash used in investing activities was $280.3 million in 2006 or $18.7 million more than $261.6 million used in investing activities a year ago. Cash use included $201.8 million for seven acquisitions and purchase of an additional 20% interest in concrete block masonry and concrete services business. Cash used for investing activities also included capital expenditures in 2006 of $52.9 million or $6.4 million more than $46.5 million a year ago. Capital expenditures in 2006 were principally for centralization of a millwork facility in Colorado, expansion of distribution facilities in Texas and Idaho and expansion of construction service facilities in Arizona as well as expansion of our data center and construction and human resource information systems. Cash used for investing activities in 2006 also included $25.4 million for the net purchase of marketable securities pursuant to the statutory funding requirements of our captive insurance subsidiary.
In 2005, cash used in investing activities was $261.6 million compared to $58.0 million in 2004. Cash use included $203.2 million for seven acquisitions, including the purchase of interests in three businesses, and purchase of an additional 20% interest in concrete block masonry and concrete services business. Cash used for capital expenditures was $46.5 million or $18.9 million more than $27.6 million in 2004. Capital expenditures were principally for expansion of distribution facilities in Texas and Montana, construction services facilities in Las Vegas and Florida and implement construction and distribution information systems. Cash used for investing activities also included $14.1 million for the net purchase of marketable securities pursuant to the statutory funding requirements of our captive insurance subsidiary.
Cash used in investing activities was $58.0 million in 2004. Cash use included $27.7 million for property and equipment and $22.7 million for the remaining interest in a framing business, interest in a truss manufacturing business as well as the acquisition of a distribution business, windows installation business and framing business. Cash use for investing activities also included $19.0 million invested in marketable securities at our captive insurance subsidiary. The cash use was partially offset by proceeds of $12.3 million from the disposition of properties in Montana, Texas and Utah.
Financing
Cash provided by financing activities in 2006 was $51.0 million compared to $73.9 million a year ago. After cash provided by operating activities, debt was borrowed to complete eight acquisitions and purchase an additional 20% interest in concrete block masonry and concrete services business as well as expand our facilities and information systems. In November 2006, we amended our revolver and entered into a new $350 million term note. This transaction resulted in proceeds from the $350 million term note which was used to repay our previous term notes and the amount outstanding under the revolver. Remaining borrowings were used to pay dividends and invest in cash equivalents.
In 2005, cash provided by financing activities was $73.9 million compared to $24.6 million in 2004. The primary sources of cash were a $75.0 million term note and an increase in book overdrafts. In addition to strong operating cash flows, debt was borrowed to complete seven acquisitions, including the purchase of interests in three businesses, and purchase of an additional 20% interest in concrete block masonry and concrete services business as well as expand facilities and implement construction information systems.
Cash provided by financing activities was $24.6 million in 2004. The primary sources of cash were $20.8 million of net borrowings from the revolver and an increase in book overdrafts and stock options exercised net of tax benefit. After cash provided by operations, debt was borrowed to purchase property and equipment, purchase the remaining interest in a framing business, an interest in a truss manufacturing business, and complete three acquisitions.
Financing Arrangements
Our debt structure consists of a revolver, term note and other borrowings.
Revolver
In November 2006, we entered into an amended $500 million revolver with a group of lenders. The revolver matures in November 2011. The revolver consists of both LIBOR and Prime based borrowings. These variable interest rates are subject to quarterly adjustment based on operating performance and range from LIBOR plus 1.00% to 2.00%, or Prime plus 0.00% to 0.75%. Interest is paid quarterly. As of December 31, 2006, no amount was outstanding under the revolver.
Term Note
In November 2006, we entered into a $350 million term note with a group of lenders. The term note matures in November 2013 and is payable in quarterly installments for the first seven years in amounts equal to 1% of the initial principal per year and the remaining principal due November 2013. The variable interest rate for the term note is LIBOR plus 2.50%, or Prime plus 1.25%. Interest is paid quarterly. As of December 31, 2006, $349.1 million was outstanding under this term note.
Other
Other long-term debt of $8.2 million consists of term notes, equipment notes and capital leases for equipment. Interest rates vary and dates of maturity are through March 2021.
Expansion of Credit Facility, Covenants and Maturities
The credit facility consists of the revolver and term note. The credit facility may be increased an aggregate amount of up to $250 million. The credit facility is collateralized by tangible and intangible property of our wholly-owned subsidiaries, except the assets of our captive insurance subsidiary. The credit facility contains covenants and conditions requiring the maintenance of certain financial ratios. At December 31, 2006, we were in compliance with these covenants and conditions.
Scheduled maturities of long-term debt are as follows (thousands):
| 2007 | | $ | 8,143 | |
| 2008 | | | 4,894 | |
| 2009 | | | 4,208 | |
| 2010 | | | 3,898 | |
| 2011 | | | 3,716 | |
| Thereafter | | | 332,445 | |
| | | $ | 357,304 | |
As of December 31, 2006 and December 31, 2005 there were $95.8 million and $75.9 million, respectively of letters of credit outstanding that guaranteed performance or payment to third parties. These letters of credit reduce borrowing availability under the revolver.
Hedging Activities
Derivative and hedging activities are recorded on the balance sheet at their fair values. In November 2006, we entered into interest rate swap contracts that effectively convert $200 million of the variable rate borrowings of the $349.1 million term note to a fixed interest rate of 7.59% through November 2012, thus reducing the impact of increases in interest rates on future interest expense. Approximately 57% of the outstanding variable rate borrowings of the term note as of December 31, 2006 have been hedged through the designation of interest rate swap contracts accounted for as cash flow hedges. After giving effect to the interest rate swap contracts, total borrowings were 58% fixed and 42% variable.
The fair value of derivative instruments is based on pricing models using current market rates. The fair value of the interest rate swap contracts was a long-term liability of $0.9 million as of December 31, 2006. The effective portion was recorded in accumulated other comprehensive income, net, a separate component of shareholders’ equity, and is subsequently reclassified into earnings in the same financial statement line item, interest expense, in the same period during which the hedged transaction is recognized in earnings. A corresponding deferred tax asset of $0.3 million was also recorded in accumulated other comprehensive income, net for the income tax related to the estimated fair value of the interest rate swap contracts. The ineffective portion of the change in the value of the interest rate swap contracts is immediately recognized as a component of interest expense. Hedge ineffectiveness for the period ended December 31, 2006 was not significant. Management may choose not to swap variable rates to fixed rates or may terminate a previously executed swap if the variable rate positions are more beneficial.
In June 2004, we entered into interest rate swap contracts that effectively converted $100 million of variable rate borrowings to a fixed interest rate. These swaps were settled in November 2006 and the $1.5 million gain recognized for this settlement was reclassified to other income, net from accumulated other comprehensive income, net.
Equity
On February 14, 2006, our Board of Directors approved a two for one split of our outstanding common shares. Shareholders of record as of February 28, 2006 received a stock dividend of one additional common share for every common share they owned. All share and per share information for all periods presented has been adjusted to reflect this share split.
At the annual meeting of shareholders on May 3, 2005, our shareholders voted to increase the number of authorized common shares to 50 million from 20 million. These additional shares may be issued for reasons including but not limited to stock splits, financing acquisitions, establishing strategic relationships with corporate partners and providing equity incentives.
In the third quarter of 1998, we filed a shelf registration with the Securities and Exchange Commission to register 4 million common shares. We may issue these shares in connection with future business acquisitions, combinations or mergers. Shares have been issued from this registration statement for a portion of the purchase price for acquisitions. There are approximately 3.7 million shares remaining and available under this shelf registration.
Based on our historical ability to generate cash flows from operations, borrowing capacity under the credit facility and access to debt and equity markets, management believes it will have sufficient capital to meet anticipated needs.
OFF-BALANCE SHEET ARRANGEMENTS
As part of our ongoing business, we do not participate in transactions that generate relationships with unconsolidated entities or financial partnerships often referred to as structured finance or special purpose entities which might be established to facilitate off-balance sheet arrangements or other contractually narrow or limited purposes. As of December 31, 2006, we are not involved in any transactions with unconsolidated entities.
DISCLOSURES OF CONTRACTUAL OBLIGATIONS AND COMMERCIAL COMMITMENTS
Contractual obligations as of December 31, 2006 (millions):
| | | Payments Due by Period | | | |
Contractual Obligations | | Less than 1 Year | | 1-3 Years | | 3-5 Years | | More than 5 Years | | Total | | Fair Value | |
| Long-term debt | | | $7.9 | | | $8.9 | | | $7.6 | | | $332.4 | | | $356.8 | | | $355.8 | |
| Capital lease obligations | | | 0.2 | | | 0.3 | | | — | | | — | | | 0.5 | | | 0.4 | |
| Operating leases | | | 26.4 | | | 43.9 | | | 24.2 | | | 15.4 | | | 109.9 | | | 109.9 | |
| Unconditional purchase obligations | | | — | | | — | | | — | | | — | | | — | | | — | |
| Other long-term commitments | | | — | | | — | | | — | | | — | | | — | | | — | |
| | | | $34.5 | | | $53.1 | | | $31.8 | | | $347.8 | | | $467.2 | | | $466.1 | |
| | | | | | | | | | | | | | | | | | | | |
| Interest rate swap contracts | | | | | | | | | | | | | | | | | | | |
| Notional principal amount of interest rate exchange agreements maturing | | | | | | | | | | | | | | | | | | | |
| Variable to fixed | | | | | | | | | | | | | | | | | | 0.9 | |
| Average pay rate | | | | | | | | | | | | | | | 5.09% | | | | |
| Average receive rate | | | | | | | | | | | | | | | 5.12% | | | | |
| | | | | | | | | | | | | | | | | | | $467.0 | |
Accelerated repayment of our revolver and term note may occur if certain financial conditions or warranties and representations are not met. The credit facility consists of the revolver and term note. The credit facility is collateralized by all tangible and intangible property, except assets of the captive insurance subsidiary. The credit facility contains covenants and conditions requiring the maintenance of certain financial ratios. At December 31, 2006, we were in compliance with these covenants and conditions.
We have potential put obligations and call rights associated with the interests in Riggs Plumbing, RCI Construction, A-1 Truss and WBC Mid-Atlantic that we do not currently own. Under the purchase agreements, we have the right to purchase the remaining portions during certain periods or if certain conditions are met. Likewise, the other owners have the option to require us to purchase the remaining portions during certain periods. The purchase price for the remaining portions will be based generally on a multiple of historical earnings.
As part of our revolver, we have $95.8 million in letters of credit outstanding principally for the deductible portion of automobile, general liability and workers’ compensation claims. These obligations are not required to be recorded on our balance sheet and renew automatically on their various anniversary dates or until released by their respective beneficiaries.
QUANTITATIVE AND QUALITATIVE DISCLOSURES ABOUT MARKET RISK
Prices of commodity wood products, which are subject to significant volatility, may adversely impact operating income when prices rapidly rise or fall within a relatively short period of time. We do not use derivative financial instruments to hedge commodity wood product prices.
Changes in interest expense occur when market interest rates change. Changes in the amount of debt could also increase interest rate risks. We use interest rate swap contracts to hedge interest rate risks. Approximately 57% of the outstanding variable rate borrowings of the $349.1 million term note as of December 31, 2006 have been hedged through the designation of interest rate swap contracts accounted for as cash flow hedges. After giving effect to the interest rate swap contracts, total borrowings are 58% fixed and 42% variable. Based on debt outstanding as of December 31, 2006, a 0.25% increase in interest rates would result in approximately $0.4 million of additional interest expense annually.
CRITICAL ACCOUNTING ESTIMATES
Preparing financial statements requires management to make estimates and assumptions that affect the reported amounts of assets, liabilities, revenues and expenses. These estimates and assumptions include critical accounting estimates which are defined by the Securities and Exchange Commission as those that are the most important to the portrayal of our financial condition, results of operations or cash flows. These estimates require management’s subjective and complex judgments often as a result of the need to estimate matters that are inherently uncertain. We review the development, selection and disclosure of these estimates with our Audit Committee. Management believes the estimates utilized are reasonable under the circumstances, however actual results could differ from these estimates and may require adjustment in future periods. Our critical accounting estimates are:
· Revenue Recognition for Construction Services
The percentage-of-completion method is used to recognize revenue for construction services. Periodic estimates of our progress towards completion are made based on a comparison of labor costs incurred to date with total estimated contract costs for labor. The percentage-of-completion method requires the use of various estimates, including among others, the extent of progress towards completion, contract revenues and contract completion costs. Contract revenues and contract costs to be recognized are dependent on the accuracy of estimates, including quantities of materials, labor productivity and other cost estimates. We have a history of making reasonable estimates of the extent of progress towards completion, contract revenues and contract completion costs. However, due to uncertainties inherent in the estimation process, it is possible that actual completion costs may vary from estimates. Revisions of contract revenues and cost estimates as well as provisions for estimated losses on uncompleted contracts are recognized in the period such revisions are known.
| · | Estimated Losses on Uncompleted Contracts and Changes in Contract Estimates |
Estimated losses on uncompleted contracts and changes in contract estimates are established by assessing estimated costs to complete, change orders and claims for uncompleted contracts. Revisions of estimated losses are recognized in the period such revisions are known.
At December 31, 2006, the reserve for these estimated losses was $0.1 million for SelectBuild and less than $0.1 million for BMC West. These reserves are established by assessing estimated costs to complete, change orders and claims. Assumptions for estimated costs to complete include material prices, labor costs, labor productivity and contract claims. Such estimates are inherently uncertain and therefore it is possible that actual completion costs may vary from these estimates. We have a history of making reasonable estimates of the extent of progress towards completion, contract revenue and contract completion costs. However, due to uncertainties inherent in the estimation process, it is possible that actual completion costs may vary from estimates.
· Goodwill
Goodwill represents the excess of purchase price over the fair values of net tangible and identifiable intangible assets of acquired businesses. An annual assessment for impairment is completed in the fourth quarter and whenever events and circumstances indicate the carrying amount may not be recoverable. An impairment is recognized if the carrying amount is more than the estimated future operating cash flows as measured by fair value techniques.
At December 31, 2006, goodwill was $287.1 million for SelectBuild and $20.9 million for BMC West. The impairment assessment includes determining the estimated fair value of reporting units based on discounting the future operating cash flows using a discount rate reflecting our estimated average cost of funds. Future operating cash flows are derived from our budget information, which includes assumptions of future volumes, pricing of commodity products and labor costs. Prices for commodity products are inherently volatile.
Due to the variables associated with prices of commodity products and the effects of changes in circumstances, both the precision and reliability of the estimates of future operating cash flows are subject to uncertainty. As additional information becomes known, we may change our estimates.
· Insurance Deductible Reserves
The estimated cost of automobile liability, general liability and workers’ compensation claims is determined by actuarial methods. Claims in excess of insurance deductibles are insured with third-party insurance carriers. Reserves for claims are recognized based on the estimated costs of these claims as limited by deductibles of the applicable insurance policies. Revisions of estimated claims are recognized in the period such revisions are known.
At December 31, 2006, the reserve for automobile, general liability and workers’ compensation claims was $50.8 million. The actuarial assessment includes determining the estimated cost of claims. The reserve for these claims is susceptible to change based on the estimated cost of the claims. Actual loss experience substantially different than the actuarial assumptions may occur. Future reserves are subject to the nature and frequency of claims, medical cost inflation and changes in the insurance deductibles of the applicable insurance policies.
· Warranties
The estimated cost of warranties for certain construction services is based on the nature and frequency of claims, anticipated claims and cost per claim. Claims in excess of insurance deductibles are insured with third-party insurance carriers. Estimated costs for warranties are recognized when the revenue associated with the service is recognized. Revisions of estimated warranties are recognized in the period such revisions are known.
At December 31, 2006, the reserve for warranties was $7.2 million. Specific terms and conditions for warranties vary from one year to ten years and are based on geographic market and state regulations. The reserve for these claims is susceptible to change based on the estimated cost of the claim. We have a history of making reasonable estimates of warranties. However, due to uncertainties inherent in the estimation process, it is possible that actual warranty costs may vary from estimates. Revisions of estimated warranties are recognized in the period such revisions are known.
· Share-based Compensation
Our estimates of the fair values of our share-based payment transactions are based on the modified Black-Scholes-Merton model. In order to meet the fair value measurement objective, we are required to develop estimates regarding expected exercise patterns, share price volatility, forfeiture rates, risk-free interest rate and dividend yield. These assumptions are based principally on historical experience. When circumstances indicate the availability of new or different information that would be useful in estimating these assumptions, revisions will be made and recognized in the periods such revisions are known. Due to uncertainties inherent in these assumptions, it is possible that actual share-based compensation may vary from this estimate.
RECENT ACCOUNTING PRINCIPLES
In September 2006, the Securities Exchange Commission issued Staff Accounting Bulletin No. 108, Considering the Effect of Prior Year Misstatements when Quantifying Misstatements in Current Year Financial Statements. This accounting principle provides specific guidance for considering the effects of prior year misstatements in quantifying current year misstatements. This accounting principle was adopted effective January 2006 and had no impact on consolidated financial position, results of operations or cash flows.
In June 2006, the Financial Accounting Standards Board issued Interpretation No. 48, Accounting for Uncertainty in Income Taxes. This accounting principle provides specific guidance for measurement, recognition and disclosure of uncertain tax positions. This accounting principle was adopted January 2007 and is not expected to have a significant impact on consolidated financial position, results of operations or cash flows.
BUSINESS RISKS AND FORWARD-LOOKING STATEMENTS
There are a number of business risks and uncertainties that affect our operations and therefore could cause future results to differ from past performance or expected results. Additional information regarding business risks and uncertainties is contained in Item 1A of this Form 10-K. These risks and uncertainties may include, however are not limited to:
| · | demand for and supply of single-family homes which is influenced by changes in the overall condition of the U.S. economy, including interest rates, job formation, consumer confidence and other important factors; |
| · | the integration of acquired businesses may not result in anticipated cost savings and revenue synergies being fully realized or may take longer to realize than expected; |
| · | our ability to identify suitable acquisition candidates; |
| · | availability of and our ability to attract, train and retain qualified individuals; |
| · | our ability to implement and maintain cost structures that align with revenue growth; |
| · | changes in the business models of our customers may limit our ability to provide construction services and building products required by our customers; |
| · | fluctuations in our costs and availability of sourcing channels for commodity wood products, concrete, steel and other building materials; |
| · | weather conditions including natural catastrophic events; |
| · | exposure to construction defect and product liability claims as well as other legal proceedings; |
| · | disruptions in our information systems; |
| · | actual and perceived vulnerabilities as a result of terrorist activities and armed conflict; |
| · | costs and/or restrictions associated with federal, state and other regulations; and |
| · | numerous other matters of a local and regional scale, including those of a political, economic, business, competitive or regulatory nature. |
Risks related to our shares may include, however are not limited to:
| · | price for our shares may fluctuate significantly; and |
| · | anti-takeover defenses and certain provisions could prevent an acquisition of our company or limit share price. |
Certain statements in the Annual Report to Shareholders including those related to expectations about homebuilding activity in our markets, demographic trends supporting homebuilding and anticipated sales and operating income are forward-looking statements within the meaning of the Private Securities Litigation Reform Act of 1995. Statements that are not historical or current facts, including statements about our expectations, anticipated financial results and future business prospects are forward-looking statements. While these statements represent our current judgment on what the future may hold and we believe these judgments are reasonable, these statements involve risks and uncertainties that are important factors that could cause our actual results to differ materially from those in forward-looking statements. These factors include, however are not limited to the risks and uncertainties cited in the above paragraph. Undue reliance should not be placed on such forward-looking statements, as such statements speak only as of the date of the filing of this Form 10-K. We undertake no obligation to update forward-looking statements.
| ITEM 7A. | Quantitative and Qualitative Disclosures About Market Risk |
Inventory Price Risk
Prices of commodity wood products, which are subject to significant volatility, may adversely impact operating income when prices rapidly rise or fall within a relatively short period of time. We do not use derivative financial instruments to hedge commodity wood product prices.
Interest Rate Risk
Changes in interest expense occur when market interest rates change. Changes in the amount of debt could also increase interest rate risks. Interest rate swap contracts are currently utilized to hedge interest rate risks. Approximately 57% of the outstanding variable rate borrowings of the $349.1 million term note as of December 31, 2006 have been hedged through the designation of interest rate swap contracts accounted for as cash flow hedges. After giving effect to the interest rate swap contracts, total borrowings are 58% fixed and 42% variable. Based on debt outstanding as of December 31, 2006, a 0.25% increase in interest rates would result in approximately $0.4 million of additional interest expense annually.
| ITEM 8. | Financial Statements and Supplementary Data |
Building Materials Holding Corporation
Consolidated Statements of Income
(thousands, except per share data)
| | | Year Ended December 31 | |
| | | 2006 | | 2005 | | 2004 | |
Sales | | | | | | | |
| Construction services | | $ | 1,926,077 | | $ | 1,586,509 | | $ | 904,362 | |
| Building products | | | 1,319,092 | | | 1,325,651 | | | 1,186,663 | |
Total sales | | | 3,245,169 | | | 2,912,160 | | | 2,091,025 | |
| | | | | | | | | | | |
Costs and operating expenses | | | | | | | | | | |
| Cost of goods sold | | | | | | | | | | |
| Construction services | | | 1,557,324 | | | 1,285,949 | | | 768,407 | |
| Building products | | | 960,565 | | | 967,877 | | | 897,725 | |
| Impairment of assets | | | 2,237 | | | 1,320 | | | 2,274 | |
| Selling, general and administrative expenses | | | 531,958 | | | 420,862 | | | 317,002 | |
| Other income, net | | | (4,370 | ) | | (3,204 | ) | | (2,491 | ) |
| Total costs and operating expenses | | | 3,047,714 | | | 2,672,804 | | | 1,982,917 | |
| | | | | | | | | | | |
Income from operations | | | 197,455 | | | 239,356 | | | 108,108 | |
| | | | | | | | | | | |
| Interest expense | | | 29,082 | | | 14,420 | | | 13,560 | |
| | | | | | | | | | | |
| Income before income taxes and minority interests | | | 168,373 | | | 224,936 | | | 94,548 | |
| | | | | | | | | | | |
| Income taxes | | | 56,806 | | | 79,915 | | | 35,198 | |
| | | | | | | | | | | |
| Minority interests income, net of income taxes | | | (9,493 | ) | | (15,514 | ) | | (5,440 | ) |
| | | | | | | | | | | |
Net income | | $ | 102,074 | | $ | 129,507 | | $ | 53,910 | |
| | | | | | | | | | | |
Net income per share: | | | | | | | | | | |
| Basic | | | $3.57 | | | $4.61 | | | $2.00 | |
| Diluted | | | $3.45 | | | $4.41 | | | $1.94 | |
The accompanying notes are an integral part of these consolidated financial statements.
Building Materials Holding Corporation
Consolidated Balance Sheets
(thousands, except share data)
| | | December 31 | | | | December 31 |
| | | 2006 | 2005 | | | | 2006 | 2005 |
ASSETS | | | | | | | LIABILITIES, MINORITY INTERESTS AND SHAREHOLDERS’ EQUITY | | | | | |
| Cash and cash equivalents | $ | 74,272 | | $ | 30,078 | | | | | | | |
| Marketable securities | | 4,337 | | | 3,645 | | Accounts payable | $ | 110,961 | | $ | 146,627 |
| Receivables, net of allowances | | | | | | | Accrued compensation | | 48,552 | | | 65,928 |
| of $4,487 and $3,756 | | 279,829 | | | 363,527 | | Insurance deductible reserves | | 24,931 | | | 21,872 |
| Inventory | | 144,366 | | | 168,282 | | Other accrued liabilities | | 103,402 | | | 51,579 |
| Unbilled receivables | | 43,527 | | | 56,128 | | Billings in excess of costs and estimated | | | | | |
| Deferred income taxes | | 8,914 | | | 5,768 | | earnings | | 27,622 | | | 33,799 |
| Prepaid expenses and other | | 11,166 | | | 6,967 | | Current portion of long-term debt | | 8,143 | | | 10,131 |
| Total current assets | | 566,411 | | | 634,395 | | Total current liabilities | | 323,611 | | | 329,936 |
| | | | | | | | | | | | | |
| Property and equipment | | | | | | | Deferred income taxes | | 9,138 | | | 6,911 |
| Land | | 62,367 | | | 47,328 | | Insurance deductible reserves | | 25,841 | | | 20,753 |
| Buildings and improvements | | 139,602 | | | 118,556 | | Long-term debt | | 349,161 | | | 278,169 |
| Equipment | | 188,285 | | | 166,633 | | Other long-term liabilities | | 41,390 | | | 30,689 |
| Construction in progress | | 8,579 | | | 9,485 | | Total liabilities | | 749,141 | | | 666,458 |
| Accumulated depreciation | | (139,342) | | | (121,525) | | | | | | | |
| Marketable securities | | 53,513 | | | 28,875 | | Minority interests | | 7,141 | | | 14,006 |
| Deferred loan costs | | 5,481 | | | 3,616 | | | | | | | |
| Other long-term assets | | 27,223 | | | 20,465 | | Commitments and contingent liabilities | | — | | | ― |
| Other intangibles, net | | 108,792 | | | 55,227 | | | | | | | |
| Goodwill | | 308,000 | | | 187,470 | | Shareholders’ equity | | | | | |
| Total assets | $ | 1,328,911 | | $ | 1,150,525 | | Common shares, $0.001 par value: | | | | | |
| | | | | | | | authorized 50 million; issued and | | | | | |
| | | | | | | | outstanding 29,153,331 and 28,758,580 | | | | | |
| | | | | | | | shares | | 29 | | | 29 |
| | | | | | | | Additional paid-in capital | | 154,405 | | | 143,780 |
| | | | | | | | Unearned compensation | | — | | | (2,698) |
| | | | | | | | Retained earnings | | 418,927 | | | 328,463 |
| | | | | | | | Accumulated other comprehensive | | | | | |
| | | | | | | | (loss) income, net | | (732) | | | 487 |
| | | | | | | | Total shareholders’ equity | | 572,629 | | | 470,061 |
| | | | | | | | Total liabilities, minority interests and
shareholders’ equity | $ | 1,328,911 | | $ | 1,150,525 |
The accompanying notes are an integral part of these consolidated financial statements.
Building Materials Holding Corporation
Consolidated Statements of Shareholders’ Equity
(thousands)
| | | | | | | | | | | | | Accumulated Other Comprehensive Income (Loss) | | | |
| | | | | | | | | | | | | Net Unrealized Gain (Loss) From | | | |
| | | Common Shares | | Additional Paid-In | | Unearned | | Retained | | Interest Rate Swap | | Marketable | | | |
| | | Shares | | Amount | | Capital | | Compensation | | Earnings | | Contracts | | Securities | | Total | |
Balance at December 31, 2003 | | | 26,667 | | $ | 27 | | $ | 115,268 | | $ | ― | | $ | 155,715 | | $ | ― | | $ | ― | | $ | 271,010 | |
| | | | | | | | | | | | | | | | | | | | | | | | | | |
| Net income | | | — | | | — | | | — | | | — | | | 53,910 | | | — | | | — | | | 53,910 | |
| Unrealized loss | | | — | | | — | | | — | | | — | | | — | | | (2,215 | ) | | — | | | (2,215 | ) |
| Tax benefit for unrealized loss | | | — | | | — | | | — | | | — | | | — | | | 853 | | | — | | | 853 | |
| Unrealized gain | | | — | | | — | | | — | | | — | | | — | | | — | | | 5 | | | 5 | |
| Taxes for unrealized gain | | | — | | | — | | | — | | | — | | | — | | | — | | | (2 | ) | | (2 | ) |
Comprehensive income | | | | | | | | | | | | | | | | | | | | | | | | 52,551 | |
| | | | | | | | | | | | | | | | | | | | | | | | | | |
| Share options exercised | | | 825 | | | 1 | | | 5,008 | | | — | | | — | | | — | | | — | | | 5,009 | |
| Tax benefit for share options exercised | | | — | | | — | | | 2,041 | | | — | | | — | | | — | | | — | | | 2,041 | |
| Shares issued from Director Plan | | | 33 | | | — | | | 285 | | | — | | | — | | | — | | | — | | | 285 | |
| Shares issued from Employee Plan | | | 31 | | | — | | | 356 | | | — | | | — | | | — | | | — | | | 356 | |
| Issuance of restricted shares | | | 149 | | | — | | | 1,622 | | | (1,622 | ) | | — | | | — | | | — | | | ― | |
| Earned compensation expense | | | — | | | — | | | — | | | 239 | | | — | | | — | | | — | | | 239 | |
| Cash dividends on common shares | | | — | | | — | | | — | | | — | | | (3,813 | ) | | — | | | — | | | (3,813 | ) |
Balance at December 31, 2004 | | | 27,705 | | | 28 | | | 124,580 | | | (1,383 | ) | | 205,812 | | | (1,362 | ) | | 3 | | | 327,678 | |
| | | | | | | | | | | | | | | | | | | | | | | | | | |
| Net income | | | — | | | — | | | — | | | — | | | 129,507 | | | — | | | — | | | 129,507 | |
| Unrealized gain | | | — | | | — | | | — | | | — | | | — | | | 3,412 | | | — | | | 3,412 | |
| Taxes for unrealized gain | | | — | | | — | | | — | | | — | | | — | | | (1,314 | ) | | — | | | (1,314 | ) |
| Unrealized loss | | | — | | | — | | | — | | | — | | | — | | | — | | | (410 | ) | | (410 | ) |
| Tax benefit for unrealized loss | | | — | | | — | | | — | | | — | | | — | | | — | | | 158 | | | 158 | |
Comprehensive income | | | | | | | | | | | | | | | | | | | | | | | | 131,353 | |
| | | | | | | | | | | | | | | | | | | | | | | | | | |
| Share options exercised | | | 861 | | | 1 | | | 4,904 | | | — | | | — | | | — | | | — | | | 4,905 | |
| Tax benefit for share options exercised | | | — | | | — | | | 9,140 | | | — | | | — | | | — | | | — | | | 9,140 | |
| Shares issued from Director Plan | | | 14 | | | — | | | 380 | | | — | | | — | | | — | | | — | | | 380 | |
| Shares issued from Employee Plan | | | 36 | | | — | | | 1,160 | | | — | | | — | | | — | | | — | | | 1,160 | |
| Shares issued for acquisition | | | 34 | | | — | | | 1,000 | | | — | | | — | | | — | | | — | | | 1,000 | |
| Issuance of restricted shares | | | 109 | | | — | | | 2,616 | | | (2,616 | ) | | — | | | — | | | — | | | ― | |
| Earned compensation expense | | | — | | | — | | | — | | | 1,301 | | | — | | | — | | | — | | | 1,301 | |
| Cash dividends on common shares | | | — | | | — | | | — | | | | | | (6,856 | ) | | — | | | — | | | (6,856 | ) |
Balance at December 31, 2005 | | | 28,759 | | | 29 | | | 143,780 | | | (2,698 | ) | | 328,463 | | | 736 | | | (249 | ) | | 470,061 | |
| | | | | | | | | | | | | | | | | | | | | | | | | | |
| Net income | | | — | | | — | | | — | | | — | | | 102,074 | | | — | | | — | | | 102,074 | |
| Unrealized loss | | | — | | | — | | | — | | | — | | | — | | | (880 | ) | | — | | | (880 | ) |
| Tax benefit for unrealized loss | | | — | | | — | | | — | | | — | | | — | | | 332 | | | — | | | 332 | |
| Unrealized gain | | | — | | | — | | | — | | | — | | | — | | | 262 | | | — | | | 262 | |
| Taxes for unrealized gain | | | — | | | — | | | — | | | — | | | — | | | (101 | ) | | — | | | (101 | ) |
| | | | | | | | | | | | | | | | | | | | | | | | | | |
| Realized gain | | �� | — | | | — | | | — | | | — | | | — | | | (1,459 | ) | | — | | | (1,459 | ) |
| Taxes for realized gain | | | — | | | — | | | — | | | — | | | — | | | 562 | | | — | | | 562 | |
| | | | | | | | | | | | | | | | | | | | | | | | | | |
| Unrealized loss | | | — | | | — | | | — | | | — | | | — | | | — | | | 127 | | | 127 | |
| Tax benefit for unrealized loss | | | — | | | — | | | — | | | — | | | — | | | — | | | (62 | ) | | (62 | ) |
Comprehensive income | | | | | | | | | | | | | | | | | | | | | | | | 100,855 | |
| | | | | | | | | | | | | | | | | | | | | | | | | | |
Reclassify unearned compensation - restricted shares | | | — | | | — | | | (2,698 | ) | | 2,698 | | | — | | | — | | | — | | | — | |
| Earned compensation - options | | | — | | | — | | | 5,103 | | | — | | | — | | | — | | | — | | | 5,103 | |
| Earned compensation - restricted shares | | | — | | | — | | | 3,107 | | | — | | | — | | | — | | | — | | | 3,107 | |
| Issuance of restricted shares | | | 138 | | | — | | | — | | | — | | | — | | | — | | | — | | | — | |
| Share options exercised | | | 176 | | | — | | | 1,292 | | | — | | | — | | | — | | | — | | | 1,292 | |
| Tax benefit for share options exercised | | | — | | | — | | | 1,457 | | | — | | | — | | | — | | | — | | | 1,457 | |
| Shares issued from Director Plan | | | 12 | | | — | | | 415 | | | — | | | — | | | — | | | — | | | 415 | |
| Shares issued from Employee Plan | | | 68 | | | — | | | 1,949 | | | — | | | — | | | — | | | — | | | 1,949 | |
| Cash dividends on common shares | | | — | | | — | | | — | | | — | | | (11,610 | ) | | — | | | — | | | (11,610 | ) |
Balance at December 31, 2006 | | | 29,153 | | $ | 29 | | $ | 154,405 | | $ | — | | $ | 418,927 | | $ | (548 | ) | $ | (184 | ) | $ | 572,629 | |
The accompanying notes are an integral part of these consolidated financial statements.
Building Materials Holding Corporation
Consolidated Statements of Cash Flows
(thousands)
| | | Year Ended December 31 | |
| | | 2006 | | 2005 | | 2004 | |
Operating Activities | | | | | | | |
| Net income | | $ | 102,074 | | $ | 129,507 | | $ | 53,910 | |
| Items in net income not using (providing) cash: | | | | | | | | | | |
| Minority interests, net | | | 9,493 | | | 15,514 | | | 5,440 | |
| Depreciation and amortization | | | 45,284 | | | 27,363 | | | 22,815 | |
| Deferred loan cost amortization | | | 1,359 | | | 704 | | | 497 | |
| Impairment of assets | | | 2,237 | | | 1,320 | | | 2,274 | |
| Share-based compensation | | | 8,917 | | | 1,855 | | | 577 | |
| Loss (gain) on sale of assets, net | | | 207 | | | (194 | ) | | 334 | |
| Realized gain on interest rate swap contracts | | | (1,459 | ) | | — | | | — | |
| Realized loss on marketable securities | | | 206 | | | — | | | — | |
| Deferred income taxes | | | (1,125 | ) | | (3,473 | ) | | (7,490 | ) |
| Tax benefit for share options | | | — | | | 9,140 | | | 2,041 | |
| Changes in assets and liabilities, net of effects of acquisitions and sales of business units: | | | | | | | | | | |
| Receivables, net | | | 128,381 | | | (19,049 | ) | | (45,687 | ) |
| Inventory | | | 43,873 | | | (3,332 | ) | | (40,258 | ) |
| Unbilled receivables | | | 22,702 | | | (8,378 | ) | | (8,571 | ) |
| Prepaid expenses and other current assets | | | (3,915 | ) | | 4,340 | | | (1,895 | ) |
| Accounts payable | | | (43,483 | ) | | 1,852 | | | 11,413 | |
| Accrued compensation | | | (18,823 | ) | | 24,465 | | | 15,643 | |
| Insurance deductible reserves | | | 3,059 | | | 5,777 | | | 3,045 | |
| Other accrued liabilities | | | 1,483 | | | (4,611 | ) | | 5,777 | |
| Billings in excess of costs and estimated earnings | | | (29,734 | ) | | (1,911 | ) | | (795 | ) |
| Other long-term assets and liabilities | | | 1,588 | | | 18,181 | | | 13,057 | |
| Other, net | | | 1,094 | | | (776 | ) | | 1,247 | |
| Cash flows provided by operating activities | | | 273,418 | | | 198,294 | | | 33,374 | |
| | | | | | | | | | | |
Investing Activities | | | | | | | | | | |
| Purchases of property and equipment | | | (52,873 | ) | | (46,540 | ) | | (27,652 | ) |
| Acquisitions and investments in businesses, net of cash acquired | | | (201,754 | ) | | (203,201 | ) | | (22,738 | ) |
| Proceeds from dispositions of property and equipment | | | 2,944 | | | 1,358 | | | 12,278 | |
| Purchase of marketable securities | | | (54,700 | ) | | (20,623 | ) | | (19,375 | ) |
| Proceeds from sales of marketable securities | | | 29,270 | | | 6,546 | | | 349 | |
| Other, net | | | (3,150 | ) | | 892 | | | (871 | ) |
| Cash flows used by investing activities | | | (280,263 | ) | | (261,568 | ) | | (58,009 | ) |
| | | | | | | | | | | |
Financing Activities | | | | | | | | | | |
| Net (payments) borrowings under revolver | | | (77,500 | ) | | (3,700 | ) | | 20,800 | |
| Borrowings under term note | | | 350,000 | | | 75,000 | | | ― | |
| Principal payments on term notes | | | (197,750 | ) | | (1,251 | ) | | (1,250 | ) |
| Net payments on other notes | | | (6,109 | ) | | (7,605 | ) | | (932 | ) |
| (Decrease) increase in book overdrafts | | | (2,902 | ) | | 17,404 | | | 5,411 | |
| Proceeds from share options exercised | | | 1,292 | | | 4,905 | | | 5,008 | |
| Tax benefit for share options | | | 1,457 | | | — | | | — | |
| Dividends paid | | | (10,853 | ) | | (5,807 | ) | | (3,505 | ) |
| Deferred financing costs | | | (3,224 | ) | | (2,236 | ) | | (175 | ) |
| Distributions to minority interests | | | (5,731 | ) | | (2,792 | ) | | (728 | ) |
| Other, net | | | 2,359 | | | (62 | ) | | (4 | ) |
| Cash flows provided by financing activities | | | 51,039 | | | 73,856 | | | 24,625 | |
| | | | | | | | | | | |
Increase (Decrease) in Cash and Cash Equivalents | | | 44,194 | | | 10,582 | | | (10 | ) |
| | | | | | | | | | | |
| Cash and cash equivalents, beginning of year | | | 30,078 | | | 19,496 | | | 19,506 | |
| Cash and cash equivalents, end of year | | $ | 74,272 | | $ | 30,078 | | $ | 19,496 | |
| | | | | | | | | | | |
Supplemental Disclosure of Cash Flow Information | | | | | | | | | | |
| Accrued but unpaid dividends | | $ | 2,915 | | $ | 2,158 | | $ | 1,108 | |
| Cash paid for interest | | $ | 28,185 | | $ | 13,682 | | $ | 12,902 | |
| Cash paid for income taxes | | $ | 69,568 | | $ | 70,553 | | $ | 37,777 | |
| | | | | | | | | | | |
Supplemental Schedule of Non-cash Investing Activities | | | | | | | | | | |
| Fair value of assets acquired | | $ | 285,957 | | $ | 337,924 | | $ | 25,353 | |
| Liabilities assumed | | $ | 84,203 | | $ | 132,114 | | $ | 2,615 | |
| Cash paid | | $ | 201,754 | | $ | 203,201 | | $ | 22,738 | |
The accompanying notes are an integral part of these consolidated financial statements.
Notes to Consolidated Financial Statements
1. Summary of Significant Accounting Policies
Nature of Operations
Building Materials Holding Corporation (BMHC) provides construction services and building products to professional homebuilders and contractors in western and southern regions of the United States. We operate through two separately managed and reportable business segments: SelectBuild and BMC West. SelectBuild provides framing and other construction services to high-volume homebuilders in 16 of the top 25 single-family construction markets. BMC West distributes building materials, manufactures building components (millwork, floor and roof trusses and wall panels) and provides construction services to professional builders and contractors through a network of 41 distribution facilities and 60 manufacturing facilities.
Principles of Consolidation
The consolidated financial statements include the accounts of BMHC and its subsidiaries. All significant intercompany balances and transactions are eliminated.
Use of Estimates
The preparation of financial statements in conformity with U.S. generally accepted accounting principles requires management to make estimates and assumptions that affect the reported amounts of assets and liabilities and contingent assets and liabilities at the date of the financial statements as well as the reported amounts of sales and expenses during the reporting period. Actual amounts may differ materially from those estimates. The following critical accounting estimates require our subjective and complex judgment often as a result of the need to estimate matters that are inherently uncertain:
· Revenue Recognition for Construction Services
The percentage-of-completion method is used to recognize revenue for construction services. Periodic estimates of our progress towards completion are made based on a comparison of labor costs incurred to date with total estimated contract costs for labor. The percentage-of-completion method requires the use of various estimates, including among others, the extent of progress towards completion, contract revenues and contract completion costs. Contract revenues and contract costs to be recognized are dependent on the accuracy of estimates, including quantities of materials, labor productivity and other cost estimates. We have a history of making reasonable estimates of the extent of progress towards completion, contract revenues and contract completion costs. However, due to uncertainties inherent in the estimation process, it is possible that actual completion costs may vary from estimates. Revisions of contract revenues and cost estimates as well as provisions for estimated losses on uncompleted contracts are recognized in the period such revisions are known.
· Estimated Losses on Uncompleted Contracts and Changes in Contract Estimates
Estimated losses on uncompleted contracts and changes in contract estimates are established by assessing estimated costs to complete, change orders and claims for uncompleted contracts. Revisions of estimated losses are recognized in the period such revisions are known.
Goodwill represents the excess of purchase price over the fair values of net tangible and identifiable intangible assets of acquired businesses. An annual assessment for impairment is completed in the fourth quarter and whenever events and circumstances indicate the carrying amount may not be recoverable. An impairment is recognized if the carrying amount is more than the estimated future operating cash flows as measured by fair value techniques.
· Insurance Deductible Reserves
The estimated cost of automobile, general liability and workers’ compensation claims is determined by actuarial methods. Claims in excess of insurance deductibles are insured with third-party insurance carriers. Reserves for claims are recognized based on the estimated costs of these claims as limited by the deductibles of the applicable insurance policies. Revisions of estimated claims are recognized in the period such revisions are known.
· Warranties
The estimated cost of warranties for certain construction services is based on the nature and frequency of claims, anticipated claims and cost per claim. Claims in excess of insurance deductibles are insured with third-party insurance carriers. Estimated costs for warranties are recognized when the revenue associated with the service is recognized. Revisions of estimated warranties are recognized in the period such revisions are known.
· Share-based Compensation
Our estimates of the fair values of our share-based payment transactions are based on the modified Black-Scholes-Merton model. In order to meet the fair value measurement objective, we are required to develop estimates regarding expected exercise patterns, share price volatility, forfeiture rates, risk-free interest rate and dividend yield. These assumptions are based principally on historical experience. When circumstances indicate the availability of new or different information that would be useful in estimating these assumptions, revisions will be made and recognized in the period such revisions are known. Due to uncertainties inherent in these assumptions, it is possible that actual share-based compensation may vary from this estimate.
Cash and Cash Equivalents
Cash and cash equivalents consist of short-term investments that have a maturity of three months or less at the date of purchase. Cash and cash equivalents were $74.3 million at December 31, 2006 and $30.1 million at December 31, 2005.
Receivables
Receivables consist primarily of amounts due from customers and are net of an allowance for doubtful accounts. The allowance for doubtful accounts reflects our best estimate of probable losses inherent in the accounts receivable balance. We determine the allowance based on known troubled accounts, historical experience and other available evidence.
Inventory Valuation
Inventory consists principally of building materials purchased for resale and is valued at the lower of average cost or market. We participate in vendor rebate programs under which rebates are earned by attaining certain purchase volumes. Volume rebates are accrued as earned. These volume rebates are recorded as a reduction in inventory and recognized in cost of goods sold when the related product is sold.
Unbilled Receivables and Billings in Excess of Costs and Estimated Earnings
The percentage-of-completion method results in recognizing costs incurred and estimated revenues on uncompleted contracts. Unbilled receivables represent revenues recognized for construction services performed, however not yet billed. Billings in excess of costs and estimated earnings represent billings made in excess of estimated revenues recognized. These billings are deferred until the actual progress towards completion indicates recognition is appropriate. Costs include direct labor and materials as well as equipment costs related to contract performance.
Property and Equipment
Property and equipment are recorded at cost. Cost includes expenditures for major improvements and replacements that extend useful life. Certain costs of software are capitalized provided those costs are not research and development and certain other criteria are met. Capitalized interest was $0.1 million in 2006, $0.2 million in 2005 and $0.1 million in 2004. Expenditures for other maintenance and repairs are expensed as incurred. Gains and losses from sales and retirements are included in income as they occur. Depreciation is calculated using the straight-line method over the economic useful lives of the assets. The estimated useful lives of depreciable assets are generally:
· ten to thirty years for buildings and improvements
· seven to ten years for machinery and fixtures
· three to ten years for handling and delivery equipment
· three to ten years for software development costs
In order to improve financial returns, we periodically evaluate our investments in property and equipment. As a result, property and equipment may be consolidated, leased or sold. We recognized a loss of $0.2 million in 2006, a gain of $0.2 million in 2005 and a loss of $0.3 million in 2004 from the sales of property and equipment.
Long-lived Assets
Long-lived assets such as property, equipment and intangibles with useful lives are evaluated for impairment whenever events or changes in circumstances indicate the carrying amount may not be recoverable. An impairment is recognized if the carrying amount exceeds its fair value and when the carrying amount is not recoverable based on the estimated future operating cash flows on an undiscounted basis.
Revenue Recognition
Taxes assessed by governmental authorities that are directly imposed on our revenue-producing transactions are excluded from sales. The percentage-of-completion method is used to recognize revenue for construction services. Revenues for building products are recognized when title to the goods and risk of loss pass to the buyer, which is at the time of delivery.
Shipping and Handling
Shipping and handling costs for manufactured building components and construction services are included as a component of cost of goods sold. Shipping and handling costs for building products are included as a component of selling, general and administrative expenses and were $78.8 million in 2006, $64.5 million in 2005 and $55.7 million in 2004.
Reclassifications
Certain reclassifications, none of which affected previously reported consolidated results of operations, cash flows or shareholders’ equity, have been made to amounts reported in prior periods to conform to the current year presentation.
Common Share Split
On February 14, 2006, our Board of Directors approved a two for one split of our outstanding common shares. Shareholders as of February 28, 2006 received a stock dividend of one additional common share for every common share they owned. All share and per share information for all prior periods presented has been retroactively adjusted to reflect this share split.
Recent Accounting Principles
In September 2006, the Securities Exchange Commission issued Staff Accounting Bulletin No. 108, Considering the Effect of Prior Year Misstatements when Quantifying Misstatements in Current Year Financial Statements. This accounting principle provides specific guidance for considering the effects of prior year misstatements in quantifying current year misstatements. This accounting principle was adopted effective January 2006 and had no impact on consolidated financial position, results of operations or cash flows.
In June 2006, the Financial Accounting Standards Board issued Interpretation No. 48, Accounting for Uncertainty in Income Taxes. This accounting principle provides specific guidance for measurement, recognition and disclosure of uncertain tax positions. This accounting principle was adopted January 2007 and is not expected to have a significant impact on consolidated financial position, results of operations or cash flows.
2. Net Income Per Share
Net income per share was determined using the following information (thousands, except per share data):
| | | Year Ended December 31 | |
| | | 2006 | | 2005 | | 2004 | |
| Net income | | $ | 102,074 | | $ | 129,507 | | $ | 53,910 | |
| | | | | | | | | | | |
| Weighted average shares used to determine basic net income per share | | | 28,603 | | | 28,101 | | | 26,988 | |
| Net effect of dilutive stock options and restricted stock | | | 986 | | | 1,261 | | | 859 | |
Weighted average shares used to determine diluted net income per share | | | 29,589 | | | 29,362 | | | 27,847 | |
| | | | | | | | �� | | | |
| Net income per share: | | | | | | | | | | |
| Basic | | | $3.57 | | | $4.61 | | | $2.00 | |
| Diluted | | | $3.45 | | | $4.41 | | | $1.94 | |
| | | | | | | | | | | |
| Annual cash dividends declared per share | | | $0.40 | | | $0.24 | | | $0.14 | |
Share options considered not dilutive are those with exercise prices greater than the average market value of the common shares in the periods presented. Share options that are not dilutive and therefore excluded from the computation of diluted net income per share were as follows:
| · | 403,100 shares in 2006, |
3. Accounting for Share-Based Compensation
On January 1, 2006, we adopted the fair value recognition provisions of Statement of Financial Accounting Standards No. 123 (Revised 2004), Share-Based Payment. This statement required the measurement and recognition of share-based payments to employees at fair value. Compensation cost is based on the fair value of those shares on the grant date. Compensation cost for share-based awards is recognized as the requisite service is rendered in the same financial statement line as cash compensation. Additionally, tax benefits for share-based compensation payments are reported as a financing activity, rather than as an operating cash flow.
Previously, we did not recognize expense for grants of share options if the exercise price was at least equal to the fair value of the shares on the date of grant. In accordance with the modified prospective method of transition, compensation expense is recognized over the requisite service period for all share-based compensation granted after the date of adoption as well as awards unvested on the date of adoption. Prior periods are not revised for comparative purposes. Share-based compensation expense previously included restricted shares and share awards and will now include the fair value of share options.
The fair value of share-based compensation expense recognized for options for the requisite service period was $5.1 million, including $0.3 million for options vested due to early retirement eligibility, for 2006. As this compensation does not require the payment of cash, this is reflected as a non-cash item in the statement of cash flows.
Share-based compensation expense for options reduced our results of operations as follows:
| | | 2006 | |
| Income before income taxes and minority interests | | $ | 5,103 | |
| Net income | | $ | 3,276 | |
| | | | | |
| Net income per share: | | | | |
| Basic | | | $0.11 | |
| Diluted | | | $0.11 | |
Share-based compensation expense is included in selling, general and administrative expenses since it is incentive compensation issued primarily to our executives and senior management. Share-based compensation expense for options, restricted shares and share awards was $8.5 million for 2006. Share-based compensation expense for restricted shares and share awards was $2.0 million for 2005 and $1.3 million for 2004.
As of December 31, 2006 there was $12.2 million of unrecognized compensation expense related to non-vested share-based compensation arrangements granted under our plans. This expense will be recognized as the requisite services are rendered and is expected to be recognized ratably through January 2009.
Pro Forma Information for the Periods Prior to January 1, 2006
Financial information for prior periods is not required to be revised to reflect this change in accounting principle. The following illustrates the effect on net income and income per share if the fair value recognition provisions of Statement of Financial Accounting Standards No. 123, Accounting for Stock-Based Compensation, were applied to share options for the prior periods (thousands, except per share data):
| | | Year Ended December 31 | |
| | | 2005 | | 2004 | |
| Net income, as reported | | $ | 129,507 | | $ | 53,910 | |
| Add: Share-based employee compensation expense determined under APB 25, net of related tax effects | | | 555 | | | 659 | |
| Deduct: Share-based employee compensation expense determined under fair value method for all awards, net of related tax effects | | | (2,497 | ) | | (1,892 | ) |
| Pro forma net income | | $ | 127,565 | | $ | 52,677 | |
| | | | | | | | |
| Basic net income per share: | | | | | | | |
| As reported | | | $4.61 | | | $2.00 | |
| Pro forma | | | $4.54 | | | $1.95 | |
| | | | | | | | |
| Diluted net income per share: | | | | | | | |
| As reported | | | $4.41 | | | $1.94 | |
| Pro forma | | | $4.34 | | | $1.89 | |
4. Impairment of Assets
Long-lived assets such as property, equipment and intangibles are evaluated for impairment whenever events or changes in circumstances indicate the carrying amount may not be recoverable. An impairment for these assets is recognized if the carrying amount is more than the estimated future operating cash flows on an undiscounted basis. Similarly, goodwill is evaluated for impairment in the fourth quarter and whenever events and circumstances indicate the carrying amount may not be recoverable. An impairment for goodwill is recognized if the carrying amount is more than the estimated future operating cash flows as measured by fair value techniques.
As a result of changes in specific markets, SelectBuild recognized the following impairments during 2006:
| · | $1.8 million for the carrying amount of goodwill in the second quarter and |
| · | $0.4 million for the carrying amount of certain customer relationships in the second quarter. |
As a result of changes in specific markets, SelectBuild recognized the following impairments during 2005:
| · | $0.5 million for the carrying amount of certain customer relationships in the second quarter and |
| · | $0.8 million for the carrying amount of goodwill in the fourth quarter. |
As a result of changes in specific markets, BMC West recognized the following impairments during 2004:
| · | $1.3 million for the carrying amount of certain properties in the first quarter and |
| · | $1.0 million for the carrying amount of goodwill in the fourth quarter. |
5. Acquisitions and Minority Interests
Acquisitions are accounted for under the purchase method of accounting. The purchase price is allocated to the assets acquired, including intangible assets, and liabilities assumed based on their estimated fair values at the date of acquisition. Subsequent to the initial allocation of purchase price, adjustments may be made to reflect the fair value of working capital and tangible assets. Any excess of the purchase price over the estimated fair value of the identifiable assets and liabilities acquired is recorded as goodwill. Operating results of acquired businesses are included in the consolidated statements of income from the date of acquisition.
| · | In December 2006, SelectBuild acquired a distribution services business in Southern California for approximately $1.6 million in cash of which $0.6 million has been retained for the settlement period. This purchase price is subject to working capital adjustment. Information required to complete the purchase price allocation is not yet available. Final allocation of the purchase price will be completed as soon as this information is available. |
| · | In August 2006, SelectBuild acquired a window installation business in Arizona for approximately $13.9 million in cash of which $0.5 million has been retained for the settlement period. This purchase price is subject to working capital adjustment. Information required to complete the purchase price allocation is not yet available. Final allocation of the purchase price will be completed as soon as this information is available. |
| · | In July 2006, SelectBuild acquired a framing services business in Southern California for approximately $78.6 million in cash of which $3.8 million has been retained for the settlement period. This purchase price is subject to working capital adjustment. Additional cash payments may be required based on operating performance through June 2009. Information required to complete the purchase price allocation is not yet available. Final allocation of the purchase price will be completed as soon as this information is available. |
| · | In June 2006, BMC West acquired a building materials distribution and truss manufacturing business in Eastern Idaho for approximately $5.1 million in cash of which $0.1 million has been retained for the settlement period. This purchase price is subject to working capital adjustment. Information required to complete the purchase price allocation is not yet available. Final allocation of the purchase price will be completed as soon as this information is available. |
| · | In April 2006, SelectBuild acquired a concrete services business in Northern Arizona for approximately $1.5 million in cash. |
| · | In April 2006, SelectBuild acquired a wall panel and truss manufacturing business in Palm Springs, California for $6.7 million in cash. |
| · | In February 2006, BMC West acquired three facilities providing building materials distribution and millwork services in Houston, Texas for $20.6 million in cash. |
| · | In January 2006, SelectBuild acquired framing businesses in Palm Springs, California and Reno, Nevada for $57.1 million in cash. Additional cash payments may be required based on operating performance through December 2009. |
| · | In October 2005, SelectBuild acquired a framing services business in San Diego, California for $72.6 million in cash. Additional cash payments may be required based on operating performance through September 2009. |
| · | In September 2005, SelectBuild acquired a concrete and plumbing services business in Las Vegas, Nevada and Southern California for $85.6 million in cash. |
| · | In September 2005, BMC West acquired a truss manufacturing business in McCall, Idaho for $1.3 million in cash. |
| · | In June 2005, SelectBuild acquired a stucco business in Las Vegas, Nevada for $5.9 million in cash. |
Minority interest reflects the other owners’ proportionate share in the assets and liabilities of business ventures as of the date of purchase, adjusted by the proportionate share of post-acquisition income or loss. As the operating results of entities with minority interest are consolidated, minority interests income represents the income or loss attributable to the other owners.
| · | In November 2006, SelectBuild acquired the remaining 49% interest in BBP Companies for $22.8 million in cash of which $22.7 million is payable and included in other accrued liabilities. In July 2005, we acquired an initial 51% interest for $9.4 million in cash and $1.0 million of our common shares. Information required to complete the purchase price allocation is not yet available. Final allocation of the purchase price will be completed as soon as this information is available. BBP Companies provide concrete services to high-volume production homebuilders in Arizona. |
| · | In January 2006, SelectBuild acquired the remaining 20% interest in WBC Construction, LLC for $35.7 million in cash of which $33.1 million is payable and included in other accrued liabilities. Information required to complete the purchase price allocation is not yet available. Final allocation of the purchase price will be completed as soon as this information is available. |
In August 2005, SelectBuild acquired an additional 20% interest in WBC Construction, LLC for $24.8 million in cash. In January 2003, we acquired an initial 60% interest for $22.9 million in cash and $1.0 million of our common shares. WBC Construction provides concrete block masonry and concrete services to high-volume homebuilders in Florida.
| · | In July 2005, SelectBuild acquired an additional 13% interest in Riggs Plumbing, LLC (Riggs Plumbing) for $1.4 million in cash. In April 2005, we acquired an initial 60% interest for $17.8 million in cash. The remaining 27% is owned by Riggs & Associates, LLC and is recognized as minority interest. Riggs Plumbing provides plumbing services to high-volume builders in the Phoenix and Tucson markets. |
| · | In January 2005, SelectBuild acquired a 51% interest in RCI Construction, LLC (RCI Construction) for $4.9 million in cash. The remaining 49% is owned by Residential Carpentry, Inc. and is recognized as minority interest. RCI Construction provides framing services to high-volume builders in the greater Chicago area. |
Assets and liabilities acquired in these acquisitions included (thousands):
| | | | | |
| | 2006 | | 2005 | | | 2006 | | 2005 |
| Cash and cash equivalents | $ | — | | $ | 1,644 | | Accounts payable | $ | 10,376 | | $ | 46,078 |
| Receivables | | 44,683 | | | 106,407 | | Accrued compensation | | 1,447 | | | 7,385 |
| Inventory | | 19,957 | | | 11,559 | | Insurance deductible reserves | | — | | | 3,192 |
| Unbilled receivables | | 10,101 | | | 30,554 | | Other accrued liabilities | | 50,340 | | | 30,014 |
| Deferred income taxes | | — | | | (6,527) | | Billings in excess of costs and | | | | | |
| Prepaid expenses and other | | 263 | | | 4,057 | | estimated earnings | | 23,557 | | | 24,436 |
| | | | | | | | Current portion of long-term debt | | — | | | 5,605 |
| Total current assets | | 75,004 | | | 147,694 | | Total current liabilities | | 85,720 | | | 116,710 |
| | | | | | | | | | | | | |
| Property and equipment | | 19,845 | | | 33,406 | | Deferred income taxes | | 937 | | | 8,528 |
| Other long-term assets | | 42 | | | 18 | | Long-term debt | | — | | | 10,048 |
| Other intangibles, net | | 68,692 | | | 46,824 | | Other long-term liabilities | | 8,173 | | | ― |
| Goodwill | | 122,374 | | | 109,982 | | Total liabilities | | 94,830 | | | 135,286 |
| | | | | | | | | | | | | |
| | | | | | | | Minority interests | | (10,627) | | | (3,172) |
| Total assets | $ | 285,957 | | $ | 337,924 | | Total liabilities and minority interests | $ | 84,203 | | $ | 132,114 |
The following summarizes pro forma results of operations assuming the acquisitions occurred as of the beginning of 2005. Due to uncertainties in these assumptions, the pro forma data does not purport to be indicative of the results of operations that would have resulted had the acquisitions been consummated at the beginning of the period presented, or that may occur in the future (thousands, except per share data):
| | | 2006 | | 2005 | |
| Sales - as reported | | $ | 3,245,169 | | $ | 2,912,160 | |
| Pro forma Sales | | $ | 3,322,258 | | $ | 3,703,094 | |
| | | | | | | | |
| Net income - as reported | | $ | 102,074 | | $ | 129,507 | |
| Pro forma Net income | | $ | 107,799 | | $ | 162,934 | |
| | | | | | | | |
| Net income per share: | | | | | | | |
| Diluted - as reported | | | $3.45 | | | $4.41 | |
| Pro forma Diluted | | | $3.64 | | | $5.55 | |
We have call rights and put obligations associated with the interests in Riggs Plumbing, RCI Construction, A-1 Truss and WBC Mid-Atlantic that we do not currently own. Under the purchase agreements, we have the right to purchase the other owners’ remaining portions during certain periods or if certain conditions are met. Likewise, the other owners have the option to require us to purchase their remaining portions during certain periods. The purchase price for the remaining portions will be based generally on a multiple of historical earnings. The following table summarizes the timing of these call and put obligations:
| | | Call Options | | Put Options |
| Riggs Plumbing | | April 2008 through March 2013 | | April 2008 through March 2013 |
| RCI Construction | | January 2008 through January 2012 | | January 2008 through January 2012 |
| A-1 Truss | | September 2004 through August 2014 | | September 2009 through August 2014 |
| WBC Mid-Atlantic | | October 2003 through September 2010 | | December 2006 through December 2008 |
6. Marketable Securities
Investments in marketable securities consist of debt securities held by our captive insurance subsidiary and are considered available-for-sale and recorded at fair value. Unrealized gains and losses are recorded as a component of accumulated other comprehensive (loss) income, net, a component of shareholders’ equity. There were no significant unrealized losses.
The fair value of these marketable securities were as follows:
| | | 2006 | | 2005 | |
| Cash and cash equivalents | | $ | — | | $ | 415 | |
| U.S. government and agencies | | | 25,661 | | | 7,838 | |
| Asset backed securities | | | 18,278 | | | 13,391 | |
| Corporate securities | | | 13,911 | | | 10,876 | |
| | | $ | 57,850 | | $ | 32,520 | |
Contractual maturities were as follows:
| | | 2006 | | 2005 | |
| Less than one year | | $ | 4,337 | | $ | 3,645 | |
| Due in one to two years | | | 16,648 | | | 9,893 | |
| Due in two to five years | | | 36,865 | | | 18,982 | |
| | | $ | 57,850 | | $ | 32,520 | |
7. Intangible Assets and Goodwill
Intangible assets represent the values assigned to customer relationships, covenants not to compete and trade names. Intangible assets are amortized on a straight-line basis over their expected useful lives. Customer relationships are amortized over three to seventeen years, covenants not to compete over two to five years and trade names over three years. Amortization expense for intangible assets was $14.7 million in 2006, $4.7 million in 2005 and $4.2 million in 2004. Intangible assets consist of the following (thousands):
| | | December 31, 2006 | |
| | | Gross Carrying Amount | | Accumulated Amortization | | Net Carrying Amount | |
| Customer relationships | | $ | 122,498 | | $ | (22,125 | ) | $ | 100,373 | |
| Covenants not to compete | | | 13,094 | | | (4,802 | ) | | 8,292 | |
| Trade names | | | 204 | | | (159 | ) | | 45 | |
| Other | | | 146 | | | (64 | ) | | 82 | |
| | | $ | 135,942 | | $ | (27,150 | ) | $ | 108,792 | |
| | | December 31, 2005 | |
| | | Gross Carrying Amount | | Accumulated Amortization | | Net Carrying Amount | |
| Customer relationships | | $ | 58,926 | | $ | (9,165 | ) | $ | 49,761 | |
| Covenants not to compete | | | 7,541 | | | (2,307 | ) | | 5,234 | |
| Trade names | | | 204 | | | (91 | ) | | 113 | |
| Other | | | 146 | | | (27 | ) | | 119 | |
| | | $ | 66,817 | | $ | (11,590 | ) | $ | 55,227 | |
Estimated amortization expense for intangible assets is $17.0 million for 2007, $15.5 million for 2008, $15.3 million for 2009, $14.2 million for 2010, $12.7 million for 2011 and $34.1 million thereafter.
Goodwill represents the excess of the purchase price over the fair value of net tangible and identifiable intangible assets of acquired businesses. Adjustments to amounts previously reported as goodwill occur as a result of completing the purchase price allocation to the assets acquired, including intangible assets, and liabilities assumed based on their estimated fair values at the date of acquisition.
An annual assessment for impairment is completed in the fourth quarter and whenever events and circumstances indicate the carrying amount may not be recoverable. An impairment is recognized at the reporting unit if the carrying amount is more than the estimated future operating cash flows as measured by fair value techniques.
Changes in the carrying amount of goodwill by business segment were as follows (thousands):
| | | SelectBuild | | BMC West | | Total | |
| Balance at December 31, 2004 | | $ | 60,253 | | $ | 20,063 | | $ | 80,316 | |
| Impairment | | | (763 | ) | | ― | | | (763 | ) |
| Goodwill acquired | | | 107,778 | | | 139 | | | 107,917 | |
| Balance at December 31, 2005 | | $ | 167,268 | | $ | 20,202 | | $ | 187,470 | |
| Purchase price adjustment | | | (1,927 | ) | | (16 | ) | | (1,943 | ) |
| Impairment | | | (1,839 | ) | | — | | | (1,839 | ) |
| Goodwill acquired | | | 123,621 | | | 691 | | | 124,312 | |
Balance at December 31, 2006 | | $ | 287,123 | | | 20,877 | | | 308,000 | |
While goodwill is tested for impairment annually and not amortized for financial statement proposes, goodwill is deductible for income tax purposes. Certain goodwill is non-deductible. Non-deductible goodwill was $41.4 million as of December 2006 of which $15.2 million was recorded in 2006 related to purchase price adjustments for 2005 acquisitions, $18.8 million was from 2005 acquisitions and $7.4 million was from acquisitions in prior periods.
8. Debt
Long-term debt consists of the following (thousands):
| | | | | | | Notional Amount of Interest | | Effective Interest Rate | |
As of December 31, 2006 | | Balance | | Stated Interest Rate | | Rate Swaps | | Average for Year | | As of December 31 | |
| Revolver | | $ | — | | | LIBOR plus 1.25% or Prime plus 0.00% | | $ | ― | | | 6.50 | % | | | n/a | | |
| | | | | | | | | | | | | | | | | |
| Term note | | | 349,125 | | | LIBOR plus 2.50% or Prime plus 1.25% | | | 200,000 | | | 6.72 | % | | | 6.97 | % | |
| | | | | | | | | | | | | | | | | |
| Other | | | 8,179 | | | Various | | | — | | | — | | | | — | | |
| | | | 357,304 | | | | | $ | 200,000 | | | | | | | |
| | | | | | | | | | | | | | | | | |
| Less: Current portion | | | 8,143 | | | | | | | | | | | | | |
| | | $ | 349,161 | | | | | | | | | | | | | |
| | | | | | | Notional Amount of Interest | | Effective Interest Rate | |
As of December 31, 2005 | | Balance | | Stated Interest Rate | | Rate Swaps | | Average for Year | | As of December 31 | |
| Revolver | | $ | 77,500 | | | LIBOR plus 0.75% or Prime plus 0.00% | | $ | ― | | | 5.37 | % | | | 6.08 | % | |
| | | | | | | | | | | | | | | | | |
| Term note | | | 75,000 | | | LIBOR plus 0.75% or Prime plus 0.00% | | | ― | | | 4.52 | % | | | 5.28 | % | |
| | | | | | | | | | | | | | | | | |
| Term note | | | 121,875 | | | LIBOR plus 1.75% | | | 100,000 | | | 6.23 | % | | | 6.17 | % | |
| | | | | | | | | | | | | | | | | |
| Other | | | 13,925 | | | Various | | | ― | | | ― | | | | ― | | |
| | | | 288,300 | | | | | $ | 100,000 | | | | | | | |
| | | | | | | | | | | | | | | | | |
| Less: Current portion | | | 10,131 | | | | | | | | | | | | | |
| | | $ | 278,169 | | | | | | | | | | | | | |
Revolver
In November 2006, we entered into an amended $500 million revolver with a group of lenders. The revolver matures in November 2011. The revolver consists of both LIBOR and Prime based borrowings. These variable interest rates are subject to quarterly adjustment based on operating performance and range from LIBOR plus 1.00% to 2.00%, or Prime plus 0.00% to 0.75%. Interest is paid quarterly. As of December 31, 2006, no amount was outstanding under the revolver.
Term Note
In November 2006, we entered into a $350 million term note with a group of lenders. The term note matures in November 2013 and is payable in quarterly installments for the first seven years in amounts equal to 1% of the initial principal per year and the remaining principal due November 2013. The variable interest rate for the term note is LIBOR plus 2.50%, or Prime plus 1.25%. Interest is paid quarterly. As of December 31, 2006, $349.1 million was outstanding under this term note.
Other
Other long-term debt of $8.2 million consists of term notes, equipment notes and capital leases for equipment. Interest rates vary and dates of maturity are through March 2021.
Expansion of Credit Facility, Covenants and Maturities
The credit facility consists of the revolver and term note. The credit facility may be increased an aggregate amount of up to $250 million. The credit facility is collateralized by tangible and intangible property of our wholly-owned subsidiaries, except the assets of our captive insurance subsidiary. The credit facility contains covenants and conditions requiring the maintenance of certain financial ratios. At December 31, 2006, we were in compliance with these covenants and conditions.
Scheduled maturities of long-term debt are as follows (thousands):
| 2007 | | $ | 8,143 | |
| 2008 | | | 4,894 | |
| 2009 | | | 4,208 | |
| 2010 | | | 3,898 | |
| 2011 | | | 3,716 | |
| Thereafter | | | 332,445 | |
| | | $ | 357,304 | |
As of December 31, 2006 and December 31, 2005 there were $95.8 million and $75.9 million, respectively of letters of credit outstanding that guaranteed performance or payment to third parties. These letters of credit reduce borrowing availability under the revolver.
Hedging Activities
Derivative and hedging activities are recorded on the balance sheet at their fair values. In November 2006, we entered into interest rate swap contracts that effectively convert $200 million of the variable rate borrowings of the $349.1 million term note to a fixed interest rate of 7.59% through November 2012, thus reducing the impact of increases in interest rates on future interest expense. Approximately 57% of the outstanding variable rate borrowings of the term note as of December 31, 2006 have been hedged through the designation of interest rate swap contracts accounted for as cash flow hedges. After giving effect to the interest rate swap contracts, total borrowings were 58% fixed and 42% variable.
The fair value of derivative instruments is based on pricing models using current market rates. The fair value of the interest rate swap contracts was a long-term liability of $0.9 million as of December 31, 2006. The effective portion was recorded in accumulated other comprehensive income, net, a separate component of shareholders’ equity, and is subsequently reclassified into earnings in the same financial statement line item, interest expense, in the same period during which the hedged transaction is recognized in earnings. A corresponding deferred tax asset of $0.3 million was also recorded in accumulated other comprehensive income, net for the income tax related to the estimated fair value of the interest rate swap contracts. The ineffective portion of the change in the value of the interest rate swap contracts is immediately recognized as a component of interest expense. Hedge ineffectiveness for the period ended December 31, 2006 was not significant. Management may choose not to swap variable rates to fixed rates or may terminate a previously executed swap if the variable rate positions are more beneficial.
In June 2004, we entered into interest rate swap contracts that effectively converted $100 million of variable rate borrowings to a fixed interest rate. These swaps were settled in November 2006 and the $1.5 million gain recognized for this settlement was reclassified to other income, net from accumulated other comprehensive income, net.
9. Shareholders’ Equity
Preferred Shares
We are authorized to issue 2 million preferred shares, however none of these shares are issued. Under the terms of our Restated Certificate of Incorporation, the Board of Directors is authorized to determine or alter the rights, preferences, privileges and restrictions of the preferred shares.
Common Shares
Our common shares have a par value of $0.001. We have 50 million shares authorized of which approximately 29.2 million are issued and outstanding as of December 31, 2006.
Of the unissued shares, 807,368 shares were reserved for the following:
| | Unissued Shares |
| Employee Stock Purchase Plan | 70,902 |
| 2004 Incentive and Performance Plan | 736,466 |
Shareholders’ Rights Plan
In September 1997, our Board of Directors adopted a shareholder rights plan. If a person acquires 15% or more of our common shares or makes a tender offer or other offer to do so without the approval of the Board of Directors, our shareholders would have the right to purchase our common shares or the shares of the acquiring company at a significant discount. The Board of Directors has the right to redeem these rights for a nominal amount, to extend the period before the rights may be exercised or to take other actions as defined. The plan is intended to encourage any person seeking to acquire us to negotiate with the Board of Directors. The plan expires in September 2007.
Dividends
Cash dividends per common share were as follows:
| | | 2006 | | 2005 | | 2004 | |
| Fourth quarter | | $ | 0.10 | | $ | 0.075 | | $ | 0.04 | |
| Third quarter | | | 0.10 | | | 0.075 | | | 0.04 | |
| Second quarter | | | 0.10 | | | 0.05 | | | 0.03 | |
| First quarter | | | 0.10 | | | 0.04 | | | 0.03 | |
| | | $ | 0.40 | | $ | 0.24 | | $ | 0.14 | |
On February 20, 2007, our Board of Directors approved a 2007 first quarter cash dividend of $0.10 per common share. The dividend was payable to shareholders of record as of March 23, 2007 and will be paid on or about April 13, 2007.
10. Employee Benefit Plans
Retirement Plans
We provide a savings and retirement plan for salaried and certain hourly employees whereby eligible employees may contribute a percentage of their earnings to a trust. Matching contributions of $4.5 million in 2006, $3.9 million in 2005 and $3.3 million in 2004 were made to the trusts based on a percentage of the contributions made by participating employees.
Additionally, there is a supplemental retirement plan for eligible participants. Contributions are based on achieving certain operating performance and certain participants receive a guaranteed return ranging from zero to 9% based on years of service. Contributions were $7.5 million in 2006, $7.5 million in 2005 and $3.6 million in 2004. The plan’s investments are principally company-owned life insurance policies. These investments fund the obligation to the participants or their beneficiaries over a 5, 10 or 15-year period.
Cash Equity Plan
In April 1999, our Board of Directors adopted the Cash Equity Plan. Employees were eligible to receive awards at the discretion of the Compensation Committee of the Board of Directors. Awards are common share equivalent units that may be exchanged for the market value of those shares. The number of units available for grant, including those units outstanding and unexercised, cannot exceed two percent of the common shares outstanding at any given time. The awards are restricted from sale or transfer, vest after three years from the date of grant and expire after five years. No units have been awarded since February 2002. Compensation expense is recognized on a straight-line basis over the respective vesting period with periodic adjustments to compensation expense based on changes in the market value of the common shares. The related compensation expense for this plan was not significant in 2006, $0.3 million in 2005 and $0.8 million in 2004. Common share equivalent units of 5,000 remain outstanding and unexercised at December 31, 2006. No further grants or awards will be made under this plan.
Employee Stock Purchase Plan
In September 2000, our Board of Directors adopted the Employee Stock Purchase Plan, which our shareholders approved in May 2001. The plan permits eligible employees to purchase common shares through payroll deductions of up to 10% of an employee’s compensation limited to $25,000 each year. The purchase price of the shares is 85% of the market price on the last day of each month. There were 400,000 common shares authorized under this plan and there were 70,902 shares available for future purchase as of December 31, 2006. Compensation expense recognized was $0.3 million in 2006, $0.2 million in 2005 and $0.1 million in 2004.
2004 Incentive and Performance Plan
In February 2004, our Board of Directors adopted the 2004 Incentive and Performance Plan, which our shareholders approved in May 2004. A total of 2.4 million shares are reserved for issuance under the plan. Employees and non-employee directors are eligible to receive awards at the discretion of the Compensation Committee. Options, appreciation rights, restricted shares, other share-based awards and non-discretionary awards may be granted under this plan.
Options
| · | Grants of options under the 2004 Incentive and Performance Plan vest ratably over three years from the date of grant and expire after seven years if unexercised. Options were awarded with exercise prices equal to the fair value of the shares on the date of grant. |
| · | In February 2000, our Board of Directors adopted the 2000 Stock Incentive Plan which our shareholders approved in May 2000. No further grants are made under this plan. |
Grants of options under the 2000 Stock Incentive Plan vest ratably through the end of the fourth year from the date of grant and expire after ten years if unexercised. Options were awarded with exercise prices equal to the fair value of the shares on the date of grant.
| · | In February 1997, the Board of Directors authorized issuance of 100,000 options as an additional incentive to attract a member of senior management. These options vested in February 2002 and expire after ten years if unexercised. These options were awarded with exercise prices equal to the fair value of the shares on the date of grant. |
With the adoption of Statement of Financial Accounting Standards No. 123 (Revised 2004), Share-Based Payment, in 2006, compensation expense is recognized over the requisite service period for all share-based awards granted after the date of adoption as well as awards unvested on the date of adoption. Prior periods are not revised for comparative purposes. Share-based compensation expense previously included restricted shares and share awards and will now include the fair value of share options.
Compensation expense is recognized over the requisite service period. The fair value of compensation expense recognized for options for the requisite service period was $5.1 million, including $0.3 million for options vested due to early retirement eligibility, for 2006. Options are not included in the calculation of basic income per share, however options are included in the calculation of diluted income per share.
The fair value of each option is estimated on the date of grant using the modified Black-Scholes-Merton model. Significant awards of options and their key assumptions are as follows:
Grant Year | | Grant Month | | Grant Date Fair Value of Shares | | Risk Free Interest Rate | | Expected Volatility | | Expected Dividend Yield | | Expected Term (Years) |
| 2006 | | September | | $28.01 | | 4.51% | | 55.58% | | 1.59% | | 4.72 |
| 2006 | | January | | $37.93 | | 3.77% | | 48.58% | | 0.70% | | 5.60 |
| 2005 | | May | | $28.36 | | 4.29% | | 54.16% | | 0.68% | | 7.00 |
| 2005 | | February | | $22.77 | | 4.10% | | 54.16% | | 0.84% | | 6.84 |
| 2004 | | May | | $8.50 | | 4.56% | | 54.25% | | 1.45% | | 7.00 |
| 2004 | | February | | $7.88 | | 4.09% | | 54.68% | | 1.45% | | 7.50 |
| 2003 | | April | | $6.97 | | 3.94% | | 55.42% | | 1.33% | | 8.50 |
These assumptions are based principally on historical experience. When circumstances indicate the availability of new or different information that would be useful in estimating these assumptions, revisions will be made and reflected in the period such revisions are determined. Due to uncertainties inherent in these assumptions, it is possible that actual share-based compensation may vary from the estimate of the fair value of these options.
Activity for option awards was as follows (thousands, except per share data):
| | | 2006 | | 2005 | | 2004 | |
| | | Shares | | Weighted Average Exercise Price | | Weighted Average Remaining Contractual Term (years) | | Intrinsic Value | | Shares | | Weighted Average Exercise Price | | Shares | | Weighted Average Exercise Price | |
| Outstanding at beginning of the period | | | 2,300 | | $ | 9.73 | | | 5.7 | | | | | | 2,756 | | $ | 6.44 | | | 3,042 | | $ | 6.10 | |
| Granted | | | 409 | | $ | 37.88 | | | | | | | | | 424 | | $ | 22.88 | | | 609 | | $ | 8.42 | |
| Exercised | | | (176 | ) | $ | 7.34 | | | | | | | | | (861 | ) | $ | 5.70 | | | (824 | ) | $ | 6.07 | |
| Forfeited | | | (12 | ) | $ | 21.98 | | | | | | | | | (19 | ) | $ | 8.41 | | | (71 | ) | $ | 13.29 | |
| Outstanding at end of the period | | | 2,521 | | $ | 14.41 | | | 5.1 | | | | | | 2,300 | | $ | 9.73 | | | 2,756 | | $ | 6.44 | |
| | | | | | | | | | | | | | | | | | | | | | | | | | |
| Exercisable at end of the period | | | 1,676 | | $ | 8.20 | | | 4.9 | | | | | | 1,428 | | $ | 6.32 | | | 1,913 | | $ | 5.76 | |
| | | | | | | | | | | | | | | | | | | | | | | | | | |
| In-the-money: | | | | | | | | | | | | | | | | | | | | | | | | | |
| Outstanding | | | 2,108 | | $ | 9.84 | | | | | $ | 31,299 | | | | | | | | | | | | | |
| Exercisable | | | 1,656 | | $ | 7.85 | | | | | $ | 27,887 | | | | | | | | | | | | | |
| | | | | | | | | | | | | | | | | | | | | | | | | | |
| Weighted average fair value of options granted at fair value | | | | | $ | 18.00 | | | | | | | | | | | $ | 12.38 | | | | | $ | 4.16 | |
| Weighted average fair value of options granted above fair value | | | | | | — | | | | | | | | | | | | — | | | | | $ | 4.39 | |
| | | | | | | | | | | | | | | | | | | | | | | | | | |
The intrinsic value (the difference between our share price on the last day of trading December 2006 and the exercise price) for in-the-money options represents the value that would have been received by option holders had they exercised their options. These values change based on the fair market value of our shares. The intrinsic value was:
| · | $31.3 million for options outstanding |
| · | $27.9 million for options exercisable (vested) |
The intrinsic value (the amount by which our share price exceeded the exercise price on the date of exercise) for options exercised was $3.8 million in 2006, $23.7 million in 2005 and $5.4 million in 2004.
| | | Options Outstanding | | Options Exercisable |
Range of Exercise Prices | | Options Outstanding | | Weighted Average Remaining Contractual Life (Years) | | Weighted Average Exercise Price | | Shares Exercisable | | Weighted Average Exercise Price |
| $4.84 to $5.97 | | 555,000 | | 3.5 | | $4.94 | | 555,000 | | $4.94 |
| $6.19 to $6.97 | | 342,396 | | 6.1 | | $6.95 | | 342,396 | | $6.95 |
| $7.00 to $7.88 | | 466,812 | | 6.0 | | $7.38 | | 415,064 | | $7.31 |
| $8.70 to $9.75 | | 337,994 | | 4.3 | | $8.70 | | 211,998 | | $8.70 |
| $22.77 to $28.36 | | 415,998 | | 5.1 | | $22.90 | | 134,011 | | $22.88 |
| $37.93 to $38.16 | | 403,100 | | 6.1 | | $37.93 | | 18,000 | | $37.93 |
| $4.84 to $38.16 | | 2,521,300 | | 5.1 | | $14.41 | | 1,676,469 | | $8.20 |
As of December 31, 2006, there was $7.4 million of unrecognized compensation expense related to these options. This is recognized as the requisite services are rendered and is expected to be recognized ratably through January 2009.
Restricted Shares
| · | Grants of restricted shares vest three years from the date of grant. Under certain circumstances some or all of the restricted shares may vest earlier. Compensation expense is recognized over the vesting period. Compensation expense recognized was $3.1 million in 2006, $1.3 million in 2005 and $0.2 million in 2004. |
Activity for nonvested restricted share awards was as follows (thousands, except share data):
| | 2006 | | 2005 | | 2004 |
| | Shares | | Weighted Average Grant Date Fair Value | | Shares | | Weighted Average Grant Date Fair Value | | Shares | | Weighted Average Grant Date Fair Value |
Nonvested at beginning of the period | 258 | | $16.46 | | 149 | | $10.89 | | — | | — |
| Granted | 139 | | $37.83 | | 118 | | $23.18 | | 149 | | $10.89 |
| Vested | — | | — | | — | | — | | — | | — |
| Forfeited | (1) | | $37.93 | | (9) | | $12.62 | | — | | — |
Nonvested at end of the period | 396 | | $23.91 | | 258 | | $16.46 | | 149 | | $10.89 |
As of December 31, 2006, there was $4.8 million of unrecognized compensation expense related to these restricted shares. This is recognized as the requisite services are rendered and is expected to be recognized ratably through January 2009. Restricted shares are not included in the calculation of basic income per share, however restricted shares are included in the calculation of diluted income per share.
Shares
| · | In May 2006, we issued 12,000 shares to non-employee directors and recognized compensation expense of $0.4 million. These shares vest immediately, however trading is restricted for one year from the date of grant. |
| · | In May 2005, we issued 14,000 shares to non-employee directors and recognized compensation expense of $0.4 million. These shares vest immediately, however trading is restricted for one year from the date of grant. |
| · | In July 2004, we issued 33,600 shares to non-employee directors and recognized compensation expense of $0.3 million. These shares vest immediately, however trading is restricted for one year from the date of grant. |
The following table summarizes equity compensation information as of December 31, 2006:
| | | Number of Securities to be Issued Upon Exercise of Outstanding Options, Warrants and Rights | | Weighted Average Exercise Price of Outstanding Options, Warrants and Rights | | Number of Securities Remaining Available for Future Issuance Under Equity Compensation Plans | |
| Equity compensation plans approved by security holders | | | 2,916,800 | | $ | 12.45 | | | 736,466 | |
| Equity compensation plans not approved by security holders | | | — | | | — | | | — | |
| Total | | | 2,916,800 | | $ | 12.45 | | | 736,466 | |
Share-based compensation expense is included in selling, general and administrative since it is incentive compensation issued primarily to our executives and senior management. Share-based compensation expense for options, restricted shares and share awards was $8.5 million for 2006. Share-based compensation expense for restricted shares and share awards was $2.0 million for 2005 and $1.3 million for 2004.
11. Income Taxes
The asset and liability method is used to account for income taxes. Under this method, deferred tax assets and liabilities are recognized for tax credits and for the future tax consequences attributable to differences between the financial statement carrying amounts of existing assets and liabilities and their tax bases. Deferred tax assets and liabilities are measured using enacted tax rates expected to apply to taxable income in the years in which those temporary differences are expected to be recovered or settled. A valuation allowance is recorded to reduce the carrying amounts of deferred tax assets unless it is more likely than not that such assets will be realized.
Our income tax compliance is periodically examined by various taxing authorities. Our tax returns for 2005 through 2002 are either under examination or open for future examination. We believe the ultimate results of examinations, if any, will not have an adverse affect on our financial condition, results of operations or cash flows. Revisions of estimated tax liabilities are reflected in the period such revisions are known.
Income taxes consist of the following (thousands):
| | | 2006 | | 2005 | | 2004 | |
| Current income taxes | | | | | | | |
| Federal | | $ | 53,918 | | $ | 72,650 | | $ | 37,185 | |
| State | | | 4,013 | | | 10,738 | | | 5,503 | |
| | | | 57,931 | | | 83,388 | | | 42,688 | |
| | | | | | | | | | | |
| Deferred income taxes | | | | | | | | | | |
| Federal | | | (1,043 | ) | | (3,157 | ) | | (6,809 | ) |
| State | | | (82 | ) | | (316 | ) | | (681 | ) |
| | | | (1,125 | ) | | (3,473 | ) | | (7,490 | ) |
| | | | | | | | | | | |
| | | $ | 56,806 | | $ | 79,915 | | $ | 35,198 | |
Income taxes associated with the other owner’s proportionate share of BBP Companies, acquired in July 2005, were $1.7 million in 2006 and $1.2 million in 2005. We are required to recognize income taxes for all of the earnings of this 51% interest due to its C Corporation status. While these income taxes are recognized in income tax expense, the portion of income taxes associated with the other owner’s proportionate share of earnings is eliminated through minority interest.
The tax benefit associated with non-statutory options exercised by employees under the various share plans reduced taxes payable by approximately $1.5 million in 2006, $9.1 million in 2005 and $2.0 million in 2004. These tax benefits are recognized in additional paid-in capital, a component of shareholders’ equity.
A reconciliation of the differences between the U.S. statutory federal income tax rate and the effective tax rate as provided in the consolidated statements of income is as follows:
| | | 2006 | | 2005 | | 2004 | |
| Statutory rate | | | 35.0 | % | | | 35.0 | % | | | 35.0 | % | |
| State income taxes, net of federal benefit | | | 1.3 | | | | 3.5 | | | | 3.3 | | |
| Non-deductible items | | | 0.4 | | | | 0.2 | | | | ― | | |
| Earnings of minority interests | | | (1.5 | ) | | | (2.3 | ) | | | (2.3 | ) | |
| Domestic production deduction | | | (0.8 | ) | | | (0.8 | ) | | | ― | | |
Other | | | (0.7 | ) | | | (0.1 | ) | | | 1.2 | | |
| | | | 33.7 | % | | | 35.5 | % | | | 37.2 | % | |
Deferred income taxes are provided using the asset and liability method to reflect temporary differences between the financial statement carrying amounts and tax bases of assets and liabilities using presently enacted tax rates and laws. The components of deferred income taxes included in the consolidated balance sheets were as follows (thousands):
| | | 2006 | | 2005 | |
| Deferred tax assets: | | | | | |
| Accounts receivable | | $ | 756 | | $ | 589 | |
| Inventory | | | 1,594 | | | ― | |
| Accrued compensation | | | 11,645 | | | 13,506 | |
| Insurance reserves | | | 6,184 | | | 5,526 | |
| Share-based compensation | | | 3,681 | | | 593 | |
| Other accrued liabilities | | | 2,502 | | | 3,487 | |
| State taxes and credits | | | 2,629 | | | 345 | |
| Investment in partnership interests | | | 2,634 | | | 466 | |
| Other | | | 437 | | | 156 | |
| | | | 32,062 | | | 24,668 | |
| Less: Valuation allowance | | | (1,507 | ) | | (345 | ) |
| | | | 30,555 | | | 24,323 | |
| | | | | | | | |
| Deferred tax liabilities: | | | | | | | |
| Inventory | | | — | | | 3,116 | |
| Revenue recognition | | | 2,495 | | | — | |
| Prepaid expenses and other | | | 1,503 | | | 1,889 | |
| Property and equipment | | | 360 | | | 367 | |
| Depreciation | | | 14,088 | | | 14,145 | |
| Goodwill and other intangibles, net | | | 12,333 | | | 5,489 | |
| Other | | | — | | | 460 | |
| | | | 30,779 | | | 25,466 | |
| | | | | | | | |
| Net deferred tax liabilities | | $ | (224 | ) | $ | (1,143 | ) |
| | | | | | | | |
| Classified in the balance sheet as: | | | | | | | |
| Deferred income tax benefit (current assets) | | $ | 8,914 | | $ | 5,768 | |
| Deferred income taxes (long-term liability) | | | (9,138 | ) | | (6,911 | ) |
| | | $ | (224 | ) | $ | (1,143 | ) |
As a result of allocating purchase price to the assets acquired and liabilities assumed for acquisitions completed during 2006 and 2005, we recorded a net deferred tax liability of $0.9 million and $15.1 million, respectively.
Deferred tax assets are reduced by a valuation allowance when it is more likely than not that some portion of the deferred tax asset will not be realized. A valuation allowance was established of $1.5 million in 2006 and $0.3 million in 2005 for state tax credits that do not expire. Due to income allocation limitations for the jurisdictions, we believe future deductibility is uncertain. We believe that it is more likely than not that our future operating results coupled with the existing deferred tax liabilities will generate sufficient taxable income to realize the remaining deferred tax assets.
12. Financial Instruments
The estimated fair values of cash and cash equivalents, receivables, inventory, unbilled receivables, accounts payable and accruals are the same as their carrying amounts due to their short-term nature. After giving effect to the interest rates swap contracts, the interest for our debt is 58% fixed and 42% variable. The estimated market value of our debt, based on current interest rates for similar obligations with like maturities, was:
| · | $0.2 million less than the amount of debt reported on the consolidated balance sheet at December 31, 2006 and |
| · | $2.7 million less than the amount of debt reported on the consolidated balance sheet at December 31, 2005. |
Changes in interest rates expose us to financial market risk. We currently utilize interest rate swap contracts to hedge interest exposure on our term note. The interest rate swap contracts effectively convert $200 million of the term note to a fixed interest rate of 7.59% through November 2012. Changes in the fair value of the interest rate swap contracts are recorded as accumulated other comprehensive loss, net, a separate component of shareholders’ equity, and are subsequently reclassified into interest expense as interest expense is recognized on the term note.
Derivative financial instruments are not utilized to hedge other risks or for speculative or trading purposes.
13. Commitments and Contingencies
Operating Leases
We lease certain real property, vehicles and office equipment under operating leases. Expense for these operating leases was $26.6 million in 2006, $17.2 million in 2005 and $11.4 million in 2004. Certain of these leases are non-cancelable and have minimum lease payment requirements of $26.4 million in 2007, $23.3 million in 2008, $20.6 million in 2009, $15.7 million in 2010, $8.5 million in 2011 and $15.4 million thereafter.
Warranties
We provide limited warranties for certain construction services. Specific terms and conditions for warranties vary from one year to ten years and are based on geographic market and state regulations. Factors for determining estimates of warranties include the nature and frequency of claims, anticipated claims and cost per claim. Estimated costs for warranties are recognized when the revenue associated with the service is recognized. Revisions of estimated warranties are reflected in the period such revisions are determined. Warranty activity is as follows (thousands):
| | | 2006 | | 2005 | | 2004 | |
| Balance at beginning of the period | | $ | 5,404 | | $ | 258 | | $ | 139 | |
| Provision for warranties | | | 3,009 | | | 2,925 | | | 366 | |
| Provision for warranties from acquisitions | | | 117 | | | 3,345 | | | — | |
| Warranty charges | | | (1,375 | ) | | (1,124 | ) | | (247 | ) |
| Balance at end of the period | | $ | 7,155 | | $ | 5,404 | | $ | 258 | |
Legal Proceedings
We are involved in litigation and other legal matters arising in the normal course of business. In the opinion of management, the recovery or liability, if any, under any of these matters will not have a material effect on our financial position, results of operations or cash flows.
14. Segment Information
The consolidated financial statements include operations from our two reportable segments, SelectBuild and BMC West. These segments represent businesses that are managed separately. Each of these businesses requires distinct marketing and operating strategies. Management reviews financial performance based on these operating segments.
SelectBuild
SelectBuild provides construction services to high-volume homebuilders. These services include wood framing or concrete block masonry, concrete services, plumbing and other services. Construction services include managing labor and construction schedules as well as sourcing materials.
BMC West
BMC West markets and sells building products, manufactures building components and provides construction services. Products include structural lumber and building materials purchased from other manufacturers as well as manufactured building components including millwork, trusses and wall panels. Construction services include framing and installation of miscellaneous building products. Building products and construction services are sold principally to professional builders and contractors.
Corporate
Corporate represents expenses to support the operations of our business segments, SelectBuild and BMC West. These costs include administrative functions for information systems, reporting, accounts payable and human resources, professional fees for regulatory compliance, executive and senior management, certain incentive compensation as well as actuarial adjustments for insurance and medical claims. These costs are not allocated to our business segments.
The financial performance for these reporting segments is based on income from operations before interest expense, income taxes and minority interests. These segments follow the accounting principles described in the Summary of Significant Accounting Policies included in our most recent Annual Report on Form 10-K. Sales between segments are recognized at market prices and no single customer accounts for more than 10% of sales.
Selected financial information by segment is as follows (thousands):
| | | Sales | | Income (Loss) Before Taxes and | | Depreciation | | | | | |
| | | Total | | Inter- Segment | | Trade | | Minority Interests | | and Amortization | | Capital (1) Expenditures | | Assets | |
Year Ended December 31, 2006 | | | | | | | | | | | | | | | | | | | | | | |
| SelectBuild | | $ | 1,744,092 | | $ | (12,278 | ) | $ | 1,731,814 | | $ | 148,416 | | $ | 30,002 | | $ | 33,409 | | $ | 722,328 | |
| BMC West | | | 1,515,121 | | | (1,766 | ) | | 1,513,355 | | | 124,523 | | | 12,178 | | | 33,135 | | | 487,703 | |
| Corporate | | | — | | | — | | | — | | | (75,484 | ) | | 3,104 | | | 6,174 | | | 118,880 | |
| | | $ | 3,259,213 | | $ | (14,044 | ) | $ | 3,245,169 | | | 197,455 | | $ | 45,284 | | $ | 72,718 | | $ | 1,328,911 | |
| Interest Expense | | | | | | | | | | | | 29,082 | | | | | | | | | | |
| | | | | | | | $ | 168,373 | | | | | | | | | | |
| | | | | | | | | | | | | | | | |
Year Ended December 31, 2005 | | | | | | | | | | | | | | | |
| SelectBuild | | $ | 1,395,182 | | $ | (1,296 | ) | $ | 1,393,886 | | $ | 160,957 | | $ | 13,695 | | $ | 62,611 | | $ | 623,877 | |
| BMC West | | | 1,519,903 | | | (1,629 | ) | | 1,518,274 | | | 151,030 | | | 11,218 | | | 17,335 | | | 447,619 | |
| Corporate | | | ― | | | ― | | | ― | | | (72,631 | ) | | 2,450 | | | ― | | | 79,029 | |
| | | $ | 2,915,085 | | $ | (2,925 | ) | $ | 2,912,160 | | | 239,356 | | $ | 27,363 | | $ | 79,946 | | $ | 1,150,525 | |
| Interest Expense | | | | | | | | | | | | 14,420 | | | | | | | | | | |
| | | | | | | | $ | 224,936 | | | | | | | | | | |
| | | | | | | | | | | | | | | | | | | | | | | |
Year Ended December 31, 2004 | | | | | | | | | | | | | | | |
| SelectBuild | | $ | 753,956 | | $ | (255 | ) | $ | 753,701 | | $ | 59,689 | | $ | 8,216 | | $ | 14,382 | | $ | 268,498 | |
| BMC West | | | 1,338,470 | | | (1,146 | ) | | 1,337,324 | | | 96,083 | | | 11,740 | | | 17,036 | | | 409,160 | |
| Corporate | | | ― | | | ― | | | ― | | | (47,664 | ) | | 2,859 | | | ― | | | 65,386 | |
| | | $ | 2,092,426 | | $ | (1,401 | ) | $ | 2,091,025 | | | 108,108 | | $ | 22,815 | | $ | 31,418 | | $ | 743,044 | |
| Interest Expense | | | | | | | | | | | | 13,560 | | | | | | | | | | |
| | | | | | | | $ | 94,548 | | | | | | | | | | |
(1) Property and equipment from acquisitions are included as capital expenditures.
15. Quarterly Results of Operations (unaudited)
Operating results by quarter for 2006 and 2005 were as follows (thousands, except per share data):
| | | Fourth | | Third | | Second | | First | |
2006 | | | | | | | | | |
Sales | | $ | 608,021 | | $ | 830,599 | | $ | 921,992 | | $ | 884,557 | |
Income from operations | | $ | 14,481 | | $ | 64,271 | | $ | 64,317 | | $ | 54,386 | |
Net income | | $ | 4,482 | | $ | 35,348 | | $ | 34,175 | (1) | $ | 28,069 | |
| | | | | | | | | | | | | | |
Net income per diluted common share | | | $0.15 | | | $1.20 | | | $1.16 | | | $0.95 | |
Common share prices: | | | | | | | | | | | | | |
High | | | $27.72 | | | $28.01 | | | $38.29 | | | $40.32 | |
Low | | | $23.95 | | | $20.84 | | | $25.36 | | | $32.27 | |
| | | | | | | | | | | | | | |
| 2005 | | | | | | | | | | | | | |
| Sales | | $ | 817,883 | | $ | 819,828 | | $ | 701,521 | | $ | 572,928 | |
| Income from operations | | $ | 62,336 | | $ | 75,820 | | $ | 60,892 | | $ | 40,308 | |
| Net income | | $ | 33,481 | (2) | $ | 41,564 | | $ | 33,314 | (3) | $ | 21,148 | |
| | | | | | | | | | | | | | |
| Net income per diluted common share | | | $1.13 | | | $1.40 | | | $1.14 | | | $0.73 | |
| Common share prices: | | | | | | | | | | | | | |
| High | | | $48.11 | | | $48.66 | | | $36.13 | | | $24.87 | |
| Low | | | $34.05 | | | $34.68 | | | $22.00 | | | $17.00 | |
| | (1) | Includes impairments of $1.1 million net of tax for goodwill and $0.3 million net of tax for certain customer relationships of SelectBuild. |
| | (2) | Includes impairment of $0.5 million net of tax for goodwill of SelectBuild. |
| | (3) | Includes impairment of $0.3 million net of tax for certain customer relationships of SelectBuild. |
Management’s Report on Internal Control Over Financial Reporting
Our management is responsible for the preparation and fair presentation of the consolidated financial statements included in this annual report. The consolidated financial statements have been prepared in conformity with United States generally accepted accounting principles and reflect management’s judgments and estimates concerning events and transactions that are accounted for or disclosed.
Our management is also responsible for establishing and maintaining effective internal control over financial reporting. Our internal control over financial reporting includes those policies and procedures that pertain to our ability to record, process, summarize and report reliable financial data. Management recognizes that there are inherent limitations in the effectiveness of any internal control and effective internal control over financial reporting can provide only reasonable assurance with respect to financial statement preparation. Additionally, because of changes in conditions, the effectiveness of internal control over financial reporting may vary over time.
In order to ensure that the internal controls over financial reporting are effective, management regularly assesses such controls and did so most recently for its financial reporting as of December 31, 2006. Management’s assessment was based on criteria for effective internal control over financial reporting described in Internal Control - Integrated Framework issued by the Committee of Sponsoring Organizations of the Treadway Commission. Our assessment excluded the internal controls over financial reporting for acquisitions completed subsequent to June 30, 2006, which included the acquisition of Davis Brothers Framing, Inc. (framing services business), Topline Windows & Door, LLC (windows installation business) and ELP Transportation, Inc. (warehousing business). These recent acquisitions comprised 1.6% of our tangible assets and 1.6% of our sales as of and for the year ended December 31, 2006. Based on this assessment, management concluded that as of December 31, 2006 our internal control over financial reporting was effective to provide reasonable assurance regarding the reliability of financial reporting and the preparation of financial statements in accordance with United States generally accepted accounting principles.
KPMG LLP, the independent registered public accounting firm that audited our consolidated financial statements included in this annual report, has issued an attestation report on management’s assertion with respect to the effectiveness of our internal control over financial reporting as of December 31, 2006.
| February 20, 2007 | /s/ Robert E. Mellor | | /s/ William M. Smartt |
| | Robert E. Mellor Chairman of the Board, President and Chief Executive Officer | | William M. Smartt Senior Vice President and Chief Financial Officer |
Report of Independent Registered Public Accounting Firm
The Board of Directors and Shareholders
Building Materials Holding Corporation:
We have audited the accompanying consolidated balance sheets of Building Materials Holding Corporation and subsidiaries as of December 31, 2006 and 2005, and the related consolidated statements of income, shareholders’ equity, and cash flows for each of the years in the three-year period ended December 31, 2006. These consolidated financial statements are the responsibility of the Company’s management. Our responsibility is to express an opinion on these consolidated financial statements based on our audits.
We conducted our audits in accordance with the standards of the Public Company Accounting Oversight Board (United States). Those standards require that we plan and perform the audit to obtain reasonable assurance about whether the financial statements are free of material misstatement. An audit includes examining, on a test basis, evidence supporting the amounts and disclosures in the financial statements. An audit also includes assessing the accounting principles used and significant estimates made by management, as well as evaluating the overall financial statement presentation. We believe that our audits provide a reasonable basis for our opinion.
In our opinion, the consolidated financial statements referred to above present fairly, in all material respects, the financial position of Building Materials Holding Corporation and subsidiaries as of December 31, 2006 and 2005, and the results of their operations and their cash flows for each of the years in the three-year period ended December 31, 2006, in conformity with U.S. generally accepted accounting principles.
As discussed in note 3 to the consolidated financial statements, effective January 1, 2006, the Company adopted the provisions of Statement of Financial Accounting Standards No. 123 (Revised 2004), Share-Based Payment.
We also have audited, in accordance with the standards of the Public Company Accounting Oversight Board (United States), the effectiveness of Building Materials Holding Corporation’s internal control over financial reporting as of December 31, 2006, based on criteria established in Internal Control—Integrated Framework issued by the Committee of Sponsoring Organizations of the Treadway Commission (COSO), and our report dated February 20, 2007 expressed an unqualified opinion on management’s assessment of, and the effective operation of, internal control over financial reporting.
/s/ KPMG LLP
San Francisco, California
February 20, 2007
Report of Independent Registered Public Accounting Firm
The Board of Directors and Shareholders
Building Materials Holding Corporation:
We have audited management’s assessment, included in the accompanying Management’s Report on Internal Control Over Financial Reporting, that Building Materials Holding Corporation maintained effective internal control over financial reporting as of December 31, 2006, based on criteria established in Internal Control—Integrated Framework issued by the Committee of Sponsoring Organizations of the Treadway Commission (COSO). Building Materials Holding Corporation’s management is responsible for maintaining effective internal control over financial reporting and for its assessment of the effectiveness of internal control over financial reporting. Our responsibility is to express an opinion on management’s assessment and an opinion on the effectiveness of the Company’s internal control over financial reporting based on our audit.
We conducted our audit in accordance with the standards of the Public Company Accounting Oversight Board (United States). Those standards require that we plan and perform the audit to obtain reasonable assurance about whether effective internal control over financial reporting was maintained in all material respects. Our audit included obtaining an understanding of internal control over financial reporting, evaluating management’s assessment, testing and evaluating the design and operating effectiveness of internal control, and performing such other procedures as we considered necessary in the circumstances. We believe that our audit provides a reasonable basis for our opinion.
A company’s internal control over financial reporting is a process designed to provide reasonable assurance regarding the reliability of financial reporting and the preparation of financial statements for external purposes in accordance with generally accepted accounting principles. A company’s internal control over financial reporting includes those policies and procedures that (1) pertain to the maintenance of records that, in reasonable detail, accurately and fairly reflect the transactions and dispositions of the assets of the company; (2) provide reasonable assurance that transactions are recorded as necessary to permit preparation of financial statements in accordance with generally accepted accounting principles, and that receipts and expenditures of the company are being made only in accordance with authorizations of management and directors of the company; and (3) provide reasonable assurance regarding prevention or timely detection of unauthorized acquisition, use, or disposition of the company’s assets that could have a material effect on the financial statements.
Because of its inherent limitations, internal control over financial reporting may not prevent or detect misstatements. Also, projections of any evaluation of effectiveness to future periods are subject to the risk that controls may become inadequate because of changes in conditions, or that the degree of compliance with the policies or procedures may deteriorate.
In our opinion, management’s assessment that Building Materials Holding Corporation maintained effective internal control over financial reporting as of December 31, 2006, is fairly stated, in all material respects, based on criteria established in Internal Control—Integrated Framework issued by the Committee of Sponsoring Organizations of the Treadway Commission (COSO). Also, in our opinion, Building Materials Holding Corporation maintained, in all material respects, effective internal control over financial reporting as of December 31, 2006, based on criteria established in Internal Control—Integrated Framework issued by the Committee of Sponsoring Organizations of the Treadway Commission (COSO).
Building Materials Holding Corporation acquired Davis Brothers Framing, Inc., Topline Windows & Doors, LLC, and ELP Transportation, Inc. subsequent to June 30, 2006, and management excluded from its assessment of the effectiveness of Building Materials Holding Corporation’s internal control over financial reporting as of December 31, 2006, these entities’ internal control over financial reporting. These entities comprise 1.6% of tangible assets and 1.6% of sales included in the consolidated financial statements of Building Materials Holding Corporation and subsidiaries as of and for the year ended December 31, 2006. Our audit of internal control over financial reporting of Building Materials Holding Corporation also excluded an evaluation of the internal control over financial reporting of these entities.
We also have audited, in accordance with the standards of the Public Company Accounting Oversight Board (United States), the consolidated balance sheets of Building Materials Holding Corporation and subsidiaries as of December 31, 2006 and 2005, and the related consolidated statements of income, shareholders’ equity, and cash flows for each of the years in the three-year period ended December 31, 2006, and our report dated February 20, 2007 expressed an unqualified opinion on those consolidated financial statements.
/s/ KPMG LLP
San Francisco, California
February 20, 2007
| ITEM 9. | Changes in and Disagreements with Accountants on Accounting and Financial Disclosure |
We have had no disagreements with our independent accountants regarding any matter of accounting principles or practices, financial statement disclosure or auditing scope or procedure.
Conclusion Regarding the Effectiveness of Disclosure Controls and Procedures
As of the end of the period covered by this report, we carried out an evaluation, under the supervision and with the participation of the Chief Executive Officer and Chief Financial Officer, of the design and operation of our disclosure controls and procedures, as defined in Rules 13a-15(e) and 15d-15(e) of the Securities and Exchange Act of 1934. This evaluation was conducted to determine whether the disclosure controls and procedures were effective and timely in bringing material information to the attention of senior management. Based on that evaluation, the Chief Executive Officer and Chief Financial Officer concluded that our disclosure controls and procedures are effective in ensuring material information required to be disclosed in reports filed under the Act is recorded, processed, summarized and reported within the time periods specified in the Securities and Exchange Commission’s rules and forms and is accumulated and communicated to our Chief Executive Officer and Chief Financial Officer to allow timely decisions regarding required disclosure.
Changes in Internal Controls
Our disclosure controls and procedures and internal controls over financial reporting are routinely evaluated and tested for effectiveness. These evaluations are discussed with management and the Audit Committee of the Board of Directors. As a result of these evaluations, revisions and corrective actions are made to ensure the continuing effectiveness of our disclosure controls and procedures and internal controls over financial reporting.
During the period covered by this report, we identified deficiencies in the design or operation of our internal controls, however revisions and corrective actions are being made to ensure the effectiveness of our disclosure controls and procedures and internal controls over financial reporting. None of these deficiencies have been considered a material weakness and there were no changes in the design or operation of our internal controls over financial reporting that have materially affected, or are reasonably likely to materially affect, our internal controls over financial reporting.
Management’s Report on Internal Control Over Financial Reporting
Refer to management’s report on internal control over financial reporting presented in Item 8 - Financial Statements and Supplementary Data (page 74).
Report of Independent Registered Public Accounting Firm on Internal Control Over Financial Reporting
Refer to report of independent registered public accounting firm presented in Item 8 - Financial Statements and Supplementary Data (pages 76 - 77).
None.
PART III
| ITEM 10. | Directors, Executive Officers and Corporate Governance |
Directors
Directors hold office until the annual meeting of shareholders or until election of a successor, resignation, removal or death.
Name | | Age | | Position and Business Experience |
| | | | | |
| Robert E. Mellor | | 63 | | Mr. Mellor became Chairman of the Board of Directors in 2002 and has been President and Chief Executive Officer since 1997. He has been a director since 1991. He was previously Of Counsel with the law firm of Gibson, Dunn & Crutcher LLP from 1990 to 1997. He is a director for Coeur d’Alene Mines Corporation, The Ryland Group and Monro Muffler Brake. He is also on the board of councilors of Save-the-Redwoods League. He does not serve on the audit committee of any of these boards. Mr. Mellor will not stand for re-election to the board of Monro Muffler Brake in 2007. |
| | | | | |
| Sara L. Beckman | | 50 | | Dr. Beckman has served as a director since 2002. She is a member of the Operations and Information Technology Management group at the Haas School of Business at University of California - Berkeley where she has been for nearly 20 years. Her teaching and research focus on operations strategy and innovation management. She also held several corporate positions at Hewlett-Packard Company and was a consultant for Booz, Allen and Hamilton. Additionally, she consults with corporate clients on customer-focused design and innovation. |
| | | | | |
| Eric S. Belsky | | 46 | | Dr. Belsky has served as a director since 2005. He is a specialist in housing finance, economics and policy. He has nearly 20 years experience conducting research on a wide range of housing and urban topics for public and private sector organizations and clients. He currently is the Executive Director of the Joint Center for Housing Studies at Harvard University and has been for over 5 years. Since 2004, he has been a Lecturer in the Harvard Graduate School of Design. He also served as Research Director for the Millennial Housing Commission 2001-2002, a bipartisan commission appointed by the United States Congress. Dr. Belsky also serves as a director of Champion Enterprises, Inc. |
| | | | | |
| James K. Jennings, Jr. | | 65 | | Mr. Jennings has served as a director since 2003. Since January 2005, Mr. Jennings has served as Executive Vice President and Secretary of both Ashbrook Simon-Hartley GP, LLC, and Ashbrook Simon-Hartley Operations GP, LLC, the general partners of limited partnerships which own the assets of a manufacturer of waste water treatment equipment with operations in the U.S., U.K. and Chile. Since October 2003, he has been Executive Vice President, Chief Financial Officer and Director of Atreides Capital, LLC, a private equity investment firm that specializes in the acquisition and operation of middle market manufacturing and distribution companies. During 2003, he served as Executive Vice President, Chief Financial Officer and Director of Consolidation Partners, L.L.C., a privately-held merchant banking organization. Prior to that, he served as Executive Vice President and Chief Financial Officer of Loomis, Fargo & Co. and its predecessor organization, both cash-in-transit service providers, from 1994 to January 2003. |
| Norman J. Metcalfe | | 64 | | Mr. Metcalfe has served as a director since 2005. For the past 8 years he has managed his own investment and real estate business. He has served as Vice Chairman and Chief Financial Officer of The Irvine Company, one of the nation's largest real estate and community development companies. Mr. Metcalfe also serves on the boards of The Ryland Group and The Tejon Ranch Company. |
| | | | | |
David M. Moffett | | 55 | | Mr. Moffett has served as a director since 2006. In February 2007, Mr. Moffett retired as Vice Chairman and Chief Financial Officer for U.S. Bancorp where he served since 1993. He was also previously the chairman of the U.S. Bancorp Asset Liability Policy Committee and a member of its Managing Committee and Credit Policy Committee. |
| | | | | |
| R. Scott Morrison, Jr. | | 67 | | Mr. Morrison has served as a director since 2004. For over 5 years he has been the owner and President of Morrison Properties, a real estate development firm, and a partner in City Center Business Offices, a company that rents business suites on a short-term basis and is based in Fort Lauderdale, Florida. He is formerly a partner and divisional President for Florida based Arvida Corporation, a real estate firm. Mr. Morrison is also a development principal in the Boca Raton Innovation Center now known as the Florida Atlantic Research Park. Mr. Morrison was also a limited partner in Memphis Prince, L.P., d/b/a Audubon Park Place, which owns a 120 unit apartment building in Memphis, Tennessee, until 2005 when it was sold and he served as the President of the general partner, RSM II, Inc, until 2005 when it was dissolved. The limited partnership filed for protection under Chapter 11 of the federal bankruptcy laws in late 2003 and the court approved a reorganization plan late in 2004. |
| | | | | |
| Peter S. O’Neill | | 69 | | Mr. O’Neill has served as a director since 1993. In 1979, he founded O’Neill Enterprises, LLC., a residential development and homebuilding company. Since 2003, he has served as chairman of PON, LLC and related companies, a residential real estate firm. Mr. O’Neill serves on the Board of Trustees and as a member of the Governance Committee for Albertson College of Idaho. He is a member of the Urban Land Institute and is currently serving as a director of IDACORP and Idaho Power Company. |
| Richard G. Reiten | | 67 | | Mr. Reiten has served as a director since 2001. He has been a director for Northwest Natural Gas since 1996 and was Chairman of the Board from 2000 to 2005 and recently re-appointed the Chairman of the Board in 2006. Mr. Reiten was also President and CEO from 1997 to 2002 and President and COO in 1996 of Northwest Natural Gas. He is a director of U.S. Bancorp, Regence Group, IDACORP and National Fuel and Gas. Mr. Reiten is past Chairman of the Board for the American Gas Association and serves on the board of the Associated Electric & Gas Insurance Services Limited. He is also a trustee of the Board of The Nature Conservancy of Oregon, the Oregon Business Council and the Oregon Community Foundation. |
| | | | | |
| Norman R. Walker | | 63 | | Mr. Walker is nominated for election to the board for the first time and was appointed as a director in September 2006. He is a retired partner of PricewaterhouseCoopers LLP (PwC), a position held for more than 26 years. He most recently served as a National Risk Management Partner, Audit and Business Advisory Services from 1992 to 2003 with PwC and is currently the Chief Financial Officer of the Diocese of Bridgeport in Connecticut. Mr. Walker’s professional and business activities also include serving as Chairman of the Ethics Division Technical Standards Committee of the American Institute of Certified Public Accountants, President of PricewaterhouseCoopers LLP Foundation and Chair and President of the University of Oregon Foundation Board of Trustees. He is currently an Emeritus Trustee of the University of Oregon Foundation, member of the Business Advisory Council of Lundquist College of Business at the University of Oregon, and a Trustee of the Bank Street College in New York. |
Executive Officers
Name | | Age | | Position and Business Experience |
| | | | | |
| Robert E. Mellor | | 63 | | Chairman of the Board, President and Chief Executive Officer Mr. Mellor became Chairman of the Board of Directors in 2002 and has been President and Chief Executive Officer since 1997. He has been a director since 1991. He was previously Of Counsel with the law firm of Gibson, Dunn & Crutcher LLP from 1990 to 1997. He is a director for Coeur d’Alene Mines Corporation, The Ryland Group and Monro Muffler Brake. He is also on the board of councilors of Save-the-Redwoods League. He does not serve on the audit committee of any of these boards. Mr. Mellor will not stand for re-election to the Board of Monro Muffler Brake in 2007. |
| William M. Smartt | | 64 | | Senior Vice President and Chief Financial Officer Mr. Smartt has been a Senior Vice President and Chief Financial Officer since April 2004. Prior to joining the Company, he was an independent consultant from August 2001 to March 2004. From 1992 to 2001, he was Executive Vice President, Chief Financial and Administrative Officer of DHL Express, a leader in international air express services. His previous experience as a Chief Financial Officer included 10 years with Di Giorgio Corporation, a Fortune 500 Company, whose product lines included the distribution of building materials, prefabricated components and framing services. |
| | | | | |
| Michael D. Mahre | | 47 | | Senior Vice President - Corporate Development, President and Chief Executive Officer - SelectBuild Mr. Mahre was elected a Senior Vice President in 2003. He was elected Vice President of Corporate Development in 2001 and Chief Executive Officer of BMC Construction in 2002. He joined the Company in 1999 as Director of Financial Planning and Analysis. Mr. Mahre was a principal of The Cambria Group, a private equity investment firm, from 1997 to 1998. |
| | | | | |
| Stanley M. Wilson | | 62 | | Senior Vice President, President and Chief Executive Officer - BMC West Mr. Wilson was elected President and CEO of BMC West in 2004 and was appointed Senior Vice President in 2003. He was elected Vice President in 2000 and was General Manager of the Pacific Division of BMC West from 1993 to 2003. Mr. Wilson has been with the company since its beginning in 1987. His previous experience includes 19 years with the building materials distribution business of Boise Cascade Corporation. |
| | | | | |
| Eric R. Beem | | 37 | | Vice President and Controller Mr. Beem was appointed Vice President in January 2006 and Controller in April 2005. He joined the Company as Accounting Manager in 1996. Mr. Beem is a Certified Public Accountant and his experience includes 3 years with an international public accounting firm. |
| | | | | |
| Mark R. Kailer | | 53 | | Vice President, Treasurer and Investor Relations Mr. Kailer has been Vice President and Treasurer since 2003. He joined the Company in 2000 as Assistant Treasurer. He was previously Senior Manager of Treasury Services at Circle International Group, a publicly-traded global logistics company based in San Francisco, from 1997 to 2000. |
| | | | | |
| Jeffrey F. Lucchesi | | 53 | | Senior Vice President, Chief Information Officer Mr. Lucchesi joined the Company in August 2004 as Senior Vice President and Chief Information Officer. From 2000 to 2004, he was Senior Vice President of Worldwide Operations for Corio, Inc., an enterprise application service provider. Mr. Lucchesi also served from 1994 to 2000 as Vice President and Chief Information Officer for DHL Express, a leader in international air express services. |
| Steven H. Pearson | | 59 | | Senior Vice President - Human Resources Mr. Pearson has been Senior Vice President of Human Resources since 2001. From 1987 through 2001 he served as Vice President of Human Resources. Mr. Pearson has been with the Company since its beginning in 1987. His previous experience also includes 18 years in the human resource function of Boise Cascade Corporation. |
| | | | | |
| Paul S. Street | | 58 | | Senior Vice President, Chief Administrative Officer, General Counsel and Corporate Secretary Mr. Street joined the Company in 1999 as Senior Vice President, General Counsel and Corporate Secretary and has been Chief Administrative Officer since 2001. He previously served as our outside General Counsel & Secretary while a partner of the law firm of Moffatt, Thomas, Barrett, Rock & Fields. |
Certain Relationships and Legal Proceedings
Christopher Reiten is the son of Richard G. Reiten, a member of our Board of Directors. Christopher is not an officer and his compensation is not approved by the Compensation Committee of the Board of Directors. He received compensation of $283,345 as Director of Business Development and Fleet Operations for BMC West in 2006.
During the past five years, there has been no litigation or legal proceeding involving a director or executive officer.
Audit Committee and Financial Expert
The Audit Committee of the Board of Directors consists of Sara L. Beckman, James K. Jennings, Jr., Norman J. Metcalfe and Norman R. Walker. Each member is independent as defined under the NYSE rules. The Board of Directors has determined that each Audit Committee member has sufficient knowledge in financial accounting matters to serve on the Audit Committee. James K. Jennings, Jr. is an audit committee financial expert, as defined by the rules of the Securities and Exchange Commission.
Section 16(a) Beneficial Ownership Reporting Compliance
Section 16(a) of the Securities Exchange Act of 1934 requires executive officers, directors and persons owning more than 10% of a registered class of equity securities to file reports of ownership and changes in ownership with the SEC and the New York Stock Exchange. These reporting persons are also required by SEC regulations to furnish us with copies of all ownership forms filed. Based on review of such forms and written representations from reporting persons, we are in compliance with filing requirements as of December 31, 2006, except for one late Form 4 filing for Paul Street as well as Richard Reiten.
Code of EthicsWe have adopted a Code of Ethics and Code of Business Conduct for our directors, chief executive officer, chief financial officer, controller, other officers and employees. Also, we have adopted Corporate Governance Guidelines for our directors. These codes and guidelines require directors, officers and employees to act with honesty and integrity, avoiding actual or apparent conflicts of interest. As we become aware of issues, prompt action is taken. Copies are available free of charge on our website at www.bmhc.com by accessing Investor Information and then Corporate Governance.
The information required by this item is included in our Proxy Statement under the caption Executive Compensation and Other Information and is incorporated herein by reference. Our Proxy Statement will be filed within 120 days of our year end of December 31, 2006.
| ITEM 12. | Security Ownership of Certain Beneficial Owners and Management and Related Stockholder Matters |
The information relating to security ownership of certain beneficial owners and management is included in our Proxy Statement under the caption Security Ownership of Certain Beneficial Owners and Management and is incorporated herein by reference.
The information relating to securities authorized for issuance under equity compensation plans is included in our Proxy Statement under the caption Executive Compensation and Other Information (specifically the subheading of Equity Compensation Plan Information) and is incorporated herein by reference.
| ITEM 13. | Certain Relationships and Related Transactions, and Director Independence |
The information relating to Certain Relationships and Related Transactions is included in our Proxy Statement under the caption Certain Relationships and Related Transactions (specifically the subheading of Related Transactions) and is incorporated herein by reference.
The information relating to Director Independence is included in our Proxy Statement under the caption Corporate Governance (specifically the subheading of Director Independence) and is incorporated herein by reference.
| ITEM 14. | Principal Accounting Fees and Services |
The information required by this item is included in our Proxy Statement under the caption Fees Paid to Independent Public Accountants and is incorporated herein by reference.
PART IV
| ITEM 15. | Exhibits, Financial Statement Schedules |
| (a) | The following documents are filed as part of this Annual Report on Form 10-K: |
| | | | | | | |
| | 1. | Financial Statements as filed under Item 8 - Financial Statements and Supplementary Data: |
| | | · Consolidated Statements of Income for the years ended December 31, 2006, 2005 and 2004 |
| | | · Consolidated Balance Sheets as of December 31, 2006 and 2005 |
| | | · Consolidated Statements of Shareholders’ Equity for the years ended December 31, 2006, 2005 and 2004 |
| | | · Consolidated Statements of Cash Flows for the years ended December 31, 2006, 2005 and 2004 |
| | | · Notes to Consolidated Financial Statements |
| | | · Management’s Report on Internal Control Over Financial Reporting |
| | | · Reports of Independent Registered Public Accounting Firm |
| | | | | |
| | 2. | Financial Statement Schedules: | | | | |
| | | · Schedule II - Valuation and Qualifying Accounts for the years ended December 31, 2006, 2005 and 2004 (page 86) |
| | | · Report of Independent Registered Public Accounting Firm (page 87) |
| | | |
| | | Schedules other than those listed are omitted because they are not applicable or the required information is presented in the financial statements and related disclosures. |
| | | |
| | 3. | Exhibits: | | | | |
| | | A list of the exhibits required to be filed as part of this report are presented in the Exhibit Index (pages 88 - 91). |
Schedule II
Valuation and Qualifying Accounts
(thousands)
Deductions to Accounts Receivable: Allowance for Returns, Discounts and Doubtful Accounts
Description | | Balance at Beginning of Year | | Additions Charged to Costs and Expenses | | Additions Charged to Other Accounts | | Deductions(1) | | Balance at End of Year | |
| | | | | | | | | | | | |
Year Ended December 31, 2006 | | $ | 3,756 | | $ | 1,181 | | $ | ― | | $ | 450 | | $ | 4,487 | |
| Year Ended December 31, 2005 | | $ | 4,367 | | $ | 447 | | $ | ― | | $ | 1,058 | | $ | 3,756 | |
| Year Ended December 31, 2004 | | $ | 2,425 | | $ | 2,804 | | $ | ― | | $ | 862 | | $ | 4,367 | |
| (1) | Represents write-offs of uncollectible receivables, net of recoveries. |
Report of Independent Registered Public Accounting Firm
The Board of Directors and Shareholders
Building Materials Holding Corporation:
Under date of February 20, 2007, we reported on the consolidated balance sheets of Building Materials Holding Corporation and subsidiaries as of December 31, 2006 and 2005, and the related consolidated statements of income, shareholders’ equity, and cash flows for each of the years in the three-year period ended December 31, 2006, which report and consolidated financial statements are included in this annual report on Form 10-K. In connection with our audits of the aforementioned consolidated financial statements, we also audited the related consolidated financial statement schedule for the years ended December 31, 2006, 2005 and 2004 listed in Item 15(a)(2) of this Form 10-K. This financial statement schedule is the responsibility of the Company’s management. Our responsibility is to express an opinion on this financial statement schedule based on our audits.
In our opinion, the financial statement schedule referred to above, when considered in relation to the basic consolidated financial statements taken as a whole, presents fairly, in all material respects, the information set forth therein.
/s/ KPMG LLP
San Francisco, California
February 20, 2007
Exhibit Index Filed with the Annual Report on Form 10-K
For the Year Ended December 31, 2006
| | | | | Incorporated by Reference |
Exhibit | | | | | | | | | | |
Number | | Exhibit Description | | Form | | File No. | | Exhibit | | Filing Date |
| | | | | | | | | | | |
| 3.50 | | Amended Certificate of Incorporation filed with the Delaware Secretary of State on September 23, 1997 | | 8-K12G3 | | 000-23135 | | 3.(i) 1 | | September 24, 1997 |
| | | | | | | | | | | |
| 3.50.1 | | Certificate of Amendment to Certificate of Incorporation of Building Materials Holding Corporation | | 10-K | | 000-23135 | | 3.50.1 | | February 27, 2006 |
| | | | | | | | | | | |
| 3.60.1 | | Amended and Restated By-laws | | 10-Q | | 000-23135 | | 3.70 | | November 14, 2001 |
| | | | | | | | | | | |
| 4.70 | | Rights Agreement Dated September 19, 1997, as Amended November 5, 1998 | | 10-K405 | | 000-23135 | | 10.27 | | March 30, 1999 |
| | | | | | | | | | | |
| 10.10 | | Second Amended and Restated Credit Agreement dated as of November 10, 2006 among Building Materials Holding Corporation, BMC West Corporation and other Subsidiary Guarantors, Wells Fargo Bank, National Association, as Administrative Agent, Joint Lead Arranger, Joint Book Manager Swingline Lender and L/C Issuer, JPMorgan Chase Bank, N.A., as Document Agent, Suntrust Bank as Joint Lead Arranger and Co-Syndication Agent, BNP Paribas as Joint Lead Arranger and Co-Syndication Agent and other Financial Institutions Party Hereto | | 8-K | | 000-23135 | | 10.10 | | November 14, 2006 |
| | | | | | | | | | | |
| 10.20* | | Amended and Restated 1992 Non-Qualified Stock Plan | | 10-K | | 000-23135 | | 10.33 | | March 28, 1997 |
| | | | | | | | | | | |
| 10.20.1* | | Non-Qualified Option Agreement Between Michael Mahre and BMC West Corporation Pursuant to the 1992 Non-Qualified Stock Option Plan | | 10-K | | 000-23135 | | 10.20.1 | | February 27, 2006 |
| | | | | | | | | | | |
| 10.21* | | Amended and Restated 1993 Employee Stock Option Plan | | 10-K | | 000-23135 | | 10.34 | | March 28, 1997 |
| | | | | | | | | | | |
| 10.21.1* | | Non-Statutory Stock Option Agreement Pursuant to the Amended and Restated 1993 Employee Stock Option Plan | | 10-K | | 000-23135 | | 10.21.1 | | February 27, 2006 |
| | | | | | | | | | | |
| 10.22* | | Second Amended and Restated Non-Employee Director Stock Option Plan | | 10-K | | 000-23135 | | 10.22 | | February 27, 2006 |
| | | | | Incorporated by Reference |
Exhibit | | | | | | | | | | |
Number | | Exhibit Description | | Form | | File No. | | Exhibit | | Filing Date |
| | | | | | | | | | | |
| 10.23* | | Building Materials Holding Corporation 2000 Stock Incentive Plan | | S-8 | | 333-44260 | | 4 | | August 22, 2000 |
| | | | | | | | | | | |
| 10.23.1* | | Non-Statutory Stock Option Agreement Pursuant to the 2000 Stock Incentive Plan | | 10-K | | 000-23135 | | 10.23.1 | | February 27, 2006 |
| | | | | | | | | | | |
| 10.24* | | Building Materials Holding Corporation Employee Stock Purchase Plan | | S-8 | | 333-47122 | | 4 | | October 2, 2000 |
| | | | | | | | | | | |
| 10.25* | | Building Materials Holding Corporation 2004 Incentive and Performance Plan | | S-8 | | 333-117237 | | 4 | | July 8, 2004 |
| | | | | | | | | | | |
| 10.25.1* | | Stock Option Agreement Pursuant to the 2004 Incentive and Performance Plan | | 10-K | | 000-23135 | | 10.25.1 | | February 27, 2006 |
| | | | | | | | | | | |
| 10.25.2* | | Restricted Stock Agreement Pursuant to the 2004 Incentive and Performance Plan (filed with this Form) | | | | | | | | |
| | | | | | | | | | | |
| 10.26* | | Cash Equity Plan | | 10-K | | 000-23135 | | 10.26 | | February 27, 2006 |
| | | | | | | | | | | |
| 10.27* | | Stock Option Agreement of BMC West Corporation and Robert E. Mellor | | S-8 | | 333-136632 | | 4 | | August 14, 2006 |
| | | | | | | | | | | |
| 10.40* | | Building Materials Holding Corporation 2006 Annual Incentive Program BMHC Officers | | 10-Q | | 000-23135 | | 10.40 | | August 1, 2006 |
| | | | | | | | | | | |
| 10.41* | | Building Materials Holding Corporation 2006 Annual Incentive Program SelectBuild Construction Participants | | 10-Q | | 000-23135 | | 10.41 | | August 1, 2006 |
| | | | | | | | | | | |
| 10.42* | | Building Materials Holding Corporation 2006 Annual Incentive Program BMC West Officers and Key Staff | | 10-Q | | 000-23135 | | 10.42 | | August 1, 2006 |
| | | | | | | | | | | |
| 10.43* | | Building Materials Holding Corporation 2005 Deferred Compensation Plan for Directors | | 10-K | | 000-23135 | | 10.43 | | February 27, 2006 |
| | | | | | | | | | | |
| 10.44* | | Building Materials Holding Corporation 1999 Deferred Compensation Plan for Directors (filed with this Form) | | | | | | | | |
| | | | | | | | | | | |
| 10.45* | | Building Materials Holding Corporation 2005 Deferred Compensation Plan for Executives | | 10-K | | 000-23135 | | 10.44 | | February 27, 2006 |
| | | | | | | | | | | |
| 10.46* | | Building Materials Holding Corporation 1999 Deferred Compensation Plan for Executives (filed with this Form) | | | | | | | | |
| | | | | Incorporated by Reference |
Exhibit | | | | | | | | | | |
Number | | Exhibit Description | | Form | | File No. | | Exhibit | | Filing Date |
| | | | | | | | | | | |
| 10.47* | | Building Materials Holding Corporation General Terms and Conditions BMHC Officers and BMHC Key Management 2006 Long-Term Cash Incentive Plan | | 10-Q | | 000-23135 | | 10.45 | | August 1, 2006 |
| | | | | | | | | | | |
| 10.48* | | Building Materials Holding Corporation General Terms and Conditions BMHC Officers and BMHC Key Management 2005 Long-Term Cash Incentive Plan | | 10-K | | 000-23135 | | 10.45 | | February 27, 2006 |
| | | | | | | | | | | |
| 10.49* | | Building Materials Holding Corporation General Terms and Conditions BMHC Officers and BMHC Key Management 2004 Long-Term Cash Incentive Plan | | 10-K | | 000-23135 | | 10.46 | | February 27, 2006 |
| | | | | | | | | | | |
| 10.60* | | Building Materials Holding Corporation 2005 Executives Supplemental Retirement Income Plan | | 10-K | | 000-23135 | | 10.60.1 | | February 27, 2006 |
| | | | | | | | | | | |
| 10.61* | | Building Materials Holding Corporation 2002 Executives Supplemental Retirement Income Plan as Amended and Restated December 31, 2002 | | 10-K | | 000-23135 | | 10.60 | | February 27, 2006 |
| | | | | | | | | | | |
| 10.70* | | Severance Plan for Certain Executive Officers, Senior Management and Key Employees of the Company and its Subsidiaries | | 10-Q | | 000-23135 | | 10.70 | | August 1, 2006 |
| | | | | | | | | | | |
| 10.80 | | Amended Form of Indemnity Agreement Between Building Materials Holding Corporation and its Officers and Directors | | 10-K | | 000-23135 | | 10.7.1 | | March 26, 2003 |
| | | | | | | | | | | |
| 10.90* | | Employment Agreement by and Between Robert E. Mellor and Building Materials Holding Corporation as of June 28, 2006 | | 10-Q | | 000-23135 | | 10.90 | | August 1, 2006 |
| | | | | | | | | | | |
| 10.91* | | Employment Agreement by and Between William M. Smartt and Building Materials Holding Corporation as of April 1, 2006 | | 10-Q | | 000-23135 | | 10.91 | | August 1, 2006 |
| | | | | | | | | | | |
| 21.0 | | Subsidiaries of Building Materials Holding Corporation (filed with this Form) | | | | | | | | |
| | | | | | | | | | | |
| 23.1 | | Consent of KPMG LLP (filed with this Form) | | | | | | | | |
| | | | | Incorporated by Reference |
Exhibit | | | | | | | | | | |
Number | | Exhibit Description | | Form | | File No. | | Exhibit | | Filing Date |
| | | | | | | | | | | |
| 31.1 | | CEO Certification Pursuant to Section 302 of the Sarbanes-Oxley Act of 2002 (filed with this Form) | | | | | | | | |
| | | | | | | | | | | |
| 31.2 | | CFO Certification Pursuant to Section 302 of the Sarbanes-Oxley Act of 2002 (filed with this Form) | | | | | | | | |
| | | | | | | | | | | |
| 32.1 | | CEO and CFO Certifications Pursuant to Section 906 of the Sarbanes-Oxley Act of 2002 (filed with this Form) | | | | | | | | |
| | | | | | | | | | | |
| 99.1 | | Annual CEO Certification of Compliance with the New York Stock Exchange Corporate Governance Listing Standards (filed with this Form) | | | | | | | | |
| | | | | | | | | | | |
| * Indicates a management contract or compensatory plan | | | | | | |
Pursuant to the requirements of Section 13 or 15(d) of the Securities Exchange Act of 1934, the registrant has duly caused this report to be signed on its behalf by the undersigned, thereunto duly authorized.
| | | Building Materials Holding Corporation |
|
|
|
| Date: February 21, 2007 | | /s/ Robert E. Mellor |
| |
Robert E. Mellor |
| | Chairman of the Board, President and Chief Executive Officer (Principal Executive Officer) |
Pursuant to the requirements of the Securities Exchange Act of 1934, this report has been signed below by the following persons on behalf of the registrant and in the capacities and on the dates indicated.
Signature | | Title | | Date |
| | | | | |
| /s/ Robert E. Mellor | | Chairman of the Board, President and Chief Executive Officer (Principal Executive Officer) | | February 21, 2007 |
| Robert E. Mellor | | | | |
| | | | | |
| /s/ William M. Smartt | | Senior Vice President and Chief Financial Officer (Principal Financial Officer) | | February 21, 2007 |
| William M. Smartt | | | | |
| | | | | |
| /s/ Eric R. Beem | | Vice President and Controller (Principal Accounting Officer) | | February 21, 2007 |
| Eric R. Beem | | | | |
| | | | | |
| /s/ Sara L. Beckman | | Director | | February 21, 2007 |
| Sara L. Beckman | | | | |
| | | | | |
| /s/ Eric S. Belsky | | Director | | February 21, 2007 |
| Eric S. Belsky | | | | |
| | | | | |
| /s/ James K. Jennings, Jr. | | Director | | February 21, 2007 |
| James K. Jennings, Jr. | | | | |
| | | | | |
| /s/ Norman J. Metcalfe | | Director | | February 21, 2007 |
| Norman J. Metcalfe | | | | |
| | | | | |
| /s/ David M. Moffett | | Director | | February 21, 2007 |
| David M. Moffett | | | | |
| | | | | |
| /s/ R. Scott Morrison, Jr. | | Director | | February 21, 2007 |
| R. Scott Morrison, Jr. | | | | |
| | | | | |
| /s/ Peter S. O’Neill | | Director | | February 21, 2007 |
| Peter S. O’Neill | | | | |
| | | | | |
| /s/ Richard G. Reiten | | Director | | February 21, 2007 |
| Richard G. Reiten | | | | |
List of Exhibits Filed |
| | |
Exhibit | |
Number | Exhibit Description |
| | |
| 10.25.2 | Restricted Stock Agreement Pursuant to the 2004 Incentive and Performance Plan |
| | |
| 10.44* | Building Materials Holding Corporation 1999 Deferred Compensation Plan for Directors |
| | |
| 10.46* | Building Materials Holding Corporation 1999 Deferred Compensation Plan for Executives |
| | |
| 21.0 | Subsidiaries of Building Materials Holding Corporation |
| | |
| 23.1 | Consent of KPMG LLP |
| | |
| 31.1 | CEO Certification Pursuant to Section 302 of the Sarbanes-Oxley Act of 2002 |
| | |
| 31.2 | CFO Certification Pursuant to Section 302 of the Sarbanes-Oxley Act of 2002 |
| | |
| 32.1 | CEO and CFO Certifications Pursuant to Section 906 of the Sarbanes-Oxley Act of 2002 |
| | |
| 99.1 | Annual CEO Certification of Compliance with the New York Stock Exchange Corporate Governance Listing Standards |
* Indicates a management contract or compensatory plan.