Item 1: Report to Shareholders| Real Estate Fund | June 30, 2005 |
The views and opinions in this report were current as of June 30, 2005. They are not guarantees of performance or investment results and should not be taken as investment advice. Investment decisions reflect a variety of factors, and the managers reserve the right to change their views about individual stocks, sectors, and the markets at any time. As a result, the views expressed should not be relied upon as a forecast of the fund’s future investment intent. The report is certified under the Sarbanes-Oxley Act of 2002, which requires mutual funds and other public companies to affirm that, to the best of their knowledge, the information in their financial reports is fairly and accurately stated in all material respects.
REPORTS ON THE WEB
Sign up for our E-mail Program, and you can begin to receive updated fund reports and prospectuses online rather than through the mail. Log in to your account at troweprice.com for more information.
Fellow Shareholders
The ongoing strength of real estate securities benefited shareholders and surprised the skeptics. In the second quarter of 2005 alone, real estate investment trusts (REITs) advanced an unusually strong 14%, as measured by the MSCI REIT Index, more than offsetting smaller declines in the first quarter and providing positive year-to-date returns that once again exceeded the broader equities benchmarks. Real estate fundamentals continued to recover and improve thanks to steady demand generated by job growth against a backdrop of limited new supply in commercial real estate construction. Advances were made in both occupancy and rental rates in the properties of many of our portfolio companies.
We would like to take this opportunity to welcome investors in the Advisor Class, which commenced operations on December 31, 2004. We are pleased to report that the fund participated in the strong advance in real estate securities, with a return that was roughly in line with the Dow Jones Wilshire Real Estate Securities Index and the Lipper Real Estate Funds Index for the six months ended June 30, 2005, as shown in the Performance Comparison table. (Results for the Advisor Class shares were slightly lower, reflecting their higher expense ratio.) During the 12-month period, fund performance was excellent and slightly surpassed the Wilshire index while handily outpacing the Lipper index, which measures the performance of competing funds.
| Periods Ended 6/30/05 | 6 Months | 12 Months |
| Real Estate Fund | 6.50% | 34.98% |
| Real Estate Fund–Advisor Class | 6.45 | – |
| Dow Jones Wilshire Real Estate | | |
| Securities Index | 6.79 | 34.60 |
| Lipper Real Estate Funds Index | 6.16 | 32.57 |
DIVIDEND DISTRIBUTION
On June 27, 2005, your fund’s Board of Directors declared a second-quarter income dividend of $0.15 ($0.14 for Advisor Class) per share. This distribution was paid on June 29, 2005, to shareholders of record on June 27.
MARKET ENVIRONMENT AND STRATEGY
The U.S. economy appears to have moved convincingly past the so-called “jobless recovery” phase that characterized it earlier, to a point where job growth is evident in increasing demand for commercial real estate. Unemployment remains low, and the Federal Reserve has raised short-term interest rates nine times since June 2004 in an effort to manage economic growth while taming inflationary pressures. Yet, while short-term interest rates have increased, long-term rates have actually contracted, confounding the experts and prompting Fed Chairman Alan Greenspan to label the situation a “conundrum.”
Persistently high oil prices are partly to blame for investors’ caution about a sustained economic recovery, leading to expectations of lower long-term equity returns. On a positive note, lower long-term interest rates against the backdrop of rising short-term rates have benefited our portfolio holdings, both directly and indirectly. Lower interest rates have reduced the borrowing costs for our real estate companies, which have historically used significant (though prudent) levels of leverage. Additionally, low returns in the broader stock market so far this year have lifted the appeal of dividend-paying companies and attracted attention to our sector of the market.
Unemployment has now fallen to a four-year low of 5% as job creation has improved considerably over the past year, and we anticipate this trend to continue in coming months. The pace of job creation has been steady but moderate, resulting in improving demand for our properties. (Recall that we have often highlighted the need for job growth in order to spur demand for real estate.) Economic growth, job growth, and corresponding household formation are all factors that contribute to filling offices, producing activity in warehouses, and spurring demand for apartments, lodging, and other properties. Fortunately, consumers have remained surprisingly resilient over the past few years, which has bolstered retail property fundamentals and helped buffer REIT performance. We still see strength in those fundamentals and are now encouraged that the weaker real estate sectors are beginning to exhibit signs of improvement.
In our last shareholder letter, we noted that—despite the strong advance of real estate securities in recent years—there did not appear to be a disconnect between stock valuations and the value of the underlying real estate assets in the private market. Indeed, since then a couple of major cash transactions have resulted in the acquisition of public real estate companies at substantial premiums, reflecting their heightened values in the private markets. Our fund benefited directly when it was announced that Gables Residential Trust would be purchased by a private partnership in an all-cash bid at a price well above market value. (Please refer to our portfolio of investments for a complete listing of fund holdings and the amount each represents of the portfolio.)
PORTFOLIO REVIEW
Once again we can highlight the notable performance of our retail property holdings and, specifically, the mall REITs in our fund, including Simon Property Group, General Growth Properties, and CBL & Associates Properties. Meanwhile, the lodging recovery continues to unfold nicely, and we took the opportunity to harvest some profits in Hilton Hotels after a rewarding runup in the stock. Reflecting the ongoing improvement in office fundamentals, investors showed renewed interest in some selective names and bolstered returns in Equity Office Properties, a REIT many consider a bellwether for the sector. We also took profits in Maguire Properties, an office REIT focused on southern California. While we still like Maguire’s asset base, we grew more concerned on a risk-adjusted basis with the company’s level of debt, although we may revisit the stock at some point when we have a greater comfort level with the company.
As mentioned, Gables Residential Trust received an all-cash bid at a substantial premium, which resulted in the removal of this longtime holding. We added shares of Post Properties during the first half of the year and believe the firm’s assets offer similar potential to that of Gables. We also received a premium acquisition bid for Catellus Development and could see this holding eliminated if the deal comes to fruition. Since the bid was tendered by another fund company, ProLogis, we stand to reap the rewards of the combined entity going forward. Longtime shareholders may recall that we have had several similar situations involving the mergers of fund positions, and we have often retained shares in the acquiring company when we were optimistic about their combined portfolios, such as the recent merger of Rouse’s assets with General Growth Properties.
| | Percent of Net Assets |
| | 12/31/04 | 6/30/05 |
| Office | 20.0% | 21.0% |
| Apartment/Residential | 17.8 | 18.1 |
| Shopping Center | 15.2 | 14.2 |
| Regional Mall | 11.9 | 13.0 |
| Industrial | 10.8 | 10.4 |
| Lodging and Leisure | 9.2 | 8.5 |
| Office and Industrial | 3.2 | 5.2 |
| Diversified | 5.5 | 5.1 |
| Other Real Estate | 2.1 | 2.2 |
| Self Storage | 1.6 | 1.4 |
| Manufactured Housing | 1.2 | 0.0 |
| Other and Reserves | 1.5 | 0.9 |
| Total | 100.0% | 100.0% |
| | | |
| Historical weightings reflect current industry/sector classifications. |
We added shares of REITs that specialize in facilities for health care and life sciences tenants—specifically Alexandria Real Estate and BioMed Realty Trust. In our view, these companies are positioned to benefit from the trends favoring these assets in key U.S. locations.
OUTLOOK
At the risk of repeating ourselves, we would like to reiterate that a recovery in job growth is critical for our sector. We are, therefore, pleased to report that the recovery appears to be well under way, and—barring an interruption to this trend down the road—the situation bodes well for improving fundamentals in several major segments of commercial real estate. Specifically, we see brightening prospects for apartments, office, and industrial real estate, and we project modest, yet healthy, earnings growth for our companies overall. We should point out that, while we are confident that improved fundamentals will lead to even better earnings for our group, the valuations of real estate companies’ stocks have recently expanded. The greatest risk we face would be a compression in price/earnings multiples, if that were to occur. That said, healthy supply/demand fundamentals are the crucial success factors for investing in real estate stocks over the long run, and we remain optimist ic about prospects in our sector.
Respectfully submitted,

David M. Lee
President of the fund and chairman of its Investment Advisory Committee
July 21, 2005
The committee chairman has day-to-day responsibility for managing the portfolio and works with committee members in developing and executing the fund’s investment program.
RISKS OF INVESTING
The fund’s share price can fall because of weakness in the stock market, a particular industry, or specific holdings. Stock markets can decline for many reasons, including adverse political or economic developments, changes in investor psychology, or heavy institutional selling. The prospects for an industry or company may deteriorate because of a variety of factors, including disappointing earnings or changes in the competitive environment. In addition, the investment manager’s assessment of companies held in a fund may prove incorrect, resulting in losses or poor performance even in rising markets.
Funds that invest only in specific industries will experience greater volatility than funds investing in a broad range of industries. Due to its concentration in the real estate industry, the fund’s share price could be more volatile than that of a fund with a broader investment mandate. Trends perceived to be unfavorable to real estate, such as changes in the tax laws or rising interest rates, could cause a decline in share prices.
GLOSSARY
Beta: A measure of the market risk of a portfolio showing how responsive the fund is to a given market index. By definition, the beta of the benchmark index is 1.00. A fund with a 1.10 beta is expected to perform 10% better than the index in up markets and 10% worse in down markets. Usually, higher betas represent riskier investments.
Capitalization rate: A ratio, shown as a percentage rate, that estimates the present value of an income-producing asset. Riskier investments have higher capitalization rates and lower present values.
Lipper indexes: Fund benchmarks that consist of a small number of the largest mutual funds in a particular category as tracked by Lipper Inc.
Price/earnings ratio (or multiple): A valuation measure calculated by dividing the price of a stock by its current or projected earnings per share. This ratio gives investors an idea of how much they are paying for current or future earnings power.
Real estate investment trusts (REITs): Publicly traded companies that own, develop, and operate apartment complexes, hotels, office buildings, and other commercial properties.
Merrill Lynch Wilshire Real Estate Securities Index: A market capitalization-weighted index composed of publicly traded real estate investment trusts and real estate operating companies.
MSCI REIT Index: A total return index composed of the most actively traded real estate investment trusts, designed to be a measure of real estate equity performance.
| PORTFOLIO HIGHLIGHTS |
| |
| TWENTY-FIVE LARGEST HOLDINGS | |
| | Percent of |
| | Net Assets |
| | 6/30/05 |
| |
| Simon Property Group | 5.1% |
| Equity Office Properties | 4.7 |
| Boston Properties | 3.9 |
| Vornado Realty Trust | 3.9 |
| Archstone-Smith Trust | 3.6 |
| Equity Residential | 3.4 |
| AMB Property | 3.2 |
| Camden Property Trust | 3.1 |
| ProLogis | 2.9 |
| SL Green Realty | 2.9 |
| General Growth Properties | 2.8 |
| Reckson Associates Realty | 2.6 |
| Avalonbay Communities | 2.5 |
| CarrAmerica Realty | 2.5 |
| Kimco Realty | 2.3 |
| Macerich Company | 2.3 |
| Starwood Hotels & Resorts Worldwide | 2.3 |
| Arden Realty | 2.3 |
| Developers Diversified Realty | 2.3 |
| EastGroup Properties | 2.3 |
| Regency Centers | 2.2 |
| Essex Property Trust | 2.2 |
| Mack-Cali Realty | 2.1 |
| Host Marriott | 2.1 |
| United Dominion Realty Trust | 2.0 |
| Total | 71.5% |
| PORTFOLIO HIGHLIGHTS |
| |
| MAJOR PORTFOLIO CHANGES | |
| Listed in descending order of size | |
| |
| 6 Months Ended 6/30/05 | |
| |
| Largest Purchases | Largest Sales |
| |
| Post Properties * | Maguire Properties ** |
| Alexandria Real Estate * | Sun Communities ** |
| Arden Realty | Hilton ** |
| Mack-Cali Realty | Gables Residential Trust ** |
| General Growth Properties | CarrAmerica Realty |
| Kilroy Realty | EastGroup Properties |
| Equity Office Properties | New Plan Excel Realty |
| Reckson Associates Realty | Centerpoint Properties |
| Macerich Company | |
| CarrAmerica Realty | |
| | |
| ** Position added | |
| ** Position eliminated | |
This chart shows the value of a hypothetical $10,000 investment in the fund over the past 10 fiscal year periods or since inception (for funds lacking 10-year records). The result is compared with benchmarks, which may include a broad-based market index and a peer group average or index. Market indexes do not include expenses, which are deducted from fund returns as well as mutual fund averages and indexes.
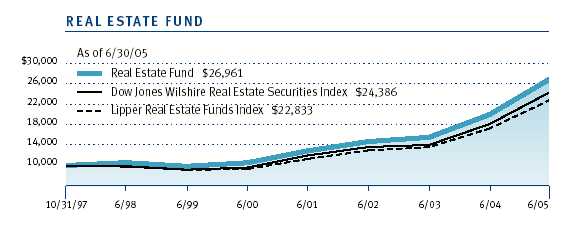
| AVERAGE ANNUAL COMPOUND TOTAL RETURN |
This table shows how the fund and its benchmarks would have performed if their actual (or cumulative) returns for the periods shown had been earned at a constant rate.
| | | | Since | Inception |
| Periods Ended 6/30/05 | 1 Year | 5 Years | Inception | Date |
| Real Estate Fund | 34.98% | 20.67% | 13.82% | 10/31/97 |
| Dow Jones Wilshire Real Estate | | | | |
| Securities Index | 34.60 | 20.48 | 12.33 | – |
| Lipper Real Estate Funds Index | 32.57 | 19.63 | 11.37 | – |
| Real Estate Fund–Advisor Class | – | – | 6.45 | 12/31/04 |
| Dow Jones Wilshire Real Estate | | | | |
| Securities Index | – | – | 6.79 | – |
| Lipper Real Estate Funds Index | – | – | 6.16 | – |
| |
| Current performance may be higher or lower than the quoted past performance, which cannot |
| guarantee future results. Share price, principal value, and return will vary, and you may have |
| a gain or loss when you sell your shares. For the most recent month-end performance infor- |
| mation, please visit our Web site (troweprice.com) or contact a T. Rowe Price representative |
| at 1-800-225-5132. The performance information shown does not reflect the deduction of |
| a 1% redemption fee on shares held for less than three months. If it did, the performance |
| would be lower. | | | | |
| Average annual total return figures include changes in principal value, reinvested dividends, and capital |
| gain distributions. Returns do not reflect taxes that the shareholder may pay on fund distributions or the |
| redemption of fund shares. When assessing performance, investors should consider both short- and |
| long-term returns. |
As a mutual fund shareholder, you may incur two types of costs: (1) transaction costs such as redemption fees or sales loads and (2) ongoing costs, including management fees, distribution and service (12b-1) fees, and other fund expenses. The following example is intended to help you understand your ongoing costs (in dollars) of investing in the fund and to compare these costs with the ongoing costs of investing in other mutual funds. The example is based on an investment of $1,000 invested at the beginning of the most recent six-month period and held for the entire period.
Please note that the fund has two share classes: The original share class (“investor class”) charges no distribution and service (12b-1) fee. Advisor Class shares are offered only through unaffiliated brokers and other financial intermediaries and charge a 0.25% 12b-1 fee. Each share class is presented separately in the table.
Actual Expenses
The first line of the following table (“Actual”) provides information about actual account values and expenses based on the fund’s actual returns. You may use the information in this line, together with your account balance, to estimate the expenses that you paid over the period. Simply divide your account value by $1,000 (for example, an $8,600 account value divided by $1,000 = 8.6), then multiply the result by the number in the first line under the heading “Expenses Paid During Period” to estimate the expenses you paid on your account during this period.
Hypothetical Example for Comparison Purposes
The information on the second line of the table (“Hypothetical”) is based on hypothetical account values and expenses derived from the fund’s actual expense ratio and an assumed 5% per year rate of return before expenses (not the fund’s actual return). You may compare the ongoing costs of investing in the fund with other funds by contrasting this 5% hypothetical example and the 5% hypothetical examples that appear in the shareholder reports of the other funds. The hypothetical account values and expenses may not be used to estimate the actual ending account balance or expenses you paid for the period.
Note: T. Rowe Price charges an annual small-account maintenance fee of $10, generally for accounts with less than $2,000 ($500 for UGMA/UTMA). The fee is waived for any investor whose T. Rowe Price mutual fund accounts total $25,000 or more, accounts employing automatic investing, and IRAs and other retirement plan accounts that utilize a prototype plan sponsored by T. Rowe Price (although a separate custodial or administrative fee may apply to such accounts). This fee is not included in the accompanying table. If you are subject to the fee, keep it in mind when you are estimating the ongoing expenses of investing in the fund and when comparing the expenses of this fund with other funds.
You should also be aware that the expenses shown in the table highlight only your ongoing costs and do not reflect any transaction costs, such as redemption fees or sales loads. Therefore, the second line of the table is useful in comparing ongoing costs only and will not help you determine the relative total costs of owning different funds. To the extent a fund charges transaction costs, however, the total cost of owning that fund is higher.
| T. ROWE PRICE REAL ESTATE FUND |
| | Beginning | Ending | Expenses Paid |
| | Account Value | Account Value | During Period* |
| | 1/1/05 | 6/30/05 | 1/1/05 to 6/30/05 |
| Investor Class | | | |
| Actual | $1,000.00 | $1,065.00 | $4.56 |
| Hypothetical (assumes 5% | | | |
| return before expenses) | 1,000.00 | 1,020.38 | 4.46 |
| Advisor Class | | | |
| Actual | 1,000.00 | 1,064.50 | 5.02 |
| Hypothetical (assumes 5% | | | |
| return before expenses) | 1,000.00 | 1,019.93 | 4.91 |
| | | | |
| * | Expenses are equal to the fund’s annualized expense ratio for the six-month period, multiplied by the |
| average account value over the period, multiplied by the number of days in the most recent fiscal half |
| year (181) divided by the days in the year (365) to reflect the half-year period. The annualized expense |
| ratio of the Investor Class was 0.89%, the Advisor Class was 0.98%. |
Unaudited
| FINANCIAL HIGHLIGHTS | For a share outstanding throughout each period |
| Investor Class | | | | | | | | | | | | |
| | | 6 Months | | Year | | | | | | | | |
| | | Ended | | Ended | | | | | | | | |
| | | 6/30/05** | | 12/31/04 | | 12/31/03 | | 12/31/02 | | 12/31/01 | | 12/31/00 |
| NET ASSET VALUE | | | | | | | | | | | | |
| Beginning of period | $ | 17.90 | $ | 13.65 | $ | 10.62 | $ | 10.54 | $ | 10.19 | $ | 8.11 |
|
|
| |
| Investment activities | | | | | | | | | | | | |
| Net investment income | | | | | | | | | | | | |
| (loss) | | 0.29 | | 0.43 | | 0.36 | | 0.38* | | 0.42* | | 0.38* |
| Net realized and | | | | | | | | | | | | |
| unrealized gain (loss) | | 0.84 | | 4.49 | | 3.26 | | 0.19++ | | 0.46 | | 2.16 |
|
|
| Total from investment | | | | | | | | | | | | |
| activities | | 1.13 | | 4.92 | | 3.62 | | 0.57 | | 0.88 | | 2.54 |
|
|
| Distributions | | | | | | | | | | | | |
| Net investment income | | (0.29) | | (0.49) | | (0.52) | | (0.47) | | (0.53) | | (0.38) |
| Net realized gain | | (0.07) | | (0.18) | | (0.05) | | – | | – | | – |
| Tax return of capital | | – | | – | | (0.02) | | (0.02) | | – | | (0.09) |
|
|
| Total distributions | | (0.36) | | (0.67) | | (0.59) | | (0.49) | | (0.53) | | (0.47) |
|
|
| |
| Redemption fees | | | | | | | | | | | | |
| added to paid-in-capital | | – | | – | | – | | – | | – | | 0.01 |
|
|
| |
| NET ASSET VALUE | | | | | | | | | | | | |
| End of period | | 18.67 | $ | 17.90 | $ | 13.65 | $ | 10.62 | $ | 10.54 | $ | 10.19 |
|
|
| | | | | | | | | | | | | |
| Ratios/Supplemental Data |
| Total return^ | | 6.50% | | 36.82% | | 34.84% | | 5.38%* | | 8.87%* | | 31.92%* |
| Ratio of total expenses to | | | | | | | | | | | | |
| average net assets | | 0.89%† | | 0.90% | | 1.00% | | 1.00%* | | 1.00%* | | 1.00%* |
| Ratio of net investment | | | | | | | | | | | | |
| income (loss) to average | | | | | | | | | | | | |
| net assets | | 3.41%† | | 2.74% | | 3.49% | | 4.07%* | | 4.09%* | | 4.61%* |
| Portfolio turnover rate | | 10.1%† | | 8.4% | | 4.5% | | 9.8% | | 37.2% | | 19.0% |
| Net assets, end of period | | | | | | | | | | | | |
| (in thousands) | $ | 785,245 | $ | 641,014 | $ | 291,066 | $ | 131,736 | $ | 68,720 | $ | 53,703 |
| |
| ^ | Total return reflects the rate that an investor would have earned on an investment in the fund during each period, |
| | assuming reinvestment of all distributions and payment of no redemption or account fees. |
| * | Excludes expenses in excess of a 0.90% contractual expense limitation in effect through 4/30/06 and expenses in |
| | excess of a 1.00% contractual expense limitation in effect through 12/31/03. |
| ** | Per share amounts calculated using average shares outstanding method. |
| ++ | The amount presented is calculated pursuant to a methodology prescribed by the Securities and Exchange Commission |
| | for a share outstanding throughout the period. This amount is inconsistent with the fund’s aggregate gains and losses |
| | because of the timing of sales and redemptions of fund shares in relation to fluctuating market values for the invest- |
| | ment portfolio. |
| † | Annualized |
The accompanying notes are an integral part of these financial statements.
Unaudited
| FINANCIAL HIGHLIGHTS | For a share outstanding throughout the period |
| Advisor Class | | |
| | 6 Months |
| | | Ended |
| | | 6/30/05** |
| NET ASSET VALUE | | |
| Beginning of period | $ | 17.90 |
|
|
| |
| Investment activities | | |
| Net investment income (loss) | | 0.30 |
| Net realized and unrealized gain (loss) | | 0.82 |
|
|
| Total from investment activities | | 1.12 |
|
|
| |
| Distributions | | |
| Net investment income | | (0.28) |
| Net realized gain | | (0.07) |
|
|
| Total distributions | | (0.35) |
|
|
| |
| NET ASSET VALUE | | |
| End of period | $ | 18.67 |
|
|
| |
| |
| Ratios/Supplemental Data | | |
| Total return^ | | 6.45% |
| Ratio of total expenses to | | |
| average net assets | | 0.98%† |
| Ratio of net investment | | |
| income (loss) to average | | |
| net assets | | 3.52%† |
| Portfolio turnover rate | | 10.1%† |
| Net assets, end of period | | |
| (in thousands) | $ | 477 |
| ^ | Total return reflects the rate that an investor would have earned on an investment in the fund during the period, |
| | assuming reinvestment of all distributions and payment of no redemption or account fees. |
| ** | Per share amounts calculated using average shares outstanding method. |
| † | Annualized |
The accompanying notes are an integral part of these financial statements.
Unaudited
| PORTFOLIO OF INVESTMENTS (1) | Shares | Value |
| (Cost and value in $ 000s) | | |
| |
| COMMON STOCKS 99.1% | | |
| |
| REAL ESTATE 99.1% | | |
| Apartment/ Residential 18.1% | | |
| Archstone-Smith Trust, REIT | 739,000 | 28,540 |
| Avalonbay Communities, REIT | 244,000 | 19,715 |
| Camden Property Trust, REIT | 457,000 | 24,564 |
| Equity Residential, REIT | 731,000 | 26,915 |
| Essex Property Trust, REIT | 210,000 | 17,443 |
| Post Properties, REIT | 249,500 | 9,009 |
| United Dominion Realty Trust, REIT | 653,000 | 15,705 |
| | | 141,891 |
| Diversified 5.1% | | |
| Cousins Properties, REIT | 340,000 | 10,057 |
| Vornado Realty Trust, REIT | 377,000 | 30,311 |
| | | 40,368 |
| Industrial 10.4% | | |
| AMB Property, REIT | 584,000 | 25,363 |
| Catellus Development, REIT | 314,000 | 10,299 |
| Centerpoint Properties, REIT | 115,000 | 4,865 |
| EastGroup Properties, REIT | 421,000 | 17,728 |
| ProLogis, REIT | 575,000 | 23,138 |
| | | 81,393 |
| Lodging & Leisure 8.5% | | |
| Host Marriott, REIT | 939,000 | 16,433 |
| LaSalle Hotel Properties, REIT | 310,000 | 10,171 |
| Marriott, Class A | 191,000 | 13,030 |
| Starwood Hotels & Resorts Worldwide, Equity Units | 306,000 | 17,922 |
| Strategic Hotel Capital, REIT | 508,000 | 9,144 |
| | | 66,700 |
| Office 21.0% | | |
| Arden Realty, REIT | 496,000 | 17,846 |
| Boston Properties, REIT | 441,000 | 30,870 |
| CarrAmerica Realty, REIT | 544,000 | 19,682 |
| Equity Office Properties, REIT | 1,111,000 | 36,774 |
| Mack-Cali Realty, REIT | 364,000 | 16,489 |
| Reckson Associates Realty, REIT | 598,000 | 20,063 |
| SL Green Realty, REIT | 354,000 | 22,833 |
| | | 164,557 |
| Office & Industrial 5.2% | | |
| Alexandria Real Estate, REIT | 114,000 | 8,373 |
| BioMed Realty Trust, REIT | 162,000 | 3,864 |
| Duke Realty, REIT | 436,000 | 13,804 |
| Kilroy Realty, REIT | 316,000 | 15,007 |
| | | 41,048 |
| Other Real Estate 2.2% | | |
| Plum Creek Timber, REIT | 223,000 | 8,095 |
| St. Joe | 112,000 | 9,132 |
| | | 17,227 |
| Regional Mall 13.0% | | |
| CBL & Associates Properties, REIT | 264,000 | 11,371 |
| General Growth Properties, REIT | 532,000 | 21,860 |
| Macerich Company, REIT | 269,000 | 18,036 |
| Mills, REIT | 168,000 | 10,213 |
| Simon Property Group, REIT | 558,000 | 40,449 |
| | | 101,929 |
| Self Storage 1.4% | | |
| Public Storage, REIT | 179,000 | 11,322 |
| | | 11,322 |
| Shopping Center 14.2% | | |
| Developers Diversified Realty, REIT | 386,000 | 17,741 |
| Federal Realty Investment Trust, REIT | 254,000 | 14,986 |
| Kimco Realty, REIT | 308,000 | 18,144 |
| New Plan Excel Realty, REIT | 517,000 | 14,047 |
| Pan Pacific Retail Properties, REIT | 207,000 | 13,741 |
| Regency Centers, REIT | 307,000 | 17,560 |
| Weingarten Realty Investors, REIT | 400,000 | 15,688 |
| | | 111,907 |
| Total Real Estate | | 778,342 |
| Total Common Stocks (Cost $573,085) | | 778,342 |
| SHORT-TERM INVESTMENTS 0.7% | | | |
| | | | |
| Money Market Fund 0.7% | | | |
| T. Rowe Price Reserve Investment Fund, 3.14% #† | 5,718,303 | | 5,718 |
| Total Short-Term Investments (Cost $5,718) | | | 5,718 |
| | | | |
| Total Investments in Securities | | | |
| 99.8% of Net Assets (Cost $578,803) | | $ | 784,060 |
| (1) | Denominated in U.S. dollars unless other- |
| | wise noted |
| # | Seven-day yield |
| † | Affiliated company – See Note 4. |
| REIT | Real Estate Investment Trust |
The accompanying notes are an integral part of these financial statements.
Unaudited
| STATEMENT OF ASSETS AND LIABILITIES |
| (In thousands except shares and per share amounts) | | |
| Assets | | |
| Investments in securities, at value | | |
| Affiliated companies (cost $5,718) | $ | 5,718 |
| Non-affiliated companies (cost $573,085) | | 778,342 |
|
|
| Total investments in securities | | 784,060 |
| Dividends receivable | | 3,616 |
| Receivable for shares sold | | 2,286 |
| Other assets | | 56 |
|
|
| Total assets | | 790,018 |
|
|
| |
| Liabilities | | |
| Investment management fees payable | | 397 |
| Payable for investment securities purchased | | 2,445 |
| Payable for shares redeemed | | 983 |
| Due to affiliates | | 84 |
| Other liabilities | | 388 |
|
|
| Total liabilities | | 4,297 |
|
|
| |
| NET ASSETS | $ | 785,721 |
|
|
| Net Assets Consist of: | | |
| Undistributed net investment income (loss) | $ | (264) |
| Undistributed net realized gain (loss) | | 3,925 |
| Net unrealized gain (loss) | | 205,257 |
| Paid-in-capital applicable to 42,074,704 shares of | | |
| $0.0001 par value capital stock outstanding; | | |
| 1,000,000,000 shares authorized | | 576,803 |
|
|
| |
| NET ASSETS | $ | 785,721 |
|
|
| |
| NET ASSET VALUE PER SHARE | | |
| Investor Class | | |
| ($785,244,800/42,049,172 shares outstanding) | $ | 18.67 |
|
|
| Advisor Class | | |
| ($476,671/25,532 shares outstanding) | $ | 18.67 |
|
|
The accompanying notes are an integral part of these financial statements.
Unaudited
| ($ 000s) | | |
| | | 6 Months |
| | | Ended |
| | | 6/30/05 |
| Investment Income (Loss) | | |
| Dividend income | $ | 14,407 |
|
|
| Expenses | | |
| Investment management | | 2,044 |
| Shareholder servicing - Investor Class | | 664 |
| Custody and accounting | | 71 |
| Prospectus and shareholder reports - Investor Class | | 63 |
| Registration | | 58 |
| Proxy and annual meeting | | 9 |
| Legal and audit | | 8 |
| Directors | | 4 |
| Rule 12b-1 fees - Advisor Class | | 1 |
| Miscellaneous | | 4 |
| Reductions/repayments of fees and expenses | | |
| Investment management fees (waived) repaid | | 66 |
|
|
| Total expenses | | 2,992 |
| Expenses paid indirectly | | (1) |
|
|
| Net expenses | | 2,991 |
|
|
| Net investment income (loss) | | 11,416 |
|
|
| |
| Realized and Unrealized Gain (Loss) | | |
| Net realized gain (loss) on securities | | 4,304 |
| Change in net unrealized gain (loss) on securities | | 33,576 |
|
|
| Net realized and unrealized gain (loss) | | 37,880 |
|
|
| |
| INCREASE (DECREASE) IN NET | | |
| ASSETS FROM OPERATIONS | $ | 49,296 |
|
|
The accompanying notes are an integral part of these financial statements.
Unaudited
| STATEMENT OF CHANGES IN NET ASSETS |
| ($ 000s) | | | | |
| | | 6 Months | | Year |
| | | Ended | | Ended |
| | | 6/30/05 | | 12/31/04 |
| |
| Increase (Decrease) in Net Assets | | | | |
| Operations | | | | |
| Net investment income (loss) | $ | 11,416 | $ | 11,385 |
| Net realized gain (loss) | | 4,304 | | 10,788 |
| Change in net unrealized gain (loss) | | 33,576 | | 119,162 |
|
|
| Increase (decrease) in net assets from operations | | 49,296 | | 141,335 |
|
|
| |
| Distributions to shareholders | | | | |
| Net investment income | | | | |
| Investor Class | | (11,674) | | (13,530) |
| Advisor Class | | (6) | | – |
| Net realized gain | | | | |
| Investor Class | | (2,715) | | (6,207) |
| Advisor Class | | (1) | | – |
|
|
| Decrease in net assets from distributions | | (14,396) | | (19,737) |
|
|
| |
| Capital share transactions * | | | | |
| Shares sold | | | | |
| Investor Class | | 218,495 | | 320,217 |
| Advisor Class | | 202 | | 250 |
| Distributions reinvested | | | | |
| Investor Class | | 12,997 | | 17,650 |
| Advisor Class | | 7 | | – |
| Shares redeemed | | | | |
| Investor Class | | (122,337) | | (109,735) |
| Advisor Class | | (19) | | – |
| Redemption fees received | | 212 | | 218 |
| Increase (decrease) in net assets from | | | | |
| capital share transactions | | 109,557 | | 228,600 |
|
|
| |
| Net Assets | | | | |
| Increase (decrease) during period | | 144,457 | | 350,198 |
| Beginning of period | | 641,264 | | 291,066 |
|
|
| |
| End of period | $ | 785,721 | $ | 641,264 |
|
|
| (Including undistributed net investment income (loss) of | | | | |
| ($264) at 6/30/05 and $0 at 12/31/04) | | | | |
| | | | | |
| *Share information | | | | |
| Shares sold | | | | |
| Investor Class | | 12,635 | | 20,904 |
| Advisor Class | | 12 | | 14 |
| Distributions reinvested | | | | |
| Investor Class | | 756 | | 1,112 |
| Advisor Class | | 1 | | – |
| Shares redeemed | | | | |
| Investor Class | | (7,156) | | (7,528) |
| Advisor Class | | (1) | | – |
|
|
| Increase (decrease) in shares outstanding | | 6,247 | | 14,502 |
The accompanying notes are an integral part of these financial statements.
Unaudited
| NOTES TO FINANCIAL STATEMENTS |
NOTE 1 - SIGNIFICANT ACCOUNTING POLICIES
T. Rowe Price Real Estate Fund, Inc. (the fund) is registered under the Investment Company Act of 1940 (the 1940 Act) as a diversified, open-end management investment company. The fund seeks to provide long-term growth through a combination of capital appreciation and current income. The fund has two classes of shares: the Real Estate Fund original share class, referred to in this report as the Investor Class, offered since October 31, 1997, and Real Estate Fund—Advisor Class (Advisor Class), offered since December 31, 2004. Advisor Class shares are sold only through unaffiliated brokers and other unaffiliated financial intermediaries that are compensated by the class for distribution, shareholder servicing, and/or certain administrative services under a Board-approved Rule 12b-1 plan. Each class has exclusive voting rights on matters related solely to that class, separate voting rights on matters that relate to both classes, and, in all other respects, the same rights and obligations as the other class.
The accompanying financial statements were prepared in accordance with accounting principles generally accepted in the United States of America, which require the use of estimates made by fund management. Fund management believes that estimates and security valuations are appropriate; however actual results may differ from those estimates, and the security valuations reflected in the financial statements may differ from the value the fund receives upon sale of the securities.
Valuation The fund values its investments and computes its net asset value per share at the close of the New York Stock Exchange (NYSE), normally 4 p.m. ET, each day that the NYSE is open for business. Equity securities listed or regularly traded on a securities exchange or in the over-the-counter market are valued at the last quoted sale price or, for certain markets, the official closing price at the time the valuations are made, except for OTC Bulletin Board securities, which are valued at the mean of the latest bid and asked prices. A security that is listed or traded on more than one exchange is valued at the quotation on the exchange determined to be the primary market for such security. Listed securities not traded on a particular day are valued at the mean of the latest bid and asked prices for domestic securities and the last quoted sale price for international securities.
Investments in mutual funds are valued at the mutual fund’s closing net asset value per share on the day of valuation.
Other investments, including restricted securities, and those for which the above valuation procedures are inappropriate or are deemed not to reflect fair value are stated at fair value as determined in good faith by the T. Rowe Price Valuation Committee, established by the fund’s Board of Directors.
Class Accounting The Advisor Class pays distribution, shareholder servicing, and/or certain administrative expenses in the form of Rule 12b-1 fees, in an amount not exceeding 0.25% of the class’s average daily net assets. Shareholder servicing, prospectus, and shareholder report expenses incurred by each class are charged directly to the class to which they relate. Expenses common to both classes, investment income, and realized and unrealized gains and losses are allocated to the classes based upon the relative daily net assets of each class.
Rebates and Credits Subject to best execution, the fund may direct certain security trades to brokers who have agreed to rebate a portion of the related brokerage commission to the fund in cash. Commission rebates are included in realized gain on securities in the accompanying financial statements. Additionally, the fund earns credits on temporarily uninvested cash balances at the custodian that reduce the fund’s custody charges. Custody expense in the accompanying financial statements is presented before reduction for credits, which are reflected as expenses paid indirectly.
Redemption Fees A 1% fee is assessed on redemptions of Investor Class and Advisor Class fund shares held less than 90 days/3 months to deter short-term trading and protect the interests of long-term shareholders. Redemption fees are withheld from proceeds that shareholders receive from the sale or exchange of fund shares. The fees are paid to the fund, and are recorded as an increase to paid-in capital. The fees may cause the redemption price per share to differ from the net asset value per share.
Investment Transactions, Investment Income, and Distributions Income and expenses are recorded on the accrual basis. Dividends received from mutual fund investments are reflected as dividend income; capital gain distributions are reflected as realized gain/loss. Dividend income and capital gain distributions are recorded on the ex-dividend date. Investment transactions are accounted for on the trade date. Realized gains and losses are reported on the identified cost basis. Distributions to shareholders are recorded on the ex-dividend date. Income distributions are declared and paid by each class on a quarterly basis. Capital gain distributions, if any, are declared and paid by the fund, typically on an annual basis.
NOTE 2 - INVESTMENT TRANSACTIONS
Purchases and sales of portfolio securities, other than short-term securities, aggregated $142,813,000 and $33,679,000, respectively, for the six months ended June 30, 2005.
NOTE 3 - FEDERAL INCOME TAXES
No provision for federal income taxes is required since the fund intends to continue to qualify as a regulated investment company under Subchapter M of the Internal Revenue Code and distribute to shareholders all of its taxable income and gains. Federal income tax regulations differ from generally accepted accounting principles; therefore, distributions determined in accordance with tax regulations may differ in amount or character from net investment income and realized gains for financial reporting purposes. Financial reporting records are adjusted for permanent book/tax differences to reflect tax character. Financial records are not adjusted for temporary differences. The amount and character of tax-basis distributions and composition of net assets are finalized at fiscal year-end; accordingly, tax-basis balances have not been determined as of June 30, 2005.
At June 30, 2005, the cost of investments for federal income tax purposes was $578,803,000. Net unrealized gain aggregated $205,257,000 at period-end, all of which related to appreciated investments.
NOTE 4 - RELATED PARTY TRANSACTIONS
The fund is managed by T. Rowe Price Associates, Inc. (the manager or Price Associates), a wholly owned subsidiary of T. Rowe Price Group, Inc. The investment management agreement between the fund and the manager provides for an annual investment management fee, which is computed daily and paid monthly. The fee consists of an individual fund fee, equal to 0.30% of the fund’s average daily net assets, and a group fee. The group fee rate is calculated based on the combined net assets of certain mutual funds sponsored by Price Associates (the group) applied to a graduated fee schedule, with rates ranging from 0.48% for the first $1 billion of assets to 0.29% for assets in excess of $160 billion. Prior to May 1, 2005, the maximum group fee rate in the graduated fee schedule had been 0.295% for assets in excess of $120 billion. The fund’s group fee is determined by applying the group fee rate to the fund’s average daily net assets. At June 30, 2005, the effective annual group fee ra te was 0.31%.
The Investor Class and Advisor Class are also subject to a contractual expense limitation through the limitation dates indicated in the table below. During the limitation period, the manager is required to waive its management fee and reimburse a class for any expenses, excluding interest, taxes, brokerage commissions, and extraordinary expenses, that would otherwise cause the class’s ratio of total expenses to average net assets (expense ratio) to exceed its expense limitation. Each class is required to repay the manager for expenses previously reimbursed and management fees waived to the extent the class’s net assets have grown or expenses have declined sufficiently to allow repayment without causing the class’s expense ratio to exceed its expense limitation. However, no repayment will be made more than three years after the date of any reimbursement or waiver or later than the repayment dates indicated in the table below.
| | Investor Class | Advisor Class |
| Expense Limitation | 0.90% | 1.20% |
| Limitation Date | April 30, 2006 | April 30, 2006 |
| Repayment Date | April 30, 2008 | April 30, 2008 |
Pursuant to this agreement, at June 30, 2005, there were no amounts subject to repayment. For the six months ended June 30, 2005, each class operated below its expense limitation.
In addition, the fund has entered into service agreements with Price Associates and two wholly owned subsidiaries of Price Associates (collectively, Price). Price Associates computes the daily share prices and maintains the financial records of the fund. T. Rowe Price Services, Inc., provides shareholder and administrative services in its capacity as the fund’s transfer and dividend disbursing agent. T. Rowe Price Retirement Plan Services, Inc., provides subaccounting and recordkeeping services for certain retirement accounts invested in the Investor Class. For the six months ended June 30, 2005, expenses incurred pursuant to these service agreements were $36,000 for Price Associates, $363,000 for T. Rowe Price Services, Inc., and $98,000 for T. Rowe Price Retirement Plan Services, Inc. The total amount payable at period end pursuant to these service agreements is reflected as due to affiliates in the accompanying financial statements.
The fund may invest in the T. Rowe Price Reserve Investment Fund and the T. Rowe Price Government Reserve Investment Fund (collectively, the T. Rowe Price Reserve Funds), open-end management investment companies managed by Price Associates and affiliates of the fund. The T. Rowe Price Reserve Funds are offered as cash management options to mutual funds, trusts, and other accounts managed by Price Associates and/or its affiliates, and are not available for direct purchase by members of the public. The T. Rowe Price Reserve Funds pay no investment management fees. During the six months ended June 30, 2005, dividend income from the T. Rowe Price Reserve Funds totaled $111,000, and the value of shares of the T. Rowe Price Reserve Funds held at June 30, 2005 and December 31, 2004 was $5,718,000 and $13,209,000, respectively.
As of June 30, 2005, T. Rowe Price Group, Inc. and/or its wholly owned subsidiaries owned 14,254 shares of the Advisor class, aggregating less than 1% of the fund’s net assets.
| INFORMATION ON PROXY VOTING POLICIES, PROCEDURES, AND RECORDS |
A description of the policies and procedures used by T. Rowe Price funds and portfolios to determine how to vote proxies relating to portfolio securities is available in each fund’s Statement of Additional Information, which you may request by calling 1-800-225-5132 or by accessing the SEC’s Web site, www.sec.gov. The description of our proxy voting policies and procedures is also available on our Web site, www.troweprice.com. To access it, click on the words “Company Info” at the top of our homepage for individual investors. Then, in the window that appears, click on the “Proxy Voting Policy” navigation button in the top left corner.
Each fund’s most recent annual proxy voting record is available on our Web site and through the SEC’s Web site. To access it through our Web site, follow the directions above, then click on the words “Proxy Voting Record” at the bottom of the Proxy Voting Policy page.
| HOW TO OBTAIN QUARTERLY PORTFOLIO HOLDINGS |
The fund files a complete schedule of portfolio holdings with the Securities and Exchange Commission for the first and third quarters of each fiscal year on Form N-Q. The fund’s Form N-Q is available electronically on the SEC’s Web site (www.sec.gov); hard copies may be reviewed and copied at the SEC’s Public Reference Room, 450 Fifth St. N.W., Washington, DC 20549. For more information on the Public Reference Room, call 1-800-SEC-0330.
| APPROVAL OF INVESTMENT MANAGEMENT AGREEMENT |
On March 2, 2005, the fund’s Board of Directors unanimously approved the investment advisory contract (“Contract”) between the fund and its investment manager, T. Rowe Price Associates, Inc. (“Manager”). The Board considered a variety of factors in connection with its review of the Contract, also taking into account information provided by the Manager during the course of the year, as discussed below:
Services Provided by the Manager
The Board considered the nature, quality, and extent of the services provided to the fund by the Manager. These services included, but were not limited to, management of the fund’s portfolio and a variety of activities related to portfolio management. The Board also reviewed the background and experience of the Manager’s senior management team and investment personnel involved in the management of the fund. The Board concluded that it was satisfied with the nature, quality, and extent of the services provided by the Manager.
Investment Performance of the Fund
The Board reviewed the fund’s average annual total return over the 1-, 3-, and 5-year periods, as well as the fund’s year-by-year returns, and compared these returns to previously agreed upon comparable performance measures and market data, including those supplied by Lipper and Morningstar, which are independent providers of mutual fund data. On the basis of this evaluation and the Board’s ongoing review of investment results, the Board concluded that the fund’s performance was satisfactory.
Costs, Benefits, Profits, and Economies of Scale
The Board reviewed detailed information regarding the revenues received by the Manager under the Contract and other benefits that the Manager (and its affiliates) may have realized from its relationship with the fund, including research received under “soft dollar” agreements. The Board also received information on the estimated costs incurred and profits realized by the Manager and its affiliates from advising T. Rowe Price mutual funds, as well as estimates of the gross profits realized from managing the fund in particular. The Board concluded that the Manager’s profits were reasonable in light of the services provided to the fund. The Board also considered whether the fund or other funds benefit under the fee levels set forth in the Contract from any economies of scale realized by the Manager. Under the Contract, the fund pays a fee to the Manager composed of two components—a group fee rate based on the aggregate assets of certain T. Rowe Price mutual funds (including the fund) that declines at certain asset levels, and an individual fund fee rate that is assessed on the assets of the fund. The Board concluded that an additional breakpoint should be added to the group fee component of the fees paid by the fund under the Contract at a level of $160 billion. The Board further concluded that, with this change, the advisory fee structure for the fund continued to provide for a reasonable sharing of benefits from any economies of scale with the fund’s investors.
Fees
The Board reviewed the fund’s management fee rate, operating expenses, and total expense ratio (for the Investor Class and Advisor Class) and compared them to fees and expenses of other comparable funds based on information and data supplied by Lipper. The information provided to the Board indicated that the fund’s management fee rate was at or above the median for certain groups of comparable funds but below the median for other groups of comparable funds. The information also indicated that the fund’s expense ratio (for both classes) was generally below the median for comparable funds. The Board also reviewed the fee schedules for comparable privately managed accounts of the Manager and its affiliates. Management informed the Board that the Manager’s responsibilities for privately managed accounts are more limited than its responsibilities for the fund and other T. Rowe Price mutual funds that it or its affiliates advise. On the basis of the information provided, the Board concluded that the fees paid by the fund under the Contract were reasonable.
Approval of the Contract
As noted, the Board approved the continuation of the Contract as amended to add an additional breakpoint to the group fee rate. No single factor was considered in isolation or to be determinative to the decision. Rather, the Board concluded, in light of a weighting and balancing of all factors considered, that it was in the best interests of the fund to approve the continuation of the Contract, including the fees to be charged for services thereunder.
Item 2. Code of Ethics.A code of ethics, as defined in Item 2 of Form N-CSR, applicable to its principal executive officer, principal financial officer, principal accounting officer or controller, or persons performing similar functions is filed as an exhibit to the registrant’s annual Form N-CSR. No substantive amendments were approved or waivers were granted to this code of ethics during the registrant’s most recent fiscal half-year.
Item 3. Audit Committee Financial Expert.
Disclosure required in registrant’s annual Form N-CSR.
Item 4. Principal Accountant Fees and Services.
Disclosure required in registrant’s annual Form N-CSR.
Item 5. Audit Committee of Listed Registrants.
Not applicable.
Item 6. Schedule of Investments.
Not applicable. The complete schedule of investments is included in Item 1 of this Form N-CSR.
Item 7. Disclosure of Proxy Voting Policies and Procedures for Closed-End Management Investment Companies.
Not applicable.
Item 8. Portfolio Managers of Closed-End Management Investment Companies.
Not applicable.
Item 9. Purchases of Equity Securities by Closed-End Management Investment Company and Affiliated Purchasers.
Not applicable.
Item 10. Submission of Matters to a Vote of Security Holders.
Not applicable.
Item 11. Controls and Procedures.
(a) The registrant’s principal executive officer and principal financial officer have evaluated the registrant’s disclosure controls and procedures within 90 days of this filing and have concluded that the registrant’s disclosure controls and procedures were effective, as of that date, in ensuring that information required to be disclosed by the registrant in this Form N-CSR was recorded, processed, summarized, and reported timely.
(b) The registrant’s principal executive officer and principal financial officer are aware of no change in the registrant’s internal control over financial reporting that occurred during the registrant’s second
fiscal quarter covered by this report that has materially affected, or is reasonably likely to materially affect, the registrant’s internal control over financial reporting.
Item 12. Exhibits.
(a)(1) The registrant’s code of ethics pursuant to Item 2 of Form N-CSR is filed with the registrant’s annual Form N-CSR.
(2) Separate certifications by the registrant's principal executive officer and principal financial officer, pursuant to Section 302 of the Sarbanes-Oxley Act of 2002 and required by Rule 30a-2(a) under the Investment Company Act of 1940, are attached.
(3) Written solicitation to repurchase securities issued by closed-end companies: not applicable.
(b) A certification by the registrant's principal executive officer and principal financial officer, pursuant to Section 906 of the Sarbanes-Oxley Act of 2002 and required by Rule 30a-2(b) under the Investment Company Act of 1940, is attached.
| |
| SIGNATURES |
| |
| | Pursuant to the requirements of the Securities Exchange Act of 1934 and the Investment |
| Company Act of 1940, the registrant has duly caused this report to be signed on its behalf by the |
| undersigned, thereunto duly authorized. |
| |
| T. Rowe Price Real Estate Fund, Inc. |
| |
| By | /s/ James S. Riepe |
| | James S. Riepe |
| | Principal Executive Officer |
| |
| Date | August 18, 2005 |
| |
| |
| | Pursuant to the requirements of the Securities Exchange Act of 1934 and the Investment |
| Company Act of 1940, this report has been signed below by the following persons on behalf of |
| the registrant and in the capacities and on the dates indicated. |
| |
| |
| By | /s/ James S. Riepe |
| | James S. Riepe |
| | Principal Executive Officer |
| |
| Date | August 18, 2005 |
| |
| |
| |
| By | /s/ Joseph A. Carrier |
| | Joseph A. Carrier |
| | Principal Financial Officer |
| |
| Date | August 18, 2005 |