Item 1: Report to Shareholders| Real Estate Fund | December 31, 2007 |
The views and opinions in this report were current as of December 31, 2007. They are not guarantees of performance or investment results and should not be taken as investment advice. Investment decisions reflect a variety of factors, and the managers reserve the right to change their views about individual stocks, sectors, and the markets at any time. As a result, the views expressed should not be relied upon as a forecast of the fund’s future investment intent. The report is certified under the Sarbanes-Oxley Act, which requires mutual funds and other public companies to affirm that, to the best of their knowledge, the information in their financial reports is fairly and accurately stated in all material respects.
REPORTS ON THE WEB
Sign up for our E-mail Program, and you can begin to receive updated fund reports and prospectuses online rather than through the mail. Log in to your account at troweprice.com for more information.
Manager’s Letter
Fellow Shareholders
After outperforming the broader S&P 500 market for seven consecutive years, real estate securities experienced a sharp correction in 2007, generating negative returns. This was the worst absolute and relative performance for our fund in over a decade, and although we remain proud that the fund remains in the top quartile of its peers for 10-year performance, we are nonetheless quite disappointed with the results in 2007.
HIGHLIGHTS
• The real estate sector experienced a sharp pullback in 2007 after outperforming the S&P 500 Index over the previous seven years.
• The fund lagged its benchmarks because of our competitors’ greater international exposure and also because of the recent inclusion of healthcare REITs in the fund’s new benchmark index. Long-term results, however, continue to compare favorably.
• During the period, we harvested profits in several strong securities and redeployed the proceeds into many existing holdings that we believe have good prospects when the economy recovers.
• The recent correction in real estate securities has resulted in higher dividend yields not seen in years, which bode well for shareholders over the long term.

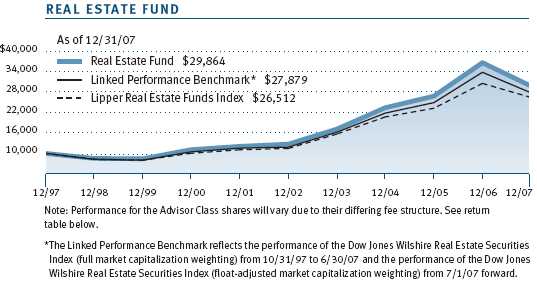
Real estate securities declined during both halves of 2007, but the correction was more pronounced in the latter half of the year. The Real Estate Fund returned -13.57% and -18.80% for the 6- and 12-month periods, respectively, behind its benchmarks as shown in the table. (Performance for the Advisor Class shares reflected their different fee structure.) Despite the setback in 2007, the fund is ranked in the top half of its Lipper peer group over 3-, 5-, and 10-year periods, and it remains a 4-star fund as rated by the widely respected Morningstar, Inc. (The Real Estate Fund received an Overall Morningstar Rating™ of 4 stars for its risk-adjusted performance. This rating is derived from a weighted average of the performance figures associated with a fund’s 3-, 5-, and 10-year (if applicable) Morningstar Rating™ metrics. Morningstar rated this fund among 265, 265, 190, and 79 specialty-real estate funds for the overall rating and the 3-, 5-, and 10-year periods (as applicable) ended December 31, 2007, respectively. Lipper ranked the Real Estate Fund 253 out of 309, 106 out of 226, 61 out of 158, and 11 out of 64 real estate funds for the 1-, 3-, 5, and 10-year periods ended December 31, 2007, respectively. Results will vary for other periods. Past performance cannot guarantee future results.)
IMPORTANT INFORMATION ABOUT MORNINGSTAR RATINGS
For funds with at least a 3-year history, a Morningstar Rating™ is based on a risk-adjusted return measure (including the effects of sales charges, loads, and redemption fees) with emphasis on downward variations and consistent performance. The top 10% of funds in each category receive 5 stars, the next 22.5% 4 stars, the next 35% 3 stars, the next 22.5% 2 stars, and the bottom 10% 1 star. Each share class is counted as a fraction of one fund within this scale and rated separately. Morningstar Rating™ is for the retail share class only; other classes may have different performance characteristics. The fund received 3, 3, and 4 stars for the 3-, 5-, and 10-year periods, respectively.
©2008 Morningstar, Inc. All Rights Reserved. The information contained herein: (1) is proprietary to Morningstar and/or its content providers; (2) may not be copied or distributed; and (3) is not warranted to be accurate, complete, or timely. Neither Morningstar nor its content providers are responsible for any damages or losses arising from any use of this information.
Regarding the fund’s negative absolute performance, the contraction in price/earnings multiples that we warned shareholders about as a potential risk did, unfortunately, materialize in 2007. In other words, while earnings for our companies actually grew in 2007, the stock prices declined in the face of this earnings growth.
Second, relating to the fund’s relative underperformance, we can identify two key factors: the continued grouping of international funds in our active Lipper peer group and the noteworthy addition of healthcare real estate investment trusts (REITs) into our fund’s passive benchmark during 2007. We’ll have more commentary on these specific issues in the market overview portion of this letter.
We would also like to point out that the fund’s original benchmark, the Dow Jones Wilshire Real Estate Securities Index, was decommissioned as of July 1, 2007. We have replaced it with the Linked Performance Benchmark, whose characteristics are explained in the footnote accompanying the performance table. The Linked Performance Benchmark is very similar to the old benchmark and still administered by Wilshire Associates.
DIVIDEND DISTRIBUTION
On December 17, 2007, your fund’s Board of Directors declared a fourth-quarter income dividend of $0.24 per share, and a long-term capital gain distribution of $0.50 per share. They were paid on December 19 to shareholders of record on December 17, 2007. For the Advisor Class, the income dividend was $0.22 and the long-term capital gain distribution was also $0.50. Remember to use your Form 1099-DIV, not your year-end statement or this report, for tax filing purposes. As reported on the 1099-DIV, a portion of the fund’s income distribution was reclassified as a long-term capital gain.
MARKET ENVIRONMENT AND STRATEGY
The impact of the housing crisis widened, sparking fears of a U.S. recession. A dangerous liquidity crunch proliferated, and access to capital was greatly curtailed. The liquidity crunch began to spread worldwide, and central banks worked in concert to ease the illiquidity, with significant monetary injections. At this point, however, the markets are still tight, and it remains to be seen if we have experienced the worst of the credit crunch and subprime write-downs.
Against this backdrop, commercial real estate values began to decline, despite continued growth in property rents. In effect, buyers began paying less for the rental streams from buildings. Some sellers even had trouble finding potential buyers, as many of them faced difficulty in obtaining affordable financing from banks for acquisitions. Indeed, even commercial real estate owners with loans already in place found it harder to renegotiate new financing when existing loans reached maturity.
The subprime crisis, with roots primarily in the U.S., began to take a toll on our economy and our financial systems. The problem, combined with the growing national budget deficit, served to undermine the value of our currency, which in turn contributed to the weak relative performance of U.S. securities versus their international counterparts. Our fund remains primarily focused on North American securities and, hence, found itself fighting to make headway against these currency devaluation headwinds.
In August 2007, Wilshire Associates, the organization that governs the passive Wilshire benchmark, announced that for the first time since the benchmark’s creation in 1978, healthcare REITs would be included as constituents. We don’t alter our investment philosophy to match the profile of our passive benchmark, so investors should understand the impact a change like this can have on fund performance relative to this benchmark.
While we have been impressed with many of the management teams involved with healthcare REITs, we have nonetheless historically avoided the subsector due to structural issues that we find unattractive. Healthcare REITs can own a variety of buildings, some more or less fundamentally appealing than others. The property types may include hospitals, medical office buildings, skilled nursing facilities, assisted living facilities, independent living facilities, and similar structures. By their nature, they tend to have high industry concentration, which entails certain risks, including immense pressure to maintain low costs, often at the expense of profitability. This is a situation we don’t expect to improve during an election year.
Many of the healthcare buildings are for special use and, therefore, less adaptable in the event of tenant vacancy. The assets tend to have very long leases, and the operations—hospitals, for example—are usually externally operated away from the control of the REITs. Overall, we feel they possess characteristics more like bonds than equities, while we seek equity-like returns in our fund. Importantly, we are generally not enamored with the location of these assets; we wouldn’t expect to find them at the heart of a prime retail or financial district, for example.
So what do healthcare REITs have going for them? Their bond-like characteristics tend to make them defensive, which can be appealing during an economic slowdown. Healthcare demand is fairly steady and less cyclical than the overall economy. In that sense, with the slowing U.S. economy, healthcare REITs were incorporated into the benchmark at an opportune time. However, when the economy shows signs of recovering, we would expect healthcare REITs to lag other property types—the ones we seek for the portfolio. Therefore, we see no point in changing the long-term investment philosophy that has served shareholders well.
Regarding the property fundamentals that should drive the long-term value of our assets, we remain satisfied with the relatively low levels of new construction. The liquidity crunch is likely to help keep construction levels in check. We are more concerned about the demand side of the equation, especially with the possibility of a recession looming on the horizon. That said, the Federal Reserve has already begun to ease short-term rates, and some critics argue that the central bank has not been sufficiently aggressive on this front. We expect the Fed to continue its policy of easing, which should begin to aid the economy and also make the cash distributions from our REITs more attractive. Indeed, the Fed lowered the fed funds rate three-quarters of a percentage point on January 22, 2008, in the face of a sharp market sell-off in global equities.
PORTFOLIO REVIEW
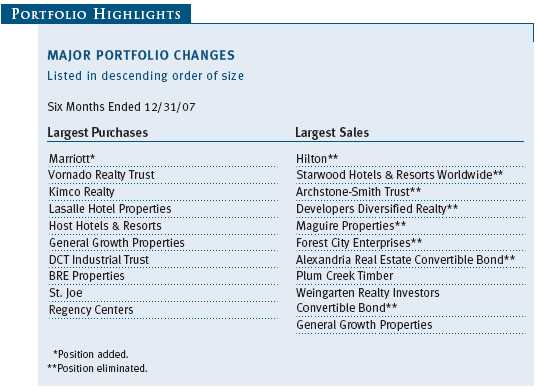
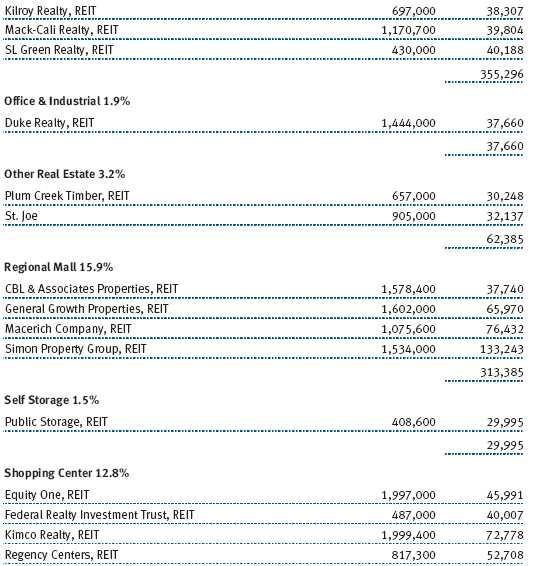
We eliminated Hilton from the portfolio, as this company was taken private by the Blackstone Group for a significant all-cash premium. Separately, we eliminated our position in Starwood Hotels & Resorts Worldwide since the firm is going through yet another CEO change in a very short period. Portions of these proceeds were redeployed into Marriott, reflecting our great respect for the Marriott brand, management team, and cash flow generation. (Please refer to our portfolio of investments for a complete listing of holdings and the amount each represents in the portfolio.)
We also eliminated Maguire Properties during the period, despite wide media speculation that Maguire was a potential acquisition target. Maguire, unfortunately, operates in an area of the country that is under greater pressure due to its exposure to subprime lending institutions and, therefore, presents some specific fundamental demand concerns.
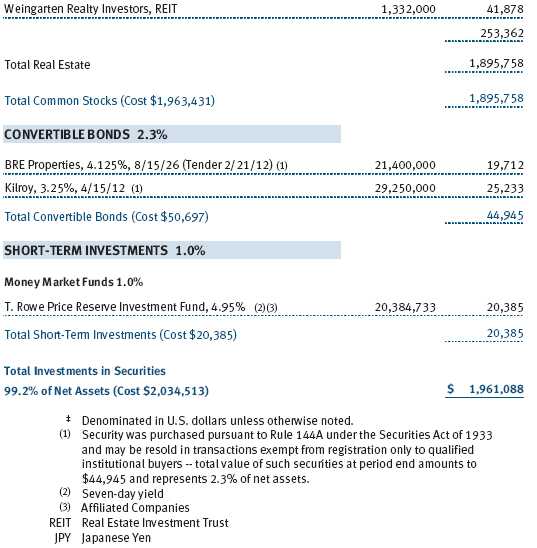
As the real estate securities market corrected, the convertible securities we had purchased held up better than the underlying common stocks. After enjoying a performance advantage afforded by the convertibles, we harvested some proceeds and redeployed them into common stocks that were trading at more attractive levels. Convertibles that were eliminated during the period were Alexandria Real Estate and Weingarten Realty Investors, and it is worth noting that we still own the common stocks of these firms.
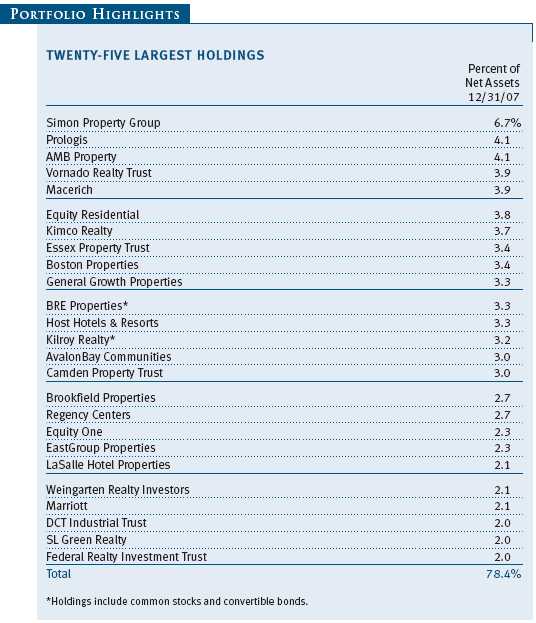
We also harvested profits from other positions that had performed relatively well and reinvested in other holdings already held in the portfolio. The Major Portfolio Changes table in this letter reveals that nine of the 10 largest purchases for the fund were in existing names, including long-time holdings Vornado Realty Trust, Kimco Realty, LaSalle Hotel Properties, and Host Hotels & Resorts.
OUTLOOK
As we have stated before, we are encouraged by the low levels of new supply coming into the market via construction in commercial real estate. Our primary concerns, beyond the price/earnings multiple compression discussed earlier, relate to demand in the event of a prolonged economic slowdown or recession. We are pleased to see the Fed lowering short-term interest rates in an effort to bolster the economy, but it may be many months before the benefits of the easing take hold. With the economy still slowing, many industries, including real estate, could face demand pressures. Nevertheless, we are optimistic about the contractual nature of the lease streams at our companies, and feel that REITs are in a good position to weather short-term dislocations in the economy.
Longer-term disruptions would be of greater concern, but REITs clearly wouldn’t be alone in this predicament. We believe that the dampened supply positions REITs to benefit from an eventual economic recovery. Following the recent correction, we are beginning to find dividend yields returning to attractive levels not seen in several years. If the dividend distribution levels can be maintained, we will be looking forward to the prospect of being paid handsomely as we await an upturn in the economy. We still believe that real estate securities offer rewarding diversification potential for long-term investors.
As always, we thank you for your continued support and confidence.
Respectfully submitted,

David M. Lee
President of the fund and chairman of its Investment Advisory Committee
January 25, 2008
The committee chairman has day-to-day responsibility for managing the portfolio and works with committee members in developing and executing the fund’s investment program.
RISKS OF INVESTING
The fund’s share price can fall because of weakness in the stock market, a particular industry, or specific holdings. Stock markets can decline for many reasons, including adverse political or economic developments, changes in investor psychology, or heavy institutional selling. The prospects for an industry or company may deteriorate because of a variety of factors, including disappointing earnings or changes in the competitive environment. In addition, the investment manager’s assessment of companies held in a fund may prove incorrect, resulting in losses or poor performance even in rising markets.
Funds that invest only in specific industries will experience greater volatility than funds investing in a broad range of industries. Due to its concentration in the real estate industry, the fund’s share price could be more volatile than that of a fund with a broader investment mandate. Trends perceived to be unfavorable to real estate, such as changes in the tax laws or rising interest rates, could cause a decline in share prices.
GLOSSARY
Beta: A measure of the market risk of a portfolio showing how responsive the fund is to a given market index. By definition, the beta of the benchmark index is 1.00. A fund with a 1.10 beta is expected to perform 10% better than the index in up markets and 10% worse in down markets. Usually, higher betas represent riskier investments.
Capitalization rate: A ratio, shown as a percentage rate, that estimates the present value of an income-producing asset. Riskier investments have higher capitalization rates and lower present values.
Lipper indexes: Fund benchmarks that consist of a small number of the largest mutual funds in a particular category as tracked by Lipper Inc.
MSCI REIT Index: A total return index composed of the most actively traded real estate investment trusts, designed to be a measure of real estate equity performance.
Price/earnings ratio (or multiple): A valuation measure calculated by dividing the price of a stock by its current or projected earnings per share. This ratio gives investors an idea of how much they are paying for current or future earnings power.
Real estate investment trusts (REITs): Publicly traded companies that own, develop, and operate apartment complexes, hotels, office buildings, and other commercial properties.
Performance and Expenses
This chart shows the value of a hypothetical $10,000 investment in the fund over the past 10 fiscal year periods or since inception (for funds lacking 10-year records). The result is compared with benchmarks, which may include a broad-based market index and a peer group average or index. Market indexes do not include expenses, which are deducted from fund returns as well as mutual fund averages and indexes.
| AVERAGE ANNUAL COMPOUND TOTAL RETURN |
This table shows how the fund would have performed each year if its actual (or cumulative) returns had been earned at a constant rate.
As a mutual fund shareholder, you may incur two types of costs: (1) transaction costs, such as redemption fees or sales loads, and (2) ongoing costs, including management fees, distribution and service (12b-1) fees, and other fund expenses. The following example is intended to help you understand your ongoing costs (in dollars) of investing in the fund and to compare these costs with the ongoing costs of investing in other mutual funds. The example is based on an investment of $1,000 invested at the beginning of the most recent six-month period and held for the entire period.
Please note that the fund has two share classes: The original share class (“investor class”) charges no distribution and service (12b-1) fee. Advisor Class shares are offered only through unaffiliated brokers and other financial intermediaries and charge a 0.25% 12b-1 fee. Each share class is presented separately in the table.
Actual Expenses
The first line of the following table (“Actual”) provides information about actual account values and expenses based on the fund’s actual returns. You may use the information in this line, together with your account balance, to estimate the expenses that you paid over the period. Simply divide your account value by $1,000 (for example, an $8,600 account value divided by $1,000 = 8.6), then multiply the result by the number in the first line under the heading “Expenses Paid During Period” to estimate the expenses you paid on your account during this period.
Hypothetical Example for Comparison Purposes
The information on the second line of the table (“Hypothetical”) is based on hypothetical account values and expenses derived from the fund’s actual expense ratio and an assumed 5% per year rate of return before expenses (not the fund’s actual return). You may compare the ongoing costs of investing in the fund with other funds by contrasting this 5% hypothetical example and the 5% hypothetical examples that appear in the shareholder reports of the other funds. The hypothetical account values and expenses may not be used to estimate the actual ending account balance or expenses you paid for the period.
Note: T. Rowe Price charges an annual small-account maintenance fee of $10, generally for accounts with less than $2,000 ($500 for UGMA/UTMA). The fee is waived for any investor whose T. Rowe Price mutual fund accounts total $25,000 or more, accounts employing automatic investing, and IRAs and other retirement plan accounts that utilize a prototype plan sponsored by T. Rowe Price (although a separate custodial or administrative fee may apply to such accounts). This fee is not included in the accompanying table. If you are subject to the fee, keep it in mind when you are estimating the ongoing expenses of investing in the fund and when comparing the expenses of this fund with other funds.
You should also be aware that the expenses shown in the table highlight only your ongoing costs and do not reflect any transaction costs, such as redemption fees or sales loads. Therefore, the second line of the table is useful in comparing ongoing costs only and will not help you determine the relative total costs of owning different funds. To the extent a fund charges transaction costs, however, the total cost of owning that fund is higher.

The accompanying notes are an integral part of these financial statements.
The accompanying notes are an integral part of these financial statements.


The accompanying notes are an integral part of these financial statements.
The accompanying notes are an integral part of these financial statements.
The accompanying notes are an integral part of these financial statements.

The accompanying notes are an integral part of these financial statements.
| NOTES TO FINANCIAL STATEMENTS |
NOTE 1 - SIGNIFICANT ACCOUNTING POLICIES
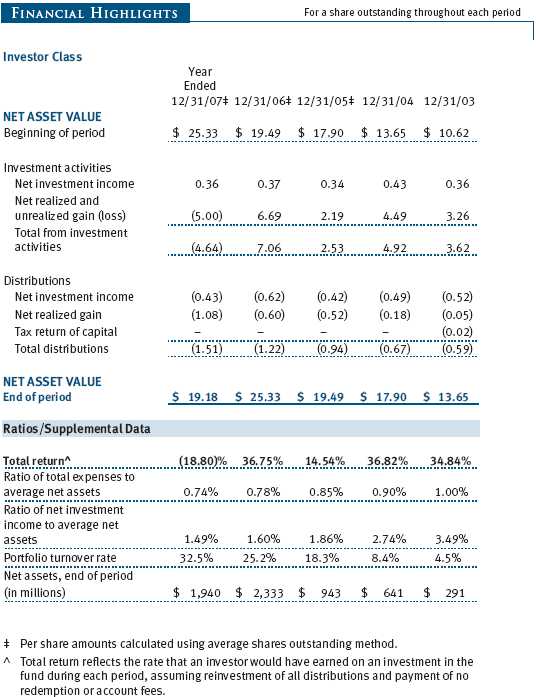
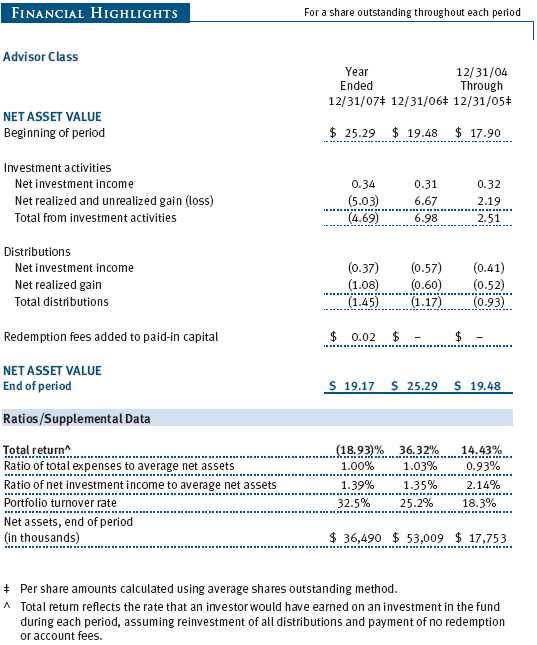
T. Rowe Price Real Estate Fund, Inc. (the fund), is registered under the Investment Company Act of 1940 (the 1940 Act) as a diversified, open-end management investment company. The fund seeks to provide long-term growth through a combination of capital appreciation and current income. The fund has two classes of shares: the Real Estate Fund original share class, referred to in this report as the Investor Class, offered since October 31, 1997, and Real Estate Fund—Advisor Class (Advisor Class), offered since December 31, 2004. Advisor Class shares are sold only through unaffiliated brokers and other unaffiliated financial intermediaries that are compensated by the class for distribution, shareholder servicing, and/or certain administrative services under a Board-approved Rule 12b-1 plan. Each class has exclusive voting rights on matters related solely to that class, separate voting rights on matters that relate to both classes, and, in all other respects, the same rights and obligations as the other class.
The accompanying financial statements were prepared in accordance with accounting principles generally accepted in the United States of America, which require the use of estimates made by fund management. Fund management believes that estimates and security valuations are appropriate; however, actual results may differ from those estimates, and the security valuations reflected in the financial statements may differ from the value the fund ultimately realizes upon sale of the securities.
Valuation The fund values its investments and computes its net asset value per share at the close of the New York Stock Exchange (NYSE), normally 4 p.m. ET, each day that the NYSE is open for business. Equity securities listed or regularly traded on a securities exchange or in the over-the-counter (OTC) market are valued at the last quoted sale price or, for certain markets, the official closing price at the time the valuations are made, except for OTC Bulletin Board securities, which are valued at the mean of the latest bid and asked prices. A security that is listed or traded on more than one exchange is valued at the quotation on the exchange determined to be the primary market for such security. Listed securities not traded on a particular day are valued at the mean of the latest bid and asked prices for domestic securities and the last quoted sale price for international securities.
Debt securities are generally traded in the over-the-counter market. Securities with original maturities of one year or more are valued at prices furnished by dealers who make markets in such securities or by an independent pricing service, which considers yield or price of bonds of comparable quality, coupon, maturity, and type, as well as prices quoted by dealers who make markets in such securities. Securities with original maturities of less than one year are valued at amortized cost in local currency, which approximates fair value when combined with accrued interest.
Investments in mutual funds are valued at the mutual fund’s closing net asset value per share on the day of valuation.
Other investments, including restricted securities, and those for which the above valuation procedures are inappropriate or are deemed not to reflect fair value are stated at fair value as determined in good faith by the T. Rowe Price Valuation Committee, established by the fund’s Board of Directors.
Most foreign markets close before the close of trading on the NYSE. If the fund determines that developments between the close of a foreign market and the close of the NYSE will, in its judgment, materially affect the value of some or all of its portfolio securities, which in turn will affect the fund’s share price, the fund will adjust the previous closing prices to reflect the fair value of the securities as of the close of the NYSE, as determined in good faith by the T. Rowe Price Valuation Committee, established by the fund’s Board of Directors. A fund may also fair value securities in other situations, such as when a particular foreign market is closed but the fund is open. In deciding whether to make fair value adjustments, the fund reviews a variety of factors, including developments in foreign markets, the performance of U.S. securities markets, and the performance of instruments trading in U.S. markets that represent foreign securities and baskets of foreign securities. The fund uses outside pricing services to provide it with closing market prices and information used for adjusting those prices. The fund cannot predict when and how often it will use closing prices and when it will adjust those prices to reflect fair value. As a means of evaluating its fair value process, the fund routinely compares closing market prices, the next day’s opening prices in the same markets, and adjusted prices.
Currency Translation Assets, including investments, and liabilities denominated in foreign currencies are translated into U.S. dollar values each day at the prevailing exchange rate, using the mean of the bid and asked prices of such currencies against U.S. dollars as quoted by a major bank. Purchases and sales of securities, income, and expenses are translated into U.S. dollars at the prevailing exchange rate on the date of the transaction. The effect of changes in foreign currency exchange rates on realized and unrealized security gains and losses is reflected as a component of security gains and losses.
Class Accounting The Advisor Class pays distribution, shareholder servicing, and/or certain administrative expenses in the form of Rule 12b-1 fees, in an amount not exceeding 0.25% of the class’s average daily net assets. Shareholder servicing, prospectus, and shareholder report expenses incurred by each class are charged directly to the class to which they relate. Expenses common to both classes, investment income, and realized and unrealized gains and losses are allocated to the classes based upon the relative daily net assets of each class.
Rebates and Credits Subject to best execution, the fund may direct certain security trades to brokers who have agreed to rebate a portion of the related brokerage commission to the fund in cash. Commission rebates are reflected as realized gain on securities in the accompanying financial statements and totaled $42,000 for the year ended December 31, 2007. Additionally, the fund earns credits on temporarily uninvested cash balances at the custodian that reduce the fund’s custody charges. Custody expense in the accompanying financial statements is presented before reduction for credits, which are reflected as expenses paid indirectly.
Redemption Fees A 1% fee is assessed on redemptions of fund shares held for 90 days or less to deter short-term trading and to protect the interests of long-term shareholders. Redemption fees are withheld from proceeds that shareholders receive from the sale or exchange of fund shares. The fees are paid to the fund, and are recorded as an increase to paid-in capital. The fees may cause the redemption price per share to differ from the net asset value per share.
Investment Transactions, Investment Income, and Distributions Income and expenses are recorded on the accrual basis. Premiums and discounts on debt securities are amortized for financial reporting purposes. Dividends received from mutual fund investments are reflected as dividend income; capital gain distributions are reflected as realized gain/loss. Dividend income and capital gain distributions are recorded on the ex-dividend date. Income tax-related interest and penalties, if incurred, would be recorded as income tax expense. Investment transactions are accounted for on the trade date. Realized gains and losses are reported on the identified cost basis. Distributions to shareholders are recorded on the ex-dividend date. Income distributions are declared and paid by each class on a quarterly basis. Capital gain distributions, if any, are declared and paid by the fund, typically on an annual basis.
New Accounting Pronouncements Effective June 29, 2007, the fund adopted Financial Accounting Standards Board (FASB) Interpretation No. 48 (FIN 48), Accounting for Uncertainty in Income Taxes, a clarification of FASB Statement No. 109, Accounting for Income Taxes. FIN 48 establishes financial accounting and disclosure requirements for recognition and measurement of tax positions taken or expected to be taken on an income tax return. The adoption of FIN 48 had no impact on the fund’s net assets or results of operations.
In September 2006, the FASB released the Statement of Financial Accounting Standard No. 157 (FAS 157), Fair Value Measurements. FAS 157 clarifies the definition of fair value and establishes the framework for measuring fair value, as well as proper disclosure of this methodology in the financial statements. It will be effective for the fund’s fiscal year beginning January 1, 2008. Management is evaluating the effects of FAS 157; however, it is not expected to have a material impact on the fund’s net assets or results of operations.
NOTE 2 - INVESTMENT TRANSACTIONS
Consistent with its investment objective, the fund engages in the following practices to manage exposure to certain risks or to enhance performance. The investment objective, policies, program, and risk factors of the fund are described more fully in the fund’s prospectus and Statement of Additional Information.
Restricted Securities The fund may invest in securities that are subject to legal or contractual restrictions on resale. Prompt sale of such securities at an acceptable price may be difficult due to substantial delays and additional costs related to their restrictions.
Securities Lending The fund lends its securities to approved brokers to earn additional income. It receives as collateral cash and U.S. government securities valued at 102% to 105% of the value of the securities on loan. Cash collateral is invested in a money market pooled trust managed by the fund’s lending agent in accordance with investment guidelines approved by fund management. Collateral is maintained over the life of the loan in an amount not less than the value of loaned securities, as determined at the close of fund business each day; any additional collateral required due to changes in security values is delivered to the fund the next business day. Although risk is mitigated by the collateral, the fund could experience a delay in recovering its securities and a possible loss of income or value if the borrower fails to return the securities. Securities lending revenue recognized by the fund consists of earnings on invested collateral and borrowing fees, net of any rebates to the borrower and compensation to the lending agent. At December 31, 2007, there were no securities on loan.
Other Purchases and sales of portfolio securities, other than short-term securities, aggregated $1,008,000 and $794,986,000, respectively, for the year ended December 31, 2007.
NOTE 3 - FEDERAL INCOME TAXES
No provision for federal income taxes is required since the fund intends to continue to qualify as a regulated investment company under Subchapter M of the Internal Revenue Code and distribute to shareholders all of its taxable income and gains. Federal income tax regulations differ from generally accepted accounting principles; therefore, distributions determined in accordance with tax regulations may differ significantly in amount or character from net investment income and realized gains for financial reporting purposes. Financial reporting records are adjusted for permanent book/tax differences to reflect tax character. Financial records are not adjusted for temporary differences.
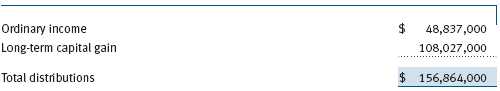
Distributions during the year ended December 31, 2007, were characterized as follows for tax purposes:
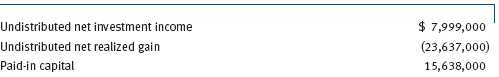
At December 31, 2007, the tax-basis components of distributable earnings were as follows:
Pursuant to federal income tax regulations applicable to investment companies, the fund has elected to treat net capital losses realized between November 1 and December 31 of each year as occurring on the first day of the following tax year. Consequently, $3,105,000 of realized losses reflected in the accompanying financial statements will not be recognized for tax purposes until 2008.
For federal income tax purposes, certain REIT dividends declared in December and paid in January are treated as if received in the succeeding tax year. Consequently, $5,028,000 of dividend income reflected in the accompanying financial statements will not be recognized for tax purposes until 2008.
For the year ended December 31, 2007, the fund recorded the following permanent reclassifications to reflect tax character. Reclassifications to paid-in capital relate primarily to a tax practice that treats a portion of the proceeds from each redemption of capital shares as a distribution of taxable net investment income and/or realized capital gain. Reclassifications between income and gain relate primarily to the character of dividends received from REIT investments. Results of operations and net assets were not affected by these reclassifications.
NOTE 4 - RELATED PARTY TRANSACTIONS
The fund is managed by T. Rowe Price Associates, Inc. (the manager or Price Associates), a wholly owned subsidiary of T. Rowe Price Group, Inc. The investment management agreement between the fund and the manager provides for an annual investment management fee, which is computed daily and paid monthly. The fee consists of an individual fund fee, equal to 0.30% of the fund’s average daily net assets, and a group fee. The group fee rate is calculated based on the combined net assets of certain mutual funds sponsored by Price Associates (the group) applied to a graduated fee schedule, with rates ranging from 0.48% for the first $1 billion of assets to 0.285% for assets in excess of $220 billion. The fund’s group fee is determined by applying the group fee rate to the fund’s average daily net assets. At December 31, 2007, the effective annual group fee rate was 0.30%.
The Advisor Class is also subject to a contractual expense limitation through April 30, 2007. During the limitation period, the manager is required to waive its management fee and reimburse a class for any expenses, excluding interest, taxes, brokerage commissions, and extraordinary expenses, that would otherwise cause the class’s ratio of total expenses to average net assets (expense ratio) to exceed its expense limitation of 1.20% . The class is required to repay the manager for expenses previously reimbursed and management fees waived to the extent the class’s net assets have grown or expenses have declined sufficiently to allow repayment without causing the class’s expense ratio to exceed its expense limitation. However, no repayment will be made more than three years after the date of any reimbursement or waiver or later than April 30, 2009. Pursuant to this agreement, at December 31, 2007, there were no amounts subject to repayment. For the year ended December 31, 20 07, the Advisor Class operated below its expense limitation.
In addition, the fund has entered into service agreements with Price Associates and two wholly owned subsidiaries of Price Associates (collectively, Price). Price Associates computes the daily share prices and provides certain other administrative services to the fund. T. Rowe Price Services, Inc., provides shareholder and administrative services in its capacity as the fund’s transfer and dividend disbursing agent. T. Rowe Price Retirement Plan Services, Inc., provides subaccounting and recordkeeping services for certain retirement accounts invested in the Investor Class. For the year ended December 31, 2007, expenses incurred pursuant to these service agreements were $111,000 for Price Associates, $1,349,000 for T. Rowe Price Services, Inc., and $398,000 for T. Rowe Price Retirement Plan Services, Inc. The total amount payable at period-end pursuant to these service agreements is reflected as Due to Affiliates in the accompanying financial st atements.
The fund may invest in the T. Rowe Price Reserve Investment Fund and the T. Rowe Price Government Reserve Investment Fund (collectively, the T. Rowe Price Reserve Investment Funds), open-end management investment companies managed by Price Associates and affiliates of the fund. The T. Rowe Price Reserve Investment Funds are offered as cash management options to mutual funds, trusts, and other accounts managed by Price Associates and/or its affiliates, and are not available for direct purchase by members of the public. The T. Rowe Price Reserve Investment Funds pay no investment management fees.
NOTE 5 - INTERFUND BORROWING PROGRAM
Pursuant to its prospectus, the fund may borrow up to 33 1 / 3% of its total assets. The manager has developed a program that provides temporary liquidity under an interfund borrowing agreement between the fund and other T. Rowe Price-sponsored mutual funds and permits the borrowing and lending of cash at rates beneficial to both the borrowing and lending funds. Pursuant to program guidelines, loans totaling 10% or more of a borrowing fund’s total assets are collateralized at 102% of the value of the loan; loans of less than 10% are unsecured. During the year ended December 31, 2007, the fund incurred $9,000 in interest expense related to outstanding borrowings on 3 days, in the average amount of $20,100,000, and at an average annual rate of 5.43% . At December 31, 2007, there were no borrowings outstanding.
| REPORT OF INDEPENDENT REGISTERED PUBLIC ACCOUNTING FIRM |
To the Board of Directors and Shareholders of T. Rowe Price Real Estate Fund, Inc.
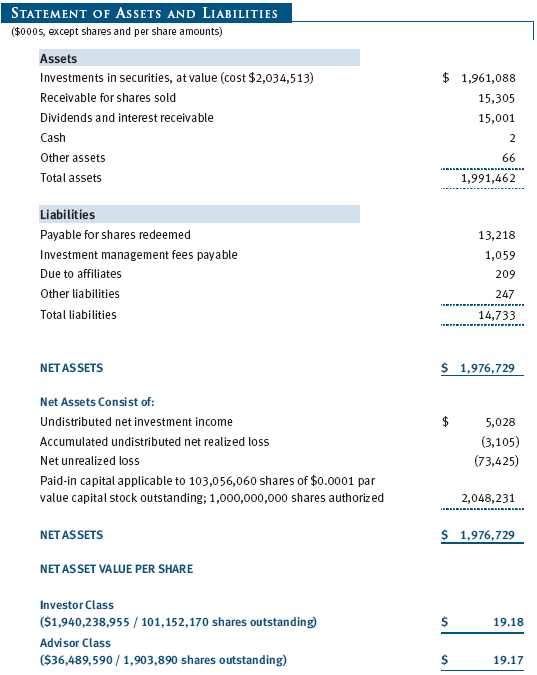
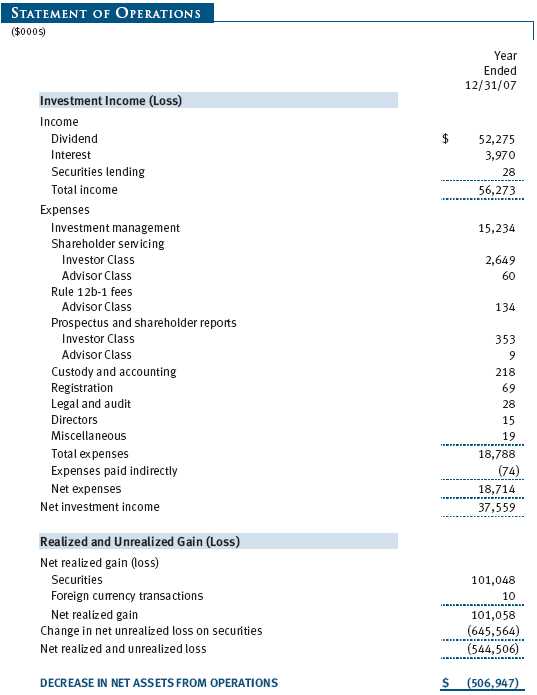
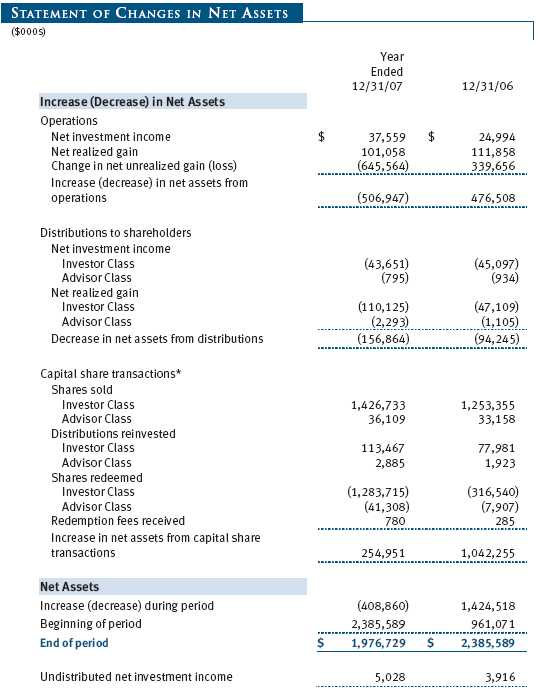
In our opinion, the accompanying statement of assets and liabilities, including the portfolio of investments, and the related statements of operations and of changes in net assets and the financial highlights present fairly, in all material respects, the financial position of T. Rowe Price Real Estate Fund, Inc. (the “Fund”) at December 31, 2007, the results of its operations for the year then ended, the changes in its net assets for each of the two years in the period then ended and the financial highlights for each of the periods presented, in conformity with accounting principles generally accepted in the United States of America. These financial statements and financial highlights (hereafter referred to as “financial statements”) are the responsibility of the Fund’s management; our responsibility is to express an opinion on these financial statements based on our audits. We conducted our audits of these financial statements in accordance with the auditing standards of the Public Company Accounting Oversight Board (United States). Those standards require that we plan and perform the audit to obtain reasonable assurance about whether the financial statements are free of material misstatement. An audit includes examining, on a test basis, evidence supporting the amounts and disclosures in the financial statements, assessing the accounting principles used and significant estimates made by management, and evaluating the overall financial statement presentation. We believe that our audits, which included confirmation of securities at December 31, 2007, by correspondence with the custodian and by agreement to the underlying ownership records for T. Rowe Price Reserve Investment Fund, provide a reasonable basis for our opinion.
PricewaterhouseCoopers LLP
Baltimore, Maryland
February 12, 2008
| TAX INFORMATION (UNAUDITED) FOR THE TAX YEAR ENDED 12/31/07 |
We are providing this information as required by the Internal Revenue Code. The amounts shown may differ from those elsewhere in this report because of differences between tax and financial reporting requirements.
The fund’s distributions to shareholders included:
• $12,389,000 from short-term capital gains,
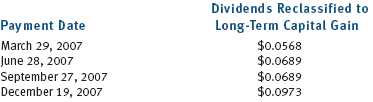
• $123,666,000 from long-term capital gains, of which $118,492,000 was subject to the 15% rate gains category, and $5,174,000 to the 25% rate gains category. As shown in the table below, $30,385,000 of the long-term capital gain distributions were originally characterized as dividends and have been reclassified as long-term capital gain distributions to reflect the character of distributions from investments in REITs.
For taxable non-corporate shareholders, $1,786,000 of the fund’s income represents qualified dividend income subject to the 15% rate category.
For corporate shareholders, $704,000 of the fund’s income qualifies for the dividends-received deduction.
| INFORMATION ON PROXY VOTING POLICIES, PROCEDURES, AND RECORDS |
A description of the policies and procedures used by T. Rowe Price funds and portfolios to determine how to vote proxies relating to portfolio securities is available in each fund’s Statement of Additional Information, which you may request by calling 1-800-225-5132 or by accessing the SEC’s Web site, www.sec.gov. The description of our proxy voting policies and procedures is also available on our Web site, www.troweprice.com. To access it, click on the words “Company Info” at the top of our homepage for individual investors. Then, in the window that appears, click on the “Proxy Voting Policy” navigation button in the top left corner.
Each fund’s most recent annual proxy voting record is available on our Web site and through the SEC’s Web site. To access it through our Web site, follow the directions above, then click on the words “Proxy Voting Record” at the bottom of the Proxy Voting Policy page.
| HOW TO OBTAIN QUARTERLY PORTFOLIO HOLDINGS |
The fund files a complete schedule of portfolio holdings with the Securities and Exchange Commission for the first and third quarters of each fiscal year on Form N-Q. The fund’s Form N-Q is available electronically on the SEC’s Web site (www.sec.gov); hard copies may be reviewed and copied at the SEC’s Public Reference Room, 450 Fifth St. N.W., Washington, DC 20549. For more information on the Public Reference Room, call 1-800-SEC-0330.
| ABOUT THE FUND’S DIRECTORS AND OFFICERS |
Your fund is governed by a Board of Directors (Board) that meets regularly to review a wide variety of matters affecting the fund, including performance, investment programs, compliance matters, advisory fees and expenses, service providers, and other business affairs. The Board elects the fund’s officers, who are listed in the final table. At least 75% of Board members are independent of T. Rowe Price Associates, Inc. (T. Rowe Price), and T. Rowe Price International, Inc. (T. Rowe Price International); “inside” or “interested” directors are employees or officers of T. Rowe Price. The business address of each director and officer is 100 East Pratt Street, Baltimore, Maryland 21202. The Statement of Additional Information includes additional information about the directors and is available without charge by calling a T. Rowe Price representative at 1-800-225-5132.
| Independent Directors | |
| |
| Name | |
| (Year of Birth) | Principal Occupation(s) During Past 5 Years and Directorships of |
| Year Elected* | Other Public Companies |
| |
| Jeremiah E. Casey | Director, National Life Insurance (2001 to 2005); Director, The Rouse |
| (1940) | Company, real estate developers (1990 to 2004); Director, Allfirst |
| 2005 | Financial Inc. (previously First Maryland Bancorp) (1983 to 2002) |
| |
| Anthony W. Deering | Chairman, Exeter Capital, LLC, a private investment firm (2004 to pres- |
| (1945) | ent); Director, Vornado Real Estate Investment Trust (3/04 to present); |
| 2001 | Member, Advisory Board, Deutsche Bank North America (2004 to pres- |
| | ent); Director, Chairman of the Board, and Chief Executive Officer, The |
| | Rouse Company, real estate developers (1997 to 2004) |
| |
| Donald W. Dick, Jr. | Principal, EuroCapital Advisors, LLC, an acquisition and management |
| (1943) | advisory firm; Chairman, The Haven Group, a custom manufacturer of |
| 1997 | modular homes (1/04 to present) |
| |
| David K. Fagin | Chairman and President, Nye Corporation (6/88 to present); Chairman, |
| (1938) | Canyon Resources Corp. (8/07 to present); Director, Golden Star |
| 1997 | Resources Ltd. (5/92 to present); Director, Pacific Rim Mining Corp. |
| | (2/02 to present) |
| |
| Karen N. Horn | Director, Federal National Mortgage Association (9/06 to present); |
| (1943) | Managing Director and President, Global Private Client Services, Marsh |
| 2003 | Inc. (1999 to 2003); Director, Georgia Pacific (5/04 to 12/05), Eli Lilly |
| | and Company, and Simon Property Group |
| |
| Theo C. Rodgers | President, A&R Development Corporation (1977 to present) |
| (1941) | |
| 2005 | |
| John G. Schreiber | Owner/President, Centaur Capital Partners, Inc., a real estate invest- |
| (1946) | ment company; Partner, Blackstone Real Estate Advisors, L.P. |
| 2001 | |
| |
| *Each independent director oversees 121 T. Rowe Price portfolios and serves until retirement, resignation, or |
| election of a successor. | |
| Inside Directors | |
| |
| Name | |
| (Year of Birth) | |
| Year Elected* | |
| [Number of T. Rowe Price | Principal Occupation(s) During Past 5 Years and Directorships of |
| Portfolios Overseen] | Other Public Companies |
| |
| Edward C. Bernard | Director and Vice President, T. Rowe Price; Vice Chairman of the Board, |
| (1956) | Director, and Vice President, T. Rowe Price Group, Inc.; Chairman of the |
| 2006 | Board, Director, and President, T. Rowe Price Investment Services, |
| [121] | Inc.; Chairman of the Board and Director, T. Rowe Price Global Asset |
| | Management Limited, T. Rowe Price Global Investment Services |
| | Limited, T. Rowe Price Retirement Plan Services, Inc., T. Rowe Price |
| | Savings Bank, and T. Rowe Price Services, Inc.; Director, T. Rowe Price |
| | International, Inc.; Chief Executive Officer, Chairman of the Board, |
| | Director, and President, T. Rowe Price Trust Company; Chairman of the |
| | Board, all funds |
| |
| Brian C. Rogers, CFA, CIC | Chief Investment Officer, Director, and Vice President, T. Rowe Price; |
| (1955) | Chairman of the Board, Chief Investment Officer, Director, and Vice |
| 2006 | President, T. Rowe Price Group, Inc.; Vice President, T. Rowe Price�� |
| [68] | Trust Company |
| |
| *Each inside director serves until retirement, resignation, or election of a successor. |
| Officers | |
| |
| Name (Year of Birth) | |
| Title and Fund(s) Served | Principal Occupation(s) |
| |
| Joseph A. Carrier, CPA (1960) | Vice President, T. Rowe Price, T. Rowe Price |
| Treasurer, Real Estate Fund | Group, Inc., T. Rowe Price Investment Services, |
| | Inc., and T. Rowe Price Trust Company |
| |
| Richard M. Clattenburg, CFA (1979) | Employee, T. Rowe Price; formerly Financial |
| Vice President, Real Estate Fund | Analyst, Goldman Sachs (to 2005) |
| |
| Anna M. Dopkin, CFA (1967) | Vice President, T. Rowe Price, T. Rowe Price |
| Vice President, Real Estate Fund | Group, Inc., and T. Rowe Price Trust Company |
| |
| Joseph B. Fath, CPA (1971) | Vice President, T. Rowe Price and T. Rowe Price |
| Vice President, Real Estate Fund | Group, Inc. |
| |
| Roger L. Fiery III, CPA (1959) | Vice President, T. Rowe Price, T. Rowe Price |
| Vice President, Real Estate Fund | Group, Inc., T. Rowe Price International, Inc., |
| | and T. Rowe Price Trust Company |
| |
| John R. Gilner (1961) | Chief Compliance Officer and Vice President, |
| Chief Compliance Officer, Real Estate Fund | T. Rowe Price; Vice President, T. Rowe Price |
| | Group, Inc., and T. Rowe Price Investment |
| | Services, Inc. |
| |
| Gregory S. Golczewski (1966) | Vice President, T. Rowe Price and T. Rowe Price |
| Vice President, Real Estate Fund | Trust Company |
| |
| Henry H. Hopkins (1942) | Director and Vice President, T. Rowe Price |
| Vice President, Real Estate Fund | Investment Services, Inc., T. Rowe Price Services, |
| | Inc., and T. Rowe Price Trust Company; Vice |
| | President, T. Rowe Price, T. Rowe Price Group, |
| | Inc., T. Rowe Price International, Inc., and |
| | T. Rowe Price Retirement Plan Services, Inc. |
| |
| Thomas J. Huber, CFA (1966) | Vice President, T. Rowe Price, T. Rowe Price |
| Vice President, Real Estate Fund | Group, Inc., and T. Rowe Price Trust Company |
| |
| David M. Lee, CFA (1962) | Vice President, T. Rowe Price and T. Rowe Price |
| President, Real Estate Fund | Group, Inc. |
| |
| Patricia B. Lippert (1953) | Assistant Vice President, T. Rowe Price and |
| Secretary, Real Estate Fund | T. Rowe Price Investment Services, Inc. |
| |
| Philip A. Nestico (1976) | Vice President, T. Rowe Price and T. Rowe Price |
| Vice President, Real Estate Fund | Group, Inc. |
| Charles M. Ober, CFA (1950) | Vice President, T. Rowe Price and T. Rowe Price |
| Vice President, Real Estate Fund | Group, Inc. |
| |
| Theodore E. Robson, CFA (1965) | Vice President, T. Rowe Price and T. Rowe Price |
| Vice President, Real Estate Fund | Group, Inc. |
| |
| Julie L. Waples (1970) | Vice President, T. Rowe Price |
| Vice President, Real Estate Fund | |
| |
| Unless otherwise noted, officers have been employees of T. Rowe Price or T. Rowe Price International for at least |
| five years. | |
Item 2. Code of Ethics.
The registrant has adopted a code of ethics, as defined in Item 2 of Form N-CSR, applicable to its principal executive officer, principal financial officer, principal accounting officer or controller, or persons performing similar functions. A copy of this code of ethics is filed as an exhibit to this Form N-CSR. No substantive amendments were approved or waivers were granted to this code of ethics during the period covered by this report.
Item 3. Audit Committee Financial Expert.
The registrant’s Board of Directors/Trustees has determined that Ms. Karen N. Horn qualifies as an audit committee financial expert, as defined in Item 3 of Form N-CSR. Ms. Horn is considered independent for purposes of Item 3 of Form N-CSR.
Item 4. Principal Accountant Fees and Services.
(a) – (d) Aggregate fees billed to the registrant for the last two fiscal years for professional services rendered by the registrant’s principal accountant were as follows:
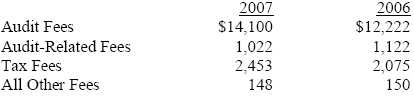
Audit fees include amounts related to the audit of the registrant’s annual financial statements and services normally provided by the accountant in connection with statutory and regulatory filings. Audit-related fees include amounts reasonably related to the performance of the audit of the registrant’s financial statements and specifically include the issuance of a report on internal controls and, if applicable, agreed-upon procedures related to fund acquisitions. Tax fees include amounts related to services for tax compliance, tax planning, and tax advice. The nature of these services specifically includes the review of distribution calculations and the preparation of Federal, state, and excise tax returns. All other fees include the registrant’s pro-rata share of amounts for agreed-upon procedures in conjunction with service contract approvals by the registrant’s Board of Directors/Trustees.
(e)(1) The registrant’s audit committee has adopted a policy whereby audit and non-audit services performed by the registrant’s principal accountant for the registrant, its investment adviser, and any entity controlling, controlled by, or under common control with the investment adviser that provides ongoing services to the registrant require pre-approval in advance at regularly scheduled audit committee meetings. If such a service is required between regularly scheduled audit committee meetings, pre-approval may be authorized by one audit committee member with ratification at the next scheduled audit committee meeting. Waiver of pre-approval for audit or non-audit services requiring fees of a de minimis amount is not permitted.
(2) No services included in (b) – (d) above were approved pursuant to paragraph (c)(7)(i)(C) of Rule 2-01 of Regulation S-X.
(f) Less than 50 percent of the hours expended on the principal accountant’s engagement to audit the registrant’s financial statements for the most recent fiscal year were attributed to work performed by persons other than the principal accountant’s full-time, permanent employees.
(g) The aggregate fees billed for the most recent fiscal year and the preceding fiscal year by the registrant’s principal accountant for non-audit services rendered to the registrant, its investment adviser, and any entity controlling, controlled by, or under common control with the investment adviser that provides ongoing services to the registrant were $1,486,000 and $1,401,000, respectively, and were less than the aggregate fees billed for those same periods by the registrant’s principal accountant for audit services rendered to the T. Rowe Price Funds.
(h) All non-audit services rendered in (g) above were pre-approved by the registrant’s audit committee. Accordingly, these services were considered by the registrant’s audit committee in maintaining the principal accountant’s independence.
Item 5. Audit Committee of Listed Registrants.
Not applicable.
Item 6. Schedule of Investments.
Not applicable. The complete schedule of investments is included in Item 1 of this Form N-CSR.
Item 7. Disclosure of Proxy Voting Policies and Procedures for Closed-End Management Investment Companies.
Not applicable.
Item 8. Portfolio Managers of Closed-End Management Investment Companies.
Not applicable.
Item 9. Purchases of Equity Securities by Closed-End Management Investment Company and Affiliated Purchasers.
Not applicable.
Item 10. Submission of Matters to a Vote of Security Holders.
Not applicable.
Item 11. Controls and Procedures.
(a) The registrant’s principal executive officer and principal financial officer have evaluated the registrant’s disclosure controls and procedures within 90 days of this filing and have concluded that the registrant’s disclosure controls and procedures were effective, as of that date, in ensuring that information required to be disclosed by the registrant in this Form N-CSR was recorded, processed, summarized, and reported timely.
(b) The registrant’s principal executive officer and principal financial officer are aware of no change in the registrant’s internal control over financial reporting that occurred during the registrant’s second fiscal quarter covered by this report that has materially affected, or is reasonably likely to materially affect, the registrant’s internal control over financial reporting.
Item 12. Exhibits.
(a)(1) The registrant’s code of ethics pursuant to Item 2 of Form N-CSR is attached.
(2) Separate certifications by the registrant's principal executive officer and principal financial officer, pursuant to Section 302 of the Sarbanes-Oxley Act of 2002 and required by Rule 30a-2(a) under the Investment Company Act of 1940, are attached.
(3) Written solicitation to repurchase securities issued by closed-end companies: not applicable.
(b) A certification by the registrant's principal executive officer and principal financial officer, pursuant to Section 906 of the Sarbanes-Oxley Act of 2002 and required by Rule 30a-2(b) under the Investment Company Act of 1940, is attached.
| | |
SIGNATURES |
| |
| | Pursuant to the requirements of the Securities Exchange Act of 1934 and the Investment |
| Company Act of 1940, the registrant has duly caused this report to be signed on its behalf by the |
| undersigned, thereunto duly authorized. |
| |
| T. Rowe Price Real Estate Fund, Inc. |
| |
| |
| By | /s/ Edward C. Bernard |
| | Edward C. Bernard |
| | Principal Executive Officer |
| |
| Date | February 19, 2008 |
| |
| |
| |
| | Pursuant to the requirements of the Securities Exchange Act of 1934 and the Investment |
| Company Act of 1940, this report has been signed below by the following persons on behalf of |
| the registrant and in the capacities and on the dates indicated. |
| |
| |
| By | /s/ Edward C. Bernard |
| | Edward C. Bernard |
| | Principal Executive Officer |
| |
| Date | February 19, 2008 |
| |
| |
| |
| By | /s/ Joseph A. Carrier |
| | Joseph A. Carrier |
| | Principal Financial Officer |
| |
| Date | February 19, 2008 |