| UNITED STATES |
| SECURITIES AND EXCHANGE COMMISSION |
| Washington, D.C. 20549 |
| |
FORM N-CSR |
| |
CERTIFIED SHAREHOLDER REPORT OF REGISTERED |
MANAGEMENT INVESTMENT COMPANIES |
| |
| |
| |
| Investment Company Act File Number: 811-08371 |
|
| |
| T. Rowe Price Real Estate Fund, Inc. |
|
| (Exact name of registrant as specified in charter) |
| |
| 100 East Pratt Street, Baltimore, MD 21202 |
|
| (Address of principal executive offices) |
| |
| David Oestreicher |
| 100 East Pratt Street, Baltimore, MD 21202 |
|
| (Name and address of agent for service) |
| |
| |
| Registrant’s telephone number, including area code: (410) 345-2000 |
| |
| |
| Date of fiscal year end: December 31 |
| |
| |
| Date of reporting period: December 31, 2008 |
Item 1: Report to Shareholders| Real Estate Fund | December 31, 2008 |
The views and opinions in this report were current as of December 31, 2008. They are not guarantees of performance or investment results and should not be taken as investment advice. Investment decisions reflect a variety of factors, and the managers reserve the right to change their views about individual stocks, sectors, and the markets at any time. As a result, the views expressed should not be relied upon as a forecast of the fund’s future investment intent. The report is certified under the Sarbanes-Oxley Act, which requires mutual funds and other public companies to affirm that, to the best of their knowledge, the information in their financial reports is fairly and accurately stated in all material respects.
REPORTS ON THE WEB
Sign up for our E-mail Program, and you can begin to receive updated fund reports and prospectuses online rather than through the mail. Log in to your account at troweprice.com for more information.
Manager’s Letter
Fellow Shareholders
The year 2008 was devastating for equity investors. It will go down in history as the third-worst year for stocks in more than a century. One has to go back to 1907 and 1931 to find calendar years that inflicted greater damage on stocks making up the Dow Jones Industrial Average (DJIA). Both the Dow Jones Industrial Average and the S&P 500 Index ended the year below their levels of 10 years ago. Unfortunately, real estate securities were not immune to the broad carnage and also suffered substantial losses.

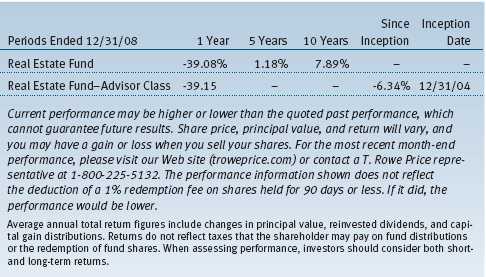
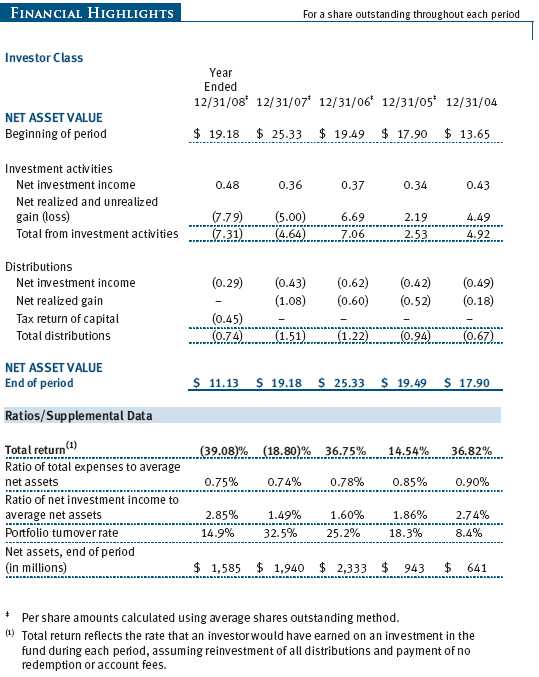
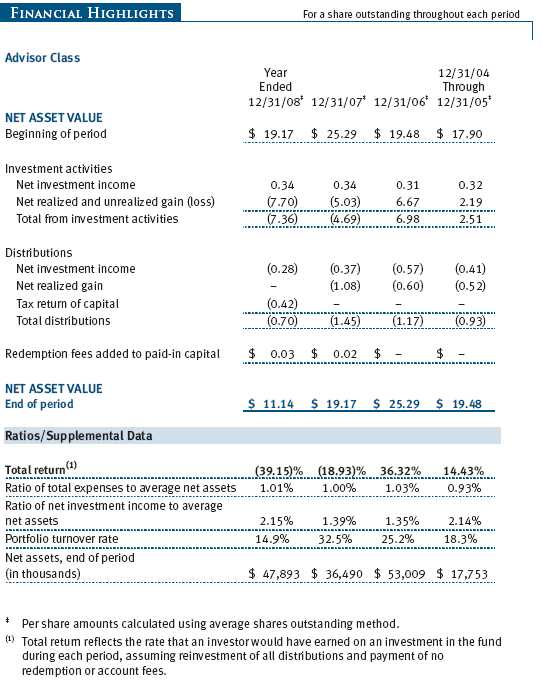
We are disappointed to report that the fund returned -36.55% during the past six months and -39.08% for all of 2008, compared with marginally greater declines in both periods for its major benchmarks, the Dow Jones Wilshire Real Estate Securities Index and the Lipper Real Estate Funds Index. (The returns for the Advisor Class shares were slightly different, reflecting its separate fee structure.) The yearly losses occurred largely during the second half. It is worth observing that, while the DJIA and S&P 500 closed 2008 below the levels they had reached a decade ago, real estate stocks have generated attractive total returns during that time (see the Growth of $10,000 chart following this letter for 10-year performance figures).
HIGHLIGHTS
• Both the Dow Jones Industrial Average and the S&P 500 Index ended the year below their levels of 10 years ago, and real estate securities also suffered substantial losses.
• Most of the fund’s losses occurred during the second half of the year. Returns for the fund’s major benchmarks were marginally lower.
• We invested in convertible securities, which offered attractive total return prospects, in an effort to mitigate losses in a hostile environment for stocks. The fund remains well diversified across multiple property types.
• Important areas of the credit markets have begun to improve, which could drive an eventual recovery in equities. The correction in REIT stocks has resulted in share prices that we have not seen in many years.
The credit crisis persisted with highly destructive effects, and the economic slowdown deepened during the year with mounting job losses. We have noted previously that the contractual nature of commercial real estate leases can serve to buffer short-term slowdowns, and indeed it appeared that the sector was working well in this regard over the first six months of the year. However, rising job losses and financing concerns eventually weighed heavily on the group, resulting in distressing stock price declines in the second half of the year. We would like to point out that these declines seem to reflect more the souring outlook on the sector than the actual earnings results being reported, which were still reasonably sound in many respects. The overall concerns about the broad market and the broader economy were evident in a -11.91% first-half return for the S&P 500 Index, while the Dow Jones Wilshire Real Estate Securities Index and the Lipper Real Estate Funds Index were down 3.41% and 2.56%, respectively. (Please note that in the June 30, 2008, semiannual report, the return for the Lipper benchmark was erroneously reported as -1.74% instead of -2.56%.)
DIVIDEND DISTRIBUTION
On December 10, 2008, your fund’s Board of Directors declared a fourth-quarter income dividend of $0.18 per share ($0.17 per share for the Advisor Class), payable to shareholders of record on December 12. The dividends have been reclassified for 1099 purposes, meaning that their tax character is different from that shown on the statement when it was paid. Remember to use Form 1099-DIV, not your year-end statement, when you file your taxes. The tax character refers to whether the dividend is from taxable or tax-exempt income, short- or long-term gain, or return of capital.
MARKET ENVIRONMENT AND STRATEGY
As the economic and liquidity crises intensified, the Fed and Treasury Department implemented increasingly aggressive actions to reverse the unfolding vicious cycle. While we welcome and commend these efforts, it is not yet clear that they will be enough to end the downward spiral.
There has been criticism of the overall government bailout in some quarters, but the failure to intervene in the case of Lehman Brothers has rippled throughout the credit markets in a way that might have been avoided had the government taken action to avert the company’s bankruptcy. Turning back to real estate, we believe there were two primary concerns weighing on investors’ minds: weakening demand fundamentals and debt-refinancing risks.
We have written before about the fundamentals of real estate in terms of supply and demand. We continue to believe that the supply side of the equation remains favorable (low new construction), but there can be no denying that demand has softened with this faltering economy. The job losses in 2008 were stunning. While an estimated 1.1 million jobs were created in 2007, as many as 2.5 million jobs were lost in 2008. Job losses were reported in every month of 2008, and they accelerated as the year progressed. Since the physical absorption of property space is often correlated with job growth, the loss of so many jobs translated into softening demand for our companies’ properties.
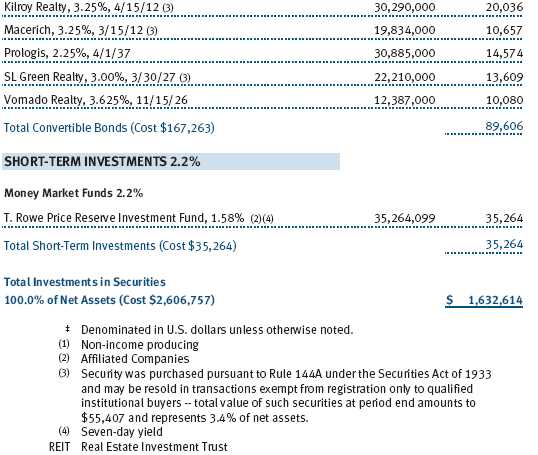
Like many others, we were surprised by the magnitude of the economic downturn, but we did take actions to help mitigate risks in this environment. For example, we invested in convertible real estate investment trust (REIT) securities, which offered attractive total return prospects compared with historical norms. They are more senior than common stock in the capital structure and thus offer an added level of security. We also sold several holdings in 2008 that we felt had specific balance sheet risks, and we feel more comfortable without them in our portfolio.
Regarding debt-refinancing risks, most public and private commercial real estate companies traditionally have employed some level of debt. Many observers view the public REIT sector as currently underleveraged versus their private market peers. We have long felt that the REIT sector on average was using acceptable levels of leverage. Unfortunately, the credit markets ground to a virtual halt in an extraordinary fashion, resulting in a borrowing environment that is either exorbitantly expensive or nonexistent. Unlike the residential market, the commercial market does not normally utilize 30-year, self-amortizing mortgages. Thus, even with a prudently staggered ladder of maturities, real estate companies typically have some amount of debt maturing in any given year. If the debt markets are “closed,” their maturities are a problem. What is particularly frustrating is that REITs have the ability by and large to service the interest on their debt but simply have not been able to find a lender in this frozen credit market.
The credit markets will thaw at some point. Each day that passes without resolution, however, has brought increasing pressure on REITs and the real estate market in general.
PORTFOLIO REVIEW
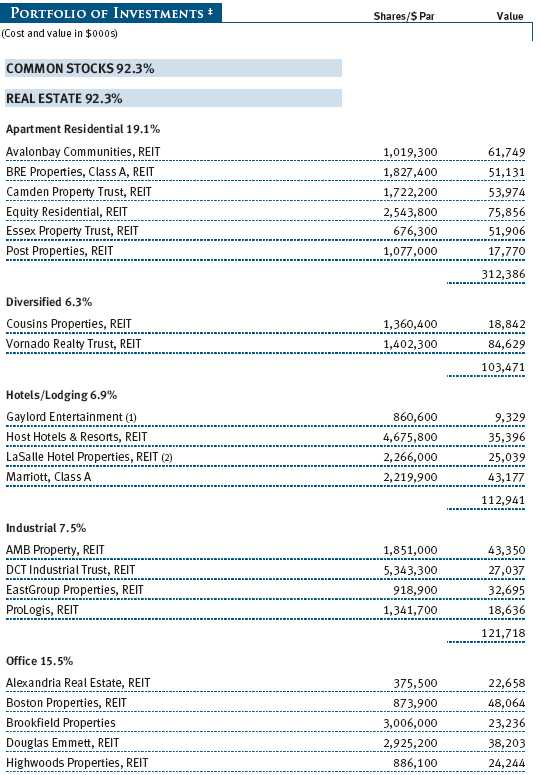
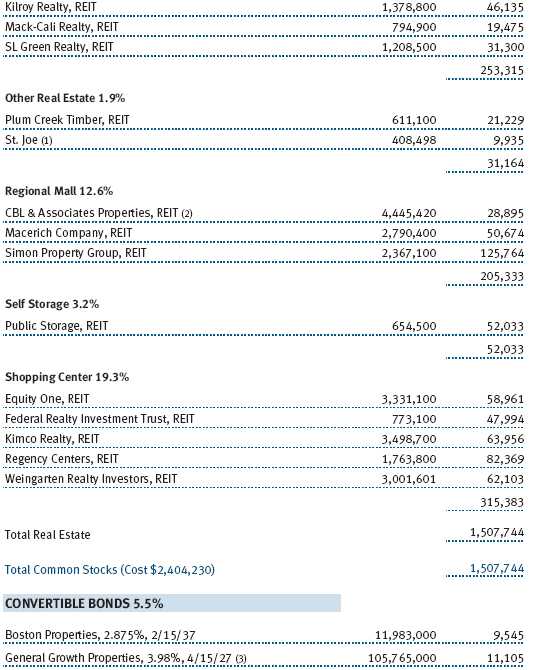
Investors may notice that the shopping center category now represents the largest property weighting in the fund. When combined with the regional mall area, it is apparent that we have substantial exposure to retail in general. While we acknowledge that there is pressure in the retail sector, we also see reasons for optimism with our holdings. First, these pressures are well known, and retail REITs have been severely punished due to the negative press surrounding them. Second, roughly two-thirds of gross domestic product (GDP) is driven by the consumer, and we are hard-pressed to envision an economic recovery that does not involve some form of recovery in consumer demand. Third, shopping centers could prove to be reasonably resilient during a downturn due to the substantial number of grocery- and drugstore-anchored centers that drive necessity-based shopping trips. This would include centers such as those owned by Regency Centers and Equity One. More than 80% of Regency Centers’ shopping centers have a grocery anchor. (Please refer to our portfolio of investments for a complete listing of holdings and the amount each represents in the portfolio.)
Regarding regional malls, we believe retailers must keep stores open in their most productive locations to generate necessary sales, including many of those owned by our regional mall REITs. Our largest REIT holding, Simon Property Group, controls a nationwide portfolio of malls that averaged sales approaching $500 per square foot last year. Simon’s U.S. malls hosted more than 2.8 billion shopper visits and generated retail sales in excess of $60 billion.
Unfortunately, in this unprecedented global liquidity crisis, possessing quality properties alone is not sufficient to protect stocks when the balance sheet becomes an issue. This is the case with General Growth Properties, which owns some of the most coveted malls in the U.S. yet finds its very survival in question due to an inability to refinance pending debt maturities. As these maturities approached without resolution, we sold our common stock at what has proven to be favorable prices. Some of the proceeds, however, were invested in the company’s debt, which, while senior to the equity, has still suffered dramatically. At the time, we felt reasonably confident that the several billion dollars’ worth of equity subordinated to our securities positioned them to be repaid in full. As we write this letter, the ultimate outcome is still unknown. Debt positions are at risk but could also offer substantial rewards with a favorable resolution. On a positive note, we are pleased with the new CEO, who has been given the responsibility to spearhead turnaround efforts at the firm.
Balance sheet concerns led us to eliminate some holdings throughout the year. During the past six months, we divested our longstanding shares of Duke Realty because of these concerns. Conversely, several of our larger purchases were companies that possess stronger balance sheets within their peer group. They included Host Hotels & Resorts and Kimco Realty. Companies with stronger balance sheets are not only better positioned to survive the credit crisis but will also be able to take advantage of opportunities when this crisis is over. Indeed, Kimco Realty has long been viewed as one of the most opportunistic real estate organizations in the REIT sector.
The apartment sector remains a large component of the portfolio. Although job losses will create challenges for apartment landlords, there are factors working to their benefit. First, there may be increased demand for rental apartments as a byproduct of the drop in home sales. Second, many apartment owners continue to have access to low-cost debt as a result of lending by Fannie Mae and Freddie Mac, both of which were placed under government conservatorship. Several of our apartment REITs are tapping into this important financing source, including a recent transaction announced by our largest apartment holding, Equity Residential.
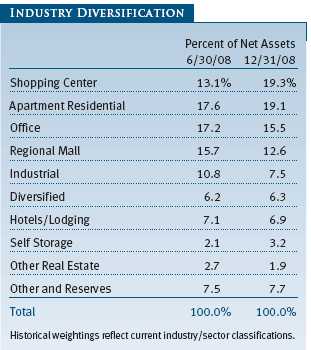
Our valuation discipline also led us to trim some shares in companies that are leaders in their subsectors, but whose relative valuations also reflected that leadership. They included opportunistic sales of shares in EastGroup Properties, Boston Properties, and Essex Property Trust. Despite the sales, these companies remain large investments in our portfolio. The fund remains well diversified across multiple property types, as can be seen in the Industry Diversification table.
OUTLOOK
Until signs of a sustainable economic recovery are evident, we expect consumer and corporate confidence to remain low. This situation is likely to lead to continued demand pressures upon our investment companies’ properties. The market, however, tends to be forward-looking, and uncertainty exists as to what extent the slowdown has already been priced into the stocks. We expect stocks to rebound before it is evident that we are in a sustained recovery.
We note that until the credit markets loosen meaningfully, we would also expect many REITs to look for ways to shore up their liquidity, including considering reductions in cash dividends. Recently, the IRS issued a temporary ruling that greatly eases the ability of REITs to pay a substantial portion of their declared dividends in stock instead of cash. Uncommon times, it seems, call for uncommon measures. While we have always been fans of the income component of REITs’ total returns, we nonetheless comprehend the unusual actions being considered in this market environment.
Important areas of the credit markets have already shown improvement (for example, significant narrowing of the so-called “TED spread,” which measures the difference between Treasuries and Libor rates, a benchmark for short-term taxable rates), which could pave the way for a recovery in equities. We also note that the correction in REIT stocks has resulted in share prices that we have not seen in many years.
We are now waiting for the government’s recent actions to gain traction and produce an economic recovery. Experience has shown us, however, that the initial phases of an economic recovery may be characterized as a “jobless recovery,” with GDP growth aided by productivity gains. This state of affairs could delay the recovery in property demand. Yet it is also true that recoveries are often recognized after they are already under way. Thus, we are immersed in a period of continuing uncertainty—which investors dislike, leading them to punish the equity market. Investors also dislike volatility, which was rampant particularly in the fourth quarter of last year, leading investors to flee equities for the safety of risk-free Treasuries.
Fortunately, President Obama has identified the creation of jobs as one of his top priorities. He and Congress will be weighing several major stimulus initiatives in the coming weeks. We are optimistic that these efforts will eventually be successful. When a job recovery gets under way, we believe that a long recovery in real estate fundamentals will also ensue, given the scarcity of new supply in the market. The government’s stimulus programs could also trigger a new round of inflation, once again attracting investors to the sector as a traditional hedge against rising prices.
We would like to thank you for your continued support and confidence during these troubling times.
Respectfully submitted,

David M. Lee
President of the fund and chairman of its Investment Advisory Committee
January 23, 2009
The committee chairman has day-to-day responsibility for managing the portfolio and works with committee members in developing and executing the fund’s investment program.
Risks of Investing
The fund’s share price can fall because of weakness in the stock market, a particular industry, or specific holdings. Stock markets can decline for many reasons, including adverse political or economic developments, changes in investor psychology, or heavy institutional selling. The prospects for an industry or company may deteriorate because of a variety of factors, including disappointing earnings or changes in the competitive environment. In addition, the investment manager’s assessment of companies held in a fund may prove incorrect, resulting in losses or poor performance even in rising markets.
Funds that invest only in specific industries will experience greater volatility than funds investing in a broad range of industries. Due to its concentration in the real estate industry, the fund’s share price could be more volatile than that of a fund with a broader investment mandate. Trends perceived to be unfavorable to real estate, such as changes in the tax laws or rising interest rates, could cause a decline in share prices.
Glossary
Dow Jones Wilshire Real Estate Securities Index: A market capitalization-weighted index composed of publicly traded real estate investment trusts and real estate operating companies.
Libor rate: The London Interbank Offered Rate, which is a benchmark for short-term taxable rates.
Lipper indexes: Fund benchmarks that consist of a small number of the largest mutual funds in a particular category as tracked by Lipper Inc.
Price/earnings ratio (or multiple): A valuation measure calculated by dividing the price of a stock by its current or projected earnings per share. This ratio gives investors an idea of how much they are paying for current or future earnings power.
Real estate investment trusts (REITs): Publicly traded companies that own, develop, and operate apartment complexes, hotels, office buildings, and other commercial properties.


Performance and Expenses
This chart shows the value of a hypothetical $10,000 investment in the fund over the past 10 fiscal year periods or since inception (for funds lacking 10-year records). The result is compared with benchmarks, which may include a broad-based market index and a peer group average or index. Market indexes do not include expenses, which are deducted from fund returns as well as mutual fund averages and indexes.

| AVERAGE ANNUAL COMPOUND TOTAL RETURN |
This table shows how the fund would have performed each year if its actual (or cumulative) returns had been earned at a constant rate.
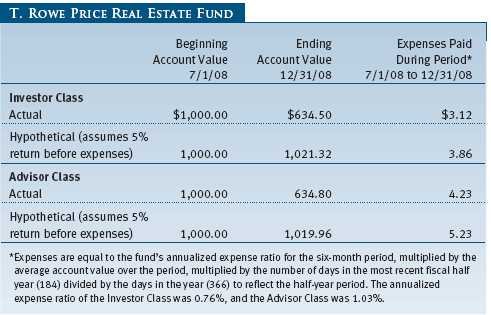
As a mutual fund shareholder, you may incur two types of costs: (1) transaction costs, such as redemption fees or sales loads, and (2) ongoing costs, including management fees, distribution and service (12b-1) fees, and other fund expenses. The following example is intended to help you understand your ongoing costs (in dollars) of investing in the fund and to compare these costs with the ongoing costs of investing in other mutual funds. The example is based on an investment of $1,000 invested at the beginning of the most recent six-month period and held for the entire period.
Please note that the fund has two share classes: The original share class (“investor class”) charges no distribution and service (12b-1) fee, and the Advisor Class shares are offered only through unaffiliated brokers and other financial intermediaries and charge a 0.25% 12b-1 fee. Each share class is presented separately in the table.
Actual Expenses
The first line of the following table (“Actual”) provides information about actual account values and expenses based on the fund’s actual returns. You may use the information in this line, together with your account balance, to estimate the expenses that you paid over the period. Simply divide your account value by $1,000 (for example, an $8,600 account value divided by $1,000 = 8.6), then multiply the result by the number in the first line under the heading “Expenses Paid During Period” to estimate the expenses you paid on your account during this period.
Hypothetical Example for Comparison Purposes
The information on the second line of the table (“Hypothetical”) is based on hypothetical account values and expenses derived from the fund’s actual expense ratio and an assumed 5% per year rate of return before expenses (not the fund’s actual return). You may compare the ongoing costs of investing in the fund with other funds by contrasting this 5% hypothetical example and the 5% hypothetical examples that appear in the shareholder reports of the other funds. The hypothetical account values and expenses may not be used to estimate the actual ending account balance or expenses you paid for the period.
Note: T. Rowe Price charges an annual small-account maintenance fee of $10, generally for accounts with less than $2,000 ($500 for UGMA/UTMA). The fee is waived for any investor whose T. Rowe Price mutual fund accounts total $25,000 or more, accounts employing automatic investing, and IRAs and other retirement plan accounts that utilize a prototype plan sponsored by T. Rowe Price (although a separate custodial or administrative fee may apply to such accounts). This fee is not included in the accompanying table. If you are subject to the fee, keep it in mind when you are estimating the ongoing expenses of investing in the fund and when comparing the expenses of this fund with other funds.
You should also be aware that the expenses shown in the table highlight only your ongoing costs and do not reflect any transaction costs, such as redemption fees or sales loads. Therefore, the second line of the table is useful in comparing ongoing costs only and will not help you determine the relative total costs of owning different funds. To the extent a fund charges transaction costs, however, the total cost of owning that fund is higher.
The accompanying notes are an integral part of these financial statements.
The accompanying notes are an integral part of these financial statements.
The accompanying notes are an integral part of these financial statements.
The accompanying notes are an integral part of these financial statements.
The accompanying notes are an integral part of these financial statements.

The accompanying notes are an integral part of these financial statements.
| NOTES TO FINANCIAL STATEMENTS |
T. Rowe Price Real Estate Fund, Inc. (the fund), is registered under the Investment Company Act of 1940 (the 1940 Act) as a diversified, open-end management investment company. The fund seeks to provide long-term growth through a combination of capital appreciation and current income. The fund has two classes of shares: the Real Estate Fund original share class, referred to in this report as the Investor Class, offered since October 31, 1997, and Real Estate Fund–Advisor Class (Advisor Class), offered since December 31, 2004. Advisor Class shares are sold only through unaffiliated brokers and other unaffiliated financial intermediaries that are compensated by the class for distribution, shareholder servicing, and/or certain administrative services under a Board-approved Rule 12b-1 plan. Each class has exclusive voting rights on matters related solely to that class, separate voting rights on matters that relate to both classes, and, in all other respects, the same rights and obligations as the other class.
NOTE 1 - SIGNIFICANT ACCOUNTING POLICIES
Basis of Preparation The accompanying financial statements were prepared in accordance with accounting principles generally accepted in the United States of America, which require the use of estimates made by fund management. Fund management believes that estimates and security valuations are appropriate; however, actual results may differ from those estimates, and the security valuations reflected in the financial statements may differ from the value the fund ultimately realizes upon sale of the securities.
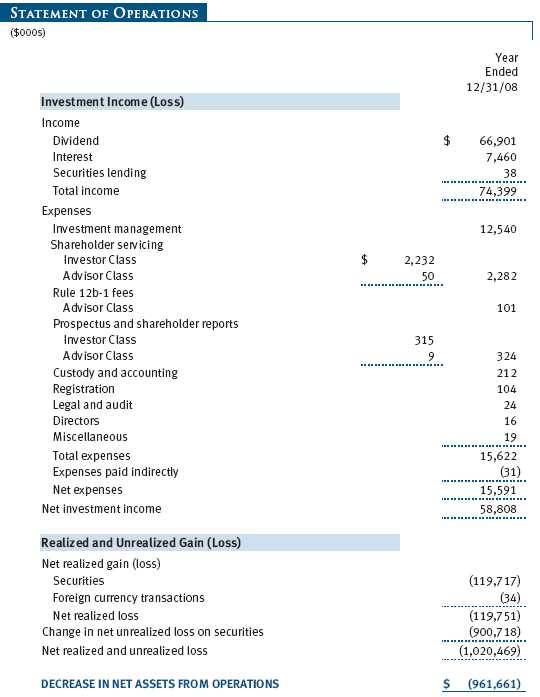
Investment Transactions, Investment Income, and Distributions Income and expenses are recorded on the accrual basis. Premiums and discounts on debt securities are amortized for financial reporting purposes. Dividends received from mutual fund investments are reflected as dividend income; capital gain distributions are reflected as realized gain/loss. Dividend income and capital gain distributions are recorded on the ex-dividend date. Income tax-related interest and penalties, if incurred, would be recorded as income tax expense. Investment transactions are accounted for on the trade date. Realized gains and losses are reported on the identified cost basis. Distributions to shareholders are recorded on the ex-dividend date. Income distributions are declared and paid by each class on a quarterly basis. Capital gain distributions, if any, are declared and paid by the fund, typically on an annual basis.
Currency Translation Assets, including investments, and liabilities denominated in foreign currencies are translated into U.S. dollar values each day at the prevailing exchange rate, using the mean of the bid and asked prices of such currencies against U.S. dollars as quoted by a major bank. Purchases and sales of securities, income, and expenses are translated into U.S. dollars at the prevailing exchange rate on the date of the transaction. The effect of changes in foreign currency exchange rates on realized and unrealized security gains and losses is reflected as a component of security gains and losses.
Class Accounting The Advisor Class pays distribution, shareholder servicing, and/or certain administrative expenses in the form of Rule 12b-1 fees, in an amount not exceeding 0.25% of the class’s average daily net assets. Shareholder servicing, prospectus, and shareholder report expenses incurred by each class are charged directly to the class to which they relate. Expenses common to both classes, investment income, and realized and unrealized gains and losses are allocated to the classes based upon the relative daily net assets of each class.
Rebates and Credits Subject to best execution, the fund may direct certain security trades to brokers who have agreed to rebate a portion of the related brokerage commission to the fund in cash. Commission rebates are reflected as realized gain on securities in the accompanying financial statements and totaled $53,000 for the year ended December 31, 2008. Additionally, the fund earns credits on temporarily uninvested cash balances at the custodian that reduce the fund’s custody charges. Custody expense in the accompanying financial statements is presented before reduction for credits, which are reflected as expenses paid indirectly.
Redemption Fees A 1% fee is assessed on redemptions of fund shares held for 90 days or less to deter short-term trading and to protect the interests of long-term shareholders. Redemption fees are withheld from proceeds that shareholders receive from the sale or exchange of fund shares. The fees are paid to the fund, and are recorded as an increase to paid-in capital. The fees may cause the redemption price per share to differ from the net asset value per share.
New Accounting Pronouncements On January 1, 2008, the fund adopted Statement of Financial Accounting Standards No. 157 (FAS 157), Fair Value Measurements. FAS 157 defines fair value, establishes the framework for measuring fair value, and expands the disclosures of fair value measurements in the financial statements. Adoption of FAS 157 did not have a material impact on the fund’s net assets or results of operations.
In March 2008, the Financial Accounting Standards Board issued Statement of Financial Accounting Standards No. 161 (FAS 161), Disclosures about Derivative Instruments and Hedging Activities, which is effective for fiscal years and interim periods beginning after November 15, 2008. FAS 161 requires enhanced disclosures about derivative and hedging activities, including how such activities are accounted for and their effect on financial position, performance and cash flows. Management is currently evaluating the impact the adoption of FAS 161 will have on the fund’s financial statements and related disclosures.
NOTE 2 - VALUATION
The fund’s investments are reported at fair value as defined under FAS 157. The fund values its investments and computes its net asset value per share at the close of the New York Stock Exchange (NYSE), normally 4 p.m. ET, each day that the NYSE is open for business.
Valuation Methods Equity securities listed or regularly traded on a securities exchange or in the over-the-counter (OTC) market are valued at the last quoted sale price or, for certain markets, the official closing price at the time the valuations are made, except for OTC Bulletin Board securities, which are valued at the mean of the latest bid and asked prices. A security that is listed or traded on more than one exchange is valued at the quotation on the exchange determined to be the primary market for such security. Listed securities not traded on a particular day are valued at the mean of the latest bid and asked prices for domestic securities and the last quoted sale price for international securities.
Debt securities are generally traded in the OTC market. Securities with remaining maturities of one year or more at the time of acquisition are valued at prices furnished by dealers who make markets in such securities or by an independent pricing service, which considers the yield or price of bonds of comparable quality, coupon, maturity, and type, as well as prices quoted by dealers who make markets in such securities. Securities with remaining maturities of less than one year at the time of acquisition generally use amortized cost in local currency to approximate fair value. However, if amortized cost is deemed not to reflect fair value or the fund holds a significant amount of such securities with remaining maturities of more than 60 days, the securities are valued at prices furnished by dealers who make markets in such securities or by an independent pricing service.
Investments in mutual funds are valued at the mutual fund’s closing net asset value per share on the day of valuation.
Other investments, including restricted securities, and those for which the above valuation procedures are inappropriate or are deemed not to reflect fair value are stated at fair value as determined in good faith by the T. Rowe Price Valuation Committee, established by the fund’s Board of Directors.
Valuation Inputs Various inputs are used to determine the value of the fund’s investments. These inputs are summarized in the three broad levels listed below:
Level 1 – quoted prices in active markets for identical securities
Level 2 – observable inputs other than Level 1 quoted prices (including, but not limited to, quoted prices for similar securities, interest rates, prepayment speeds, credit risk)
Level 3 – unobservable inputs
Observable inputs are those based on market data obtained from sources independent of the fund, and unobservable inputs reflect the fund’s own assumptions based on the best information available. The input levels are not necessarily an indication of the risk or liquidity associated with investments at that level. The following table summarizes the fund’s investments, based on the inputs used to determine their values on December 31, 2008:

NOTE 3 - INVESTMENT TRANSACTIONS
Consistent with its investment objective, the fund engages in the following practices to manage exposure to certain risks or to enhance performance. The investment objective, policies, program, and risk factors of the fund are described more fully in the fund’s prospectus and Statement of Additional Information.
Restricted Securities The fund may invest in securities that are subject to legal or contractual restrictions on resale. Prompt sale of such securities at an acceptable price may be difficult and may involve substantial delays and additional costs.
Securities Lending The fund lends its securities to approved brokers to earn additional income. It receives as collateral cash and U.S. government securities valued at 102% to 105% of the value of the securities on loan. Cash collateral is invested by the fund’s lending agent(s) in accordance with investment guidelines approved by fund management. Although risk is mitigated by the collateral, the fund could experience a delay in recovering its securities and a possible loss of income or value if the borrower fails to return the securities or if collateral investments decline in value. Securities lending revenue recognized by the fund consists of earnings on invested collateral and borrowing fees, net of any rebates to the borrower and compensation to the lending agent. At December 31, 2008, there were no securities on loan.
Other Purchases and sales of portfolio securities, other than short-term securities, aggregated $1,007,886,000 and $298,831,000, respectively, for the year ended December 31, 2008.
NOTE 4 - FEDERAL INCOME TAXES
No provision for federal income taxes is required since the fund intends to continue to qualify as a regulated investment company under Subchapter M of the Internal Revenue Code and distribute to shareholders all of its taxable income and gains. Distributions are determined in accordance with Federal income tax regulations, which differ from generally accepted accounting principles, and, therefore, may differ significantly in amount or character from net investment income and realized gains for financial reporting purposes. Financial reporting records are adjusted for permanent book/tax differences to reflect tax character but are not adjusted for temporary differences.
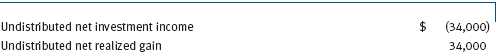
Reclassifications between income and gain relate primarily to the character of currency gains and losses. For the year ended December 31, 2008, the following reclassifications, which had no impact on results of operations or net assets, were recorded to reflect tax character:
Distributions during the years ended December 31, 2008 and December 31, 2007 were characterized for tax purposes as follows:

At December 31, 2008, the tax-basis cost of investments and components of net assets were as follows:
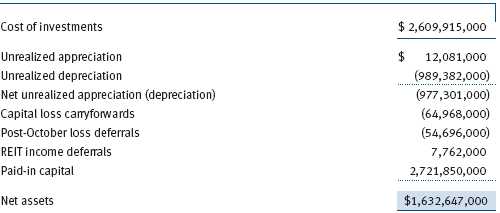
The difference between book-basis and tax-basis net unrealized appreciation (depreciation) is attributable to the deferral of losses from wash sales for tax purposes. The fund intends to retain realized gains to the extent of available capital loss carryforwards. As of December 31, 2008, all unused capital loss carryforwards expire in 2016. Pursuant to federal income tax regulations applicable to investment companies, recognition of dividend income and capital losses on certain transactions is deferred until the subsequent tax year. Consequently, dividend income reflected in the accompanying financial statements includes REIT dividends declared in December and paid in January that have not been recognized for tax purposes (REIT income deferrals). Realized losses reflected in the accompanying financial statements include net capital losses realized between November 1 and the fund’s fiscal year-end that have not been recognized for tax purposes (Post-October loss deferrals).
NOTE 5 - RELATED PARTY TRANSACTIONS
The fund is managed by T. Rowe Price Associates, Inc. (the manager or Price Associates), a wholly owned subsidiary of T. Rowe Price Group, Inc. The investment management agreement between the fund and the manager provides for an annual investment management fee, which is computed daily and paid monthly. The fee consists of an individual fund fee, equal to 0.30% of the fund’s average daily net assets, and a group fee. The group fee rate is calculated based on the combined net assets of certain mutual funds sponsored by Price Associates (the group) applied to a graduated fee schedule, with rates ranging from 0.48% for the first $1 billion of assets to 0.285% for assets in excess of $220 billion. The fund’s group fee is determined by applying the group fee rate to the fund’s average daily net assets. At December 31, 2008, the effective annual group fee rate was 0.31%.
In addition, the fund has entered into service agreements with Price Associates and two wholly owned subsidiaries of Price Associates (collectively, Price). Price Associates computes the daily share prices and provides certain other administrative services to the fund. T. Rowe Price Services, Inc., provides shareholder and administrative services in its capacity as the fund’s transfer and dividend disbursing agent. T. Rowe Price Retirement Plan Services, Inc., provides subaccounting and recordkeeping services for certain retirement accounts invested in the Investor Class. For the year ended December 31, 2008, expenses incurred pursuant to these service agreements were $120,000 for Price Associates, $1,120,000 for T. Rowe Price Services, Inc., and $294,000 for T. Rowe Price Retirement Plan Services, Inc. The total amount payable at period-end pursuant to these service agreements is reflected as Due to Affiliates in the accompanying financial statements.
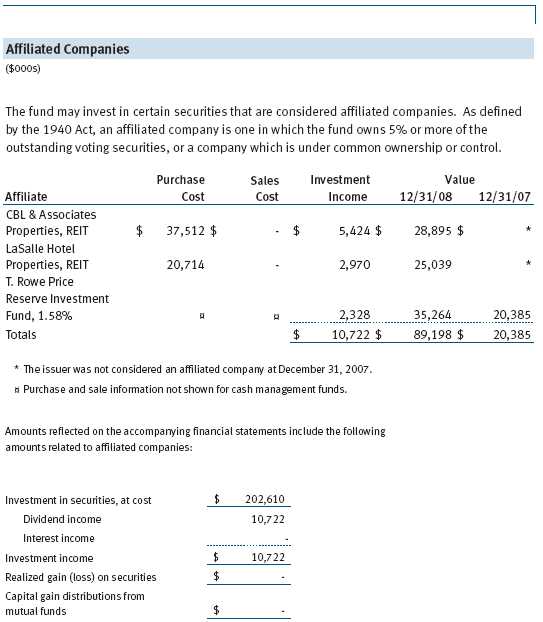
The fund may invest in the T. Rowe Price Reserve Investment Fund and the T. Rowe Price Government Reserve Investment Fund (collectively, the T. Rowe Price Reserve Investment Funds), open-end management investment companies managed by Price Associates and considered affiliates of the fund. The T. Rowe Price Reserve Investment Funds are offered as cash management options to mutual funds, trusts, and other accounts managed by Price Associates and/or its affiliates and are not available for direct purchase by members of the public. The T. Rowe Price Reserve Investment Funds pay no investment management fees.
| REPORT OF INDEPENDENT REGISTERED PUBLIC ACCOUNTING FIRM |
To the Board of Directors and Shareholders of T. Rowe Price Real Estate Fund, Inc.
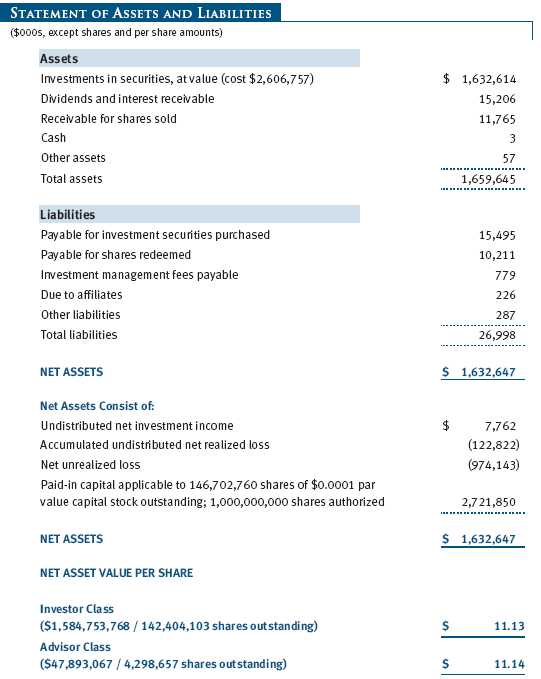
In our opinion, the accompanying statement of assets and liabilities, including the schedule of investments, and the related statements of operations and of changes in net assets and the financial highlights present fairly, in all material respects, the financial position of T. Rowe Price Real Estate Fund, Inc (the “Fund”) at December 31, 2008, the results of its operations for the year then ended, the changes in its net assets for each of the two years in the period then ended and the financial highlights for each of the fiscal periods presented, in conformity with accounting principles generally accepted in the United States of America. These financial statements and financial highlights (hereafter referred to as “financial statements”) are the responsibility of the Fund’s management; our responsibility is to express an opinion on these financial statements based on our audits. We conducted our audits of these financial statements in accordance with the standards of the Public Company Accounting Oversight Board (United States). Those standards require that we plan and perform the audit to obtain reasonable assurance about whether the financial statements are free of material misstatement. An audit includes examining, on a test basis, evidence supporting the amounts and disclosures in the financial statements, assessing the accounting principles used and significant estimates made by management, and evaluating the overall financial statement presentation. We believe that our audits, which included confirmation of securities at December 31, 2008 by correspondence with the custodian and confirmation of the underlying fund by correspondence with the transfer agent, provide a reasonable basis for our opinion.
PricewaterhouseCoopers LLP
Baltimore, Maryland
February 12, 2009
| TAX INFORMATION (UNAUDITED) FOR THE TAX YEAR ENDED 12/31/08 |
We are providing this information as required by the Internal Revenue Code. The amounts shown may differ from those elsewhere in this report because of differences between tax and financial reporting requirements.
For taxable non-corporate shareholders, $2,647,000 of the fund’s income represents qualified dividend income subject to the 15% rate category.
For corporate shareholders, $588,000 of the fund’s income qualifies for the dividends-received deduction.
| INFORMATION ON PROXY VOTING POLICIES, PROCEDURES, AND RECORDS |
A description of the policies and procedures used by T. Rowe Price funds and portfolios to determine how to vote proxies relating to portfolio securities is available in each fund’s Statement of Additional Information, which you may request by calling 1-800-225-5132 or by accessing the SEC’s Web site, www.sec.gov. The description of our proxy voting policies and procedures is also available on our Web site, www.troweprice.com. To access it, click on the words “Our Company” at the top of our corporate homepage. Then, when the next page appears, click on the words “Proxy Voting Policies” on the left side of the page.
Each fund’s most recent annual proxy voting record is available on our Web site and through the SEC’s Web site. To access it through our Web site, follow the directions above, then click on the words “Proxy Voting Records” on the right side of the Proxy Voting Policies page.
| HOW TO OBTAIN QUARTERLY PORTFOLIO HOLDINGS |
The fund files a complete schedule of portfolio holdings with the Securities and Exchange Commission for the first and third quarters of each fiscal year on Form N-Q. The fund’s Form N-Q is available electronically on the SEC’s Web site (www.sec.gov); hard copies may be reviewed and copied at the SEC’s Public Reference Room, 450 Fifth St. N.W., Washington, DC 20549. For more information on the Public Reference Room, call 1-800-SEC-0330.
| ABOUT THE FUND’S DIRECTORS AND OFFICERS |
Your fund is governed by a Board of Directors (Board) that meets regularly to review a wide variety of matters affecting the fund, including performance, investment programs, compliance matters, advisory fees and expenses, service providers, and other business affairs. The Board elects the fund’s officers, who are listed in the final table. At least 75% of Board members are independent of T. Rowe Price Associates, Inc. (T. Rowe Price), and T. Rowe Price International, Inc. (T. Rowe Price International); “inside” or “interested” directors are employees or officers of T. Rowe Price. The business address of each director and officer is 100 East Pratt Street, Baltimore, Maryland 21202. The Statement of Additional Information includes additional information about the directors and is available without charge by calling a T. Rowe Price representative at 1-800-225-5132.
| Independent Directors | |
| |
| Name | |
| (Year of Birth) | Principal Occupation(s) During Past Five Years and Directorships of |
| Year Elected* | Other Public Companies |
| | |
| Jeremiah E. Casey | Director, National Life Insurance (2001 to 2005); Director, The Rouse |
| (1940) | Company, real estate developers (1990 to 2004) |
| 2005 | |
| | |
| Anthony W. Deering | Chairman, Exeter Capital, LLC, a private investment firm (2004 |
| (1945) | to present); Director, Under Armour (8/08 to present); Director, |
| 2001 | Vornado Real Estate Investment Trust (3/04 to present); Director, |
| | Mercantile Bankshares (2002 to 2007); Member, Advisory Board, |
| | Deutsche Bank North America (2004 to present); Director, Chairman |
| | of the Board, and Chief Executive Officer, The Rouse Company, real |
| | estate developers (1997 to 2004) |
| | |
| Donald W. Dick, Jr. | Principal, EuroCapital Advisors, LLC, an acquisition and manage- |
| (1943) | ment advisory firm (10/95 to present); Chairman, The Haven Group, |
| 1997 | a custom manufacturer of modular homes (1/04 to present) |
| | |
| David K. Fagin | Chairman and President, Nye Corporation (6/88 to present); |
| (1938) | Director, Golden Star Resources Ltd. (5/92 to present); Director, |
| 1997 | Pacific Rim Mining Corp. (2/02 to present); Director, B.C. Corporation |
| | (3/08 to present); Chairman, Canyon Resources Corp. (8/07 to |
| | 3/08); Director, Atna Resources Ltd. (3/08 to present) |
| | |
| Karen N. Horn | Director, Eli Lilly and Company (1987 to present); Director, Simon |
| (1943) | Property Group (2004 to present); Director, Federal National |
| 2003 | Mortgage Association (9/06 to present); Director, Norfolk Southern |
| | (2/08 to present); Director, Georgia Pacific (5/04 to 12/05); |
| | Managing Director and President, Global Private Client Services, |
| | Marsh Inc. (1999 to 2003) |
| Theo C. Rodgers | President, A&R Development Corporation (1977 to present) |
| (1941) | |
| 2005 | |
| | |
| John G. Schreiber | Owner/President, Centaur Capital Partners, Inc., a real estate invest- |
| (1946) | ment company (1991 to present); Partner, Blackstone Real Estate |
| 2001 | Advisors, L.P. (10/92 to present) |
| |
| *Each independent director oversees 126 T. Rowe Price portfolios (except for Mr. Fagin, who oversees |
| 125 T. Rowe Price portfolios) and serves until retirement, resignation, or election of a successor. |
| Inside Directors | |
| |
| Name | |
| (Year of Birth) | |
| Year Elected* | |
| [Number of T. Rowe Price | Principal Occupation(s) During Past Five Years and Directorships of |
| Portfolios Overseen] | Other Public Companies |
| | |
| Edward C. Bernard | Director and Vice President, T. Rowe Price; Vice Chairman of the |
| (1956) | Board, Director, and Vice President, T. Rowe Price Group, Inc.; |
| 2006 | Chairman of the Board, Director, and President, T. Rowe Price |
| [126] | Investment Services, Inc.; Chairman of the Board and Director, |
| | T. Rowe Price Global Asset Management Limited, T. Rowe Price |
| | Global Investment Services Limited, T. Rowe Price Retirement |
| | Plan Services, Inc., T. Rowe Price Savings Bank, and T. Rowe Price |
| | Services, Inc.; Director, T. Rowe Price International, Inc.; Chief |
| | Executive Officer, Chairman of the Board, Director, and President, |
| | T. Rowe Price Trust Company; Chairman of the Board, all funds |
| | |
| Brian C. Rogers, CFA, CIC | Chief Investment Officer, Director, and Vice President, T. Rowe Price; |
| (1955) | Chairman of the Board, Chief Investment Officer, Director, and Vice |
| 2006 | President, T. Rowe Price Group, Inc.; Vice President, T. Rowe Price |
| [71] | Trust Company |
| |
| *Each inside director serves until retirement, resignation, or election of a successor. |
| Officers | |
| |
| Name (Year of Birth) | |
| Title and Fund(s) Served | Principal Occupation(s) |
| | |
| Richard M. Clattenburg, CFA (1979) | Vice President, T. Rowe Price; formerly Financial |
| Vice President, Real Estate Fund | Analyst, Goldman Sachs (to 2005) |
| | |
| Anna M. Dopkin, CFA (1967) | Vice President, T. Rowe Price, T. Rowe Price |
| Vice President, Real Estate Fund | Group, Inc., and T. Rowe Price Trust Company |
| | |
| Joseph B. Fath, CPA (1971) | Vice President, T. Rowe Price and T. Rowe Price |
| Vice President, Real Estate Fund | Group, Inc. |
| | |
| Roger L. Fiery III, CPA (1959) | Vice President, T. Rowe Price, T. Rowe Price |
| Vice President, Real Estate Fund | Group, Inc., T. Rowe Price International, Inc., |
| | and T. Rowe Price Trust Company |
| | |
| John R. Gilner (1961) | Chief Compliance Officer and Vice President, |
| Chief Compliance Officer, Real Estate Fund | T. Rowe Price; Vice President, T. Rowe Price |
| | Group, Inc., and T. Rowe Price Investment |
| | Services, Inc. |
| | |
| Gregory S. Golczewski (1966) | Vice President, T. Rowe Price and T. Rowe Price |
| Vice President, Real Estate Fund | Trust Company |
| | |
| Gregory K. Hinkle, CPA (1958) | Vice President, T. Rowe Price, T. Rowe Price |
| Treasurer, Real Estate Fund | Group, Inc., T. Rowe Price Investment Services, |
| | Inc., and T. Rowe Price Trust Company; formerly |
| | Partner, PricewaterhouseCoopers LLP (to 2007) |
| | |
| Thomas J. Huber, CFA (1966) | Vice President, T. Rowe Price, T. Rowe Price |
| Vice President, Real Estate Fund | Group, Inc., and T. Rowe Price Trust Company |
| | |
| David M. Lee, CFA (1962) | Vice President, T. Rowe Price and T. Rowe Price |
| President, Real Estate Fund | Group, Inc. |
| | |
| Patricia B. Lippert (1953) | Assistant Vice President, T. Rowe Price and |
| Secretary, Real Estate Fund | T. Rowe Price Investment Services, Inc. |
| | |
| Philip A. Nestico (1976) | Vice President, T. Rowe Price and T. Rowe Price |
| Vice President, Real Estate Fund | Group, Inc. |
| | |
| Charles M. Ober, CFA (1950) | Vice President, T. Rowe Price and T. Rowe Price |
| Vice President, Real Estate Fund | Group, Inc. |
| David Oestreicher (1967) | Director and Vice President, T. Rowe Price |
| Vice President, Real Estate Fund | Investment Services, Inc., T. Rowe Price Trust |
| | Company, and T. Rowe Price Services, Inc.; Vice |
| | President, T. Rowe Price, T. Rowe Price Global |
| | Asset Management Limited, T. Rowe Price |
| | Global Investment Services Limited, T. Rowe |
| | Price Group, Inc., T. Rowe Price International, |
| | Inc., and T. Rowe Price Retirement Plan |
| | Services, Inc. |
| | |
| Theodore E. Robson, CFA (1965) | Vice President, T. Rowe Price, T. Rowe Price |
| Vice President, Real Estate Fund | Group, Inc., and T. Rowe Price Trust Company |
| | |
| Julie L. Waples (1970) | Vice President, T. Rowe Price |
| Vice President, Real Estate Fund | |
| |
| Unless otherwise noted, officers have been employees of T. Rowe Price or T. Rowe Price International for at |
| least five years. | |
Item 2. Code of Ethics.
The registrant has adopted a code of ethics, as defined in Item 2 of Form N-CSR, applicable to its principal executive officer, principal financial officer, principal accounting officer or controller, or persons performing similar functions. A copy of this code of ethics is filed as an exhibit to this Form N-CSR. No substantive amendments were approved or waivers were granted to this code of ethics during the period covered by this report.
Item 3. Audit Committee Financial Expert.
The registrant’s Board of Directors/Trustees has determined that Ms. Karen N. Horn qualifies as an audit committee financial expert, as defined in Item 3 of Form N-CSR. Ms. Horn is considered independent for purposes of Item 3 of Form N-CSR.
Item 4. Principal Accountant Fees and Services.
(a) – (d) Aggregate fees billed to the registrant for the last two fiscal years for professional services rendered by the registrant’s principal accountant were as follows:
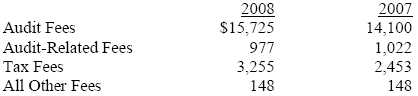
Audit fees include amounts related to the audit of the registrant’s annual financial statements and services normally provided by the accountant in connection with statutory and regulatory filings. Audit-related fees include amounts reasonably related to the performance of the audit of the registrant’s financial statements and specifically include the issuance of a report on internal controls and, if applicable, agreed-upon procedures related to fund acquisitions. Tax fees include amounts related to services for tax compliance, tax planning, and tax advice. The nature of these services specifically includes the review of distribution calculations and the preparation of Federal, state, and excise tax returns. All other fees include the registrant’s pro-rata share of amounts for agreed-upon procedures in conjunction with service contract approvals by the registrant’s Board of Directors/Trustees.
(e)(1) The registrant’s audit committee has adopted a policy whereby audit and non-audit services performed by the registrant’s principal accountant for the registrant, its investment adviser, and any entity controlling, controlled by, or under common control with the investment adviser that provides ongoing services to the registrant require pre-approval in advance at regularly scheduled audit committee meetings. If such a service is required between regularly scheduled audit committee meetings, pre-approval may be authorized by one audit committee member with ratification at the next scheduled audit committee meeting. Waiver of pre-approval for audit or non-audit services requiring fees of a de minimis amount is not permitted.
(2) No services included in (b) – (d) above were approved pursuant to paragraph (c)(7)(i)(C) of Rule 2-01 of Regulation S-X.
(f) Less than 50 percent of the hours expended on the principal accountant’s engagement to audit the registrant’s financial statements for the most recent fiscal year were attributed to work performed by persons other than the principal accountant’s full-time, permanent employees.
(g) The aggregate fees billed for the most recent fiscal year and the preceding fiscal year by the registrant’s principal accountant for non-audit services rendered to the registrant, its investment adviser, and any entity controlling, controlled by, or under common control with the investment adviser that provides ongoing services to the registrant were $1,922,000 and $1,486,000, respectively.
(h) All non-audit services rendered in (g) above were pre-approved by the registrant’s audit committee. Accordingly, these services were considered by the registrant’s audit committee in maintaining the principal accountant’s independence.
Item 5. Audit Committee of Listed Registrants.
Not applicable.
Item 6. Investments.
(a) Not applicable. The complete schedule of investments is included in Item 1 of this Form N-CSR.
(b) Not applicable.
Item 7. Disclosure of Proxy Voting Policies and Procedures for Closed-End Management Investment Companies.
Not applicable.
Item 8. Portfolio Managers of Closed-End Management Investment Companies.
Not applicable.
Item 9. Purchases of Equity Securities by Closed-End Management Investment Company and Affiliated Purchasers.
Not applicable.
Item 10. Submission of Matters to a Vote of Security Holders.
Not applicable.
Item 11. Controls and Procedures.
(a) The registrant’s principal executive officer and principal financial officer have evaluated the registrant’s disclosure controls and procedures within 90 days of this filing and have concluded that the registrant’s disclosure controls and procedures were effective, as of that date, in ensuring that information required to be disclosed by the registrant in this Form N-CSR was recorded, processed, summarized, and reported timely.
(b) The registrant’s principal executive officer and principal financial officer are aware of no change in the registrant’s internal control over financial reporting that occurred during the registrant’s second fiscal quarter covered by this report that has materially affected, or is reasonably likely to materially affect, the registrant’s internal control over financial reporting.
Item 12. Exhibits.
(a)(1) The registrant’s code of ethics pursuant to Item 2 of Form N-CSR is attached.
(2) Separate certifications by the registrant's principal executive officer and principal financial officer, pursuant to Section 302 of the Sarbanes-Oxley Act of 2002 and required by Rule 30a-2(a) under the Investment Company Act of 1940, are attached.
(3) Written solicitation to repurchase securities issued by closed-end companies: not applicable.
(b) A certification by the registrant's principal executive officer and principal financial officer, pursuant to Section 906 of the Sarbanes-Oxley Act of 2002 and required by Rule 30a-2(b) under the Investment Company Act of 1940, is attached.
| | �� |
SIGNATURES |
| |
| | Pursuant to the requirements of the Securities Exchange Act of 1934 and the Investment |
| Company Act of 1940, the registrant has duly caused this report to be signed on its behalf by the |
| undersigned, thereunto duly authorized. |
| |
| T. Rowe Price Real Estate Fund, Inc. |
| |
| |
| |
| By | /s/ Edward C. Bernard |
| | Edward C. Bernard |
| | Principal Executive Officer |
| |
| Date | February 19, 2009 |
| |
| |
| |
| | Pursuant to the requirements of the Securities Exchange Act of 1934 and the Investment |
| Company Act of 1940, this report has been signed below by the following persons on behalf of |
| the registrant and in the capacities and on the dates indicated. |
| |
| |
| By | /s/ Edward C. Bernard |
| | Edward C. Bernard |
| | Principal Executive Officer |
| |
| Date | February 19, 2009 |
| |
| |
| |
| By | /s/ Gregory K. Hinkle |
| | Gregory K. Hinkle |
| | Principal Financial Officer |
| |
| Date | February 19, 2009 |