| UNITED STATES |
| SECURITIES AND EXCHANGE COMMISSION |
| Washington, D.C. 20549 |
| |
FORM N-CSR |
| |
CERTIFIED SHAREHOLDER REPORT OF REGISTERED |
MANAGEMENT INVESTMENT COMPANIES |
| |
| |
| |
| Investment Company Act File Number: 811-08371 |
|
| |
| T. Rowe Price Real Estate Fund, Inc. |
|
| (Exact name of registrant as specified in charter) |
| |
| 100 East Pratt Street, Baltimore, MD 21202 |
|
| (Address of principal executive offices) |
| |
| David Oestreicher |
| 100 East Pratt Street, Baltimore, MD 21202 |
|
| (Name and address of agent for service) |
| |
| |
| Registrant’s telephone number, including area code: (410) 345-2000 |
| |
| |
| Date of fiscal year end: December 31 |
| |
| |
| Date of reporting period: December 31, 2009 |
Item 1: Report to Shareholders| Real Estate Fund | December 31, 2009 |
The views and opinions in this report were current as of December 31, 2009. They are not guarantees of performance or investment results and should not be taken as investment advice. Investment decisions reflect a variety of factors, and the managers reserve the right to change their views about individual stocks, sectors, and the markets at any time. As a result, the views expressed should not be relied upon as a forecast of the fund’s future investment intent. The report is certified under the Sarbanes-Oxley Act, which requires mutual funds and other public companies to affirm that, to the best of their knowledge, the information in their financial reports is fairly and accurately stated in all material respects.
REPORTS ON THE WEB
Sign up for our E-mail Program, and you can begin to receive updated fund reports and prospectuses online rather than through the mail. Log in to your account at troweprice.com for more information.
Manager’s Letter
Fellow Shareholders
Markets sprang back sharply in 2009, rewarding patient investors while defying skeptics. Your fund wholly participated in the rebound, with strong total returns that exceeded both the passive and active indices. Credit markets made great strides over the year, providing access to limited debt financing at reasonable levels. Concurrently, equity markets were receptive to real estate investment trust (REIT) offerings, which strengthened balance sheets and better prepared companies to weather continued tough times ahead.
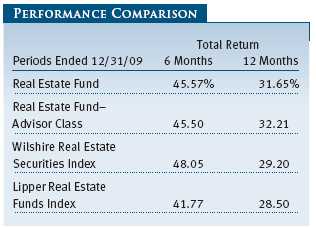
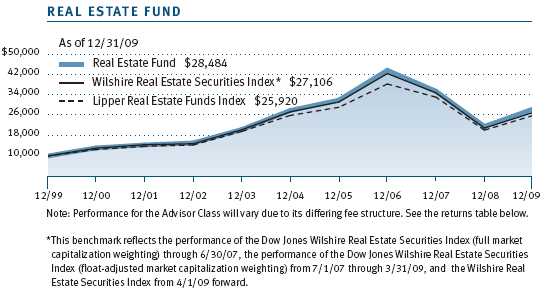
Your fund returned 45.57% during the past six months compared with 48.05% for the Wilshire Real Estate Securities Index and 41.77% for the Lipper Real Estate Funds Index. Combined with the first-half performance, the fund exceeded both benchmarks for the full year with total returns of 31.65%, 29.20%, and 28.50%, respectively.
DIVIDEND DISTRIBUTION
On December 10, 2009, your fund’s Board of Directors declared a fourth-quarter dividend of $0.12 per share ($0.11 per share for Advisor Class). This dividend was paid on December 14 to shareholders of record on December 10. The dividends have been reclassified for 1099 purposes, meaning that their tax character is different from that shown on the statement when it was paid. Remember to use Form 1099-DIV, not your year-end statement, when you file your taxes. The tax character refers to whether the dividend is from taxable or tax-exempt income, short- or long-term gain, or return of capital.
MARKET ENVIRONMENT AND STRATEGY
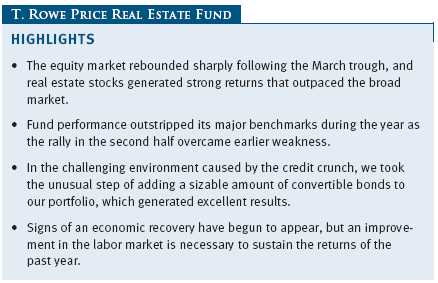
The rally in real estate securities that began in the spring remained strong through the remainder of the year. Despite the second-quarter rally, returns for the first half of 2009 were in negative territory. Second-half returns not only overcame that deficit but also provided unusually strong gains in real estate securities by historical standards.
In our report at the end of 2008, we discussed the liquidity crunch and its devastating impact upon our markets and our holdings. Fortunately, as 2009 progressed, the capital markets began to thaw and became increasingly more receptive to funding for our sector. While a small number of REITs took advantage of the option to preserve capital by paying dividends in stock instead of cash, the industry by and large viewed this as a band-aid approach and not a viable solution to the liquidity crisis. Subsequently, a vast wave of equity issuance served as a catalyst for the sector as investors saw that the benefits of deleveraging balance sheets outweighed the drawbacks of significant share dilution. Success begat success as a flourishing string of equity offerings encouraged more offerings that, too, proved rewarding. Indeed, some of the early issuers returned for subsequent offerings at substantially higher prices than their first.
Job losses and unemployment remained high in the U.S., but at least there were signs that the rate of decline was slowing. A slowing decline was certainly not as welcome as an outright positive upturn, but it was a necessary starting point for a revival. The protracted economic downturn meant that companies continued to hand back unutilized space to landlords. This caused a surplus of space and falling rents, which would be associated with such imbalances in the markets. That said, it could have been much worse, as the industry showed relatively good restraint leading into the downturn that limited new supply; there was no glut delivered into the market at the time we began suffering the demand shock. Indeed, we remain quite optimistic about the prospects for a recovery when demand (associated with job growth) returns in an environment of limited new supply.
Annual turnover for the fund remained well below average, with returns that added to our confidence and belief in our long-term investment philosophy, which did not deviate significantly during the recent crisis. We maintain a diverse portfolio of real estate investments composed of the strongest assets, franchises, and balance sheets the industry has to offer.
PORTFOLIO REVIEW
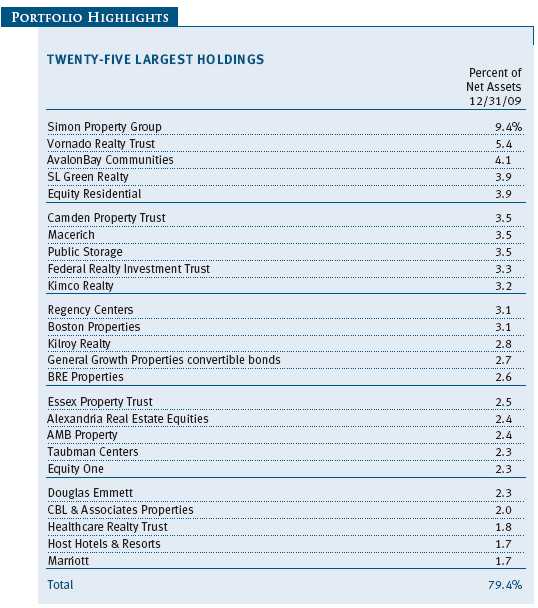
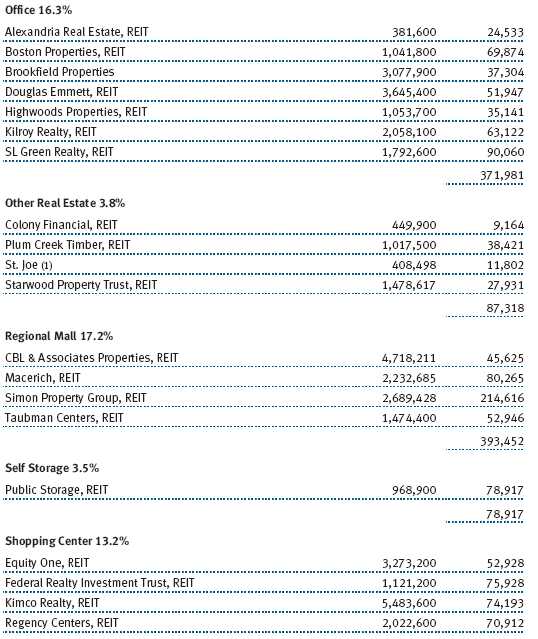
Retail assets were a sizable portion of the fund’s holdings, comprising mainly regional malls and neighborhood shopping centers. We’ve noted that, historically, U.S. gross domestic product has been driven roughly two-thirds by the consumer, reinforcing our belief that an economic recovery should involve some meaningful upturn in consumer demand. While we still believe this is true, we were nonetheless surprised at the great divergence in performance between regional malls and shopping centers over the last year. Some of it was caused by specific differences in subsectors, while some was due to individual companies. Regional malls, including our largest holding Simon Property Group, exhibited better stock and fundamental performance during the period, whereas shopping center names, including Kimco Realty and Regency Centers, suffered in comparison. (Please refer to our portfolio of investments for a complete listing of holdings and the amount each represents in the portfolio.)
One factor weighing in favor of regional malls is the relative lack of new supply, given the Herculean effort (land, money, time, etc.) required to deliver such large properties. Local shopping centers, on the other hand, were being built in an abundant fashion, often in the path of emerging neighborhoods that were a part of the recent housing boom, leading to a supply/demand imbalance during the recent housing bust. Also, while national grocery store chains tend to anchor the shopping centers, many other stores in the center tend to be heavily populated with local mom-and-pop operators who were disproportionately impacted by the recession and borrowing crisis. Nevertheless, we are optimistic that small businesses will make up a large portion of our economic revival and, therefore, a large part of the upturn for shopping center fundamentals.
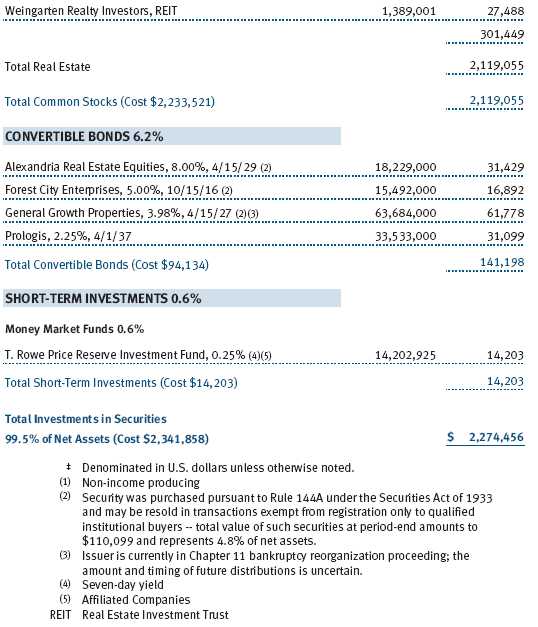
One additional note as it relates to our retail exposure: Investors may be surprised to find that our best-performing investment during the period was the bankrupt General Growth Properties’ convertible bond. We have discussed this bond situation in prior shareholder letters, and, indeed, it turned out that retaining this security ultimately offered an attractive return.
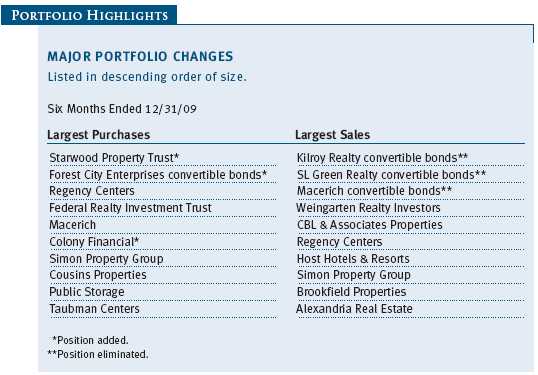
In the challenging environment caused by the credit crunch, we took the unusual path of adding a sizable amount of convertible bonds to our portfolio. Believing that the credit markets would need to heal for equity markets to improve, we felt these investments would prove quite rewarding and offer more protection in the event of continuing adversity. As it turned out, the credit markets did mend during the year, benefiting our bond holdings. While the equity markets also rebounded, our bonds actually produced better returns on average during the period. In the Major Portfolio Changes table on page 8 you will notice that our largest sales were of convertible bonds (Kilroy Realty, SL Green Realty, and Macerich). These are companies whose common stock we continue to hold. These bonds performed as desired, and, consequently, we eliminated them as their upside potential became more limited.

During the liquidity crisis and the subsequent disconnect from normalcy, we found many attractive real estate bonds available in the open market. However, as the credit markets rallied, it became significantly more challenging to find such public opportunities. We still believe there are ample opportunities in lending to real estate, but more so in the private domain. We did add a couple of investments that specialize in uncovering these private market opportunities, including Starwood Property Trust and Colony Financial. Both organizations have long and successful histories in commercial real estate, and we believe they can discover financing activities that we might normally find inaccessible.
Meanwhile, reports of Manhattan’s death proved premature. New York City specialist SL Green rebounded nicely in 2009. Lodging companies also surprised skeptics by finding ways to survive the economic meltdown, and Gaylord Entertainment and LaSalle Hotel Properties were among those leading to outsized returns. The fund remains well diversified across multiple property types.
OUTLOOK
In our outlook for 2009, we mentioned that the market tends to be forward-looking and we could expect stocks to rebound before a true economic recovery became evident. This proved to be the case. Some promising signs of a recovery have begun to emerge, and most economists believe that the economy grew at a brisk pace in the fourth quarter of 2009. However, a recovery in job creation remains elusive, and an improvement in the labor market is necessary, in our opinion, to sustain the returns of the past year. With a rewarding year behind us, uncertainty still remains. This pattern has been repeated in the past, both in real estate and in the broader markets.
In previous real estate cycles, we have watched public securities recover much earlier than their private market counterparts. Frankly, we expect to see negative headlines for commercial real estate for some time to come. That does not mean, however, that our investments cannot prove rewarding at the same time. Real estate securities have done well in the past, while both vacancies and capitalization rates continued to climb.
Public real estate companies are in a good position to access the capital markets and take advantage of continued distress in private real estate. Having made great strides in strengthening their own balance sheets, we believe that REITs may well turn out to be part of the solution rather than part of the problem.
We would like to thank you for your continued support and confidence during these challenging times.
Respectfully submitted,

David M. Lee
President of the fund and chairman of its Investment Advisory Committee
January 22, 2010
The committee chairman has day-to-day responsibility for managing the portfolio and works with committee members in developing and executing the fund’s investment program.
RISKS OF INVESTING
The fund’s share price can fall because of weakness in the stock market, a particular industry, or specific holdings. Stock markets can decline for many reasons, including adverse political or economic developments, changes in investor psychology, or heavy institutional selling. The prospects for an industry or company may deteriorate because of a variety of factors, including disappointing earnings or changes in the competitive environment. In addition, the investment manager’s assessment of companies held in a fund may prove incorrect, resulting in losses or poor performance even in rising markets.
Funds that invest only in specific industries will experience greater volatility than funds investing in a broad range of industries. Due to its concentration in the real estate industry, the fund’s share price could be more volatile than that of a fund with a broader investment mandate. Trends perceived to be unfavorable to real estate, such as changes in the tax laws or rising interest rates, could cause a decline in share prices.
GLOSSARY
Capitalization rate: A ratio, shown as a percentage rate, that estimates the present value of an income-producing asset. Riskier investments have higher capitalization rates and lower present values.
Lipper indexes: Fund benchmarks that consist of a small number of the largest mutual funds in a particular category as tracked by Lipper Inc.
Price/earnings ratio (or multiple): A valuation measure calculated by dividing the price of a stock by its current or projected earnings per share. This ratio gives investors an idea of how much they are paying for current or future earnings power.
Real estate investment trusts (REITs): Publicly traded companies that own, develop, and operate apartment complexes, hotels, office buildings, and other commercial properties.
Wilshire Real Estate Securities Index: A float-adjusted, market capitalization-weighted index composed of publicly traded real estate investment trusts and real estate operating companies.
Performance and Expenses
This chart shows the value of a hypothetical $10,000 investment in the fund over the past 10 fiscal year periods or since inception (for funds lacking 10-year records). The result is compared with benchmarks, which may include a broad-based market index and a peer group average or index. Market indexes do not include expenses, which are deducted from fund returns as well as mutual fund averages and indexes.
| AVERAGE ANNUAL COMPOUND TOTAL RETURN |
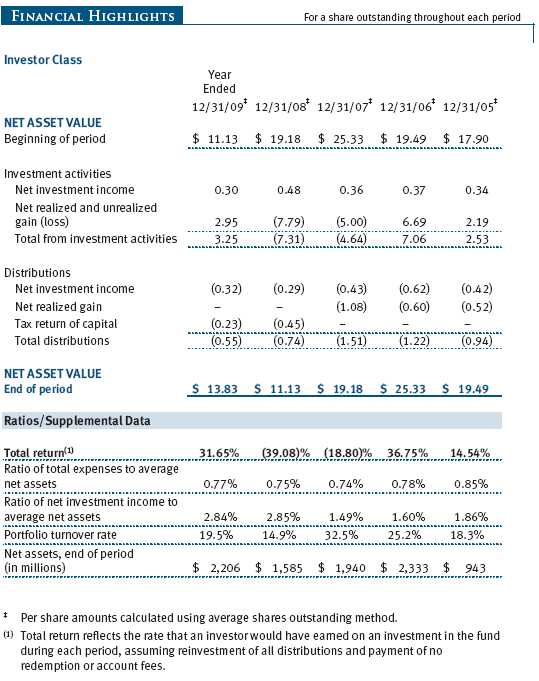
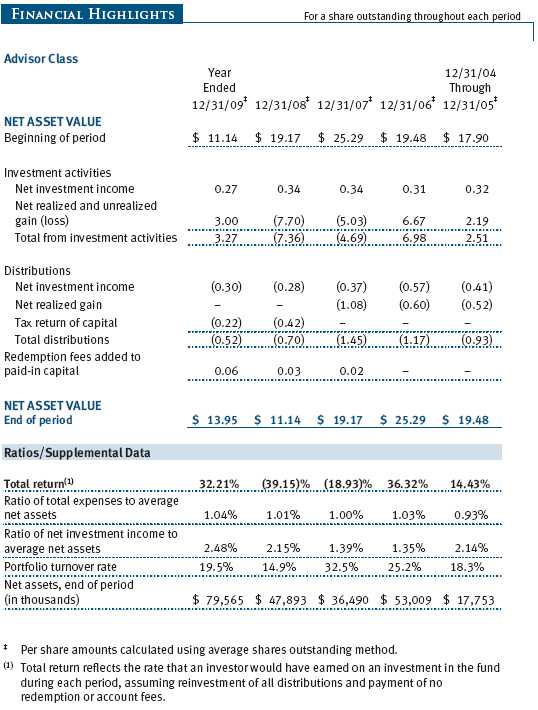
This table shows how the fund would have performed each year if its actual (or cumulative) returns had been earned at a constant rate.

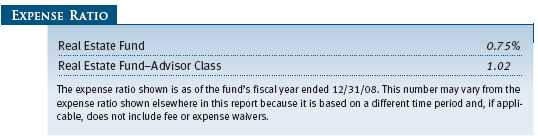
As a mutual fund shareholder, you may incur two types of costs: (1) transaction costs, such as redemption fees or sales loads, and (2) ongoing costs, including management fees, distribution and service (12b-1) fees, and other fund expenses. The following example is intended to help you understand your ongoing costs (in dollars) of investing in the fund and to compare these costs with the ongoing costs of investing in other mutual funds. The example is based on an investment of $1,000 invested at the beginning of the most recent six-month period and held for the entire period.
Please note that the fund has two share classes: The original share class (“investor class”) charges no distribution and service (12b-1) fee, and the Advisor Class shares are offered only through unaffiliated brokers and other financial intermediaries and charge a 0.25% 12b-1 fee. Each share class is presented separately in the table.
Actual Expenses
The first line of the following table (“Actual”) provides information about actual account values and expenses based on the fund’s actual returns. You may use the information in this line, together with your account balance, to estimate the expenses that you paid over the period. Simply divide your account value by $1,000 (for example, an $8,600 account value divided by $1,000 = 8.6), then multiply the result by the number in the first line under the heading “Expenses Paid During Period” to estimate the expenses you paid on your account during this period.
Hypothetical Example for Comparison Purposes
The information on the second line of the table (“Hypothetical”) is based on hypothetical account values and expenses derived from the fund’s actual expense ratio and an assumed 5% per year rate of return before expenses (not the fund’s actual return). You may compare the ongoing costs of investing in the fund with other funds by contrasting this 5% hypothetical example and the 5% hypothetical examples that appear in the shareholder reports of the other funds. The hypothetical account values and expenses may not be used to estimate the actual ending account balance or expenses you paid for the period.
Note: T. Rowe Price charges an annual small-account maintenance fee of $10, generally for accounts with less than $2,000 ($500 for UGMA/UTMA). The fee is waived for any investor whose T. Rowe Price mutual fund accounts total $25,000 or more, accounts employing automatic investing, and IRAs and other retirement plan accounts that utilize a prototype plan sponsored by T. Rowe Price (although a separate custodial or administrative fee may apply to such accounts). This fee is not included in the accompanying table. If you are subject to the fee, keep it in mind when you are estimating the ongoing expenses of investing in the fund and when comparing the expenses of this fund with other funds.
You should also be aware that the expenses shown in the table highlight only your ongoing costs and do not reflect any transaction costs, such as redemption fees or sales loads. Therefore, the second line of the table is useful in comparing ongoing costs only and will not help you determine the relative total costs of owning different funds. To the extent a fund charges transaction costs, however, the total cost of owning that fund is higher.

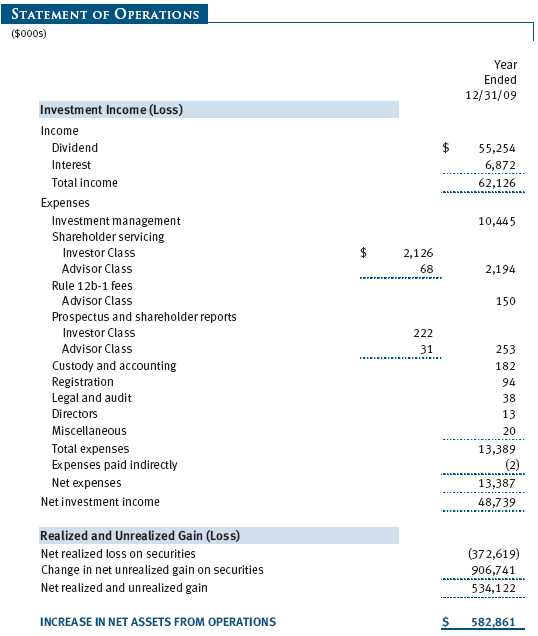
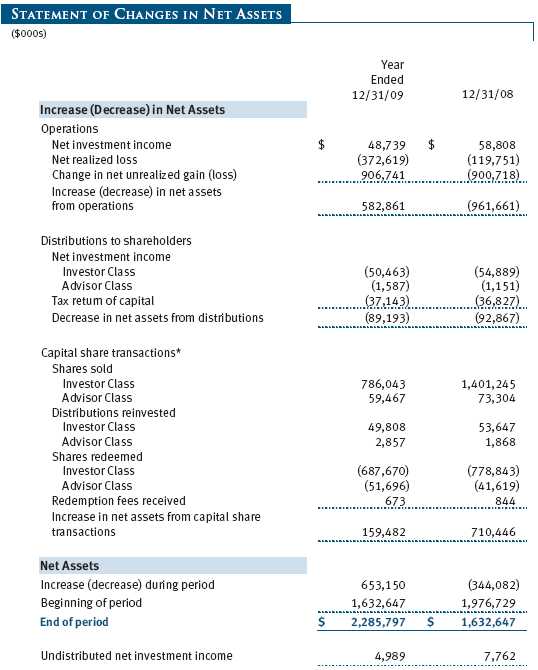
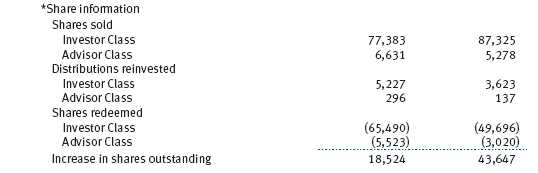
The accompanying notes are an integral part of these financial statements.
The accompanying notes are an integral part of these financial statements.

The accompanying notes are an integral part of these financial statements.
The accompanying notes are an integral part of these financial statements.
The accompanying notes are an integral part of these financial statements.
The accompanying notes are an integral part of these financial statements.
| NOTES TO FINANCIAL STATEMENTS |
T. Rowe Price Real Estate Fund, Inc. (the fund), is registered under the Investment Company Act of 1940 (the 1940 Act) as a diversified, open-end management investment company. The fund seeks to provide long-term growth through a combination of capital appreciation and current income. The fund has two classes of shares: the Real Estate Fund original share class, referred to in this report as the Investor Class, offered since October 31, 1997, and the Real Estate Fund—Advisor Class (Advisor Class), offered since December 31, 2004. Advisor Class shares are sold only through unaffiliated brokers and other unaffiliated financial intermediaries that are compensated by the class for distribution, shareholder servicing, and/or certain administrative services under a Board-approved Rule 12b-1 plan. Each class has exclusive voting rights on matters related solely to that class; separate voting rights on matters that relate to both classes; and, in all other respects, the same rights and obligations as the other class.
NOTE 1 - SIGNIFICANT ACCOUNTING POLICIES
Basis of Preparation The accompanying financial statements were prepared in accordance with accounting principles generally accepted in the United States of America (GAAP), which require the use of estimates made by fund management. Fund management believes that estimates and security valuations are appropriate; however, actual results may differ from those estimates, and the security valuations reflected in the accompanying financial statements may differ from the value ultimately realized upon sale of the securities. Further, fund management believes that no events have occurred between December 31, 2009, the date of this report, and February 25, 2010, the date of issuance of the financial statements, that require adjustment of, or disclosure in, the accompanying financial statements.
Investment Transactions, Investment Income, and Distributions Income and expenses are recorded on the accrual basis. Premiums and discounts on debt securities are amortized for financial reporting purposes. Dividends received from mutual fund investments are reflected as dividend income; capital gain distributions are reflected as realized gain/loss. Dividend income and capital gain distributions are recorded on the ex-dividend date. Income tax-related interest and penalties, if incurred, would be recorded as income tax expense. Investment transactions are accounted for on the trade date. Realized gains and losses are reported on the identified cost basis. Distributions to shareholders are recorded on the ex-dividend date. Income distributions are declared and paid by each class quarterly. Capital gain distributions, if any, are generally declared and paid by the fund, annually.
Class Accounting The Advisor Class pays distribution, shareholder servicing, and/or certain administrative expenses in the form of Rule 12b-1 fees, in an amount not exceeding 0.25% of the class’s average daily net assets. Shareholder servicing, prospectus, and shareholder report expenses incurred by each class are charged directly to the class to which they relate. Expenses common to both classes, investment income, and realized and unrealized gains and losses are allocated to the classes based upon the relative daily net assets of each class.
Rebates and Credits Subject to best execution, the fund may direct certain security trades to brokers who have agreed to rebate a portion of the related brokerage commission to the fund in cash. Commission rebates are reflected as realized gain on securities in the accompanying financial statements and totaled $45,000 for the year ended December 31, 2009. Additionally, the fund earns credits on temporarily uninvested cash balances held at the custodian, which reduce the fund’s custody charges. Custody expense in the accompanying financial statements is presented before reduction for credits, which are reflected as expenses paid indirectly.
Redemption Fees A 1% fee is assessed on redemptions of fund shares held for 90 days or less to deter short-term trading and to protect the interests of long-term shareholders. Redemption fees are withheld from proceeds that shareholders receive from the sale or exchange of fund shares. The fees are paid to the fund and are recorded as an increase to paid-in capital. The fees may cause the redemption price per share to differ from the net asset value per share.
New Accounting Pronouncement On January 1, 2009, the fund adopted new accounting guidance that requires enhanced disclosures about derivative and hedging activities, including how such activities are accounted for and their effect on financial position, performance, and cash flows. Adoption of this guidance had no impact on the fund’s net assets or results of operations.
NOTE 2 - VALUATION
The fund’s investments are reported at fair value as defined under GAAP. The fund determines the values of its assets and liabilities and computes its net asset value per share at the close of the New York Stock Exchange (NYSE), normally 4 p.m. ET, each day that the NYSE is open for business.
Valuation Methods Equity securities listed or regularly traded on a securities exchange or in the over-the-counter (OTC) market are valued at the last quoted sale price or, for certain markets, the official closing price at the time the valuations are made, except for OTC Bulletin Board securities, which are valued at the mean of the latest bid and asked prices. A security that is listed or traded on more than one exchange is valued at the quotation on the exchange determined to be the primary market for such security. Listed securities not traded on a particular day are valued at the mean of the latest bid and asked prices for domestic securities and the last quoted sale price for international securities.
Debt securities are generally traded in the OTC market. Securities with remaining maturities of one year or more at the time of acquisition are valued at prices furnished by dealers who make markets in such securities or by an independent pricing service, which considers the yield or price of bonds of comparable quality, coupon, maturity, and type, as well as prices quoted by dealers who make markets in such securities. Securities with remaining maturities of less than one year at the time of acquisition generally use amortized cost in local currency to approximate fair value. However, if amortized cost is deemed not to reflect fair value or the fund holds a significant amount of such securities with remaining maturities of more than 60 days, the securities are valued at prices furnished by dealers who make markets in such securities or by an independent pricing service.
Investments in mutual funds are valued at the mutual fund’s closing net asset value per share on the day of valuation.
Other investments, including restricted securities, and those financial instruments for which the above valuation procedures are inappropriate or are deemed not to reflect fair value are stated at fair value as determined in good faith by the T. Rowe Price Valuation Committee, established by the fund’s Board of Directors.
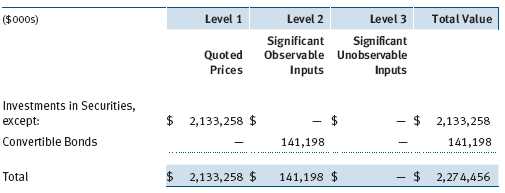
Valuation Inputs Various inputs are used to determine the value of the fund’s financial instruments. These inputs are summarized in the three broad levels listed below:
Level 1 – quoted prices in active markets for identical securities
Level 2 – observable inputs other than Level 1 quoted prices (including, but not limited to, quoted prices for similar securities, interest rates, prepayment speeds, and credit risk)
Level 3 – unobservable inputs
Observable inputs are those based on market data obtained from sources independent of the fund, and unobservable inputs reflect the fund’s own assumptions based on the best information available. The input levels are not necessarily an indication of the risk or liquidity associated with financial instruments at that level. The following table summarizes the fund’s financial instruments, based on the inputs used to determine their values on December 31, 2009:
NOTE 3 - OTHER INVESTMENT TRANSACTIONS
Consistent with its investment objective, the fund engages in the following practices to manage exposure to certain risks and/or to enhance performance. The investment objective, policies, program, and risk factors of the fund are described more fully in the fund’s prospectus and Statement of Additional Information.
Restricted Securities The fund may invest in securities that are subject to legal or contractual restrictions on resale. Prompt sale of such securities at an acceptable price may be difficult and may involve substantial delays and additional costs.
Other Purchases and sales of portfolio securities other than short-term securities aggregated $477,405,000 and $329,199,000, respectively, for the year ended December 31, 2009.
NOTE 4 - FEDERAL INCOME TAXES
No provision for federal income taxes is required since the fund intends to continue to qualify as a regulated investment company under Subchapter M of the Internal Revenue Code and distribute to shareholders all of its taxable income and gains. Distributions determined in accordance with federal income tax regulations may differ in amount or character from net investment income and realized gains for financial reporting purposes. Financial reporting records are adjusted for permanent book/tax differences to reflect tax character but are not adjusted for temporary differences.
The fund files U.S. federal, state, and local tax returns as required. The fund’s tax returns are subject to examination by the relevant tax authorities until expiration of the applicable statute of limitations, which is generally three years after filing of the tax return but could be longer in certain circumstances.
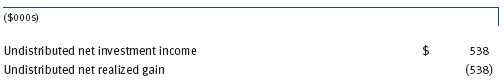
Reclassifications between income and gain relate primarily to the character of dividends received from REIT investments. For the year ended December 31, 2009, the following reclassifications were recorded to reflect tax character; there was no impact on results of operations or net assets:
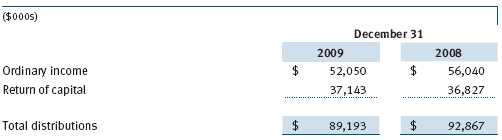
Distributions during the years ended December 31, 2009 and December 31, 2008 were characterized for tax purposes as follows:
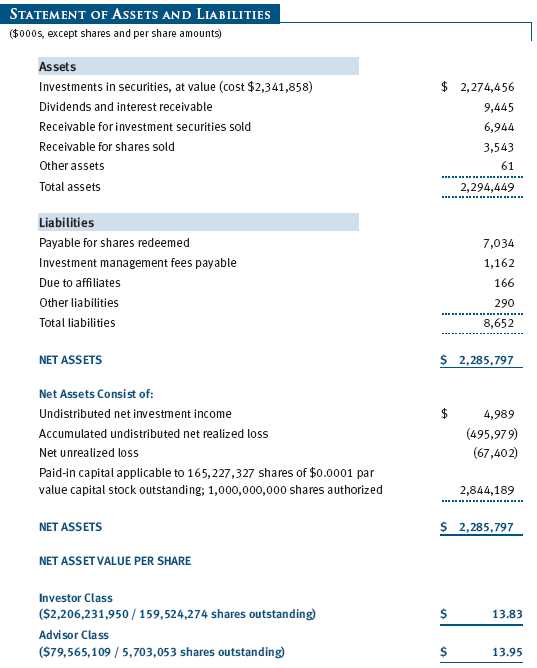
At December 31, 2009, the tax-basis cost of investments and components of net assets were as follows:

The difference between book-basis and tax-basis net unrealized appreciation (depreciation) is attributable to the deferral of losses from wash sales for tax purposes. The fund intends to retain realized gains to the extent of available capital loss carryforwards. The fund’s unused capital loss carryforwards as of December 31, 2009, expire: $64,967,000 in fiscal 2016 and $367,971,000 in fiscal 2017. Certain dividends declared by real estate investment trusts (REITs) in December and paid the following January are recognized for tax purposes in the subsequent year (REIT income deferrals), but for financial reporting purposes are included in the fund’s dividend income on ex-date.
NOTE 5 - RELATED PARTY TRANSACTIONS
The fund is managed by T. Rowe Price Associates, Inc. (the manager or Price Associates), a wholly owned subsidiary of T. Rowe Price Group, Inc. The investment management agreement between the fund and the manager provides for an annual investment management fee, which is computed daily and paid monthly. The fee consists of an individual fund fee, equal to 0.30% of the fund’s average daily net assets, and a group fee. The group fee rate is calculated based on the combined net assets of certain mutual funds sponsored by Price Associates (the group) applied to a graduated fee schedule, with rates ranging from 0.48% for the first $1 billion of assets to 0.285% for assets in excess of $220 billion. The fund’s group fee is determined by applying the group fee rate to the fund’s average daily net assets. At December 31, 2009, the effective annual group fee rate was 0.30%.
In addition, the fund has entered into service agreements with Price Associates and two wholly owned subsidiaries of Price Associates (collectively, Price). Price Associates computes the daily share prices and provides certain other administrative services to the fund. T. Rowe Price Services, Inc., provides shareholder and administrative services in its capacity as the fund’s transfer and dividend disbursing agent. T. Rowe Price Retirement Plan Services, Inc., provides subaccounting and recordkeeping services for certain retirement accounts invested in the Investor Class. For the year ended December 31, 2009, expenses incurred pursuant to these service agreements were $112,000 for Price Associates; $911,000 for T. Rowe Price Services, Inc.; and $239,000 for T. Rowe Price Retirement Plan Services, Inc. The total amount payable at period-end pursuant to these service agreements is reflected as Due to Affiliates in the accompanying financial statements.
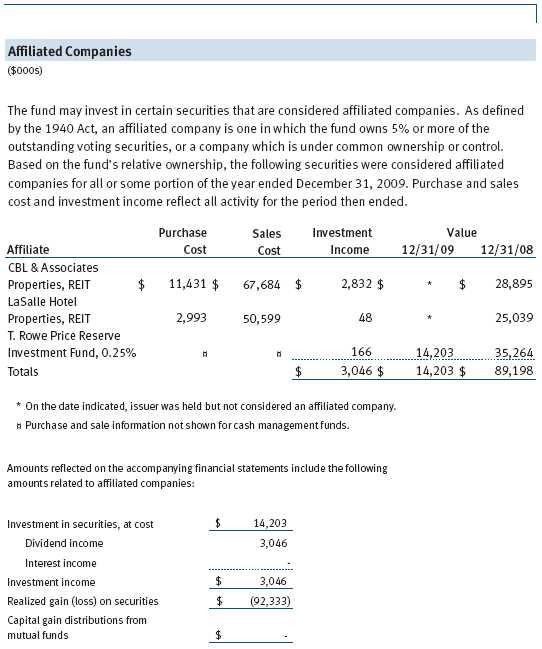
The fund may invest in the T. Rowe Price Reserve Investment Fund and the T. Rowe Price Government Reserve Investment Fund (collectively, the T. Rowe Price Reserve Investment Funds), open-end management investment companies managed by Price Associates and considered affiliates of the fund. The T. Rowe Price Reserve Investment Funds are offered as cash management options to mutual funds, trusts, and other accounts managed by Price Associates and/or its affiliates and are not available for direct purchase by members of the public. The T. Rowe Price Reserve Investment Funds pay no investment management fees.
NOTE 6 - INTERFUND BORROWING PROGRAM
Pursuant to its prospectus, the fund may borrow up to 33 1/3% of its total assets. The manager has developed a program that provides temporary liquidity under an interfund borrowing agreement between the fund and other T. Rowe Price-sponsored mutual funds. The program permits the borrowing and lending of cash at rates beneficial to both the borrowing and lending funds. Pursuant to program guidelines, loans totaling 10% or more of a borrowing fund’s total assets require collateralization at 102% of the value of the loan; loans of less than 10% are unsecured. During the year ended December 31, 2009, the fund incurred $1,000 in interest expense related to outstanding borrowings on three days in the average amount of $9,900,000 and at an average annual rate of 1.21%. At December 31, 2009, there were no borrowings outstanding.
| REPORT OF INDEPENDENT REGISTERED PUBLIC ACCOUNTING FIRM |
To the Board of Directors and Shareholders of
T. Rowe Price Real Estate Fund, Inc.
In our opinion, the accompanying statement of assets and liabilities, including the schedule of investments, and the related statements of operations and of changes in net assets and the financial highlights present fairly, in all material respects, the financial position of T. Rowe Price Real Estate Fund, Inc. (the “Fund”) at December 31, 2009, the results of its operations for the year then ended, the changes in its net assets for each of the two years in the period then ended and the financial highlights for each of the five years in the period then ended, in conformity with accounting principles generally accepted in the United States of America. These financial statements and financial highlights (hereafter referred to as “financial statements”) are the responsibility of the Fund’s management; our responsibility is to express an opinion on these financial statements based on our audits. We conducted our audits of these financial statements in accordance with the standards of the Public Company Accounting Oversight Board (United States). Those standards require that we plan and perform the audit to obtain reasonable assurance about whether the financial statements are free of material misstatement. An audit includes examining, on a test basis, evidence supporting the amounts and disclosures in the financial statements, assessing the accounting principles used and significant estimates made by management, and evaluating the overall financial statement presentation. We believe that our audits, which included confirmation of securities at December 31, 2009 by correspondence with the custodian, and confirmation of the underlying fund by correspondence with the transfer agent, provide a reasonable basis for our opinion.
PricewaterhouseCoopers LLP
Baltimore, Maryland
February 25, 2010
| TAX INFORMATION (UNAUDITED) FOR THE TAX YEAR ENDED 12/31/09 |
We are providing this information as required by the Internal Revenue Code. The amounts shown may differ from those elsewhere in this report because of differences between tax and financial reporting requirements.
The fund’s distributions to shareholders included $538,000 from short-term capital gains.
For taxable non-corporate shareholders, $273,000 of the fund’s income represents qualified dividend income subject to the 15% rate category.
For corporate shareholders, $273,000 of the fund’s income qualifies for the dividends-received deduction.
| INFORMATION ON PROXY VOTING POLICIES, PROCEDURES, AND RECORDS |
A description of the policies and procedures used by T. Rowe Price funds and portfolios to determine how to vote proxies relating to portfolio securities is available in each fund’s Statement of Additional Information, which you may request by calling 1-800-225-5132 or by accessing the SEC’s Web site, www.sec.gov. The description of our proxy voting policies and procedures is also available on our Web site, www.troweprice.com. To access it, click on the words “Our Company” at the top of our corporate homepage. Then, when the next page appears, click on the words “Proxy Voting Policies” on the left side of the page.
Each fund’s most recent annual proxy voting record is available on our Web site and through the SEC’s Web site. To access it through our Web site, follow the directions above, then click on the words “Proxy Voting Records” on the right side of the Proxy Voting Policies page.
| HOW TO OBTAIN QUARTERLY PORTFOLIO HOLDINGS |
The fund files a complete schedule of portfolio holdings with the Securities and Exchange Commission for the first and third quarters of each fiscal year on Form N-Q. The fund’s Form N-Q is available electronically on the SEC’s Web site (www.sec.gov); hard copies may be reviewed and copied at the SEC’s Public Reference Room, 450 Fifth St. N.W., Washington, DC 20549. For more information on the Public Reference Room, call 1-800-SEC-0330.
| ABOUT THE FUND’S DIRECTORS AND OFFICERS |
Your fund is governed by a Board of Directors (Board) that meets regularly to review a wide variety of matters affecting the fund, including performance, investment programs, compliance matters, advisory fees and expenses, service providers, and other business affairs. The Board elects the fund’s officers, who are listed in the final table. At least 75% of Board members are independent of T. Rowe Price Associates, Inc. (T. Rowe Price), and T. Rowe Price International, Inc. (T. Rowe Price International); “inside” or “interested” directors are employees or officers of T. Rowe Price. The business address of each director and officer is 100 East Pratt Street, Baltimore, Maryland 21202. The Statement of Additional Information includes additional information about the directors and is available without charge by calling a T. Rowe Price representative at 1-800-225-5132.
| Independent Directors | |
| |
| Name | |
| (Year of Birth) | Principal Occupation(s) During Past Five Years and Directorships of |
| Year Elected* | Other Public Companies |
| | |
| William R. Brody, M.D., Ph.D. | President and Trustee, Salk Institute for Biological Studies (2009 |
| (1944) | to present); Director, Novartis, Inc. (2009 to present); Director, IBM |
| 2009 | (2007 to present); President and Trustee, Johns Hopkins University |
| | (1996 to 2009); Chairman of Executive Committee and Trustee, |
| | Johns Hopkins Health System (1996 to 2009) |
| | |
| Jeremiah E. Casey | Director, National Life Insurance (2001 to 2005); Director, The Rouse |
| (1940) | Company, real estate developers (1990 to 2004) |
| 2005 | |
| | |
| Anthony W. Deering | Chairman, Exeter Capital, LLC, a private investment firm (2004 to |
| (1945) | present); Director, Under Armour (2008 to present); Director, Vornado |
| 2001 | Real Estate Investment Trust (2004 to present); Director, Mercantile |
| | Bankshares (2002 to 2007); Member, Advisory Board, Deutsche Bank |
| | North America (2004 to present); Director, Chairman of the Board, |
| | and Chief Executive Officer, The Rouse Company, real estate develop- |
| | ers (1997 to 2004) |
| | |
| Donald W. Dick, Jr. | Principal, EuroCapital Advisors, LLC, an acquisition and management |
| (1943) | advisory firm (1995 to present) |
| 1997 | |
| | |
| Karen N. Horn | Director, Eli Lilly and Company (1987 to present); Director, Simon |
| (1943) | Property Group (2004 to present); Director, Norfolk Southern (2008 |
| 2003 | to present); Director, Georgia Pacific (2004 to 2005) |
| | |
| Theo C. Rodgers | President, A&R Development Corporation (1977 to present) |
| (1941) | |
| 2005 | |
| John G. Schreiber | Owner/President, Centaur Capital Partners, Inc., a real estate invest- |
| (1946) | ment company (1991 to present); Partner, Blackstone Real Estate |
| 2001 | Advisors, L.P. (1992 to present) |
| | |
| Mark R. Tercek | President and Chief Executive Officer, The Nature Conservancy (2008 |
| (1957) | to present); Managing Director, The Goldman Sachs Group, Inc. |
| 2009 | (1984 to 2008) |
| |
| *Each independent director oversees 124 T. Rowe Price portfolios and serves until retirement, resignation, |
| or election of a successor. | |
| Inside Directors | |
| |
| Name | |
| (Year of Birth) | |
| Year Elected* | |
| [Number of T. Rowe Price | Principal Occupation(s) During Past Five Years and Directorships of |
| Portfolios Overseen] | Other Public Companies |
| | |
| Edward C. Bernard | Director and Vice President, T. Rowe Price; Vice Chairman of the Board, |
| (1956) | Director, and Vice President, T. Rowe Price Group, Inc.; Chairman of |
| 2006 | the Board, Director, and President, T. Rowe Price Investment Services, |
| [124] | Inc.; Chairman of the Board and Director, T. Rowe Price Global Asset |
| | Management Limited, T. Rowe Price Global Investment Services |
| | Limited, T. Rowe Price Retirement Plan Services, Inc., T. Rowe Price |
| | Savings Bank, and T. Rowe Price Services, Inc.; Director, T. Rowe Price |
| | International, Inc.; Chief Executive Officer, Chairman of the Board, |
| | Director, and President, T. Rowe Price Trust Company; Chairman of the |
| | Board, all funds |
| | |
| Brian C. Rogers, CFA, CIC | Chief Investment Officer, Director, and Vice President, T. Rowe Price; |
| (1955) | Chairman of the Board, Chief Investment Officer, Director, and Vice |
| 2006 | President, T. Rowe Price Group, Inc.; Vice President, T. Rowe Price |
| [69] | Trust Company |
| |
| *Each inside director serves until retirement, resignation, or election of a successor. |
| Officers | |
| |
| Name (Year of Birth) | |
| Position Held With Real Estate Fund | Principal Occupation(s) |
| | |
| Richard N. Clattenburg, CFA (1979) | Vice President, T. Rowe Price, T. Rowe Price |
| Vice President | Global Investment Services Limited, and T. Rowe |
| | Price Group, Inc.; formerly Financial Analyst, |
| | Goldman Sachs (to 2005) |
| | |
| Anna M. Dopkin, CFA (1967) | Vice President, T. Rowe Price, T. Rowe Price |
| Vice President | Group, Inc., and T. Rowe Price Trust Company |
| | |
| Joseph B. Fath, CPA (1971) | Vice President, T. Rowe Price and T. Rowe Price |
| Vice President | Group, Inc. |
| | |
| Roger L. Fiery III, CPA (1959) | Vice President, T. Rowe Price, T. Rowe Price |
| Vice President | Group, Inc., T. Rowe Price International, Inc., |
| | and T. Rowe Price Trust Company |
| | |
| John R. Gilner (1961) | Chief Compliance Officer and Vice President, |
| Chief Compliance Officer | T. Rowe Price; Vice President, T. Rowe Price |
| | Group, Inc., and T. Rowe Price Investment |
| | Services, Inc. |
| | |
| Gregory S. Golczewski (1966) | Vice President, T. Rowe Price and T. Rowe Price |
| Vice President | Trust Company |
| | |
| Gregory K. Hinkle, CPA (1958) | Vice President, T. Rowe Price, T. Rowe Price |
| Treasurer | Group, Inc., and T. Rowe Price Trust Company; |
| | formerly Partner, PricewaterhouseCoopers LLP |
| | (to 2007) |
| | |
| Thomas J. Huber, CFA (1966) | Vice President, T. Rowe Price, T. Rowe Price |
| Vice President | Group, Inc., and T. Rowe Price Trust Company |
| | |
| Nina P. Jones, CPA (1980) | Employee, T. Rowe Price; formerly intern, T. Rowe |
| Vice President | Price (summer 2007); Senior Associate, KPMG |
| | LLP; student, Columbia Business School |
| | |
| Michael M. Lasota (1982) | Employee, T. Rowe Price; formerly student, |
| Vice President | University of Chicago, Graduate School of |
| | Business (to 2008); associate, The Boston |
| | Consulting Group (to 2006) |
| | |
| David M. Lee, CFA (1962) | Vice President, T. Rowe Price and T. Rowe Price |
| President | Group, Inc. |
| | |
| Patricia B. Lippert (1953) | Assistant Vice President, T. Rowe Price and |
| Secretary | T. Rowe Price Investment Services, Inc. |
| | |
| Philip A. Nestico (1976) | Vice President, T. Rowe Price and T. Rowe Price |
| Vice President | Group, Inc. |
| Charles M. Ober, CFA (1950) | Vice President, T. Rowe Price and T. Rowe Price |
| Vice President | Group, Inc. |
| | |
| David Oestreicher (1967) | Director and Vice President, T. Rowe Price |
| Vice President | Investment Services, Inc., T. Rowe Price Trust |
| | Company, and T. Rowe Price Services, Inc.; Vice |
| | President, T. Rowe Price, T. Rowe Price Global |
| | Asset Management Limited, T. Rowe Price |
| | Global Investment Services Limited, T. Rowe |
| | Price Group, Inc., T. Rowe Price International, |
| | Inc., and T. Rowe Price Retirement Plan |
| | Services, Inc. |
| | |
| Theodore E. Robson, CFA (1965) | Vice President, T. Rowe Price, T. Rowe Price |
| Vice President | Group, Inc., and T. Rowe Price Trust Company |
| | |
| Deborah D. Seidel (1962) | Vice President, T. Rowe Price, T. Rowe Price |
| Vice President | Investment Services, Inc., and T. Rowe Price |
| | Services, Inc. |
| | |
| Julie L. Waples (1970) | Vice President, T. Rowe Price |
| Vice President | |
| |
| Unless otherwise noted, officers have been employees of T. Rowe Price or T. Rowe Price International for |
| at least five years. | |
Item 2. Code of Ethics.
The registrant has adopted a code of ethics, as defined in Item 2 of Form N-CSR, applicable to its principal executive officer, principal financial officer, principal accounting officer or controller, or persons performing similar functions. A copy of this code of ethics is filed as an exhibit to this Form N-CSR. No substantive amendments were approved or waivers were granted to this code of ethics during the period covered by this report.
Item 3. Audit Committee Financial Expert.
The registrant’s Board of Directors/Trustees has determined that Mr. Anthony W. Deering qualifies as an audit committee financial expert, as defined in Item 3 of Form N-CSR. Mr. Deering is considered independent for purposes of Item 3 of Form N-CSR.
Item 4. Principal Accountant Fees and Services.
(a) – (d) Aggregate fees billed to the registrant for the last two fiscal years for professional services rendered by the registrant’s principal accountant were as follows:
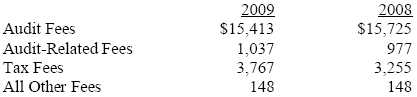
Audit fees include amounts related to the audit of the registrant’s annual financial statements and services normally provided by the accountant in connection with statutory and regulatory filings. Audit-related fees include amounts reasonably related to the performance of the audit of the registrant’s financial statements and specifically include the issuance of a report on internal controls and, if applicable, agreed-upon procedures related to fund acquisitions. Tax fees include amounts related to services for tax compliance, tax planning, and tax advice. The nature of these services specifically includes the review of distribution calculations and the preparation of Federal, state, and excise tax returns. All other fees include the registrant’s pro-rata share of amounts for agreed-upon procedures in conjunction with service contract approvals by the registrant’s Board of Directors/Trustees.
(e)(1) The registrant’s audit committee has adopted a policy whereby audit and non-audit services performed by the registrant’s principal accountant for the registrant, its investment adviser, and any entity controlling, controlled by, or under common control with the investment adviser that provides ongoing services to the registrant require pre-approval in advance at regularly scheduled audit committee meetings. If such a service is required between regularly scheduled audit committee meetings, pre-approval may be authorized by one audit committee member with ratification at the next scheduled audit committee meeting. Waiver of pre-approval for audit or non-audit services requiring fees of a de minimis amount is not permitted.
(2) No services included in (b) – (d) above were approved pursuant to paragraph (c)(7)(i)(C) of Rule 2-01 of Regulation S-X.
(f) Less than 50 percent of the hours expended on the principal accountant’s engagement to audit the registrant’s financial statements for the most recent fiscal year were attributed to work performed by persons other than the principal accountant’s full-time, permanent employees.
(g) The aggregate fees billed for the most recent fiscal year and the preceding fiscal year by the registrant’s principal accountant for non-audit services rendered to the registrant, its investment adviser, and any entity controlling, controlled by, or under common control with the investment adviser that provides ongoing services to the registrant were $1,879,000 and $1,922,000, respectively.
(h) All non-audit services rendered in (g) above were pre-approved by the registrant’s audit committee. Accordingly, these services were considered by the registrant’s audit committee in maintaining the principal accountant’s independence.
Item 5. Audit Committee of Listed Registrants.
Not applicable.
Item 6. Investments.
(a) Not applicable. The complete schedule of investments is included in Item 1 of this Form N-CSR.
(b) Not applicable.
Item 7. Disclosure of Proxy Voting Policies and Procedures for Closed-End Management Investment Companies.
Not applicable.
Item 8. Portfolio Managers of Closed-End Management Investment Companies.
Not applicable.
Item 9. Purchases of Equity Securities by Closed-End Management Investment Company and Affiliated Purchasers.
Not applicable.
Item 10. Submission of Matters to a Vote of Security Holders.
Not applicable.
Item 11. Controls and Procedures.
(a) The registrant’s principal executive officer and principal financial officer have evaluated the registrant’s disclosure controls and procedures within 90 days of this filing and have concluded that the registrant’s disclosure controls and procedures were effective, as of that date, in ensuring that information required to be disclosed by the registrant in this Form N-CSR was recorded, processed, summarized, and reported timely.
(b) The registrant’s principal executive officer and principal financial officer are aware of no change in the registrant’s internal control over financial reporting that occurred during the registrant’s second fiscal quarter covered by this report that has materially affected, or is reasonably likely to materially affect, the registrant’s internal control over financial reporting.
Item 12. Exhibits.
(a)(1) The registrant’s code of ethics pursuant to Item 2 of Form N-CSR is attached.
(2) Separate certifications by the registrant's principal executive officer and principal financial officer, pursuant to Section 302 of the Sarbanes-Oxley Act of 2002 and required by Rule 30a-2(a) under the Investment Company Act of 1940, are attached.
(3) Written solicitation to repurchase securities issued by closed-end companies: not applicable.
(b) A certification by the registrant's principal executive officer and principal financial officer, pursuant to Section 906 of the Sarbanes-Oxley Act of 2002 and required by Rule 30a-2(b) under the Investment Company Act of 1940, is attached.
| | |
SIGNATURES |
| |
| | Pursuant to the requirements of the Securities Exchange Act of 1934 and the Investment |
| Company Act of 1940, the registrant has duly caused this report to be signed on its behalf by the |
| undersigned, thereunto duly authorized. |
| |
| T. Rowe Price Real Estate Fund, Inc. |
| |
| |
| |
| By | /s/ Edward C. Bernard |
| | Edward C. Bernard |
| | Principal Executive Officer |
| |
| Date | February 25, 2010 |
| |
| |
| |
| | Pursuant to the requirements of the Securities Exchange Act of 1934 and the Investment |
| Company Act of 1940, this report has been signed below by the following persons on behalf of |
| the registrant and in the capacities and on the dates indicated. |
| |
| |
| By | /s/ Edward C. Bernard |
| | Edward C. Bernard |
| | Principal Executive Officer |
| |
| Date | February 25, 2010 |
| |
| |
| |
| By | /s/ Gregory K. Hinkle |
| | Gregory K. Hinkle |
| | Principal Financial Officer |
| |
| Date | February 25, 2010 |