| UNITED STATES |
| SECURITIES AND EXCHANGE COMMISSION |
| Washington, D.C. 20549 |
| |
FORM N-CSR |
| |
CERTIFIED SHAREHOLDER REPORT OF REGISTERED |
MANAGEMENT INVESTMENT COMPANIES |
| |
| |
| |
| Investment Company Act File Number: 811-08371 |
|
| |
| T. Rowe Price Real Estate Fund, Inc. |
|
| (Exact name of registrant as specified in charter) |
| |
| 100 East Pratt Street, Baltimore, MD 21202 |
|
| (Address of principal executive offices) |
| |
| David Oestreicher |
| 100 East Pratt Street, Baltimore, MD 21202 |
|
| (Name and address of agent for service) |
| |
| |
| Registrant’s telephone number, including area code: (410) 345-2000 |
| |
| |
| Date of fiscal year end: December 31 |
| |
| |
| Date of reporting period: June 30, 2011 |
Item 1: Report to Shareholders| Real Estate Fund | June 30, 2011 |
The views and opinions in this report were current as of June 30, 2011. They are not guarantees of performance or investment results and should not be taken as investment advice. Investment decisions reflect a variety of factors, and the managers reserve the right to change their views about individual stocks, sectors, and the markets at any time. As a result, the views expressed should not be relied upon as a forecast of the fund’s future investment intent. The report is certified under the Sarbanes-Oxley Act, which requires mutual funds and other public companies to affirm that, to the best of their knowledge, the information in their financial reports is fairly and accurately stated in all material respects.
REPORTS ON THE WEB
Sign up for our E-mail Program, and you can begin to receive updated fund reports and prospectuses online rather than through the mail. Log in to your account at troweprice.com for more information.
Manager’s Letter
Fellow Shareholders
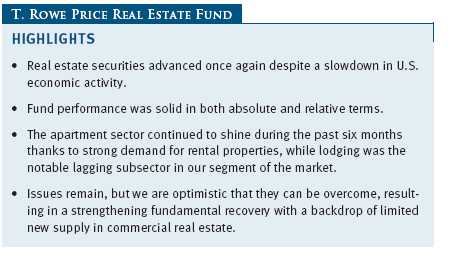
Real estate securities provided rewarding returns once again, as stocks advanced despite ongoing hesitancy in the nation’s economic recovery. Stocks in our sector appeared to be more forward-looking in performance relative to the actual underlying fundamentals, which were more tepid. Real estate investment trusts benefited from a low interest rate environment, from investors’ appetite for higher-yielding instruments, and from those seeking refuge from threats of future inflation.
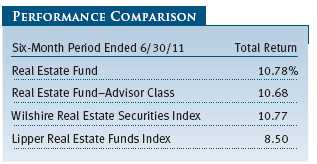
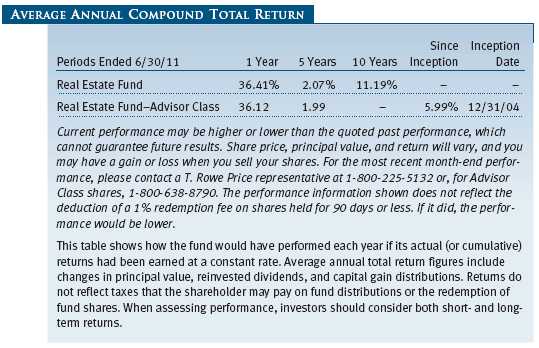
We are pleased to report that your fund’s performance was solid in both absolute and relative terms, with a return of 10.78% during the past six months. Fund results were in line with the 10.77% return of the passive Wilshire Real Estate Securities Index and well ahead of the 8.50% return for the Lipper Real Estate Funds Index of similar funds. (The returns for the Advisor Class shares were lower, reflecting their different fee structure.)
DIVIDEND DISTRIBUTION
On June 27, 2011, your fund’s Board of Directors declared a second-quarter dividend of $0.09 per share to shareholders of record on that day. The dividend was paid on June 29. This brings total dividend distributions for the year to $0.18 per share. You should have received your check or statement reflecting this most recent distribution. (Dividends for the Advisor Class were $0.08 per share, bringing total dividends for the year to $0.16 per share.)
MARKET ENVIRONMENT AND STRATEGY
Against the backdrop of a sluggish U.S. economic recovery, commercial real estate securities continued to advance during the first six months of the year, registering gains in each of the first two quarters as though disconnected from the ongoing uncertainty. A tug of war is taking place within our sector of the equities market, with the appealing influences so far overpowering the more negative factors in the market.
The major negative is restrained demand. Unemployment is high, as job creation remains disappointingly weak. Consequently, demand for our properties is subdued relative to where it normally would be at this point in a recovery. To be sure, the situation could be worse, but the uncertainty and tepid nature of the recovery to date have created hesitancy among both businesses and consumers. In many real estate subsectors, we rely on healthy economic growth to drive demand for our assets. We need more workers to fill office space, stronger consumer optimism for activity in malls, more trips to shopping centers to stimulate retail sales, more business travel to drive hotel occupancy, and so on. While demand has turned mildly positive (as can be seen in rising occupancy rates), it should be even stronger with the recession now several quarters behind us.
New supply has been virtually nonexistent and continues to hover near record lows. We continue to believe this offers hope for an extended recovery in commercial real estate down the road. Apparently, many investors feel the same way, and their forward-looking views have propelled the ongoing strength in real estate securities. Additionally, low interest rates fueled by loose monetary policy have made it easier for landlords to refinance loans, even in a tougher underwriting environment. Low interest rates have sent investors scrambling for yield, which has boosted demand for both public and private prime income-producing real estate. Fears that loose monetary policy may ultimately lead to inflationary pressures have also spurred demand for real assets that could fare well in an inflationary environment.
In many cases, appreciation in prime commercial real estate has resulted in historically low capitalization rates (cap rates) or yields. This situation may pose some valuation risk should cap rates rise. Ideally, yields would rise with steadily growing operating income as a result of healthy demand.
PORTFOLIO REVIEW
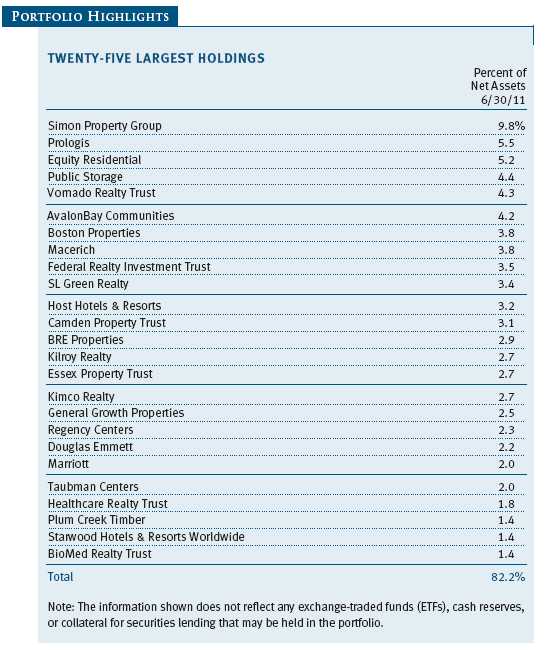
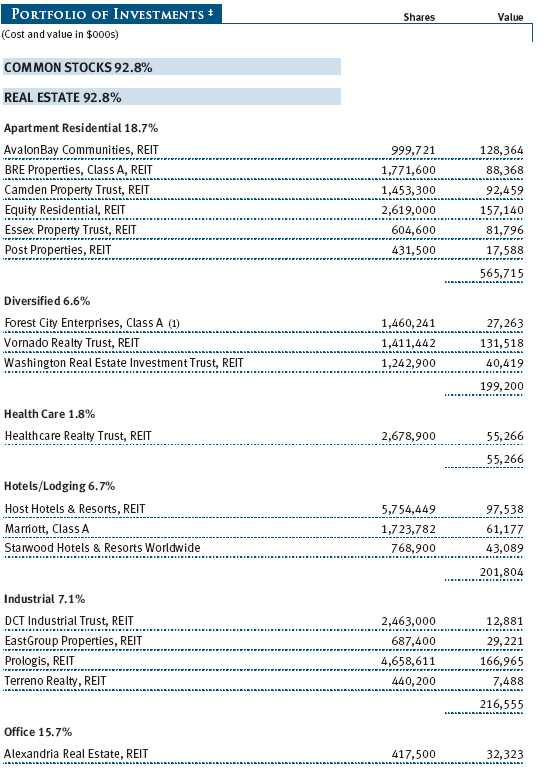
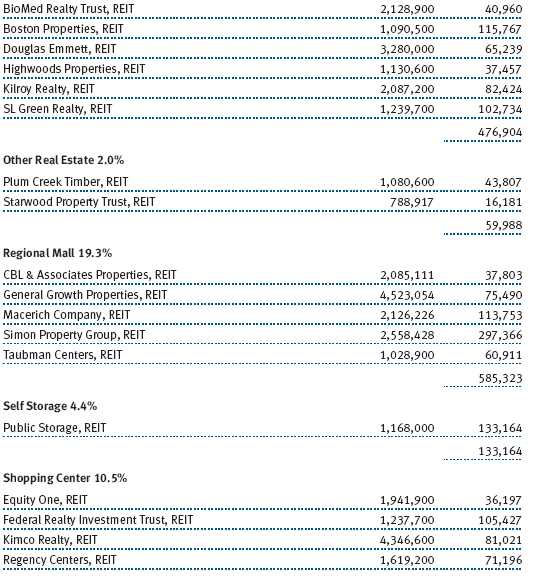
Apartment performance continued to shine during the period. Normally, apartment demand is strongly associated with job growth, but falling homeownership rates have translated into increased rental demand. Also, the luster of homeownership as a surefire winning investment appears to have disappeared, at least for now. Not unexpectedly, areas where affordability remains challenging saw resilient demand for rental properties, and Essex Property Trust and BRE Properties were bolstered by their concentrations along the West Coast. Even in the Sun Belt, where the price for homeownership is more affordable, apartment demand was surprisingly sizable and strengthened results at Camden Property Trust. (Please refer to our portfolio of investments for a complete list of holdings and the amount each represents in the portfolio.)
Infill office markets on both coasts drew heightened investor demand, thus propelling SL Green Realty with its Manhattan exposure and Douglas Emmett on the West Coast. This contrasted sharply with results at more suburban office markets where demand remained anemic. In this weak job environment, it seems that investors fear that suburban office space will be characterized as “last to fill, first to vacate.” The high-end consumer seemed to fare better during this period, and thus, too, did the high-end mall owners, with relative strength seen in our holdings of Taubman Centers and Simon Property Group.
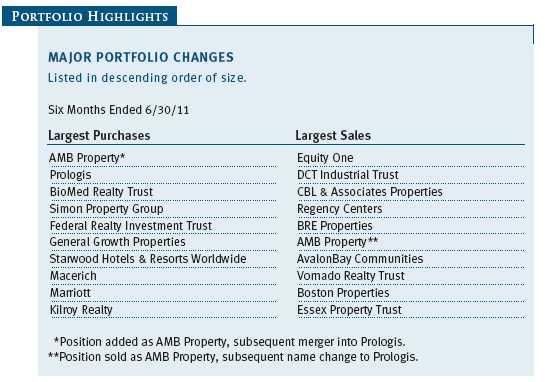
Our two large industrial portfolios, Prologis and AMB Property, combined during the period and ended as the fund’s second-largest holding. The merger offers great global potential, and we expect projected synergies to be exceeded by the new entity.

The notable lagging subsector in our portfolio was lodging. Investors soured on the prospects for a lodging recovery considering the economy’s hesitant nature, though we continued to see indications of a pickup in the area as measured by weekly revenue per available room. Consequently, we added to shares of Starwood Hotels & Resorts Worldwide and Marriott on weakness.
OUTLOOK
Job growth has been weak, and we need “jobs, jobs, jobs” to sustain growth in our sector. Other industries may find that they can cut their way to prosperity (at least for some time), but in real estate we’re largely dealing with fixed assets that can’t be “cut” and, instead, need to be occupied for true prosperity to take place. Inflation may work in our favor as owners of hard assets, but real estate might not prosper in an environment of “stagflation” marked by a combination of inflation with little economic activity.
Interest rates continue to be low, and the credit markets remain liquid, aiding refinancing by landlords. However, credit markets are still facing challenges, both from our own national debt issues and from potential contagion stemming from the debt crisis throughout the European Union. That said, we are optimistic that these near-term crises can be overcome, resulting in a strengthening fundamental recovery with a backdrop of limited new supply in commercial real estate.
We would like to thank you for your continued support and confidence.
Respectfully submitted,

David M. Lee
President of the fund and chairman of its Investment Advisory Committee
July 21, 2011
The committee chairman has day-to-day responsibility for managing the portfolio and works with committee members in developing and executing the fund’s investment program.
RISKS OF INVESTING
The fund’s share price can fall because of weakness in the stock market, a particular industry, or specific holdings. Stock markets can decline for many reasons, including adverse political or economic developments, changes in investor psychology, or heavy institutional selling. The prospects for an industry or company may deteriorate because of a variety of factors, including disappointing earnings or changes in the competitive environment. In addition, the investment manager’s assessment of companies held in a fund may prove incorrect, resulting in losses or poor performance even in rising markets.
Funds that invest only in specific industries will experience greater volatility than funds investing in a broad range of industries. Due to its concentration in the real estate industry, the fund’s share price could be more volatile than that of a fund with a broader investment mandate. Trends perceived to be unfavorable to real estate, such as changes in the tax laws or rising interest rates, could cause a decline in share prices.
GLOSSARY
Lipper indexes: Fund benchmarks that consist of a small number of the largest mutual funds in a particular category as tracked by Lipper Inc.
Price/earnings ratio (or multiple): A valuation measure calculated by dividing the price of a stock by its current or projected earnings per share. This ratio gives investors an idea of how much they are paying for current or future earnings power.
Real estate investment trusts (REITs): Publicly traded companies that own, develop, and operate apartment complexes, hotels, office buildings, and other commercial properties.
Wilshire Real Estate Securities Index: A float-adjusted, market capitalization-weighted index composed of publicly traded REITs and real estate operating companies.
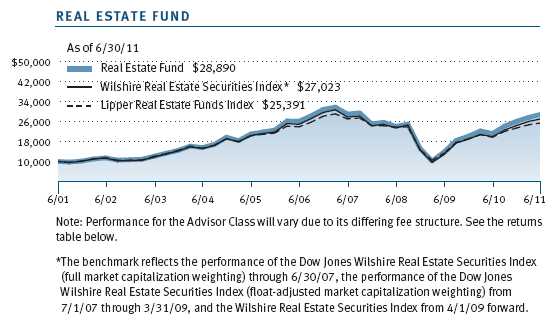
Performance and Expenses
This chart shows the value of a hypothetical $10,000 investment in the fund over the past 10 fiscal year periods or since inception (for funds lacking 10-year records). The result is compared with benchmarks, which may include a broad-based market index and a peer group average or index. Market indexes do not include expenses, which are deducted from fund returns as well as mutual fund averages and indexes.
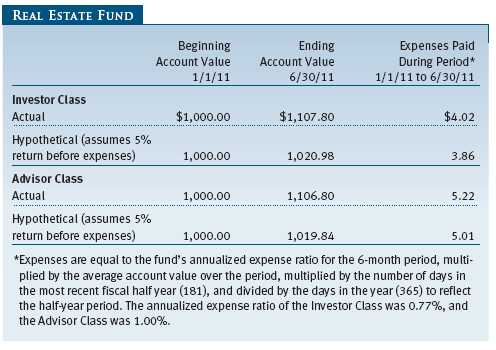
As a mutual fund shareholder, you may incur two types of costs: (1) transaction costs, such as redemption fees or sales loads, and (2) ongoing costs, including management fees, distribution and service (12b-1) fees, and other fund expenses. The following example is intended to help you understand your ongoing costs (in dollars) of investing in the fund and to compare these costs with the ongoing costs of investing in other mutual funds. The example is based on an investment of $1,000 invested at the beginning of the most recent six-month period and held for the entire period.
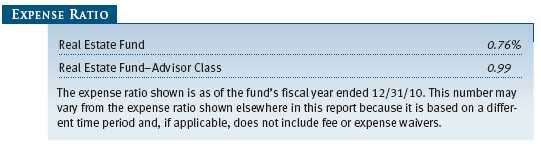
Please note that the fund has two share classes: The original share class (“investor class”) charges no distribution and service (12b-1) fee, and the Advisor Class shares are offered only through unaffiliated brokers and other financial intermediaries and charge a 0.25% 12b-1 fee. Each share class is presented separately in the table.
Actual Expenses
The first line of the following table (“Actual”) provides information about actual account values and expenses based on the fund’s actual returns. You may use the information on this line, together with your account balance, to estimate the expenses that you paid over the period. Simply divide your account value by $1,000 (for example, an $8,600 account value divided by $1,000 = 8.6), then multiply the result by the number on the first line under the heading “Expenses Paid During Period” to estimate the expenses you paid on your account during this period.
Hypothetical Example for Comparison Purposes
The information on the second line of the table (“Hypothetical”) is based on hypothetical account values and expenses derived from the fund’s actual expense ratio and an assumed 5% per year rate of return before expenses (not the fund’s actual return). You may compare the ongoing costs of investing in the fund with other funds by contrasting this 5% hypothetical example and the 5% hypothetical examples that appear in the shareholder reports of the other funds. The hypothetical account values and expenses may not be used to estimate the actual ending account balance or expenses you paid for the period.
Note: T. Rowe Price charges an annual account service fee of $20, generally for accounts with less than $10,000 ($1,000 for UGMA/UTMA). The fee is waived for any investor whose T. Rowe Price mutual fund accounts total $50,000 or more; accounts employing automatic investing; accounts electing to receive electronic delivery of account statements, transaction confirmations, and prospectuses and shareholder reports; accounts of an investor who is a T. Rowe Price Preferred Services, Personal Services, or Enhanced Personal Services client (enrollment in these programs generally requires T. Rowe Price assets of at least $100,000); and IRAs and other retirement plan accounts that utilize a prototype plan sponsored by T. Rowe Price (although a separate custodial or administrative fee may apply to such accounts). This fee is not included in the accompanying table. If you are subject to the fee, keep it in mind when you are estimating the ongoing expenses of investing in the fund and when comparing the expenses of this fund with other funds.
You should also be aware that the expenses shown in the table highlight only your ongoing costs and do not reflect any transaction costs, such as redemption fees or sales loads. Therefore, the second line of the table is useful in comparing ongoing costs only and will not help you determine the relative total costs of owning different funds. To the extent a fund charges transaction costs, however, the total cost of owning that fund is higher.
Unaudited
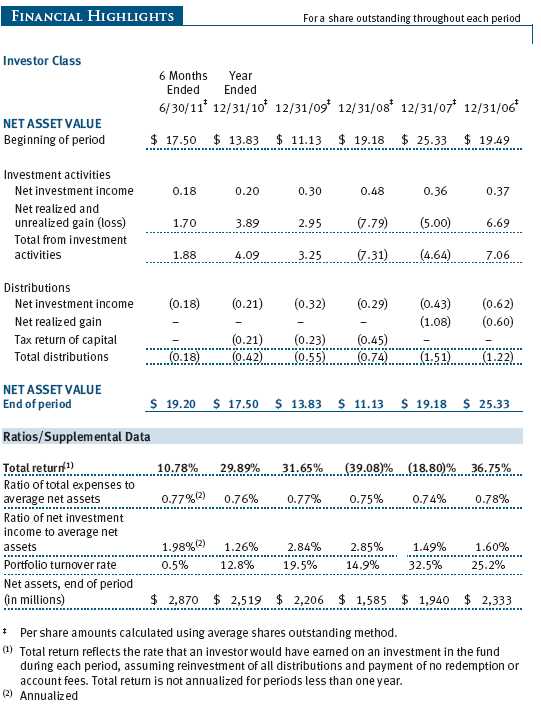
The accompanying notes are an integral part of these financial statements.
Unaudited
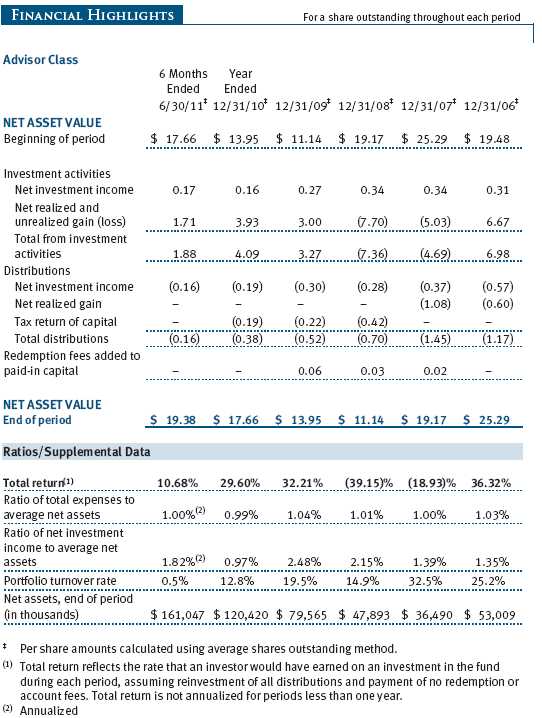
The accompanying notes are an integral part of these financial statements.
Unaudited
The accompanying notes are an integral part of these financial statements.
Unaudited
The accompanying notes are an integral part of these financial statements.
Unaudited
The accompanying notes are an integral part of these financial statements.
Unaudited
The accompanying notes are an integral part of these financial statements.
Unaudited
| NOTES TO FINANCIAL STATEMENTS |
T. Rowe Price Real Estate Fund, Inc. (the fund), is registered under the Investment Company Act of 1940 (the 1940 Act) as a diversified, open-end management investment company. The fund seeks to provide long-term growth through a combination of capital appreciation and current income. The fund has two classes of shares: the Real Estate Fund original share class, referred to in this report as the Investor Class, offered since October 31, 1997, and the Real Estate Fund—Advisor Class (Advisor Class), offered since December 31, 2004. Advisor Class shares are sold only through unaffiliated brokers and other unaffiliated financial intermediaries that are compensated by the class for distribution, shareholder servicing, and/or certain administrative services under a Board-approved Rule 12b-1 plan. Each class has exclusive voting rights on matters related solely to that class; separate voting rights on matters that relate to both classes; and, in all other respects, the same rights and obligations as the other class.
NOTE 1 - SIGNIFICANT ACCOUNTING POLICIES
Basis of Preparation The accompanying financial statements were prepared in accordance with accounting principles generally accepted in the United States of America (GAAP), which require the use of estimates made by management. Management believes that estimates and valuations are appropriate; however, actual results may differ from those estimates, and the valuations reflected in the accompanying financial statements may differ from the value ultimately realized upon sale or maturity.
Investment Transactions, Investment Income, and Distributions Income and expenses are recorded on the accrual basis. Dividends received from mutual fund investments are reflected as dividend income; capital gain distributions are reflected as realized gain/loss. Dividend income and capital gain distributions are recorded on the ex-dividend date. Income tax-related interest and penalties, if incurred, would be recorded as income tax expense. Investment transactions are accounted for on the trade date. Realized gains and losses are reported on the identified cost basis. Distributions to shareholders are recorded on the ex-dividend date. Income distributions are declared and paid by each class quarterly. Capital gain distributions, if any, are generally declared and paid by the fund annually.
Class Accounting The Advisor Class pays distribution, shareholder servicing, and/or certain administrative expenses in the form of Rule 12b-1 fees, in an amount not exceeding 0.25% of the class’s average daily net assets. Shareholder servicing, prospectus, and shareholder report expenses incurred by each class are charged directly to the class to which they relate. Expenses common to both classes, investment income, and realized and unrealized gains and losses are allocated to the classes based upon the relative daily net assets of each class.
Rebates and Credits Subject to best execution, the fund may direct certain security trades to brokers who have agreed to rebate a portion of the related brokerage commission to the fund in cash. Commission rebates are reflected as realized gain on securities in the accompanying financial statements and totaled $17,000 for the six months ended June 30, 2011. Additionally, the fund earns credits on temporarily uninvested cash balances held at the custodian, which reduce the fund’s custody charges. Custody expense in the accompanying financial statements is presented before reduction for credits.
Redemption Fees A 1% fee is assessed on redemptions of fund shares held for 90 days or less to deter short-term trading and to protect the interests of long-term shareholders. Redemption fees are withheld from proceeds that shareholders receive from the sale or exchange of fund shares. The fees are paid to the fund and are recorded as an increase to paid-in capital. The fees may cause the redemption price per share to differ from the net asset value per share.
NOTE 2 - VALUATION
The fund’s financial instruments are reported at fair value as defined by GAAP. The fund determines the values of its assets and liabilities and computes each class’s net asset value per share at the close of the New York Stock Exchange (NYSE), normally 4 p.m. ET, each day that the NYSE is open for business.
Valuation Methods Equity securities listed or regularly traded on a securities exchange or in the over-the-counter (OTC) market are valued at the last quoted sale price or, for certain markets, the official closing price at the time the valuations are made, except for OTC Bulletin Board securities, which are valued at the mean of the latest bid and asked prices. A security that is listed or traded on more than one exchange is valued at the quotation on the exchange determined to be the primary market for such security. Listed securities not traded on a particular day are valued at the mean of the latest bid and asked prices for domestic securities and the last quoted sale price for international securities.
Investments in mutual funds are valued at the mutual fund’s closing net asset value per share on the day of valuation.
Other investments, including restricted securities, and those financial instruments for which the above valuation procedures are inappropriate or are deemed not to reflect fair value are stated at fair value as determined in good faith by the T. Rowe Price Valuation Committee, established by the fund’s Board of Directors.
Valuation Inputs Various inputs are used to determine the value of the fund’s financial instruments. These inputs are summarized in the three broad levels listed below:
Level 1 – quoted prices in active markets for identical financial instruments
Level 2 – observable inputs other than Level 1 quoted prices (including, but not limited to, quoted prices for similar financial instruments, interest rates, prepayment speeds, and credit risk)
Level 3 – unobservable inputs
Observable inputs are those based on market data obtained from sources independent of the fund, and unobservable inputs reflect the fund’s own assumptions based on the best information available. The input levels are not necessarily an indication of the risk or liquidity associated with financial instruments at that level. On June 30, 2011, all of the fund’s financial instruments were classified as Level 1, based on the inputs used to determine their values.
NOTE 3 - OTHER INVESTMENT TRANSACTIONS
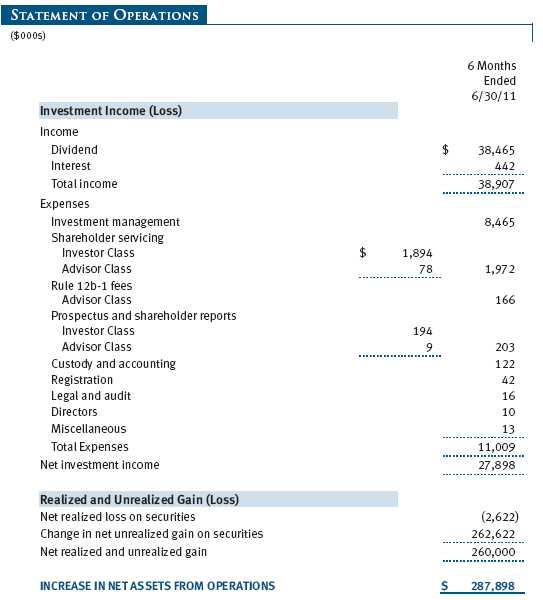
Purchases and sales of portfolio securities other than short-term securities aggregated $98,960,000 and $13,459,000, respectively, for the six months ended June 30, 2011.
NOTE 4 - FEDERAL INCOME TAXES
No provision for federal income taxes is required since the fund intends to continue to qualify as a regulated investment company under Subchapter M of the Internal Revenue Code and distribute to shareholders all of its taxable income and gains. Distributions determined in accordance with federal income tax regulations may differ in amount or character from net investment income and realized gains for financial reporting purposes. Financial reporting records are adjusted for permanent book/tax differences to reflect tax character but are not adjusted for temporary differences. The amount and character of tax-basis distributions and composition of net assets are finalized at fiscal year-end; accordingly, tax-basis balances have not been determined as of the date of this report.
In accordance with federal tax regulations, the fund recognized ordinary income and capital losses in the current period for tax purposes that had been recognized in the prior fiscal year for financial reporting purposes. Such deferrals relate to REIT dividends and net capital losses realized between November 1, 2010 and December 31, 2010, and totaled $13,109,000. The fund intends to retain realized gains to the extent of available capital loss carryforwards. As of December 31, 2010, the fund had $508,189,000 of unused capital loss carryforwards, which expire: $64,967,000 in fiscal 2016, $367,971,000 in fiscal 2017, and $75,251,000 in fiscal 2018.
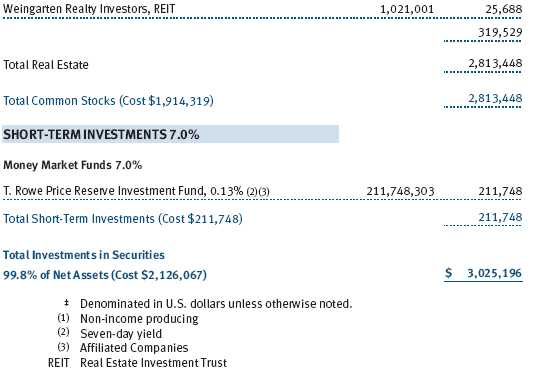
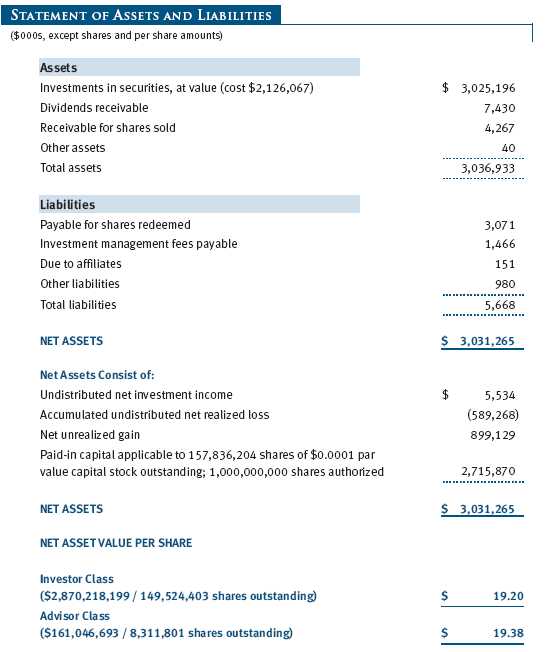
At June 30, 2011, the cost of investments for federal income tax purposes was $2,126,067,000. Net unrealized gain aggregated $899,129,000 at period-end, of which $903,932,000 related to appreciated investments and $4,803,000 related to depreciated investments.
NOTE 5 - RELATED PARTY TRANSACTIONS
The fund is managed by T. Rowe Price Associates, Inc. (Price Associates), a wholly owned subsidiary of T. Rowe Price Group, Inc. (Price Group). The investment management agreement between the fund and Price Associates provides for an annual investment management fee, which is computed daily and paid monthly. The fee consists of an individual fund fee, equal to 0.30% of the fund’s average daily net assets, and a group fee. The group fee rate is calculated based on the combined net assets of certain mutual funds sponsored by Price Associates (the group) applied to a graduated fee schedule, with rates ranging from 0.48% for the first $1 billion of assets to 0.28% for assets in excess of $300 billion. The fund’s group fee is determined by applying the group fee rate to the fund’s average daily net assets. At June 30, 2011, the effective annual group fee rate was 0.30%.
In addition, the fund has entered into service agreements with Price Associates and two wholly owned subsidiaries of Price Associates (collectively, Price). Price Associates computes the daily share prices and provides certain other administrative services to the fund. T. Rowe Price Services, Inc., provides shareholder and administrative services in its capacity as the fund’s transfer and dividend disbursing agent. T. Rowe Price Retirement Plan Services, Inc., provides subaccounting and recordkeeping services for certain retirement accounts invested in the Investor Class. For the six months ended June 30, 2011, expenses incurred pursuant to these service agreements were $84,000 for Price Associates; $630,000 for T. Rowe Price Services, Inc.; and $228,000 for T. Rowe Price Retirement Plan Services, Inc. The total amount payable at period-end pursuant to these service agreements is reflected as Due to Affiliates in the accompanying financial statements.
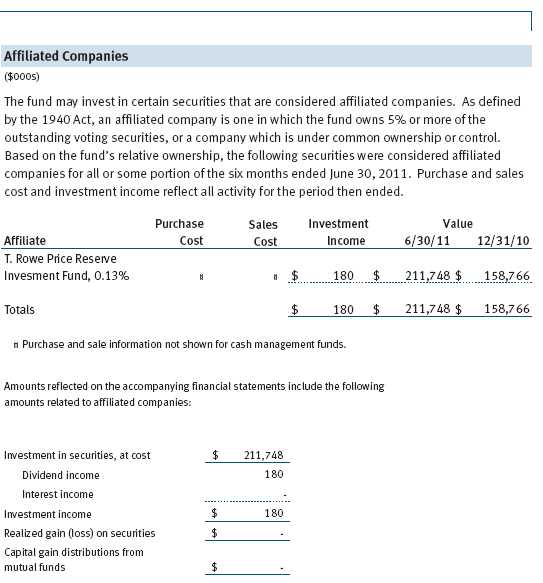
The fund may invest in the T. Rowe Price Reserve Investment Fund and the T. Rowe Price Government Reserve Investment Fund (collectively, the T. Rowe Price Reserve Investment Funds), open-end management investment companies managed by Price Associates and considered affiliates of the fund. The T. Rowe Price Reserve Investment Funds are offered as cash management options to mutual funds, trusts, and other accounts managed by Price Associates and/or its affiliates and are not available for direct purchase by members of the public. The T. Rowe Price Reserve Investment Funds pay no investment management fees.
| INFORMATION ON PROXY VOTING POLICIES, PROCEDURES, AND RECORDS |
A description of the policies and procedures used by T. Rowe Price funds and portfolios to determine how to vote proxies relating to portfolio securities is available in each fund’s Statement of Additional Information, which you may request by calling 1-800-225-5132 or by accessing the SEC’s website, sec.gov. The description of our proxy voting policies and procedures is also available on our website, troweprice.com. To access it, click on the words “Our Company” at the top of our corporate homepage. Then, when the next page appears, click on the words “Proxy Voting Policies” on the left side of the page.
Each fund’s most recent annual proxy voting record is available on our website and through the SEC’s website. To access it through our website, follow the directions above, then click on the words “Proxy Voting Records” on the right side of the Proxy Voting Policies page.
| HOW TO OBTAIN QUARTERLY PORTFOLIO HOLDINGS |
The fund files a complete schedule of portfolio holdings with the Securities and Exchange Commission for the first and third quarters of each fiscal year on Form N-Q. The fund’s Form N-Q is available electronically on the SEC’s website (sec.gov); hard copies may be reviewed and copied at the SEC’s Public Reference Room, 450 Fifth St. N.W., Washington, DC 20549. For more information on the Public Reference Room, call 1-800-SEC-0330.
| APPROVAL OF INVESTMENT MANAGEMENT AGREEMENT |
On March 9, 2011, the fund’s Board of Directors (Board) unanimously approved the continuation of the investment advisory contract (Contract) between the fund and its investment advisor, T. Rowe Price Associates, Inc. (Advisor). The Board considered a variety of factors in connection with its review of the Contract, also taking into account information provided by the Advisor during the course of the year, as discussed below:
Services Provided by the Advisor
The Board considered the nature, quality, and extent of the services provided to the fund by the Advisor. These services included, but were not limited to, management of the fund’s portfolio and a variety of related activities, as well as financial and administrative services, reporting, and communications. The Board also reviewed the background and experience of the Advisor’s senior management team and investment personnel involved in the management of the fund. The Board concluded that it was satisfied with the nature, quality, and extent of the services provided by the Advisor.
Investment Performance of the Fund
The Board reviewed the fund’s average annual total returns over the 1-, 3-, 5-, and 10-year periods, as well as the fund’s year-by-year returns, and compared these returns with a wide variety of previously agreed upon comparable performance measures and market data, including those supplied by Lipper and Morningstar, which are independent providers of mutual fund data. On the basis of this evaluation and the Board’s ongoing review of investment results, and factoring in the relative market conditions during certain of the performance periods, the Board concluded that the fund’s performance was satisfactory.
Costs, Benefits, Profits, and Economies of Scale
The Board reviewed detailed information regarding the revenues received by the Advisor under the Contract and other benefits that the Advisor (and its affiliates) may have realized from its relationship with the fund, including research received under “soft dollar” agreements and commission-sharing arrangements with broker-dealers. The Board considered that the Advisor may receive some benefit from soft-dollar arrangements pursuant to which research is received from broker-dealers that execute the applicable fund’s portfolio transactions. The Board also received information on the estimated costs incurred and profits realized by the Advisor and its affiliates from advising T. Rowe Price mutual funds, as well as estimates of the gross profits realized from managing the fund in particular. The Board concluded that the Advisor’s profits were reasonable in light of the services provided to the fund. The Board also considered whether the fund or other funds benefit under the fee levels set forth in the Contract from any economies of scale realized by the Advisor. Under the Contract, the fund pays a fee to the Advisor composed of two components—a group fee rate based on the aggregate assets of certain T. Rowe Price mutual funds (including the fund) that declines at certain asset levels and an individual fund fee rate that is assessed on the assets of the fund. The Board determined that it would be appropriate to introduce another breakpoint into the group fee rate, effective May 1, 2011, to allow fund shareholders to participate in additional economies of scale. The Board concluded that the advisory fee structure for the fund continued to provide for a reasonable sharing of benefits from any economies of scale with the fund’s investors.
Fees
The Board reviewed the fund’s management fee rate, operating expenses, and total expense ratio (for the Investor Class and Advisor Class) and compared them with fees and expenses of other comparable funds based on information and data supplied by Lipper. The information provided to the Board indicated that the fund’s management fee rate was above the median for certain groups of comparable funds but at or below the median for other groups of comparable funds. The information also indicated that the total expense ratio for both classes was below the median for comparable funds. The Board also reviewed the fee schedules for institutional accounts of the Advisor and its affiliates with similar mandates. Management provided the Board with information about the Advisor’s responsibilities and services provided to institutional account clients, which are more limited than its responsibilities for the fund and other T. Rowe Price mutual funds that it advises, and showing that the Advisor performs significant additional services and assumes greater risk for the fund and other T. Rowe Price mutual funds that it advises than it does for institutional account clients. On the basis of the information provided, the Board concluded that the fees paid by the fund under the Contract were reasonable.
Approval of the Contract
As noted, the Board approved the continuation of the Contract. No single factor was considered in isolation or to be determinative to the decision. Rather, the Board was assisted by the advice of independent legal counsel and concluded, in light of a weighting and balancing of all factors considered, that it was in the best interests of the fund to approve the continuation of the Contract (including the fees to be charged for services thereunder).
Item 2. Code of Ethics.
A code of ethics, as defined in Item 2 of Form N-CSR, applicable to its principal executive officer, principal financial officer, principal accounting officer or controller, or persons performing similar functions is filed as an exhibit to the registrant’s annual Form N-CSR. No substantive amendments were approved or waivers were granted to this code of ethics during the registrant’s most recent fiscal half-year.
Item 3. Audit Committee Financial Expert.
Disclosure required in registrant’s annual Form N-CSR.
Item 4. Principal Accountant Fees and Services.
Disclosure required in registrant’s annual Form N-CSR.
Item 5. Audit Committee of Listed Registrants.
Not applicable.
Item 6. Investments.
(a) Not applicable. The complete schedule of investments is included in Item 1 of this Form N-CSR.
(b) Not applicable.
Item 7. Disclosure of Proxy Voting Policies and Procedures for Closed-End Management Investment Companies.
Not applicable.
Item 8. Portfolio Managers of Closed-End Management Investment Companies.
Not applicable.
Item 9. Purchases of Equity Securities by Closed-End Management Investment Company and Affiliated Purchasers.
Not applicable.
Item 10. Submission of Matters to a Vote of Security Holders.
Not applicable.
Item 11. Controls and Procedures.
(a) The registrant’s principal executive officer and principal financial officer have evaluated the registrant’s disclosure controls and procedures within 90 days of this filing and have concluded that the registrant’s disclosure controls and procedures were effective, as of that date, in ensuring that information required to be disclosed by the registrant in this Form N-CSR was recorded, processed, summarized, and reported timely.
(b) The registrant’s principal executive officer and principal financial officer are aware of no change in the registrant’s internal control over financial reporting that occurred during the registrant’s second fiscal quarter covered by this report that has materially affected, or is reasonably likely to materially affect, the registrant’s internal control over financial reporting.
Item 12. Exhibits.
(a)(1) The registrant’s code of ethics pursuant to Item 2 of Form N-CSR is filed with the registrant’s annual Form N-CSR.
(2) Separate certifications by the registrant's principal executive officer and principal financial officer, pursuant to Section 302 of the Sarbanes-Oxley Act of 2002 and required by Rule 30a-2(a) under the Investment Company Act of 1940, are attached.
(3) Written solicitation to repurchase securities issued by closed-end companies: not applicable.
(b) A certification by the registrant's principal executive officer and principal financial officer, pursuant to Section 906 of the Sarbanes-Oxley Act of 2002 and required by Rule 30a-2(b) under the Investment Company Act of 1940, is attached.
| | |
SIGNATURES |
| |
| | Pursuant to the requirements of the Securities Exchange Act of 1934 and the Investment |
| Company Act of 1940, the registrant has duly caused this report to be signed on its behalf by the |
| undersigned, thereunto duly authorized. |
| |
| T. Rowe Price Real Estate Fund, Inc. |
| |
| |
| |
| By | /s/ Edward C. Bernard |
| | Edward C. Bernard |
| | Principal Executive Officer |
| |
| Date | August 17, 2011 |
| |
| |
| |
| | Pursuant to the requirements of the Securities Exchange Act of 1934 and the Investment |
| Company Act of 1940, this report has been signed below by the following persons on behalf of |
| the registrant and in the capacities and on the dates indicated. |
| |
| |
| By | /s/ Edward C. Bernard |
| | Edward C. Bernard |
| | Principal Executive Officer |
| |
| Date | August 17, 2011 |
| |
| |
| |
| By | /s/ Gregory K. Hinkle |
| | Gregory K. Hinkle |
| | Principal Financial Officer |
| |
| Date | August 17, 2011 |