| UNITED STATES |
| SECURITIES AND EXCHANGE COMMISSION |
| Washington, D.C. 20549 |
| |
| FORM N-CSR |
| |
| CERTIFIED SHAREHOLDER REPORT OF REGISTERED |
| MANAGEMENT INVESTMENT COMPANIES |
| |
| |
| |
| Investment Company Act File Number: 811-08371 |
| |
| T. Rowe Price Real Estate Fund, Inc. |
|
| (Exact name of registrant as specified in charter) |
| |
| 100 East Pratt Street, Baltimore, MD 21202 |
|
| (Address of principal executive offices) |
| |
| David Oestreicher |
| 100 East Pratt Street, Baltimore, MD 21202 |
|
| (Name and address of agent for service) |
| |
| |
| Registrant’s telephone number, including area code: (410) 345-2000 |
| |
| |
| Date of fiscal year end: December 31 |
| |
| |
| Date of reporting period: December 31, 2016 |
Item 1. Report to Shareholders
| Real Estate Fund | December 31, 2016 |

The views and opinions in this report were current as of December 31, 2016. They are not guarantees of performance or investment results and should not be taken as investment advice. Investment decisions reflect a variety of factors, and the managers reserve the right to change their views about individual stocks, sectors, and the markets at any time. As a result, the views expressed should not be relied upon as a forecast of the fund’s future investment intent. The report is certified under the Sarbanes-Oxley Act, which requires mutual funds and other public companies to affirm that, to the best of their knowledge, the information in their financial reports is fairly and accurately stated in all material respects.
REPORTS ON THE WEB
Sign up for our Email Program, and you can begin to receive updated fund reports and prospectuses online rather than through the mail. Log in to your account at troweprice.com for more information.
Manager’s Letter
Fellow Shareholders
Real estate securities as well as other income-oriented investments were under pressure during the second half of 2016 as long-term interest rates moved sharply higher. Long-term rates continued to climb following the unexpected electoral victory of Donald Trump to become the 45th president of the United States. However, investor sentiment improved as the markets seemed to look optimistically toward a more pro-growth business environment, which served to offset some of the rate increase pressure. Despite the negative second-half returns, full-year returns for real estate securities remained positive for the eighth consecutive year.
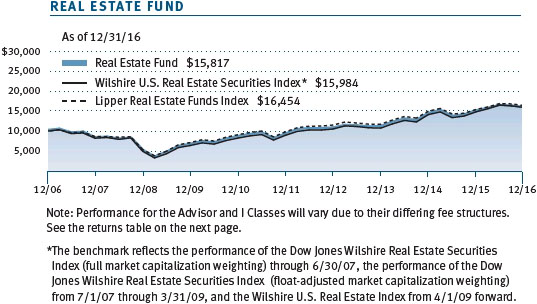
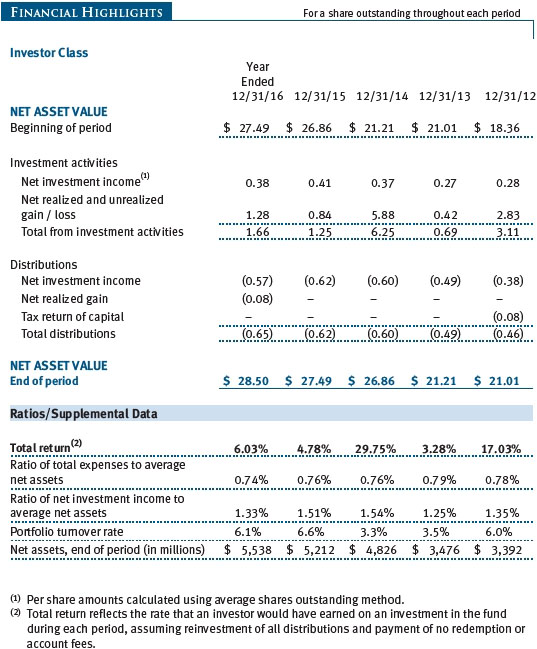
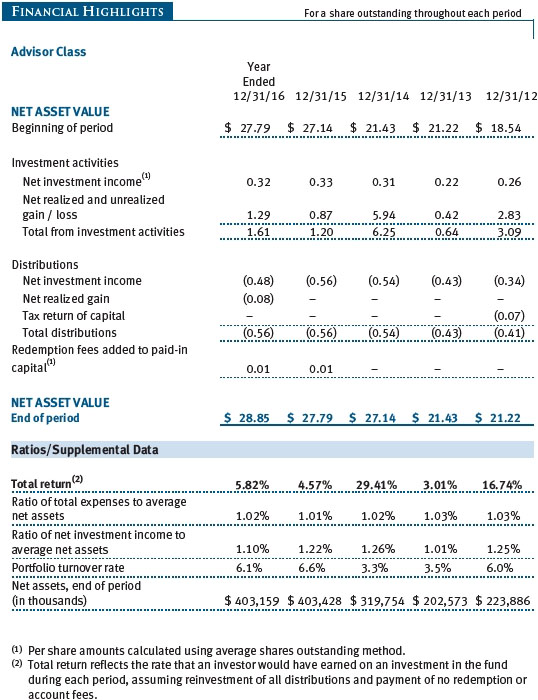
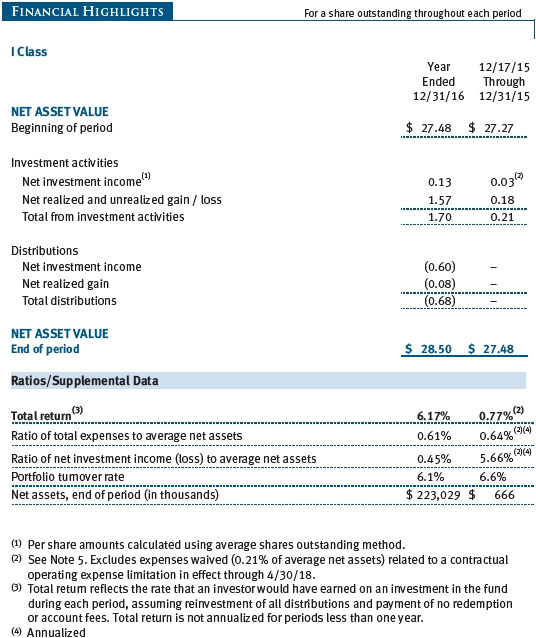
For the 12 months ended December 31, 2016, the Real Estate Fund gained 6.03% while the Wilshire U.S. Real Estate Securities Index returned 7.62% and the Lipper Real Estate Funds Index advanced 6.48%. During the second half of the year, the Real Estate Fund returned -2.81%, which outperformed our benchmark and the Lipper peer group. (The returns for Advisor and I Class shares vary, reflecting their different fee structures.)

Your fund compared favorably versus its peer group during longer time periods. Lipper ranked the Real Estate Fund in the top quartile among real estate funds for the three- and five-year periods ended December 31, 2016. (Based on cumulative total return, Lipper ranked the fund 140 of 267, 56 of 235, 37 of 210, and 51 of 133 funds for the 1-, 3-, 5-, and 10-year periods ended December 31, 2016, respectively. Past performance cannot guarantee future results.)
DIVIDEND DISTRIBUTION
On December 12, 2016, your fund’s Board of Directors declared a fourth-quarter dividend of $0.22 per share to shareholders of record on that day, which was paid on December 14. You should have received your check or statement reflecting this distribution. This brings total distributions for the year to $0.65 per share. (Advisor Class distributions were $0.19 per share in the fourth quarter and $0.56 for the year, while I Class distributions totaled $0.22 and $0.68 for the respective periods.)
MARKET ENVIRONMENT AND STRATEGY
Donald Trump’s unexpected victory highlighted the extraordinary backdrop for investors during the second half of 2016. While the broader indices reached new all-time highs following the election, investors in real estate investment trusts (REITs) experienced negative returns during both quarters of the second-half period. However, first-half gains were sufficiently strong to result in a positive return for the full year. Calendar year results have been positive for shareholders since 2009, reflecting the extended duration of the recovery.
While the Federal Reserve began the year with the thought of multiple interest rate hikes, the persistence of macroeconomic uncertainty and tepid global growth held the central bank in check until after the election. While job growth remained positive and unemployment remained low, productivity and wage growth were less impressive. Early concerns of slowing global growth, highlighted by continuing concerns about China, lingered into the second half of the year with the surprise result of the UK “Brexit” referendum injecting further uncertainty into recovery projections.
In the U.S., divisive politicking remained the norm at all levels of government, and wide-scale partisan bitterness continued even after the elections. The voting resulted in Republican control of the presidency as well as the House and Senate, thus offering the prospects for alignment of the executive and legislative branches of government beginning in 2017. This party alignment increased the probability of passing legislation that could circumvent partisan gridlock, which has characterized D.C. in recent years. Overall, broader U.S. equity markets rallied as confidence increased among consumers and businesses, and investors seemed to embrace the prospects for change on several fronts, including fiscal stimulus, tax reform, and a pro-growth business agenda with lessened regulatory oversight.
Assuming such reforms are enacted, as with most investments, the spending will be upfront and the return on investment (if any) measured after. Such upfront spending could increase the deficit, at least initially, and increase inflationary pressures in materials and labor. Higher expectations for growth, deficits, and inflation have often led to rising interest rates, and such was the case during the second half of the year. Following the election, interest rates at the long end of the yield curve began to move swiftly higher, placing pressure on bonds and other yielding investments, including utilities and REITs. The shift in yields was relatively dramatic in a short time period, though interest rates still remained low in historical terms; the yields of many bonds ended the year roughly where they started. We have remained of the opinion that REITs could prosper even in a gradual rising rate environment as long as any such increases progress at a moderate pace. However, the movement this period proved too sudden for the markets and resulted in broad REIT corrections.
Turning specifically to the environment for real estate securities during the period, we note the exceptionally strong performance of lodging stocks. Such strength reflected the prospects for better economic growth and/or greater inflation. Hotels are able to change room rates overnight and thus are viewed as having the fastest repricing responses. Self-storage properties too have short lease periods, but fears regarding potential oversupply weighed heavier on the stocks this period.
Also experiencing weakness in the second half were retail investments in shopping centers and malls. Online sales continue to grow, resulting in lower traffic at traditional brick and mortar locations. That said, we remain of the view that prime shopping locations will remain appealing to consumers and retailers. It is in the prime locations that retailers are least likely to close stores and where landlords are most likely to find replacements in the event of store closures. In the past, we have seen a more bifurcated performance between the better and lesser locations, but this period seemed overwhelmed by negative retailer headlines such that all quality levels were punished in the markets. On a fundamental level, however, we note that actual store closings were disproportionately found outside the high-quality portfolios in which we have invested.
While e-commerce presented a headwind to retailers, it offered a tailwind to logistics companies. Distribution properties within the industrial category continued to benefit from growth in online commerce. We have continued to focus our investments on warehouse locations that are in closer proximity to end users, with a better opportunity to play a role in the logistics of “last mile” delivery.
Apartment results were mixed during the year, as new supply caused some investors to worry about markets that had been performing exceptionally well, particularly the coastal markets that have recently experienced an unusual uptick in supply. We note that the new supply is in response to strong demand in these locations. We remain optimistic regarding the long-term prospects for high-barrier apartment locations and contemplate that higher interest rates could favor the prospects for renting over buying a home.
Rising interest rates led to weaker performance in more bond-like REITs (sometimes referred to as “triple-net”) that we have largely sought to avoid in our portfolio. This aided the fund’s relative returns during the second half. Also aiding the fund was our continued underweight in healthcare REITs, which were also negatively impacted by their more bond-like characteristics as well as uncertainty related to the impact of a possible repeal of the Affordable Care Act.
Lastly, our lack of exposure to data centers detracted from the fund’s relative results in 2016. There is no doubt that data centers have seen an increase in demand as a result of increased use of technology and cloud computing. That said, we have seen a strong supply response to this demand and note that substantial capital expenditures are spent equipping these data centers relative to the amount spent on the actual land and building construction. As such, we are not yet comfortable with the “margin of safety” for the real estate in these investments as we have seen large write-offs taken on some unsuccessful projects.
PORTFOLIO REVIEW
As mentioned previously, the intense growth in online sales and e-commerce is having a dramatic impact on retailers and various forms of real estate. Failed retailers have exited the business while weaker retailers have downsized their store count. These store closings have generated many negative headlines and understandable concerns for retail landlords. Fortunately, the actual impact to date has been relatively small for our better retail locations. Indeed, several of our portfolio companies have bid to reclaim valuable space from weaker tenants within their portfolio with the intention of replacing them with stronger tenants generating greater traffic from consumers.

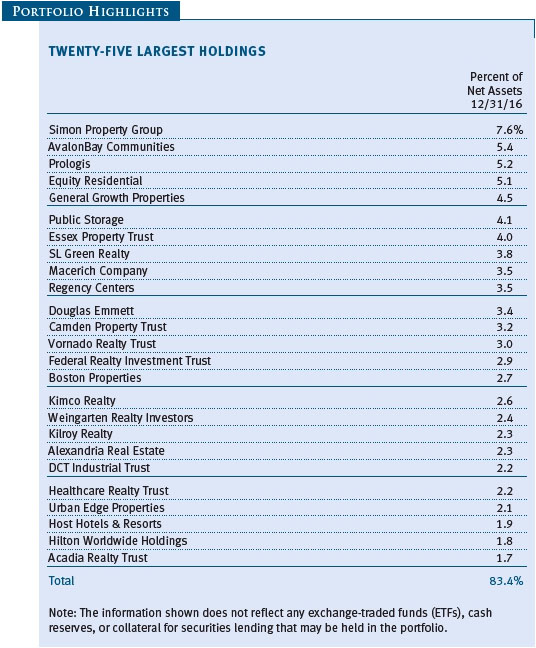
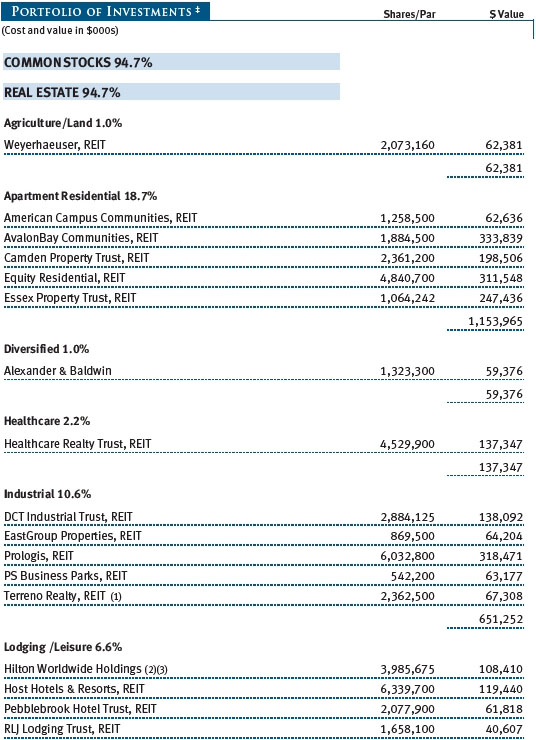
Despite the relatively benign impact to date, our retail holdings suffered nonetheless from anxious investors causing weakness in the stocks. We added to positions such as Macerich Company, General Growth Properties, and Regency Centers, though we acknowledge that the cloud of uncertainty in retailing could remain for an extended period of time. Meanwhile, our industrial properties continued to thrive from e-commerce demand, and investors drove these stocks significantly higher during the year. Even as we trimmed positions and took profits on strength in names including DCT Industrial Trust and Prologis, we remained overweight the category. (Please refer to the fund’s portfolio of investments for a complete list of holdings and the amount each represents in the portfolio.)
Our largest sale this period involved trimming our position in PS Business Parks, which had very strong performance for the year. The successful CEO of PS Business Parks, whom we have known and respected for many years, has moved on to become an executive at Public Storage, where we have recently increased our holdings.
We significantly increased our holdings in the apartment sector as we remain bullish on the long-term prospects for the assets. Indeed, recent weakness in the names appeared to us to be more about a slowing of the rental growth from an unsustainable pace to levels that we still view as healthy. We added to Equity Residential, AvalonBay Communities, and Camden Property Trust. Our apartment weighting increased overall despite the elimination of Post Properties, which was a longtime holding that has been acquired by another public REIT.
Within the “diversified” real estate category, we continued to add to our holdings in Alexander & Baldwin (ALEX) as we remain pleased with management’s strategic initiatives. The company is among the top five private landowners in Hawaii. In recent years, ALEX has undertaken a series of major strategic steps that we applaud, including separating the real estate business from the cargo shipping business, redirecting proceeds from mainland assets back to Hawaiian investments, discontinuing the volatile sugar cultivation business, and the ongoing evaluation of the appropriateness of conversion to a REIT structure. This brings up an interesting point—the fund owns the company because of its real estate holdings, not because of its tax structure. We own it currently as a C corporation, and, all else being equal, we would expect to continue to own it as a REIT. Our point is that with the discussion of potential tax reforms under the new administration, we don’t anticipate radical changes to our positions based on tax law changes, though we would expect our portfolio companies to continuously analyze and optimize their tax structures in the interests of shareholders.
OUTLOOK
While the picture is clearer in terms of the election results, the outlook remains uncertain as to specific proposals that will ultimately become law. While the same party now controls both the White House and Congress, there were significant policy differences that were expressed during the election campaigns. The economy has already been in a long recovery period, though many argue that the trajectory of this recovery has been disappointing. Perhaps partisan legislative gridlock hindered the recovery, and that now appears to be one less obstacle to better growth. That said, if the solutions were obvious and simple, then they would have already been implemented. New ideas will now be attempted, but the budget deficit will continue to pose a challenge to any proposed legislative action.
Still, we are optimistic that a pro-business environment may lead to stronger economic growth and to continued demand for our investments. This may bring with it inflationary pressures and higher interest rates. If demand is sufficient that landlords can raise rents, then a modest pace of rising rates may be offset, and historically real estate has been viewed favorably as an asset class during inflationary periods. While we are eager to see what changes will come with the new administration, we are not changing our emphasis upon fundamental research and bottom-up stock picking.
We would like to thank you for your continued support and confidence.
Respectfully submitted,

David M. Lee
President of the fund and chairman of its Investment Advisory Committee
January 27, 2017
The committee chairman has day-to-day responsibility for managing the portfolio and works with committee members in developing and executing the fund’s investment program.
RISKS OF INVESTING
The fund’s share price can fall because of weakness in the stock market, a particular industry, or specific holdings. Stock markets can decline for many reasons, including adverse political or economic developments, changes in investor psychology, or heavy institutional selling. The prospects for an industry or company may deteriorate because of a variety of factors, including disappointing earnings or changes in the competitive environment. In addition, the investment manager’s assessment of companies held in a fund may prove incorrect, resulting in losses or poor performance even in rising markets.
Funds that invest only in specific industries will experience greater volatility than funds investing in a broad range of industries. Due to its concentration in the real estate industry, the fund’s share price could be more volatile than that of a fund with a broader investment mandate. Trends perceived to be unfavorable to real estate, such as changes in the tax laws or rising interest rates, could cause a decline in share prices.
GLOSSARY
Lipper indexes: Fund benchmarks that consist of a small number of the largest mutual funds in a particular category as tracked by Lipper Inc.
Price/earnings ratio (or multiple): A valuation measure calculated by dividing the price of a stock by its current or projected earnings per share. This ratio gives investors an idea of how much they are paying for current or future earnings power.
Real estate investment trusts (REITs): Publicly traded companies that own, develop, and operate apartment complexes, hotels, office buildings, and other commercial properties.
Wilshire U.S. Real Estate Securities Index: A float-adjusted, market capitalization-weighted index composed of publicly traded REITs and real estate operating companies.

Performance and Expenses
This chart shows the value of a hypothetical $10,000 investment in the fund over the past 10 fiscal year periods or since inception (for funds lacking 10-year records). The result is compared with benchmarks, which may include a broad-based market index and a peer group average or index. Market indexes do not include expenses, which are deducted from fund returns as well as mutual fund averages and indexes.

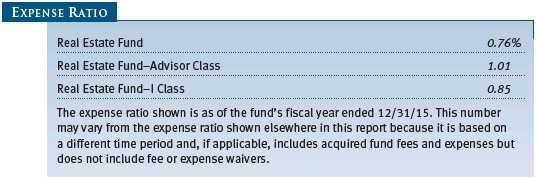
As a mutual fund shareholder, you may incur two types of costs: (1) transaction costs, such as redemption fees or sales loads, and (2) ongoing costs, including management fees, distribution and service (12b-1) fees, and other fund expenses. The following example is intended to help you understand your ongoing costs (in dollars) of investing in the fund and to compare these costs with the ongoing costs of investing in other mutual funds. The example is based on an investment of $1,000 invested at the beginning of the most recent six-month period and held for the entire period.
Please note that the fund has three share classes: The original share class (Investor Class) charges no distribution and service (12b-1) fee, the Advisor Class shares are offered only through unaffiliated brokers and other financial intermediaries and charge a 0.25% 12b-1 fee, and I Class shares are available to institutionally oriented clients and impose no 12b-1 or administrative fee payment. Each share class is presented separately in the table.
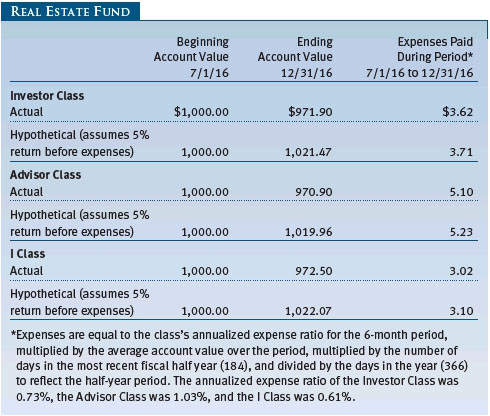
Actual Expenses
The first line of the following table (Actual) provides information about actual account values and expenses based on the fund’s actual returns. You may use the information on this line, together with your account balance, to estimate the expenses that you paid over the period. Simply divide your account value by $1,000 (for example, an $8,600 account value divided by $1,000 = 8.6), then multiply the result by the number on the first line under the heading “Expenses Paid During Period” to estimate the expenses you paid on your account during this period.
Hypothetical Example for Comparison Purposes
The information on the second line of the table (Hypothetical) is based on hypothetical account values and expenses derived from the fund’s actual expense ratio and an assumed 5% per year rate of return before expenses (not the fund’s actual return). You may compare the ongoing costs of investing in the fund with other funds by contrasting this 5% hypothetical example and the 5% hypothetical examples that appear in the shareholder reports of the other funds. The hypothetical account values and expenses may not be used to estimate the actual ending account balance or expenses you paid for the period.
Note: T. Rowe Price charges an annual account service fee of $20, generally for accounts with less than $10,000. The fee is waived for any investor whose T. Rowe Price mutual fund accounts total $50,000 or more; accounts electing to receive electronic delivery of account statements, transaction confirmations, prospectuses, and shareholder reports; or accounts of an investor who is a T. Rowe Price Preferred Services, Personal Services, or Enhanced Personal Services client (enrollment in these programs generally requires T. Rowe Price assets of at least $100,000). This fee is not included in the accompanying table. If you are subject to the fee, keep it in mind when you are estimating the ongoing expenses of investing in the fund and when comparing the expenses of this fund with other funds.
You should also be aware that the expenses shown in the table highlight only your ongoing costs and do not reflect any transaction costs, such as redemption fees or sales loads. Therefore, the second line of the table is useful in comparing ongoing costs only and will not help you determine the relative total costs of owning different funds. To the extent a fund charges transaction costs, however, the total cost of owning that fund is higher.
The accompanying notes are an integral part of these financial statements.
The accompanying notes are an integral part of these financial statements.
The accompanying notes are an integral part of these financial statements.


The accompanying notes are an integral part of these financial statements.

The accompanying notes are an integral part of these financial statements.

The accompanying notes are an integral part of these financial statements.


The accompanying notes are an integral part of these financial statements.
| Notes to Financial Statements |
T. Rowe Price Real Estate Fund, Inc. (the fund), is registered under the Investment Company Act of 1940 (the 1940 Act) as a diversified, open-end management investment company. The fund seeks to provide long-term growth through a combination of capital appreciation and current income. The fund has three classes of shares: the Real Estate Fund (Investor Class), the Real Estate Fund–Advisor Class (Advisor Class), and the Real Estate Fund–I Class (I Class). Advisor Class shares are sold only through unaffiliated brokers and other unaffiliated financial intermediaries. I Class shares generally are available only to investors meeting a $1,000,000 minimum investment or certain other criteria. The Advisor Class operates under a Board-approved Rule 12b-1 plan pursuant to which the class compensates financial intermediaries for distribution, shareholder servicing, and/or certain administrative services; the Investor and I Classes do not pay Rule 12b-1 fees. Each class has exclusive voting rights on matters related solely to that class; separate voting rights on matters that relate to all classes; and, in all other respects, the same rights and obligations as the other classes.
NOTE 1 - SIGNIFICANT ACCOUNTING POLICIES
Basis of Preparation The fund is an investment company and follows accounting and reporting guidance in the Financial Accounting Standards Board (FASB) Accounting Standards Codification Topic 946 (ASC 946). The accompanying financial statements were prepared in accordance with accounting principles generally accepted in the United States of America (GAAP), including, but not limited to, ASC 946. GAAP requires the use of estimates made by management. Management believes that estimates and valuations are appropriate; however, actual results may differ from those estimates, and the valuations reflected in the accompanying financial statements may differ from the value ultimately realized upon sale or maturity.
Investment Transactions, Investment Income, and Distributions Income and expenses are recorded on the accrual basis. Premiums and discounts on debt securities are amortized for financial reporting purposes. Dividends received from mutual fund investments are reflected as dividend income; capital gain distributions are reflected as realized gain/loss. Dividend income and capital gain distributions are recorded on the ex-dividend date. Income tax-related interest and penalties, if incurred, would be recorded as income tax expense. Investment transactions are accounted for on the trade date. Realized gains and losses are reported on the identified cost basis. Distributions from REITs are initially recorded as dividend income and, to the extent such represent a return of capital or capital gain for tax purposes, are reclassified when such information becomes available. Income distributions are declared and paid by each class quarterly. Distributions to shareholders are recorded on the ex-dividend date. Capital gain distributions are generally declared and paid by the fund annually.
Class Accounting Shareholder servicing, prospectus, and shareholder report expenses incurred by each class are charged directly to the class to which they relate. Expenses common to all classes, investment income, and realized and unrealized gains and losses are allocated to the classes based upon the relative daily net assets of each class. The Advisor Class pays Rule 12b-1 fees, in an amount not exceeding 0.25% of the class’s average daily net assets.
Rebates Subject to best execution, the fund may direct certain security trades to brokers who have agreed to rebate a portion of the related brokerage commission to the fund in cash. Commission rebates are reflected as realized gain on securities in the accompanying financial statements and totaled $31,000 for the year ended December 31, 2016.
Redemption Fees A 1% fee is assessed on redemptions of fund shares held for 90 days or less to deter short-term trading and to protect the interests of long-term shareholders. Redemption fees are withheld from proceeds that shareholders receive from the sale or exchange of fund shares. The fees are paid to the fund and are recorded as an increase to paid-in capital. The fees may cause the redemption price per share to differ from the net asset value per share.
New Accounting Guidance In October 2016, the Securities and Exchange Commission (SEC) issued a new rule, Investment Company Reporting Modernization, which, among other provisions, amends Regulation S-X to require standardized, enhanced disclosures, particularly related to derivatives, in investment company financial statements. Compliance with the guidance is effective for financial statements filed with the SEC on or after August 1, 2017; adoption will have no effect on the fund’s net assets or results of operations.
NOTE 2 - VALUATION
The fund’s financial instruments are valued and each class’s net asset value (NAV) per share is computed at the close of the New York Stock Exchange (NYSE), normally 4 p.m. ET, each day the NYSE is open for business. However, the NAV per share may be calculated at a time other than the normal close of the NYSE if trading on the NYSE is restricted, if the NYSE closes earlier, or as may be permitted by the SEC.
Fair Value The fund’s financial instruments are reported at fair value, which GAAP defines as the price that would be received to sell an asset or paid to transfer a liability in an orderly transaction between market participants at the measurement date. The T. Rowe Price Valuation Committee (the Valuation Committee) is an internal committee that has been delegated certain responsibilities by the fund’s Board of Directors (the Board) to ensure that financial instruments are appropriately priced at fair value in accordance with GAAP and the 1940 Act. Subject to oversight by the Board, the Valuation Committee develops and oversees pricing-related policies and procedures and approves all fair value determinations. Specifically, the Valuation Committee establishes procedures to value securities; determines pricing techniques, sources, and persons eligible to effect fair value pricing actions; oversees the selection, services, and performance of pricing vendors; oversees valuation-related business continuity practices; and provides guidance on internal controls and valuation-related matters. The Valuation Committee reports to the Board and has representation from legal, portfolio management and trading, operations, risk management, and the fund’s treasurer.
Various valuation techniques and inputs are used to determine the fair value of financial instruments. GAAP establishes the following fair value hierarchy that categorizes the inputs used to measure fair value:
Level 1 – quoted prices (unadjusted) in active markets for identical financial instruments that the fund can access at the reporting date
Level 2 – inputs other than Level 1 quoted prices that are observable, either directly or indirectly (including, but not limited to, quoted prices for similar financial instruments in active markets, quoted prices for identical or similar financial instruments in inactive markets, interest rates and yield curves, implied volatilities, and credit spreads)
Level 3 – unobservable inputs
Observable inputs are developed using market data, such as publicly available information about actual events or transactions, and reflect the assumptions that market participants would use to price the financial instrument. Unobservable inputs are those for which market data are not available and are developed using the best information available about the assumptions that market participants would use to price the financial instrument. GAAP requires valuation techniques to maximize the use of relevant observable inputs and minimize the use of unobservable inputs. When multiple inputs are used to derive fair value, the financial instrument is assigned to the level within the fair value hierarchy based on the lowest-level input that is significant to the fair value of the financial instrument. Input levels are not necessarily an indication of the risk or liquidity associated with financial instruments at that level but rather the degree of judgment used in determining those values.
Valuation Techniques Equity securities listed or regularly traded on a securities exchange or in the over-the-counter (OTC) market are valued at the last quoted sale price or, for certain markets, the official closing price at the time the valuations are made. OTC Bulletin Board securities are valued at the mean of the closing bid and asked prices. A security that is listed or traded on more than one exchange is valued at the quotation on the exchange determined to be the primary market for such security. Listed securities not traded on a particular day are valued at the mean of the closing bid and asked prices. Actively traded equity securities listed on a domestic exchange generally are categorized in Level 1 of the fair value hierarchy. OTC Bulletin Board securities, certain preferred securities, and equity securities traded in inactive markets generally are categorized in Level 2 of the fair value hierarchy.
Debt securities generally are traded in the OTC market. Securities with remaining maturities of one year or more at the time of acquisition are valued at prices furnished by dealers who make markets in such securities or by an independent pricing service, which considers the yield or price of bonds of comparable quality, coupon, maturity, and type, as well as prices quoted by dealers who make markets in such securities. Generally, debt securities are categorized in Level 2 of the fair value hierarchy.
Investments in mutual funds are valued at the mutual fund’s closing NAV per share on the day of valuation and are categorized in Level 1 of the fair value hierarchy. Assets and liabilities other than financial instruments, including short-term receivables and payables, are carried at cost, or estimated realizable value, if less, which approximates fair value.
Thinly traded financial instruments and those for which the above valuation procedures are inappropriate or are deemed not to reflect fair value are stated at fair value as determined in good faith by the Valuation Committee. The objective of any fair value pricing determination is to arrive at a price that could reasonably be expected from a current sale. Financial instruments fair valued by the Valuation Committee are primarily private placements, restricted securities, warrants, rights, and other securities that are not publicly traded.
Subject to oversight by the Board, the Valuation Committee regularly makes good faith judgments to establish and adjust the fair valuations of certain securities as events occur and circumstances warrant. For instance, in determining the fair value of an equity investment with limited market activity, such as a private placement or a thinly traded public company stock, the Valuation Committee considers a variety of factors, which may include, but are not limited to, the issuer’s business prospects, its financial standing and performance, recent investment transactions in the issuer, new rounds of financing, negotiated transactions of significant size between other investors in the company, relevant market valuations of peer companies, strategic events affecting the company, market liquidity for the issuer, and general economic conditions and events. In consultation with the investment and pricing teams, the Valuation Committee will determine an appropriate valuation technique based on available information, which may include both observable and unobservable inputs. The Valuation Committee typically will afford greatest weight to actual prices in arm’s length transactions, to the extent they represent orderly transactions between market participants, transaction information can be reliably obtained, and prices are deemed representative of fair value. However, the Valuation Committee may also consider other valuation methods such as market-based valuation multiples; a discount or premium from market value of a similar, freely traded security of the same issuer; or some combination. Fair value determinations are reviewed on a regular basis and updated as information becomes available, including actual purchase and sale transactions of the issue. Because any fair value determination involves a significant amount of judgment, there is a degree of subjectivity inherent in such pricing decisions, and fair value prices determined by the Valuation Committee could differ from those of other market participants. Depending on the relative significance of unobservable inputs, including the valuation technique(s) used, fair valued securities may be categorized in Level 2 or 3 of the fair value hierarchy.
Valuation Inputs The following table summarizes the fund’s financial instruments, based on the inputs used to determine their fair values on December 31, 2016:

There were no material transfers between Levels 1 and 2 during the year ended December 31, 2016.
NOTE 3 - OTHER INVESTMENT TRANSACTIONS
Consistent with its investment objective, the fund engages in the following practices to manage exposure to certain risks and/or to enhance performance. The investment objective, policies, program, and risk factors of the fund are described more fully in the fund’s prospectus and Statement of Additional Information.
When-Issued Securities The fund may enter into when-issued purchase or sale commitments, pursuant to which it agrees to purchase or sell, respectively, an authorized but not yet issued security for a fixed unit price, with payment and delivery not due until issuance of the security on a scheduled future date. When-issued securities may be new securities or securities issued through a corporate action, such as a reorganization or restructuring. Until settlement, the fund maintains liquid assets sufficient to settle its commitment to purchase a when-issued security or, in the case of a sale commitment, the fund maintains an entitlement to the security to be sold. Amounts realized on when-issued transactions are included in realized gain/loss on securities in the accompanying financial statements.
Other Purchases and sales of portfolio securities other than short-term securities aggregated $804,279,000 and $352,266,000, respectively, for the year ended December 31, 2016.
NOTE 4 - FEDERAL INCOME TAXES
No provision for federal income taxes is required since the fund intends to continue to qualify as a regulated investment company under Subchapter M of the Internal Revenue Code and distribute to shareholders all of its taxable income and gains. Distributions determined in accordance with federal income tax regulations may differ in amount or character from net investment income and realized gains for financial reporting purposes. Financial reporting records are adjusted for permanent book/tax differences to reflect tax character but are not adjusted for temporary differences.
The fund files U.S. federal, state, and local tax returns as required. The fund’s tax returns are subject to examination by the relevant tax authorities until expiration of the applicable statute of limitations, which is generally three years after the filing of the tax return but which can be extended to six years in certain circumstances. Tax returns for open years have incorporated no uncertain tax positions that require a provision for income taxes.
Reclassifications to paid-in capital relate primarily to an over-distribution of taxable income not deemed a return of capital for tax purposes. Reclassifications between income and gain relate primarily to the character of dividends received from real estate investment trusts (REITs). For the year ended December 31, 2016, the following reclassifications were recorded to reflect tax character (there was no impact on results of operations or net assets):

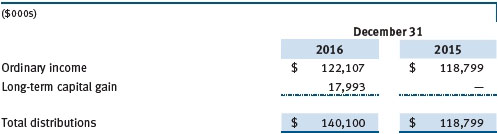
Distributions during the years ended December 31, 2016 and December 31, 2015, were characterized for tax purposes as follows:
At December 31, 2016, the tax-basis cost of investments and components of net assets were as follows:
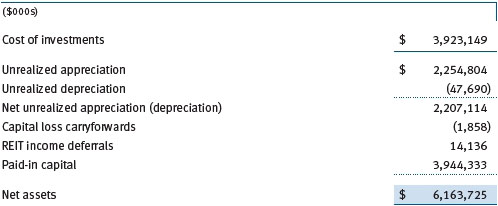
The difference between book-basis and tax-basis net unrealized appreciation (depreciation) is attributable to the deferral of losses from wash sales for tax purposes. The fund intends to retain realized gains to the extent of available capital loss carryforwards. Net realized capital losses may be carried forward indefinitely to offset future realized capital gains. All or a portion of the capital loss carryforwards may be from losses realized between November 1 and the fund’s fiscal year-end, which are deferred for tax purposes until the subsequent year but recognized for financial reporting purposes in the year realized. During the year ended December 31, 2016, the fund utilized $164,644,000 of capital loss carryforwards. Certain dividends declared by REITs in December and paid the following January are recognized for tax purposes in the subsequent year (REIT income deferrals) but, for financial reporting purposes, are included in the fund’s dividend income on ex-date.
NOTE 5 - RELATED PARTY TRANSACTIONS
The fund is managed by T. Rowe Price Associates, Inc. (Price Associates), a wholly owned subsidiary of T. Rowe Price Group, Inc. (Price Group). The investment management agreement between the fund and Price Associates provides for an annual investment management fee, which is computed daily and paid monthly. The fee consists of an individual fund fee, equal to 0.30% of the fund’s average daily net assets, and a group fee. The group fee rate is calculated based on the combined net assets of certain mutual funds sponsored by Price Associates (the group) applied to a graduated fee schedule, with rates ranging from 0.48% for the first $1 billion of assets to 0.270% for assets in excess of $500 billion. The fund’s group fee is determined by applying the group fee rate to the fund’s average daily net assets. At December 31, 2016, the effective annual group fee rate was 0.29%.
The I Class is subject to an operating expense limitation (I Class limit) pursuant to which Price Associates is contractually required to pay all operating expenses of the I Class, excluding management fees, interest, expenses related to borrowings, taxes, and brokerage, and other non-recurring expenses permitted by the investment management agreement, to the extent such operating expenses, on an annualized basis, exceed 0.05% of average net assets. This agreement will continue until April 30, 2018, and may be renewed, revised, or revoked only with approval of the fund’s Board. The I Class is required to repay Price Associates for expenses previously paid to the extent the class’s net assets grow or expenses decline sufficiently to allow repayment without causing the class’s operating expenses to exceed the I Class limit in effect at the time of the waiver. However, no repayment will be made more than three years after the date of a payment or waiver. For the year ended December 31, 2016, the I Class operated below its expense limitation.
In addition, the fund has entered into service agreements with Price Associates and two wholly owned subsidiaries of Price Associates (collectively, Price). Price Associates provides certain accounting and administrative services to the fund. T. Rowe Price Services, Inc., provides shareholder and administrative services in its capacity as the fund’s transfer and dividend-disbursing agent. T. Rowe Price Retirement Plan Services, Inc., provides subaccounting and recordkeeping services for certain retirement accounts invested in the Investor Class. For the year ended December 31, 2016, expenses incurred pursuant to these service agreements were $67,000 for Price Associates; $1,473,000 for T. Rowe Price Services, Inc.; and $629,000 for T. Rowe Price Retirement Plan Services, Inc. The total amount payable at period-end pursuant to these service agreements is reflected as Due to Affiliates in the accompanying financial statements.
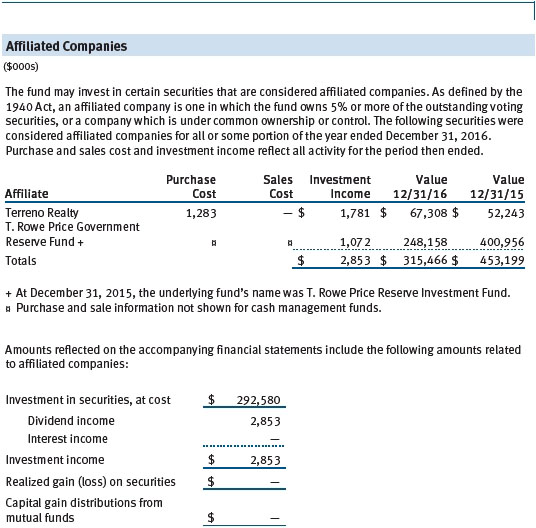
The fund may invest in the T. Rowe Price Government Reserve Fund, the T. Rowe Price Treasury Reserve Fund, or the T. Rowe Price Short-Term Fund (collectively, the Price Reserve Funds), open-end management investment companies managed by Price Associates and considered affiliates of the fund. The Price Reserve Funds are offered as short-term investment options to mutual funds, trusts, and other accounts managed by Price Associates or its affiliates and are not available for direct purchase by members of the public. The Price Reserve Funds pay no investment management fees.
The fund may participate in securities purchase and sale transactions with other funds or accounts advised by Price Associates (cross trades), in accordance with procedures adopted by the fund’s Board and Securities and Exchange Commission rules, which require, among other things, that such purchase and sale cross trades be effected at the independent current market price of the security. During the year ended December 31, 2016, the fund had no purchases or sales cross trades with other funds or accounts advised by Price Associates.
| Report of Independent Registered Public Accounting Firm |
To the Board of Directors and Shareholders of
T. Rowe Price Real Estate Fund, Inc.
In our opinion, the accompanying statement of assets and liabilities, including the portfolio of investments, and the related statements of operations and of changes in net assets and the financial highlights present fairly, in all material respects, the financial position of T. Rowe Price Real Estate Fund, Inc. (the “Fund”) as of December 31, 2016, the results of its operations, the changes in its net assets and the financial highlights for each of the periods indicated therein, in conformity with accounting principles generally accepted in the United States of America. These financial statements and financial highlights (hereafter referred to as “financial statements”) are the responsibility of the Fund’s management. Our responsibility is to express an opinion on these financial statements based on our audits. We conducted our audits of these financial statements in accordance with the standards of the Public Company Accounting Oversight Board (United States). Those standards require that we plan and perform the audit to obtain reasonable assurance about whether the financial statements are free of material misstatement. An audit includes examining, on a test basis, evidence supporting the amounts and disclosures in the financial statements, assessing the accounting principles used and significant estimates made by management, and evaluating the overall financial statement presentation. We believe that our audits, which included confirmation of securities as of December 31, 2016 by correspondence with the custodian, and confirmation of the underlying fund by correspondence with the transfer agent, provide a reasonable basis for our opinion.
PricewaterhouseCoopers LLP
Baltimore, Maryland
February 21, 2017
| Tax Information (Unaudited) for the Tax Year Ended 12/31/16 |
We are providing this information as required by the Internal Revenue Code. The amounts shown may differ from those elsewhere in this report because of differences between tax and financial reporting requirements.
The fund’s distributions to shareholders included:
| ● | $136,000 from short-term capital gains |
| | |
| ● | $17,993,000 from long-term capital gains, subject to a long-term capital gains tax rate of not greater than 20% |
For taxable non-corporate shareholders, $5,942,000 of the fund’s income represents qualified dividend income subject to a long-term capital gains tax rate of not greater than 20%.
For corporate shareholders, $1,475,000 of the fund’s income qualifies for the dividends-received deduction.
| Information on Proxy Voting Policies, Procedures, and Records |
A description of the policies and procedures used by T. Rowe Price funds and portfolios to determine how to vote proxies relating to portfolio securities is available in each fund’s Statement of Additional Information. You may request this document by calling 1-800-225-5132 or by accessing the SEC’s website, sec.gov.
The description of our proxy voting policies and procedures is also available on our corporate website. To access it, please visit the following Web page:
https://www3.troweprice.com/usis/corporate/en/utility/policies.html
Scroll down to the section near the bottom of the page that says, “Proxy Voting Policies.” Click on the Proxy Voting Policies link in the shaded box.
Each fund’s most recent annual proxy voting record is available on our website and through the SEC’s website. To access it through T. Rowe Price, visit the website location shown above, and scroll down to the section near the bottom of the page that says, “Proxy Voting Records.” Click on the Proxy Voting Records link in the shaded box.
| How to Obtain Quarterly Portfolio Holdings |
The fund files a complete schedule of portfolio holdings with the Securities and Exchange Commission for the first and third quarters of each fiscal year on Form N-Q. The fund’s Form N-Q is available electronically on the SEC’s website (sec.gov); hard copies may be reviewed and copied at the SEC’s Public Reference Room, 100 F St. N.E., Washington, DC 20549. For more information on the Public Reference Room, call 1-800-SEC-0330.
| About the Fund’s Directors and Officers |
Your fund is overseen by a Board of Directors (Board) that meets regularly to review a wide variety of matters affecting or potentially affecting the fund, including performance, investment programs, compliance matters, advisory fees and expenses, service providers, and business and regulatory affairs. The Board elects the fund’s officers, who are listed in the final table. At least 75% of the Board’s members are independent of T. Rowe Price Associates, Inc. (T. Rowe Price), and its affiliates; “inside” or “interested” directors are employees or officers of T. Rowe Price. The business address of each director and officer is 100 East Pratt Street, Baltimore, Maryland 21202. The Statement of Additional Information includes additional information about the fund directors and is available without charge by calling a T. Rowe Price representative at 1-800-638-5660.
Independent Directors
| Name | | |
| (Year of Birth) | | |
| Year Elected* | | |
| [Number of T. Rowe Price | | Principal Occupation(s) and Directorships of Public Companies and |
| Portfolios Overseen] | | Other Investment Companies During the Past Five Years |
| | | |
| William R. Brody, M.D., Ph.D. | | President and Trustee, Salk Institute for Biological Studies |
| (1944) | | (2009 to present); Director, BioMed Realty Trust (2013 to 2016); |
| 2009 | | Chairman of the Board, Mesa Biotech, a molecular diagnostic |
| [187] | | company (March 2016 to present); Director, Radiology Partners, |
| | an integrated radiology practice management company (June 2016 |
| | to present); Director, Novartis, Inc. (2009 to 2014); Director, IBM |
| | (2007 to present) |
| | | |
| Anthony W. Deering | | Chairman, Exeter Capital, LLC, a private investment firm (2004 |
| (1945) | | to present); Director, Brixmor Real Estate Investment Trust (2012 |
| 2001 | | to present); Director and Advisory Board Member, Deutsche |
| [187] | | Bank North America (2004 to present); Director, Under Armour |
| | (2008 to present); Director, Vornado Real Estate Investment Trust |
| | (2004 to 2012) |
| | | |
| Bruce W. Duncan | | Chief Executive Officer and Director (2009 to present), Chairman |
| (1951) | | of the Board (January 2016 to present), and President (2009 |
| 2013 | | to September 2016), First Industrial Realty Trust, an owner and |
| [187] | | operator of industrial properties; Chairman of the Board (2005 to |
| | May 2016) and Director (1999 to May 2016), Starwood Hotels & |
| | Resorts, a hotel and leisure company; Director, Boston Properties |
| | (May 2016 to present) |
| | | |
| Robert J. Gerrard, Jr. | | Advisory Board Member, Pipeline Crisis/Winning Strategies, a |
| (1952) | | collaborative working to improve opportunities for young African |
| 2012 | | Americans (1997 to present) |
| [187] | | |
| | | |
| Paul F. McBride | | Advisory Board Member, Vizzia Technologies (2015 to present) |
| (1956) | | |
| 2013 | | |
| [187] | | |
| | | |
| Cecilia E. Rouse, Ph.D. | | Dean, Woodrow Wilson School (2012 to present); Professor and |
| (1963) | | Researcher, Princeton University (1992 to present); Director, MDRC, |
| 2012 | | a nonprofit education and social policy research organization (2011 |
| [187] | | to present); Member of National Academy of Education (2010 to |
| | present); Research Associate of Labor Program (2011 to present) |
| | and Board Member (2015 to present), National Bureau of Economic |
| | Research (2011 to present); Chair of Committee on the Status of |
| | Minority Groups in the Economic Profession (2012 to present) and |
| | Vice President (2015 to present), American Economic Association |
| | | |
| John G. Schreiber | | Owner/President, Centaur Capital Partners, Inc., a real estate |
| (1946) | | investment company (1991 to present); Cofounder, Partner, and |
| 2001 | | Cochairman of the Investment Committee, Blackstone Real Estate |
| [187] | | Advisors, L.P. (1992 to 2015); Director, General Growth Properties, |
| | Inc. (2010 to 2013); Director, Blackstone Mortgage Trust, a real |
| | estate finance company (2012 to 2016); Director and Chairman of |
| | the Board, Brixmor Property Group, Inc. (2013 to present); Director, |
| | Hilton Worldwide (2013 to present); Director, Hudson Pacific |
| | Properties (2014 to 2016) |
| | | |
| Mark R. Tercek | | President and Chief Executive Officer, The Nature Conservancy |
| (1957) | | (2008 to present) |
| 2009 | | |
| [187] | | |
| |
| *Each independent director serves until retirement, resignation, or election of a successor. |
Inside Directors
| Name | | |
| (Year of Birth) | | |
| Year Elected* | | |
| [Number of T. Rowe Price | | Principal Occupation(s) and Directorships of Public Companies and |
| Portfolios Overseen] | | Other Investment Companies During the Past Five Years |
| | | |
| Edward C. Bernard | | Director and Vice President, T. Rowe Price; Vice Chairman of the |
| (1956) | | Board, Director, and Vice President, T. Rowe Price Group, Inc.; |
| 2006 | | Chairman of the Board, Director, and President, T. Rowe Price |
| [187] | | Investment Services, Inc.; Chairman of the Board and Director, |
| | T. Rowe Price Retirement Plan Services, Inc., and T. Rowe Price |
| | Services, Inc.; Chairman of the Board, Chief Executive Officer, |
| | Director, and President, T. Rowe Price International and T. Rowe |
| | Price Trust Company; Chairman of the Board, all funds |
| | | |
| Brian C. Rogers, CFA, CIC | | Chief Investment Officer, Director, and Vice President, T. Rowe |
| (1955) | | Price; Chairman of the Board, Chief Investment Officer, Director, and |
| 2006 | | Vice President, T. Rowe Price Group, Inc.; Vice President, T. Rowe |
| [131] | | Price Trust Company, Director, United Technologies (January 2016 |
| | to present) |
| |
| *Each inside director serves until retirement, resignation, or election of a successor. |
Officers
| Name (Year of Birth) | | |
| Position Held With Real Estate Fund | | Principal Occupation(s) |
| | | |
| Darrell N. Braman (1963) | | Vice President, Price Hong Kong, Price |
| Vice President and Secretary | | Singapore, T. Rowe Price, T. Rowe Price Group, |
| | Inc., T. Rowe Price International, T. Rowe Price |
| | Investment Services, Inc., and T. Rowe Price |
| | Services, Inc. |
| | | |
| John R. Gilner (1961) | | Chief Compliance Officer and Vice President, |
| Chief Compliance Officer | | T. Rowe Price; Vice President, T. Rowe Price |
| | Group, Inc., and T. Rowe Price Investment |
| | Services, Inc. |
| | | |
| Thomas J. Huber, CFA (1966) | | Vice President, T. Rowe Price, T. Rowe Price |
| Vice President | | Group, Inc., and T. Rowe Price Trust Company |
| | | |
| Nina P. Jones, CPA (1980) | | Vice President, T. Rowe Price and T. Rowe Price |
| Vice President | | Group, Inc. |
| | | |
| Paul J. Krug, CPA (1964) | | Vice President, T. Rowe Price, T. Rowe Price |
| Vice President | | Group, Inc., and T. Rowe Price Trust Company |
| | | |
| David M. Lee, CFA (1962) | | Vice President, T. Rowe Price, T. Rowe Price |
| President | | Group, Inc., and T. Rowe Price Trust Company |
| | | |
| Catherine D. Mathews (1963) | | Vice President, T. Rowe Price, T. Rowe Price |
| Treasurer and Vice President | | Group, Inc., and T. Rowe Price Trust Company |
| | | |
| Daniel A. McCulley (1987) | | Employee, T. Rowe Price; formerly, summer |
| Vice President | | intern, Clearbridge Investments (to 2015); |
| | Associate Research Analyst, T. Rowe Price |
| | (to 2013) |
| | | |
| Philip A. Nestico (1976) | | Vice President, T. Rowe Price and T. Rowe Price |
| Vice President | | Group, Inc. |
| | | |
| David Oestreicher (1967) | | Director, Vice President, and Secretary, T. Rowe |
| Vice President | | Price Investment Services, Inc., T. Rowe Price |
| | Retirement Plan Services, Inc., T. Rowe |
| | Price Services, Inc., and T. Rowe Price Trust |
| | Company; Chief Legal Officer, Vice President, |
| | and Secretary, T. Rowe Price Group, Inc.; Vice |
| | President and Secretary, T. Rowe Price and |
| | T. Rowe Price International; Vice President, |
| | Price Hong Kong and Price Singapore |
| | | |
| Preeta Ragavan (1987) | | Vice President, T. Rowe Price; formerly, summer |
| Vice President | | intern, T. Rowe Price (to 2013) |
| | | |
| John W. Ratzesberger (1975) | | Vice President, T. Rowe Price, T. Rowe Price |
| Vice President | | Group, Inc., and T. Rowe Price Trust Company; |
| | formerly, North American Head of Listed |
| | Derivatives Operation, Morgan Stanley |
| | (to 2013) |
| | | |
| Shannon H. Rauser (1987) | | Employee, T. Rowe Price |
| Assistant Secretary | | |
| | | |
| Theodore E. Robson, CFA (1965) | | Vice President, T. Rowe Price, T. Rowe Price |
| Vice President | | Group, Inc., and T. Rowe Price Trust Company |
| | | |
| Deborah D. Seidel (1962) | | Vice President, T. Rowe Price, T. Rowe Price |
| Vice President | | Group, Inc., T. Rowe Price Investment Services, |
| | Inc., and T. Rowe Price Services, Inc. |
| | | |
| Weijie Si (1983) | | Vice President, T. Rowe Price and T. Rowe |
| Vice President | | Price Group, Inc.; formerly, student, Harvard |
| | Business School (to 2012) |
| |
| Unless otherwise noted, officers have been employees of T. Rowe Price or T. Rowe Price International for at least 5 years. |
Item 2. Code of Ethics.
The registrant has adopted a code of ethics, as defined in Item 2 of Form N-CSR, applicable to its principal executive officer, principal financial officer, principal accounting officer or controller, or persons performing similar functions. A copy of this code of ethics is filed as an exhibit to this Form N-CSR. No substantive amendments were approved or waivers were granted to this code of ethics during the period covered by this report.
Item 3. Audit Committee Financial Expert.
The registrant’s Board of Directors/Trustees has determined that Mr. Bruce W. Duncan qualifies as an audit committee financial expert, as defined in Item 3 of Form N-CSR. Mr. Duncan is considered independent for purposes of Item 3 of Form N-CSR.
Item 4. Principal Accountant Fees and Services.
(a) – (d) Aggregate fees billed for the last two fiscal years for professional services rendered to, or on behalf of, the registrant by the registrant’s principal accountant were as follows:

Audit fees include amounts related to the audit of the registrant’s annual financial statements and services normally provided by the accountant in connection with statutory and regulatory filings. Audit-related fees include amounts reasonably related to the performance of the audit of the registrant’s financial statements and specifically include the issuance of a report on internal controls and, if applicable, agreed-upon procedures related to fund acquisitions. Tax fees include amounts related to services for tax compliance, tax planning, and tax advice. The nature of these services specifically includes the review of distribution calculations and the preparation of Federal, state, and excise tax returns. All other fees include the registrant’s pro-rata share of amounts for agreed-upon procedures in conjunction with service contract approvals by the registrant’s Board of Directors/Trustees.
(e)(1) The registrant’s audit committee has adopted a policy whereby audit and non-audit services performed by the registrant’s principal accountant for the registrant, its investment adviser, and any entity controlling, controlled by, or under common control with the investment adviser that provides ongoing services to the registrant require pre-approval in advance at regularly scheduled audit committee meetings. If such a service is required between regularly scheduled audit committee meetings, pre-approval may be authorized by one audit committee member with ratification at the next scheduled audit committee meeting. Waiver of pre-approval for audit or non-audit services requiring fees of a de minimis amount is not permitted.
(2) No services included in (b) – (d) above were approved pursuant to paragraph (c)(7)(i)(C) of Rule 2-01 of Regulation S-X.
(f) Less than 50 percent of the hours expended on the principal accountant’s engagement to audit the registrant’s financial statements for the most recent fiscal year were attributed to work performed by persons other than the principal accountant’s full-time, permanent employees.
(g) The aggregate fees billed for the most recent fiscal year and the preceding fiscal year by the registrant’s principal accountant for non-audit services rendered to the registrant, its investment adviser, and any entity controlling, controlled by, or under common control with the investment adviser that provides ongoing services to the registrant were $2,146,000 and $2,158,000, respectively.
(h) All non-audit services rendered in (g) above were pre-approved by the registrant’s audit committee. Accordingly, these services were considered by the registrant’s audit committee in maintaining the principal accountant’s independence.
Item 5. Audit Committee of Listed Registrants.
Not applicable.
Item 6. Investments.
(a) Not applicable. The complete schedule of investments is included in Item 1 of this Form N-CSR.
(b) Not applicable.
Item 7. Disclosure of Proxy Voting Policies and Procedures for Closed-End Management Investment Companies.
Not applicable.
Item 8. Portfolio Managers of Closed-End Management Investment Companies.
Not applicable.
Item 9. Purchases of Equity Securities by Closed-End Management Investment Company and Affiliated Purchasers.
Not applicable.
Item 10. Submission of Matters to a Vote of Security Holders.
Not applicable.
Item 11. Controls and Procedures.
(a) The registrant’s principal executive officer and principal financial officer have evaluated the registrant’s disclosure controls and procedures within 90 days of this filing and have concluded that the registrant’s disclosure controls and procedures were effective, as of that date, in ensuring that information required to be disclosed by the registrant in this Form N-CSR was recorded, processed, summarized, and reported timely.
(b) The registrant’s principal executive officer and principal financial officer are aware of no change in the registrant’s internal control over financial reporting that occurred during the registrant’s second fiscal quarter covered by this report that has materially affected, or is reasonably likely to materially affect, the registrant’s internal control over financial reporting.
Item 12. Exhibits.
(a)(1) The registrant’s code of ethics pursuant to Item 2 of Form N-CSR is attached.
(2) Separate certifications by the registrant's principal executive officer and principal financial officer, pursuant to Section 302 of the Sarbanes-Oxley Act of 2002 and required by Rule 30a-2(a) under the Investment Company Act of 1940, are attached.
(3) Written solicitation to repurchase securities issued by closed-end companies: not applicable.
(b) A certification by the registrant's principal executive officer and principal financial officer, pursuant to Section 906 of the Sarbanes-Oxley Act of 2002 and required by Rule 30a-2(b) under the Investment Company Act of 1940, is attached.
SIGNATURES
Pursuant to the requirements of the Securities Exchange Act of 1934 and the Investment Company Act of 1940, the registrant has duly caused this report to be signed on its behalf by the undersigned, thereunto duly authorized.
T. Rowe Price Real Estate Fund, Inc.
| By | /s/ Edward C. Bernard |
| | Edward C. Bernard |
| | Principal Executive Officer |
| | |
| Date February 16, 2017 | | |
Pursuant to the requirements of the Securities Exchange Act of 1934 and the Investment Company Act of 1940, this report has been signed below by the following persons on behalf of the registrant and in the capacities and on the dates indicated.
| By | /s/ Edward C. Bernard |
| | Edward C. Bernard |
| | Principal Executive Officer |
| | |
| Date February 16, 2017 | | |
| | |
| | |
| By | /s/ Catherine D. Mathews |
| | Catherine D. Mathews |
| | Principal Financial Officer |
| | |
| Date February 16, 2017 | | |