UNITED STATES
SECURITIES AND EXCHANGE COMMISSION
Washington, D.C. 20549
FORM N-CSR
CERTIFIED SHAREHOLDER REPORT OF REGISTERED
MANAGEMENT INVESTMENT COMPANIES
Investment Company Act File Number: 811-08371
| T. Rowe Price Real Estate Fund, Inc. |
|
| (Exact name of registrant as specified in charter) |
| |
| 100 East Pratt Street, Baltimore, MD 21202 |
|
| (Address of principal executive offices) |
| |
| David Oestreicher |
| 100 East Pratt Street, Baltimore, MD 21202 |
|
| (Name and address of agent for service) |
Registrant’s telephone number, including area code: (410) 345-2000
Date of fiscal year end: December 31
Date of reporting period: June 30, 2017
Item 1. Report to Shareholders
| Real Estate Fund | June 30, 2017 |
The views and opinions in this report were current as of June 30, 2017. They are not guarantees of performance or investment results and should not be taken as investment advice. Investment decisions reflect a variety of factors, and the managers reserve the right to change their views about individual stocks, sectors, and the markets at any time. As a result, the views expressed should not be relied upon as a forecast of the fund’s future investment intent. The report is certified under the Sarbanes-Oxley Act, which requires mutual funds and other public companies to affirm that, to the best of their knowledge, the information in their financial reports is fairly and accurately stated in all material respects.
REPORTS ON THE WEB
Sign up for our Email Program, and you can begin to receive updated fund reports and prospectuses online rather than through the mail. Log in to your account at troweprice.com for more information.
Manager’s Letter
Fellow Shareholders
In the first half of 2017, equity markets generally advanced during an environment of improved business confidence following the results of the 2016 U.S. elections. This confidence remained despite the lack of tangible progress on political promises such as the “repeal and replace” of Obamacare and a comprehensive tax overhaul. Real estate securities also recorded positive results, but to a lesser degree than the broader equity markets.
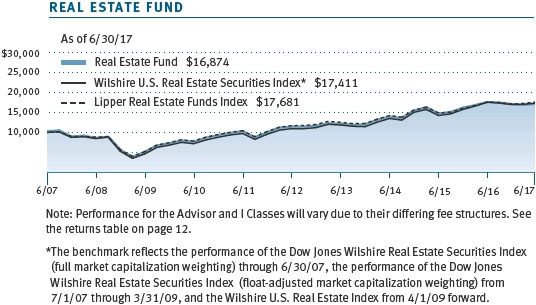
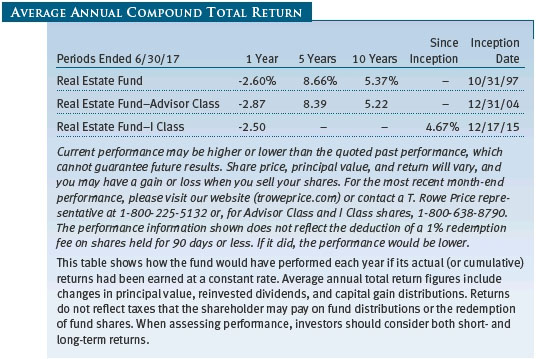
For the first half of 2017, the Real Estate Fund returned a modest 0.22% and trailed the Wilshire U.S. Real Estate Securities Index, which returned 2.42%, and the Lipper Real Estate Funds Index, which returned 3.26%. We attribute much of this performance differential to our fund’s relative lack of exposure to specialty real estate investment trusts (REITs), including data centers, cellular towers, and healthcare, and the fund’s exposure to retail REITs, which continue to be pressured by negative investor sentiment despite positive fundamentals. (The returns for the Advisor and I Class shares vary, reflecting their different fee structures.)

DIVIDEND DISTRIBUTION
On June 27, 2017, your fund’s Board of Directors declared a second-quarter dividend of $0.17 per share to shareholders of record on that day, which was paid on June 29. You should have received your check or statement reflecting this distribution. This brings total distributions for the first half of the year to $0.32 per share. (Advisor Class distributions were $0.14 per share in the second quarter and $0.27 for the first half, while I Class shares totaled $0.18 and $0.34 for the respective periods.)
MARKET ENVIRONMENT AND STRATEGY
Broad stock market indices posted gains for both quarters during the first half of the year, and the technology-heavy Nasdaq Composite Index offered the greatest gains among major benchmarks. The 10-year Treasury note appreciated, leading to lower yields despite two more Federal Reserve increases at the short end of the interest rate curve. While equity markets advanced overall, there were notably diverse pockets of strength and weakness. Technology and healthcare were strong S&P 500 sectors, while energy was weak. Within the consumer discretionary category, it felt like disappointing retailer news was a daily occurrence.
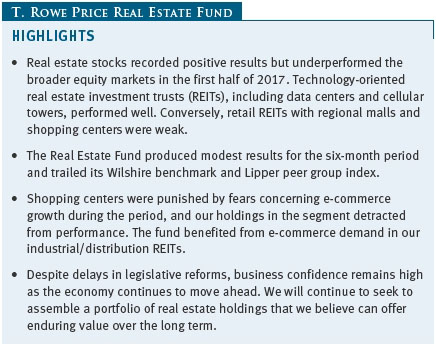
Stock performance in the real estate sector mirrored much of what occurred in the broader markets. Technology-oriented REITs, including data centers and cellular towers, performed exceptionally well. Meanwhile, declining long-term interest rates and the impasse on healthcare legislation helped healthcare REITs produce strong returns during the period. Our fund trailed others due to underweights in both the technology and healthcare subsectors. Conversely, retail REITs with regional malls and shopping centers were exceptionally weak. Continued store closure announcements weighed on mall REITs, while the unanticipated proposal by Amazon.com to acquire Whole Foods Market sent shockwaves through the grocery industry and through the community shopping center REITs that cater to grocers.
While we acknowledge that there are challenges in the retailing environment, we are not as pessimistic as some others, and we continue to forecast earnings growth overall for our retail portfolio. We see the entry of Amazon into the more traditional brick-and-mortar world via the acquisition of Whole Foods as an acknowledgment of omni-channel retailing by the largest online participant. For many years, Amazon has sought to penetrate the grocery segment, and the proposed $13.7 billion acquisition of Whole Foods would represent the company’s largest acquisition ever. We will continue to monitor events as they unfold in this segment, and we are fortunate to have the assistance of dedicated retail and Internet analysts at our disposal within the firm.
Our strategy remains the same, as we are focused on locations that we believe will remain desirable and relevant in the future. We are not going to follow an index fund or allow an index selection committee to determine for us the choice of holdings for real estate exposure. We maintain a fairly traditional approach to investing in commercial real estate with an emphasis on “location, location, location.” We also routinely analyze the net asset value (NAV) of our holdings. Lately it feels as though the market has veered away from these standards, favoring instead a focus on earnings growth regardless of source, with much of that growth externally generated through merger and acquisition (M&A) activity. We continue to prefer internally generated intrinsic growth. While we too appreciate earnings growth at our companies, we note that it is easier in many cases to manufacture short-term earnings growth than it is to accrue long-term NAV growth.
While we are disappointed that our fund did not keep pace with the market and its peers during the reporting period, we believe this is a consequence of our diversification. The point of diversification is that not everything is moving in the same direction—good or bad—at the same time. Somewhat troubling is the recent movement in tandem of many differing products in the market. While there are rewards to owning the same securities when they are appreciating, cross-ownership of securities across multiple strategies presents a risk to diversification in our opinion. Indeed, when there was a brief (admittedly very brief) correction in technology stocks during June, we were encouraged by our fund’s relative performance within the real estate category. We would also note our intent to own less “bond-like” REITs that correlate better to interest rates, though we acknowledge that many of these REITs have performed well over what may be described as a 30-year bull market for bonds in an environment of declining interest rates. Overall, as we reviewed our performance attribution, we were heartened by the value created via our individual stock selection, although this positive selection has at times been offset by unfavorable subsector weightings.
PORTFOLIO REVIEW
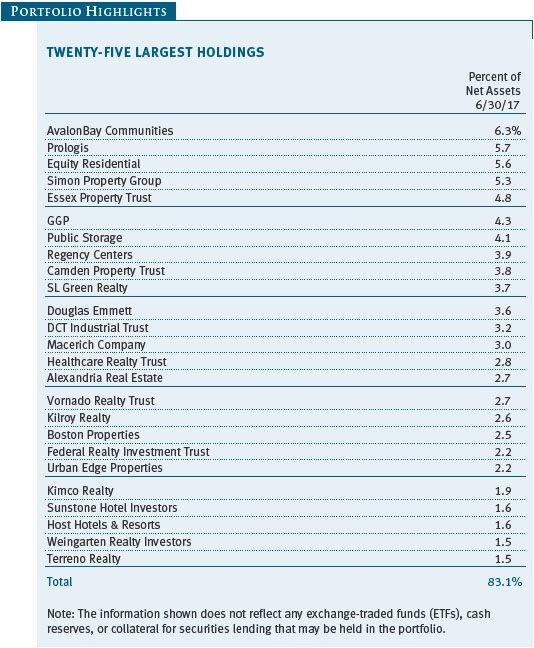
Shopping centers were punished by fears concerning e-commerce growth during the period. We believe that both retailing formats can coexist in an omni-channel world, and we feel that Amazon’s proposed acquisition of Whole Foods is an important acknowledgment of this concept. That said, shopping center REITs took another leg down with this proposed acquisition, and some of our holdings in this segment, including Kimco Realty, Weingarten Realty, Urban Edge Properties, and Regency Centers, detracted from the fund’s performance. For Regency Centers, we continue to project that this predominantly grocery-anchored portfolio will generate solid growth. We are attracted to the company’s strong demographic statistics in terms of nearby population density and household incomes. We added to our Regency position and were pleased to see the company reiterate its positive earnings outlook. (Please refer to the fund’s portfolio of investments for a complete list of holdings and the amount each represents in the portfolio.)
Regional mall REITs were also punished during the period as store closing announcements continued to weigh upon the shares. Generally, the store closings were disproportionately projected to occur outside our holdings, reflecting the higher quality of our locations. Still, negative sentiment battered all mall shares, including the portfolio’s positions in Simon Property Group, GGP, and Macerich Company. We are of the opinion that many retailers have not properly invested in their physical stores as they have been distracted by their efforts to bolster their online strategies. This has left some physical locations lacking in appeal and has had a negative impact on mall traffic. We applaud the efforts of mall managements to proactively recapture less productive space. This does often lead to some short-term disruption as a tenant vacates and capital improvements are made before new tenants move in and begin paying rents. While we remain overweight the mall subsector, we did trim our position in Simon Property Group to manage our subsector position size.
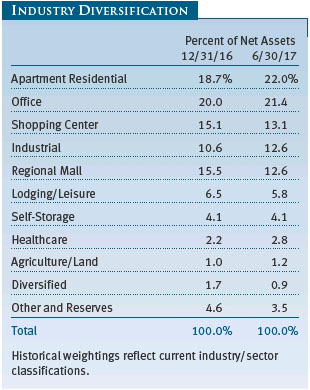
At the other end of the return spectrum, the fund continued to benefit from e-commerce demand reflected in the strong fundamentals for our industrial/distribution REITs. We favor properties that are near populated areas and the final destination for delivered goods. The exceptionally strong performance of Terreno Realty, a company we have held since its initial public offering, was a highlight this period. We support the company’s strategy, which is focused exclusively on six major metropolitan markets. We were pleased to see other investors now recognizing the attractiveness of this strategy. We also saw broad strength in our other industrial holdings, including Eastgroup Property, Prologis, and DCT Industrial Trust.
Apartment REITs bounced back nicely this period as management teams provided outlooks that appeared more optimistic. Supply pressure lessened in some key markets, and there was M&A activity within the sector that offered support for NAV estimates. We had positive returns for apartment REITs Camden Property Trust, Essex Property Trust, AvalonBay Communities, and Equity Residential, and we added to these positions during the period. Student housing provider American Campus Communities was weaker during the period, and we added to our position as we maintain a positive long-term view on the demand for well-located student housing at major universities.
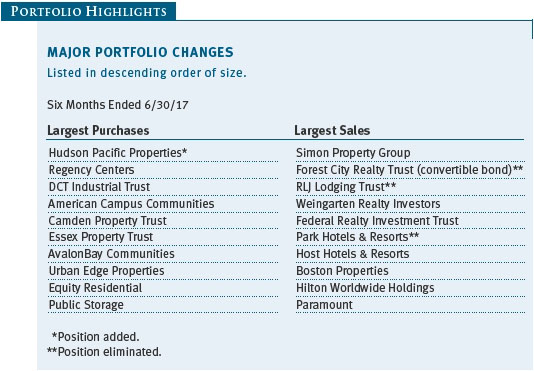
Over the past year, several of our lodging REITs have undergone changes in leadership or strategy. We trimmed some of our holdings as we look to see how the new leadership teams or strategies will perform. This included a reduction of our holdings in Host Hotels & Resorts. We eliminated our holdings in RLJ Lodging Trust after the company announced a very large acquisition that will affect the company’s balance sheet. Also eliminated this period was Park Hotels & Resorts, the spin-off we received from Hilton, though we may revisit this name as we have a favorable view of the CEO from his experience at his prior company.
We initiated a new position in Hudson Pacific Properties, which is a REIT focused on office properties along the West Coast. We are optimistic about key Hudson Pacific markets, including West Los Angeles, San Francisco, and Seattle. Indeed, these same attractive markets are also present in another one of our holdings, Kilroy Realty, and we had sought to increase our exposure to those areas.
We eliminated our Forest City convertible debenture this period; we view the holding as an example of our risk-adjusted approach to investing. The debenture, which is scheduled to mature in less than a year, allowed our fund to participate in upside returns from stock appreciation while placing us at a more senior level in the capital structure and at the same time paying us a generous yield. The convertible bond did benefit from stock appreciation, and we sold the security at a premium to its par value.
OUTLOOK
The hopes for prompt fiscal stimulus, comprehensive legislative reform, and a pickup in economic growth following the U.S. presidential election in November have waned amid the complexities involved in governing the nation. Despite one-party control of the White House and Congress, the extensive legislative reforms related to healthcare and taxation have not been enacted. This was a possibility we highlighted in our prior shareholder letter. Some form of compromise will likely be required to pass comprehensive legislation. Notably, compromise will be required within the Republican Party itself. However, many would note that Congress lately has seemed uncompromising in many respects, so the possibility remains that no comprehensive legislation will be passed regarding healthcare or tax reform.
However, even without legislative reforms, business confidence remains high and unemployment levels low as the economy continues to move ahead—though at a more modest pace than many desire. Technological disruption has had an impact on businesses, though only time will tell if the potential long-term outcomes have been appropriately priced into equity shares, both positively and negatively. As we scan the fund’s portfolio of holdings, we see a collection of quality real estate assets and locations that we believe remain relevant and desirable. That said, our team will continue to seek to assemble and refine a portfolio of real estate holdings that we believe can offer enduring value over the long term.
Thank you for your continued support and confidence.
Respectfully submitted,

David M. Lee
President of the fund and chairman of its Investment Advisory Committee
July 25, 2017
The committee chairman has day-to-day responsibility for managing the portfolio and works with committee members in developing and executing the fund’s investment program.
RISKS OF INVESTING
The fund’s share price can fall because of weakness in the stock market, a particular industry, or specific holdings. Stock markets can decline for many reasons, including adverse political or economic developments, changes in investor psychology, or heavy institutional selling. The prospects for an industry or company may deteriorate because of a variety of factors, including disappointing earnings or changes in the competitive environment. In addition, the investment manager’s assessment of companies held in a fund may prove incorrect, resulting in losses or poor performance even in rising markets.
Funds that invest only in specific industries will experience greater volatility than funds investing in a broad range of industries. Due to its concentration in the real estate industry, the fund’s share price could be more volatile than that of a fund with a broader investment mandate. Trends perceived to be unfavorable to real estate, such as changes in the tax laws or rising interest rates, could cause a decline in share prices.
GLOSSARY
Lipper indexes: Fund benchmarks that consist of a small number of the largest mutual funds in a particular category as tracked by Lipper Inc.
Nasdaq Composite Index: A market value-weighted index of all common stocks listed on Nasdaq.
Price/earnings ratio (or multiple): A valuation measure calculated by dividing the price of a stock by its current or projected earnings per share. This ratio gives investors an idea of how much they are paying for current or future earnings power.
Real estate investment trusts (REITs): Publicly traded companies that own, develop, and operate apartment complexes, hotels, office buildings, and other commercial properties.
Wilshire U.S. Real Estate Securities Index: A float-adjusted, market capitalization-weighted index composed of publicly traded REITs and real estate operating companies.
Performance and Expenses
This chart shows the value of a hypothetical $10,000 investment in the fund over the past 10 fiscal year periods or since inception (for funds lacking 10-year records). The result is compared with benchmarks, which may include a broad-based market index and a peer group average or index. Market indexes do not include expenses, which are deducted from fund returns as well as mutual fund averages and indexes.
As a mutual fund shareholder, you may incur two types of costs: (1) transaction costs, such as redemption fees or sales loads, and (2) ongoing costs, including management fees, distribution and service (12b-1) fees, and other fund expenses. The following example is intended to help you understand your ongoing costs (in dollars) of investing in the fund and to compare these costs with the ongoing costs of investing in other mutual funds. The example is based on an investment of $1,000 invested at the beginning of the most recent six-month period and held for the entire period.
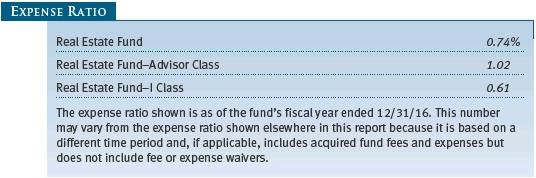
Please note that the fund has three share classes: The original share class (Investor Class) charges no distribution and service (12b-1) fee, the Advisor Class shares are offered only through unaffiliated brokers and other financial intermediaries and charge a 0.25% 12b-1 fee, and I Class shares are available to institutionally oriented clients and impose no 12b-1 or administrative fee payment. Each share class is presented separately in the table.
Actual Expenses
The first line of the following table (Actual) provides information about actual account values and expenses based on the fund’s actual returns. You may use the information on this line, together with your account balance, to estimate the expenses that you paid over the period. Simply divide your account value by $1,000 (for example, an $8,600 account value divided by $1,000 = 8.6), then multiply the result by the number on the first line under the heading “Expenses Paid During Period” to estimate the expenses you paid on your account during this period.
Hypothetical Example for Comparison Purposes
The information on the second line of the table (Hypothetical) is based on hypothetical account values and expenses derived from the fund’s actual expense ratio and an assumed 5% per year rate of return before expenses (not the fund’s actual return). You may compare the ongoing costs of investing in the fund with other funds by contrasting this 5% hypothetical example and the 5% hypothetical examples that appear in the shareholder reports of the other funds. The hypothetical account values and expenses may not be used to estimate the actual ending account balance or expenses you paid for the period.
Note: T. Rowe Price charges an annual account service fee of $20, generally for accounts with less than $10,000. The fee is waived for any investor whose T. Rowe Price mutual fund accounts total $50,000 or more; accounts electing to receive electronic delivery of account statements, transaction confirmations, prospectuses, and shareholder reports; or accounts of an investor who is a T. Rowe Price Personal Services or Enhanced Personal Services client (enrollment in these programs generally requires T. Rowe Price assets of at least $250,000). This fee is not included in the accompanying table. If you are subject to the fee, keep it in mind when you are estimating the ongoing expenses of investing in the fund and when comparing the expenses of this fund with other funds.
You should also be aware that the expenses shown in the table highlight only your ongoing costs and do not reflect any transaction costs, such as redemption fees or sales loads. Therefore, the second line of the table is useful in comparing ongoing costs only and will not help you determine the relative total costs of owning different funds. To the extent a fund charges transaction costs, however, the total cost of owning that fund is higher.

Unaudited
The accompanying notes are an integral part of these financial statements.
Unaudited

The accompanying notes are an integral part of these financial statements.
Unaudited
The accompanying notes are an integral part of these financial statements.
Unaudited


The accompanying notes are an integral part of these financial statements.
Unaudited

The accompanying notes are an integral part of these financial statements.
Unaudited
The accompanying notes are an integral part of these financial statements.
Unaudited
The accompanying notes are an integral part of these financial statements.
Unaudited
| Notes to Financial Statements |
T. Rowe Price Real Estate Fund, Inc. (the fund), is registered under the Investment Company Act of 1940 (the 1940 Act) as a diversified, open-end management investment company. The fund seeks to provide long-term growth through a combination of capital appreciation and current income. The fund has three classes of shares: the Real Estate Fund (Investor Class), the Real Estate Fund–Advisor Class (Advisor Class), and the Real Estate Fund–I Class (I Class). Advisor Class shares are sold only through unaffiliated brokers and other unaffiliated financial intermediaries. I Class shares generally are available only to investors meeting a $1,000,000 minimum investment or certain other criteria. The Advisor Class operates under a Board-approved Rule 12b-1 plan pursuant to which the class compensates financial intermediaries for distribution, shareholder servicing, and/or certain administrative services; the Investor and I Classes do not pay Rule 12b-1 fees. Each class has exclusive voting rights on matters related solely to that class; separate voting rights on matters that relate to all classes; and, in all other respects, the same rights and obligations as the other classes.
NOTE 1 - SIGNIFICANT ACCOUNTING POLICIES
Basis of Preparation The fund is an investment company and follows accounting and reporting guidance in the Financial Accounting Standards Board (FASB) Accounting Standards Codification Topic 946 (ASC 946). The accompanying financial statements were prepared in accordance with accounting principles generally accepted in the United States of America (GAAP), including, but not limited to, ASC 946. GAAP requires the use of estimates made by management. Management believes that estimates and valuations are appropriate; however, actual results may differ from those estimates, and the valuations reflected in the accompanying financial statements may differ from the value ultimately realized upon sale or maturity.
Investment Transactions, Investment Income, and Distributions Income and expenses are recorded on the accrual basis. Dividends received from mutual fund investments are reflected as dividend income; capital gain distributions are reflected as realized gain/loss. Dividend income and capital gain distributions are recorded on the ex-dividend date. Income tax-related interest and penalties, if incurred, would be recorded as income tax expense. Investment transactions are accounted for on the trade date. Realized gains and losses are reported on the identified cost basis. Distributions from REITs are initially recorded as dividend income and, to the extent such represent a return of capital or capital gain for tax purposes, are reclassified when such information becomes available. Income distributions are declared and paid by each class quarterly. Distributions to shareholders are recorded on the ex-dividend date. A capital gain distribution may also be declared and paid by the fund annually.
Class Accounting Shareholder servicing, prospectus, and shareholder report expenses incurred by each class are charged directly to the class to which they relate. Expenses common to all classes, investment income, and realized and unrealized gains and losses are allocated to the classes based upon the relative daily net assets of each class. The Advisor Class pays Rule 12b-1 fees, in an amount not exceeding 0.25% of the class’s average daily net assets.
Rebates Subject to best execution, the fund may direct certain security trades to brokers who have agreed to rebate a portion of the related brokerage commission to the fund in cash. Commission rebates are reflected as realized gain on securities in the accompanying financial statements and totaled $28,000 for the six months ended June 30, 2017.
Redemption Fees A 1% fee is assessed on redemptions of fund shares held for 90 days or less to deter short-term trading and to protect the interests of long-term shareholders. Redemption fees are withheld from proceeds that shareholders receive from the sale or exchange of fund shares. The fees are paid to the fund and are recorded as an increase to paid-in capital. The fees may cause the redemption price per share to differ from the net asset value per share.
New Accounting Guidance In October 2016, the Securities and Exchange Commission (SEC) issued a new rule, Investment Company Reporting Modernization, which, among other provisions, amends Regulation S-X to require standardized, enhanced disclosures, particularly related to derivatives, in investment company financial statements. Compliance with the guidance is effective for financial statements related to periods ending on or after August 1, 2017; adoption will have no effect on the fund’s net assets or results of operations.
NOTE 2 - VALUATION
The fund’s financial instruments are valued and each class’s net asset value (NAV) per share is computed at the close of the New York Stock Exchange (NYSE), normally 4 p.m. ET, each day the NYSE is open for business. However, the NAV per share may be calculated at a time other than the normal close of the NYSE if trading on the NYSE is restricted, if the NYSE closes earlier, or as may be permitted by the SEC.
Fair Value The fund’s financial instruments are reported at fair value, which GAAP defines as the price that would be received to sell an asset or paid to transfer a liability in an orderly transaction between market participants at the measurement date. The T. Rowe Price Valuation Committee (the Valuation Committee) is an internal committee that has been delegated certain responsibilities by the fund’s Board of Directors (the Board) to ensure that financial instruments are appropriately priced at fair value in accordance with GAAP and the 1940 Act. Subject to oversight by the Board, the Valuation Committee develops and oversees pricing-related policies and procedures and approves all fair value determinations. Specifically, the Valuation Committee establishes procedures to value securities; determines pricing techniques, sources, and persons eligible to effect fair value pricing actions; oversees the selection, services, and performance of pricing vendors; oversees valuation-related business continuity practices; and provides guidance on internal controls and valuation-related matters. The Valuation Committee reports to the Board and has representation from legal, portfolio management and trading, operations, risk management, and the fund’s treasurer.
Various valuation techniques and inputs are used to determine the fair value of financial instruments. GAAP establishes the following fair value hierarchy that categorizes the inputs used to measure fair value:
Level 1 – quoted prices (unadjusted) in active markets for identical financial instruments that the fund can access at the reporting date
Level 2 – inputs other than Level 1 quoted prices that are observable, either directly or indirectly (including, but not limited to, quoted prices for similar financial instruments in active markets, quoted prices for identical or similar financial instruments in inactive markets, interest rates and yield curves, implied volatilities, and credit spreads)
Level 3 – unobservable inputs
Observable inputs are developed using market data, such as publicly available information about actual events or transactions, and reflect the assumptions that market participants would use to price the financial instrument. Unobservable inputs are those for which market data are not available and are developed using the best information available about the assumptions that market participants would use to price the financial instrument. GAAP requires valuation techniques to maximize the use of relevant observable inputs and minimize the use of unobservable inputs. When multiple inputs are used to derive fair value, the financial instrument is assigned to the level within the fair value hierarchy based on the lowest-level input that is significant to the fair value of the financial instrument. Input levels are not necessarily an indication of the risk or liquidity associated with financial instruments at that level but rather the degree of judgment used in determining those values.
Valuation Techniques Equity securities listed or regularly traded on a securities exchange or in the over-the-counter (OTC) market are valued at the last quoted sale price or, for certain markets, the official closing price at the time the valuations are made. OTC Bulletin Board securities are valued at the mean of the closing bid and asked prices. A security that is listed or traded on more than one exchange is valued at the quotation on the exchange determined to be the primary market for such security. Listed securities not traded on a particular day are valued at the mean of the closing bid and asked prices. Actively traded equity securities listed on a domestic exchange generally are categorized in Level 1 of the fair value hierarchy. OTC Bulletin Board securities, certain preferred securities, and equity securities traded in inactive markets generally are categorized in Level 2 of the fair value hierarchy.
Investments in mutual funds are valued at the mutual fund’s closing NAV per share on the day of valuation and are categorized in Level 1 of the fair value hierarchy. Assets and liabilities other than financial instruments, including short-term receivables and payables, are carried at cost, or estimated realizable value, if less, which approximates fair value.
Thinly traded financial instruments and those for which the above valuation procedures are inappropriate or are deemed not to reflect fair value are stated at fair value as determined in good faith by the Valuation Committee. The objective of any fair value pricing determination is to arrive at a price that could reasonably be expected from a current sale. Financial instruments fair valued by the Valuation Committee are primarily private placements, restricted securities, warrants, rights, and other securities that are not publicly traded.
Subject to oversight by the Board, the Valuation Committee regularly makes good faith judgments to establish and adjust the fair valuations of certain securities as events occur and circumstances warrant. For instance, in determining the fair value of an equity investment with limited market activity, such as a private placement or a thinly traded public company stock, the Valuation Committee considers a variety of factors, which may include, but are not limited to, the issuer’s business prospects, its financial standing and performance, recent investment transactions in the issuer, new rounds of financing, negotiated transactions of significant size between other investors in the company, relevant market valuations of peer companies, strategic events affecting the company, market liquidity for the issuer, and general economic conditions and events. In consultation with the investment and pricing teams, the Valuation Committee will determine an appropriate valuation technique based on available information, which may include both observable and unobservable inputs. The Valuation Committee typically will afford greatest weight to actual prices in arm’s length transactions, to the extent they represent orderly transactions between market participants, transaction information can be reliably obtained, and prices are deemed representative of fair value. However, the Valuation Committee may also consider other valuation methods such as market-based valuation multiples; a discount or premium from market value of a similar, freely traded security of the same issuer; or some combination. Fair value determinations are reviewed on a regular basis and updated as information becomes available, including actual purchase and sale transactions of the issue. Because any fair value determination involves a significant amount of judgment, there is a degree of subjectivity inherent in such pricing decisions, and fair value prices determined by the Valuation Committee could differ from those of other market participants. Depending on the relative significance of unobservable inputs, including the valuation technique(s) used, fair valued securities may be categorized in Level 2 or 3 of the fair value hierarchy.
Valuation Inputs On June 30, 2017, all of the fund’s financial instruments were classified as Level 1, based on the inputs used to determine their fair values
There were no material transfers between Levels 1 and 2 during the six months ended June 30, 2017.
NOTE 3 - OTHER INVESTMENT TRANSACTIONS
Consistent with its investment objective, the fund engages in the following practices to manage exposure to certain risks and/or to enhance performance. The investment objective, policies, program, and risk factors of the fund are described more fully in the fund’s prospectus and Statement of Additional Information.
When-Issued Securities The fund may enter into when-issued purchase or sale commitments, pursuant to which it agrees to purchase or sell, respectively, an authorized but not yet issued security for a fixed unit price, with payment and delivery not due until issuance of the security on a scheduled future date. When-issued securities may be new securities or securities issued through a corporate action, such as a reorganization or restructuring. Until settlement, the fund maintains liquid assets sufficient to settle its commitment to purchase a when-issued security or, in the case of a sale commitment, the fund maintains an entitlement to the security to be sold. Amounts realized on when-issued transactions are included in realized gain/loss on securities in the accompanying financial statements.
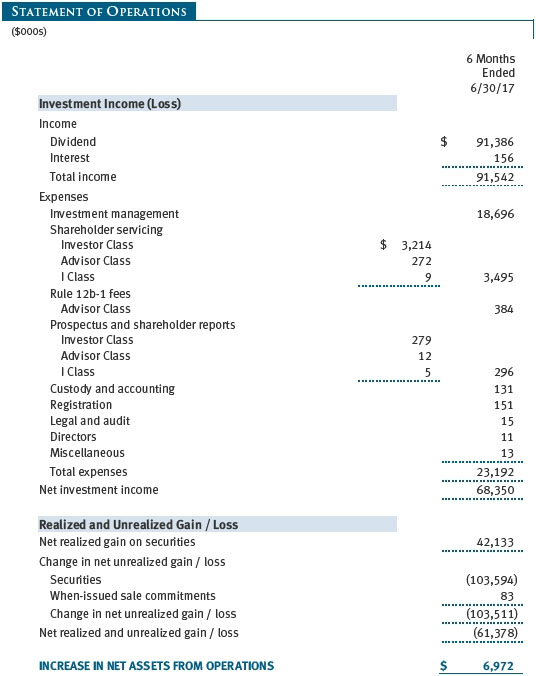
Other Purchases and sales of portfolio securities other than short-term securities aggregated $552,422,000 and $354,082,000, respectively, for the six months ended June 30, 2017.
NOTE 4 - FEDERAL INCOME TAXES
No provision for federal income taxes is required since the fund intends to continue to qualify as a regulated investment company under Subchapter M of the Internal Revenue Code and distribute to shareholders all of its taxable income and gains. Distributions determined in accordance with federal income tax regulations may differ in amount or character from net investment income and realized gains for financial reporting purposes. Financial reporting records are adjusted for permanent book/tax differences to reflect tax character but are not adjusted for temporary differences. The amount and character of tax-basis distributions and composition of net assets are finalized at fiscal year-end; accordingly, tax-basis balances have not been determined as of the date of this report.
The fund intends to retain realized gains to the extent of available capital loss carryforwards. Because the fund is required to use capital loss carryforwards that do not expire before those with expiration dates, all or a portion of its capital loss carryforwards subject to expiration could ultimately go unused. As of December 31, 2016, the fund had $1,858,000 of available capital loss carryforwards.
At June 30, 2017, the cost of investments for federal income tax purposes was $4,103,880,000. Net unrealized gain aggregated $2,100,889,000 at period-end, of which $2,153,735,000 related to appreciated investments and $52,846,000 related to depreciated investments.
NOTE 5 - RELATED PARTY TRANSACTIONS
The fund is managed by T. Rowe Price Associates, Inc. (Price Associates), a wholly owned subsidiary of T. Rowe Price Group, Inc. (Price Group). The investment management agreement between the fund and Price Associates provides for an annual investment management fee, which is computed daily and paid monthly. The fee consists of an individual fund fee, equal to 0.30% of the fund’s average daily net assets, and a group fee. The group fee rate is calculated based on the combined net assets of certain mutual funds sponsored by Price Associates (the group) applied to a graduated fee schedule, with rates ranging from 0.48% for the first $1 billion of assets to 0.265% for assets in excess of $650 billion. The fund’s group fee is determined by applying the group fee rate to the fund’s average daily net assets. At June 30, 2017, the effective annual group fee rate was 0.29%.
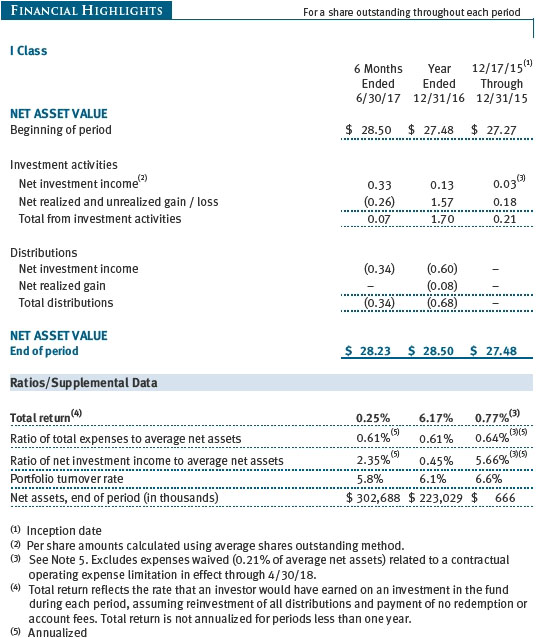
The I Class is subject to an operating expense limitation (I Class limit) pursuant to which Price Associates is contractually required to pay all operating expenses of the I Class, excluding management fees, interest, expenses related to borrowings, taxes, brokerage, and other non-recurring expenses permitted by the investment management agreement, to the extent such operating expenses, on an annualized basis, exceed 0.05% of average net assets. This agreement will continue until April 30, 2018, and may be renewed, revised, or revoked only with approval of the fund’s Board. The I Class is required to repay Price Associates for expenses previously paid to the extent the class’s net assets grow or expenses decline sufficiently to allow repayment without causing the class’s operating expenses to exceed the I Class limit in effect at the time of the waiver. However, no repayment will be made more than three years after the date of a payment or waiver. For the six months ended June 30, 2017, the I Class operated below its expense limitation.
In addition, the fund has entered into service agreements with Price Associates and two wholly owned subsidiaries of Price Associates (collectively, Price). Price Associates provides certain accounting and administrative services to the fund. T. Rowe Price Services, Inc. provides shareholder and administrative services in its capacity as the fund’s transfer and dividend-disbursing agent. T. Rowe Price Retirement Plan Services, Inc. provides subaccounting and recordkeeping services for certain retirement accounts invested in the Investor Class and I Class. For the six months ended June 30, 2017, expenses incurred pursuant to these service agreements were $41,000 for Price Associates; $647,000 for T. Rowe Price Services, Inc.; and $240,000 for T. Rowe Price Retirement Plan Services, Inc. The total amount payable at period-end pursuant to these service agreements is reflected as Due to Affiliates in the accompanying financial statements.
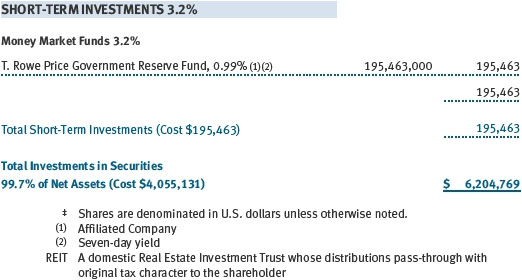
The fund may invest in the T. Rowe Price Government Reserve Fund, the T. Rowe Price Treasury Reserve Fund, or the T. Rowe Price Short-Term Fund (collectively, the Price Reserve Funds), open-end management investment companies managed by Price Associates and considered affiliates of the fund. The Price Reserve Funds are offered as short-term investment options to mutual funds, trusts, and other accounts managed by Price Associates or its affiliates and are not available for direct purchase by members of the public. The Price Reserve Funds pay no investment management fees.
The fund may participate in securities purchase and sale transactions with other funds or accounts advised by Price Associates (cross trades), in accordance with procedures adopted by the fund’s Board and Securities and Exchange Commission rules, which require, among other things, that such purchase and sale cross trades be effected at the independent current market price of the security. During the six months ended June 30, 2017, the aggregate value of purchases and sales cross trades with other funds or accounts advised by Price Associates was less than 1% of the fund’s net assets as of June 30, 2017.
| Information on Proxy Voting Policies, Procedures, and Records |
A description of the policies and procedures used by T. Rowe Price funds and portfolios to determine how to vote proxies relating to portfolio securities is available in each fund’s Statement of Additional Information. You may request this document by calling 1-800-225-5132 or by accessing the SEC’s website, sec.gov.
The description of our proxy voting policies and procedures is also available on our corporate website. To access it, please visit the following Web page:
https://www3.troweprice.com/usis/corporate/en/utility/policies.html
Scroll down to the section near the bottom of the page that says, “Proxy Voting Policies.” Click on the Proxy Voting Policies link in the shaded box.
Each fund’s most recent annual proxy voting record is available on our website and through the SEC’s website. To access it through T. Rowe Price, visit the website location shown above, and scroll down to the section near the bottom of the page that says, “Proxy Voting Records.” Click on the Proxy Voting Records link in the shaded box.
| How to Obtain Quarterly Portfolio Holdings |
The fund files a complete schedule of portfolio holdings with the Securities and Exchange Commission for the first and third quarters of each fiscal year on Form N-Q. The fund’s Form N-Q is available electronically on the SEC’s website (sec.gov); hard copies may be reviewed and copied at the SEC’s Public Reference Room, 100 F St. N.E., Washington, DC 20549. For more information on the Public Reference Room, call 1-800-SEC-0330.
| Approval of Investment Management Agreement |
Each year, the fund’s Board of Directors (Board) considers the continuation of the investment management agreement (Advisory Contract) between the fund and its investment advisor, T. Rowe Price Associates, Inc. (Advisor). In that regard, at an in-person meeting held on March 6–7, 2017 (Meeting), the Board, including a majority of the fund’s independent directors, approved the continuation of the fund’s Advisory Contract. At the Meeting, the Board considered the factors and reached the conclusions described below relating to the selection of the Advisor and the approval of the Advisory Contract. The independent directors were assisted in their evaluation of the Advisory Contract by independent legal counsel from whom they received separate legal advice and with whom they met separately.
In providing information to the Board, the Advisor was guided by a detailed set of requests for information submitted by independent legal counsel on behalf of the independent directors. In considering and approving the Advisory Contract, the Board considered the information it believed was relevant, including, but not limited to, the information discussed below. The Board considered not only the specific information presented in connection with the Meeting but also the knowledge gained over time through interaction with the Advisor about various topics. The Board meets regularly and, at each of its meetings, covers an extensive agenda of topics and materials and considers factors that are relevant to its annual consideration of the renewal of the T. Rowe Price funds’ advisory contracts, including performance and the services and support provided to the funds and their shareholders.
Services Provided by the Advisor
The Board considered the nature, quality, and extent of the services provided to the fund by the Advisor. These services included, but were not limited to, directing the fund’s investments in accordance with its investment program and the overall management of the fund’s portfolio, as well as a variety of related activities such as financial, investment operations, and administrative services; compliance; maintaining the fund’s records and registrations; and shareholder communications. The Board also reviewed the background and experience of the Advisor’s senior management team and investment personnel involved in the management of the fund, as well as the Advisor’s compliance record. The Board concluded that it was satisfied with the nature, quality, and extent of the services provided by the Advisor.
Investment Performance of the Fund
The Board took into account discussions with the Advisor and reports that it receives throughout the year relating to fund performance. In connection with the Meeting, the Board reviewed the fund’s net annualized total returns for the 1-, 2-, 3-, 4-, 5-, and 10-year periods as of September 30, 2016, and compared these returns with the performance of a peer group of funds with similar investment programs and a wide variety of other previously agreed-upon comparable performance measures and market data, including those supplied by Broadridge, which is an independent provider of mutual fund data.
On the basis of this evaluation and the Board’s ongoing review of investment results, and factoring in the relative market conditions during certain of the performance periods, the Board concluded that the fund’s performance was satisfactory.
Costs, Benefits, Profits, and Economies of Scale
The Board reviewed detailed information regarding the revenues received by the Advisor under the Advisory Contract and other benefits that the Advisor (and its affiliates) may have realized from its relationship with the fund, including any research received under “soft dollar” agreements and commission-sharing arrangements with broker-dealers. The Board considered that the Advisor may receive some benefit from soft-dollar arrangements pursuant to which research is received from broker-dealers that execute the fund’s portfolio transactions. The Board received information on the estimated costs incurred and profits realized by the Advisor from managing the T. Rowe Price funds. The Board also reviewed estimates of the profits realized from managing the fund in particular, and the Board concluded that the Advisor’s profits were reasonable in light of the services provided to the fund.
The Board also considered whether the fund benefits under the fee levels set forth in the Advisory Contract from any economies of scale realized by the Advisor. Under the Advisory Contract, the fund pays a fee to the Advisor for investment management services composed of two components—a group fee rate based on the combined average net assets of most of the T. Rowe Price funds (including the fund) that declines at certain asset levels and an individual fund fee rate based on the fund’s average daily net assets—and the fund pays its own expenses of operations (subject to an expense limitation agreed to by the Advisor with respect to the fund’s I Class). At the Meeting, the Board approved an additional 0.005% breakpoint to the group fee schedule, effective May 1, 2017. With the new breakpoint, the group fee rate will decline to 0.265% when the combined average net assets of the applicable T. Rowe Price funds exceed $650 billion. The Board concluded that the advisory fee structure for the fund continued to provide for a reasonable sharing of benefits from any economies of scale with the fund’s investors.
Fees and Expenses
The Board was provided with information regarding industry trends in management fees and expenses. Among other things, the Board reviewed data for peer groups that were compiled by Broadridge, which compared: (i) contractual management fees, total expenses, actual management fees, and non-management expenses of the Investor Class of the fund with a group of competitor funds selected by Broadridge (Investor Class Expense Group); (ii) total expenses and actual management fees of the Advisor Class of the fund with a group of competitor funds selected by Broadridge (Advisor Class Expense Group); and (iii) total expenses, actual management fees, and non-management expenses of the Investor Class of the fund with a broader set of funds within the Lipper investment classification (Expense Universe). The Board considered the fund’s contractual management fee rate, actual management fee rate (which reflects the management fees actually received from the fund by the Advisor after any applicable waivers, reductions, or reimbursements), operating expenses, and total expenses (which reflect the net total expense ratio of the fund after any waivers, reductions, or reimbursements) in comparison with the information for the Broadridge peer groups. Broadridge generally constructed the peer groups by seeking the most comparable funds based on similar investment classifications and objectives, expense structure, asset size, and operating components and attributes and ranked funds into quintiles, with the first quintile representing the funds with the lowest relative expenses and the fifth quintile representing the funds with the highest relative expenses. The information provided to the Board indicated that the fund’s contractual management fee ranked in the second quintile (Investor Class Expense Group), the fund’s actual management fee rate ranked in the second quintile (Investor Class Expense Group, Advisor Class Expense Group, and Expense Universe), and the fund’s total expenses ranked in the first quintile (Investor Class Expense Group, Advisor Class Expense Group, and Expense Universe).
The Board also reviewed the fee schedules for institutional accounts and private accounts with similar mandates that are advised or subadvised by the Advisor and its affiliates. Management provided the Board with information about the Advisor’s responsibilities and services provided to subadvisory and other institutional account clients, including information about how the requirements and economics of the institutional business are fundamentally different from those of the mutual fund business. The Board considered information showing that the Advisor’s mutual fund business is generally more complex from a business and compliance perspective than its institutional account business and considered various relevant factors, such as the broader scope of operations and oversight, more extensive shareholder communication infrastructure, greater asset flows, heightened business risks, and differences in applicable laws and regulations associated with the Advisor’s proprietary mutual fund business. In assessing the reasonableness of the fund’s management fee rate, the Board considered the differences in the nature of the services required for the Advisor to manage its mutual fund business versus managing a discrete pool of assets as a subadvisor to another institution’s mutual fund or for an institutional account and that the Advisor generally performs significant additional services and assumes greater risk in managing the fund and other T. Rowe Price funds than it does for institutional account clients.
On the basis of the information provided and the factors considered, the Board concluded that the fees paid by the fund under the Advisory Contract are reasonable.
Approval of the Advisory Contract
As noted, the Board approved the continuation of the Advisory Contract. No single factor was considered in isolation or to be determinative to the decision. Rather, the Board concluded, in light of a weighting and balancing of all factors considered, that it was in the best interests of the fund and its shareholders for the Board to approve the continuation of the Advisory Contract (including the fees to be charged for services thereunder).
Item 2. Code of Ethics.
A code of ethics, as defined in Item 2 of Form N-CSR, applicable to its principal executive officer, principal financial officer, principal accounting officer or controller, or persons performing similar functions is filed as an exhibit to the registrant’s annual Form N-CSR. No substantive amendments were approved or waivers were granted to this code of ethics during the registrant’s most recent fiscal half-year.
Item 3. Audit Committee Financial Expert.
Disclosure required in registrant’s annual Form N-CSR.
Item 4. Principal Accountant Fees and Services.
Disclosure required in registrant’s annual Form N-CSR.
Item 5. Audit Committee of Listed Registrants.
Not applicable.
Item 6. Investments.
(a) Not applicable. The complete schedule of investments is included in Item 1 of this Form N-CSR.
(b) Not applicable.
Item 7. Disclosure of Proxy Voting Policies and Procedures for Closed-End Management Investment Companies.
Not applicable.
Item 8. Portfolio Managers of Closed-End Management Investment Companies.
Not applicable.
Item 9. Purchases of Equity Securities by Closed-End Management Investment Company and Affiliated Purchasers.
Not applicable.
Item 10. Submission of Matters to a Vote of Security Holders.
Not applicable.
Item 11. Controls and Procedures.
(a) The registrant’s principal executive officer and principal financial officer have evaluated the registrant’s disclosure controls and procedures within 90 days of this filing and have concluded that the registrant’s disclosure controls and procedures were effective, as of that date, in ensuring that information required to be disclosed by the registrant in this Form N-CSR was recorded, processed, summarized, and reported timely.
(b) The registrant’s principal executive officer and principal financial officer are aware of no change in the registrant’s internal control over financial reporting that occurred during the registrant’s second fiscal quarter covered by this report that has materially affected, or is reasonably likely to materially affect, the registrant’s internal control over financial reporting.
Item 12. Exhibits.
(a)(1) The registrant’s code of ethics pursuant to Item 2 of Form N-CSR is filed with the registrant’s annual Form N-CSR.
(2) Separate certifications by the registrant's principal executive officer and principal financial officer, pursuant to Section 302 of the Sarbanes-Oxley Act of 2002 and required by Rule 30a-2(a) under the Investment Company Act of 1940, are attached.
(3) Written solicitation to repurchase securities issued by closed-end companies: not applicable.
(b) A certification by the registrant's principal executive officer and principal financial officer, pursuant to Section 906 of the Sarbanes-Oxley Act of 2002 and required by Rule 30a-2(b) under the Investment Company Act of 1940, is attached.
SIGNATURES
Pursuant to the requirements of the Securities Exchange Act of 1934 and the Investment Company Act of 1940, the registrant has duly caused this report to be signed on its behalf by the undersigned, thereunto duly authorized.
T. Rowe Price Real Estate Fund, Inc.
| By | | /s/ Edward C. Bernard |
| | | Edward C. Bernard |
| | | Principal Executive Officer |
| |
| Date | | August 21, 2017 | | | | |
Pursuant to the requirements of the Securities Exchange Act of 1934 and the Investment Company Act of 1940, this report has been signed below by the following persons on behalf of the registrant and in the capacities and on the dates indicated.
| By | | /s/ Edward C. Bernard |
| | | Edward C. Bernard |
| | | Principal Executive Officer |
| |
| Date | | August 21, 2017 | | | | |
| |
| |
| By | | /s/ Catherine D. Mathews |
| | | Catherine D. Mathews |
| | | Principal Financial Officer |
| |
| Date | | August 21, 2017 | | | | |