UNITED STATES
SECURITIES AND EXCHANGE COMMISSION
Washington, D.C. 20549
FORM N-CSR
CERTIFIED SHAREHOLDER REPORT OF REGISTERED
MANAGEMENT INVESTMENT COMPANIES
Investment Company Act File Number: 811-08371
| T. Rowe Price Real Estate Fund, Inc. |
|
| (Exact name of registrant as specified in charter) |
| |
| 100 East Pratt Street, Baltimore, MD 21202 |
|
| (Address of principal executive offices) |
| |
| David Oestreicher |
| 100 East Pratt Street, Baltimore, MD 21202 |
|
| (Name and address of agent for service) |
Registrant’s telephone number, including area code: (410) 345-2000
Date of fiscal year end: December 31
Date of reporting period: June 30, 2022
Item 1. Reports to Shareholders
(a) Report pursuant to Rule 30e-1.
| Real Estate Fund | June 30, 2022 |
| TRREX | Investor Class |
| PAREX | Advisor Class |
| TIRRX | I Class |
| T. ROWE PRICE Real Estate Fund |
|
HIGHLIGHTS
| ■ | The Real Estate Fund produced negative results during a broad market downturn in the first half of 2022. The fund underperformed its benchmark and performed in line with its Lipper peer group. |
| | |
| ■ | A lack of exposure to triple net real estate weighed on the portfolio’s relative results, while our allocation to the infrastructure sector aided performance. |
| | |
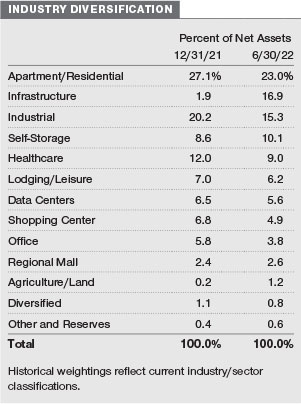
| ■ | The fund’s largest positions are in apartment/residential, infrastructure, and industrial real estate stocks, which made up about 55% of the portfolio at the end of the period. |
| | |
| ■ | We believe a solid demand environment combined with below-average deliveries of new space could be supportive for our holdings despite a less favorable macro backdrop. |

Log in to your account at troweprice.com for more information.
*Certain mutual fund accounts that are assessed an annual account service fee can also save money by switching to e-delivery.
Market Commentary
Dear Shareholder
Major stock and bond indexes produced sharply negative results during the first half of 2022 as investors contended with persistently high inflation, tightening financial conditions, and slowing growth.
After reaching an all-time high on January 3, the S&P 500 Index finished the period down about 20%, the worst first half of a calendar year for the index since 1970. Double-digit losses were common in equity markets around the globe, and bond investors also faced a historically tough environment amid a sharp rise in interest rates.
Value shares outperformed growth stocks as equity investors turned risk averse and rising rates put downward pressure on growth stock valuations. Emerging markets stocks held up somewhat better than shares in developed markets due to the strong performance of some oil-exporting countries. Meanwhile, the U.S. dollar strengthened during the period, which weighed on returns for U.S. investors in international securities.
Within the S&P 500, energy was the only bright spot, gaining more than 30% as oil prices jumped in response to Russia’s invasion of Ukraine and the ensuing commodity supply crunch. Typically defensive shares, such as utilities, consumer staples, and health care, finished in negative territory but held up relatively well. The consumer discretionary, communication services, and information technology sectors were the weakest performers. Shares of some major retailers fell sharply following earnings misses driven in part by overstocked inventories.
Inflation remained the leading concern for investors throughout the period. Despite hopes in 2021 that the problem was transitory, and later expectations that inflation would peak in the spring, headline consumer prices continued to grind higher throughout the first half of 2022. The war in Ukraine exacerbated already existing supply chain problems, and other factors, such as the impact of the fiscal and monetary stimulus enacted during the pandemic and strong consumer demand, also pushed prices higher. The May consumer price index report (the last to be issued during our reporting period) showed prices increasing 8.6% over the 12-month period, the largest jump since late 1981.
In response, the Federal Reserve, which at the end of 2021 had forecast that only three 25-basis-point (0.25 percentage point) rate hikes would be necessary in all of 2022, rapidly shifted in a hawkish direction and executed three rate increases in the first six months of the year. The policy moves included hikes of 25, 50, and 75 basis points—the largest single increase since 1994—increasing the central bank’s short-term lending benchmark from near zero to a target range of 1.50% to 1.75% by the end of June. In addition, the Fed ended the purchases of Treasuries and agency mortgage-backed securities that it had begun to support the economy early in the pandemic and started reducing its balance sheet in June.
Longer-term bond yields also increased considerably as the Fed tightened monetary policy, with the yield on the benchmark 10-year U.S. Treasury note reaching 3.49% on June 14, its highest level in more than a decade. (Bond prices and yields move in opposite directions.) Higher mortgage rates led to signs of cooling in the housing market.
The economy continued to add jobs during the period, and other indicators pointed to a slowing but still expanding economy. However, the University of Michigan consumer sentiment index dropped in June to its lowest level since records began in 1978 as higher inflation expectations undermined confidence.
Looking ahead, investors are likely to remain focused on whether the Fed can tame inflation without sending the economy into recession, a backdrop that could produce continued volatility. We believe this environment makes skilled active management a critical tool for identifying risks and opportunities, and our investment teams will continue to use fundamental research to identify companies that can add value to your portfolio over the long term.
Thank you for your continued confidence in T. Rowe Price.
Sincerely,

Robert Sharps
CEO and President
Management’s Discussion of Fund Performance
INVESTMENT OBJECTIVE
The fund seeks to provide long-term growth through a combination of capital appreciation and current income.
FUND COMMENTARY
How did the fund perform in the past six months?
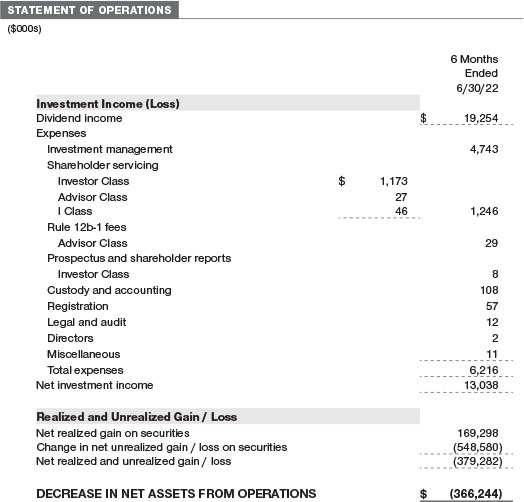
The Real Estate Fund returned -20.26% for the six months ended June 30, 2022. The fund underperformed its benchmark, the FTSE NAREIT All Equity REITs Index, but performed in line with its Lipper peer group. Effective May 1, 2022, the primary benchmark for the Real Estate Fund changed from the Wilshire U.S. Real Estate Securities Index to the FTSE NAREIT All Equity REITs Index. (Returns for the Advisor and I Class shares varied slightly, reflecting their different fee structures. Past performance cannot guarantee future results.)

On June 27, 2022, the fund’s Board of Directors declared a second-quarter dividend of $0.06 per share to shareholders of record on that day. You should have received your check or statement reflecting this distribution. The dividend was distributed on June 29. (Distributions for the Advisor and I Class shares may vary.)
What factors influenced the fund’s performance?
Real estate stocks delivered negative results during the period but performed roughly in line with the broader U.S. equity market. Overall, stocks fell sharply as the Federal Reserve aggressively raised interest rates to curb the highest inflation in four decades. Within the real estate benchmark, performance was negative for all property types, although returns varied widely.
Generally, sectors with greater exposure to risks from rising interest rates, higher inflation, or a weakening growth picture faced headwinds. Regional malls, industrial real estate, and offices performed the worst, while triple net real estate, lodging/leisure, and infrastructure fared the best.
Our lack of exposure to triple net real estate was the largest detractor from relative results during the period as the higher-yielding sector significantly outperformed the benchmark in a rising rate environment. Triple net assets, where leaseholders pay maintenance, insurance, and taxes, were also looked at favorably during this period as property owners in the sector have a buffer against rising expenses despite relatively stagnant rent growth.
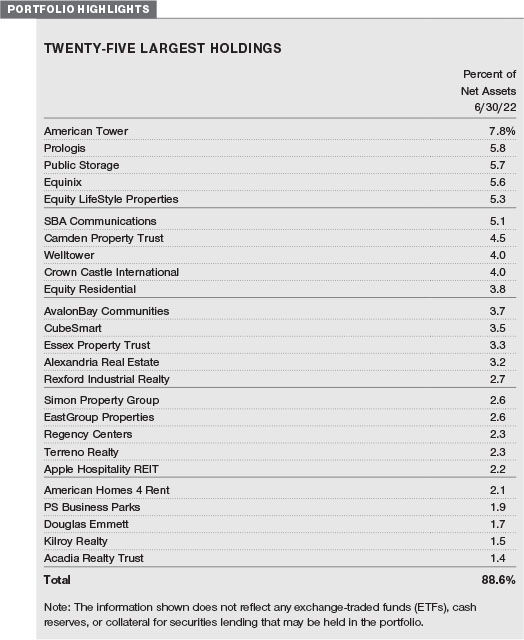
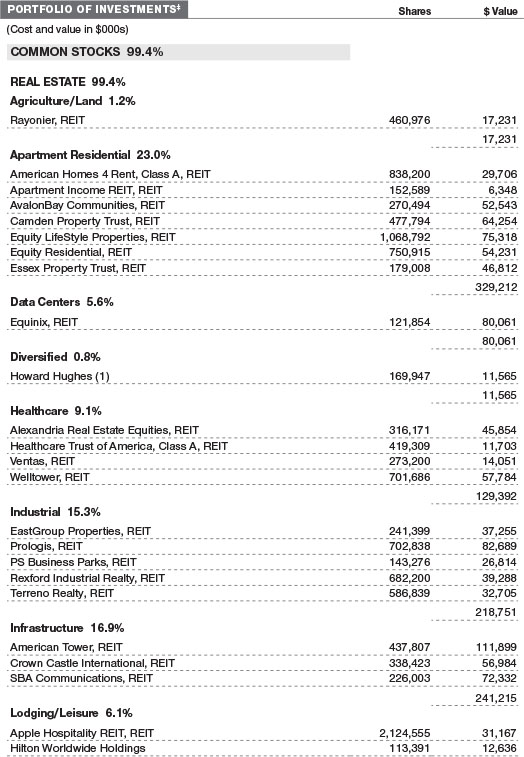
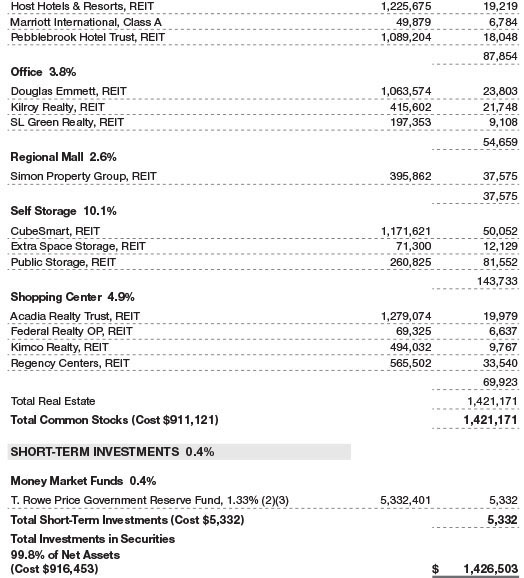
Stock selection and an overweight in industrial real estate also detracted. Our positions in Terreno Realty and EastGroup Properties suffered losses on the news that Amazon would slow down its pace of new warehouse leasing. (Please refer to the fund’s portfolio of investments for a complete list of holdings and the amount each represents in the portfolio.)
The lodging/leisure sector also weighed on relative results. Our overweight allocation to hotels was a positive as the sector benefited from continued strong demand for leisure travel and a rebound in business travel. However, stock selection in the sector offset these gains. Our positions in Pebblebrook Hotel Trust and Hilton Worldwide underperformed amid increasing recession concerns late in the period.
Effective May 1, 2022, the primary benchmark for the Real Estate Fund changed from the Wilshire U.S. Real Estate Securities Index to the FTSE NAREIT All Equity REITs Index. Concurrent with this change and throughout the second quarter, we increased our exposure to the infrastructure segment. The purchases proved well timed and helped relative performance late in the period.
An underweight allocation to regional malls contributed to results. The sector, including our holding in Simon Property Group, struggled amid signs that consumers were reducing discretionary spending due to high inflation. Stock selection in the self-storage sector also added value, led by Public Storage, which reported better-than-expected earnings.
How is the fund positioned?
As shown in the Industry Diversification chart on page 5, our largest positions are in apartment/residential, infrastructure, and industrial stocks, which made up about 55% of the portfolio at the end of the period. Our industry weightings are largely determined by our bottom-up approach to stock selection.
The fund retained an overweight position in apartment and residential real estate investment trusts (REITs) during the period. Following strong relative and absolute performance early in the year, we trimmed our investments in apartment REITs Camden Property Trust and Essex Property Trust.
We also eliminated our position in student housing provider American Campus Communities after the company accepted a takeover offer at a premium to where its shares had been trading. With the proceeds, we initiated a position in American Homes 4 Rent, which is focused on single-family home rentals. We believe a lack of housing supply should drive continued strength in single-family rental rates, and we like the sector’s relatively defensive characteristics.
As noted earlier, in concurrence with the benchmark change, we increased our allocation to cell tower companies within the infrastructure sector during the period. We believe cell tower companies have attractive business models in that each individual tower has strong pricing power over its coverage area due to strict zoning rules. We initiated positions in American Tower and Crown Castle International and built a larger position in SBA Communications.
The fund remained overweight industrial real estate as we continue to have a positive outlook for the fundamental results in the sector. We trimmed our position in Prologis during the period to take advantage of more attractive valuations in other names.
We also added new names in the healthcare and self-storage sectors. We initiated a position in Ventas, a diversified healthcare REIT that owns senior housing, medical office, and life science properties. We partially funded the position by trimming our large investment in Welltower, which owns similar assets and has performed well on a relative basis. Following a pullback in self-storage stocks late in the period, we initiated a position in Extra Space Storage and added to our existing investment in Public Storage.
What is portfolio management’s outlook?
As fears of a looming recession crept into the market throughout the first half of the year, real estate stock prices moved lower. Sentiment around real estate fundamentals quickly shifted from viewing inflationary forces as a positive for pricing power to concerns about inflation prompting the Fed into faster and more restrictive interest rate policy.
Higher interest rates, in isolation, represent a headwind for real estate on two fronts. First, interest rates are one of the two major inputs into real estate valuations. Higher interest rates put upward pressure on cap rates and therefore downward pressure on valuations. In addition, higher interest rates will eventually flow through financing costs for the companies that we invest in, crimping earnings growth, although this will happen over several years.
Fortunately, real estate valuations are also driven by demand and supply. Demand for commercial and residential real estate has thus far remained strong. Leasing continues apace in various sectors, including residential, industrial warehouses, self-storage, and hotels. In addition, delays in the construction of new buildings during 2020 and 2021 due to concerns around the pandemic, elongated permitting timelines, and supply chain issues will result in more modest construction deliveries throughout the remainder of 2022 and into 2023. A solid demand environment combined with below-average deliveries of new space should help support the earnings, cash flow, and dividend growth of our holdings.
We remain focused on investing in companies where we believe the real estate is well located, meaning demand exceeds supply over a sustainable time period. This remains critical to our philosophy, as rent growth is needed to combat the headwind from higher interest rates.
Lastly, while drawdowns in the stock market are never desirable, valuations for our opportunity set of real estate stocks are improved. The fears prevalent in the market around a recession and higher interest rates are, to at least some degree, already reflected in real estate stock valuations. As a result, we are optimistic on the return potential for our portfolio of real estate companies going forward.
The views expressed reflect the opinions of T. Rowe Price as of the date of this report and are subject to change based on changes in market, economic, or other conditions. These views are not intended to be a forecast of future events and are no guarantee of future results.
RISKS OF INVESTING
The fund’s share price can fall because of weakness in the stock market, a particular industry, or specific holdings. Stock markets can decline for many reasons, including adverse political or economic developments, changes in investor psychology, or heavy institutional selling. The prospects for an industry or company may deteriorate because of a variety of factors, including disappointing earnings or changes in the competitive environment. In addition, the investment manager’s assessment of companies held in a fund may prove incorrect, resulting in losses or poor performance even in rising markets.
Funds that invest only in specific industries will experience greater volatility than funds investing in a broad range of industries. Due to its concentration in the real estate industry, the fund’s share price could be more volatile than that of a fund with a broader investment mandate. Trends perceived to be unfavorable to real estate, such as changes in the tax laws or rising interest rates, could cause a decline in share prices.
BENCHMARK INFORMATION
Note: FTSE is a trademark of the LSE Group and is used by FTSE International Limited (“FTSE”) under license. “NAREIT” is a trademark of the Nareit. All rights in the FTSE NAREIT All Equity REITs Index (the “Index”) vest in FTSE and Nareit. Neither FTSE, nor the LSE Group, nor Nareit accept any liability for any errors or omissions in the indexes or data and no party may rely on any indexes or data contained in this communication. No further distribution of data from the FTSE or Nareit is permitted without the relevant FTSE’s express written consent. FTSE, the LSE Group, and Nareit do not promote, sponsor or endorse the content of this communication.
Note: Portions of the mutual fund information contained in this report were supplied by Lipper, a Refinitiv Company, subject to the following: Copyright 2022 © Refinitiv. All rights reserved. Any copying, republication or redistribution of Lipper content is expressly prohibited without the prior written consent of Lipper. Lipper shall not be liable for any errors or delays in the content, or for any actions taken in reliance thereon.
Note: The Wilshire IndexesSM and Wilshire AtlasSM have been licensed for use by T. Rowe Price and all content is © 2022 Wilshire Associates Incorporated. All rights reserved.
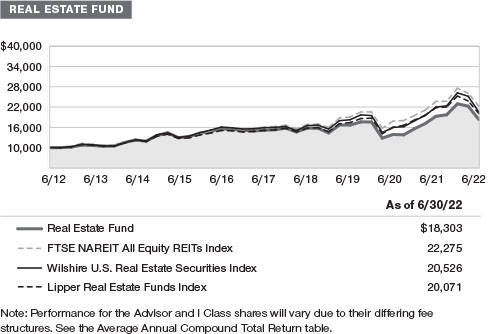
GROWTH OF $10,000
This chart shows the value of a hypothetical $10,000 investment in the fund over the past 10 fiscal year periods or since inception (for funds lacking 10-year records). The result is compared with benchmarks, which include a broad-based market index and may also include a peer group average or index. Market indexes do not include expenses, which are deducted from fund returns as well as mutual fund averages and indexes.
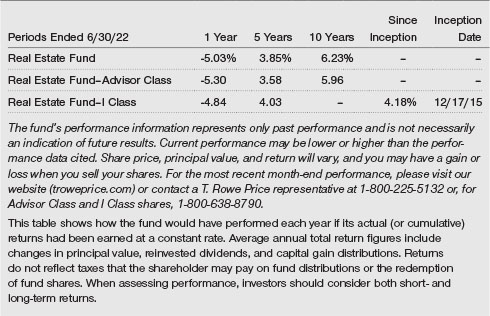
AVERAGE ANNUAL COMPOUND TOTAL RETURN
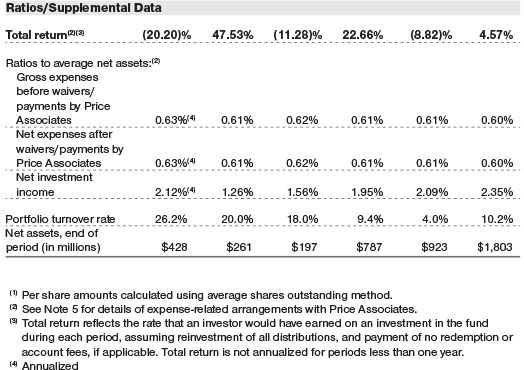
EXPENSE RATIO
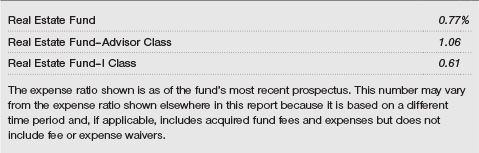
FUND EXPENSE EXAMPLE
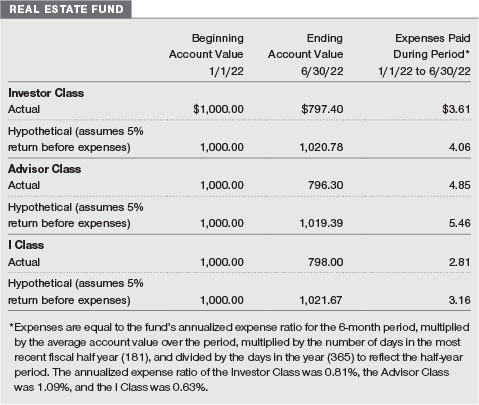
As a mutual fund shareholder, you may incur two types of costs: (1) transaction costs, such as redemption fees or sales loads, and (2) ongoing costs, including management fees, distribution and service (12b-1) fees, and other fund expenses. The following example is intended to help you understand your ongoing costs (in dollars) of investing in the fund and to compare these costs with the ongoing costs of investing in other mutual funds. The example is based on an investment of $1,000 invested at the beginning of the most recent six-month period and held for the entire period.
Please note that the fund has three share classes: The original share class (Investor Class) charges no distribution and service (12b-1) fee, the Advisor Class shares are offered only through unaffiliated brokers and other financial intermediaries and charge a 0.25% 12b-1 fee, and I Class shares are available to institutionally oriented clients and impose no 12b-1 or administrative fee payment. Each share class is presented separately in the table.
Actual Expenses
The first line of the following table (Actual) provides information about actual account values and expenses based on the fund’s actual returns. You may use the information on this line, together with your account balance, to estimate the expenses that you paid over the period. Simply divide your account value by $1,000 (for example, an $8,600 account value divided by $1,000 = 8.6), then multiply the result by the number on the first line under the heading “Expenses Paid During Period” to estimate the expenses you paid on your account during this period.
Hypothetical Example for Comparison Purposes
The information on the second line of the table (Hypothetical) is based on hypothetical account values and expenses derived from the fund’s actual expense ratio and an assumed 5% per year rate of return before expenses (not the fund’s actual return). You may compare the ongoing costs of investing in the fund with other funds by contrasting this 5% hypothetical example and the 5% hypothetical examples that appear in the shareholder reports of the other funds. The hypothetical account values and expenses may not be used to estimate the actual ending account balance or expenses you paid for the period.
Note: T. Rowe Price charges an annual account service fee of $20, generally for accounts with less than $10,000. The fee is waived for any investor whose T. Rowe Price mutual fund accounts total $50,000 or more; accounts electing to receive electronic delivery of account statements, transaction confirmations, prospectuses, and shareholder reports; or accounts of an investor who is a T. Rowe Price Personal Services or Enhanced Personal Services client (enrollment in these programs generally requires T. Rowe Price assets of at least $250,000). This fee is not included in the accompanying table. If you are subject to the fee, keep it in mind when you are estimating the ongoing expenses of investing in the fund and when comparing the expenses of this fund with other funds.
You should also be aware that the expenses shown in the table highlight only your ongoing costs and do not reflect any transaction costs, such as redemption fees or sales loads. Therefore, the second line of the table is useful in comparing ongoing costs only and will not help you determine the relative total costs of owning different funds. To the extent a fund charges transaction costs, however, the total cost of owning that fund is higher.
Unaudited


The accompanying notes are an integral part of these financial statements.
Unaudited

The accompanying notes are an integral part of these financial statements.
Unaudited
The accompanying notes are an integral part of these financial statements.
June 30, 2022 (Unaudited)


The accompanying notes are an integral part of these financial statements.
June 30, 2022 (Unaudited)


The accompanying notes are an integral part of these financial statements.
Unaudited
The accompanying notes are an integral part of these financial statements.
Unaudited
The accompanying notes are an integral part of these financial statements.
Unaudited
| NOTES TO FINANCIAL STATEMENTS |
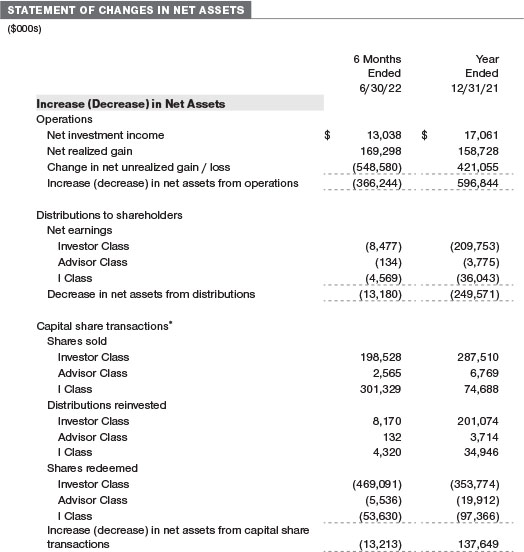
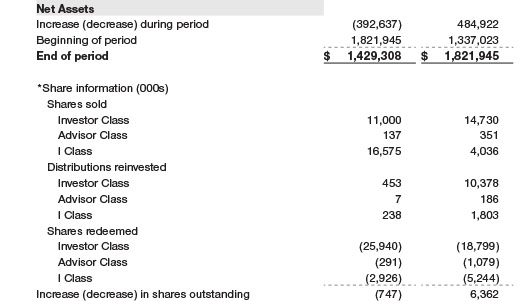
T. Rowe Price Real Estate Fund, Inc. (the fund) is registered under the Investment Company Act of 1940 (the 1940 Act) as a nondiversified, open-end management investment company. The fund seeks to provide long-term growth through a combination of capital appreciation and current income. The fund has three classes of shares: the Real Estate Fund (Investor Class), the Real Estate Fund–Advisor Class (Advisor Class) and the Real Estate Fund–I Class (I Class). Advisor Class shares are sold only through various brokers and other financial intermediaries. I Class shares require a $500,000 initial investment minimum, although the minimum generally is waived or reduced for financial intermediaries, eligible retirement plans, and certain other accounts. Prior to November 15, 2021, the initial investment minimum was $1 million and was generally waived for financial intermediaries, eligible retirement plans, and other certain accounts. As a result of the reduction in the I Class minimum, certain assets transferred from the Investor Class to the I Class. This transfer of shares from Investor Class to I Class is reflected in the Statement of Changes in Net Assets within the Capital shares transactions as Shares redeemed and Shares sold, respectively. The Advisor Class operates under a Board-approved Rule 12b-1 plan pursuant to which the class compensates financial intermediaries for distribution, shareholder servicing, and/or certain administrative services; the Investor and I Classes do not pay Rule 12b-1 fees. Each class has exclusive voting rights on matters related solely to that class; separate voting rights on matters that relate to all classes; and, in all other respects, the same rights and obligations as the other classes.
NOTE 1 - SIGNIFICANT ACCOUNTING POLICIES
Basis of Preparation The fund is an investment company and follows accounting and reporting guidance in the Financial Accounting Standards Board (FASB) Accounting Standards Codification Topic 946 (ASC 946). The accompanying financial statements were prepared in accordance with accounting principles generally accepted in the United States of America (GAAP), including, but not limited to, ASC 946. GAAP requires the use of estimates made by management. Management believes that estimates and valuations are appropriate; however, actual results may differ from those estimates, and the valuations reflected in the accompanying financial statements may differ from the value ultimately realized upon sale or maturity.
Investment Transactions, Investment Income, and Distributions Investment transactions are accounted for on the trade date basis. Income and expenses are recorded on the accrual basis. Realized gains and losses are reported on the identified cost basis. Income tax-related interest and penalties, if incurred, are recorded as income tax expense. Dividends received from mutual fund investments are reflected as dividend income; capital gain distributions are reflected as realized gain/loss. Dividend income and capital gain distributions are recorded on the ex-dividend date. Distributions from REITs are initially recorded as dividend income and, to the extent such represent a return of capital or capital gain for tax purposes, are reclassified when such information becomes available. Non-cash dividends, if any, are recorded at the fair market value of the asset received. Distributions to shareholders are recorded on the ex-dividend date. Income distributions, if any, are declared and paid by each class quarterly. A capital gain distribution may also be declared and paid by the fund annually.
Class Accounting Shareholder servicing, prospectus, and shareholder report expenses incurred by each class are charged directly to the class to which they relate. Expenses common to all classes, investment income, and realized and unrealized gains and losses are allocated to the classes based upon the relative daily net assets of each class. The Advisor Class pays Rule 12b-1 fees, in an amount not exceeding 0.25% of the class’s average daily net assets.
Capital Transactions Each investor’s interest in the net assets of the fund is represented by fund shares. The fund’s net asset value (NAV) per share is computed at the close of the New York Stock Exchange (NYSE), normally 4 p.m. ET, each day the NYSE is open for business. However, the NAV per share may be calculated at a time other than the normal close of the NYSE if trading on the NYSE is restricted, if the NYSE closes earlier, or as may be permitted by the SEC. Purchases and redemptions of fund shares are transacted at the next-computed NAV per share, after receipt of the transaction order by T. Rowe Price Associates, Inc., or its agents.
Indemnification In the normal course of business, the fund may provide indemnification in connection with its officers and directors, service providers, and/or private company investments. The fund’s maximum exposure under these arrangements is unknown; however, the risk of material loss is currently considered to be remote.
NOTE 2 - VALUATION
Fair Value The fund’s financial instruments are valued at the close of the NYSE and are reported at fair value, which GAAP defines as the price that would be received to sell an asset or paid to transfer a liability in an orderly transaction between market participants at the measurement date. The T. Rowe Price Valuation Committee (the Valuation Committee) is an internal committee that has been delegated certain responsibilities by the fund’s Board of Directors (the Board) to ensure that financial instruments are appropriately priced at fair value in accordance with GAAP and the 1940 Act. Subject to oversight by the Board, the Valuation Committee develops and oversees pricing-related policies and procedures and approves all fair value determinations. Specifically, the Valuation Committee establishes policies and procedures used in valuing financial instruments, including those which cannot be valued in accordance with normal procedures or using pricing vendors; determines pricing techniques, sources, and persons eligible to effect fair value pricing actions; evaluates the services and performance of the pricing vendors; oversees the pricing process to ensure policies and procedures are being followed; and provides guidance on internal controls and valuation-related matters. The Valuation Committee provides periodic reporting to the Board on valuation matters.
Various valuation techniques and inputs are used to determine the fair value of financial instruments. GAAP establishes the following fair value hierarchy that categorizes the inputs used to measure fair value:
Level 1 – quoted prices (unadjusted) in active markets for identical financial instruments that the fund can access at the reporting date
Level 2 – inputs other than Level 1 quoted prices that are observable, either directly or indirectly (including, but not limited to, quoted prices for similar financial instruments in active markets, quoted prices for identical or similar financial instruments in inactive markets, interest rates and yield curves, implied volatilities, and credit spreads)
Level 3 – unobservable inputs (including the fund’s own assumptions in determining fair value)
Observable inputs are developed using market data, such as publicly available information about actual events or transactions, and reflect the assumptions that market participants would use to price the financial instrument. Unobservable inputs are those for which market data are not available and are developed using the best information available about the assumptions that market participants would use to price the financial instrument. GAAP requires valuation techniques to maximize the use of relevant observable inputs and minimize the use of unobservable inputs. When multiple inputs are used to derive fair value, the financial instrument is assigned to the level within the fair value hierarchy based on the lowest-level input that is significant to the fair value of the financial instrument. Input levels are not necessarily an indication of the risk or liquidity associated with financial instruments at that level but rather the degree of judgment used in determining those values.
Valuation Techniques Equity securities, including exchange-traded funds, listed or regularly traded on a securities exchange or in the over-the-counter (OTC) market are valued at the last quoted sale price or, for certain markets, the official closing price at the time the valuations are made. OTC Bulletin Board securities are valued at the mean of the closing bid and asked prices. A security that is listed or traded on more than one exchange is valued at the quotation on the exchange determined to be the primary market for such security. Listed securities not traded on a particular day are valued at the mean of the closing bid and asked prices for domestic securities.
Investments in mutual funds are valued at the mutual fund’s closing NAV per share on the day of valuation. Assets and liabilities other than financial instruments, including short-term receivables and payables, are carried at cost, or estimated realizable value, if less, which approximates fair value.
Investments for which market quotations or market-based valuations are not readily available or deemed unreliable are valued at fair value as determined in good faith by the Valuation Committee, in accordance with fair valuation policies and procedures. The objective of any fair value pricing determination is to arrive at a price that could reasonably be expected from a current sale. Financial instruments fair valued by the Valuation Committee are primarily private placements, restricted securities, warrants, rights, and other securities that are not publicly traded. Factors used in determining fair value vary by type of investment and may include market or investment specific considerations. The Valuation Committee typically will afford greatest weight to actual prices in arm’s length transactions, to the extent they represent orderly transactions between market participants, transaction information can be reliably obtained, and prices are deemed representative of fair value. However, the Valuation Committee may also consider other valuation methods such as market-based valuation multiples; a discount or premium from market value of a similar, freely traded security of the same issuer; discounted cash flows; yield to maturity; or some combination. Fair value determinations are reviewed on a regular basis and updated as information becomes available, including actual purchase and sale transactions of the investment. Because any fair value determination involves a significant amount of judgment, there is a degree of subjectivity inherent in such pricing decisions, and fair value prices determined by the Valuation Committee could differ from those of other market participants.
Valuation Inputs On June 30, 2022, all of the fund’s financial instruments were classified as Level 1, based on the inputs used to determine their fair values.
NOTE 3 - OTHER INVESTMENT TRANSACTIONS
Purchases and sales of portfolio securities other than short-term securities aggregated $428,855,000 and $439,965,000, respectively, for the six months ended June 30, 2022.
NOTE 4 - FEDERAL INCOME TAXES
No provision for federal income taxes is required since the fund intends to continue to qualify as a regulated investment company under Subchapter M of the Internal Revenue Code and distribute to shareholders all of its taxable income and gains. Distributions determined in accordance with federal income tax regulations may differ in amount or character from net investment income and realized gains for financial reporting purposes. Financial reporting records are adjusted for permanent book/tax differences to reflect tax character but are not adjusted for temporary differences. The amount and character of tax-basis distributions and composition of net assets are finalized at fiscal year-end; accordingly, tax-basis balances have not been determined as of the date of this report.
At June 30, 2022, the cost of investments for federal income tax purposes was $925,719,000. Net unrealized gain aggregated $500,784,000 at period-end, of which $536,511,000 related to appreciated investments and $35,727,000 related to depreciated investments.
NOTE 5 - RELATED PARTY TRANSACTIONS
The fund is managed by T. Rowe Price Associates, Inc. (Price Associates), a wholly owned subsidiary of T. Rowe Price Group, Inc. (Price Group). The investment management agreement between the fund and Price Associates provides for an annual investment management fee, which is computed daily and paid monthly. The fee consists of an individual fund fee, equal to 0.30% of the fund’s average daily net assets, and a group fee. The group fee rate is calculated based on the combined net assets of certain mutual funds sponsored by Price Associates (the group) applied to a graduated fee schedule, with rates ranging from 0.48% for the first $1 billion of assets to 0.260% for assets in excess of $845 billion. The fund’s group fee is determined by applying the group fee rate to the fund’s average daily net assets. The fee is computed daily and paid monthly. At June 30, 2022, the effective annual group fee rate was 0.29%.
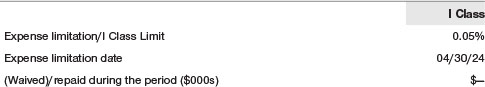
The I Class is subject to an operating expense limitation (I Class Limit) pursuant to which Price Associates is contractually required to pay all operating expenses of the I Class, excluding management fees; interest; expenses related to borrowings, taxes, and brokerage; and other non-recurring expenses permitted by the investment management agreement, to the extent such operating expenses, on an annualized basis, exceed the I Class Limit. This agreement will continue through the expense limitation date indicated in the table below, and may be renewed, revised, or revoked only with approval of the fund’s Board. The I Class is required to repay Price Associates for expenses previously paid to the extent the class’s net assets grow or expenses decline sufficiently to allow repayment without causing the class’s operating expenses (after the repayment is taken into account) to exceed the lesser of: (1) the I Class Limit in place at the time such amounts were paid; or (2) the current I Class Limit. However, no repayment will be made more than three years after the date of a payment or waiver.
In addition, the fund has entered into service agreements with Price Associates and two wholly owned subsidiaries of Price Associates, each an affiliate of the fund (collectively, Price). Price Associates provides certain accounting and administrative services to the fund. T. Rowe Price Services, Inc. provides shareholder and administrative services in its capacity as the fund’s transfer and dividend-disbursing agent. T. Rowe Price Retirement Plan Services, Inc. provides subaccounting and recordkeeping services for certain retirement accounts invested in the Investor Class and Advisor Class. For the six months ended June 30, 2022, expenses incurred pursuant to these service agreements were $53,000 for Price Associates; $588,000 for T. Rowe Price Services, Inc.; and $47,000 for T. Rowe Price Retirement Plan Services, Inc. All amounts due to and due from Price, exclusive of investment management fees payable, are presented net on the accompanying Statement of Assets and Liabilities.
The fund may invest its cash reserves in certain open-end management investment companies managed by Price Associates and considered affiliates of the fund: the T. Rowe Price Government Reserve Fund or the T. Rowe Price Treasury Reserve Fund, organized as money market funds, or the T. Rowe Price Short-Term Fund, a short-term bond fund (collectively, the Price Reserve Funds). The Price Reserve Funds are offered as short-term investment options to mutual funds, trusts, and other accounts managed by Price Associates or its affiliates and are not available for direct purchase by members of the public. Cash collateral from securities lending, if any, is invested in the T. Rowe Price Government Reserve Fund; prior to December 13, 2021, the cash collateral from securities lending was invested in the T. Rowe Price Short-Term Fund. The Price Reserve Funds pay no investment management fees.
The fund may participate in securities purchase and sale transactions with other funds or accounts advised by Price Associates (cross trades), in accordance with procedures adopted by the fund’s Board and Securities and Exchange Commission rules, which require, among other things, that such purchase and sale cross trades be effected at the independent current market price of the security. During the six months ended June 30, 2022, the fund had no purchases or sales cross trades with other funds or accounts advised by Price Associates.
Price Associates has voluntarily agreed to reimburse the fund from its own resources on a monthly basis for the cost of investment research embedded in the cost of the fund’s securities trades. This agreement may be rescinded at any time. For the six months ended June 30, 2022, this reimbursement amounted to $16,000, which is included in Net realized gain (loss) on Securities in the Statement of Operations.
NOTE 6 - OTHER MATTERS
Unpredictable events such as environmental or natural disasters, war, terrorism, pandemics, outbreaks of infectious diseases, and similar public health threats may significantly affect the economy and the markets and issuers in which a fund invests. Certain events may cause instability across global markets, including reduced liquidity and disruptions in trading markets, while some events may affect certain geographic regions, countries, sectors, and industries more significantly than others, and exacerbate other pre-existing political, social, and economic risks. Since 2020, a novel strain of coronavirus (COVID-19) has resulted in disruptions to global business activity and caused significant volatility and declines in global financial markets. In February 2022, Russian forces entered Ukraine and commenced an armed conflict leading to economic sanctions being imposed on Russia and certain of its citizens, creating impacts on Russian-related stocks and debt and greater volatility in global markets. These are recent examples of global events which may have an impact on the fund’s performance, which could be negatively impacted if the value of a portfolio holding were harmed by these and such other events. Management is actively monitoring the risks and financial impacts arising from these events.
INFORMATION ON PROXY VOTING POLICIES, PROCEDURES, AND RECORDS
A description of the policies and procedures used by T. Rowe Price funds to determine how to vote proxies relating to portfolio securities is available in each fund’s Statement of Additional Information. You may request this document by calling 1-800-225-5132 or by accessing the SEC’s website, sec.gov.
The description of our proxy voting policies and procedures is also available on our corporate website. To access it, please visit the following Web page:
https://www.troweprice.com/corporate/us/en/utility/policies.html
Scroll down to the section near the bottom of the page that says, “Proxy Voting Guidelines.” Click on the links in the shaded box.
Each fund’s most recent annual proxy voting record is available on our website and through the SEC’s website. To access it through T. Rowe Price, visit the website location shown above, and scroll down to the section near the bottom of the page that says, “Proxy Voting Records.” Click on the Proxy Voting Records link in the shaded box.
HOW TO OBTAIN QUARTERLY PORTFOLIO HOLDINGS
The fund files a complete schedule of portfolio holdings with the Securities and Exchange Commission (SEC) for the first and third quarters of each fiscal year as an exhibit to its reports on Form N-PORT. The fund’s reports on Form N-PORT are available electronically on the SEC’s website (sec.gov). In addition, most T. Rowe Price funds disclose their first and third fiscal quarter-end holdings on troweprice.com.
APPROVAL OF INVESTMENT MANAGEMENT AGREEMENT
Each year, the fund’s Board of Directors (Board) considers the continuation of the investment management agreement (Advisory Contract) between the fund and its investment adviser, T. Rowe Price Associates, Inc. (Adviser). In that regard, at a meeting held on March 7–8, 2022 (Meeting), the Board, including all of the fund’s independent directors, approved the continuation of the fund’s Advisory Contract. At the Meeting, the Board considered the factors and reached the conclusions described below relating to the selection of the Adviser and the approval of the Advisory Contract. The independent directors were assisted in their evaluation of the Advisory Contract by independent legal counsel from whom they received separate legal advice and with whom they met separately.
In providing information to the Board, the Adviser was guided by a detailed set of requests for information submitted by independent legal counsel on behalf of the independent directors. In considering and approving the Advisory Contract, the Board considered the information it believed was relevant, including, but not limited to, the information discussed below. The Board considered not only the specific information presented in connection with the Meeting but also the knowledge gained over time through interaction with the Adviser about various topics. The Board meets regularly and, at each of its meetings, covers an extensive agenda of topics and materials and considers factors that are relevant to its annual consideration of the renewal of the T. Rowe Price funds’ advisory contracts, including performance and the services and support provided to the funds and their shareholders.
Services Provided by the Adviser
The Board considered the nature, quality, and extent of the services provided to the fund by the Adviser. These services included, but were not limited to, directing the fund’s investments in accordance with its investment program and the overall management of the fund’s portfolio, as well as a variety of related activities such as financial, investment operations, and administrative services; compliance; maintaining the fund’s records and registrations; and shareholder communications. The Board also reviewed the background and experience of the Adviser’s senior management team and investment personnel involved in the management of the fund, as well as the Adviser’s compliance record. The Board concluded that it was satisfied with the nature, quality, and extent of the services provided by the Adviser.
Investment Performance of the Fund
The Board took into account discussions with the Adviser and reports that it receives throughout the year relating to fund performance. In connection with the Meeting, the Board reviewed the fund’s total returns for various periods through December 31, 2021, and compared these returns with the performance of a peer group of funds with similar investment programs and a wide variety of other previously agreed-upon comparable performance measures and market data, including relative performance information as of September 30, 2021, supplied by Broadridge, which is an independent provider of mutual fund data.
On the basis of this evaluation and the Board’s ongoing review of investment results, and factoring in the relative market conditions during certain of the performance periods, the Board concluded that the fund’s performance was satisfactory.
Costs, Benefits, Profits, and Economies of Scale
The Board reviewed detailed information regarding the revenues received by the Adviser under the Advisory Contract and other direct and indirect benefits that the Adviser (and its affiliates) may have realized from its relationship with the fund. In considering soft-dollar arrangements pursuant to which research may be received from broker-dealers that execute the fund’s portfolio transactions, the Board noted that the Adviser bears the cost of research services for all client accounts that it advises, including the T. Rowe Price funds. The Board received information on the estimated costs incurred and profits realized by the Adviser from managing the T. Rowe Price funds. The Board also reviewed estimates of the profits realized from managing the fund in particular, and the Board concluded that the Adviser’s profits were reasonable in light of the services provided to the fund.
The Board also considered whether the fund benefits under the fee levels set forth in the Advisory Contract or otherwise from any economies of scale realized by the Adviser. Under the Advisory Contract, the fund pays a fee to the Adviser for investment management services composed of two components—a group fee rate based on the combined average net assets of most of the T. Rowe Price funds (including the fund) that declines at certain asset levels and an individual fund fee rate based on the fund’s average daily net assets—and the fund pays its own expenses of operations. The Board concluded that the advisory fee structure for the fund continued to provide for a reasonable sharing of benefits from any economies of scale with the fund’s investors.
Fees and Expenses
The Board was provided with information regarding industry trends in management fees and expenses. Among other things, the Board reviewed data for peer groups that were compiled by Broadridge, which compared: (i) contractual management fees, actual management fees, nonmanagement expenses, and total expenses of the Investor Class of the fund with a group of competitor funds selected by Broadridge (Investor Class Expense Group); (ii) actual management fees and total expenses of the Advisor Class of the fund with a group of competitor funds selected by Broadridge (Advisor Class Expense Group); and (iii) actual management fees, nonmanagement expenses, and total expenses of the Investor Class of the fund with a broader set of funds within the Lipper investment classification (Expense Universe). The Board considered the fund’s contractual management fee rate, actual management fee rate (which reflects the management fees actually received from the fund by the Adviser after any applicable waivers, reductions, or reimbursements), operating expenses, and total expenses (which reflect the net total expense ratio of the fund after any waivers, reductions, or reimbursements) in comparison with the information for the Broadridge peer groups. Broadridge generally constructed the peer groups by seeking the most comparable funds based on similar investment classifications and objectives, expense structure, asset size, and operating components and attributes and ranked funds into quintiles, with the first quintile representing the funds with the lowest relative expenses and the fifth quintile representing the funds with the highest relative expenses. The information provided to the Board indicated that the fund’s contractual management fee ranked in the second quintile (Investor Class Expense Group), the fund’s actual management fee rate ranked in the second quintile (Investor Class Expense Group and Expense Universe) and first quintile (Advisor Class Expense Group), and the fund’s total expenses ranked in the second quintile (Investor Class Expense Group and Expense Universe) and first quintile (Advisor Class Expense Group).
The Board also reviewed the fee schedules for other investment portfolios with similar mandates that are advised or subadvised by the Adviser and its affiliates, including separately managed accounts for institutional and individual investors; subadvised funds; and other sponsored investment portfolios, including collective investment trusts and pooled vehicles organized and offered to investors outside the United States. Management provided the Board with information about the Adviser’s responsibilities and services provided to subadvisory and other institutional account clients, including information about how the requirements and economics of the institutional business are fundamentally different from those of the proprietary mutual fund business. The Board considered information showing that the Adviser’s mutual fund business is generally more complex from a business and compliance perspective than its institutional account business and considered various relevant factors, such as the broader scope of operations and oversight, more extensive shareholder communication infrastructure, greater asset flows, heightened business risks, and differences in applicable laws and regulations associated with the Adviser’s proprietary mutual fund business. In assessing the reasonableness of the fund’s management fee rate, the Board considered the differences in the nature of the services required for the Adviser to manage its mutual fund business versus managing a discrete pool of assets as a subadviser to another institution’s mutual fund or for an institutional account and that the Adviser generally performs significant additional services and assumes greater risk in managing the fund and other T. Rowe Price funds than it does for institutional account clients, including subadvised funds.
On the basis of the information provided and the factors considered, the Board concluded that the fees paid by the fund under the Advisory Contract are reasonable.
Approval of the Advisory Contract
As noted, the Board approved the continuation of the Advisory Contract. No single factor was considered in isolation or to be determinative to the decision. Rather, the Board concluded, in light of a weighting and balancing of all factors considered, that it was in the best interests of the fund and its shareholders for the Board to approve the continuation of the Advisory Contract (including the fees to be charged for services thereunder).
Item 1. (b) Notice pursuant to Rule 30e-3.
Not applicable.
Item 2. Code of Ethics.
A code of ethics, as defined in Item 2 of Form N-CSR, applicable to its principal executive officer, principal financial officer, principal accounting officer or controller, or persons performing similar functions is filed as an exhibit to the registrant’s annual Form N-CSR. No substantive amendments were approved or waivers were granted to this code of ethics during the registrant’s most recent fiscal half-year.
Item 3. Audit Committee Financial Expert.
Disclosure required in registrant’s annual Form N-CSR.
Item 4. Principal Accountant Fees and Services.
Disclosure required in registrant’s annual Form N-CSR.
Item 5. Audit Committee of Listed Registrants.
Not applicable.
Item 6. Investments.
(a) Not applicable. The complete schedule of investments is included in Item 1 of this Form N-CSR.
(b) Not applicable.
Item 7. Disclosure of Proxy Voting Policies and Procedures for Closed-End Management Investment Companies.
Not applicable.
Item 8. Portfolio Managers of Closed-End Management Investment Companies.
Not applicable.
Item 9. Purchases of Equity Securities by Closed-End Management Investment Company and Affiliated Purchasers.
Not applicable.
Item 10. Submission of Matters to a Vote of Security Holders.
There has been no change to the procedures by which shareholders may recommend nominees to the registrant’s board of directors.
Item 11. Controls and Procedures.
(a) The registrant’s principal executive officer and principal financial officer have evaluated the registrant’s disclosure controls and procedures within 90 days of this filing and have concluded that the registrant’s disclosure controls and procedures were effective, as of that date, in ensuring that information required to be disclosed by the registrant in this Form N-CSR was recorded, processed, summarized, and reported timely.
(b) The registrant’s principal executive officer and principal financial officer are aware of no change in the registrant’s internal control over financial reporting that occurred during the period covered by this report that has materially affected, or is reasonably likely to materially affect, the registrant’s internal control over financial reporting.
Item 12. Disclosure of Securities Lending Activities for Closed-End Management Investment Companies.
Not applicable.
Item 13. Exhibits.
(a)(1) The registrant’s code of ethics pursuant to Item 2 of Form N-CSR is filed with the registrant’s annual Form N-CSR.
(2) Separate certifications by the registrant’s principal executive officer and principal financial officer, pursuant to Section 302 of the Sarbanes-Oxley Act of 2002 and required by Rule 30a-2(a) under the Investment Company Act of 1940, are attached.
(3) Written solicitation to repurchase securities issued by closed-end companies: not applicable.
(b) A certification by the registrant’s principal executive officer and principal financial officer, pursuant to Section 906 of the Sarbanes-Oxley Act of 2002 and required by Rule 30a-2(b) under the Investment Company Act of 1940, is attached.
SIGNATURES
Pursuant to the requirements of the Securities Exchange Act of 1934 and the Investment Company Act of 1940, the registrant has duly caused this report to be signed on its behalf by the undersigned, thereunto duly authorized.
T. Rowe Price Real Estate Fund, Inc.
| By | | /s/ David Oestreicher |
| | | David Oestreicher |
| | | Principal Executive Officer |
| |
| Date | | August 17, 2022 | | | | |
Pursuant to the requirements of the Securities Exchange Act of 1934 and the Investment Company Act of 1940, this report has been signed below by the following persons on behalf of the registrant and in the capacities and on the dates indicated.
| By | | /s/ David Oestreicher |
| | | David Oestreicher |
| | | Principal Executive Officer |
| |
| Date | | August 17, 2022 | | | | |
| |
| |
| By | | /s/ Alan S. Dupski |
| | | Alan S. Dupski |
| | | Principal Financial Officer |
| |
| Date | | August 17, 2022 | | | | |