 © Career Education Corporation 2008 © Career Education Corporation 2008 Exhibit 99.1 |
 Gary E. McCullough Gary E. McCullough PRESIDENT AND CHIEF EXECUTIVE OFFICER CAREER EDUCATION CORPORATION PRESIDENT AND CHIEF EXECUTIVE OFFICER CAREER EDUCATION CORPORATION © Career Education Corporation 2008 © Career Education Corporation 2008 ® March 18, 2008 March 18, 2008 |
 Except for the historical and present factual information contained herein, the matters set forth in this presentation, including statements identified by words such as "anticipate," "believe," "plan," "expect," "intend," "project," "will," and similar expressions, are forward-looking statements as defined in Section 21E of the Securities Exchange Act of 1934, as amended. These statements are based on information currently available to us and are subject to various risks, uncertainties and other factors that could cause our actual growth, results of operations, performance and business prospects, and opportunities to differ materially from those expressed in, or implied by, these statements. Except as expressly required by the federal securities laws, we undertake no obligation to update such factors or to publicly announce the results of any of the forward-looking statements contained herein to reflect future events, developments, or changed circumstances or for any other reason. These risks and uncertainties, the outcome of which could materially and adversely affect our financial condition and operations, include, but are not limited to, the following: risks associated with unfavorable changes in the cost or availability of financing, including alternative loans, for our students; potential higher bad debt expense or reduced revenue associated with requiring students to pay more of their educational expenses while in school; increased competition; the effectiveness of our regulatory compliance efforts; future financial and operational results, including the impact of the impairment of goodwill and other intangible assets; risks related to our ability to comply with accrediting agency requirements or obtain accrediting agency approvals; risks related to our ability to comply with, and the impact of changes in, legislation and regulations that affect our ability to participate in student financial aid programs; costs, risks, and effects of legal and administrative proceedings and investigations and governmental regulations, and class action and other lawsuits; costs, risks and uncertainties associated with our company-wide restructuring, including risks and uncertainties associated with changes in management and reporting responsibilities; costs and difficulties related to the integration of acquired businesses; risks related to our ability to manage and continue growth; risks related to the sale or teach-out of any campuses; risks related to general economic conditions including credit market conditions and other risk factors relating to our industry and business and the factors discussed in our Annual Report on Form 10-K for the year ended December 31, 2007, and from time to time in our other reports filed with the Securities and Exchange Commission. Safe Harbor Safe Harbor © Career Education Corporation 2008 © Career Education Corporation 2008 |
 Welcome! Welcome! Today’s Objectives 2007…challenging year, positive trends, much accomplished 2008…progress accelerates, transformation underway Beyond 2008…aggressive and achievable strategic business plan CEC Executive Leadership Team Your questions Why CEC? Today’s Objectives 2007…challenging year, positive trends, much accomplished 2008…progress accelerates, transformation underway Beyond 2008…aggressive and achievable strategic business plan CEC Executive Leadership Team Your questions Why CEC? |
       Today’s Discussion Today’s Discussion Reading Reading |
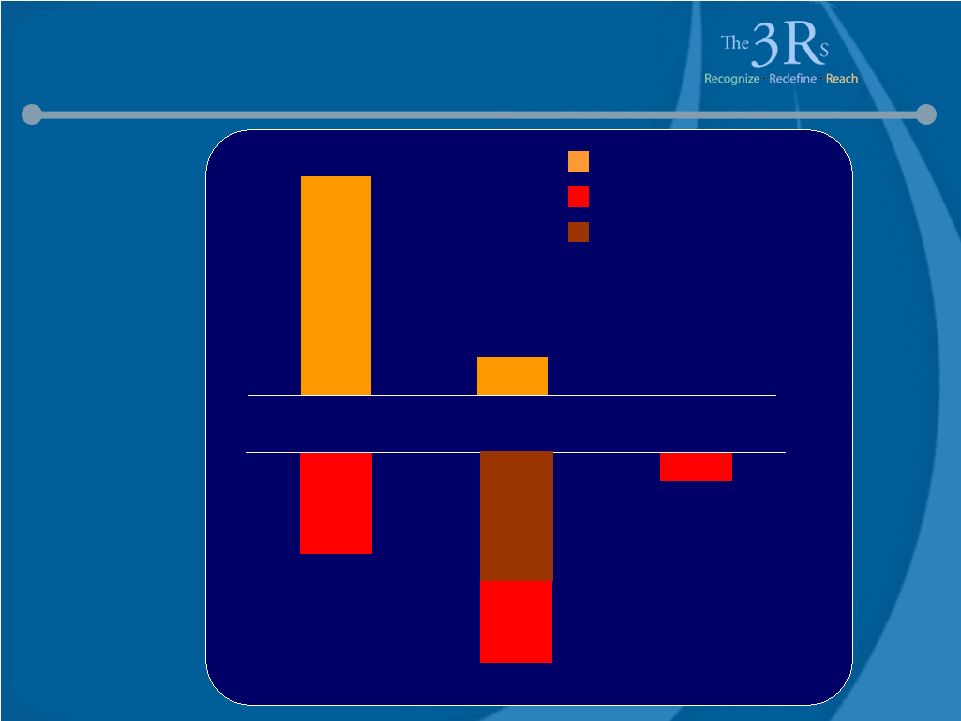
       The 3Rs at Career Education The 3Rs at Career Education • Business position • Opportunities • Threats • Risks • Business position • Opportunities • Threats • Risks • Mission • Strategy • Organization • Processes • Culture • Mission • Strategy • Organization • Processes • Culture • Future state • Goals • Milestones • Future state • Goals • Milestones |
 Career Education Overview Career Education Overview Our Mission: A global educational company committed to quality outcomes and career opportunities for a diverse student population Our Mission: A global educational company committed to quality outcomes and career opportunities for a diverse student population ® |
 Career Education Overview Career Education Overview Approximately 90,000 Students Approximately 90,000 Students Associate, Bachelor’s, Master’s and Doctorate Degrees; Certificates Associate, Bachelor’s, Master’s and Doctorate Degrees; Certificates Curriculum: Business, Visual Communications & Design, Culinary Arts, Health Education, Information Technology Curriculum: Business, Visual Communications & Design, Culinary Arts, Health Education, Information Technology Over 75 On-ground Campuses, 22 States and 4 Countries Over 75 On-ground Campuses, 22 States and 4 Countries 3 Online Campuses without Geographic Boundaries 3 Online Campuses without Geographic Boundaries 2007 Revenue: $1.7 Billion Second Largest For-Profit Post Secondary Education Company 2007 Revenue: $1.7 Billion Second Largest For-Profit Post Secondary Education Company |
 CEC Board of Directors (Year of Appointment) CEC Board of Directors (Year of Appointment) Robert E. Dowdell Chairman of the Board (1994) Dennis H. Chookaszian Former Chairman and Chief Executive Officer of CNA Financial Corporation (2002) Patrick W. Gross Founder and Chairman of The Lovell Group (2005) Thomas B. Lally Former President of Heller Equity Capital Corporation (1998) Steven H. Lesnik Chairman of KemperSports Inc. (2006) Leslie T. Thornton Former Chief of Staff to U.S. Secretary of Education Richard W. Riley and Partner, Dickstein Shapiro LLP (2005) Gary E. McCullough President and Chief Executive Officer of Career Education Corporation (2007) Robert E. Dowdell Chairman of the Board (1994) Dennis H. Chookaszian Former Chairman and Chief Executive Officer of CNA Financial Corporation (2002) Patrick W. Gross Founder and Chairman of The Lovell Group (2005) Thomas B. Lally Former President of Heller Equity Capital Corporation (1998) Steven H. Lesnik Chairman of KemperSports Inc. (2006) Leslie T. Thornton Former Chief of Staff to U.S. Secretary of Education Richard W. Riley and Partner, Dickstein Shapiro LLP (2005) Gary E. McCullough President and Chief Executive Officer of Career Education Corporation (2007) |
   Executive Leadership Team Executive Leadership Team SCHOOL OPERATIONS SCHOOL OPERATIONS • Le Cordon Bleu • Kitchen Academy • Le Cordon Bleu • Kitchen Academy • Sanford Brown College • Sanford Brown Institute • Missouri College • Western School • Sanford Brown College • Sanford Brown Institute • Missouri College • Western School • American InterContinental University • Colorado Technical University • Briarcliffe College • American InterContinental University • Colorado Technical University • Briarcliffe College • IADT • Harrington College • Brooks Institute • Collins College • Brown College • IADT • Harrington College • Brooks Institute • Collins College • Brown College • INSEEC • Istituto Marangoni • INSEEC • Istituto Marangoni President & CEO Gary E. McCullough Finance Mike Graham Marketing & Admissions Len Mariani Education Dr. Donna Gray Organization Eff. & Administration Tom Budlong General Counsel Jeff Ayers Culinary Arts Business Unit Paul Ryan Health Education Business Unit George Grayeb University Business Unit Deb Lenart Art & Design Business Unit Ty Roberts International, Plng & Development Todd Steele CORPORATE OPERATIONS/INSTITUTIONAL EFFECTIVENESS CORPORATE OPERATIONS/INSTITUTIONAL EFFECTIVENESS |
 ® CEO Perspective… CEO Perspective… Career Education Corporation Career Education Corporation $13.64 $30.09 Share Price 3/06/08 3/06/07 Continuing operations Continuing operations -1.5 pts. 7% Margin $1.01 $120* $1,675* 2007 +$0.11 Earnings Per Share (23%) Operating Profit (7%) Revenue vs 2006 (* $ in Millions) |
 CEO Perspective CEO Perspective “I will start by saying that I am probably more optimistic today about what we can do than I ever have been…” - Gary McCullough earnings call on 2/21/08 “I will start by saying that I am probably more optimistic today about what we can do than I ever have been…” - Gary McCullough earnings call on 2/21/08 |
 Why the Optimism? Why the Optimism? Ten Reasons to be Optimistic About the Future of Career Education Corporation Ten Reasons to be Optimistic About the Future of Career Education Corporation |
 REASON REASON We Provide Students with Opportunities to Change Their Lives Through a Quality Education We Provide Students with Opportunities to Change Their Lives Through a Quality Education # 1 |
 Reason #1…Our Students Reason #1…Our Students We educate many people…. 172,000 total graduates (2004-2007) 66% on-ground 34% online 160 total degrees and certificates offered 125 graduation ceremonies per year We educate many people…. 172,000 total graduates (2004-2007) 66% on-ground 34% online 160 total degrees and certificates offered 125 graduation ceremonies per year |
 Reason #1…Our Students Reason #1…Our Students We serve a diverse mix of students. For example: American InterContinental University is: First in awarding master’s degrees in computer and information science to Hispanic-Americans Second in awarding associate degrees across all disciplines to African-Americans and all minorities Third in awarding master’s and bachelor’s degrees computer and information science to all minorities LCB first to offer a 100% Spanish speaking culinary degree in United States We serve a diverse mix of students. For example: American InterContinental University is: First in awarding master’s degrees in computer and information science to Hispanic-Americans Second in awarding associate degrees across all disciplines to African-Americans and all minorities Third in awarding master’s and bachelor’s degrees computer and information science to all minorities LCB first to offer a 100% Spanish speaking culinary degree in United States Source: Diverse Issues In Higher Education Source: Diverse Issues In Higher Education |
 Reason #1…Our Students Reason #1…Our Students Kristen Grissom Mother of two young children Graduated from Orlando Culinary Academy with an Associate in Culinary Arts Now an assistant pastry chef at the Ritz-Carlton Orlando Kristen Grissom Mother of two young children Graduated from Orlando Culinary Academy with an Associate in Culinary Arts Now an assistant pastry chef at the Ritz-Carlton Orlando CEC students are using their education to advance their lives CEC students are using their education to advance their lives |
 REASON REASON Major Uncertainties that Have Hindered Growth Are Behind Us Major Uncertainties that Have Hindered Growth Are Behind Us # 2 |
    Reason #2…Uncertainties Resolved Reason #2…Uncertainties Resolved 89,500 89,500 84,700 84,700 89,500 89,500 83,300 83,300 POPULATION $1.7B $1.7B $1.8B $1.8B $1.9B $1.9B $1.5B $1.5B REVENUE DOJ DOE SEC SACS 2007 2006 2005 2004 - June - AIU placed on warning - December - AIU placed on probation - June - SEC launches inquiry - June - DOE investigates, places growth restrictions on CEC - May - DOJ launches review of CEC schools - April - SEC recommends inquiry termination - December - AIU SACS resolution - January - DOE resolution and removal of restrictions - April - DOJ resolution |
 REASON REASON Underlying Performance Trends for CEC Are Positive and Moving in the Right Direction Underlying Performance Trends for CEC Are Positive and Moving in the Right Direction # 3 |
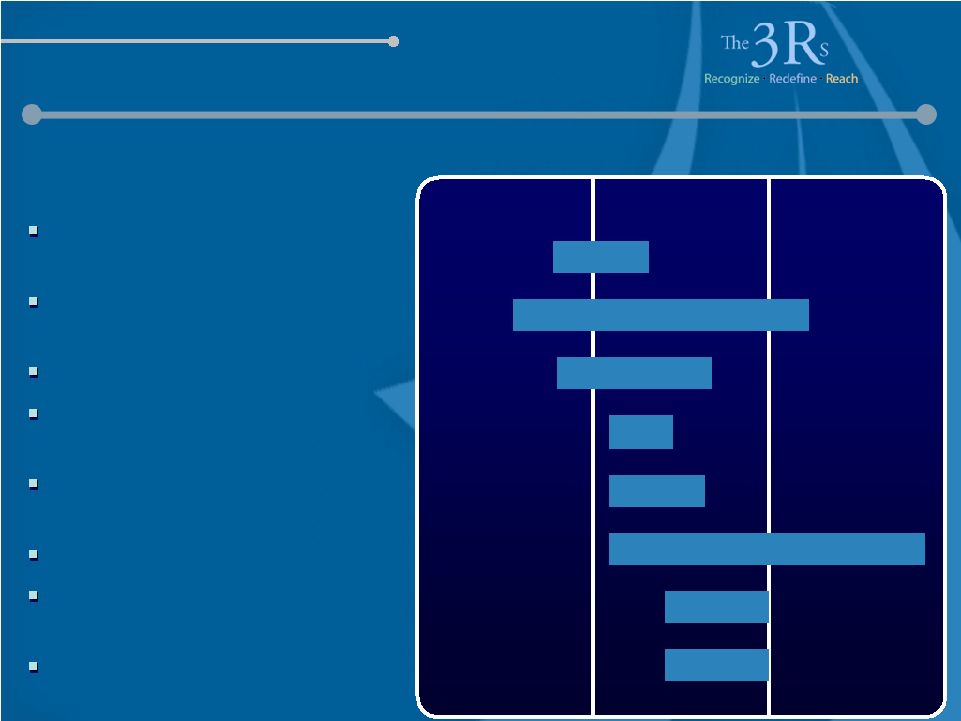
    Reason #3…Positive Trends Reason #3…Positive Trends Improved key operational metrics as year progressed Improved key operational metrics as year progressed Performance Metric Performance Metric 2007 vs 2006 Qtr 1 Qtr 1 Qtr2 Qtr2 Qtr3 Qtr3 Qtr4 Qtr4 Starts Starts -10% -10% 16% 16% 11% 11% 12% 12% Population Population - - 5% 5% 8% 8% 6% 6% Retention Retention Revenue per Revenue per student student Cost per Start Cost per Start |
 REASON REASON We Participate in Markets that Have a Positive Outlook We Participate in Markets that Have a Positive Outlook # 4 |
 Reason #4…Positive Market Outlook Reason #4…Positive Market Outlook U.S. enrollments projected to grow from 17.9 million in 2007 to 19.4 million by 2012 U.S. enrollments projected to grow from 17.9 million in 2007 to 19.4 million by 2012 Post secondary education market is large and growing Post secondary education market is large and growing Working adult student segment (age 22-34) projected to grow twice as fast as traditional student segment (age 18-21) Working adult student segment (age 22-34) projected to grow twice as fast as traditional student segment (age 18-21) Source: National Center of Education Statistics (NCES) CEC serves fastest-growing age segment CEC serves fastest-growing age segment |
 Reason #4…Positive Market Outlook Reason #4…Positive Market Outlook 100% online enrollments to grow 14% per year – from 1.8 million in 2007 to 3.4 million by 2012 By 2012, nearly 1 in 5 students fully online (up from 10% today) 100% online enrollments to grow 14% per year – from 1.8 million in 2007 to 3.4 million by 2012 By 2012, nearly 1 in 5 students fully online (up from 10% today) Fully online education is fastest-growing segment in postsecondary Fully online education is fastest-growing segment in postsecondary For-profits will grow faster than traditional, not-for-profit institutions For-profits will grow faster than traditional, not-for-profit institutions For-profit enrollments to grow 5-7% per year, compared to 1-2% for not-for-profits For-profit revenue to grow 7-9% annually For-profit enrollments to grow 5-7% per year, compared to 1-2% for not-for-profits For-profit revenue to grow 7-9% annually Source: Eduventures, BMO Capital Markets, Credit Suisse, National Center of Education Statistics (NCES) |
 REASON REASON We Bring Significant Strengths to a Highly Competitive Marketplace We Bring Significant Strengths to a Highly Competitive Marketplace # 5 |
 Reason #5…CEC Strengths Reason #5…CEC Strengths Academic Excellence Academic Excellence Quality Outcomes & Career Opportunities Quality Outcomes & Career Opportunities Global Education Company Global Education Company |
 Reason #5…CEC Strengths Reason #5…CEC Strengths Exceeded all benchmarks in the 2007 Noel-Levitz Priorities Survey for Online Learners Exceeded all benchmarks in the 2007 Noel-Levitz Priorities Survey for Online Learners Council of College and Military Educators 2007 Institution Award 2007 Kerrigan Top 30 Military Friendly Schools 25 Wounded Warrior Scholarships Council of College and Military Educators 2007 Institution Award 2007 Kerrigan Top 30 Military Friendly Schools 25 Wounded Warrior Scholarships Academic Excellence Academic Excellence |
 Reason #5…CEC Strengths Reason #5…CEC Strengths Western Culinary Institute and LCB Miami 2006-2007 School of Distinction Western Culinary Institute and LCB Miami 2006-2007 School of Distinction Surgical Technology Program at Sanford-Brown Institute Iselin, NJ “PAE Elite Twenty Program” Surgical Technology Program at Sanford-Brown Institute Iselin, NJ “PAE Elite Twenty Program” Academic Excellence Academic Excellence |
 Reason #5…CEC Strengths Diverse Brand Portfolio Reason #5…CEC Strengths Diverse Brand Portfolio Leading network of allied health schools Leading network of allied health schools National network of culinary schools in the US National network of culinary schools in the US Multi-national online and on-ground schools Multi-national online and on-ground schools Multi-national online school and Midwest ground schools Multi-national online school and Midwest ground schools Highly ranked schools Highly ranked schools Nationally recognized interior design school Nationally recognized interior design school ® Nationwide network of fashion & design schools Nationwide network of fashion & design schools TM Nationally recognized leader in digital photography Nationally recognized leader in digital photography TM |
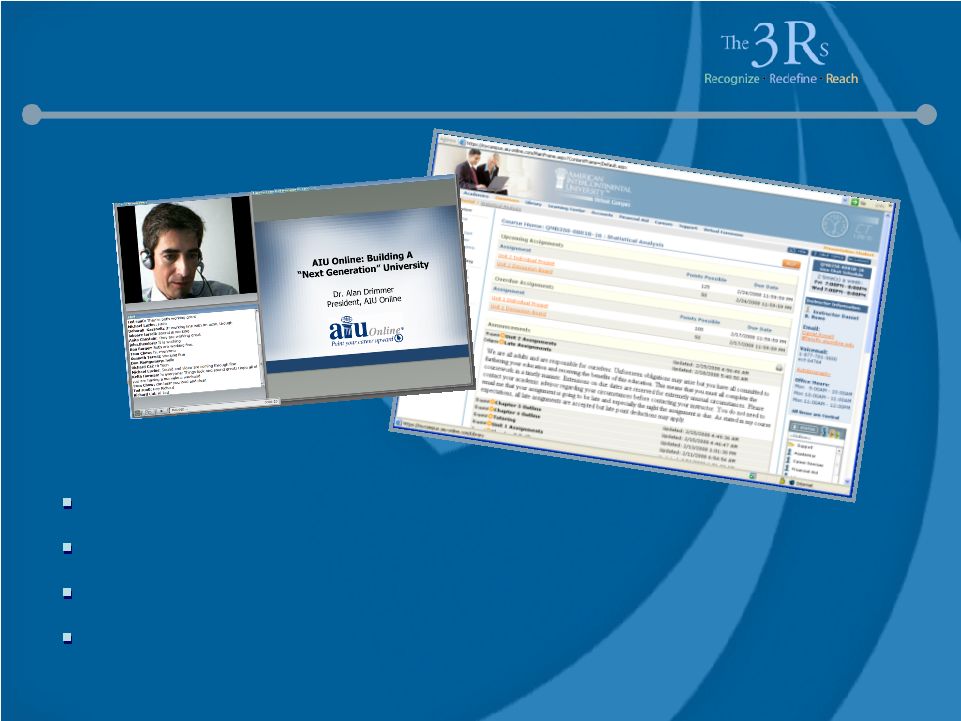 Reason #5…CEC Strengths Proprietary Student Interfaces Reason #5…CEC Strengths Proprietary Student Interfaces Virtual Campus and full student services Powerful proprietary learning management systems Full integration with the student management system Rich online collaboration tools Virtual Campus and full student services Powerful proprietary learning management systems Full integration with the student management system Rich online collaboration tools |
 Reason #5…CEC Strengths New Mobile Student Interface Reason #5…CEC Strengths New Mobile Student Interface Access to the Virtual Campus using mobile devices Application designed for Apple’s iPhone and iTouch Access to the Virtual Campus using mobile devices Application designed for Apple’s iPhone and iTouch |
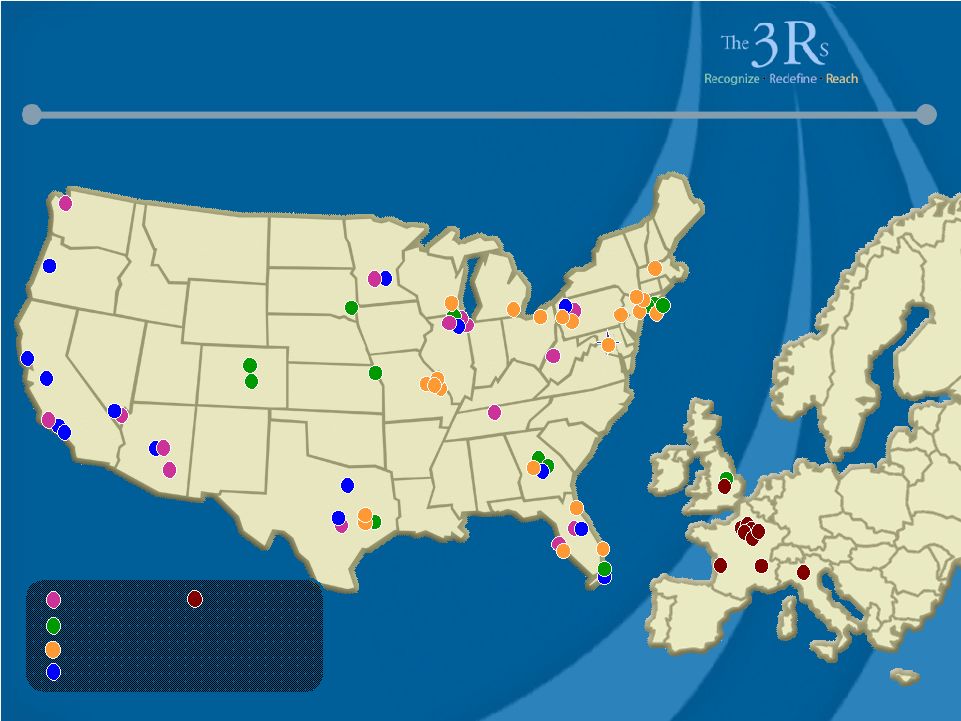   Reason #5…CEC Strengths Broad Geographic Coverage Reason #5…CEC Strengths Broad Geographic Coverage Art & Design University Culinary Health International |
 Reason #5…CEC Strengths Proven School Startup Expertise Reason #5…CEC Strengths Proven School Startup Expertise Record of Success Record of Success Future Plans Future Plans Since 2001, opened 18 new schools in 11 states Over $200 million of 2007 revenue Since 2001, opened 18 new schools in 11 states Over $200 million of 2007 revenue 3-5 new startups per year More efficient model reaches profitability within one year 3-5 new startups per year More efficient model reaches profitability within one year |
 Reason #5…CEC Strengths Reason #5…CEC Strengths Our People Our People |
 Challenging Environment Challenging Environment Intensified Competition Adding campus locations aggressively Expanding online curriculum Improving brand management skills and support program efficiencies Student Funding Uncertainty New targets for student profiles New curriculum design Emerging Price Sensitivity Inflationary impact on students Availability of education alternatives Intensified Competition Adding campus locations aggressively Expanding online curriculum Improving brand management skills and support program efficiencies Student Funding Uncertainty New targets for student profiles New curriculum design Emerging Price Sensitivity Inflationary impact on students Availability of education alternatives |
 REASON REASON We Will Not Hesitate to Make Necessary Changes to Our Company to Succeed We Will Not Hesitate to Make Necessary Changes to Our Company to Succeed # 6 |
    Reason #6…Change Oriented Reason #6…Change Oriented 2 0 0 7 2 0 0 7 Implemented reduction in force in QTR 1 – annual savings of up to $15 million Developed mission, strategy, five-year plan Launched 40 new programs and concentrations Opened four new campuses: integrated one international acquisition Hired four new senior leaders Designed high performance organization Implemented reduction in force in QTR 1 – annual savings of up to $15 million Developed mission, strategy, five-year plan Launched 40 new programs and concentrations Opened four new campuses: integrated one international acquisition Hired four new senior leaders Designed high performance organization |
    Reason #6…Change Oriented Reason #6…Change Oriented QTR 1 ’08 QTR 1 ’08 Implemented new organization structure… Strategic Business Units Hired three additional senior leaders and promoted one Implemented headcount reduction (220 positions) for annual savings of up to $20 million Introduced new Management Incentive Plan Updated strategic business plan with changes in student lending environment Announced teach-out of 11 additional schools Implemented new organization structure… Strategic Business Units Hired three additional senior leaders and promoted one Implemented headcount reduction (220 positions) for annual savings of up to $20 million Introduced new Management Incentive Plan Updated strategic business plan with changes in student lending environment Announced teach-out of 11 additional schools |
 REASON REASON # 7 We Have Identified Operational Shortfalls and Are Taking Decisive Actions We Have Identified Operational Shortfalls and Are Taking Decisive Actions |
 Reason #7…Decisive Actions Reason #7…Decisive Actions Centralizing operations to extent possible Student financial aid processing National lead and media buying Procurement Select admissions functions Human resource systems Creating awareness and understanding of relative campus performance Implementing real estate plan to reduce future liabilities Centralizing operations to extent possible Student financial aid processing National lead and media buying Procurement Select admissions functions Human resource systems Creating awareness and understanding of relative campus performance Implementing real estate plan to reduce future liabilities |
 REASON REASON # 8 We Have an Aligned, Focused Organization with a Highly Capable Leadership Team We Have an Aligned, Focused Organization with a Highly Capable Leadership Team |
 Reason #8…Aligned, Focused Organization Reason #8…Aligned, Focused Organization Conclusions from CEC Organization Review: Extra layers, overlaps, redundancies Unclear accountabilities Brand management and strategic perspective missing Inconsistencies in activities, responsibilities, staffing levels across divisions Underleveraged Alignment with CEC objectives and priorities missing in some areas Talent gap Conclusions from CEC Organization Review: Extra layers, overlaps, redundancies Unclear accountabilities Brand management and strategic perspective missing Inconsistencies in activities, responsibilities, staffing levels across divisions Underleveraged Alignment with CEC objectives and priorities missing in some areas Talent gap |
   Reason #8…Aligned, Focused Organization Reason #8…Aligned, Focused Organization Overview of Changes Overview of Changes Five SBUs reporting to CEO New brand management and strategic planning talent in SBUs Standardized organization structures across SBUs and campuses New transitional school division More focused shared services at corporate center Five SBUs reporting to CEO New brand management and strategic planning talent in SBUs Standardized organization structures across SBUs and campuses New transitional school division More focused shared services at corporate center President & CEO Gary E. McCullough Institutions/ Campuses Strategic Business Units Leadership Center Function |
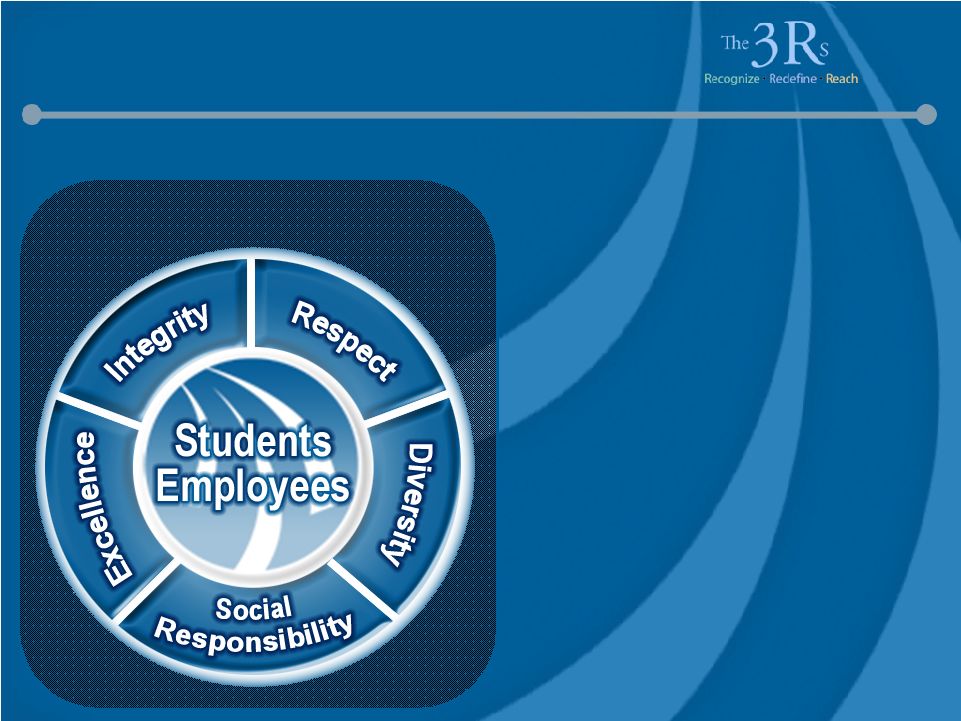 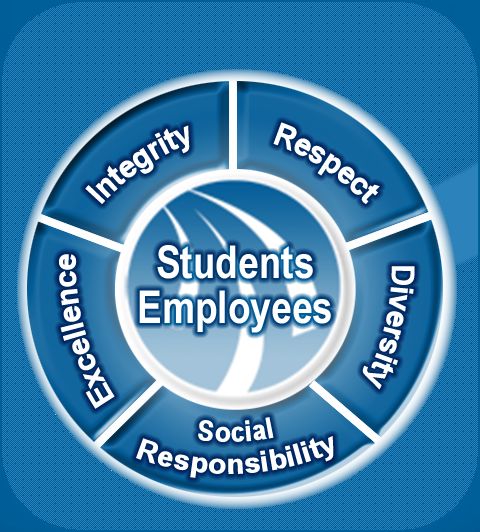  Reason #8…Aligned, Focused Organization Reason #8…Aligned, Focused Organization CEC Values CEC Values High Performance Principles • Leadership • Sense of urgency • Measured risk taking • Innovation • Teamwork • Accountability • Effective communication • Mastery High Performance Principles • Leadership • Sense of urgency • Measured risk taking • Innovation • Teamwork • Accountability • Effective communication • Mastery Establishing a New Culture Establishing a New Culture |
 Reason #8…Aligned, Focused Organization Reason #8…Aligned, Focused Organization Objectives of plan: Pay for performance Alignment between corporate, SBU and campus goals Participants: 2,100 employees at corporate, SBU teams, campus leadership Performance measurements: Objectives of plan: Pay for performance Alignment between corporate, SBU and campus goals Participants: 2,100 employees at corporate, SBU teams, campus leadership Performance measurements: Performance goals, turnover, compliance Individual performance Revenue & operating income Corporate, SBU, campus Measurements Categories New Management Incentive Plan New Management Incentive Plan |
 REASON REASON # 9 We Are Resourced to Grow Our Business Organically and Through Acquisitions We Are Resourced to Grow Our Business Organically and Through Acquisitions |
 Reason #9…Resourced to Grow Reason #9…Resourced to Grow Program Development: Resources in place with capacity and expertise to develop curriculum quickly at relatively low cost New programs: on-ground, blended and online Updates to existing programs Program conversions from on-ground to online Startups: Specialized team(s) in place. Proven capability to identify and open new locations Alumni: New resources now in place to mine the growth potential of our alumni network Program Development: Resources in place with capacity and expertise to develop curriculum quickly at relatively low cost New programs: on-ground, blended and online Updates to existing programs Program conversions from on-ground to online Startups: Specialized team(s) in place. Proven capability to identify and open new locations Alumni: New resources now in place to mine the growth potential of our alumni network Organic Growth Organic Growth |
 Reason #9…Resourced to Grow Reason #9…Resourced to Grow Historically grown through acquisitions Particularly successful international acquisitions Poised to move forward with acquisitions after significant improvement in domestic execution Resources in place Market scans continue Historically grown through acquisitions Particularly successful international acquisitions Poised to move forward with acquisitions after significant improvement in domestic execution Resources in place Market scans continue Acquisitions Acquisitions |
 REASON REASON The Strategic Business Units Have Aggressive and Achievable Plans The Strategic Business Units Have Aggressive and Achievable Plans # 10 |
         Reason #10…Aggressive Plans Reason #10…Aggressive Plans Health Education Health Education Culinary Arts Culinary Arts University University Art & Design Art & Design TM Four Academic Focus Areas Four Academic Focus Areas |
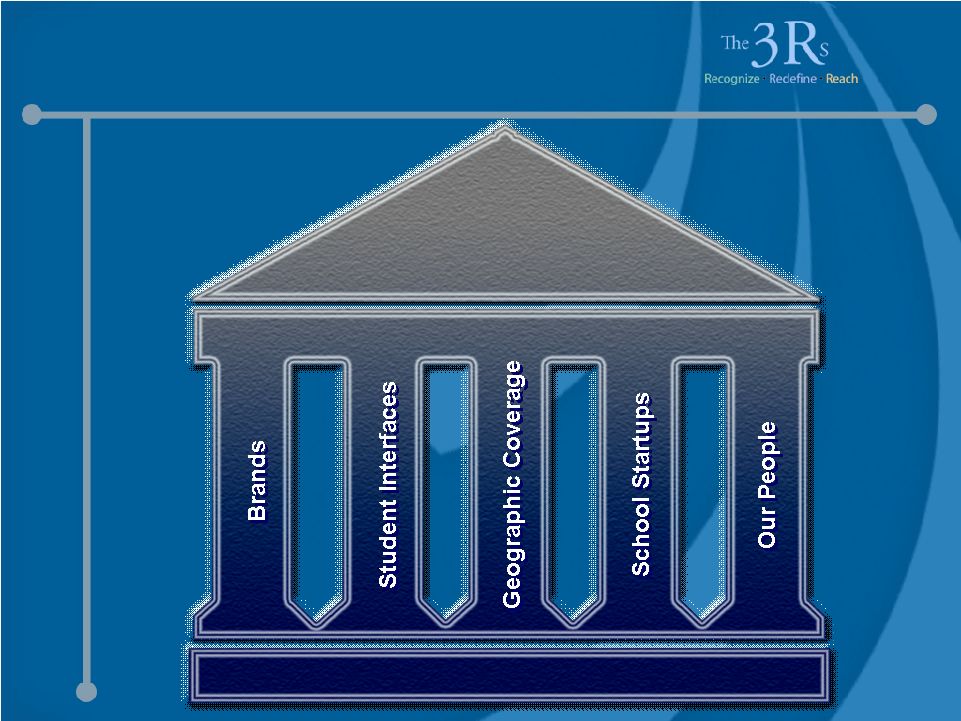
   Reason #10…Aggressive Plans Reason #10…Aggressive Plans INSTITUTIONS INSTITUTIONS Grow…our core educational institutions Improve…academic and operational effectiveness Enter…new markets Build…our reputation and external relationships Grow and Develop… our people Grow…our core educational institutions Improve…academic and operational effectiveness Enter…new markets Build…our reputation and external relationships Grow and Develop… our people 5 Strategic Choices 5 Strategic Choices TM TM TM ® |
 Reason #10…Aggressive Plans Reason #10…Aggressive Plans Execution Focus: Rebuild Online Population and Improve On-ground Performance Brand differentiation for AIU/CTU/Briarcliffe New programs with more flexibility Population growth through improved target marketing and new locations Enhanced tutoring and academic support Execution Focus: Rebuild Online Population and Improve On-ground Performance Brand differentiation for AIU/CTU/Briarcliffe Brand differentiation for AIU/CTU/Briarcliffe New programs with more flexibility New programs with more flexibility Population growth through improved target marketing Population growth through improved target marketing and new locations and new locations Enhanced tutoring and academic support Enhanced tutoring and academic support University SBU University SBU |
 Reason #10…Aggressive Plans Reason #10…Aggressive Plans CTU…Population Growth and Improved Degree Mix Matriculation from associate to bachelor’s Master’s, doctorate programs Continued military focus One University…“CTU Choices” AIU…Rebuild Online Population and Improve On-ground Performance AIU recovery: $12 million media campaign New programs and concentrations Unified on-ground and online Teach-out of Los Angeles CTU…Population Growth and Improved CTU…Population Growth and Improved Degree Mix Degree Mix Matriculation from associate to bachelor’s Matriculation from associate to bachelor’s Master’s, doctorate programs Master’s, doctorate programs Continued military focus Continued military focus One University…“CTU Choices” One University…“CTU Choices” AIU…Rebuild Online Population and Improve AIU…Rebuild Online Population and Improve On-ground Performance On-ground Performance AIU recovery: $12 million media campaign AIU recovery: $12 million media campaign New programs and concentrations New programs and concentrations Unified on-ground and online Unified on-ground and online Teach-out of Los Angeles Teach-out of Los Angeles TM |
 AIU Unified Branding – Old Message AIU Unified Branding – Old Message |
 AIU Unified Branding – New Creative Look AIU Unified Branding – New Creative Look |
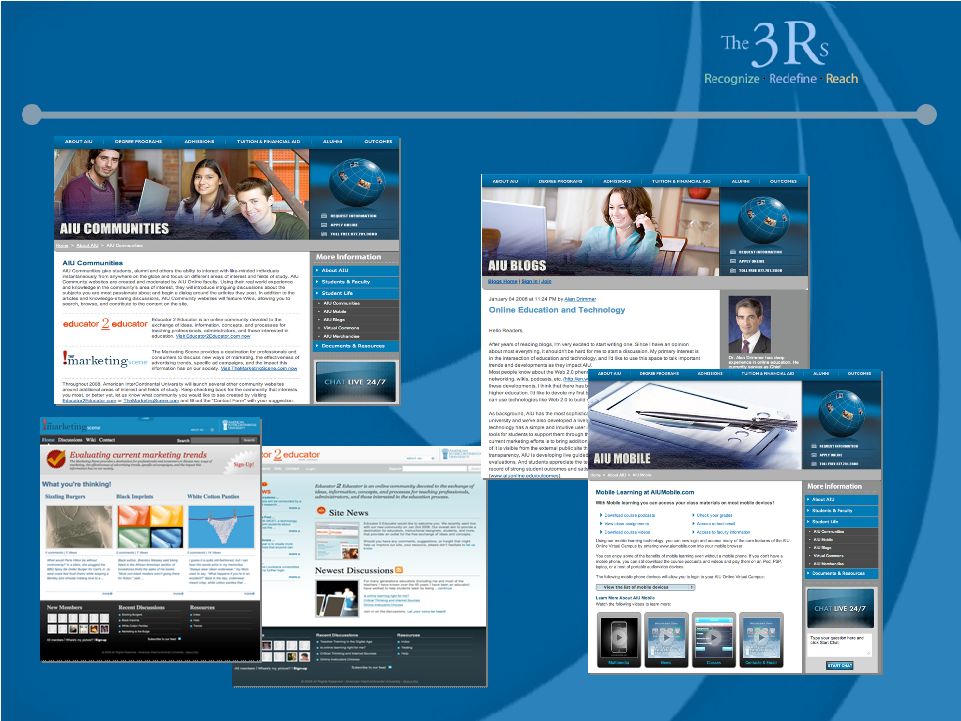 AIU Unified Branding – Communities, Blogging & Mobile AIU Unified Branding – Communities, Blogging & Mobile |
 AIU Commercial |
 Execution Focus: Redesign Business to Enable Increased Student Funding Flexibility Flexible LCB program up to 21 months Increased recruiting focus on local and high school markets New certificate programs at selected schools Optimal footprints for new locations Realigned cost structure to population Improved financial performance of CCA Execution Focus: Redesign Business to Enable Increased Student Funding Flexibility Flexible LCB program up to 21 months Flexible LCB program up to 21 months Increased recruiting focus on local Increased recruiting focus on local and high school markets and high school markets New certificate programs at selected schools New certificate programs at selected schools Optimal footprints for new locations Optimal footprints for new locations Realigned cost structure to population Realigned cost structure to population Improved financial performance of CCA Improved financial performance of CCA Reason #10…Aggressive Plans Reason #10…Aggressive Plans TM Culinary Arts SBU Culinary Arts SBU |
 Execution Focus: Consolidate Brands, Higher End Curriculum, New Locations Consolidated brands New, higher end programs Blended learning Geographic expansion Standardized operations across locations Execution Focus: Consolidate Brands, Higher End Curriculum, New Locations Consolidated brands Consolidated brands New, higher end programs New, higher end programs Blended learning Blended learning Geographic expansion Geographic expansion Standardized operations across locations Standardized operations across locations Reason #10…Aggressive Plans Reason #10…Aggressive Plans Health Education SBU Health Education SBU |
 Execution Focus: On-ground and Blended Programs Determine optimal number and positioning of institutions Leverage common curricula across institutions Grow IADT online and blended learning Increase recruiting focus in local markets for on-ground schools Expand with Academy startups Execution Focus: On-ground and Blended Programs Determine optimal number and positioning Determine optimal number and positioning of institutions of institutions Leverage common curricula across institutions Leverage common curricula across institutions Grow IADT online and blended learning Grow IADT online and blended learning Increase recruiting focus in local markets Increase recruiting focus in local markets for on-ground schools for on-ground schools Expand with Academy startups Expand with Academy startups Reason #10…Aggressive Plans Reason #10…Aggressive Plans TM Art and Design SBU Art and Design SBU |
 Reason #10…Aggressive Plans Reason #10…Aggressive Plans New programs, multi- channel marketing Accreditation enhancements Explore additional geographic expansion New programs, multi- channel marketing Accreditation enhancements Explore additional geographic expansion Business, Communications and Health Education Business, Communications and Health Education Premier Fashion Schools Premier Fashion Schools Execution Focus: Expand Current Properties Execution Focus: Expand Current Properties New programs for London, Paris locations Explore additional geographic expansion New programs for London, Paris locations Explore additional geographic expansion TM International SBU International SBU |
 Why the Optimism? Why the Optimism? Help students change their lives Put major uncertainties behind us Continue positive performance trends Participate in a marketplace with positive outlook Compete with significant strengths Change to succeed Take decisive actions on operations opportunities Align the organization Are resourced to grow Implement aggressive and achievable business plans Help students change their lives Put major uncertainties behind us Continue positive performance trends Participate in a marketplace with positive outlook Compete with significant strengths Change to succeed Take decisive actions on operations opportunities Align the organization Are resourced to grow Implement aggressive and achievable business plans 10 10 1 1 2 2 3 3 4 4 5 5 6 6 7 7 8 8 9 9 |
 Execution Expectations Execution Expectations AIU recovery New online, blended programs Program matriculation New student profiles Optimal program length New locations Brand consolidation 2008 2009 2010 Transformation Acceleration New on-ground, online, blended curricula Program matriculation New locations Continue brand development TM TM |
 Execution Expectations Execution Expectations Develop new organization Centralize support activities Execute teach-outs Build external relationships Develop high performance culture Optimize real estate 2008 2009 2010 Transformation Acceleration Optimize domestic business Teach-outs complete New focus on international expansion Growth: organic, acquisition ® |
 Performance Expectations Performance Expectations 2008-2010 Population 6 to 8% CAGR Revenue 6 to 8% CAGR Margin Low to mid teens New locations 3 to 5 per year Teach-outs Announced teach-outs closed by 2010 |
 2007/2008… Making a Step Change 2007/2008… Making a Step Change CEC 2007 and Prior $1.7 billion Margin degradation Multiple, independent brands/institutions/ operations Mixed reputation Inefficient organization CEC 2007 and Prior $1.7 billion Margin degradation Multiple, independent brands/institutions/ operations Mixed reputation Inefficient organization CEC Future State $2 billion plus: CAGR in mid single digits Margins in “mid teens” Differentiated brands Strong reputation Academic excellence Student outcomes High performance organization CEC Future State $2 billion plus: CAGR in mid single digits Margins in “mid teens” Differentiated brands Strong reputation Academic excellence Student outcomes High performance organization Step change needed now to achieve future state |
 What Keeps Me Awake at Night? What Keeps Me Awake at Night? Student funding availability AIU recovery Rogue admissions representatives Student funding availability AIU recovery Rogue admissions representatives |
 In Summary… In Summary… 2007 a challenging year…but we see important, underlying performance improvements 2007 a challenging year…but we see important, underlying performance improvements |
 In Summary… In Summary… Major transformation that began in 2007 is well underway Progress accelerates in 2008, continues into 2009 Build on a strong foundation Major transformation that began in 2007 is well underway Progress accelerates in 2008, continues into 2009 Build on a strong foundation |
 In Summary… In Summary… Goals reflect significant turnaround Team is optimistic about CEC’s ability to execute 10 Reasons why you should be optimistic Goals reflect significant turnaround Team is optimistic about CEC’s ability to execute 10 Reasons why you should be optimistic |
 © Career Education Corporation 2008 © Career Education Corporation 2008 |
 |
 Len Mariani Len Mariani Chief Marketing and Admissions Officer CAREER EDUCATION CORPORATION Chief Marketing and Admissions Officer CAREER EDUCATION CORPORATION © Career Education Corporation 2008 © Career Education Corporation 2008 ® March 18, 2008 |
 Except for the historical and present factual information contained herein, the matters set forth in this presentation, including statements identified by words such as "anticipate," "believe," "plan," "expect," "intend," "project," "will," and similar expressions, are forward-looking statements as defined in Section 21E of the Securities Exchange Act of 1934, as amended. These statements are based on information currently available to us and are subject to various risks, uncertainties and other factors that could cause our actual growth, results of operations, performance and business prospects, and opportunities to differ materially from those expressed in, or implied by, these statements. Except as expressly required by the federal securities laws, we undertake no obligation to update such factors or to publicly announce the results of any of the forward-looking statements contained herein to reflect future events, developments, or changed circumstances or for any other reason. These risks and uncertainties, the outcome of which could materially and adversely affect our financial condition and operations, include, but are not limited to, the following: risks associated with unfavorable changes in the cost or availability of financing, including alternative loans, for our students; potential higher bad debt expense or reduced revenue associated with requiring students to pay more of their educational expenses while in school; increased competition; the effectiveness of our regulatory compliance efforts; future financial and operational results, including the impact of the impairment of goodwill and other intangible assets; risks related to our ability to comply with accrediting agency requirements or obtain accrediting agency approvals; risks related to our ability to comply with, and the impact of changes in, legislation and regulations that affect our ability to participate in student financial aid programs; costs, risks, and effects of legal and administrative proceedings and investigations and governmental regulations, and class action and other lawsuits; costs, risks and uncertainties associated with our company-wide restructuring, including risks and uncertainties associated with changes in management and reporting responsibilities; costs and difficulties related to the integration of acquired businesses; risks related to our ability to manage and continue growth; risks related to the sale or teach-out of any campuses; risks related to general economic conditions including credit market conditions and other risk factors relating to our industry and business and the factors discussed in our Annual Report on Form 10-K for the year ended December 31, 2007, and from time to time in our other reports filed with the Securities and Exchange Commission. Safe Harbor Safe Harbor © Career Education Corporation 2008 © Career Education Corporation 2008 |
 Summary Summary We recognize our marketing and admission performance represents a significant improvement opportunity We will build and add on to our core strengths in marketing and admissions to improve performance We will define our success by significantly improved starts and cost per start performance We recognize our marketing and admission performance represents a significant improvement opportunity We will build and add on to our core strengths in marketing and admissions to improve performance We will define our success by significantly improved starts and cost per start performance |
 Large, Distributed Operation Marketing, Admissions, PR and Communications Major activities performed in corporate and the business units Under 2,700 full and part-time employees Support over 75 ground and online schools $464M spent in 2007 to generate over 6M leads and deliver over 95,500 starts Large, Distributed Operation Large, Distributed Operation Marketing, Admissions, PR and Communications Major activities performed in corporate and the business units Under 2,700 full and part-time employees Support over 75 ground and online schools $464M spent in 2007 to generate over 6M leads and deliver over 95,500 starts Marketing and Admissions Overview Marketing and Admissions Overview |
 89,700 95,500 1st Qtr 2nd Qtr 3rd Qtr 4th Qtr Total 2006 2007 89,700 95,500 1st Qtr 2nd Qtr 3rd Qtr 4th Qtr Total 2006 2007 Positive Trends Positive Trends Marketing and Admissions Year Over Year Start Increase Year Over Year Start Increase Year Over Year Start Increase *Continuing Operations 5,800 Starts 7% 5,800 Starts 7% |
 $4,800 $5,000 $7,100 $5,930 $4,600 $3,800 $5,700 $4,700 $5,500 $4,860 1st Qtr 2nd Qtr 3rd Qtr 4th Qtr Total 2006 2007 $4,800 $5,000 $7,100 $5,930 $4,600 $3,800 $5,700 $4,700 $5,500 $4,860 1st Qtr 2nd Qtr 3rd Qtr 4th Qtr Total 2006 2007 Positive Trends Positive Trends Marketing and Admissions Year Over Year Cost Per Start Decline CEC Quarterly Average Starts Year Over Year Cost Per Start Decline Year Over Year Cost Per Start Decline CEC Quarterly Average Starts CEC Quarterly Average Starts $640 12% $640 12% |
 Operating Margins Operating Margins Operating Margin Among Lowest in Industry Operating Margin – Percent of Revenue Operating Margin Among Lowest in Industry Operating Margin Among Lowest in Industry Operating Operating Margin Margin – – Percent Percent of of Revenue Revenue 29% 29% 28% 17% 15% 7% 3% ITT Strayer Apollo EDMC DeVry CEC COCO 29% 29% 28% 17% 15% 7% 3% ITT Strayer Apollo EDMC DeVry CEC COCO Marketing and Admissions Source: CECO 2007 10K; Stifel Nicolaus Factbook (Fall 2007); Apollo 6/07 10Q; DeVry 11/07 10Q; COCO 8/07 10K; Strayer 11/07 10Q; ITT (ESI) 10/07 10Q Source: CECO 2007 10K; Stifel Nicolaus Factbook (Fall 2007); Apollo 6/07 10Q; DeVry 11/07 10Q; COCO 8/07 10K; Strayer 11/07 10Q; ITT (ESI) 10/07 10Q |
 $3,900 $6,087 $4,860 $4,215 $3,506 $2,734 $2,281 $2,062 DeVry CEC EDMC ITT COCO Strayer Apollo $6,087 $4,860 $4,215 $3,506 $2,734 $2,281 $2,062 DeVry CEC EDMC ITT COCO Strayer Apollo Marketing and Admissions Costs Among Highest in Industry Marketing and Admissions – Costs Per Start Marketing and Admissions Costs Among Highest in Industry Marketing and Admissions Costs Among Highest in Industry Marketing Marketing and and Admissions Admissions – – Costs Costs Per Per Start Start Cost Per Start Cost Per Start Source: CEC Finance Sept 2007 Profitability Report; Stifel Nicolaus Factbook (Fall 2007) Source: CEC Finance Sept 2007 Profitability Report; Stifel Nicolaus Factbook (Fall 2007) Marketing and Admissions |
 Framework Framework Leads Enroll Start Appt. Student Prospect Fallout Student Prospect Fallout Excessive Student Prospect Fallout Prior to Start Excessive Student Prospect Fallout Prior to Start Excessive Student Prospect Fallout Prior to Start Marketing and Admissions |
 Marketing and Admissions Assets Assets Strong Fundamentals Online marketing innovation Broad online brand presence Custom lead management applications Recognized brands Best practices in advertising and admissions Strong Fundamentals Strong Fundamentals Online marketing innovation Broad online brand presence Custom lead management applications Recognized brands Best practices in advertising and admissions ® TM TM TM |
 Operational, Cultural, Strategic Challenges Decentralized management model results in media buys and admissions process that lack consistency and scale Inadequate focus on student performance and lifetime value Admissions team effectiveness hampered by high turnover and inconsistent skills Multiple and sometimes un-differentiated brands result in sub-optimal performance, awareness, perceptions Operational, Cultural, Strategic Challenges Operational, Cultural, Strategic Challenges Decentralized management model results in Decentralized management model results in media buys and admissions process that lack media buys and admissions process that lack consistency and scale consistency and scale Inadequate focus on student performance and Inadequate focus on student performance and lifetime value lifetime value Admissions team effectiveness hampered by Admissions team effectiveness hampered by high turnover and inconsistent skills high turnover and inconsistent skills Multiple and sometimes un-differentiated brands Multiple and sometimes un-differentiated brands result in sub-optimal performance, awareness, result in sub-optimal performance, awareness, perceptions perceptions Marketing and Admissions Challenges Challenges |
 Marketing and Admissions Timing Timing Most Initiatives Complete or Underway Execution Timing Eliminating unprofitable/least profitable media Scaling lead clearinghouse activities and technology Addressing private lending Consolidating offline and online media buying Consolidating agency and creative management Simplifying brand architecture Enhance front-line supervisor and admissions rep training Simplify rep supp comp plan Most Initiatives Complete or Underway Most Initiatives Complete or Underway Execution Timing Execution Timing Eliminating unprofitable/least Eliminating unprofitable/least profitable media profitable media Scaling lead clearinghouse Scaling lead clearinghouse activities and technology activities and technology Addressing private lending Addressing private lending Consolidating offline and Consolidating offline and online media buying online media buying Consolidating agency and Consolidating agency and creative management creative management Simplifying brand architecture Simplifying brand architecture Enhance front-line supervisor Enhance front-line supervisor and admissions rep training and admissions rep training Simplify rep supp comp plan Simplify rep supp comp plan ‘07 ‘07 07 ‘08 ‘08 08 ‘09 ‘09 09 Q1 Q1 Q4 Q4 Q1 Q1 Q4 Q4 Q1 Q1 Q4 Q4 |
 Improve 2010 Performance Relative to 2007 Target Changes in Cost Per Start, Starts and Revenue Per Student Improve 2010 Performance Relative to 2007 Improve 2010 Performance Relative to 2007 Target Changes in Cost Per Start, Target Changes in Cost Per Start, Starts and Revenue Per Student Starts and Revenue Per Student Marketing and Admissions 2010 Targets 2010 Targets Cost Per Start Cost Per Start $4,100 – $4,100 – $4,400 $4,400 2007 – 2007 – $4,860 $4,860 M/A Costs % Revenue M/A Costs % Revenue 25% – 25% – 27% 27% 2007 – 2007 – 28% 28% Starts Starts 120,000 – 120,000 – 130,000 130,000 2007 – 2007 – 95,500 95,500 |
 Summary Summary We recognize our marketing and admission performance represents a significant improvement opportunity We will build and add on to our core strengths in marketing and admissions to improve performance We will define our success by significantly improved starts and cost per start performance We recognize our marketing and admission performance represents a significant improvement opportunity We will build and add on to our core strengths in marketing and admissions to improve performance We will define our success by significantly improved starts and cost per start performance |
 |
 |
 Mike Graham Mike Graham EXECUTIVE VICE PRESIDENT AND CHIEF FINANCIAL OFFICER CAREER EDUCATION CORPORATION EXECUTIVE VICE PRESIDENT AND CHIEF FINANCIAL OFFICER CAREER EDUCATION CORPORATION © Career Education Corporation 2008 © Career Education Corporation 2008 ® March 18, 2008 March 18, 2008 |
 Safe Harbor Safe Harbor Except for the historical and present factual information contained herein, the matters set forth in this presentation, including statements identified by words such as "anticipate," "believe," "plan," "expect," "intend," "project," "will," and similar expressions, are forward-looking statements as defined in Section 21E of the Securities Exchange Act of 1934, as amended. These statements are based on information currently available to us and are subject to various risks, uncertainties and other factors that could cause our actual growth, results of operations, performance and business prospects, and opportunities to differ materially from those expressed in, or implied by, these statements. Except as expressly required by the federal securities laws, we undertake no obligation to update such factors or to publicly announce the results of any of the forward-looking statements contained herein to reflect future events, developments, or changed circumstances or for any other reason. These risks and uncertainties, the outcome of which could materially and adversely affect our financial condition and operations, include, but are not limited to, the following: risks associated with unfavorable changes in the cost or availability of financing, including alternative loans, for our students; potential higher bad debt expense or reduced revenue associated with requiring students to pay more of their educational expenses while in school; increased competition; the effectiveness of our regulatory compliance efforts; future financial and operational results, including the impact of the impairment of goodwill and other intangible assets; risks related to our ability to comply with accrediting agency requirements or obtain accrediting agency approvals; risks related to our ability to comply with, and the impact of changes in, legislation and regulations that affect our ability to participate in student financial aid programs; costs, risks, and effects of legal and administrative proceedings and investigations and governmental regulations, and class action and other lawsuits; costs, risks and uncertainties associated with our company-wide restructuring, including risks and uncertainties associated with changes in management and reporting responsibilities; costs and difficulties related to the integration of acquired businesses; risks related to our ability to manage and continue growth; risks related to the sale or teach-out of any campuses; risks related to general economic conditions including credit market conditions and other risk factors relating to our industry and business and the factors discussed in our Annual Report on Form 10-K for the year ended December 31, 2007, and from time to time in our other reports filed with the Securities and Exchange Commission. Except for the historical and present factual information contained herein, the matters set forth in this presentation, including statements identified by words such as "anticipate," "believe," "plan," "expect," "intend," "project," "will," and similar expressions, are forward-looking statements as defined in Section 21E of the Securities Exchange Act of 1934, as amended. These statements are based on information currently available to us and are subject to various risks, uncertainties and other factors that could cause our actual growth, results of operations, performance and business prospects, and opportunities to differ materially from those expressed in, or implied by, these statements. Except as expressly required by the federal securities laws, we undertake no obligation to update such factors or to publicly announce the results of any of the forward-looking statements contained herein to reflect future events, developments, or changed circumstances or for any other reason. These risks and uncertainties, the outcome of which could materially and adversely affect our financial condition and operations, include, but are not limited to, the following: risks associated with unfavorable changes in the cost or availability of financing, including alternative loans, for our students; potential higher bad debt expense or reduced revenue associated with requiring students to pay more of their educational expenses while in school; increased competition; the effectiveness of our regulatory compliance efforts; future financial and operational results, including the impact of the impairment of goodwill and other intangible assets; risks related to our ability to comply with accrediting agency requirements or obtain accrediting agency approvals; risks related to our ability to comply with, and the impact of changes in, legislation and regulations that affect our ability to participate in student financial aid programs; costs, risks, and effects of legal and administrative proceedings and investigations and governmental regulations, and class action and other lawsuits; costs, risks and uncertainties associated with our company-wide restructuring, including risks and uncertainties associated with changes in management and reporting responsibilities; costs and difficulties related to the integration of acquired businesses; risks related to our ability to manage and continue growth; risks related to the sale or teach-out of any campuses; risks related to general economic conditions including credit market conditions and other risk factors relating to our industry and business and the factors discussed in our Annual Report on Form 10-K for the year ended December 31, 2007, and from time to time in our other reports filed with the Securities and Exchange Commission. |
 Non-GAAP Financial Information Non-GAAP Financial Information The Company has included some non-GAAP financial measures in this presentation to discuss the Company's financial results. As a general matter, the Company uses these non-GAAP measures in addition to and in conjunction with results presented in accordance with GAAP. Among other things, the Company may use such non-GAAP financial measures in addition to and in conjunction with corresponding GAAP measures, to help analyze the performance of its core business, in connection with the preparation of annual budgets, and in measuring performance for some forms of compensation. In addition, the Company believes that non-GAAP financial information is used by analysts and others in the investment community to analyze the Company's historical results and in providing estimates of future performance and that failure to report these non-GAAP measures could result in confusion among analysts and others and a misplaced perception that the Company's results have underperformed or exceeded expectations. These non-GAAP financial measures reflect an additional way of viewing aspects of the Company's operations that, when viewed with the GAAP results and the reconciliations to corresponding GAAP financial measures, provide a more complete understanding of the Company's results of operations and the factors and trends affecting the Company's business. However, these non-GAAP measures should be considered as a supplement to, and not as a substitute for, or superior to, the corresponding measures calculated in accordance with GAAP. The Company has included some non-GAAP financial measures in this presentation to discuss the Company's financial results. As a general matter, the Company uses these non-GAAP measures in addition to and in conjunction with results presented in accordance with GAAP. Among other things, the Company may use such non-GAAP financial measures in addition to and in conjunction with corresponding GAAP measures, to help analyze the performance of its core business, in connection with the preparation of annual budgets, and in measuring performance for some forms of compensation. In addition, the Company believes that non-GAAP financial information is used by analysts and others in the investment community to analyze the Company's historical results and in providing estimates of future performance and that failure to report these non-GAAP measures could result in confusion among analysts and others and a misplaced perception that the Company's results have underperformed or exceeded expectations. These non-GAAP financial measures reflect an additional way of viewing aspects of the Company's operations that, when viewed with the GAAP results and the reconciliations to corresponding GAAP financial measures, provide a more complete understanding of the Company's results of operations and the factors and trends affecting the Company's business. However, these non-GAAP measures should be considered as a supplement to, and not as a substitute for, or superior to, the corresponding measures calculated in accordance with GAAP. |
 Agenda Agenda Historical trends New organizational structure Three year growth trajectory Student lending transition Transitional schools division Risks and upsides Summary Historical trends New organizational structure Three year growth trajectory Student lending transition Transitional schools division Risks and upsides Summary |
 CEC Financial Model CEC Financial Model Strong growth potential in online Continued margin improvement in on-ground Ability to gain operating leverage in cost structure Significant cash flow generation Strong balance sheet Strong growth potential in online Continued margin improvement in on-ground Ability to gain operating leverage in cost structure Significant cash flow generation Strong balance sheet |
 Population Population 25,000 58,300 32,700 56,800 28,600 56,100 32,000 57,500 0 30,000 60,000 90,000 Jan. 05 Jan. 06 Jan. 07 Jan. 08 25,000 58,300 32,700 56,800 28,600 56,100 32,000 57,500 0 30,000 60,000 90,000 Jan. 05 Jan. 06 Jan. 07 Jan. 08 Despite the effects of AIU’s probationary status over the past two years, strong starts in 2007 drove significant population growth. Despite the effects of AIU’s probationary status over the past two years, strong starts in 2007 drove significant population growth. On-ground Online On-ground Online 89,500 89,500 84,700 84,700 83,300 83,300 89,500 89,500 |
 Annual Revenue Annual Revenue ($ millions) Discontinued Operations Continuing Operations Strong growth in our Online Associate Degree programs reduced our average revenue per student despite solid growth in starts and population during 2007. Strong growth in our Online Associate Degree programs reduced our average revenue per student despite solid growth in starts and population during 2007. $956 $222 $1,505 $223 $1,855 $180 $1,806 $143 $1,675 $121 $0 $500 $1,000 $1,500 $2,000 $2,500 2003 2004 2005 2006 2007 $956 $222 $1,505 $223 $1,855 $180 $1,806 $143 $1,675 $121 $0 $500 $1,000 $1,500 $2,000 $2,500 2003 2004 2005 2006 2007 |
 $199 $671 $263 $575 $267 $416 $0 $100 $200 $300 $400 $500 $600 $700 2005 2006 2007 $199 $671 $263 $575 $267 $416 $0 $100 $200 $300 $400 $500 $600 $700 2005 2006 2007 University Revenue University Revenue ($ millions) While CTU revenue has shown substantial growth since 2005, AIU’s revenue has declined due to the effects of probation. While CTU revenue has shown substantial growth since 2005, AIU’s revenue has declined due to the effects of probation. AIU CTU AIU CTU |
 19% 19% 21% 9% 7% 0% 5% 10% 15% 20% 25% 2003 2004 2005 2006 2007 Continuing Operations Continuing Operations Operating Profit Margin Operating Profit Margin A mix shift in our Online University schools coupled with higher levels of startup and teach-out activity have created pressure on operating margins in recent years. A mix shift in our Online University schools coupled with higher levels of startup and teach-out activity have created pressure on operating margins in recent years. * 2007 and 2006 include a goodwill and asset impairment charge of $5.8 million and $90.1 million respectively * 2007 and 2006 include a goodwill and asset impairment charge of $5.8 million and $90.1 million respectively |
 Diluted Earnings Per Share Diluted Earnings Per Share $1.08 $0.04 $1.70 $0.01 $2.39 -$0.13 $0.90 -$0.43 $1.01 -$0.38 -$1 $0 $1 $1 $2 $2 $3 2003 2004 2005 2006 2007 $1.08 $0.04 $1.70 $0.01 $2.39 -$0.13 $0.90 -$0.43 $1.01 -$0.38 -$1 $0 $1 $1 $2 $2 $3 2003 2004 2005 2006 2007 * 2007 and 2006 include a goodwill and asset impairment charge of $5.8 million and $90.1 million respectively * 2007 and 2006 include a goodwill and asset impairment charge of $5.8 million and $90.1 million respectively Continuing Operations Discontinued Operations Continuing Operations Discontinued Operations |
       2006 2005 Balance Sheet & Cash Flow Highlights Balance Sheet & Cash Flow Highlights $222 $378 $216 Net Cash Provided by Operating Activities ($58) ($126) ($69) Capital Expenditures 3.2% 6.2% 3.6% Capex % of Revenue $164 $252 $147 Subtoal ($224) ($200) ($166) Share Repurchases ($60) $52 ($19) Net ($27) $52 $33 Cumulative 2007 ($ millions) |
 Student Retention Trends Student Retention Trends Despite external pressures on our business over the past two years, student retention has shown increased sustainability of our student base. Despite external pressures on our business over the past two years, student retention has shown increased sustainability of our student base. 65% 66% 68% 64% 66% 68% 2005 2006 2007 65% 66% 68% 64% 66% 68% 2005 2006 2007 |
 Cohort Default Rates Cohort Default Rates Since 2004, cohort default rates have been improving year-over-year and we project further improvement for 2006. Since 2004, cohort default rates have been improving year-over-year and we project further improvement for 2006. 0% 4% 8% 12% 2004 2005 2006 (Projected) 0% 4% 8% 12% 2004 2005 2006 (Projected) 12.1% 12.1% 10.6% 10.6% 8% - 10% 8% - 10% |
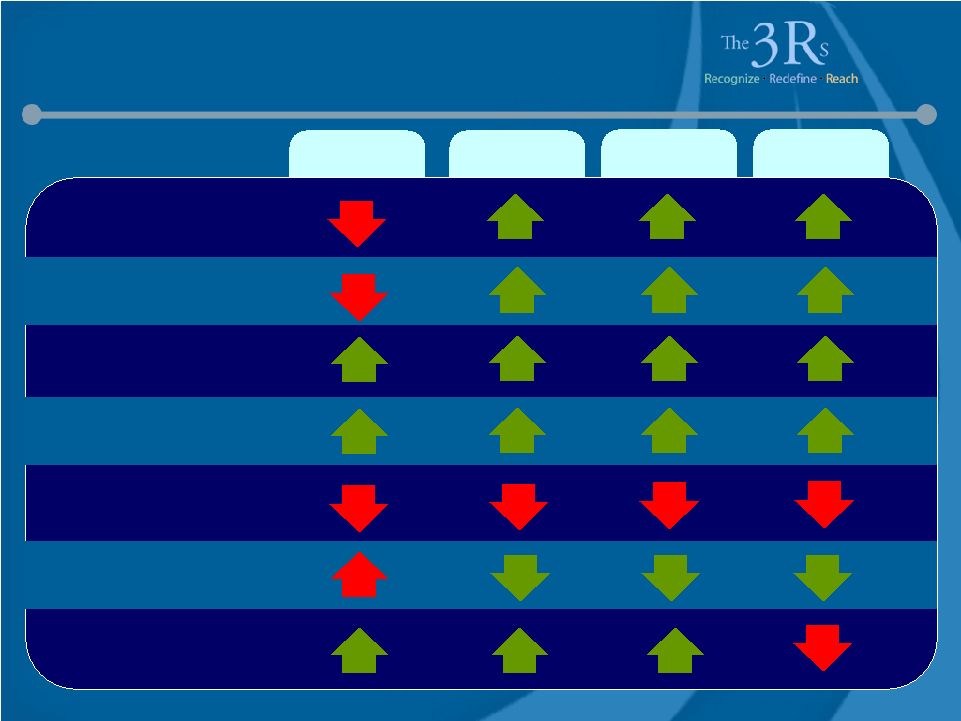 2007 Inflection Points 2007 Inflection Points 4Q07 3Q07 2Q07 1Q07 Starts Population Conversions Show Rates RPS Cost per Start Retention |
       Operating Profit 2007 Results By Division 2007 Results By Division vs’06 2007 vs ’06 2007 vs ’06 2007 Revenue Population (1/31/08) ($ millions) (1) 2006 includes a goodwill and asset impairment charge of $86.3 million 8,400 (75%) $4 $171 4% Academy 12% 7,700 (72%) $9 $184 (16%) Colleges (11%) 10,900 (19%) $49 $366 - Culinary - 13,500 109% (1) $7 $189 12% Health 16% 8,600 14% $13 $82 61% International 13% 40,400 (55%) $91 $683 (18%) University 5% N/A 37% ($52) - N/A Corporate N/A 89,500 (23%) $120 $1,675 (7%) CEC Total 6% |
 Pro Forma 2007 - 2010 Pro Forma 2007 - 2010 Pro Forma to reflect new organizational structure All charts and graphs representing 2007 – 2010 projected growth exclude transitional school division results Pro Forma to reflect new organizational structure All charts and graphs representing 2007 – 2010 projected growth exclude transitional school division results |
 2007 Pro Forma 2007 Pro Forma College segment schools moved to Art & Design with the exception of Briarcliffe which moved into University Schools in teach-out previously classified in Colleges, Academy and University segments moved to Transitional Schools Schools in teach-out previously classified as assets held for sale in discontinued operations moved to Transitional Schools Schools remaining with CEC previously classified as assets held for sale in discontinued operations moved to Health Education College segment schools moved to Art & Design with the exception of Briarcliffe which moved into University Schools in teach-out previously classified in Colleges, Academy and University segments moved to Transitional Schools Schools in teach-out previously classified as assets held for sale in discontinued operations moved to Transitional Schools Schools remaining with CEC previously classified as assets held for sale in discontinued operations moved to Health Education |
             Transitional AIU: 6 - CTU: 5 Briarcliffe: 2 IADT: 11 - Brooks Institute: 1 - Harrington: 1 Collins: 1 - Brown: 1 Art & Design 15 Formed SBUs Formed SBUs Culinary Arts 15 Health 24 International 12 University 13 Le Cordon Bleu (LCB): 13 Kitchen Academy: 2 Sanford Brown: 19 - Missouri: 1 - Gibbs: 2 Western School of Health & Business Careers: 2 INSEEC: 9 Instituto Marangoni: 3 Gibbs:7 - AIU:1 - IADT:2 - Brooks College:2 Lehigh Valley: 1 - McIntosh:1 |
 Population 2007 - 2010 Population 2007 - 2010 0 50,000 100,000 150,000 2007 2010 (projected) Art & Design Culinary Health International University 0 50,000 100,000 150,000 2007 2010 (projected) Art & Design Culinary Health International University 6% - 8% CAGR 6% - 8% CAGR * Excludes Transitional School Division Results * Excludes Transitional School Division Results |
 Revenue 2007 - 2010 Revenue 2007 - 2010 $0 $500 $1,000 $1,500 $2,000 2007 2010 (projected) Art and Design Culinary Health International University $0 $500 $1,000 $1,500 $2,000 2007 2010 (projected) Art and Design Culinary Health International University 6% - 8% CAGR 6% - 8% CAGR ($millions) ($millions) * Excludes Transitional School Division Results * Excludes Transitional School Division Results |
 Operating Expense 2007-2010 Operating Expense 2007-2010 2007 2010 (projected) Bad Debt Administration Advertising and Admissions Educational Services and Facilities 2007 2010 (projected) Bad Debt Administration Advertising and Admissions Educational Services and Facilities 35% 35% 28% 28% 22% 22% 3% 3% 32% 32% 27% 27% 20% 20% 4% 4% * Excludes Transitional School Division Results * Excludes Transitional School Division Results |
 2007 2010 (projected) Art & Design Culinary Health International University 2007 2010 (projected) Art & Design Culinary Health International University Operating Profit Margin 2007-2010 Operating Profit Margin 2007-2010 Low to Mid Teens Low to Mid Teens 9% 9% * Excludes Transitional School Division Results * Excludes Transitional School Division Results |
 Art and Design SBU Art and Design SBU Utilize strength of specialty schools across IADT (i.e. photography, fashion design, gaming) Successful launch of IADT online Blended learning One Academy initiative Consistent messaging and advertising Utilize strength of specialty schools across IADT (i.e. photography, fashion design, gaming) Successful launch of IADT online Blended learning One Academy initiative Consistent messaging and advertising 2010 Outlook 2007 Pro Forma $275 million Mid Single Digit CAGR Revenue 12.0% Mid Teens Operating Profit Margin |
 Culinary Arts SBU Culinary Arts SBU Offer extended Le Cordon Bleu Associate Program Focus recruiting efforts on local markets Base new startups on smaller operating footprint Introduce additional certificate-based programs Offer extended Le Cordon Bleu Associate Program Focus recruiting efforts on local markets Base new startups on smaller operating footprint Introduce additional certificate-based programs 2010 Outlook 2007 Pro Forma $366 million Mid Single Digit CAGR Revenue 13.0% High Single Digits Operating Profit Margin |
 Health Education SBU Health Education SBU Expand higher end program offerings Introduce blended learning model Consistent platform Consolidation of brands Geographic expansion through startups Expand higher end program offerings Introduce blended learning model Consistent platform Consolidation of brands Geographic expansion through startups 2010 Outlook 2007 Pro Forma $207 million High Single Digit CAGR Revenue 3.0% High Single Digits Operating Profit Margin |
 International SBU International SBU Continued growth of INSEEC through new program offerings Solidify market acceptance of Istituto Marangoni London and Paris locations Explore geographic expansion Continued growth of INSEEC through new program offerings Solidify market acceptance of Istituto Marangoni London and Paris locations Explore geographic expansion 2010 Outlook 2007 Pro Forma $82 million Mid Teens CAGR Revenue 16.0% High Teens Operating Profit Margin |
 University SBU University SBU Renewal of AIU brand Continued growth in CTU military market Determine Briarcliffe strategy regarding online and blended learning Renewal of AIU brand Continued growth in CTU military market Determine Briarcliffe strategy regarding online and blended learning 2010 Outlook 2007 Pro Forma $704 million Low Teens CAGR Revenue 15.0% Low Twenties Operating Profit Margin |
 AIU Profitability Initiatives AIU Profitability Initiatives Introduce new programs and concentrations Launch $12 million new media campaign Align on-ground and online educational calendars Leverage power of entire university Teach-out Los Angeles campus Ended agreement with AIU Dubai Introduce new programs and concentrations Launch $12 million new media campaign Align on-ground and online educational calendars Leverage power of entire university Teach-out Los Angeles campus Ended agreement with AIU Dubai 2010 Outlook 2007 Pro Forma $400 million Mid Single Digit CAGR Revenue 15.0% High Teens to Low Twenties Operating Profit Margin |
 CTU Profitability Initiatives CTU Profitability Initiatives Grow military markets Enhance Institute of Advanced Study Introduce new programs and concentrations Matriculate associate students to bachelor’s degree programs Capitalize on one University Grow military markets Enhance Institute of Advanced Study Introduce new programs and concentrations Matriculate associate students to bachelor’s degree programs Capitalize on one University 2010 Outlook 2007 Pro Forma $267 million Mid Teens CAGR Revenue 17.0% Low Twenties Operating Profit Margin |
 Student Lending Transition Student Lending Transition January, 2008: Sallie Mae (SLM) announced intention to terminate recourse loan program to new students January, 2008: SLM increased discount rate in interim period from 25% to 44% February, 2008: SLM announced intention to terminate recourse loan program to students February, 2008: SLM terminating certain FICO bands from its non-recourse loan programs February, 2008: CECO announces that it will utilize its balance sheet to support serial students and selective lending to new students January, 2008: Sallie Mae (SLM) announced intention to terminate recourse loan program to new students January, 2008: SLM increased discount rate in interim period from 25% to 44% February, 2008: SLM announced intention to terminate recourse loan program to students February, 2008: SLM terminating certain FICO bands from its non-recourse loan programs February, 2008: CECO announces that it will utilize its balance sheet to support serial students and selective lending to new students |
     Student Lending Transition – Projected Financial Impact Student Lending Transition – Projected Financial Impact $ millions $ millions 2008 2009 ($20-$25) Discontinue existing EPP ($20-$25) ($50-$65) Loss Culinary – SLM Recourse & Repositioning ($70-$85) ($25-$35) Loss Other Segments – SML Recourse ($30-$40) ($95-$125) Subtotal ($120-$150) $20-$25 CEC New Payment Plan $25-$30 $0-$10 Alternate Lenders $20-$30 ($40-$60) Net Loss Profit ($40-$60) ($75-$90) Net Loss Revenue ($75-$90) |
 University Segment AIU Los Angeles Academy Segment IADT Toronto & Pittsburgh Gibbs Segment 7 Gibbs Schools College Segment Lehigh Valley, McIntosh, Brooks College (Sunnyvale & Long Beach) Transitional Transitional School Segment School Segment Transitional School Segment Transitional School Segment |
 Transitional School Segment – Projected Financial Impact Transitional School Segment – Projected Financial Impact 2009 Operating Loss 2009 Revenue 2008 Operating Loss 2008 Revenue ($3-$5) $0 - $2 $10 - $12 ($8-$10) Academy ($30-$34) $8 - $12 $45 - $50 ($20-$25) Gibbs ($6-$8) $0 - $2 $13 - $18 ($15-$21) Colleges ($3-$5) $0 - $2 $7 - $10 ($7-$9) University ($42-$52) $8 - $18 $75 - $90 ($50-$65) Subtotal ($55-$75) Exiting real estate obligations ($ millions) |
 Transitional School Segment – Projected Financial Impact Transitional School Segment – Projected Financial Impact ($ millions) 2008 2009 2010 $75 - $90 $8 - $18 ($50 - $65) ($97 - $127) ($10 - $20) Revenue Operating Income Real Estate |
 Perspectives on 2008 Perspectives on 2008 Change in earnings days at AIU from first quarter 2008 to third quarter 2008 $12 million investment in marketing for AIU renewal $18-$20 million savings, net of severance for organizational restructuring Loss of revenue and operating profit due to lending market contraction Change in earnings days at AIU from first quarter 2008 to third quarter 2008 $12 million investment in marketing for AIU renewal $18-$20 million savings, net of severance for organizational restructuring Loss of revenue and operating profit due to lending market contraction |
 Perspectives on 2009 Perspectives on 2009 Anticipated loss of revenue and operating profit due to lending market contraction Real estate obligation on schools in teach-out Lengthening of Culinary program Anticipated loss of revenue and operating profit due to lending market contraction Real estate obligation on schools in teach-out Lengthening of Culinary program |
 Real Estate Efforts Real Estate Efforts Over 7 million square feet of space in global portfolio Portfolio rationalization initiative actively in progress Efficiency planning in progress to identify significant additional opportunities in 2008 and 2009 Developed and implemented standardization plans for proposed new campuses Over 7 million square feet of space in global portfolio Portfolio rationalization initiative actively in progress Efficiency planning in progress to identify significant additional opportunities in 2008 and 2009 Developed and implemented standardization plans for proposed new campuses |
 Summary Summary $195 - $195 - $235 $235 $164 $164 Est. Free Cash Flow Est. Free Cash Flow $210 $210 - - $255 $255 $65 $65 Total Total ($10 - ($10 - $20) $20) N/A N/A ($86) ($86) Transitional Transitional Operating Income Operating Income $225 - $225 - $270 $270 Low to Mid Low to Mid Teens Teens $151 $151 Operating Income Operating Income $1,950 - $1,950 - $2,050 $2,050 6% - 6% - 8% 8% CAGR CAGR $1,635 $1,635 Revenue Revenue 2010 2010 Milestone Milestone 2007 2007 Restated Restated ($ millions) ($ millions) |
 Other Performance Considerations Other Performance Considerations Student lending AIU pace of recovery Growth in higher degrees Growth in blended learning Rapid elimination of excess real estate Student lending AIU pace of recovery Legal and regulatory Issues Culinary transition Excess charges for the reduction of excess real estate 2008 - 2010 Primary Risks Potential Upsides ® |
 Q & A Q & A Q#1: In 2009, you have operating losses from teach-outs and real estate disposal as well as the impact from student lending. Are you concerned about meeting the DOE financial responsibility ratio? Q#2: Will you continue to take advantage of your repurchase program? What is the minimum cash you want to maintain on your balance sheet? Q#3: Would you consider taking on more debt? What is your ideal capital structure? Q#1: In 2009, you have operating losses from teach-outs and real estate disposal as well as the impact from student lending. Are you concerned about meeting the DOE financial responsibility ratio? Q#2: Will you continue to take advantage of your repurchase program? What is the minimum cash you want to maintain on your balance sheet? Q#3: Would you consider taking on more debt? What is your ideal capital structure? |
 CEC Financial Model CEC Financial Model Strong growth potential in online Continued margin improvement in on-ground Ability to gain operating leverage in cost structure Significant cash flow generation Strong balance sheet Strong growth potential in online Continued margin improvement in on-ground Ability to gain operating leverage in cost structure Significant cash flow generation Strong balance sheet |
 Q&A Q&A |
 |