Exhibit 99.1

Exhibit 99.1
Career Education Corporation
2010 Analyst and Investor Day
February 18, 2010
Copyright Career Education Corporation 2010
John Springer
Senior Vice President, Finance and Investor Relations
Copyright Career Education Corporation 2010 2010 Analyst and Investor Day

Welcome!
1:00 p.m. – 2:30 p.m. Overview and Strategy – Gary E. McCullough, President and Chief Executive Officer
2:30 p.m. – 2:45 p.m. Break
Technology Discussion and Demonstration – Manoj Kulkarni, Chief Information Officer
2:45 p.m. – 4:15 p.m.
Financial Highlights and Outlook – Mike Graham, Executive Vice President and Chief Financial Officer
4:15 p.m. – 5:00 p.m. Questions and Answers
2010 Analyst and Investor Day
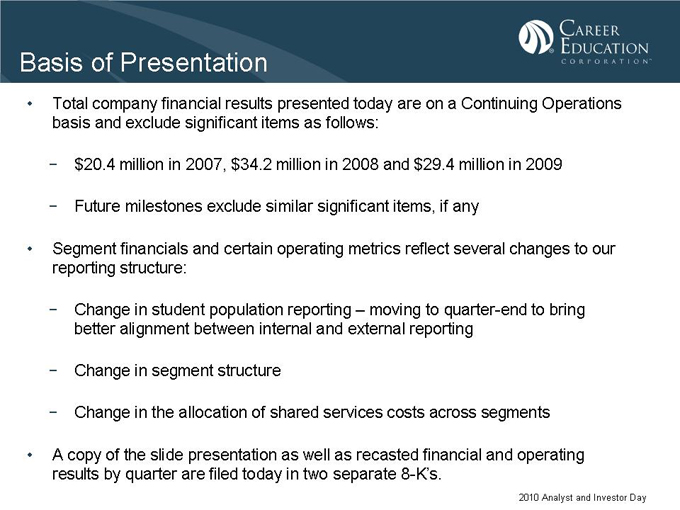
Basis of Presentation
Total company financial results presented today are on a Continuing Operations basis and exclude significant items as follows:
$20.4 million in 2007, $34.2 million in 2008 and $29.4 million in 2009
Future milestones exclude similar significant items, if any
Segment financials and certain operating metrics reflect several changes to our reporting structure:
Change in student population reporting – moving to quarter-end to bring better alignment between internal and external reporting
Change in segment structure
Change in the allocation of shared services costs across segments
A copy of the slide presentation as well as recasted financial and operating results by quarter are filed today in two separate 8-K’s.
2010 Analyst and Investor Day
Safe Harbor
During this presentation, we will make forward-looking statements subject to known and unknown risks and uncertainties that could cause actual performance to differ materially from that expressed or implied by the statements. These statements are based on information currently available to us. Some factors that could cause actual results and performance to differ are: •Our ability to comply with the extensive regulatory requirements and accreditation requirements for school operations •Changes and uncertainties in student lending markets and federal and state student financial aid programs •Financial and operating results, including new student starts •Our ability to manage and grow our business in current and changing economic, political, regulatory and competitive environments •Litigation, claims and administrative proceedings involving the company •Other risks described from time to time in our press releases and our filings with the Securities and Exchange Commission We undertake no obligation to publicly release any revisions to forward-looking statements to reflect events or expectations after the date of this presentation. We provide a detailed discussion of risk factors in our SEC filings and encourage you to review the filings.
2010 Analyst and Investor Day
Non-GAAP Financial Measures
The Company has included some non-GAAP financial measures in this presentation to discuss the Company’s financial results and outlook. As a general matter, the Company uses these non-GAAP measures in addition to and in conjunction with results presented in accordance with GAAP. Among other things, the Company may use such non-GAAP financial measures in addition to and in conjunction with corresponding GAAP measures, to help analyze the performance of its core business, in connection with the preparation of annual budgets, and in measuring performance for some forms of compensation. In addition, the Company believes that non-GAAP financial measures are used by analysts and others in the investment community to analyze the Company’s historical results and in providing estimates of future performance and that failure to report these non-GAAP measures could result in confusion among analysts and others and a misplaced perception that the Company’s results have underperformed or exceeded expectations.
These non-GAAP financial measures reflect an additional way of viewing aspects of the Company’s operations that, when viewed with the GAAP results and the reconciliations to corresponding GAAP financial measures, provide a more complete understanding of the Company’s results of operations and the factors and trends affecting the Company’s business. However, these non-GAAP measures should be considered as a supplement to, and not as a substitute for, or superior to, the corresponding measures calculated in accordance with GAAP.
2010 Analyst and Investor Day
Gary E. McCullough
President and Chief Executive Officer
Copyright Career Education Corporation 2010 2010 Analyst and Investor Day
Our Approach to Analyst & Investor Day
• We have worked to be transparent during the past three years
• Messages today are intended to be aligned with expressed investor and analyst needs
• Goal is to have you see the company through a different lens
Commitment to changing lives through education
Completed major transformation ahead of expectations
Strength & momentum of a diversified model
• We will answer as many questions as possible today
2010 Analyst and Investor Day

Summary
• Transformed company and achieved 2010 milestones
• Strong momentum entering 2010
• Well positioned in key market segments
• Focused strategies to deliver next level of growth
2010 Analyst and Investor Day

Statement of Purpose
To change lives through education.
2010 Analyst and Investor Day
Vision Statement
Transform the company into a progressive, proprietary education leader that delivers life-changing education for generations of students.
“Progressive, Proprietary Education Leader” – We aspire to educate with schools that rapidly evolve our academic offerings to meet both student and employer demands
“Life-changing Education “ – This is consistent with our Purpose
“Generations of Students “ – This reflects our desire to create an enduring company
2010 Analyst and Investor Day
Core Values
Integrity
Respect
Diversity
Social responsibility
Excellence
Students Employees
2010 Analyst and Investor Day
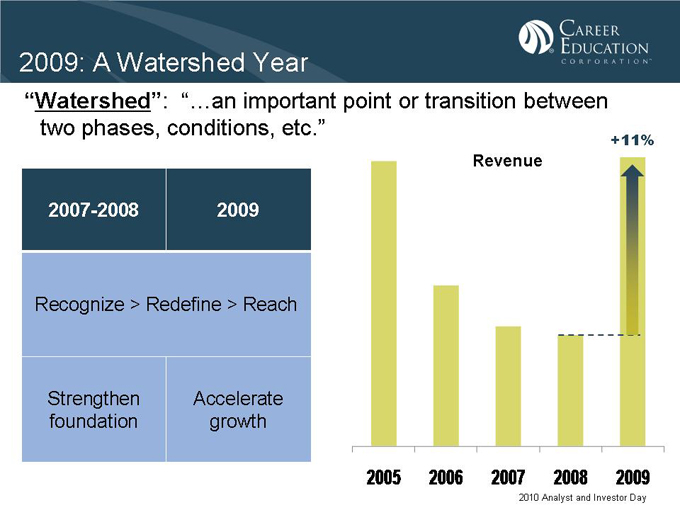
2009: A Watershed Year
“Watershed”: “…an important point or transition between two phases, conditions, etc.”
2007-2008 2009
Recognize > Redefine > Reach
Strengthen foundation
Accelerate growth
Revenue
+11%
2005 2006 2007 2008 2009
2010 Analyst and Investor Day
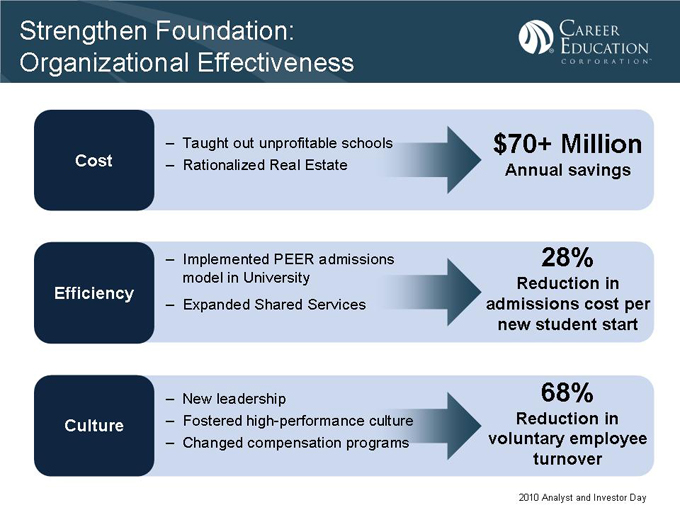
Strengthen Foundation: Organizational Effectiveness
Cost
Taught out unprofitable schools Rationalized Real Estate
$70+ Million
Annual savings
Efficiency
Implemented PEER admissions model in University Expanded Shared Services
28%
Reduction in admissions cost per new student start
Culture
New leadership
Fostered high-performance culture Changed compensation programs
68%
Reduction in voluntary employee turnover
2010 Analyst and Investor Day
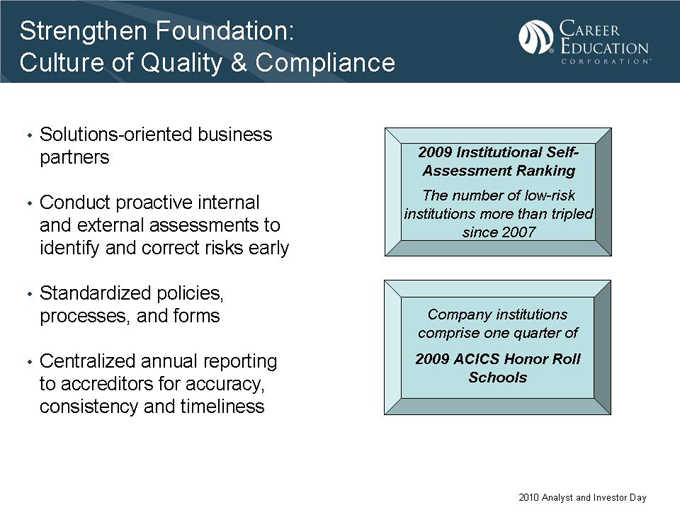
Strengthen Foundation: Culture of Quality & Compliance
• Solutions-oriented business partners
• Conduct proactive internal and external assessments to identify and correct risks early
• Standardized policies, processes, and forms
• Centralized annual reporting to accreditors for accuracy, consistency and timeliness
2009 Institutional Self-Assessment Ranking
The number of low-risk institutions more than tripled since 2007
Company institutions comprise one quarter of
2009 ACICS Honor Roll Schools
2010 Analyst and Investor Day
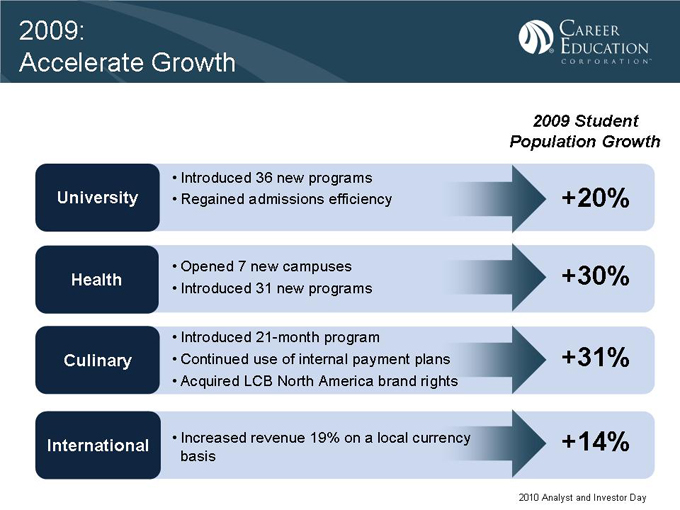
2009: Accelerate Growth
University
Introduced 36 new programs Regained admissions efficiency
+20%
Health
• Opened 7 new campuses
• Introduced 31 new programs
+30%
Culinary
• Introduced 21-month program
• Continued use of internal payment plans
• Acquired LCB North America brand rights
+31%
International
Increased revenue 19% on a local currency basis
+14%
2010 Analyst and Investor Day
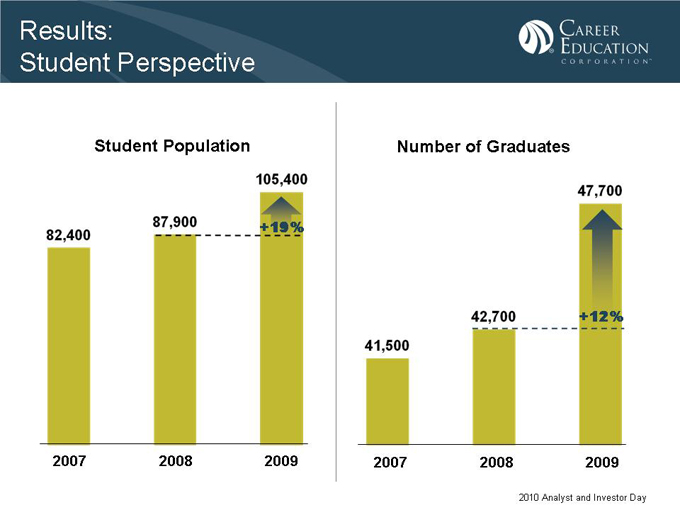
Results: Student Perspective
Student Population
+19% 82,400 87,900 105,400
2007 2008 2009
Number of Graduates
+12% 41,500 42,700 47,700
2007 2008 2009
2010 Analyst and Investor Day
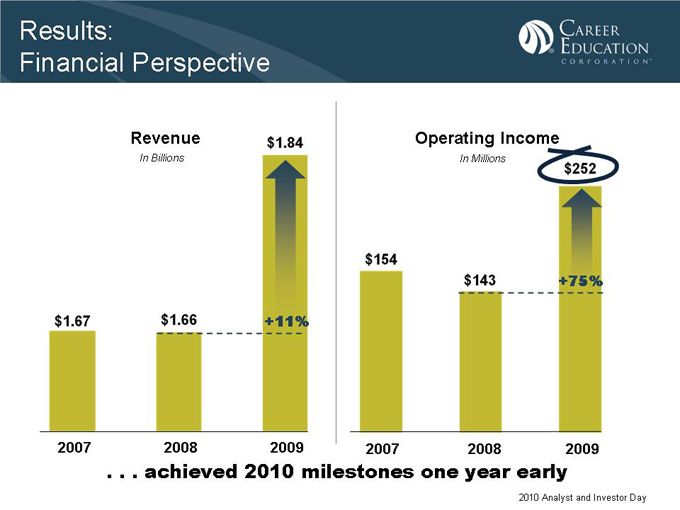
Results:
Financial Perspective
Revenue
In Billions
+11% $1.67 $1.66 $1.84
2007 2008 2009
Operating Income
In Millions
+75% $154 $143 $252
2007 2008 2009
. . . achieved 2010 milestones one year early
2010 Analyst and Investor Day
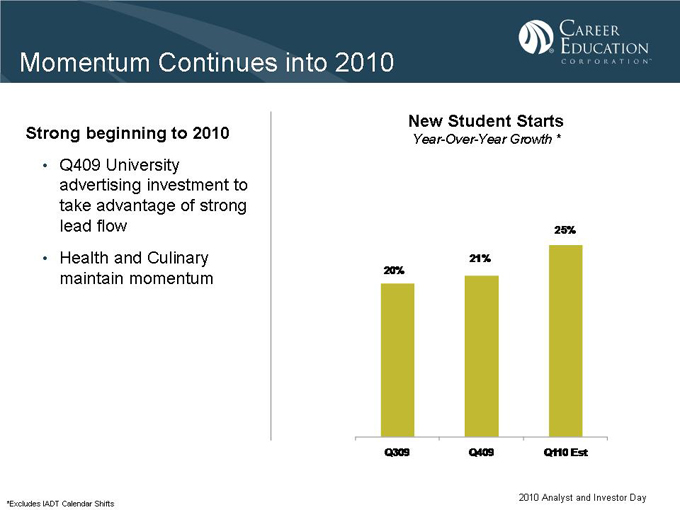
Momentum Continues into 2010
Strong beginning to 2010
• Q409 University advertising investment to take advantage of strong lead flow
• Health and Culinary maintain momentum
New Student Starts
Year-Over-Year Growth *
25%
21% 20%
Q309 Q409 Q110 Est
*Excludes IADT Calendar Shifts
2010 Analyst and Investor Day

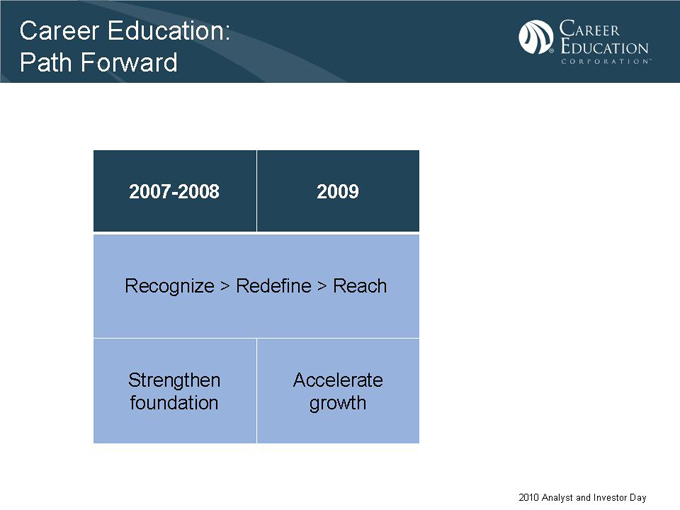
Career Education: Path Forward
2007-2008 2009
Recognize > Redefine > Reach
Strengthen foundation
Accelerate growth
2010 Analyst and Investor Day
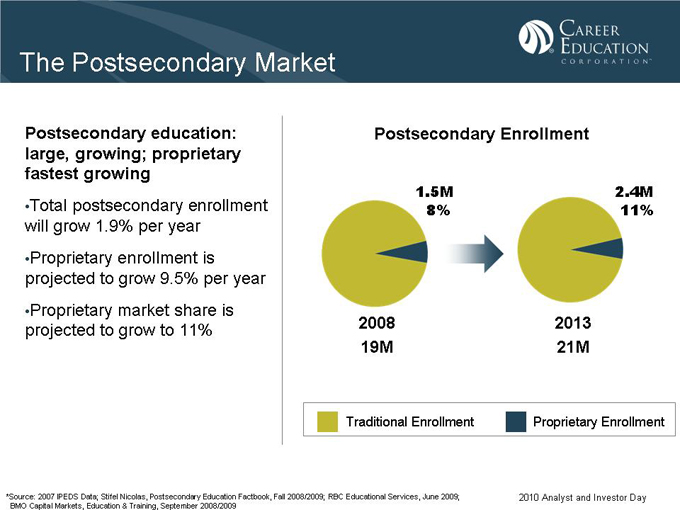
The Postsecondary Market
Postsecondary education: large, growing; proprietary fastest growing
•Total postsecondary enrollment will grow 1.9% per year •Proprietary enrollment is projected to grow 9.5% per year •Proprietary market share is projected to grow to 11%
Postsecondary Enrollment
1.5M
8%
2008 19M
2.4M 11%
2013 21M
Traditional Enrollment
Proprietary Enrollment
*Source: 2007 IPEDS Data; Stifel Nicolas, Postsecondary Education Factbook, Fall 2008/2009; RBC Educational Services, June 2009; BMO Capital Markets, Education & Training, September 2008/2009
2010 Analyst and Investor Day
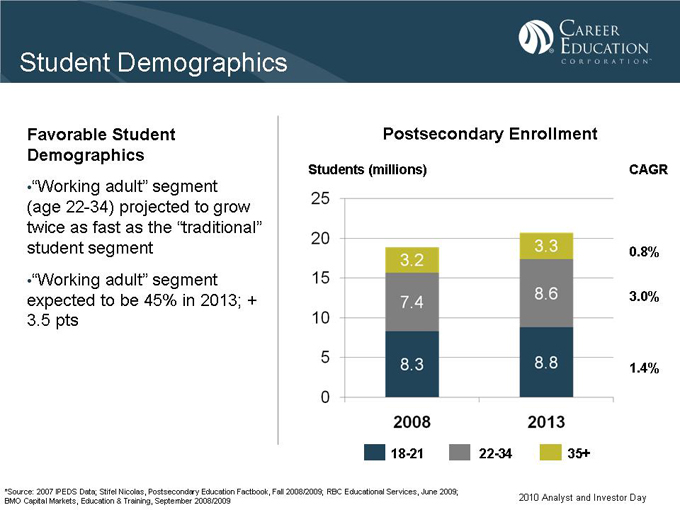
Student Demographics
Favorable Student Demographics
•”Working adult” segment (age 22-34) projected to grow twice as fast as the “traditional” student segment •”Working adult” segment expected to be 45% in 2013; + 3.5 pts
Postsecondary Enrollment
Students (millions)
CAGR
0 5 10 15 20 25
2008 3.2 7.4 8.3
2013 3.3 8.6 8.8
0.8%
3.0%
1.4%
18-21 22-34 35+
*Source: 2007 IPEDS Data; Stifel Nicolas, Postsecondary Education Factbook, Fall 2008/2009; RBC Educational Services, June 2009; BMO Capital Markets, Education & Training, September 2008/2009
2010 Analyst and Investor Day
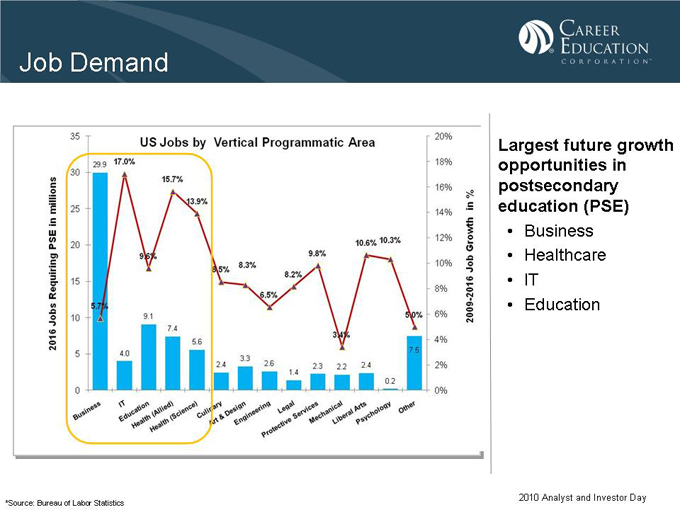
Job Demand
Largest future growth opportunities in postsecondary education (PSE)
• Business
• Healthcare
• IT
• Education
*Source: Bureau of Labor Statistics
2010 Analyst and Investor Day
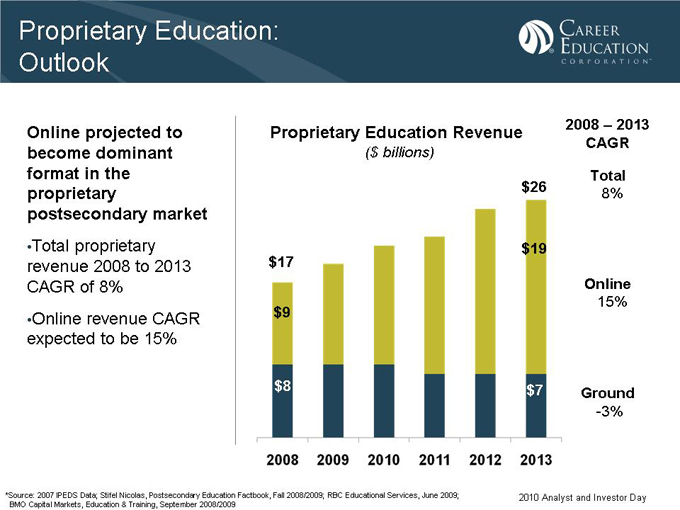
Proprietary Education: Outlook
Online projected to become dominant format in the proprietary postsecondary market
•Total proprietary revenue 2008 to 2013 CAGR of 8% •Online revenue CAGR expected to be 15%
Proprietary Education Revenue
($ billions)
2008 – 2013 CAGR
Total
8%
Online
15%
Ground
-3%
$26
$19 $17
$9
$8 $7
2008 2009 2010 2011 2012 2013
*Source: 2007 IPEDS Data; Stifel Nicolas, Postsecondary Education Factbook, Fall 2008/2009; RBC Educational Services, June 2009; BMO Capital Markets, Education & Training, September 2008/2009
2010 Analyst and Investor Day
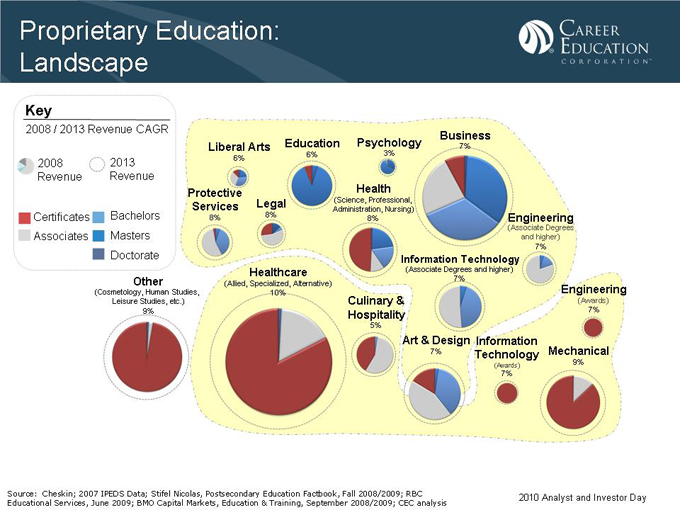
Proprietary Education: Landscape
Key
2008 / 2013 Revenue CAGR
2008 2013 Revenue Revenue
Certificates Bachelors Associates Masters Doctorate
Liberal Arts
6%
Education
6%
Psychology
3%
Business
7%
Protective Services
8%
Legal
8%
Health
(Science, Professional, Administration, Nursing) 8%
Engineering
(Associate Degrees and higher) 7%
Information Technology
(Associate Degrees and higher) 7%
Healthcare
(Allied, Specialized, Alternative) 10%
Culinary & Hospitality
5%
Other
(Cosmetology, Human Studies, Leisure Studies, etc.) 9%
Art & Design
7%
Information Technology
(Awards) 7%
Engineering
(Awards) 7%
Mechanical
9%
Source: Cheskin; 2007 IPEDS Data; Stifel Nicolas, Postsecondary Education Factbook, Fall 2008/2009; RBC Educational Services, June 2009; BMO Capital Markets, Education & Training, September 2008/2009; CEC analysis
2010 Analyst and Investor Day

Proprietary Education: University Landscape
Key
2008 / 2013 Revenue CAGR
2008 Revenue
2013 Revenue
Certificates Associates
Bachelors Masters Doctorate
University -type Curricula
Liberal Arts
6%
Protective Services
8%
Education
6%
Legal
8%
Psychology
3%
Health
(Science, Professional,
Administration, Nursing) 8%
Business
7%
Engineering
(Associate Degrees and higher) 7%
Information Technology
(Associate Degrees and higher) 7%
Art & Design
7%
University segment characteristics:
• Bachelors and higher
• Online focused
• Regional Accreditation
• Diversified offerings
• Largest demand:
Business, Education, Health and IT
Source: Cheskin; 2007 IPEDS Data; Stifel Nicolas, Postsecondary Education Factbook, Fall 2008/2009; RBC Educational Services, June 2009; BMO Capital Markets, Education & Training, September 2008/2009; CEC analysis
2010 Analyst and Investor Day
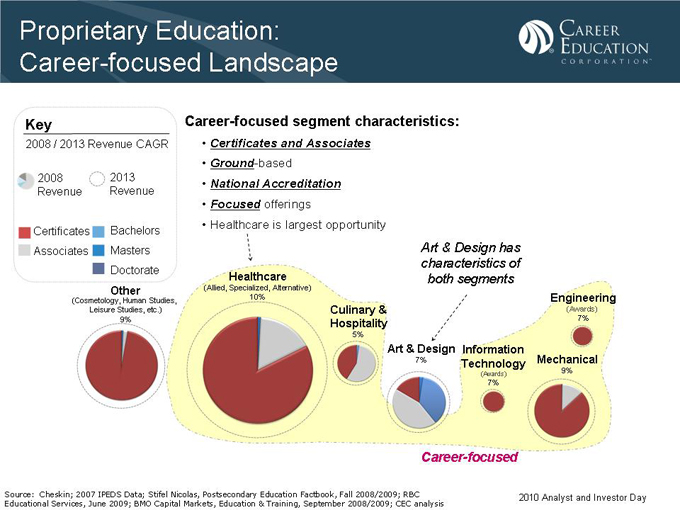
Proprietary Education: Career-focused Landscape
Key
2008 / 2013 Revenue CAGR
2008 Revenue
2013 Revenue
Certificates Associates
Bachelors Masters Doctorate
Career-focused segment characteristics:
• Certificates and Associates
• Ground-based
• National Accreditation
• Focused offerings
• Healthcare is largest opportunity
Other
(Cosmetology, Human Studies, Leisure Studies, etc.) 9%
Healthcare
(Allied, Specialized, Alternative) 10%
Culinary & Hospitality
5%
Art & Design
7%
Information Technology
(Awards) 7%
Mechanical
9%
Engineering
(Awards) 7%
Art & Design has characteristics of both segments
Career-focused
Source: Cheskin; 2007 IPEDS Data; Stifel Nicolas, Postsecondary Education Factbook, Fall 2008/2009; RBC Educational Services, June 2009; BMO Capital Markets, Education & Training, September 2008/2009; CEC analysis
2010 Analyst and Investor Day
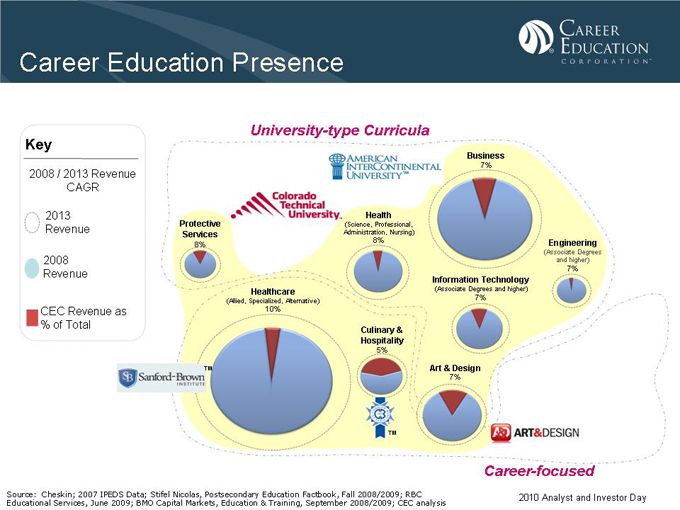
Career Education Presence
Key
2008 / 2013 Revenue CAGR
2013 Revenue
2008 Revenue
CEC Revenue as % of Total
University-type Curricula
Protective Services
8%
Healthcare
(Allied, Specialized, Alternative) 10%
Health
(Science, Professional, Administration, Nursing) 8%
Business
7%
Information Technology
(Associate Degrees and higher) 7%
Engineering
(Associate Degrees and higher) 7%
Culinary & Hospitality
5%
Art & Design
7%
Career-focused
Source: Cheskin; 2007 IPEDS Data; Stifel Nicolas, Postsecondary Education Factbook, Fall 2008/2009; RBC Educational Services, June 2009; BMO Capital Markets, Education & Training, September 2008/2009; CEC analysis
2010 Analyst and Investor Day
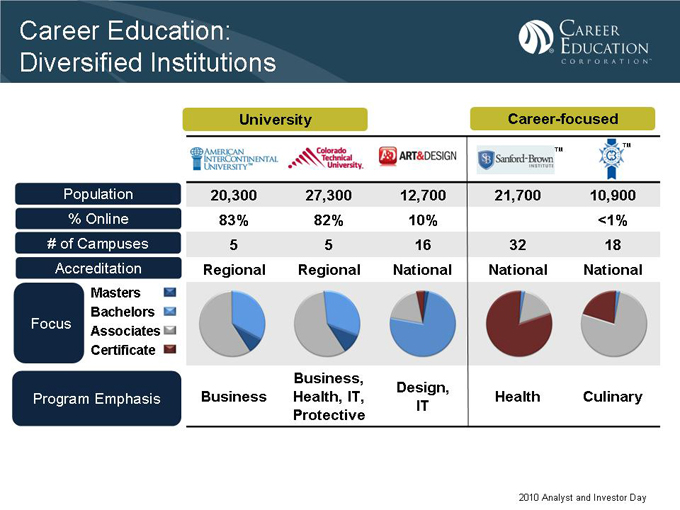
Career Education: Diversified Institutions
University
Career-focused
Population 20,300 27,300 12,700 21,700 10,900
% Online 83% 82% 10% <1%
# of Campuses 5 5 16 32 18
Accreditation Regional Regional National National National
Masters
Bachelors
Focus Associates
Certificate
Program Emphasis Business Business, Health, IT, Protective Design, IT Health Culinary
2010 Analyst and Investor Day
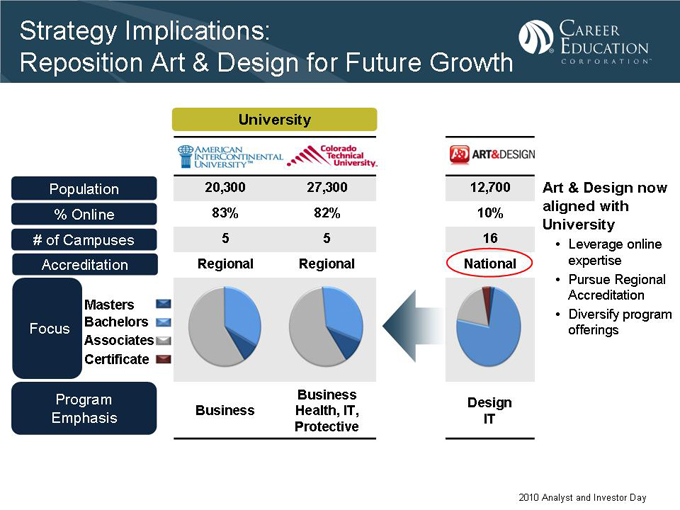
Strategy Implications:
Reposition Art & Design for Future Growth
University
Population 20,300 27,300 12,700
% Online 83% 82% 10%
# of Campuses 5 5 16
Accreditation Regional Regional National
Masters
Focus Bachelors
Associates
Certificate
Program Emphasis Business Business Health, IT, Protective Design IT
Art & Design now aligned with University
• Leverage online expertise
• Pursue Regional Accreditation
• Diversify program offerings
2010 Analyst and Investor Day
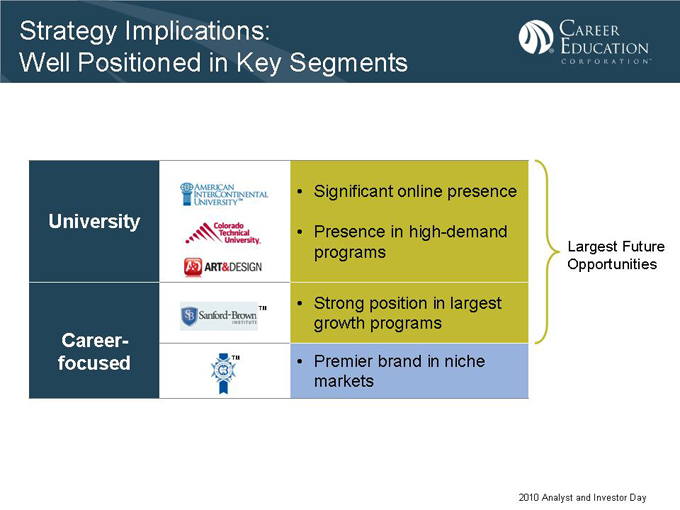
Strategy Implications: Well Positioned in Key Segments
University
Career-focused
• Significant online presence
• Presence in high-demand programs
• Strong position in largest growth programs
• Premier brand in niche markets
Largest Future Opportunities
2010 Analyst and Investor Day
Career Education: Path Forward
2007-2008 2009
Recognize > Redefine > Reach
Strengthen foundation
Accelerate growth
2010 Analyst and Investor Day

Enablers for Growth
• Quality
• Programs
• Technology
• Geographic Expansion
2010 Analyst and Investor Day
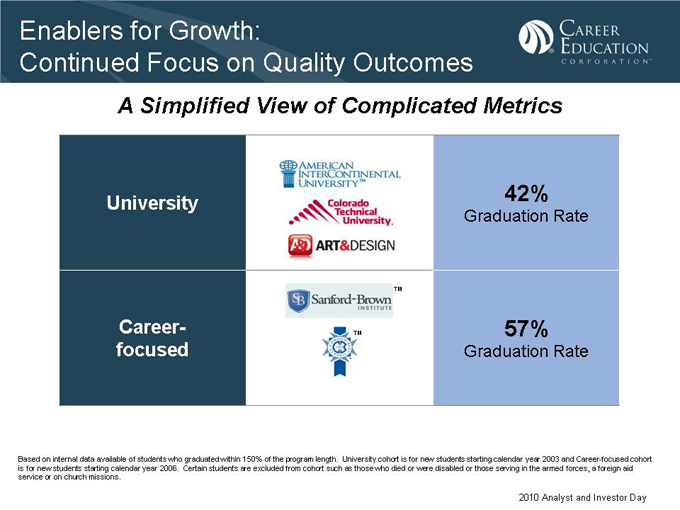
Enablers for Growth:
Continued Focus on Quality Outcomes
A Simplified View of Complicated Metrics
University
Career-focused
42%
Graduation Rate
57%
Graduation Rate
Based on internal data available of students who graduated within 150% of the program length. University cohort is for new students starting calendar year 2003 and Career-focused cohort is for new students starting calendar year 2006. Certain students are excluded from cohort such as those who died or were disabled or those serving in the armed forces, a foreign aid service or on church missions.
2010 Analyst and Investor Day
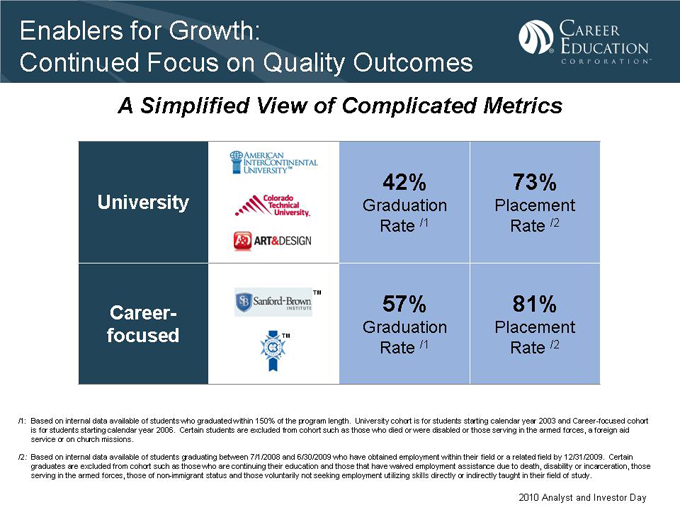
Enablers for Growth:
Continued Focus on Quality Outcomes
A Simplified View of Complicated Metrics
University
Career-focused
42%
Graduation Rate /1
73%
Placement Rate /2
57%
Graduation Rate /1
81%
Placement Rate /2
/1: Based on internal data available of students who graduated within 150% of the program length. University cohort is for students starting calendar year 2003 and Career-focused cohort is for students starting calendar year 2006. Certain students are excluded from cohort such as those who died or were disabled or those serving in the armed forces, a foreign aid service or on church missions.
/2: Based on internal data available of students graduating between 7/1/2008 and 6/30/2009 who have obtained employment within their field or a related field by 12/31/2009. Certain graduates are excluded from cohort such as those who are continuing their education and those that have waived employment assistance due to death, disability or incarceration, those serving in the armed forces, those of non-immigrant status and those voluntarily not seeking employment utilizing skills directly or indirectly taught in their field of study.
2010 Analyst and Investor Day
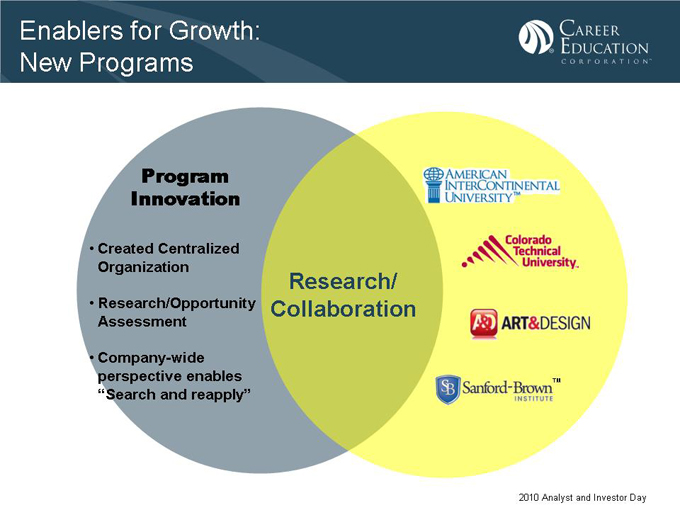
Enablers for Growth: New Programs
Program Innovation
• Created Centralized Organization
• Research/Opportunity Assessment
• Company-wide perspective enables “Search and reapply”
Research/Collaboration
2010 Analyst and Investor Day
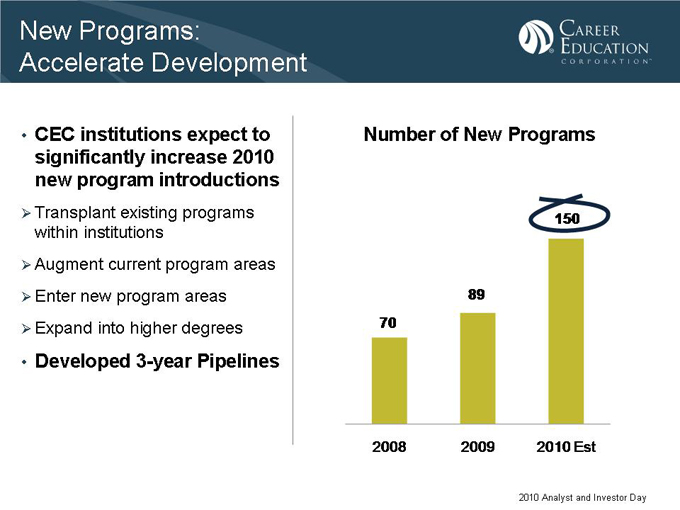
New Programs:
Accelerate Development
• CEC institutions expect to significantly increase 2010 new program introductions
Transplant existing programs within institutions
Augment current program areas
Enter new program areas
Expand into higher degrees
• Developed 3-year Pipelines
Number of New Programs
70
2008
89
2009
150
2010 Est
2010 Analyst and Investor Day
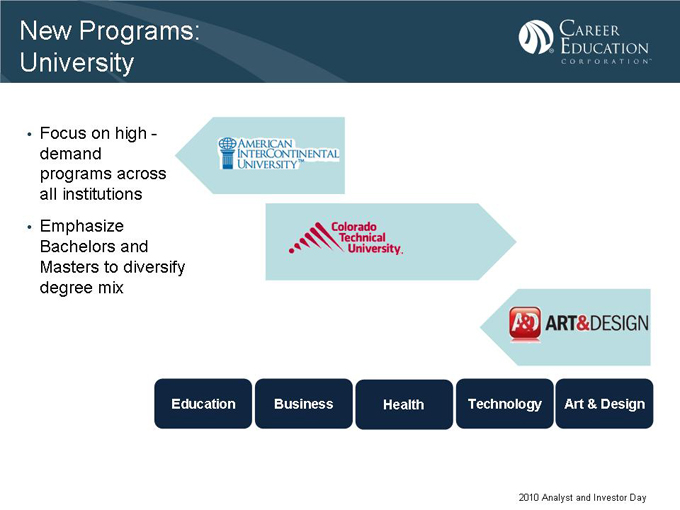
New Programs: University
• Focus on high-demand programs across all institutions
• Emphasize Bachelors and Masters to diversify degree mix
Education Business Health Technology Art & Design
2010 Analyst and Investor Day
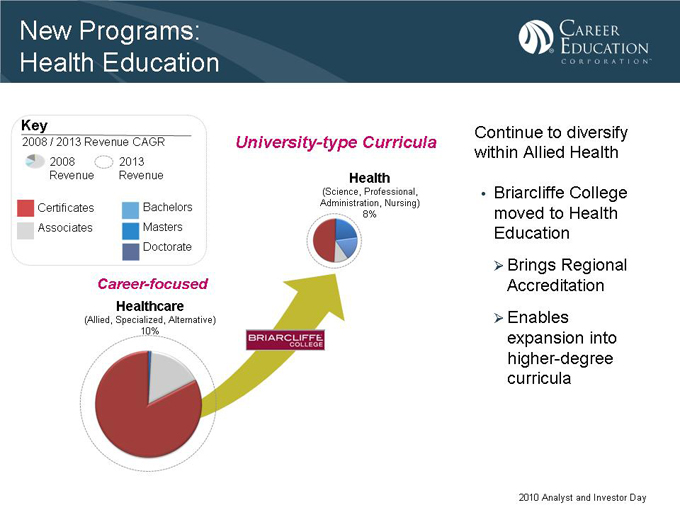
New Programs: Health Education
Key
2008 / 2013 Revenue CAGR
2008 Revenue
2013 Revenue
Certificates Associates
Bachelors Masters Doctorate
Career-focused
Healthcare
(Allied, Specialized, Alternative) 10%
University-type Curricula
Health
(Science, Professional, Administration, Nursing) 8%
Continue to diversify within Allied Health
• Briarcliffe College moved to Health Education
Brings Regional Accreditation
Enables expansion into higher-degree curricula
2010 Analyst and Investor Day
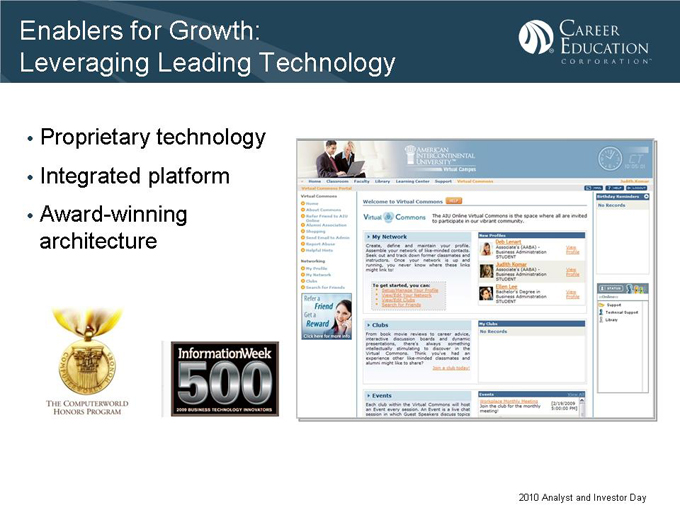
Enablers for Growth: Leveraging Leading Technology
• Proprietary technology
• Integrated platform
• Award-winning architecture
2010 Analyst and Investor Day
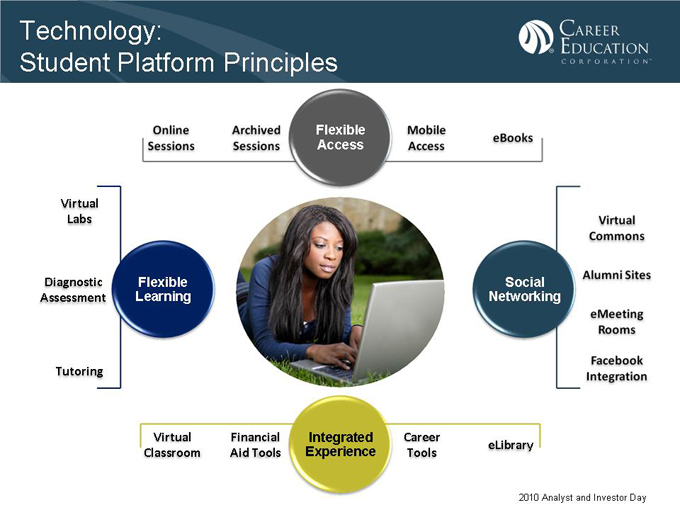
Technology: Student Platform Principles
Flexible Access
Online Sessions
Archived Sessions
Mobile Access
eBooks
Virtual Labs
Diagnostic Assessment
Tutoring
Flexible Learning
Social Networking
Virtual Commons
Alumni Sites
eMeeting Rooms
Facebook Integration
Virtual Classroom
Financial Aid Tools
Integrated Experience
Career Tools
eLibrary
2010 Analyst and Investor Day
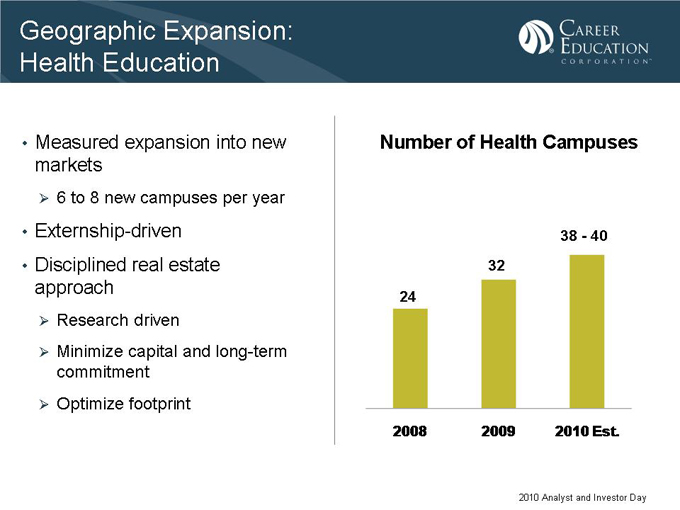
Geographic Expansion: Health Education
• Measured expansion into new markets
6 to 8 new campuses per year
• Externship-driven
• Disciplined real estate approach
Research driven
Minimize capital and long-term commitment
Optimize footprint
Number of Health Campuses
38—40 32
24
2008 2009 2010 Est.
2010 Analyst and Investor Day
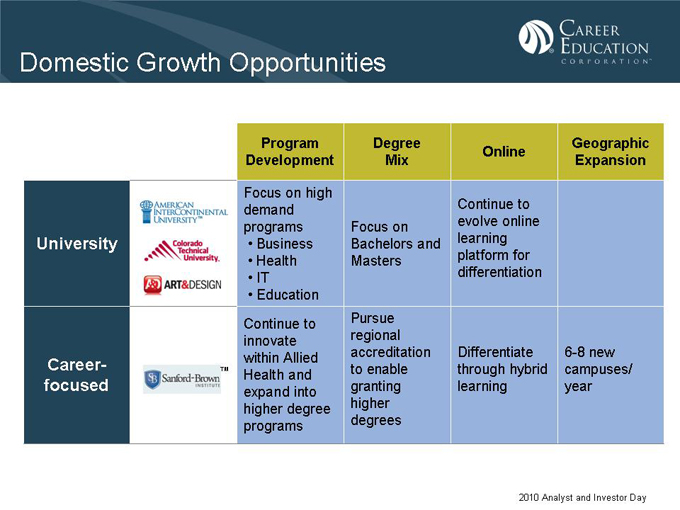
Domestic Growth Opportunities
Program Development Degree Mix Online Geographic Expansion
University
Career-focused
Focus on high demand programs
• Business
• Health
• IT
• Education
Continue to innovate within Allied Health and expand into higher degree programs
Focus on Bachelors and Masters
Pursue regional accreditation to enable granting higher degrees
Continue to evolve online learning platform for differentiation
Differentiate through hybrid learning
6-8 new campuses/year
2010 Analyst and Investor Day
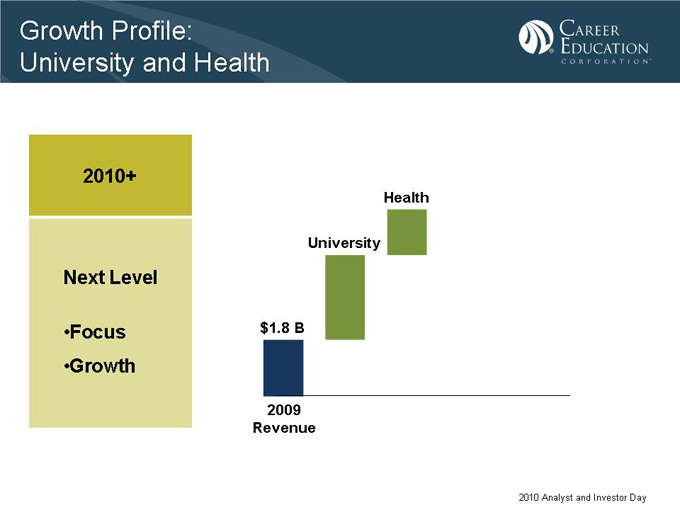
Growth Profile: University and Health
2010+
Next Level
•Focus •Growth
Health
University
$1.8 B
2009 Revenue
2010 Analyst and Investor Day

Targeted Growth Opportunity: Culinary Arts
Population 10,900
% Online <1%
# of Campuses 18
Accreditation National
Masters
Bachelors
Focus Associates
Certificate
Program Emphasis Culinary Arts
Student Population
+30%
2007 2008 2009
Continue to rebuild student population in existing markets
• Premier brand in Culinary
• New programs
• Online bachelor’s degree program
2010 Analyst and Investor Day
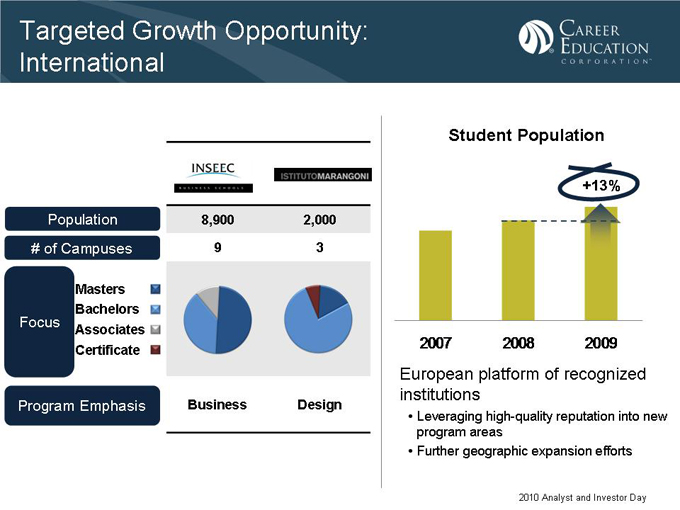
Targeted Growth Opportunity: International
Population 8,900 2,000
# of Campuses 9 3
Masters
Bachelors
Focus Associates
Certificate
Program Emphasis Business Design
Student Population
+13%
2007 2008 2009
European platform of recognized institutions
• Leveraging high-quality reputation into new program areas
• Further geographic expansion efforts
2010 Analyst and Investor Day
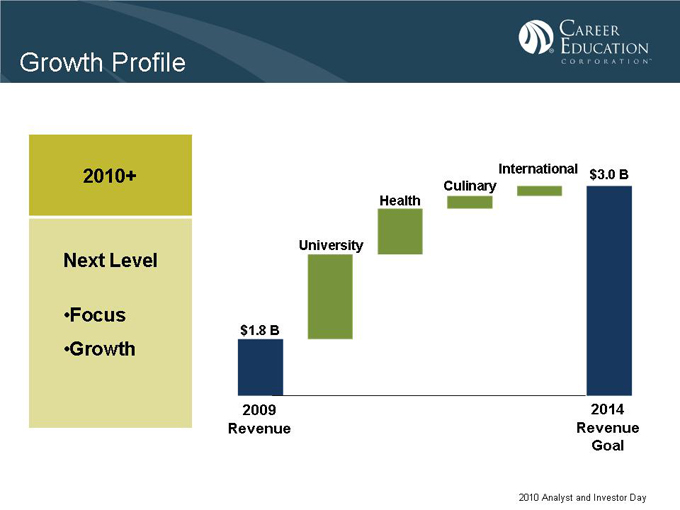
Growth Profile
2010+
Next Level
•Focus •Growth
International $3.0 B Culinary Health
University
$1.8 B
2009 Revenue
2014 Revenue Goal
2010 Analyst and Investor Day

Milestones
Annual Growth
2010+ 2010 2011—2014
Next Level
•Focus •Growth •Value
Student Population Growth 15%+ 8-10%
Revenue Growth 15%+ 8-10%
Operating Income Growth 40%+ 15-20%
2010 Analyst and Investor Day
Current Events – AIU Update on HLC
• AIU granted accreditation in May 2009
AIU was required to submit a report on curricula design and learning outcomes followed by a focused visit to assess the issue of credit equivalence
• In October 2009 AIU was notified that HLC would:
defer applications for new programs until focused visit completed conduct an advisory visit in January 2010
• Advisory visit is concluded and visiting team is expected to report to HLC in the first quarter
• AIU is preparing for the focused visit which has not been scheduled at this time
2010 Analyst and Investor Day
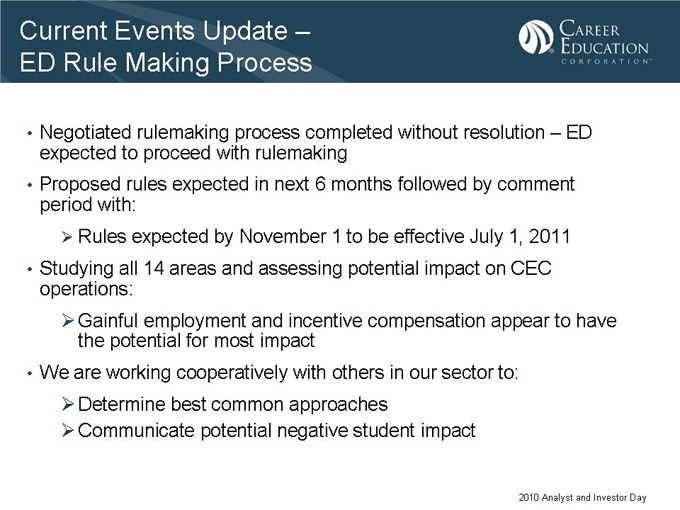
Current Events Update – ED Rule Making Process
• Negotiated rulemaking process completed without resolution – ED expected to proceed with rulemaking
• Proposed rules expected in next 6 months followed by comment period with:
Rules expected by November 1 to be effective July 1, 2011
• Studying all 14 areas and assessing potential impact on CEC operations:
Gainful employment and incentive compensation appear to have the potential for most impact
• We are working cooperatively with others in our sector to:
Determine best common approaches
Communicate potential negative student impact
2010 Analyst and Investor Day
Summary
• Transformed company and achieved 2010 milestones
• Strong momentum entering 2010
• Well positioned in key market segments
• Focused strategies to deliver next level of growth
2010 Analyst and Investor Day

Break
Manoj Kulkarni
Chief Information Officer
Copyright Career Education Corporation 2010 2010 Analyst and Investor Day
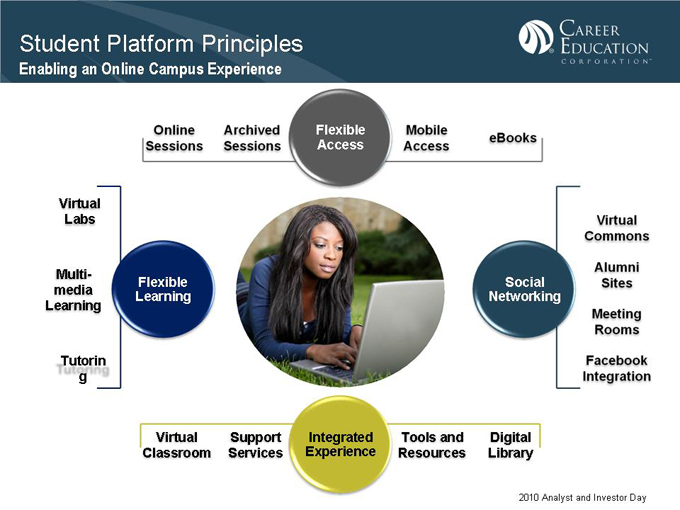
Student Platform Principles
Enabling an Online Campus Experience
Flexible Access
Online Sessions
Archived Sessions
Mobile Access
eBooks
Virtual Labs
Multi-media Learning
Tutoring
Flexible Learning
Social Networking
Virtual Commons
Alumni Sites
Meeting Rooms
Facebook Integration
Virtual Classroom
Support Services
Integrated Experience
Tools and Resources
Digital Library
2010 Analyst and Investor Day
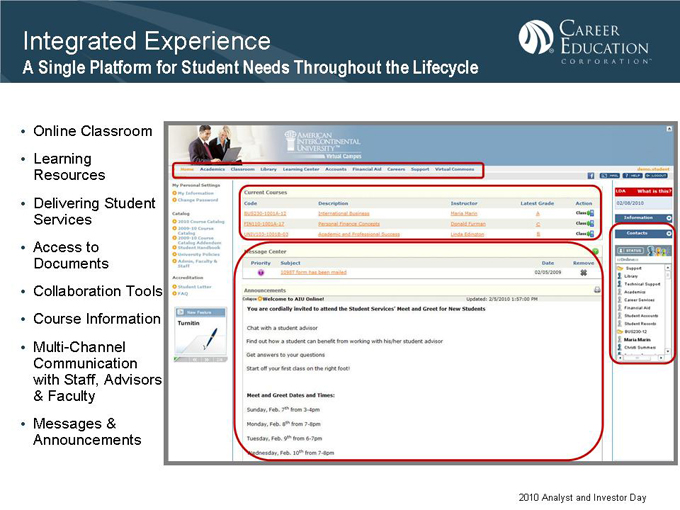
Integrated Experience
A Single Platform for Student Needs Throughout the Lifecycle
• Online Classroom
• Learning Resources
• Delivering Student Services
• Access to Documents
• Collaboration Tools
• Course Information
• Multi-Channel Communication with Staff, Advisors
& Faculty
• Messages & Announcements
2010 Analyst and Investor Day

Social Networking
Online…But Never Alone
Faculty
Student
Alumni
2010 Analyst and Investor Day
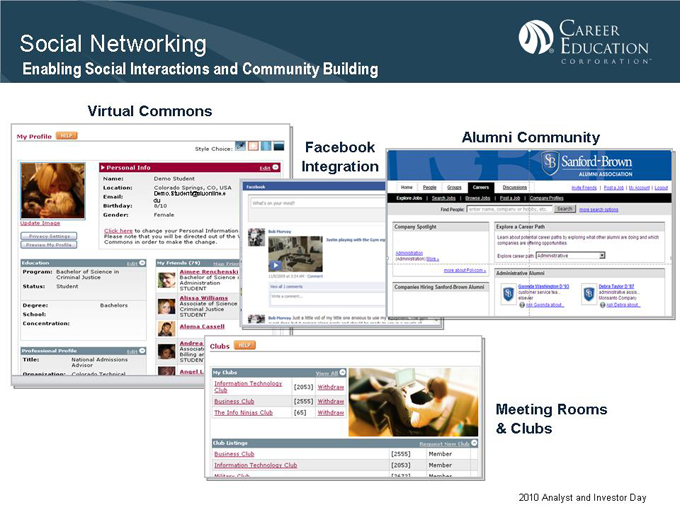
Social Networking
Enabling Social Interactions and Community Building
Virtual Commons
Facebook Integration
Alumni Community
Meeting Rooms & Clubs
2010 Analyst and Investor Day
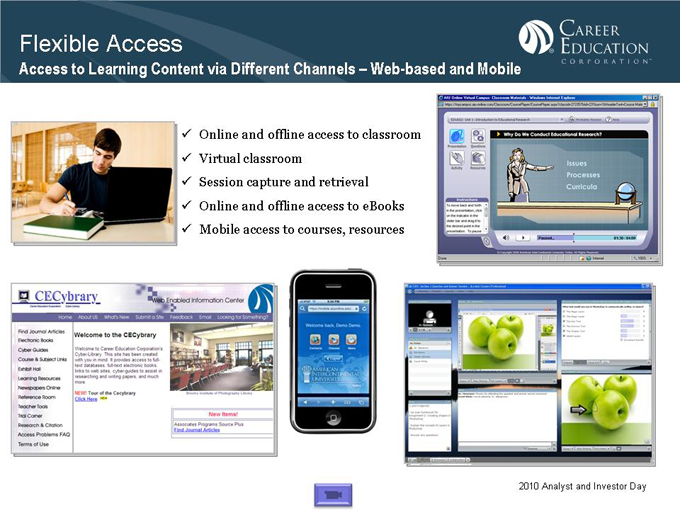
Flexible Access
Access to Learning Content via Different Channels – Web-based and Mobile
Online and offline access to classroom
Virtual classroom
Session capture and retrieval
Online and offline access to eBooks
Mobile access to courses, resources
2010 Analyst and Investor Day
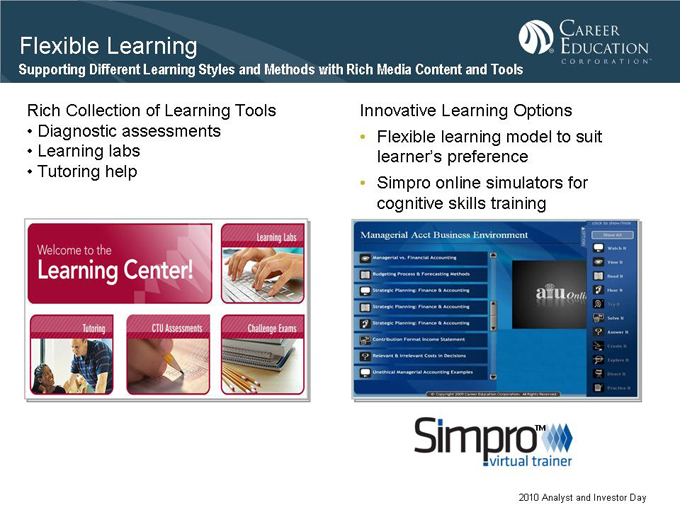
Flexible Learning
Supporting Different Learning Styles and Methods with Rich Media Content and Tools
Rich Collection of Learning Tools
• Diagnostic assessments
• Learning labs
• Tutoring help
Innovative Learning Options
• Flexible learning model to suit learner’s preference
• Simpro online simulators for cognitive skills training
2010 Analyst and Investor Day
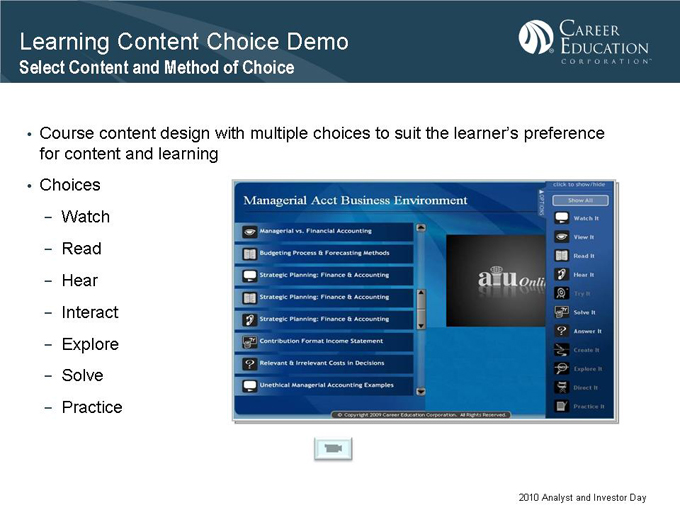
Learning Content Choice Demo
Select Content and Method of Choice
• Course content design with multiple choices to suit the learner’s preference for content and learning
• Choices
Watch
Read
Hear
Interact
Explore
Solve
Practice
2010 Analyst and Investor Day
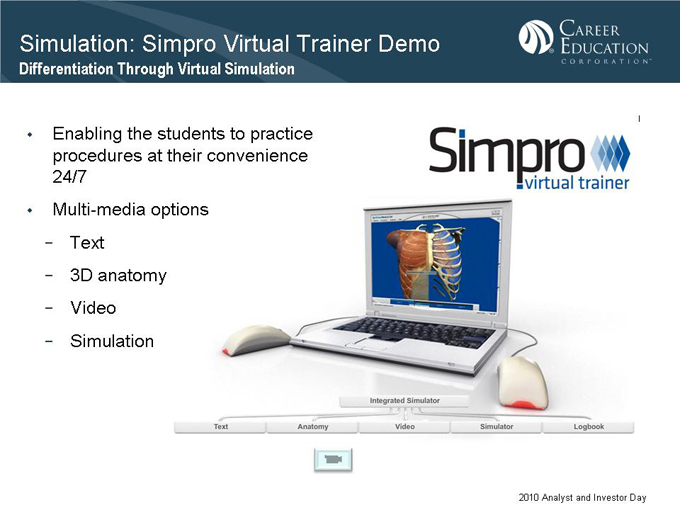
Simulation: Simpro Virtual Trainer Demo
Differentiation Through Virtual Simulation
• Enabling the students to practice procedures at their convenience 24/7
Multi-media options
Text
3D anatomy
Video
Simulation
2010 Analyst and Investor Day
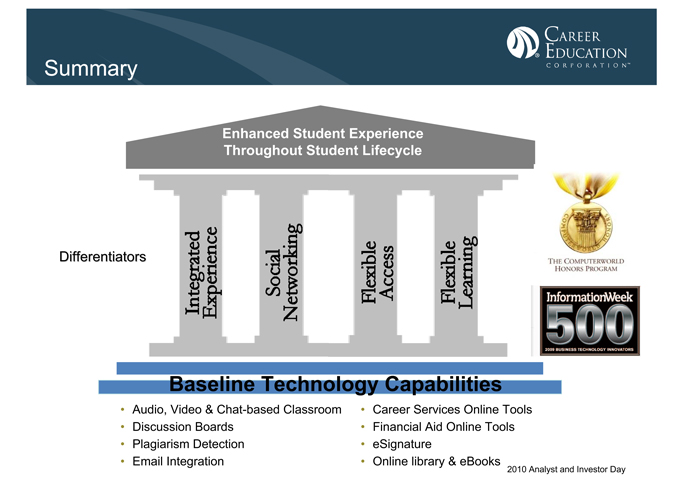
Summary
Enhanced Student Experience Throughout Student Lifecycle
Differentiators
Baseline Technology Capabilities
• Audio, Video & Chat-based Classroom
• Discussion Boards
• Plagiarism Detection
• Email Integration
• Career Services Online Tools
• Financial Aid Online Tools
• eSignature
• Online library & eBooks
2010 Analyst and Investor Day
Student Technology Platform—Conclusions
• Robust, flexible & integrated online learning platform
• Market-competitive standard features for all institutions
• Differentiated learning experiences to enable student success
• Focus on innovative use of online technology and tools
• Ability to leverage scale and manage growth cost-effectively
• Well-positioned to support online, hybrid and campus growth objectives
2010 Analyst and Investor Day
Mike Graham
Executive Vice President and Chief Financial Officer
Copyright Career Education Corporation 2010 2010 Analyst and Investor Day
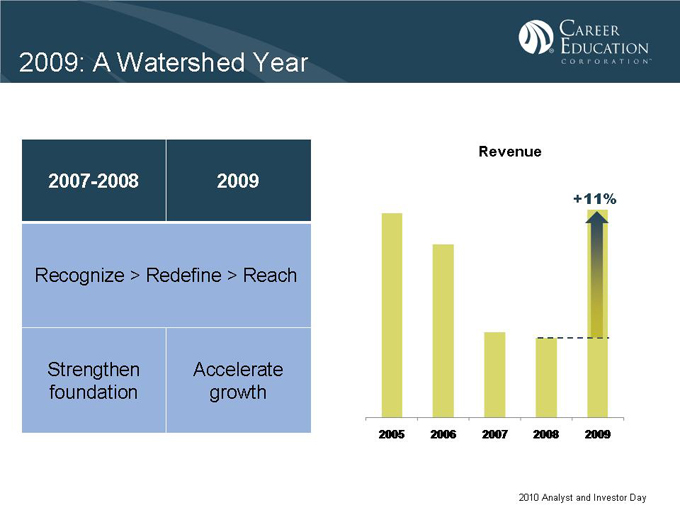
2009: A Watershed Year
2007-2008 2009
Recognize > Redefine > Reach
Strengthen foundation
Accelerate growth
Revenue
+11%
2005 2006 2007 2008 2009
2010 Analyst and Investor Day
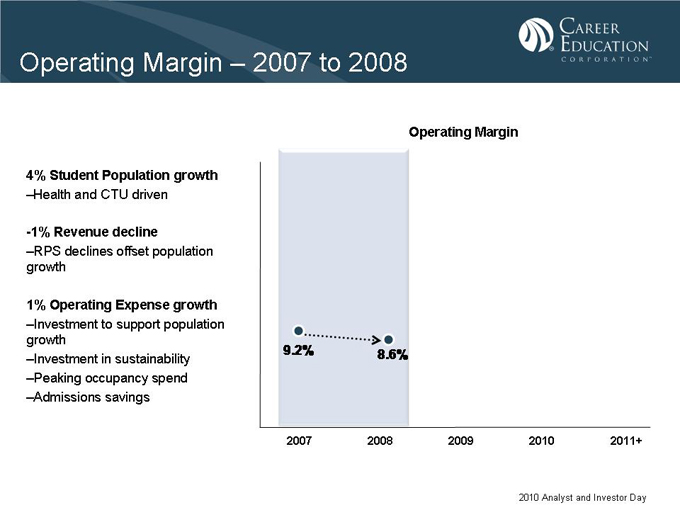
Operating Margin – 2007 to 2008
4% Student Population growth
–Health and CTU driven
-1% Revenue decline
–RPS declines offset population growth
1% Operating Expense growth
–Investment to support population growth
–Investment in sustainability
–Peaking occupancy spend
–Admissions savings
Operating Margin
9.2% 8.6%
2007 2008 2009 2010 2011+
2010 Analyst and Investor Day
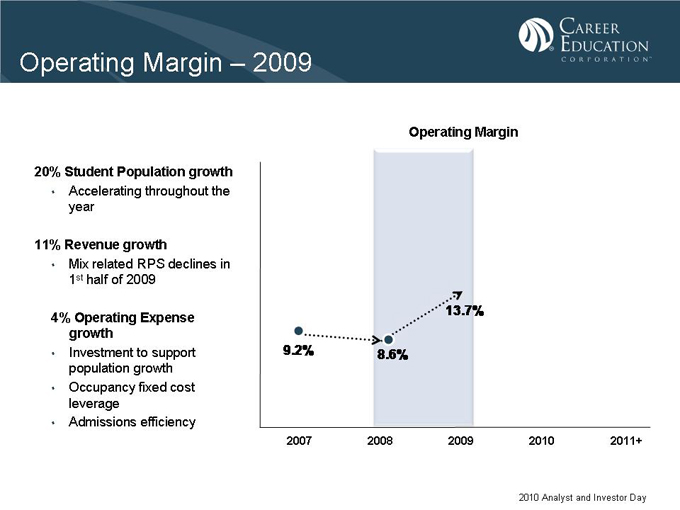
Operating Margin – 2009
20% Student Population growth
• Accelerating throughout the year
11% Revenue growth
• Mix related RPS declines in 1st half of 2009
4% Operating Expense growth
• Investment to support population growth
• Occupancy fixed cost leverage
• Admissions efficiency
Operating Margin
13.7%
9.2% 8.6%
2007 2008 2009 2010 2011+
2010 Analyst and Investor Day
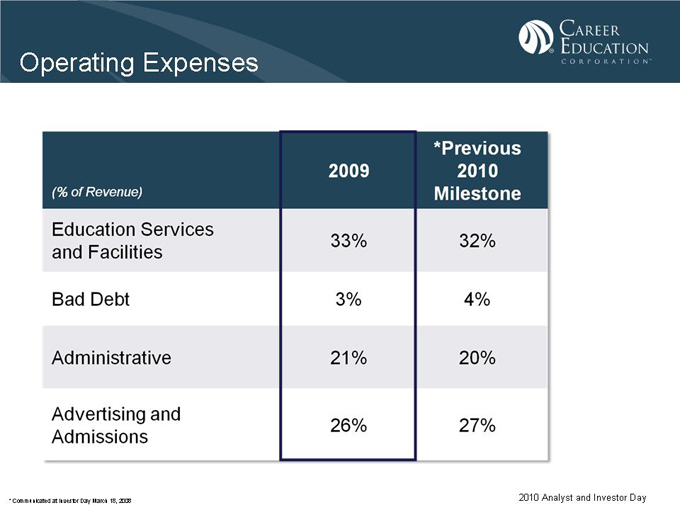
Operating Expenses
(% of Revenue) *Previous 2010 Milestone
2009
Education Services and Facilities 33% 32%
Bad Debt 3% 4%
Administrative 21% 20%
Advertising and Admissions 26% 27%
2010 Analyst and Investor Day
* | | Communicated at Investor Day March 18, 2008 |
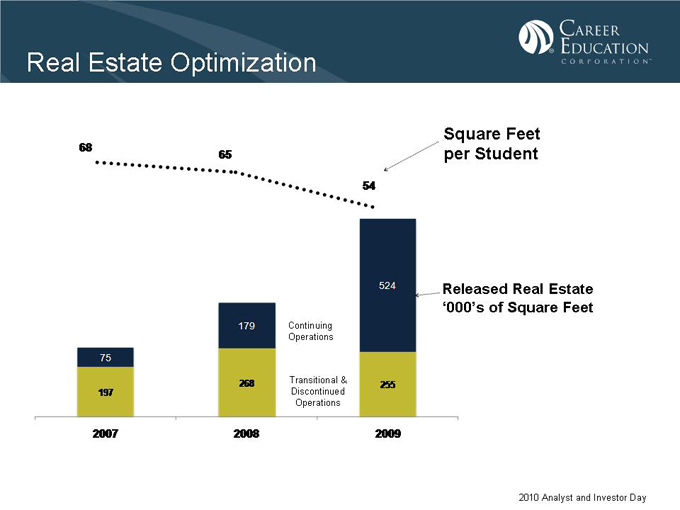
Real Estate Optimization
Square Feet per Student
68
65
54
75
197
2007
179
268
2008
Continuing Operations
Transitional & Discontinued Operations
524
255
2009
Released Real Estate ‘000’s of Square Feet
2010 Analyst and Investor Day

Student Payment Performance
Bad Debt Expense—% of Revenue
Cohort Default Rate*
3.1%
2.6% 2.6%
2007 2008 2009
20.9%
3-Year 19.6% 18.0%
10.6% 10.0% 2-Year 9.1% 8.4%
2005 2006 2007 2008
* | | Total Company, includes transitional schools and discontinued operations |
2010 Analyst and Investor Day
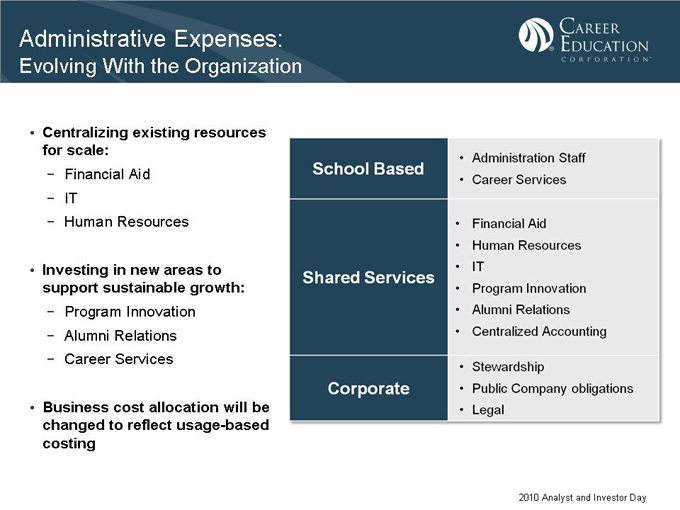
Administrative Expenses:
Evolving With the Organization
• Centralizing existing resources for scale:
Financial Aid
IT
Human Resources
• Investing in new areas to support sustainable growth:
Program Innovation
Alumni Relations
Career Services
• Business cost allocation will be changed to reflect usage-based costing
School Based
• Administration Staff
• Career Services
• Financial Aid
• Human Resources
Shared Services
• IT
• Program Innovation
• Alumni Relations
• Centralized Accounting
• Stewardship
Corporate
• Public Company obligations
• Legal
2010 Analyst and Investor Day
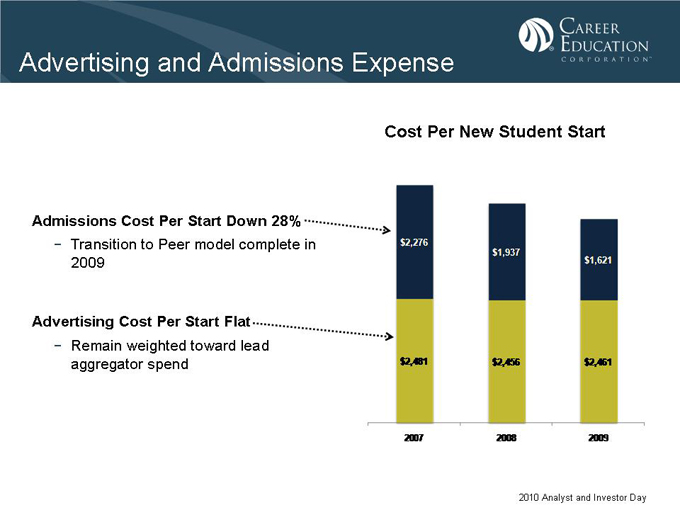
Advertising and Admissions Expense
Cost Per New Student Start
Admissions Cost Per Start Down 28%
Transition to Peer model complete in 2009
Advertising Cost Per Start Flat
Remain weighted toward lead aggregator spend
$2,276 $2,481 2007
$1,937 $2,456 2008
$1,621 $2,461 2009
2010 Analyst and Investor Day
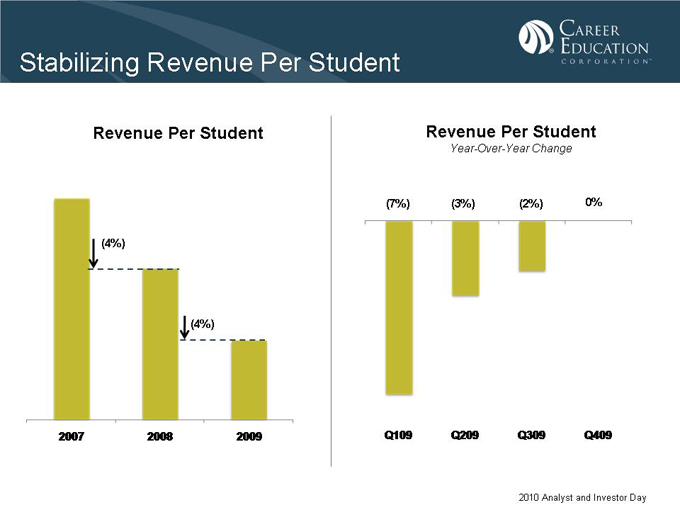
Stabilizing Revenue Per Student
Revenue Per Student
(4%)
(4%)
2007 2008 2009
Revenue Per Student
Year-Over-Year Change
(7%) (3%) (2%) 0%
Q109 Q209 Q309 Q409
2010 Analyst and Investor Day
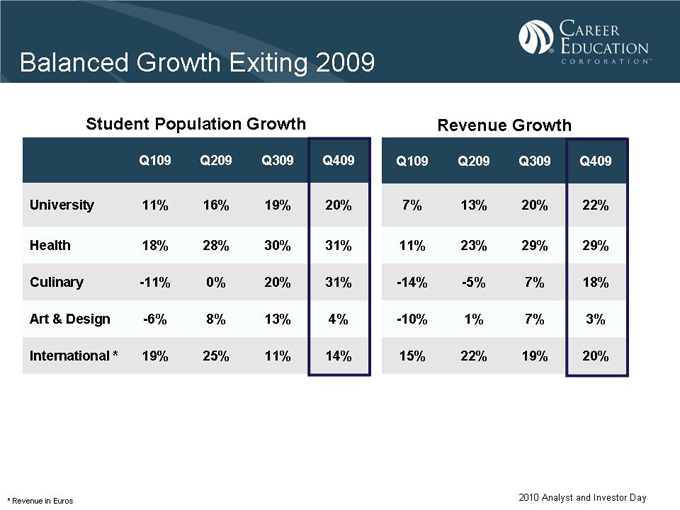
Balanced Growth Exiting 2009
Student Population Growth Revenue Growth
Q109 Q209 Q309 Q409 Q109 Q209 Q309 Q409
University 11% 16% 19% 20% 7% 13% 20% 22%
Health 18% 28% 30% 31% 11% 23% 29% 29%
Culinary -11% 0% 20% 31% -14% -5% 7% 18%
Art & Design -6% 8% 13% 4% -10% 1% 7% 3%
International * 19% 25% 11% 14% 15% 22% 19% 20%
* | | Revenue in Euros 2010 Analyst and Investor Day |
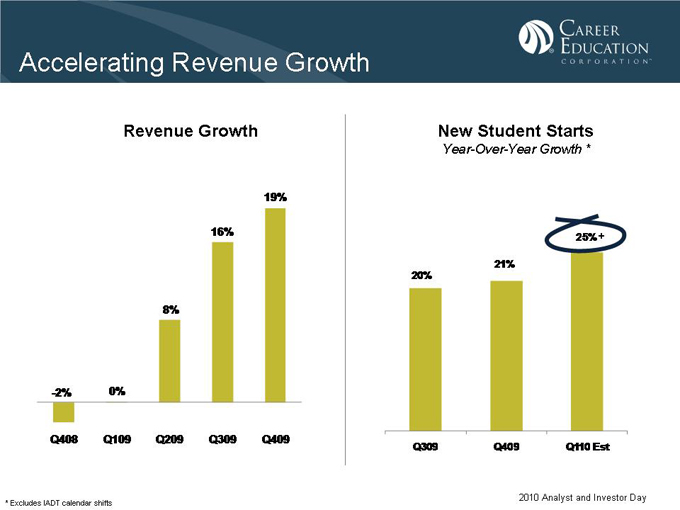
Accelerating Revenue Growth
Revenue Growth
-2%
Q408
0%
Q109
8%
Q209
16%
Q309
19%
Q409
New Student Starts
Year-Over-Year Growth *
20%
Q309
21%
Q409
25%+
Q110 Est
2010 Analyst and Investor Day
* | | Excludes IADT calendar shifts |
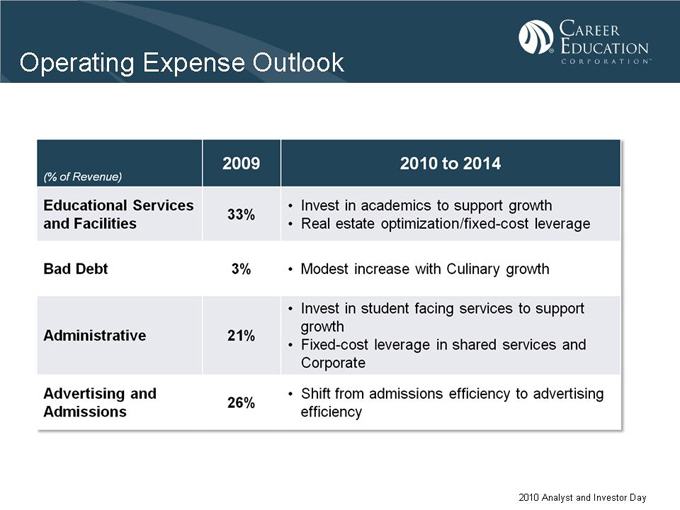
Operating Expense Outlook
(% of Revenue) 2009 2010 to 2014
Educational Services and Facilities 33% • Invest in academics to support growth • Real estate optimization/fixed-cost leverage
Bad Debt 3% • Modest increase with Culinary growth
Administrative 21% • Invest in student facing services to support growth • Fixed-cost leverage in shared services and Corporate
Advertising and Admissions 26% • Shift from admissions efficiency to advertising efficiency
2010 Analyst and Investor Day
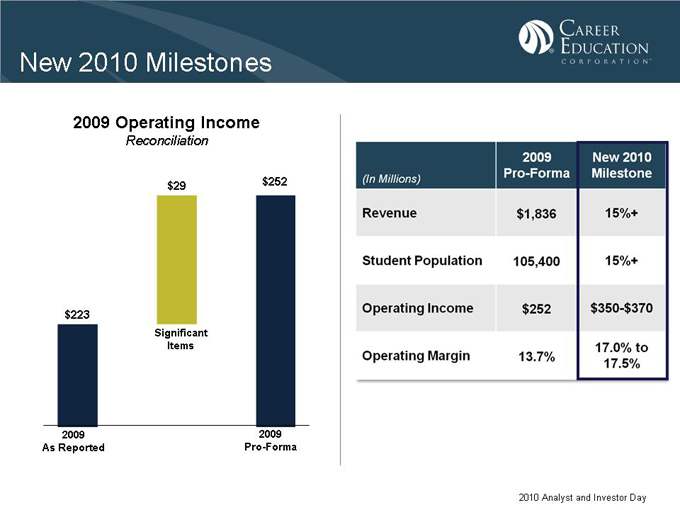
New 2010 Milestones
2009 Operating Income
Reconciliation
$223
2009 As Reported
$29
Significant Items
$252
2009 Pro-Forma
(In Millions) Pro-Forma 2009 New 2010 Milestone
Revenue $1,836 15%+
Student Population 105,400 15%+
Operating Income $252 $350-$370
Operating Margin 13.7% 17.0% to 17.5%
2010 Analyst and Investor Day
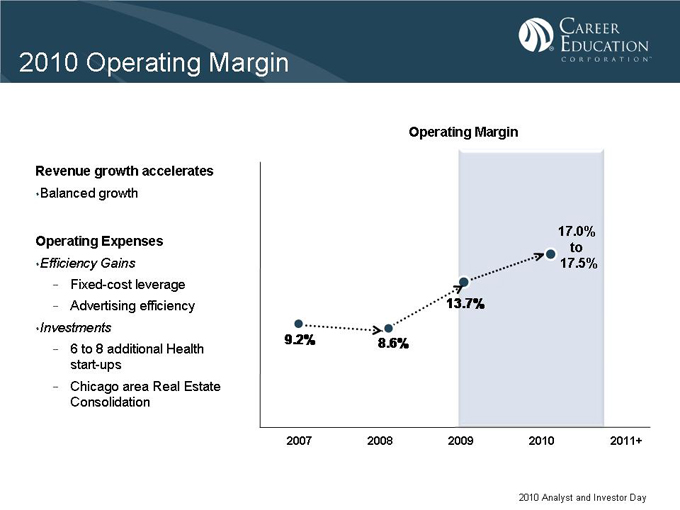
2010 Operating Margin
Revenue growth accelerates
•Balanced growth
Operating Expenses
•Efficiency Gains
Fixed-cost leverage
Advertising efficiency
•Investments
6 | | to 8 additional Health start-ups |
Chicago area Real Estate Consolidation
Operating Margin
13.7%
9.2% 8.6%
17.0% to 17.5%
2007 2008 2009 2010 2011+
2010 Analyst and Investor Day
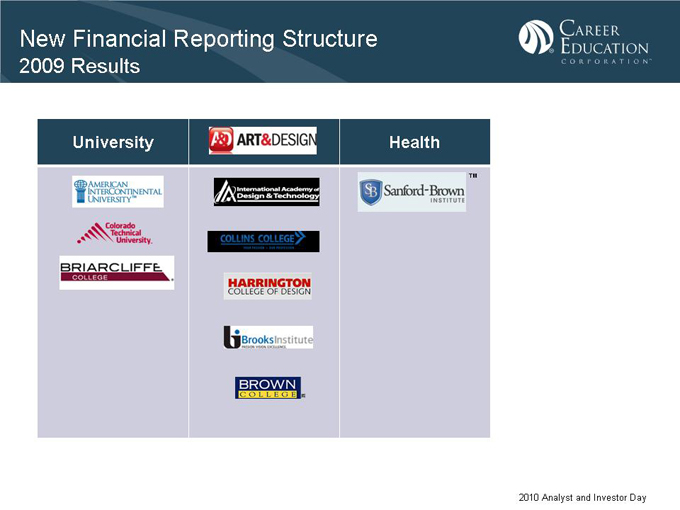
New Financial Reporting Structure
2009 Results
University Health
2010 Analyst and Investor Day

New Financial Reporting Structure
New Segments
University Health
2010 Analyst and Investor Day
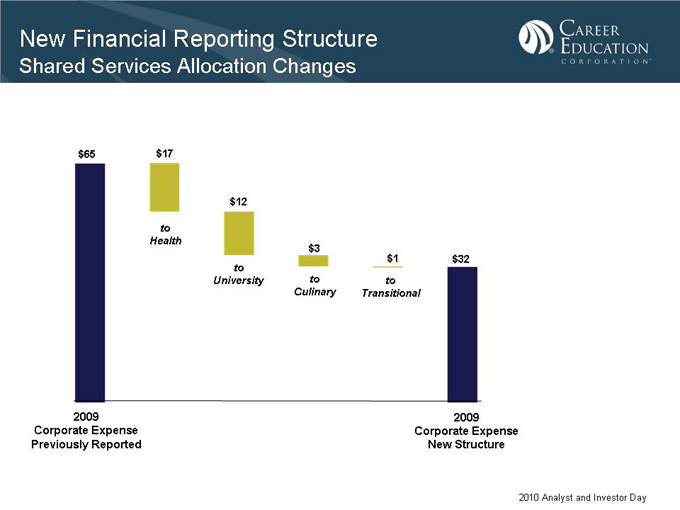
New Financial Reporting Structure
Shared Services Allocation Changes
$65
2009 Corporate Expense Previously Reported
$17
to Health
$12
to University
$3
to
Culinary
$1
to
Transitional
$32
2009 Corporate Expense New Structure
2010 Analyst and Investor Day
New Financial Reporting Structure
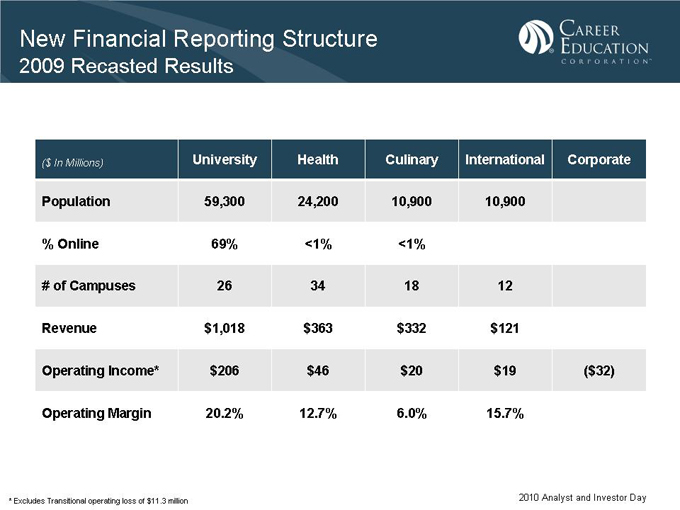
2009 Recasted Results
($ In Millions) University Health Culinary International Corporate
Population 59,300 24,200 10,900 10,900
% Online 69% <1% <1%
# of Campuses 26 34 18 12
Revenue $1,018 $363 $332 $121
Operating Income* $206 $46 $20 $19 ($32)
Operating Margin 20.2% 12.7% 6.0% 15.7%
* | | Excludes Transitional operating loss of $11.3 million 2010 Analyst and Investor Day |
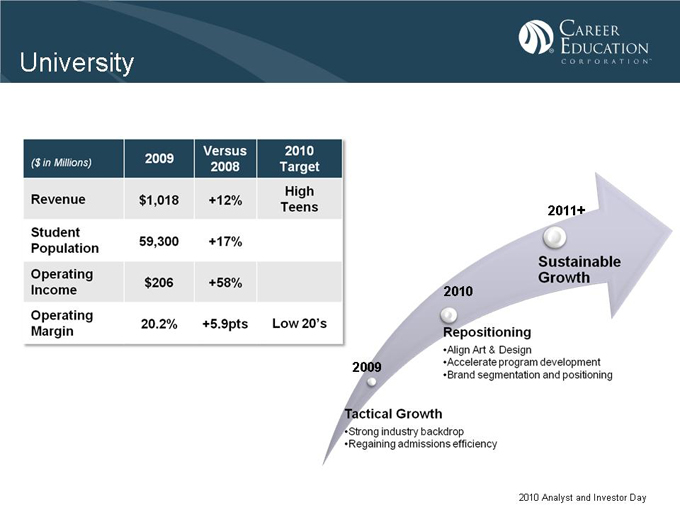
University
($ in Millions) 2009 Versus 2008 2010 Target
Revenue $1,018 +12% High Teens
Student Population 59,300 +17%
Operating Income $206 +58%
Operating Margin 20.2% +5.9pts Low 20’s
2011+
Sustainable Growth
2010
Repositioning
Align Art & Design
Accelerated program development
Brand segementation and positioning
2009
Tactical Growth
Strong industry backdrop
Regaining admissions efficiency
2010 Analyst and Investor Day
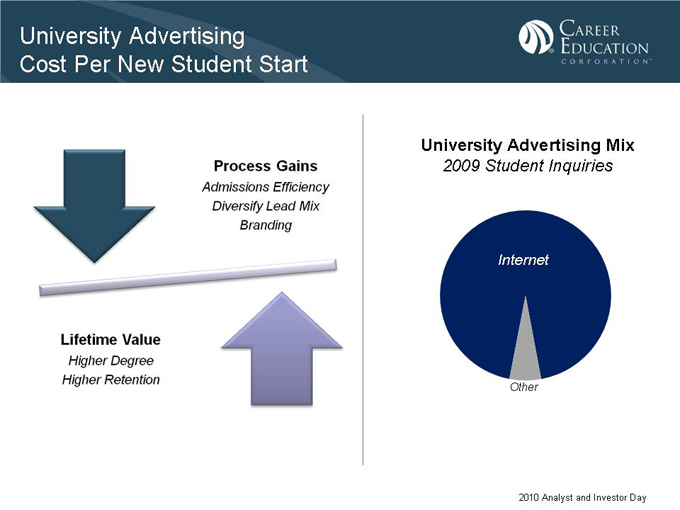
University Advertising Cost Per New Student Start
Process Gains
Admissions Efficiency
Diversify Lead Mix
Branding
Lifetime Value
Higher Degree
Higher Retention
University Advertising Mix
2009 Student Inquiries
Internet
Other
2010 Analyst and Investor Day
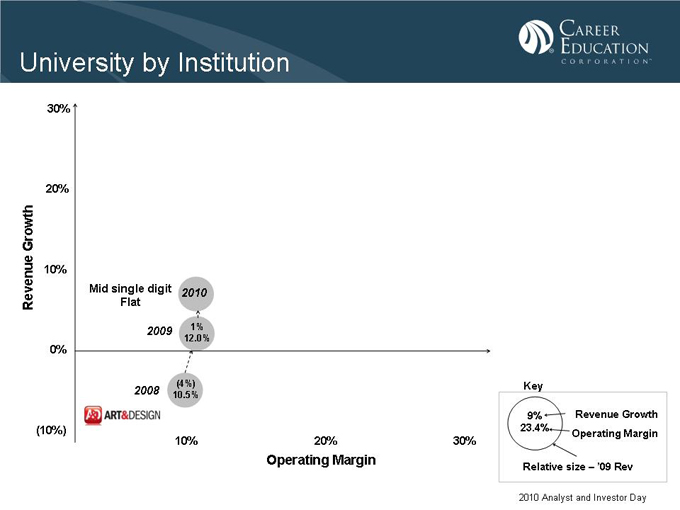
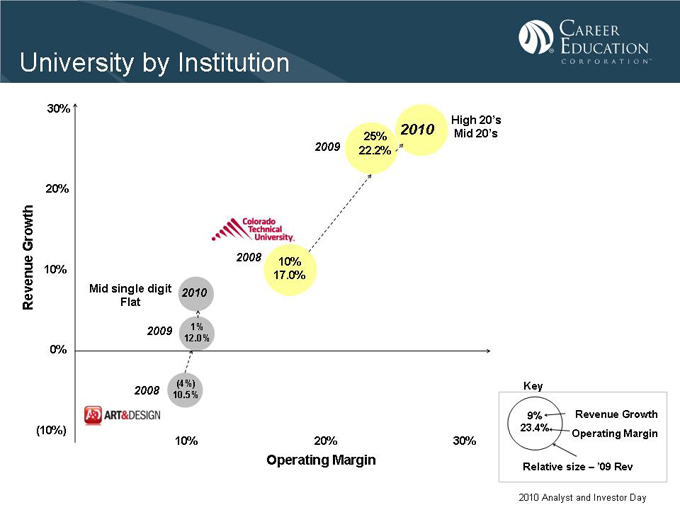
University by Institution
Revenue Growth
30% 20% 10% 0% (10%)
Mid single digit Flat 2010
2009 1% 12.0%
(4%)
2008 10.5%
10%
20% Operating Margin
30%
Key
9% Revenue Growth 23.4% Operating Margin
Relative size – ‘09 Rev
2010 Analyst and Investor Day
University by Institution
Revenue Growth
30% 20% 10% 0% (10%)
2009
25%
22.2%
2010
High 20’s
Mid 20’s
2008 10%
17.0%
Mid single digit Flat 2010
2009 1% 12.0%
(4%)
2008 10.5%
10%
20% Operating Margin
30%
Key
9% Revenue Growth 23.4% Operating Margin
Relative size – ‘09 Rev
2010 Analyst and Investor Day
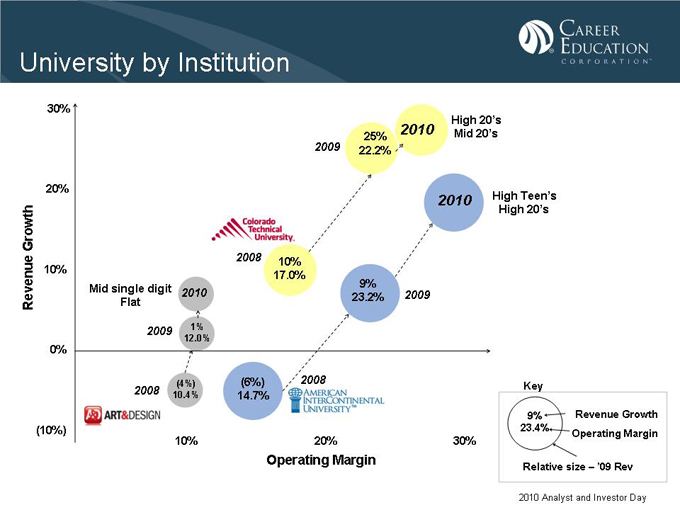
University by Institution
Revenue Growth
30% 20% 10% 0% (10%)
High 20’s Mid 20’s
2010
2009 25% 22.2%
2010 High Teen’s High 20’s
2008 10%
17.0%
9%
23.2% 2009
Mid single digit Flat 2010
2009 1% 12.0%
(4%)
2008 10.4%
(6%) 14.7%
2008
10%
20% Operating Margin
30%
Key
9% Revenue Growth 23.4% Operating Margin
Relative size – ‘09 Rev
2010 Analyst and Investor Day
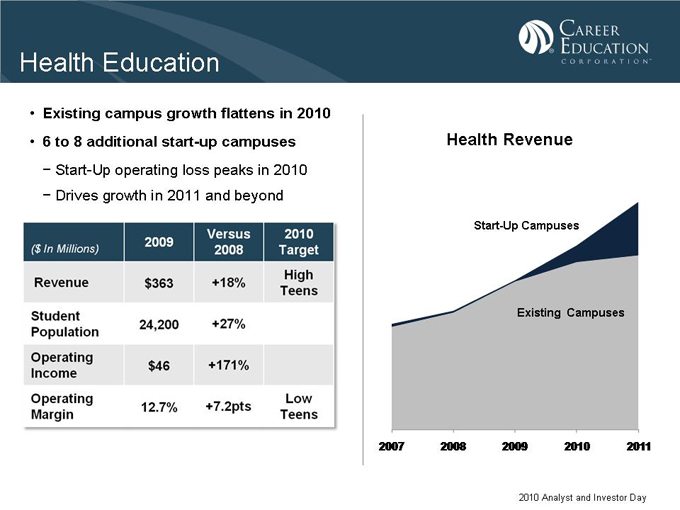
Health Education
• Existing campus growth flattens in 2010
• | | 6 to 8 additional start-up campuses |
Start-Up operating loss peaks in 2010
Drives growth in 2011 and beyond
($ In Millions) 2009 Versus 2008 2010 Target
Revenue $363 +18% High Teens
Student Population 24,200 +27%
Operating Income $46 +171%
Operating Margin 12.7% +7.2pts Low Teens
Health Revenue
Start-Up Campuses
Existing Campuses
2007 2008 2009 2010 2011
2010 Analyst and Investor Day
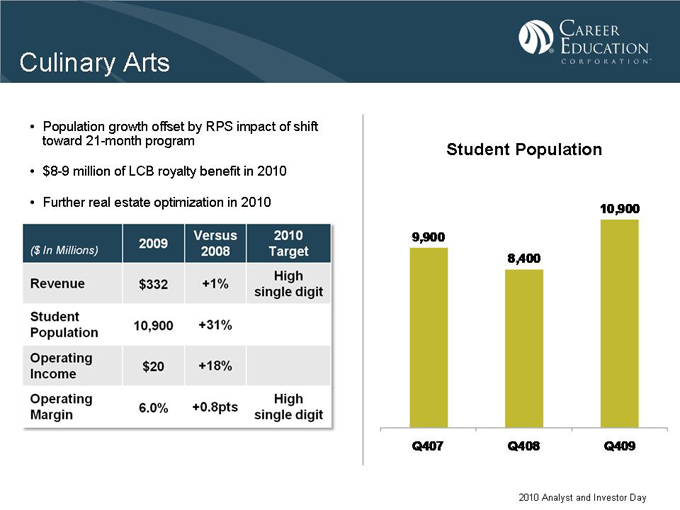
Culinary Arts
• Population growth offset by RPS impact of shift toward 21-month program
• $8-9 million of LCB royalty benefit in 2010
• Further real estate optimization in 2010
($ In Millions) 2009 Versus 2008 2010 Target
Revenue $332 +1% High single digit
Student Population 10,900 +31%
Operating Income $20 +18%
Operating Margin 6.0% +0.8pts High single digit
Student Population
10,900
9,900
8,400
Q407 Q408 Q409
2010 Analyst and Investor Day
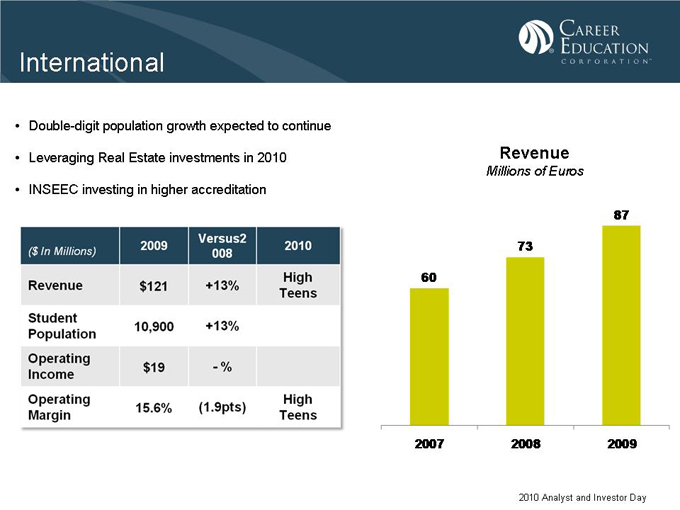
International
• Double-digit population growth expected to continue
• Leveraging Real Estate investments in 2010
• INSEEC investing in higher accreditation
($ In Millions) 2009 Versus2008 2010
Revenue $121 +13% High Teens
Student Population 10,900 +13%
Operating Income $19 -%
Operating Margin 15.6% (1.9pts) High Teens
Revenue
Millions of Euros
87 73 60
2007 2008 2009
2010 Analyst and Investor Day
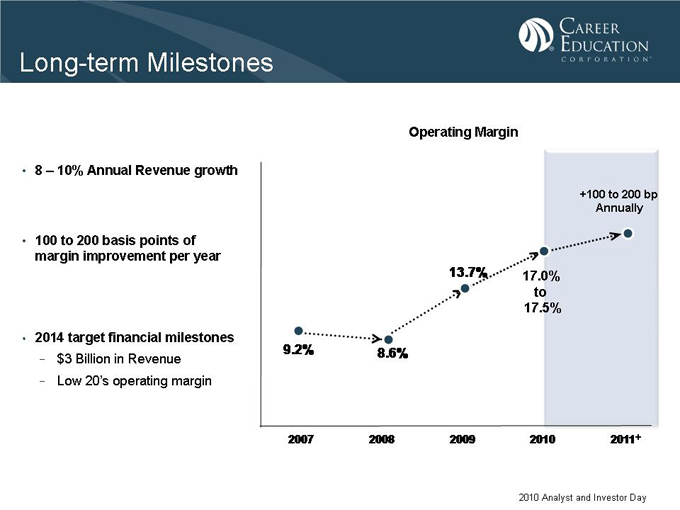
Long-term Milestones
• | | 8 – 10% Annual Revenue growth |
• 100 to 200 basis points of margin improvement per year
• 2014 target financial milestones
$3 Billion in Revenue
Low 20’s operating margin
Operating Margin
+100 to 200 bp Annually
13.7% 17.0% to 17.5%
9.2% 8.6%
2007 2008 2009 2010 2011+
2010 Analyst and Investor Day

Long-term Milestones
Annual Revenue Growth
International
8-10%
Low 20’s%
2014 Target Operating Margin
2010 Analyst and Investor Day
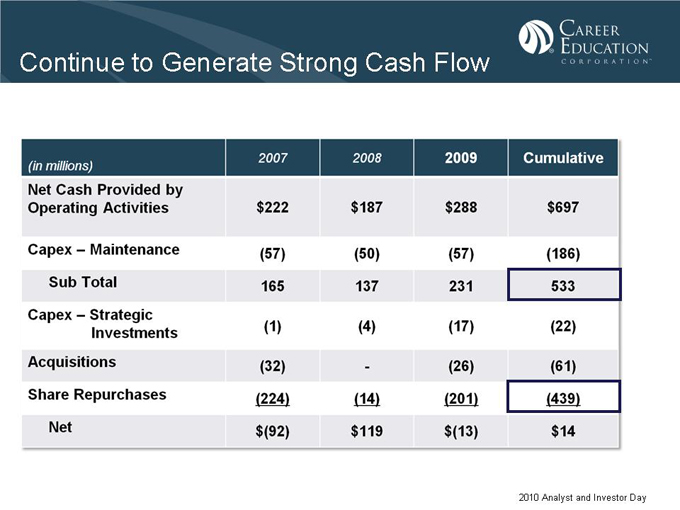
Continue to Generate Strong Cash Flow
(in millions) 2007 2008 2009 Cumulative
Net Cash Provided by Operating Activities $222 $187 $288 $697
Capex—Maintenance (57) (50) (57) (186)
Sub Total 165 137 231 533
Capex—Strategic Investments (1) (4) (17) (22)
Acquisitions (32) — (26) (61)
Share Repurchases (224) (14) (201) (439)
Net $(92) $119 $(13) $14
2010 Analyst and Investor Day
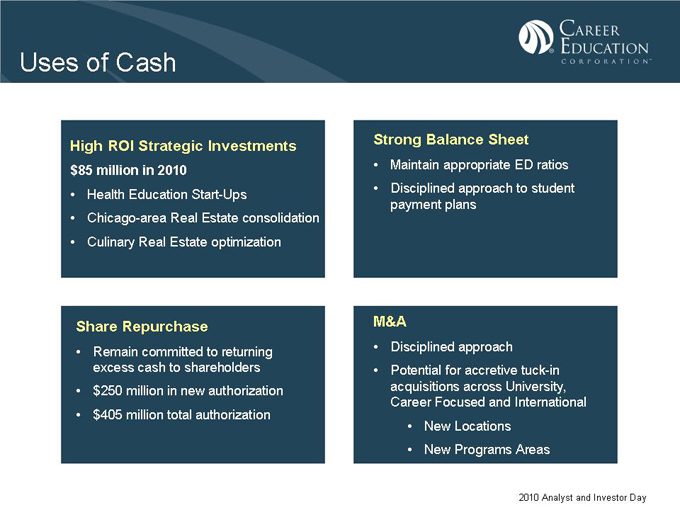
Uses of Cash
High ROI Strategic Investments
$85 million in 2010
• Health Education Start-Ups
• Chicago-area Real Estate consolidation
• Culinary Real Estate optimization
Share Repurchase
• Remain committed to returning excess cash to shareholders • $250 million in new authorization • $405 million total authorization
Strong Balance Sheet
• Maintain appropriate ED ratios
• Disciplined approach to student payment plans
M&A
• Disciplined approach
• Potential for accretive tuck-in acquisitions across University, Career Focused and International
• New Locations
• New Programs Areas
2010 Analyst and Investor Day
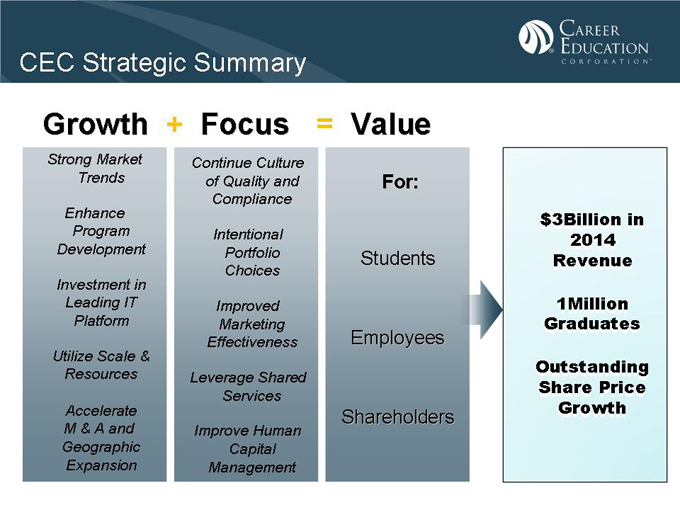
CEC Strategic Summary
Growth + Focus = Value
Strong Market Trends
Enhance Program Development
Investment in Leading IT Platform
Utilize Scale & Resources
Accelerate M & A and Geographic Expansion
Continue Culture of Quality and Compliance
Intentional Portfolio Choices
Improved Marketing Effectiveness
Leverage Shared Services
Improve Human Capital Management
For:
Students Employees Shareholders
$3Billion in 2014 Revenue
1Million Graduates
Outstanding Share Price Growth

Questions and Answers

CEC Strategic Summary
Growth + Focus = Value
Strong Market Trends
Enhance Program Development
Investment in Leading IT Platform
Utilize Scale & Resources
Accelerate M & A and Geographic Expansion
Continue Culture of Quality and Compliance
Intentional Portfolio Choices
Improved Marketing Effectiveness
Leverage Shared Services
Improve Human Capital Management
For:
Students Employees Shareholders
$3Billion in 2014 Revenue
1Million Graduates
Outstanding Share Price Growth
Statement of Purpose
To change lives through education.
2010 Analyst and Investor Day

Thank You!
Copyright Career Education Corporation 2010