![]() Confidential – For Internal Use Only Career Education Investor Presentation November 2014 Exhibit 99.1 |
![]() Confidential – For Internal Use Only Cautionary Statements & Disclosures 1 This presentation contains “forward-looking statements,” as defined in Section 21E of the Securities Exchange Act of 1934, as amended, that reflect our current expectations regarding our future growth, results of operations, cash flows, performance and business prospects and opportunities, as well as assumptions made by, and information currently available to, our management. We have tried to identify forward-looking statements by using words such as “will,” “believe,” “moving closer to,” “opportunities,” “expect,” “estimate,” “beginning to” and similar expressions, but these words are not the exclusive means of identifying forward-looking statements. These statements are based on information currently available to us and are subject to various risks, uncertainties, and other factors, including, but not limited to, those discussed in Item 1A,“Risk Factors” of our Annual Report on Form 10-K for the year ended December 31, 2013 that could cause our actual growth, results of operations, financial condition, cash flows, performance and business prospects and opportunities to differ materially from those expressed in, or implied by, these statements. Except as expressly required by the federal securities laws, we undertake no obligation to update such factors or to publicly announce the results of any of the forward-looking statements contained herein to reflect future events, developments, or changed circumstances or for any other reason. Certain financial information is presented on a non-GAAP basis. The Company believes it is useful to present non-GAAP financial measures which exclude certain significant items as a means to understand the performance of its core business. As a general matter, the Company uses non-GAAP financial measures in conjunction with results presented in accordance with GAAP to help analyze the performance of its core business, assist with preparing the annual operating plan, and measure performance for some forms of compensation. In addition, the Company believes that non-GAAP financial information is used by analysts and others in the investment community to analyze the Company's historical results and to provide estimates of future performance and that failure to report non-GAAP measures could result in a misplaced perception that the Company's results have underperformed or exceeded expectations. The most directly comparable GAAP information and a reconciliation between the non-GAAP and GAAP figures are provided at the end of this presentation, and this presentation (including the reconciliation) has been posted to our website. |
![]() Confidential – For Internal Use Only Key Investment Highlights 2 • Diverse business model with both online and campus based portfolio of assets. • Turnaround strategy in place with execution progressing. • Favorable industry dynamics in terms of market size and employer demand for skilled workers. • Strong balance sheet and cash position with clear path to profitability. • Dedicated management team with extensive industry experience. |
![]() Confidential – For Internal Use Only U.S. Macro Education Market Drivers 3 (1) Source: Bureau of Labor Statistics • U.S. population has low level of educational attainment. • Approximately 3 million jobs are unfilled due to a worker skills gap (1) . • Proprietary segment serves an under served demographic with a higher concentration of minority students and older students than attend traditional schools. • Due to student dependency on tuition assistance (Title IV funds), the proprietary segment is highly regulated by the Department of Education, Accreditors and States. “The Skill Gap” |
![]() Confidential – For Internal Use Only Earnings Power of Postsecondary Education 4 • Meaningful correlation between post secondary education and lifetime earnings. • For-profit college students that earned a Bachelor’s degree earn an average salary greater than those students that earned their degrees from public and private colleges (2) . (2 ) National Center for Education Statistics issued a report in July 2014 which included data from students who earned a Bachelor’s Degree in 2007-2008. The data from the report was derived from surveys conducted approximately four year’s post graduation. (1) Georgetown University Center on Education and the Workforce (June 2010). |
![]() Confidential – For Internal Use Only Business Overview 5 Dynamic educational services company committed to quality, career-focused learning to a diverse student population through online, on-ground and hybrid learning program offerings. • Approximately 30,250 students, or 63% of total enrollments, are online students. • Focus on improving the educational experiences and outcomes of students and helping bridge the gap between learners seeking new skills and employers looking for talent to help them succeed. • Turnaround process underway, led by seasoned executive management team with extensive industry experience. |
![]() Confidential – For Internal Use Only Segment Geographic and Strategy Overview 6 |
![]() Confidential – For Internal Use Only A Summary of Career Education’s History 7 • Company founded in 1994 and went public in 1998. • Business built through a series of acquisitions. • Company and industry have experienced two market downturns – the most recent one being more severe. |
![]() Confidential – For Internal Use Only Key Investor Objectives to Turnaround Strategy 8 • Strengthen Academic Outcomes, Enhance Regulatory Compliance and Simplify Business Model. • Generate Modest University Total Student Enrollment Growth. • Neutralize Negative Impact of Career Schools as Soon as Practical. • Reduce Organizational Cost Structure. • Successfully Complete the Teach Out of Transitional Schools. We also regularly evaluate the Company’s assets to determine where best to deploy our capital and structure our organization to provide the greatest opportunity for long-term, sustainable shareholder growth. |
![]() Confidential – For Internal Use Only Improving Academic Outcomes, Enhanced Regulatory Compliance and Simplification 9 • IntelliPath is a competitive differentiator. • For the 2014 cohort, 100% of our 32 nationally-accredited ACICS schools (that are not in teach out) achieved a campus placement rate that met or exceeded ACICS’ compliance benchmark. • HLC acted to continue their regional accreditation of AIU and CTU in 2014 and 2013, respectively. • Consolidation of brands and programs in career schools. |
![]() Confidential – For Internal Use Only Generate Modest University Total Student Enrollment Growth 10 Change in Total Student Enrollments vs. Prior Year Quarter Q3 2013 Q4 2013 Q1 2014 Q2 2014 Q3 2014 |
![]() Confidential – For Internal Use Only Neutralize Negative Impact of Career Schools as Soon as Practical 11 Total Student Enrollments – Career Schools (1) Culinary Arts had a shift in start dates as compared to the prior year, therefore Q3 2014 had an additional start which was reflected in Q4 2013 in the prior year. |
![]() Confidential – For Internal Use Only Operating Expenses ($ millions) Reduce Organizational Cost Structure – Progress Underway 12 $1,542 $1,272 $899 $814 Reduced by $212 million Reduced by $80 million FY 2012 & FY 2013 data as reported in the Company’s 2013 10-K and based on schools that were in continuing operations at 12/31/13. YTD 3Q 2013 and YTD 3Q 2014 data as reported in the Company’s 3Q 2014 10-Q and based on schools that were in continuing operations at 9/30/14. |
![]() Confidential – For Internal Use Only 3Q 2014 % of Revenue YTD 3Q 2014 % of Revenue Total Revenue $227,452 $697,391 OPERATING EXPENSES Educational services and facilities $82,892 36.4% $243,690 34.9% General & Administrative Advertising $70,897 31.2% $198,780 28.5% Admissions $30,625 13.5% $94,258 13.5% Administrative $53,596 23.6% $195,546 28.0% Bad Debt $6,779 3.0% $19,023 2.7% Total G&A $161,897 71.2% $507,607 72.8% Reduce Organizational Cost Structure – Additional Opportunities 13 • Educational services & facilities - Additional opportunity to optimize real estate footprint. • Advertising – Generate efficiencies / lower lead generator volumes. • Administrative expenses - As a percentage of revenue, Career Education administrative expenses are approximately 30%. – While industry comparisons can fluctuate in terms of classification of expenses, the industry average is closer to 20%-22%. • Management has targeted at least $40 million in operating expense reductions in 2015. |
![]() Confidential – For Internal Use Only Successfully Complete Teach Out of Transitional Schools 14 • Transitional Schools operating losses in FY 2013 were approximately ($77) million which was primarily cash outflow. • This fiscal year (through September 2014), we closed 16 campuses, divested one campus and are scheduled to close an additional 4 campuses by the end of this year. • The 17 campuses that have been closed or divested as of September 2014 generated approximately ($43) million of operating losses in FY 2013. (1) Taught out 3 campuses and announced 3 additional campuses for teach-out during 3Q 2014 |
![]() Confidential – For Internal Use Only Financial Overview – Profitable University Segment 15 • CTU financially strong with trailing twelve month operating margin of 20.0%. • AIU moving closer to break-even performance. University Revenue & Operating Income - (in $000) Trailing 12-Months Revenue and Operating Income $545,188 $134,299 $138,469 Quarter Operating Income $55,381 $6,504 $3,685 Quarter Revenue |
![]() Confidential – For Internal Use Only Future Real Estate Lease Obligations are Declining (1) Lease obligations are inclusive of rent payments but exclude operating expenses. (2) Amounts provided are for the full year of 2014. (3) Amounts provided are for executed sublease agreements. 16 2014 (2) 2015 2016 2017 2018 2019 2020 & Thereafter Total Gross operating lease obligations (1) Ongoing operations 61,024 $ 60,148 $ 55,194 $ 46,199 $ 45,203 $ 35,389 $ 43,985 $ 347,142 $ Transitional & Discontinued operations 38,024 31,541 24,045 21,357 14,122 6,516 2,863 138,468 Total gross operating lease obligations 99,048 $ 91,689 $ 79,239 $ 67,556 $ 59,325 $ 41,905 $ 46,848 $ 485,610 $ Sublease income (3) Ongoing operations 2,245 $ 4,227 $ 2,936 $ 2,812 $ 2,466 $ 1,821 $ 1,068 $ 17,575 $ Transitional & Discontinued operations 1,145 4,737 4,510 4,190 145 - - 14,727 Total sublease income 3,390 $ 8,964 $ 7,446 $ 7,002 $ 2,611 $ 1,821 $ 1,068 $ 32,302 $ Net operating lease obligations Ongoing operations 58,779 $ 55,921 $ 52,258 $ 43,387 $ 42,737 $ 33,568 $ 42,917 $ 329,567 $ Transitional & Discontinued operations 36,879 26,804 19,535 17,167 13,977 6,516 2,863 123,741 Total net contractual lease obligations 95,658 $ 82,725 $ 71,793 $ 60,554 $ 56,714 $ 40,084 $ 45,780 $ 453,308 $ |
![]() Confidential – For Internal Use Only Financial Overview – Strong Cash Position 17 (In 000’s) (1) Balances presented above are quarter end balances and include both Continuing and Discontinued Operations. (2) The increase in 4Q 2013 is attributed to proceeds from the sale of the Company’s International segment. • Recently increased the borrowing capacity under the company’s existing revolving facility from $70 million to $120 million. |
![]() Confidential – For Internal Use Only Trailing Twelve Month (TTM) Adjusted EBITDA – Ongoing Operations (in $000) Quarterly Adjusted EBITDA – Ongoing Operations (in $000) TTM 2Q 2014 1Q 2014 2Q 2014 Financial Overview – Improving Adjusted EBITDA 18 • Ongoing Adjusted EBITDA exhibits seasonality fluctuations due to higher advertising investments in 1Q and 3Q. • Adjusted EBITDA from ongoing operations is expected to be positive for Q4 2014 and exiting 2015 on a TTM basis. 4Q 2013 (1) Numbers exclude significant items (including Transitional Schools) as disclosed in the Non-GAAP reconciliation at the end of these slides. TTM 3Q 2014 3Q 2014 3Q 2013 |
![]() Confidential – For Internal Use Only Adjusted EBITDA – Transitional & Discontinued Operations Trailing Twelve Months Adjusted EBITDA ($ in millions) (1) Numbers exclude significant items (including International segment) as disclosed in the Non-GAAP reconciliation at the end of these slides. 19 Projected • Negative Adjusted EBITDA from Transitional and Discontinued Operations continues to decline. |
![]() Confidential – For Internal Use Only Key Investment Highlights 20 • Diverse business model with both online and campus based portfolio of assets. • Turnaround strategy in place with execution progressing. • Favorable industry dynamics in terms of market size and employer demand for skilled workers. • Strong balance sheet and cash position with clear path to profitability. • Dedicated management team with extensive industry experience. |
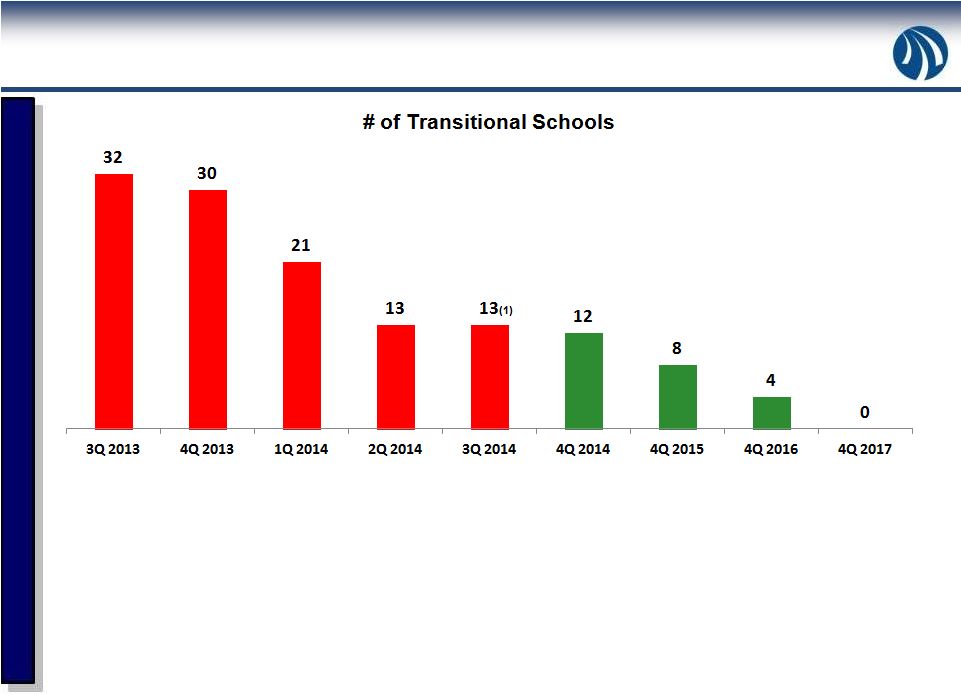
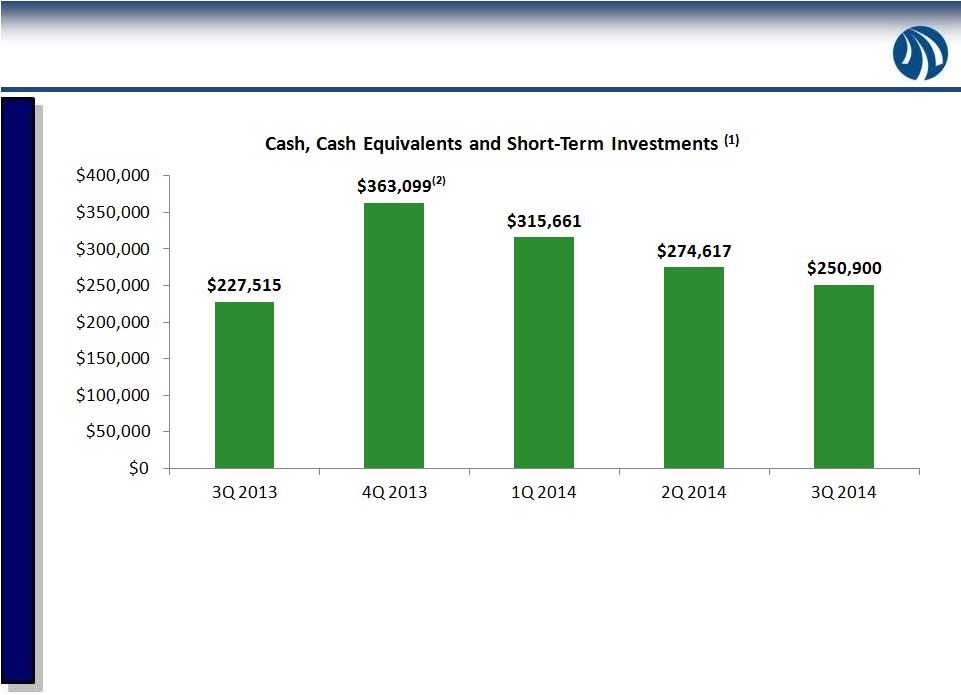
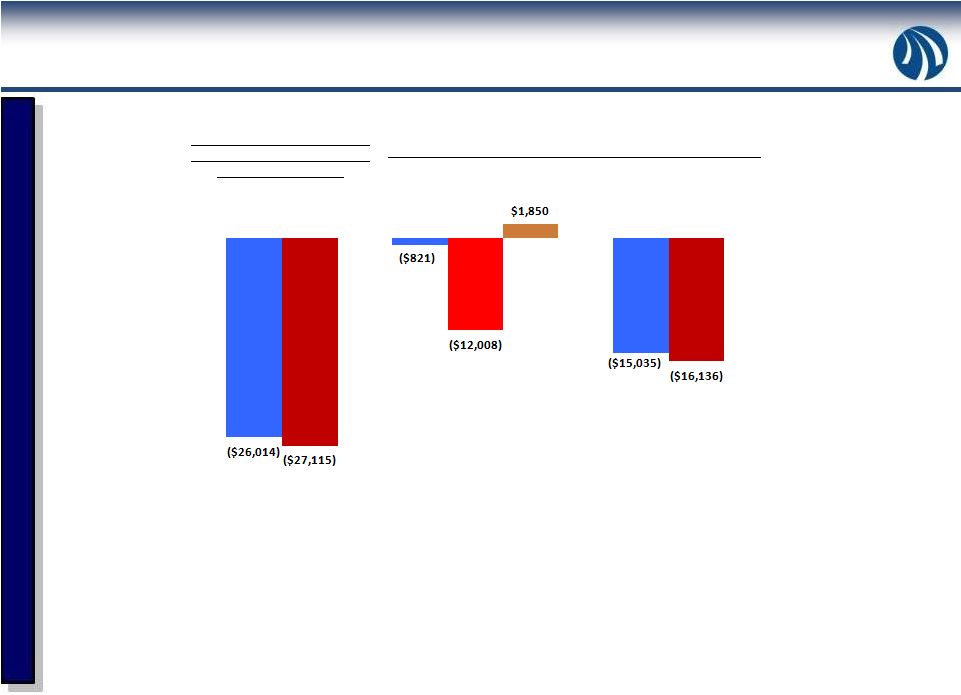
![]() Confidential – For Internal Use Only Reconciliation of GAAP to Non-GAAP Items 21 Adjusted EBITDA Q3 2014 Q2 2014 Q1 2014 Q4 2013 Q3 2013 Ongoing Operations: Pre-tax loss from continuing operations (44,787) $ (31,984) $ (39,930) $ (43,458) $ (54,989) $ Transitional Schools operating loss 11,390 9,642 8,259 12,944 10,099 Interest (income) expense, net (120) (177) (25) 65 15 Loss (gain) on sale of business - - - (68) 39 Depreciation and amortization (3) 11,950 12,554 13,029 13,661 13,990 Stock-based compensation (3) 950 1,020 1,341 1,580 1,713 Legal settlements (3) (4) - 1,600 5,850 17,000 300 14,396 7,403 74 3,050 11,513 (226) (879) (606) (2,924) 1,184 (8,588) - - - - Adjusted EBITDA–Ongoing Operations (2) (15,035) $ (821) $ (12,008) $ 1,850 $ (16,136) $ Adjusted EBITDA per diluted share (0.22) $ (0.01) $ (0.18) $ 0.03 $ (0.24) $ Memo: Advertising Expenses (3) 69,875 $ 56,224 $ 69,379 $ 56,077 $ 70,936 $ Transitional Schools and Discontinued Operations: Pre-tax (loss) income from discontinued operations (2,065) $ (12,726) $ (17,993) $ 117,272 $ (21,712) $ Transitional Schools operating loss (11,390) (9,642) (8,259) (12,944) (10,099) Loss (gain) on sale of business (8) - 311 - (130,109) - International Schools operating (income) loss (7) - - - (11,434) 7,608 Interest (income) expense, net - - - (51) (21) Depreciation and amortization (8) 1,191 1,840 2,402 2,765 2,961 Legal settlements (8) 225 - - - - 89 51 (7) 3,933 72 (3,485) 1,436 3,099 5,766 (3,092) Adjusted EBITDA–Transitional and Discontinued Operations (2) (15,435) $ (18,730) $ (20,758) $ (24,802) $ (24,283) $ Adjusted EBITDA per diluted share (0.23) $ (0.28) $ (0.31) $ (0.37) $ (0.36) $ Asset impairments (3) (5) Unused space charges (3) (6) Asset impairments (8) Unused space charges (6) (8) CAREER EDUCATION CORPORATION AND SUBSIDIARIES UNAUDITED RECONCILIATION OF GAAP TO NON-GAAP ITEMS (1) (In thousands, except per share amounts) Insurance recovery |
![]() Confidential – For Internal Use Only 22 Reconciliation of GAAP to Non-GAAP Items – con’t Q3 2014 Q2 2014 Q1 2014 Q4 2013 Q3 2013 CTU - $ - $ (900) $ 1,300 $ - $ Career Colleges - - - 200 300 Culinary Arts - 2,000 3,000 15,500 - Corporate & Other - (400) 3,750 - - Total - $ 1,600 $ 5,850 $ 17,000 $ 300 $ (1) (2) (3) (4) (5) (6) (7) (8) The Company believes it is useful to present non-GAAP financial measures which exclude certain significant items as a means to understand the performance of its ongoing operations. As a general matter, the Company uses non-GAAP financial measures in conjunction with results presented in accordance with GAAP to help analyze the performance of its ongoing operations, assist with preparing the annual operating plan, and measure performance for some forms of compensation. In addition, the Company believes that non-GAAP financial information is used by analysts and others in the investment community to analyze the Company's historical results and to provide estimates of future performance and that failure to report non-GAAP measures could result in a misplaced perception that the Company's results have underperformed or exceeded expectations. We believe Adjusted EBITDA allows us to compare our current operating results with corresponding historical periods and with the operational performance of other companies in our industry because it does not give effect to potential differences caused by items we do not consider reflective of underlying operating performance. We also present Adjusted EBITDA because we believe it is frequently used by securities analysts, investors and other interested parties as a measure of performance. In evaluating Adjusted EBITDA, investors should be aware that in the future we may incur expenses similar to the adjustments presented above. Our presentation of Adjusted EBITDA should not be construed as an inference that our future results will be unaffected by expenses that are unusual, non-routine or non-recurring. Adjusted EBITDA has limitations as an analytical tool, and you should not consider it in isolation, or as a substitute for net income (loss), operating income (loss), or any other performance measure derived in accordance and reported under GAAP or as an alternative to cash flow from operating activities or as a measure of our liquidity. Non-GAAP financial measures when viewed in a reconciliation to corresponding GAAP financial measures, provides an additional way of viewing the Company's results of operations and the factors and trends affecting the Company's business. Non-GAAP financial measures should be considered as a supplement to, and not as a substitute for, or superior to, the corresponding financial results presented in accordance with GAAP. Management assesses results of operations for ongoing operations, which excludes Transitional Schools, separately from Transitional Schools. As schools within the Transitional Schools segment are fully taught-out, these schools will be recast as components of Discontinued Operations. As a result, management views adjusted EBITDA from ongoing operations separately from Transitional Schools and Discontinued Operations to assess results and make decisions. Accordingly, Transitional Schools operating loss is added back to pre-tax loss from continuing operations and subtracted from pre-tax loss from discontinued operations. Quarterly amounts relate to ongoing operations, which excludes Transitional Schools. Legal settlement amounts are net of insurance recoveries and are recorded within the following segments: Asset impairments primarily relate to impairment charges within Culinary Arts of $1.5 million, $7.4 million and $10.7 million which were recorded during the third quarter of 2014, second quarter of 2014 and third quarter of 2013, respectively, and within Career Colleges of $12.8 million and $2.9 million recorded during the third quarter of 2014 and fourth quarter of 2013, respectively. Unused space charges represent the net present value of remaining lease obligations less an estimated amount for sublease income as well as the subsequent accretion of these charges. The International Schools segment was sold during the fourth quarter of 2013. As such, management excludes operations from the International Schools when assessing results and trends of Transitional Schools and Discontinued Operations. Quarterly amounts relate to Transitional Schools and Discontinued Operations, excluding International. |