E.ON "Delivering Profitable Growth and Performance" November 2006
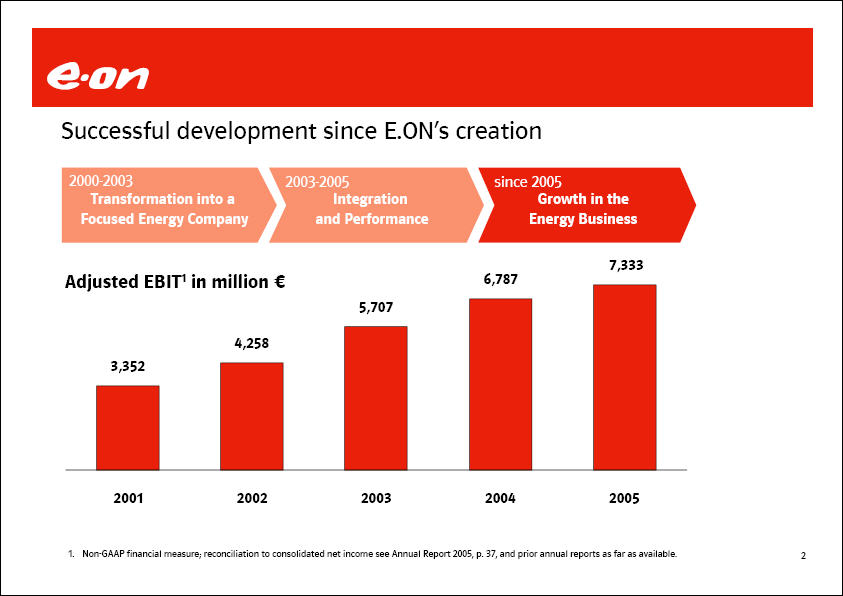
E.ON Successful development since E.ON's creation 2000-2003 Transformation into a Focused Energy Company 2003-2005 Integration and Performance since 2005 Growth in the Energy Business Adjusted EBIT1 in million € 7,333 2005 6,787 2004 5,707 2003 4,258 2002 3,352 2001 1. Non-GAAP financial measure; reconciliation to consolidated net income see Annual Report 2005, p. 37, and prior annual reports as far as available.
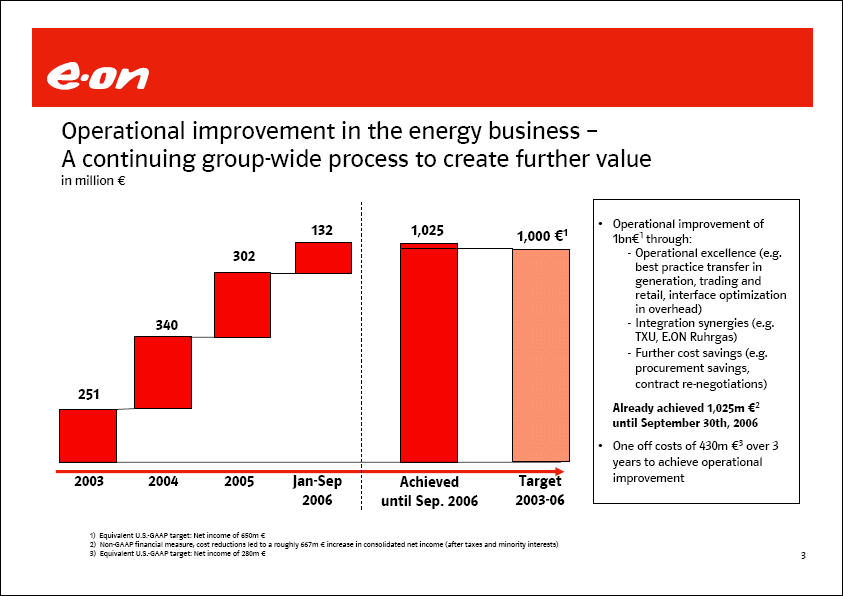
E.ON Operational improvement in the energy business - A continuing group-wide process to create further value in million € 251 2003 340 2004 302 2005 132 Jan-Sep 2006 1,025 Achieved until Sep. 2006 1,000 €1 Target 2003-06 Operational improvement of 1bn€1 through: Operational excellence (e.g. best practice transfer in generation, trading and retail, interface optimization in overhead) Integration synergies (e.g. TXU, E.ON Ruhrgas) Further cost savings (e.g. procurement savings, contract re-negotiations) Already achieved 1,025m €2 until September 30th, 2006 One off costs of 430m €3 over 3 years to achieve operational improvement 1) Equivalent U.S.-GAAP target: Net income of 650m € 2) Non-GAAP financial measure; cost reductions led to a roughly 667m € increase in consolidated net income (after taxes and minority interests) 3) Equivalent U.S.-GAAP target: Net income of 280m €

E.ON Value creation through focus on performance improvement 12% 10% 8% 6% 4% 2% 0% 9.6% 2001 9.2% 2002 9.9% 2003 11.5% 2004 12.1% 2005 ROCE1 Cost of Capital 1. Non-GAAP financial measure; for derivation see Annual Report 2005, p. 38-39, and prior annual reports as far as available.
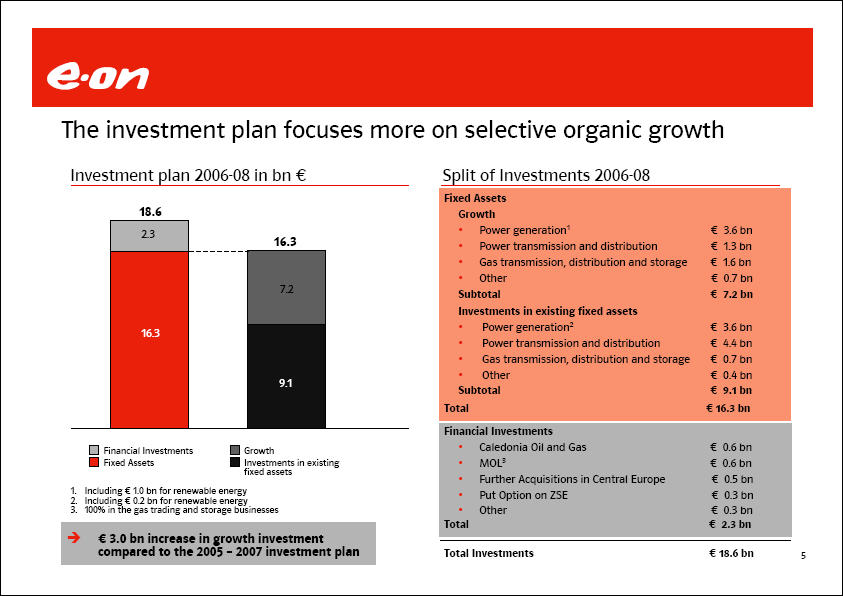
E.ON The investment plan focuses more on selective organic growth Investment plan 2006-08 in bn € 18.6 2.3 16.3 Financial Investments Fixed Assets 16.3 7.2 9.1 Growth Investments in existing fixed assets 1. Including €1.0 bn for renewable energy 2. Including € 0.2 bn for renewable energy 3. 100% in the gas trading and storage businesses € 3.0 bn increase in growth investment compared to the 2005 - 2007 investment plan Split of Investments 2006-08 Fixed Assets Growth Power generation1 € 3.6 bn Power transmission and distribution € 1.3 bn Gas transmission, distribution and storage € 1.6 bn Other € 0.7 bn Subtotal € 7.2 bn Investments in existing fixed assets Power generation 2 € 3.6 bn Power transmission and distribution € 4.4 bn Gas transmission, distribution and storage € 0.7 bn Other € 0.4 bn Subtotal € 9.1 bn Total €16.3 bn Financial Investments Caledonia Oil and Gas € 0.6 bn MOL3 € 0.6 bn Further Acquisitions in Central Europe € 0.5 bn Put Option on ZSE € 0.3 bn Other € 0.3 bn Total € 2.3 bn Total Investments € 18.6 bn

E.ON All external growth opportunities are subject to E.ON's strict strategic and financial investment criteria Strategic Criteria Market attractiveness (returns, growth, regulation, country risk) Target attractiveness (asset quality, market position, management quality) Value creation potential (cost reduction, integration benefits, transfer of best practice) Financial Criteria Earnings enhancing in the first full year after acquisition Returns exceeding cost of capital three years after acquisition in general Not endanger overall group performance targets
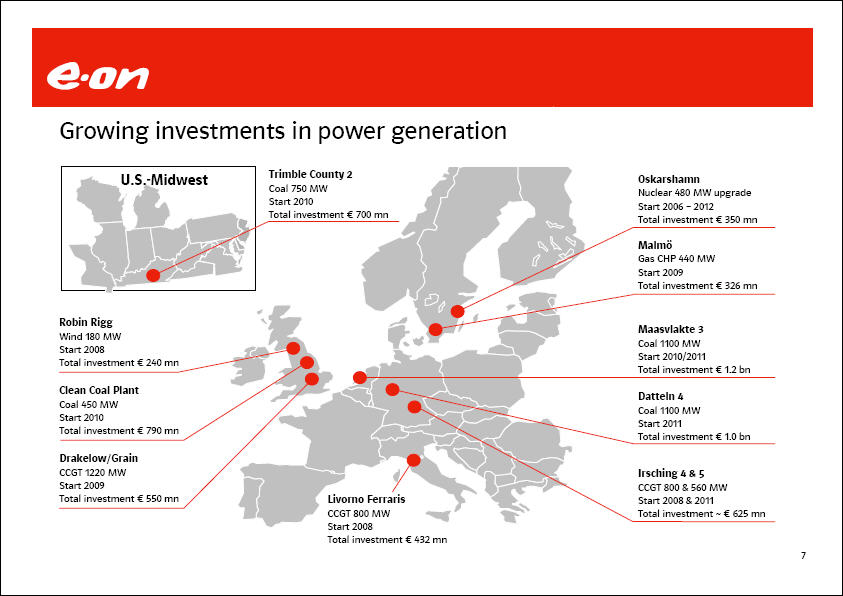
E.ON Growing investments in power generation U.S.-Midwest Trimble County 2 Coal 750 MW Start 2010 Total investment € 700 mn Oskarshamn Nuclear 480 MW upgrade Start 2006 - 2012 Total investment € 350 mn Malmö Gas CHP 440 MW Start 2009 Total investment € 326 mn Robin Rigg Wind 180 MW Start 2008 Total investment € 240 mn Clean Coal Plant Coal 450 MW Start 2010 Total investment € 790 mn Maasvlakte 3 Coal 1100 MW Start 2010/2011 Total investment €1.2 bn Datteln 4 Coal 1100 MW Start 2011 Total investment €1.0 bn Drakelow/Grain CCGT 1220 MW Start 2009 Total investment € 550 mn Irsching 4 & 5 CCGT 800 & 560 MW Start 2008 & 2011 Total investment € 625 mn Livorno Ferraris CCGT 800 MW Start 2008 Total investment € 432 mn

E.ON E.ON continues to solidify its integrated position in Eastern Europe E.ON involvements in power E.ON involvements in gas Czech Rep. pp VCP ECR ECD ETI ECE JCP SMP JMP ZSE Slovakia SPP Slovakia EED EDE Moldova E.ON Földgaz Trade Hungary KÖGAZ DDGAZ E.ON Gaz Romania Bulgaria Varna Gorna subject to permission of the cartel authority Majority shareholding Minority stake (with 100% management control) 100% E.ON Földgaz Trade 100% E.ON Földgaz Storage Minority stake Expanding our presence in Eastern Europe enables us to create economies of scale and to create a market leading position as eastern European markets become more connected and converge
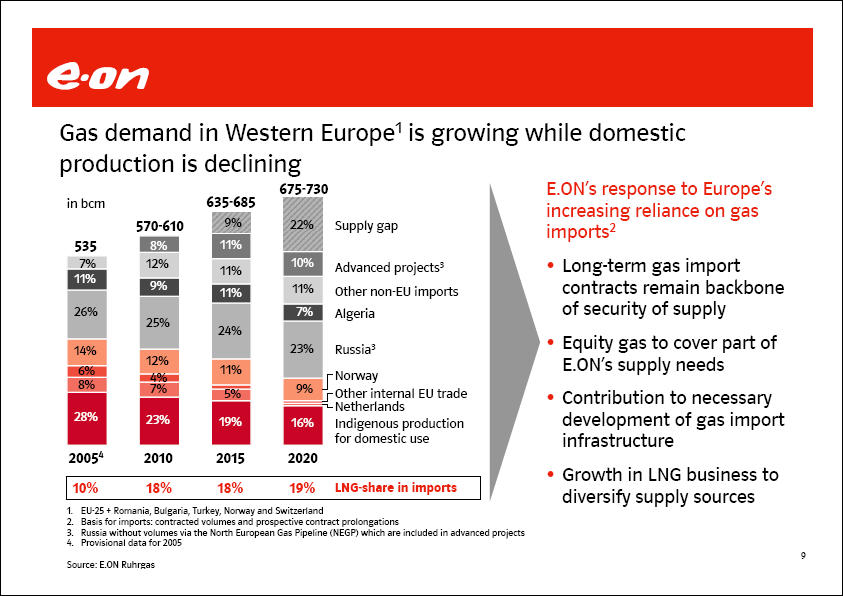
E.ON Gas demand in Western Europe1 is growing while domestic production is declining in bcm 675-730 635-685 570-610 Supply gap 535 7% 11% 8% 12% 11% 10% Advanced projects 3 11% 9% 11% 11% Other non-EU imports 26% 7% Algeria 25% 24% 14% 23% Russia3 12% 4% 11% Norway 9% Other internal EU trade Netherlands 28% 23% 19% 16% Indigenous production for domestic use 20054 2010 2015 2020 10% 18% 18% 19% LNG-share in imports 1. EU-25 + Romania, Bulgaria, Turkey, Norway and Switzerland 2. Basis for imports: contracted volumes and prospective contract prolongations 3. Russia without volumes via the North European Gas Pipeline (NEGP) which are included in advanced projects 4. Provisional data for 2005 E.ON's response to Europe's increasing reliance on gas imports2 Long-term gas import contracts remain backbone of security of supply Equity gas to cover part of E.ON's supply needs Contribution to necessary development of gas import infrastructure Growth in LNG business to diversify supply sources Source: E.ON Ruhrgas

E.ON E.ON's gas upstream strategy: Strengthen and diversify supply Long term targets: Build gas upstream position of up to - 15 - 20% of the E.ON Ruhrgas supply portfolio Target regions: North Sea (UK, Norway), Russia. Africa & Middle East under evaluation in combination with LNG Implementation status: E.ON Ruhrgas gas supply 2005: - 59 bcm Gas production from North Sea: Up to 5% of current E.ON Ruhrgas supply1 Gas production from Russia: Up to 10 % of current E.ON Ruhrgas supply2 British North Sea Sleipner St. Fergus Stavanger Scoter Draupner Elgin Norway, UK and Danmark Glenelg Franklin Ekofisk Nybro Emden Seal Teesside Johnston Hunter Minke Orca Revenspurn North Dimlington Theddlethorpe Bacton Edinburgh Norwegian North Sea Skarv Norne Viktoria Åsgard Heidrun Kristin Haltenbanken Vest Mikkel Njord Ormen Lange Tjeldbergodden Russia Jamburg Kharvuta S.-Urengoy Zapoljamoje Urengoy Medvezhje Jamsovey Yushno Russkoje 1. When all gas fields of E.ON Ruhrgas UK North Sea Ltd. are in production 2. When Yushno Russkoje has reached plateau production
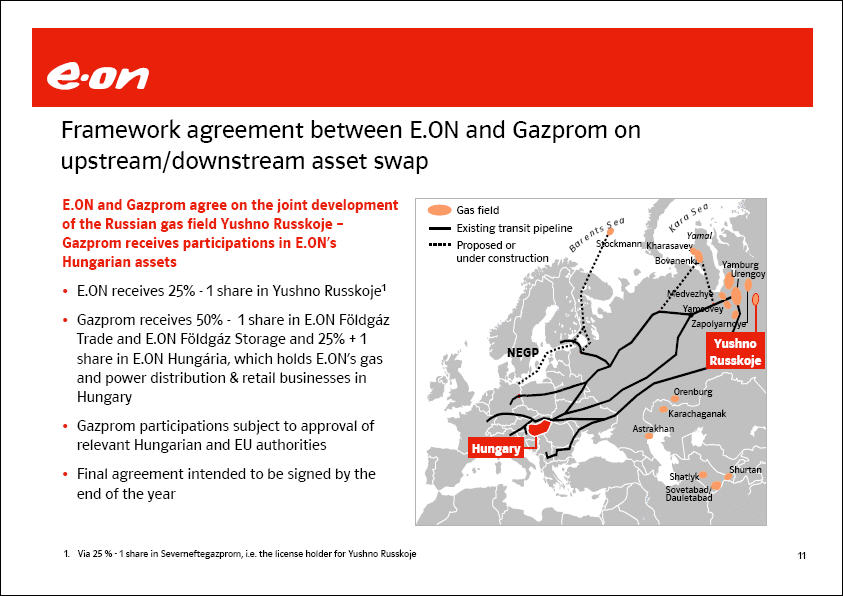
E.ON Framework agreement between E.ON and Gazprom on upstream/downstream asset swap E.ON and Gazprom agree on the joint development of the Russian gas field Yushno Russkoje - Gazprom receives participations in E.ON's Hungarian assets E.ON receives 25% -1 share in Yushno Russkojel Gazprom receives 50% - 1 share in E.ON Földgáz Trade and E.ON Földgáz Storage and 25% + 1 share in E.ON Hungária, which holds E.ON's gas and power distribution & retail businesses in Hungary Gazprom participations subject to approval of relevant Hungarian and EU authorities Final agreement intended to be signed by the end of the year Gas field Existing transit pipeline Proposed or under construction NEGP Yushno Russkoje Hungary 1. Via 25 % -1 share in Severneftegazprom, i.e. the license holder for Yushno Russkoje Hungary Shatlyk Sovetabad/Dauletabad Shurtan Astrakhan Karachaganak Orenburg Zapolyarnoye Yamsovey Medvezhye Yamburg Urengoy Bovanenko Kharasavely Yamal Stockmann Barents Sea Kara Sea
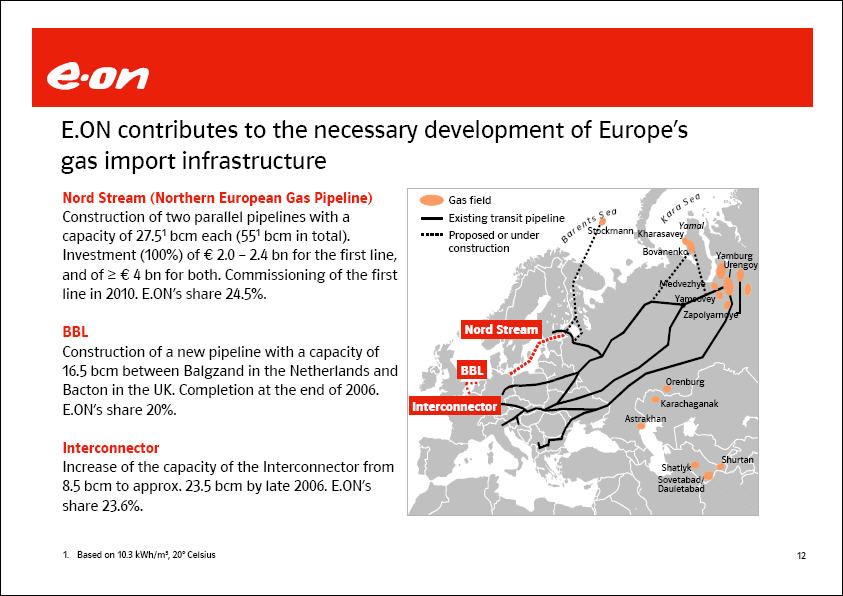
E.ON E.ON contributes to the necessary development of Europe's gas import infrastructure Nord Stream (Northern European Gas Pipeline) Construction of two parallel pipelines with a capacity of 27.51 bcm each (551 bcm in total). Investment (100%) of € 2.0 - 2.4 bn for the first line, and of ≥€ 4 bn for both. Commissioning of the first line in 2010. E.ON's share 24.5%. BBL Construction of a new pipeline with a capacity of 16.5 bcm between Balgzand in the Netherlands Bacton in the UK. Completion at the end of 2006. E.ON's share 20%. Interconnector Increase of the capacity of the Interconnector from 8.5 bcm to approx. 23.5 bcm by late 2006. E.ON's share 23.6%. 1. Based on 10.3 kWh/m3, 20° Celsius Gas field Existing transit pipeline Proposed or under construction Nord Stream BBL Interconnector Yamburg Urengoy Zapolyarnoye Shatlyk Sovetabad/Dauletabad Shurtan Astrakhan Karachaganak Orenburg Yamsovey Medvezhye Bovanenko Kharasavey Yamal Stockmann Barents Sea Kara Sea
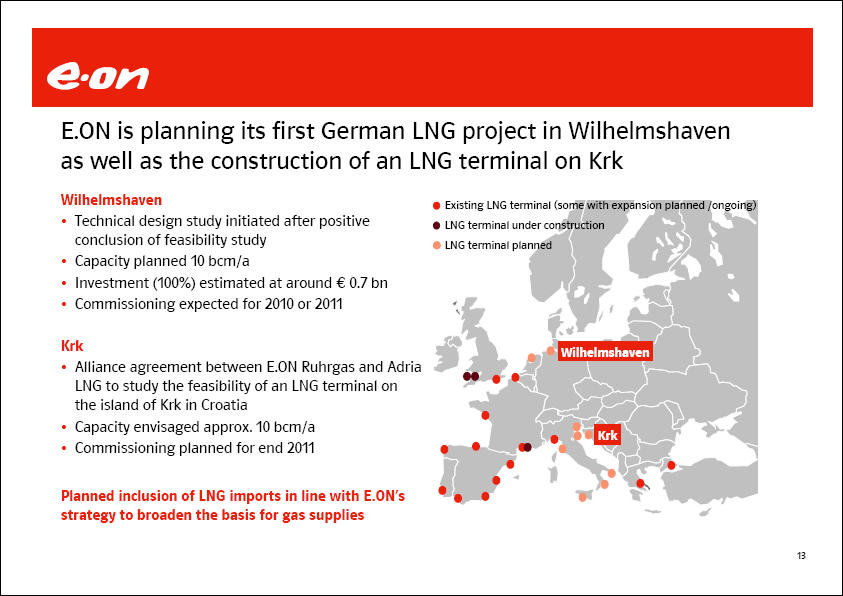
E.ON is planning its first German LNG project in Wilhelmshaven as well as the construction of an LNG terminal on Krk Wilhelmshaven Technical design study initiated after positive conclusion of feasibility study Capacity planned 10 bcm/a Investment (100%) estimated at around € 0.7 bn Commissioning expected for 2010 or 2011 Krk Alliance agreement between E.ON Ruhrgas and Adria LNG to study the feasibility of an LNG terminal on the island of Krk in Croatia Capacity envisaged approx. 10 bcm/a Commissioning planned for end 2011 Planned inclusion of LNG imports in line with E.ON‘s strategy to broaden the basis for gas supplies Existing LNG terminal (some with expansion planned /ongoing) LNG terminal under construction LNG terminal planned Wilhelmshaven Krk

E.on The combination of E.ON and Endesa creates the world’s leading power and gas company Global scale Europe1 327 TWh power generation 515 TWh power sales 931 TWh gas sales 41 million customers2 The Americas1 94 TWh power generation 93 TWh power sales 13 million customers E.ON Endesa Diversified earnings3 Iberia 20% UK 9% Nordic 7% Italy/France 5% European Gas 12% Latin 11% US 4% Central Europe 32% Diversified generation4 Nuclear 25% Hydro 16% Gas/Oil 17% Other 1% Coal 40% 1. 2005 figures 2. Majority controlled customers 3. Adjusted EBITDA for E.ON; EBITDA for Endesa 4. Generation mix (TWh) as of 2004 Sources: Endesa presentations and reports; E.ON

E.on The combined Pan-European presence will provide new value creation opportunities and is in line with EU vision European markets emerging Regional power markets European gas market European CO2 market Global LNG and coal markets EU Vision: One European market Priority Axes identified by the EC TENS Program for power transmission strengthening Nordic market GB/IRL market Western Europe Market Iberian market Mibel Italian market zone SE Europe Market Eastern Europe Market Baltic market
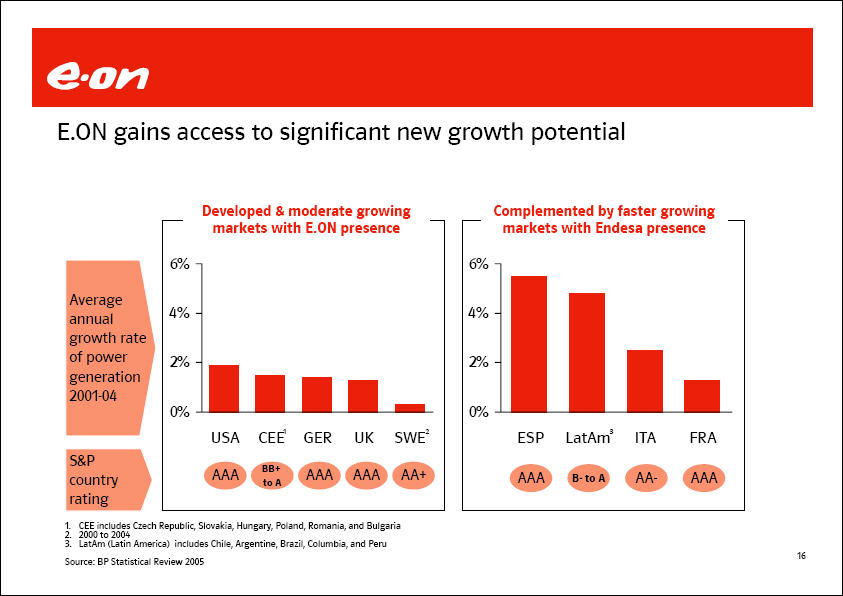
E.ON E.ON gains access to significant new growth potential Developed & moderate growing markets with E.ON presence Average annual growth rate of power generation 2001-04 S&P country rating USA AAA CEE1 BB+ to A GER AAA UK AAA SWE2 AA+ Complemented by faster growing markets with Endesa presence ESP AAA LatAm3 B- to A ITA AA- FRA AAA 1. CEE includes Czech Republic, Slovakia, Hungary, Poland, Romania, and Bulgaria 2. 2000 to 2004 6% 4% 2% 0% 3. LatAm (Latin America) includes Chile, Argentine, Brazil, Columbia, and Peru Source: BP Statistical Review 2005
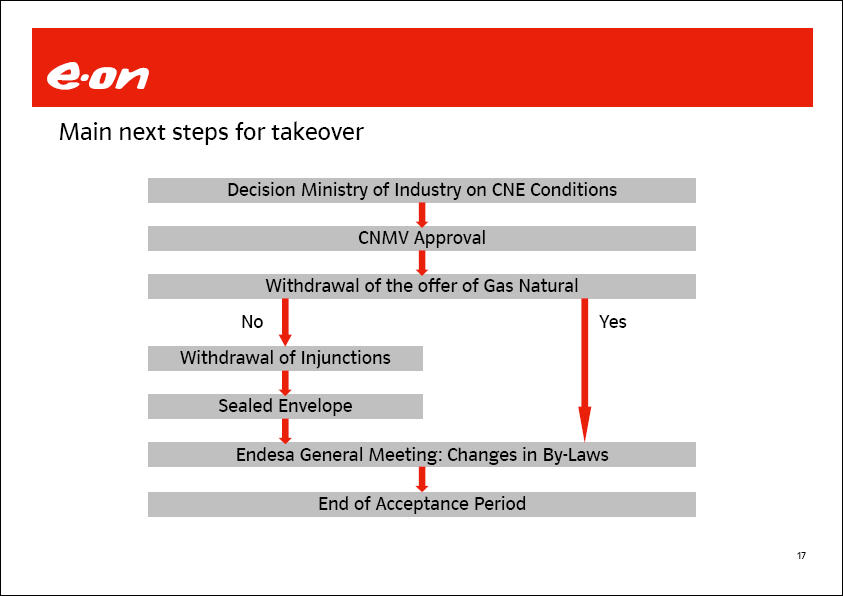
E.ON Main next steps for takeover Decision Ministry of Industry on CNE Conditions CNMV Approval Withdrawal of the offer of Gas Natural No Yes Withdraw of Injunctions Sealed Envelope Endesa General Meeting: Changes in By-Laws End of Acceptance Period

E.ON Regulation of network charges in Germany E.ON Hanse E.ON Westfalen Weser E.ON Mitte E.ON edis E.ON Avacon E.ON Thüringer Energie E.ON Bayern Difference between allowed and requested network fees Electricity Gas E.ON Netz1 -16%2 - E.ON Avacon -5% / -13% t.b.a. E.ON Bayern -12% t.b.a. E.ON Edis -14% -9.8% E.ON Hanse -11% -8.7% E.ON Mitte -14% -11% E.ON Thüringer Energie -14% -9.5% E.ON Westfalen-Weser -12% -9.8% Differing interpretations of new rules, with BNetzA unduly disadvantaging network operators. Main points of contention with BNetzA: Calculation of the equity portion of the asset base Valuation of the fixed assets Treatment of the trade tax Estimated ~€ 0.7 bn negative impact on 2006 adjusted EBIT, mainly within market unit Central Europe. Outlook for market unit Central Europe takes regulatory risks into account. Adjusted EBIT expected to be higher in 2006. 1. Electricity network only 2. 9% compared to status quo
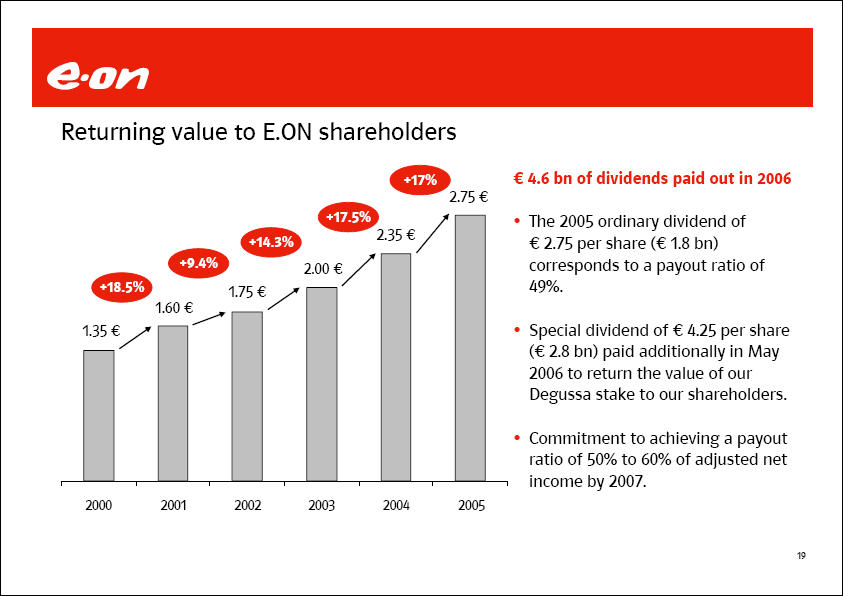
E.ON Returning value to E.ON shareholders 4.6 bn of dividends paid out in 2006 The 2005 ordinary dividend of € 2.75 per share (€ 1.8 bn) corresponds to a payout ratio of 49%. Special dividend of € 4.25 per share (€ 2.8 bn) paid additionally in May 2006 to return the value of our Degussa stake to our shareholders. Commitment to achieving a payout ratio of 50% to 60% of adjusted net income by 2007. +18.5% +9.4% +14.3% +17.5% +17% 1.35 € 1.60 € 1.75 € 2.00 € 2.35 € 2.75 € 2000 2001 2002 2003 2004 2005
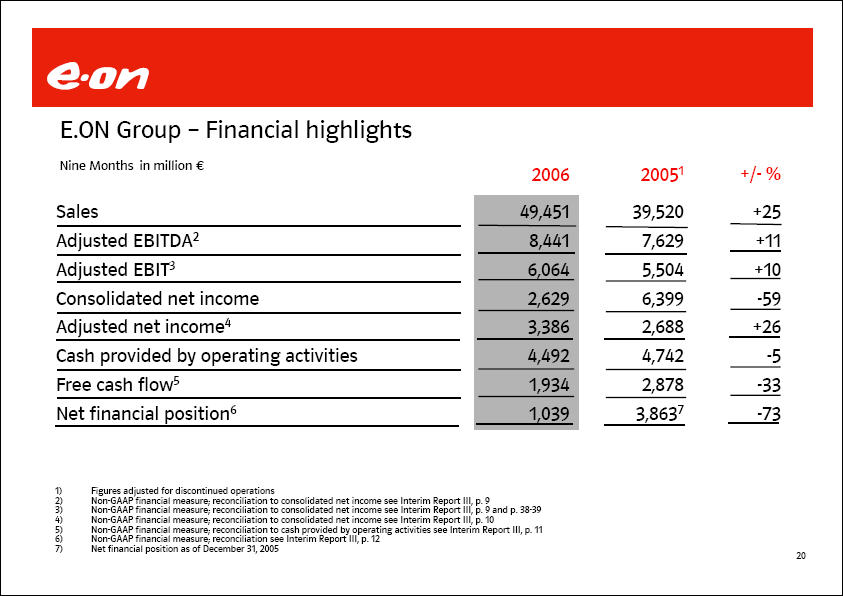
E.ON E.ON Group - Financial highlights Nine Months in million € 2006 20051 +/- % Sales 49,451 39,520 +25 Adjusted EBITDA2 8,441 7,629 +11
Adjusted EBIT3 6,064 5,504 +10 Consolidated net income 2,629 6,399 -59 Adjusted net income4 3,386 2,688 +26 Cash provided by operating activities 4,492 4,742 -5 Free cash flow5 1,934 2,878 -33 Net financial position6 1,039 3,8637 -73 1) Figures adjusted for discontinued operations 2) Non-GAAP financial measure; reconciliation to consolidated net income see Interim Report III, p. 9 3) Non-GAAP financial measure; reconciliation to consolidated net income see Interim Report III, p. 9 and p. 38-39 4) Non-GAAP financial measure; reconciliation to consolidated net income see Interim Report III, p. 10 5) Non-GAAP financial measure; reconciliation to cash provided by operating activities see Interim Report III, p. 11 6) Non-GAAP financial measure; reconciliation see Interim Report III, p. 12 7) Net financial position as of December 31, 2005
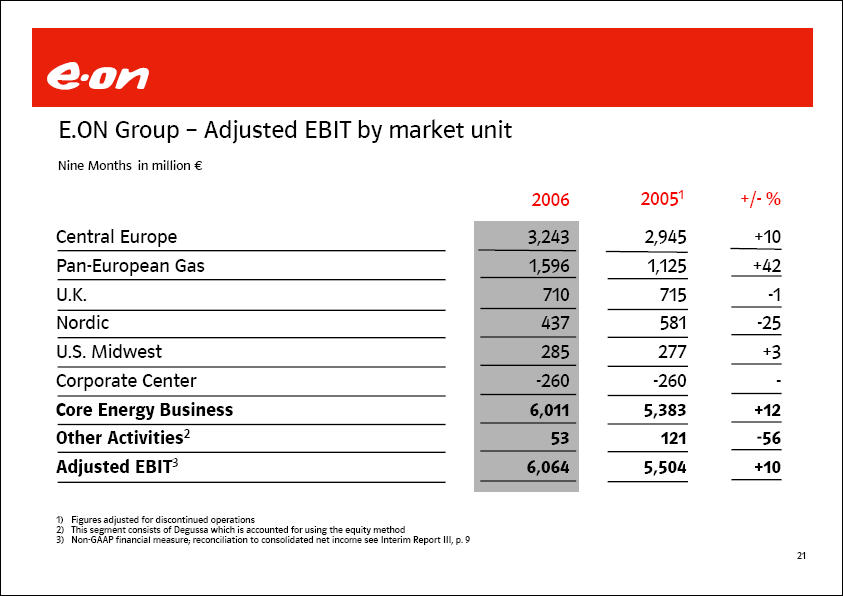
E.ON E.ON Group - Adjusted EBIT by market unit Nine Months in million € 2006 20051 +/- % Central Europe 3,243 2,934 +10 Pan-European Gas 1,596 1,125 +42 U.K. 710 715 -1 Nordic 437 581 -25 U.S. Midwest 285 277 +3 Corporate Center -260 -260 - Core Energy Business 6,011 5,383 +12 Other Activities2 53 121 -56 Adjusted EBIT3 6,064 5,504 +10 1) Figures adjusted for discontinued operations 2) This segment consists of Degussa which is accounted for using the equity method 3) Non-GAAP financial measure; reconciliation to consolidated net income see Interim Report III, p. 9
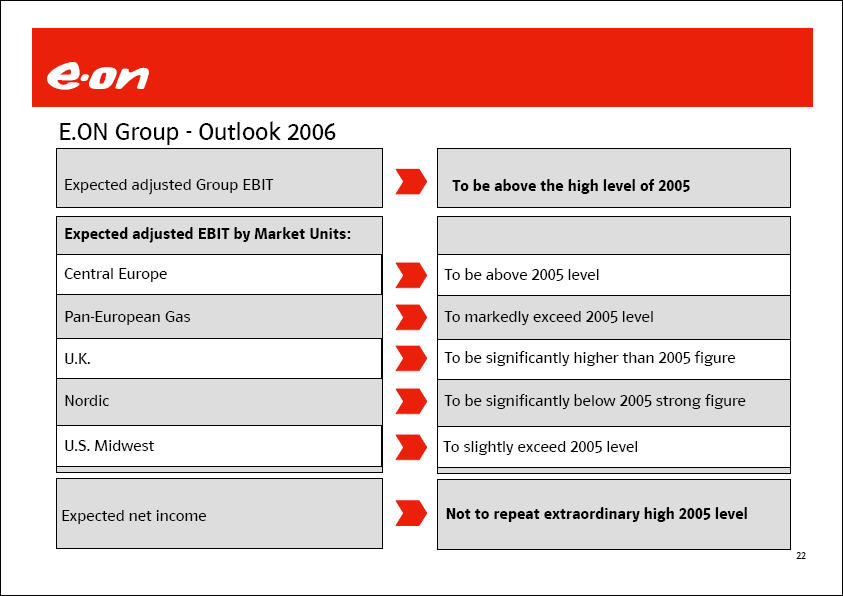
E.ON E.ON Group - Outlook 2006 Expected adjusted Group EBIT To be above the high level of 2005 Expected adjusted EBIT by Market Units: Central Europe To be above 2005 level Pan-European Gas To markedly exceed 2005 level U.K. To be significantly higher than 2005 figure Nordic To be significantly below 2005 strong figure U.S. Midwest To slightly exceed 2005 level Expected net income Not to repeat extraordinary high 2005 level

E.ON E.ON’s proven management philosophy Performance & Integration Continued drive for better performance across all markets Integration of the acquired business a priority Standardized processes across businesses, maximizing efficiency Focused investments Strengthen the integrated power and gas business in existing markets Expanded platform for growing the business organically and through focused investments Active portfolio management Continue to manage actively the portfolio Constant review of portfolio with respect to strategic fit and value creation Financial discipline Strict financial discipline Continued commitment to a strong balance sheet
E.ON Our vision: “E.ON - the world´s leading power and gas company”

E.ON Back-up Charts
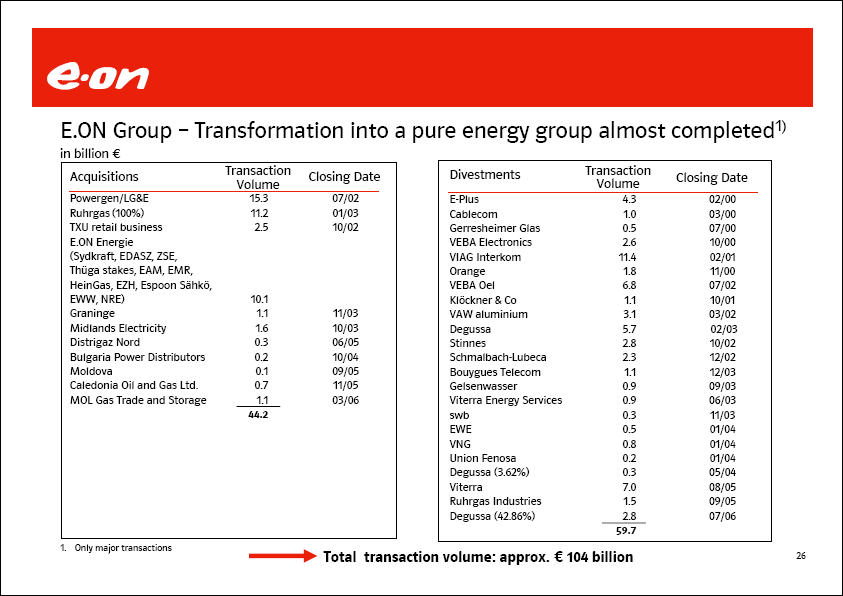
E.ON E.ON Group - Transformation into a pure energy group almost completed1) in billion € Acquisitions Transaction Volume Closing Date Powergen/LG&E 15.3 07/02 Ruhrgas (100%) 11.2 01/03 TXU retail business 2.5 10/02 E.ON Energie (Sydkraft, EDASZ, ZSE, Thüga stakes, EAM, EMR, HeinGas, EZH, Espoon Sähkö, EWW, NRE) 10.1 Graninge 1.1 11/03 Midlands Electricity 1.6 10/03 Distrigaz Nord 0.3 06/05 Bulgaria Power Distributors 0.2 10/04 Moldova 0.1 09/05 Caledonia Oil and Gas Ltd. 0.7 11/05 MOL Gas Trade and Storage 1.1 03/06 44.2 Divestments Transaction Closing Date Volume E-Plus 4.3 02/00 Cablecom 1.0 03/00 Gerresheimer Glas 0.5 07/00 VEBA Electronics 2.6 10/00 VIAG Interkom 11.4 02/01 Orange 1.8 11/00 VEBA Oel 6.8 07/02 Klöckner & Co 1.1 10/01 VAW aluminium 3.1 03/02 Degussa 5.7 02/03 Stinnes 2.8 10/02 Schmalbach-Lubeca 2.3 12/02 Bouygues Telecom 1.1 12/03 Gelsenwasser 0.9 09/03 Viterra Energy Services 0.9 06/03 swb 0.3 11/03 EWE 0.5 01/04 VNG 0.8 01/04 Union Fenosa 0.2 01/04 Degussa (3.62%) 0.3 05/04 Viterra 7.0 08/05 Ruhrgas Industries Ruhrgas Industries 1.5 09/05 Degussa (42.86%) 2.8 07/06 59.7 1. Only major transactions Total transaction volume: approx. € 104 billion

E.ON Significant growth steps since 2003 Small and medium size investments of more than € 7 bn Upstream-Projects in the North Sea, including Caledonia, Njord Construction of off-shore wind power Enfield gas-fired power station Acquisition of Midlands Electricity Share increase Interconnector; BBL gas pipeline
NRE Energie Expansion of German gas infrastructure to increase supply to UK/IT Investments in Italy (especially Thüga in Northern Italy; recently CCGT plant in Livorno) Entered the Bulgarian power market Entered the Romanian power and gas markets Acquisition of MOL Gas Trade and Storage Consolidation of Czech downstream activities Acquisition of Graninge
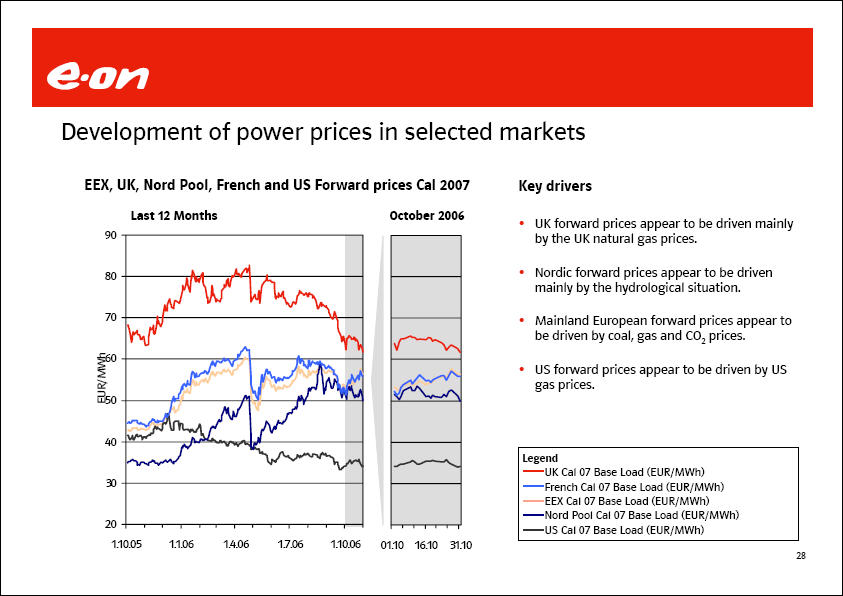
E.ON Development of power prices in selected markets EEX, UK, Nord Pool, French and US Forward prices Cal 2007 Last 12 Months October 2006 EUR/MWh 90 80 70 60 50 40 30 20 1.10.05 1.1.06 1.4.06 1.7.06 1.10.06 01.10 16.10 31.10 Key drivers UK forward prices appear to be driven mainly by the UK natural gas prices. Nordic forward prices appear to be driven mainly by the hydrological situation. Mainland European forward prices appear to be driven by coal, gas and CO2 prices. US forward prices appear to be driven by US gas prices. Legend UK Cal 07 Base Load (EUR/MWh) French Cal 07 Base Load (EUR/MWh) EEX Cal 07 Base Load (EUR/MWh) Nord Pool Cal 07 Base Load (EUR/MWh) US Cal 07 Base Load (EUR/MWh)
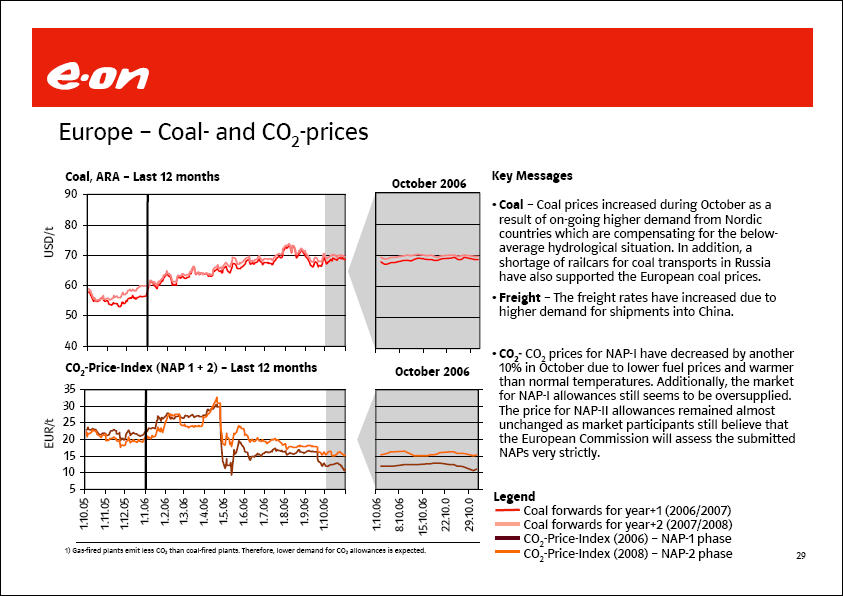
E.ON Europe - Coal- and CO2-prices Coal, ARA - Last 12 months October 2006 USD/t 90 80 70 60 50 40 CO2-Price-Index (NAP 1 + 2) - Last 12 months October 2006 EUR/t 35 30 25 20 15 10 5 1.10.05 1.11.05 1.12.05 1.1.06 1.2.06 1.3.06 1.4.06 1.5.06 1.6.06 1.7.06 1.8.06 1.9.06 1.10.06 1.10.06 8.10.06 15.10.06 22.10.0 29.10.0 Key Messages Coal - Coal prices increased during October as a result of on-going higher demand from Nordic countries which are compensating for the below-average hydrological situation. In addition, a shortage of railcars for coal transports in Russia have also supported the European coal prices. Freight - The freight rates have increased due to higher demand for shipments into China. CO2- CO2 prices for NAP-I have decreased by another 10% in October due to lower fuel prices and warmer than normal temperatures. Additionally, the market for NAP-I allowances still seems to be oversupplied. The price for NAP-II allowances remained almost unchanged as market participants still believe that the European Commission will assess the submitted NAPs very strictly. Legend Coal forwards for year+1 (2006/2007) Coal forwards for year+2 (2007/2008) CO2-Price-Index (2006) - NAP-1 phase CO2-Price-Index (2008) - NAP-2 phase 1) Gas-fired plants emit less CO2 than coal-fired plants. Therefore, lower demand for CO2 allowances is expected.
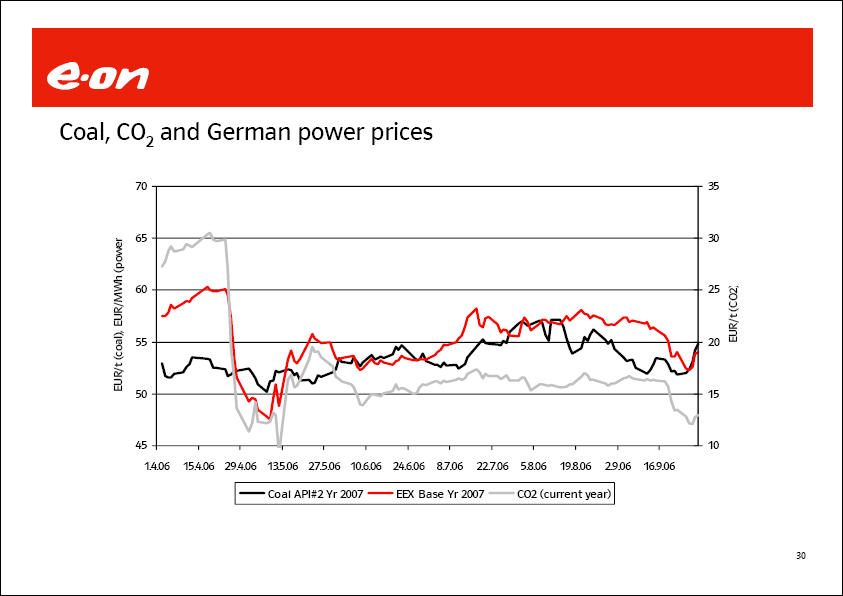
E.ON Coal, CO2 and German power prices EUR/t (coal), EUR/MWh (power 70 65 60 55 50 45 1.4.06 15.4.06 29.4.06 13.5.06 27.5.06 10.6.06 24.6.06 8.7.06 22.7.06 5.8.06 19.8.06 2.9.06 16.9.06 EUR/t(CO2) 35 30 25 20 15 10 Coal API#2 Yr 2007 EEX Base Yr 2007 CO2 (current year)

E.ON Germany - Regulation of network fees Gas transmission: exemption from cost regulation accepted if grid-to-grid competition in transmission can be proved.Gas distribution and electricity: calculation of allowed costs largely identical. Cost of Capital: Return on equity 6.5% real (electricity) and 7.8% real (gas distribution) post trade tax; for new investment: 7.91 % nominal (electricity) and 9.21% nominal (gas distribution) post trade tax. Maximum level of accepted equity ratio for cost calculation: 40%. Corporate tax allowance to be fully included with implementation of incentive regulation. Cancellation of netting out of accumulated regulatory depreciation and re-investment. Benchmarking of network charges of “comparable” network operators.
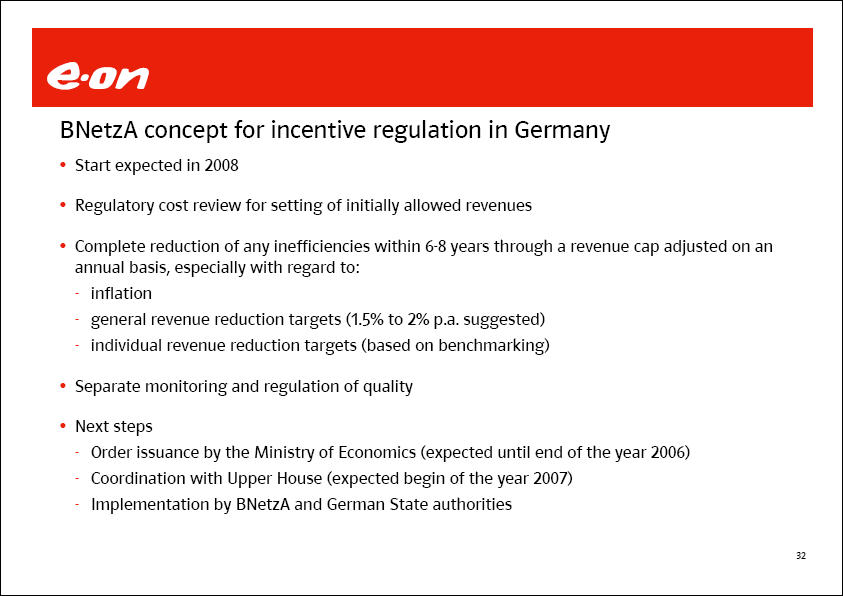
E.ON BNetzA concept for incentive regulation in Germany Start expected in 2008 Regulatory cost review for setting of initially allowed revenuesComplete reduction of any inefficiencies within 6-8 years through a revenue cap adjusted on an annual basis, especially with regard to: inflation general revenue reduction targets (1.5% to 2% p.a. suggested) individual revenue reduction targets (based on benchmarking) Separate monitoring and regulation of quality Next steps Order issuance by the Ministry of Economics (expected until end of the year 2006) Coordination with Upper House (expected begin of the year 2007) Implementation by BNetzA and German State authorities
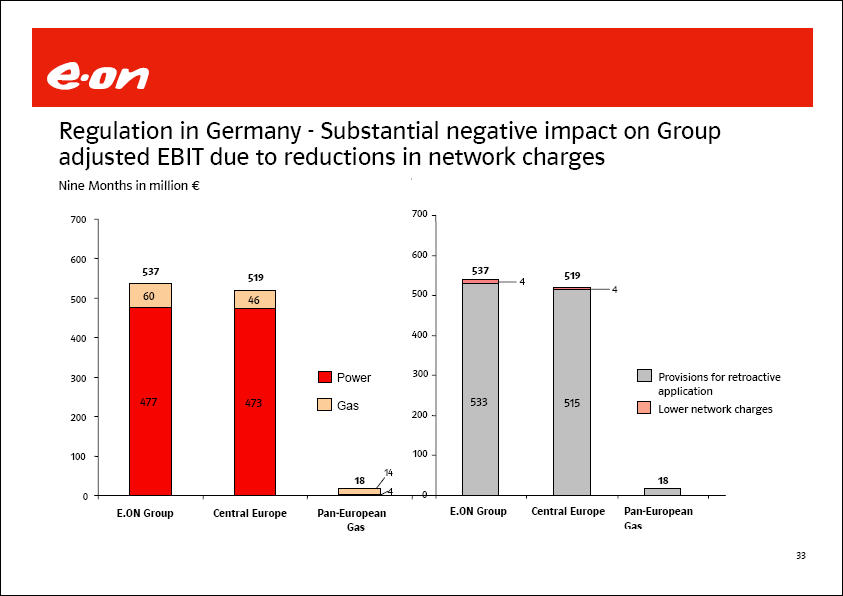
E.ON Regulation in Germany - Substantial negative impact on Group adjusted EBIT due to reductions in network charges Nine Months in million € E.ON Group 477 60 537 Central Europe 473 46 519 Pan-European 4 14 18 Power Gas 700 600 500 400 300 200 100 0 E.ON Group 533 4 537 Central Europe 515 4 519 Pan-European Gas 18 Provisions for retroactive application Lower network charges

E.ON Regulation-induced impairments on gas distribution activities Nine Months in million € 600 500 400 300 200 100 0 E.ON Group 188 359 547 Central Europe 251 251 € 227m on own networks and € 24m on other shareholdings Pan-European Gas 188 108 296 Thüga shareholdings in municipal distribution network operators Other shareholdings at Pan-European Gas EBIT-effective Non-operating
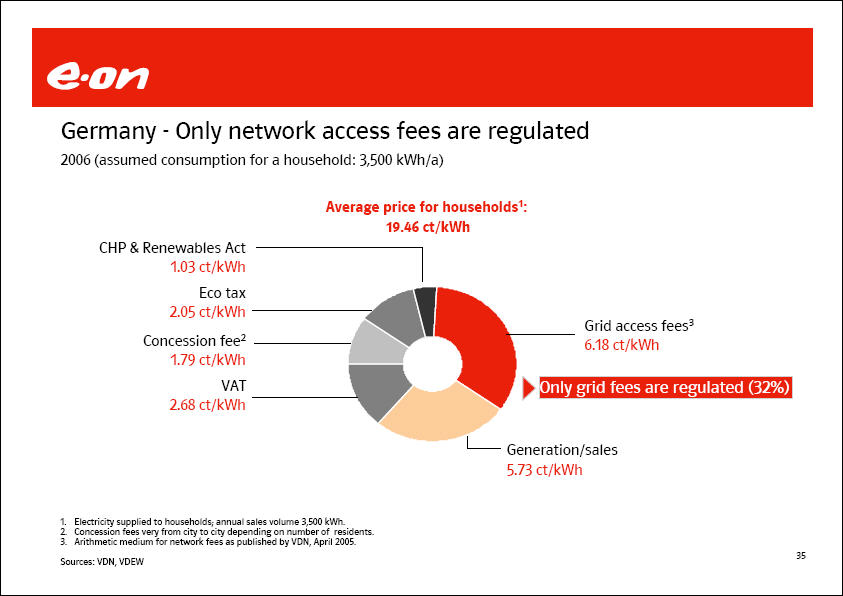
E.ON Germany - Only network access fees are regulated 2006 (assumed consumption for a household: 3,500 kWh/a) Average price for households1: 19.46 ct/kWh CHP & Renewables Act 1.03 ct/kWh Eco tax 2.05 ct/kWh Concession fee2 1.79 ct/kWh VAT 2.68 ct/kWh Generation/sales 5.73 ct/kWh Only grid fees are regulated (32%) Grid access fees3 6.18 ct/kWh 1. Electricity supplied to households; annual sales volume 3,500 kWh. 2. Concession fees very from city to city depending on number of residents. 3. Arithmetic medium for network fees as published by VDN, April 2005. Sources: VDN, VDEW
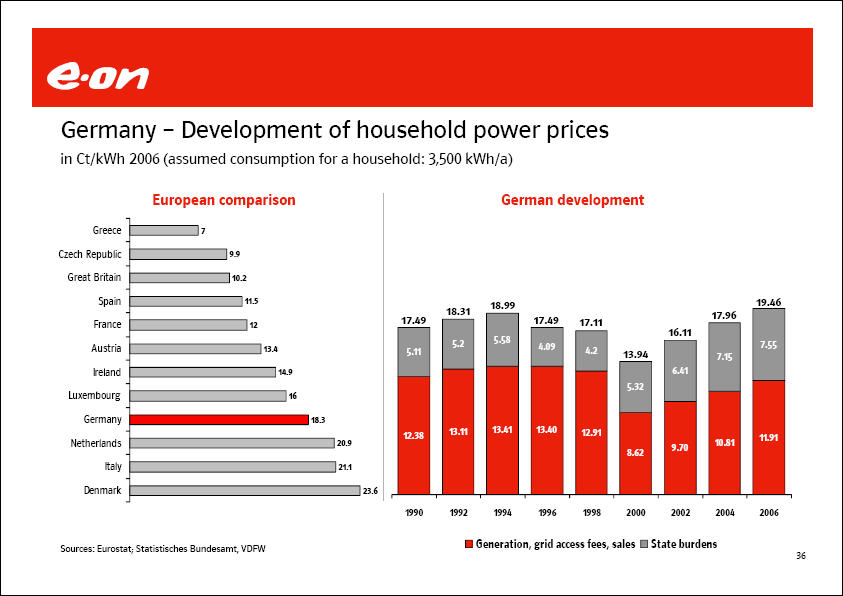
E.ON Germany-Development of household power prices in Ct/kWH 2006 (assumed consumption for a household: 3500 kWH/a European comparison Greece 7 Czech Republic 9.9 Great Britain 10.2 Spain 11.5 France 12 Austria 13.4 Ireland 14.9 Luxembourg 16 Germany 18.3 Netherlands 20.9 Italy 21.1 Denmark 23.6 German development 1990 12.38 5.11 17.49 1992 13.11 5.2 18.31 1994 13.41 5.58 18.99 1996 13.40 4.09 17.49 1998 12.91 4.2 17.11 2000 8.62 5.32 13.94 2002 9.70 6.41 16.11 2004 10.81 7.15 17.96 2006 11.91 7.55 19.46 Generation, grid access fees, sales State burdens Sources: Eurostat; Statistisches Bundesamt, VDFW
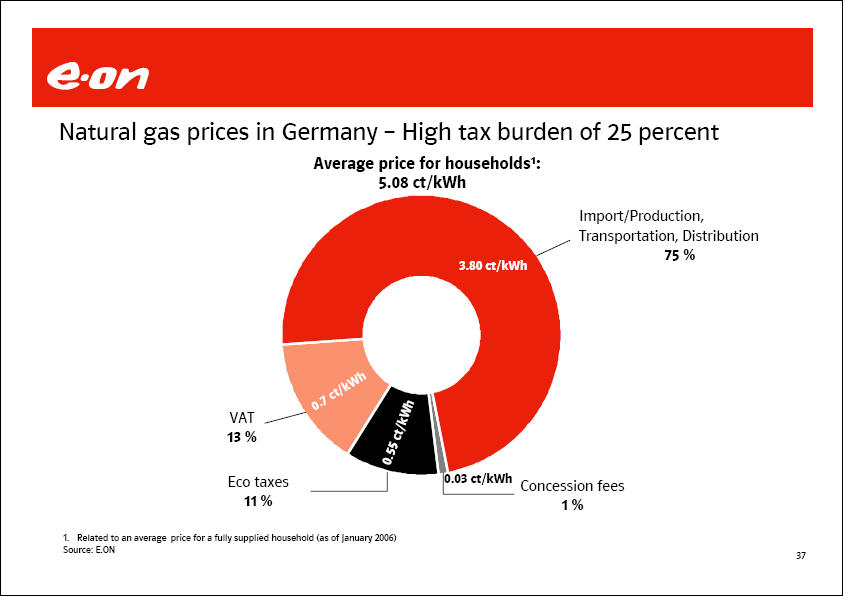
E.ON Natural gas prices in Germany - High tax burden of 25 percent Average price for households1: 5.08 ct/kWh VAT 13 % 0.7 ct/kWh Eco taxes 11 % 0.55 ct/kWh Concession fees 1 % 0.03 ct/kWh Import/Production, Transportation, Distribution 75 % 3.80 ct/kWh 1. Related to an average price for a fully supplied household (as of January 2006) Source: E.ON

E.ON Gas price adjustment Oil indexation Main competitors of natural gas are gas oil and fuel oil. Long-term contracts need an automatic indexation. Oil indexation secures competitive gas prices. Example for oil indexation : Price adjustment every 3 months; 1.1./1.4./1.7./1.10. Reference period 6 months Time lag 3 months Reference period Time lag Gas price adjustment Reference period Time lag Gas price adjustment Reference period Time lag Gas price adjustment Apr 03 May 03 Jun 03 Jul 03 Aug 03 Sep 03 Oct 03 Nov 03 Dec 03 Jan 04 Feb 04 Mar 04 Apr 04 May 04 Jun 04 Jul 04 Aug 04 Sep 04 Oct 04

E.ON For the 2005-2007 trading period, E.ON has received CO2 allowances of about 77.4 million tonnes CO2 per year UK Germany Sweden Reduction Overall 0.2% Energy sector: 21.5% Industry: increase (allocation based on projections) Overall: 0.4 % no sector specific allocation, but 0 - 7.5% due to application Overall: no reduction Energy sector: 20% (main energy source is non fossil) Industry: 0 % New Built allocation No transfer rule. New entrance reserve 18.9 mn t or 7.7% of budget allocated New built allocation to Energy sector based on BAT or BM Transfer rule from old to new installations New entrance reserve 3 mn t or 3.1% of budget New built allocation to generators based on fuel type benchmark Energy sector has to buy. New entrance reserve 1.8 mn t or 2.3% of budget Early Action & CHP no early action new CHP free early action CHP free no early action CHP reward NAP Focus Environmental delivery Security of Supply Environmental delivery
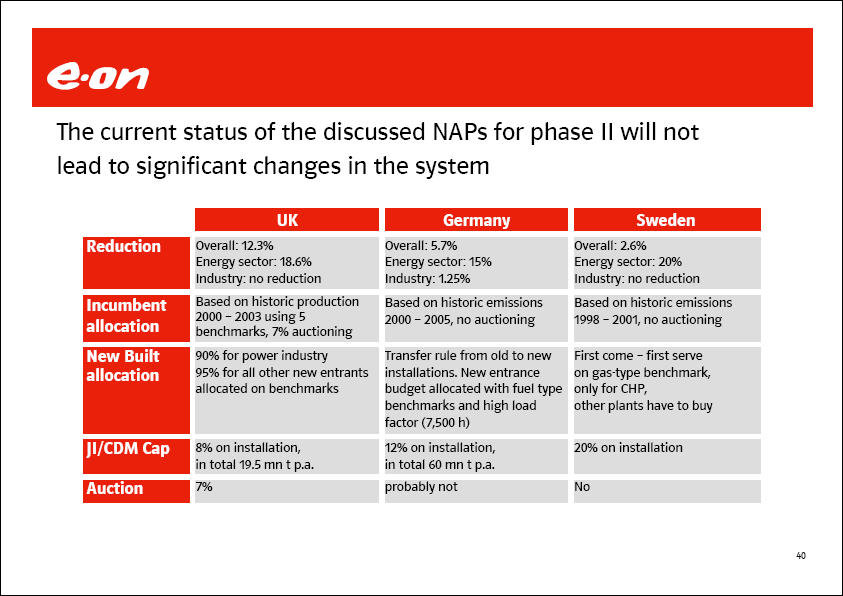
E.ON The current status of the discussed NAPs for phase II will not lead to significant changes in the system UK Germany Sweden Reduction Overall: 12.3% Energy sector: 18.6% Industry: no reduction Overall: 5.7% Energy sector: 15% Industry: 1.25% Overall: 2.6% Energy sector: 20% Industry: no reduction Incumbent allocation Based on historic production 2000 - 2003 using 5 benchmarks, 7% auctioning Based on historic emissions 2000 - 2005, no auctioning Based on historic emissions 1998 - 2001, no auctioning New Built allocation 90% for power industry 95% for all other new entrants allocated on benchmarks Transfer rule from old to new installations. New entrance budget allocated with fuel type benchmarks and high load factor (7,500 h) First come - first serve on gas-type benchmark, only for CHP, other plants have to buy JI/CDM Cap 8% on installation, in total 19.5 mn t p.a. 12% on installation, in total 60 mn t p.a. 20% on installation Auction 7% probably not No
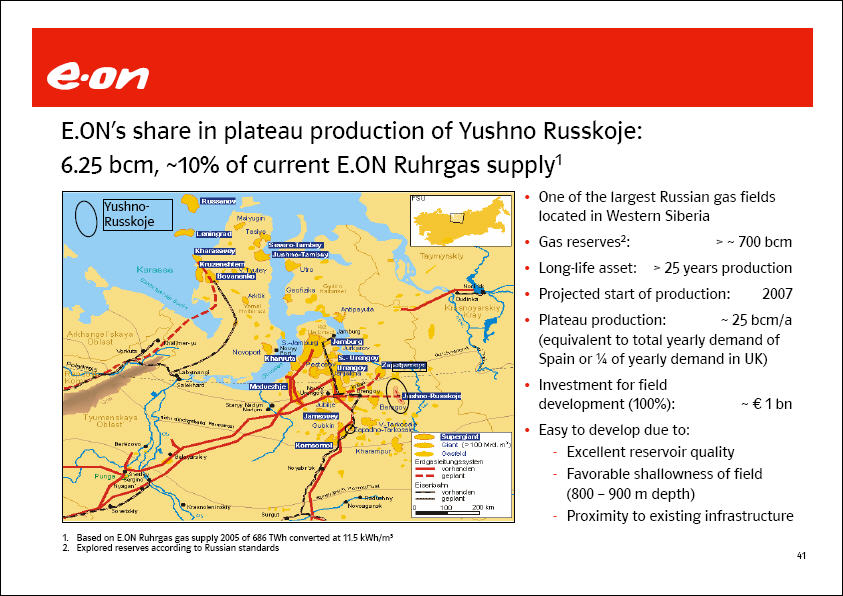
E.ON E.ON’s share in plateau production of Yushno Russkoje: 6.25 bcm, ~10% of current E.ON Ruhrgas supply1 One of the largest Russian gas fields located in Western Siberia Gas reserves2: > ~ 700 bcm Long-life asset: > 25 years production Projected start of production: 2007 Plateau production: ~ 25 bcm/a
(equivalent to total yearly demand of Spain or ¼ of yearly demand in UK) Investment for field development (100%): ~ € 1 bn Easy to develop due to: Excellent reservoir quality Favorable shallowness of field (800 - 900 m depth) Proximity to existing infrastructure 1. Based on E.ON Ruhrgas gas supply 2005 of 686 TWh converted at 11.5 kWh/m³ 2. Explored reserves according to Russian standards
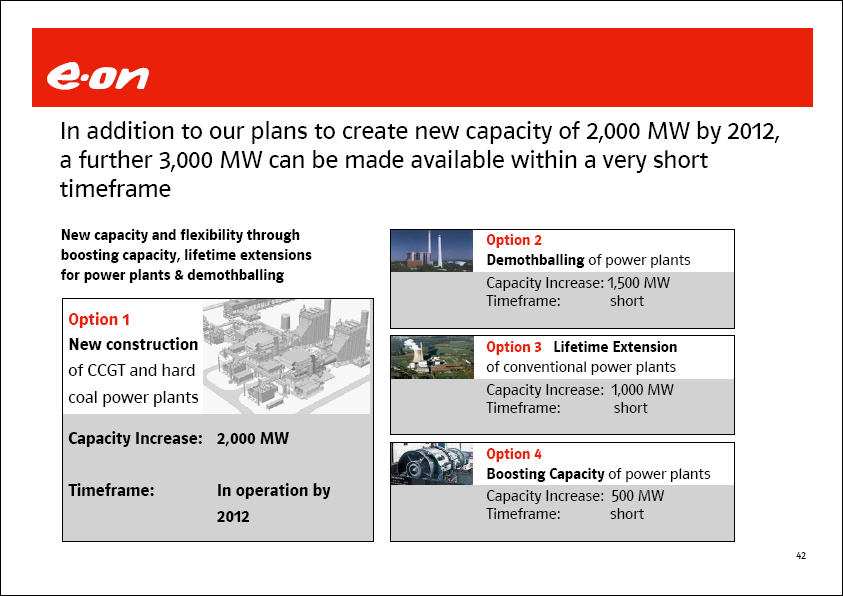
E.ON In addition to our plans to create new capacity of 2,000 MW by 2012, a further 3,000 MW can be made available within a very short timeframe New capacity and flexibility through boosting capacity, lifetime extensions for power plants & demothballing Option 1 New construction of CCGT and hard coal plants Capacity Increase: 2,000 MW Timeframe: In operation by 2012 Option 2 Demothballing of power plants Capacity Increase: 1,500 MW Timeframe: short Option 3 Lifetime Extension of conventional power plants Capacity Increase: 1,000 MW Timeframe: short Option 4 Boosting Capacity of power plants Capacity Increase: 500 MW Timeframe: short
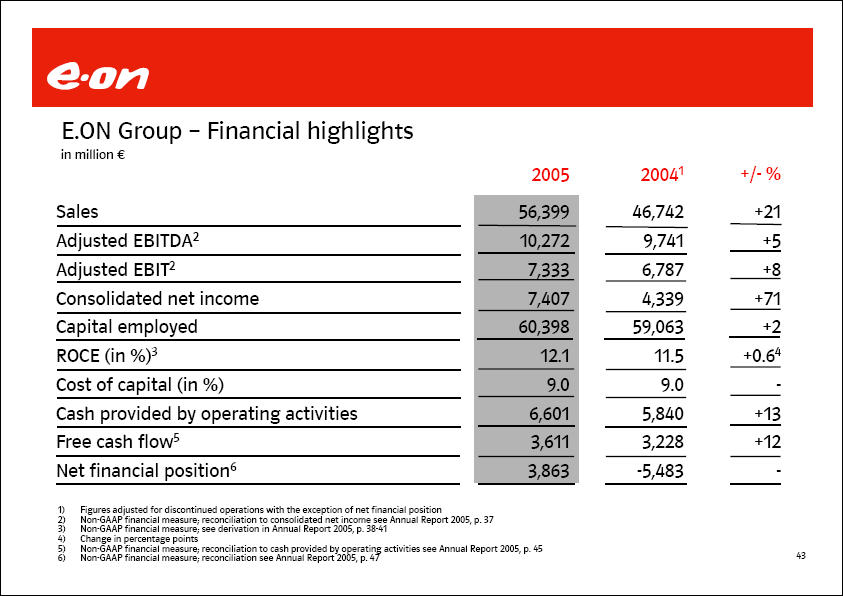
E.ON Group - Financial highlights in million € 2005 20041 +/- % Sales 56,399 46,742 +21 Adjusted EBITDA2 10,272 9,741 +5 Adjusted EBIT2 7,333 6,787 +8 Consolidated net income 7,407 4,339 +71 Capital employed 60,398 59,063 +2 ROCE (in %)3 12.1 11.5 +0.64 Cost of capital (in %) 9.0 9.0 - Cash provided by operating activities 6,601 5,840 +13 Free cash flow5 3,611 3,228 +12 Net financial position6 3,863 -5,483 - 1) Figures adjusted for discontinued operations with the exception of net financial position 2) Non-GAAP financial measure; reconciliation to consolidated net income see Annual Report 2005, p. 37 3) Non-GAAP financial measure; see derivation in Annual Report 2005, p. 38-41 4) Change in percentage points 5) Non-GAAP financial measure; reconciliation to cash provided by operating activities see Annual Report 2005, p. 45 6) Non-GAAP financial measure; reconciliation see Annual Report 2005, p. 47

E.ON Market units – Key financial figures1 2005 in million € Sales Adjusted Adjusted EBIT EBITDA Capital Employed ROCE (%) Pre-tax CoC (%) Oper. Cash-flow Value Added Central Europe 24,295 5,284 3,930 17,969 21.9 9.0 3,020 2,318 Pan-European Gas 17,914 1,939 1,536 13,355 11.5 8.2 1,999 441 U.K. 10, 176 1,550 963 12,642 7.6 9.2 101 -202 Nordic 3,471 1,193 806 7,066 11.4 9.0 746 170 U.S.Midwest 2,045 560 365 6,625 5.5 8.0 214 -166
Corporate Center -1,502 -386 -399 782 - - 521 - Core Energy Business 56,399 10,140 7,201 58,439 12.3 9.0 6,601 1,929 Other activities2 132 132 1,959 -57 E.ON Group 56,399 10,272 7,333 60,398 12.1 9.0 6,601 1,872 1. Non-GAAP financial measures; for derivation and reconciliation see Annual Report 2005, p. 80, p. 86, p. 92, p. 96, p. 98, p. 40 and p . 174. 2. This segment consists of Degussa which is accounted for using the equity method

E.ON E.ON Group - Split of gross external debt1 as of September 30, 2006, in billion € Central Europe Pan-Europea Gas U.K. Nordic U.S. Midwest Corporate Center E.ON Group Bonds 0,0 0,0 0,4 0,6 0,8 7,3 9,1 Commercial Paper 0,0 0,0 0,0 0,3 0,0 0,9 1,2 Bank Loans / others 1,3 0,6 0,2 0,5 0,0 0,1 2,7 Gross External Debt 1 1,3 0,6 0,6 1,4 0,8 8,3 13,0 Split by Market Unit 10% 5% 5% 11% 6% 64% Central Europe Pan-European Gas U.K. Nordic U.S. Midwest Corporate Center Split by Maturity 22% 27% 7% 4% 4% 36% 2006 2007 2009 2010 2011-2016 After 2016 Split by Currency2 12% 45% 15% 28% EUR GBP USD SEK 1) Non-GAAP financial measure; gross external debt equals financial liabilities to banks and third parties, see Interim Report III, p. 12 2) Before hedging

 This presentation does not constitute an invitation to sell or an offer to buy any securities or a solicitation of any vote or approval. Endesa investors and security holders are urged to read the Spanish prospectus from E.ON regarding the Spanish tender offer for Endesa because it contains important information. Furthermore, Endesa investors and security holders should read the U.S. tender offer statement from E.ON regarding the proposed U.S. tender offer for Endesa, when it becomes available, because it will contain important information. The Spanish prospectus and certain complementary documentation were authorised in Spain by the Spanish Comisión Nacional del Mercado de Valores (the “CNMV”). Likewise, a U.S. tender offer statement will be filed in the United States with the U.S. Securities and Exchange Commission (the “SEC”). Investors and security holders may obtain a free copy of the Spanish prospectus and its complementary documentation from E.ON, Endesa, the four Spanish Stock Exchanges, Santander Investment Bolsa SV SA, Santander Investment SA, Corredores de Bolsa, and elsewhere. The Spanish prospectus is also available on the websites of the CNMV (www.cnmv.es), E.ON (www.eon.com), and elsewhere. Likewise, investors and security holders may obtain a free copy of the U.S. tender offer statement, when it is available, and other documents filed by E.ON with the SEC on the SEC’s web site at www.sec.gov. The U.S. tender offer statement and these other documents may also be obtained for free from E.ON, when they become available, by directing a request to E.ON AG, External Communications, Tel.: 0211- 45 79 - 4 53. This presentation may contain forward-looking statements. Various known and unknown risks, uncertainties and other factors could lead to material differences between the actual future results, financial situation, development or performance of E.ON and Endesa and the estimates given here. These factors include the inability to obtain necessary regulatory approvals or to obtain them on acceptable terms; the inability to integrate successfully Endesa within the E.ON Group or to realize synergies from such integration; costs related to the acquisition of Endesa; the economic environment of the industries in which E.ON and Endesa operate; and other risk factors discussed in E.ON's public reports filed with the Frankfurt Stock Exchange and with the SEC (including E.ON's Annual Report on Form 20-F) and in Endesa's public reports filed with the CNMV and with the SEC (including Endesa's Annual Report on Form 20-F). E.ON assumes no liability whatsoever to update these forward-looking statements or to conform them to future events or developments. 49 |