Exhibit (a)(5)(MMM)
E.ON Investment plan 2007-2009 December 14, 2006
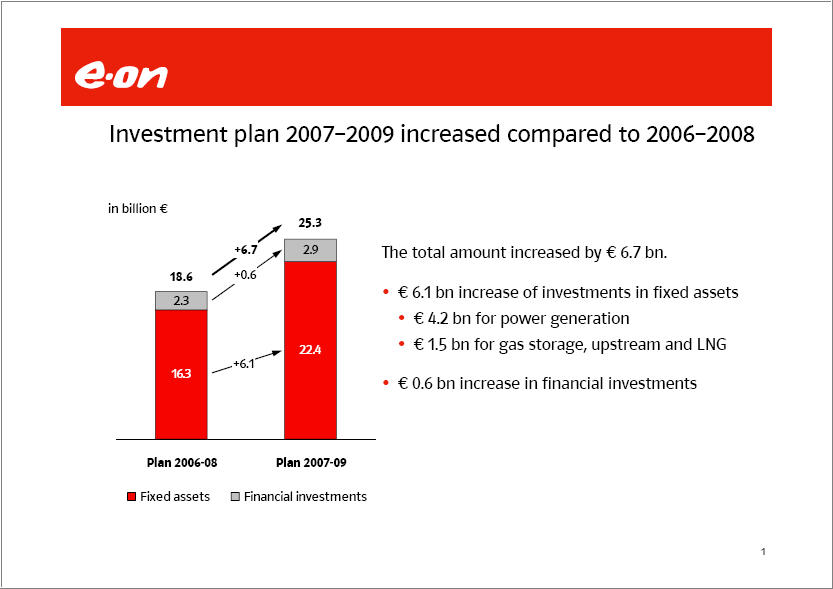
E.ON Investment plan 2007-2009 increased compared to 2006-2008 in billion € 18.6 2.3 16.3 Plan 2006-08 +6.7 +0.6 +6.1 25.3 2.9 22.4 Plan 2007-09 Fixed assets Financial investments The total amount increased by € 6.7 bn. € 6.1 bn increase of investments in fixed assets € 4.2 bn for power generation €1.5 bn for gas storage, upstream and LNG € 0.6 bn increase in financial investments
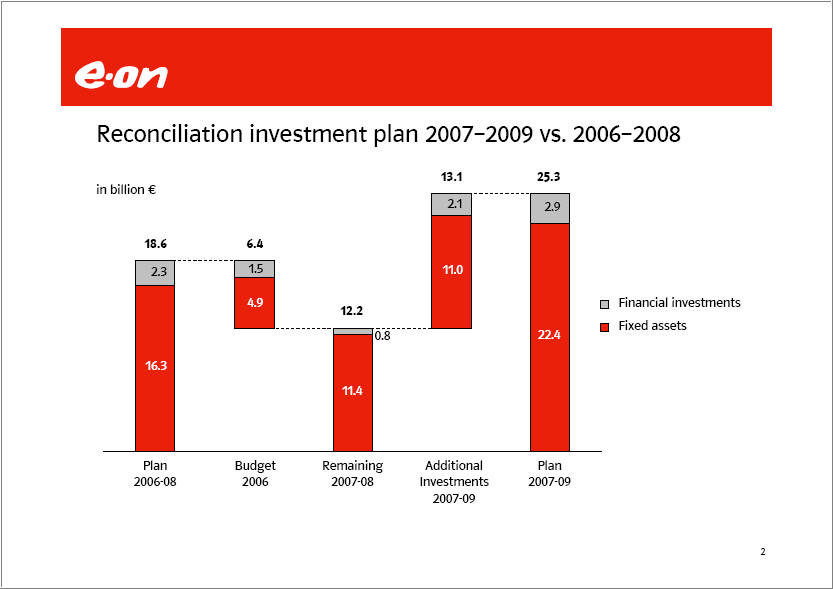
2) E.ON Reconciliation investment plan 2007-2009 vs. 2006-2008 in billion € 18.6 2.3 16.3 Plan 2006-08 6.4 1.5 4.9 Budget 2006 12.2 0.8 11.4 Remaining 2007-08 13.1 2.1 11.0 Additional Investments 2007-09 25.3 2.9 22.4 Plan 2007-09 Financial investments Fixed assets
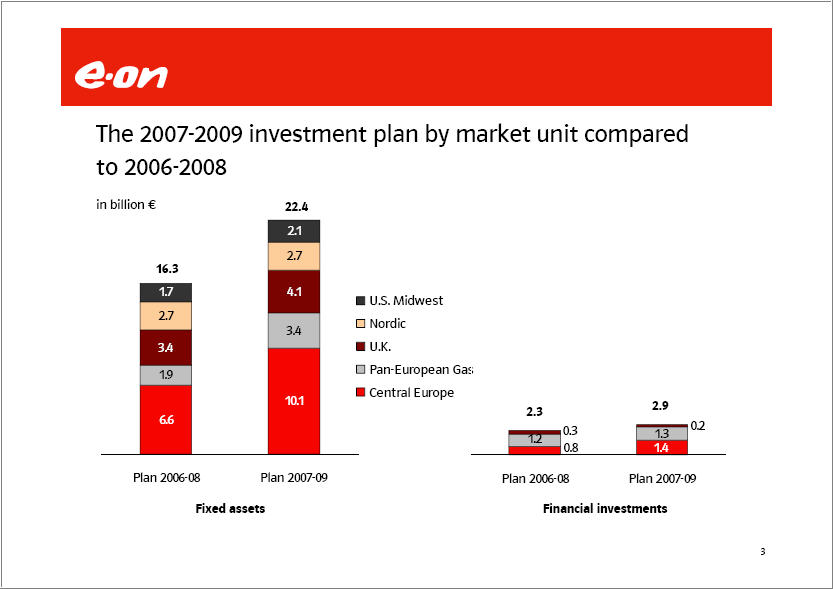
3) E.ON The 2007-2009 investment plan by market unit compared to 2006-2008 in billion € 16.3 1.7 2.7 3.4 1.9 6.6 Plan 2006-08 22.4 2.1 2.7 4.1 3.4 10.1 Plan 2007-09 Fixed assets U.S. Midwest Nordic U.K. Pan-European Gasp Central Europe 2.3 0.3 1.2 0.8 Plan 2006-08 2.9 0.2 1.3 1.4 Plan 2007-09 Fixed assets Financial investments
E.ON 2007-09 investments in power generation Major planned investments in power plants excluding renewables U.S.-Midwest Trimble County 2 Grain Kingsnorth Supercritical coal Staudinger 6 Livorno Ferraris Oskarshamn (upgrade) Malmö Maasvlakte 3 Datteln 4 Other projects Eastern Europe Gönyü 1 Irsching 5 Irsching 4 Replacement Growth 1. Site still to be decided. Fixed asset investments in power generation in billion € 7.3 Plan 2006-08 11.4 Plan 2007-09 Central Europe 6.0
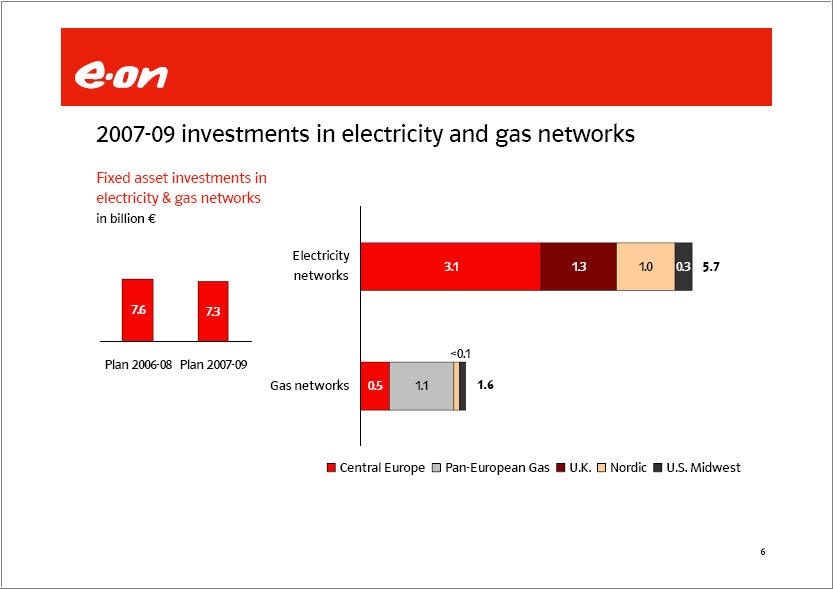
E.ON 2007-09 investments in electricity and gas networks Fixed asset investments in electricity & gas networks in billion € Electricity networks 3.1 1.3 1.0 0.3 5.7 7.6 Plan 2006-08 7.3 Plan 2007-09 Gas networks 0.5 1.1 <0.1 1.6 Central Europe Pan-European Gas U.K. Nordic U.S. Midwest
7) E.ON 2007-09 investments in gas storage, upstream & LNG Fixed asset investments in gas storage, upstream & LNG in billion € 0.9 Plan 2006-08 2.4 Plan 2007-09 0.3 2.1 Pan-European Gas U.K. Major projects in gas storage & LNG Gas pipeline Gas storage LNG terminal Nordstream Wilhelmshaven Holford Krummhörn EPE ETZEL Schnaitsee/Weitermühle RAG Krk
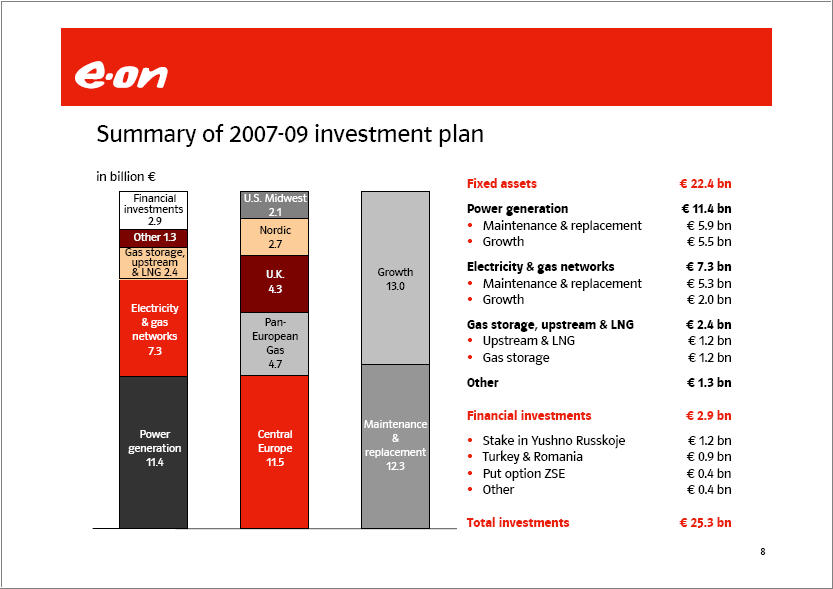
E.ON Summary of 2007-09 investment plan in billion € Financial investments 2.9 Other 1.3 Gas storage, upstream & LNG 2.4 Electricity & gas networks 7.3 Power Generation 11.4 U.S. Midwest 2.1 Nordic 2.7 U.K. 4.3 Pan-European Gas 4.7 Central Europe 11.5 Growth 13.0 Maintenance & replacement 12.3 Fixed assets € 22.4 bn Power generation €11.4 bn Maintenance & replacement € 5.9 bn Growth € 5.5 bn Electricity & as networks € 7.3 bn Maintenance & replacement € 5.3 bn Growth € 2.0 bn Gas storage, upstream & LNG € 2.4 bn Upstream & LNG €1.2 bn Gas storage €1.2 bn Other €1.3 bn Financial investments € 2.9 bn Stake in Yushno Russkoje €1.2 bn Turkey & Romania € 0.9 bn Put option ZSE € 0.4 bn Other € 0.4 bn Total investments € 25.3 bn
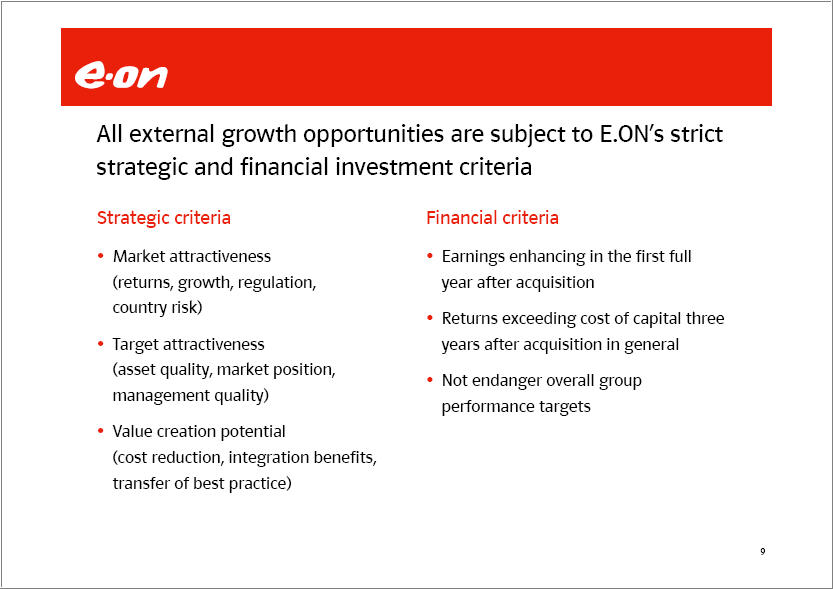
E.ON All external growth opportunities are subject to E.ON's strict strategic and financial investment criteria Strategic criteria Market attractiveness (returns, growth, regulation, country risk) Target attractiveness (asset quality, market position, management quality) Value creation potential (cost reduction, integration benefits, transfer of best practice) Financial criteria Earnings enhancing in the first full year after acquisition Returns exceeding cost of capital three years after acquisition in general Not endanger overall group performance targets
back-up charts
E.ON 2007-2009 fixed asset investments in Germany Electricity networks € 2.2 bn Gas networks €1.3 bn Renewables € 0.2 bn Gas storage & LNG €0.8 bn Other € 0.7 bn Power generation excluding renewables € 3.5 bn Total € 8.7 bn
EP•on 2007-2009 fixed asset investments in renewables by market unit Nordic €0.1 bn Central Europe € 0.2 bn U.K. €0.6bn Total € 0.9 bn
 This presentation does not constitute an invitation to sell or an offer to buy any securities or a solicitation of any vote or approval. Endesa investors and security holders are urged to read the Spanish prospectus from E.ON regarding the Spanish tender offer for Endesa because it contains important information. Furthermore, Endesa investors and security holders should read the U.S. tender offer statement from E.ON regarding the proposed U.S. tender offer for Endesa, when it becomes available, because it will contain important information. The Spanish prospectus and certain complementary documentation were authorised in Spain by the Spanish Comisión Nacional del Mercado de Valores (the "CNMV"). Likewise, a U.S. tender offer statement will be filed in the United States with the U.S. Securities and Exchange Commission (the "SEC"). Investors and security holders may obtain a free copy of the Spanish prospectus and its complementary documentation from E.ON, Endesa, the four Spanish Stock Exchanges, Santander Investment Bolsa SV SA, Santander Investment SA, Corredores de Bolsa, and elsewhere. The Spanish prospectus is also available on the websites of the CNMV (www.cnmv.es), E.ON (www.eon.com), and elsewhere. Likewise, investors and security holders may obtain a free copy of the U.S. tender offer statement, when it is available, and other documents filed by E.ON with the SEC on the SEC's web site at www.sec.gov. The U.S. tender offer statement and these other documents may also be obtained for free from E.ON, when they become available, by directing a request to E.ON AG, External Communications, Tel.: 0211- 45 79 - 4 53. This presentation may contain forward-looking statements. Various known and unknown risks, uncertainties and other factors could lead to material differences between the actual future results, financial situation, development or performance of E.ON and Endesa and the estimates given here. These factors include the inability to obtain necessary regulatory approvals or to obtain them on acceptable terms; the inability to integrate successfully Endesa within the E.ON Group or to realize synergies from such integration; costs related to the acquisition of Endesa; the economic environment of the industries in which E.ON and Endesa operate; and other risk factors discussed in E.ON's public reports filed with the Frankfurt Stock Exchange and with the SEC (including E.ON's Annual Report on Form 20-F) and in Endesa's public reports filed with the CNMV and with the SEC (including Endesa's Annual Report on Form 20-F). E.ON assumes no liability whatsoever to update these forward-looking statements or to conform them to future events or developments. E.ON currently prepares its consolidated financial statements in accordance with generally accepted accounting principles in the United States ("U.S. GAAP"), but will adopt International Financial Reporting Standards ("IFRS") as its primary set of accounting principles in 2007; the financial data reflected in this presentation has been prepared in accordance with IFRS. This presentation may contain references to certain financial measures (including forward looking measures) that are not calculated in accordance with either IFRS or U.S. GAAP and are therefore considered "Non-GAAP financial measures" within the meaning of the U.S. federal securities laws. E.ON presents a reconciliation of these Non-GAAP financial Measures to the most comparable US-GAAP measure or target, either in this presentation or on its website at www.eon.com. Management believes that the Non-GAAP financial measures used by E.ON., when considered in conjunction with (but not in lieu of) other measures that are computed in accordance with IFRS or U.S. GAAP. enhance an understanding of E.ON's results of operations. A number of these Non-GAAP financial measures are also commonly used by securities analysts, credit rating agencies and investors to evaluate and compare the periodic and future operating performance and value of E.ON and other companies with which E.ON competes. These Non-GAAP financial measures should not be considered in isolation as a measure of E.ON's profitability or liquidity, and should be considered in addition to, rather than as a substitute for, net income, cash provided by operating activities and the other income or cash flow data prepared in accordance with IFRS or U.S. GAAP. The Non-GAAP financial measures used by E.ON may differ from, and not be comparable to, similarly-titled measures used by other companies. 13 |
