SECURITIES AND EXCHANGE COMMISSION
Washington, D.C. 20549
SCHEDULE 14D-9
SOLICITATION/RECOMMENDATION STATEMENT UNDER
SECTION 14(D)(4) OF THE SECURITIES EXCHANGE ACT OF 1934
ENDESA, S.A.
(Name of Subject Company)
ENDESA, S.A.
(Name of Person(s) Filing Statement)
Ordinary shares, nominal value €1.20 each
American Depositary Shares, each representing the right to receive one ordinary share
(Title of Class of Securities)
00029274F1
(CUSIP Number of Class of Securities)
Álvaro Pérez de Lema
Authorized Representative of Endesa, S.A.
410 Park Avenue, Suite 410
New York, NY 10022
(212) 750-7200
(Name, Address and Telephone Number of Person Authorized to Receive Notices
and Communications on Behalf of the Person(s) Filing Statement)
With a Copy to:
Sullivan & Cromwell LLP
125 Broad Street
New York, New York 10004
1 (212) 558-4000
x Check the box if the filing relates solely to preliminary communications made before the commencement of a tender offer.
IMPORTANT LEGAL INFORMATION
The following document was made available to shareholders of Endesa, S.A. (the "Company" or "Endesa") on November 16th , 2005. Endesa shareholders are urged to read Endesa’s Solicitation/Recommendation Statement on Schedule 14D-9 when it is filed by the Company with the U.S. Securities and Exchange Commission (the "SEC"), as it will contain important information. The Solicitation/Recommendation Statement and other public filings made from time to time by the Company with the SEC are available without charge from the SEC's website at www.sec.gov and at the Company’s principal executive offices in Madrid, Spain.
Statements in this document other than factual or historical information are “forward-looking statements” within the meaning of the U.S. Private Securities Litigation Reform Act of 1995. Forward-looking statements regarding Endesa’s anticipated financial and operating results and statistics are not guarantees of future performance and are subject to material risks, uncertainties, changes and other factors which may be beyond Endesa’s control or may be difficult to predict.
Forward-looking statements could include, but are not limited to, statements regarding: (1) estimated future earnings; (2) anticipated increases in wind and CCGTs generation and market share; (3) expected increases in demand for gas and gas sourcing; (4) management strategy and goals; (5) estimated cost reductions and increased efficiency; (6) anticipated developments affecting tariffs, pricing structures and other regulatory matters; (7) anticipated growth in Italy, France and elsewhere in Europe; (8) estimated capital expenditures and other investments; (9) expected asset disposals; (10) estimated increases in capacity and output and changes in capacity mix; (11) repowering of capacity; and (12) macroeconomic conditions. For all of these-forward looking statements, Endesa claims the protection of the safe harbor for forward-looking statements contained in the U.S. Private Securities Litigation Reform Act of 1995. Endesa disclaims any obligation to revise or update any forward-looking statements in this document.
The following important factors, in addition to those discussed elsewhere in this document, could cause actual financial and operating results and statistics to differ materially from those expressed in our forward-looking statements:
| · | Economic and Industry Conditions: materially adverse changes in economic or industry conditions generally or in our markets; the effect of existing regulations and regulatory changes; tariff reductions; the impact of any fluctuations in interest rates; the impact of fluctuations in exchange rates; natural disasters; the impact of more stringent environmental regulations and the inherent environmental risks relating to our business operations; and the potential liabilities relating to our nuclear facilities. |
| · | Transaction or Commercial Factors: any delays in or failure to obtain necessary regulatory, antitrust and other approvals for our proposed acquisitions or asset disposals, or any conditions imposed in connection with such approvals; our ability to integrate acquired businesses successfully; the challenges inherent in diverting management's focus and resources from other strategic opportunities and from operational matters during the process of integrating acquired businesses; the outcome of any negotiations with partners and governments; any delays in or failure to obtain necessary regulatory approvals (including environmental) to construct new facilities or repower or enhance our existing facilities; shortages or changes in the price of equipment, materials or labor; opposition of political and ethnic groups; adverse changes in the political and regulatory environment in the countries where we and our related companies operate; adverse weather conditions, which may delay the completion of power plants or substations, or natural disasters, accidents or other unforeseen events; and the inability to obtain financing at rates that are satisfactory to us. |
| · | Political/Governmental Factors: political conditions in Latin America and changes in Spanish, European and foreign laws, regulations and taxes. |
| · | Operating Factors: technical difficulties; changes in operating conditions and costs; the ability to implement cost reduction plans; the ability to maintain a stable supply of coal, fuel and gas and the impact of fluctuations on fuel and gas prices; acquisitions or restructurings; and the ability to implement an international and diversification strategy successfully. |
| · | Competitive Factors: the actions of competitors; changes in competition and pricing environments; the entry of new competitors in our markets. |

Results
JANUARY - SEPTEMBER 2005
2
ENDESA reports a 32.8% increase in net income in the first nine months of 2005 to Euro 1,556 million.
All the electricity related businesses of the Company have generated excellent results
| The net income for the first nine months, which does not include proceeds from the sale of the stake in Auna, is an unprecedented result. The Euro 1,556 million achieved exceeds the best full-year results recorded by the Company. |
| 24.4% growth in net income in Spain and Portugal in a difficult environment. |
| High growth in net income in the European (+102.1%) and Latin American business (+70.6%). |
| Significant growth in total EBITDA (+15.9%) and EBIT (+19.4%). |
| European and Latin American business have contributed 46% of total EBITDA, reflecting ENDESA's international footprint. |
| Double-digit growth in all major P&L items. |
ENDESA’s results confirm the feasibility and strength of the commitments presented in the Strategic Plan (“ENDESA: stronger business, greater value”)
| 2005 net income and EBITDA expected to exceed long-term growth estimates provided to the market. |
| Year-end leverage ratio will also exceed ENDESA’s target. |
| Successful divestiture of Auna, with Euro 1,060 million in net capital gains, ensures meeting dividend targets. |
3
| CONTENTS | |
Key facts and figures for January-September 2005 04 | |
Consolidated results 11 | |
Progress with the Strategic Plan 20 | |
Results by business line 22 | |
Electricity business in Spain and Portugal 23 | |
Electricity business in Europe 35 | |
Electricity business in Latin America 40 | |
Accounting Criteria 47 | |
Statistical appendix 49 |
4
| KEY FACTS AND FIGURES |
| FOR JANUARY-SEPTEMBER 2005 |
5
STRONG GROWTH IN NET INCOME IN ALL OF ENDESA’S BUSINESSES
¾ In the first nine months of 2005, the Spanish and Portuguese business posted an increase of 24.4% in net income to Euro 1,051 million.
¾ Net income from the business in Europe rose 102.1% to Euro 283 million.
¾ Net income from the business in Latin America was Euro 186 million, an increase of 70.6% versus the first nine months in 2004.
DOUBLE DIGIT GROWTH IN ALL MAJOR P&L ITEMS
¾ The gross margin advanced 16.2% to Euro 6,498 million.
¾ Gross operating profit ( EBITDA) rose by 15.9% to Euro 4,399 million.
¾ Operating profit (EBIT) grew 19.4% to Euro 3,106 million.
¾ Cash flow from operations amounted to Euro 2,929 million, 16.3% higher than in January-September 2004.
RESULTS EXCEED STRATEGIC PLAN PRESENTED TO THE MARKET
¾ Growth in net income for 2005, even excluding the Auna divestiture, is expected to range from 15 to 35%.
¾ Growth achieved exceeds commitment of 12% net income growth presented in the Strategic Plan on the 3rd of October (“ENDESA: stronger business, greater value”).
¾ Including the Auna divestiture, net income for 2005 will grow more than 100% vs. 2004.
¾ Growth in EBITDA for 2005 is expected to range from 20 to 27% and will thus exceed ENDESA’s target, as outlined in the aforementioned Strategic Plan, which is between 10 and 11%.
¾ The increase in net income and capital gains derived from the Auna divestiture (Euro 1,060 million net of taxes) will provide ENDESA significant progress in meeting its target of distributing Euro 7 billion in dividends over the next 5 years.
CONTINUED IMPROVEMENT IN FINANCIAL LEVERAGE
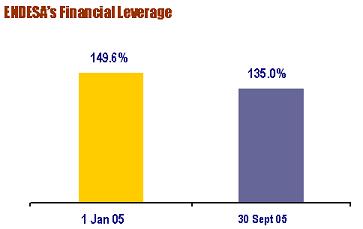
¾ Financial leverage stood at 135.0% at the end of the third quarter, down from 149.6% at the beginning of the year.
6
¾ Leverage as of third quarter 2005 exceeds our target in the Strategic Plan presented to the market by 5 percent.
¾ The estimated debt for year-end is approximately Euro 18 billion, clearly below the 18.698 billion figure at the beginning of the year.
¾ In the first nine months of the year all business lines have generated cash flows that exceeded their respective investment needs
ELECTRICITY BUSINESS IN SPAIN AND PORTUGAL
Solid performance despite a severe drought, high fuel costs and a deficit in allocation of CO2 rights
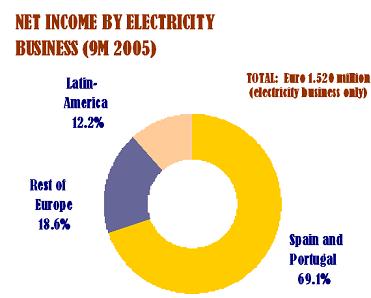
¾ Net income from the electricity business in Spain and Portugal increased by 24.4% and accounted for 67.5% of ENDESA’s total net income.
¾ EBITDA from this business grew by 6.3% and EBIT by 12.9%.
¾ Reduction in third quarter 2005 fixed costs (by 3% vs. 3Q 2004 and 6.3% vs. 2Q 2005) in line with the targets set out in ENDESA's Efficiency Plan.
¾ The effects of the drought and the rise in fuel costs have not affected ENDESA as much as its peers due to a more balanced generation mix.
¾ In the first nine months of 2005, ENDESA has achieved fuel unit costs for mainland generation in ordinary regime of €16.2/MWh, 24.7% below the rest of the industry.
Largest generator and top selling power company in Spain
¾ ENDESA continues to be the leading Spanish power company, with the largest share of the total generation market and total electricity sales.
¾ Met 93% of its Spanish demand from its own output, a balance that gives it a clear competitive advantage over its rivals owing to its lower exposure to fluctuations in rainfall and wholesale prices.
¾ ENDESA’s mainland coal-fired plants achieved a 86.9% load factor in the first nine months of 2005, contributing significantly to the ensure supply in the Spanish electricity system.
¾ CO2 emission rights deficit in January-September 2005 amounted to Euro 131 million, or 5.9 million tonnes.
Continued improvement in quality of supply
7
¾ ENDESA’s SAIDI (system average interruption duration index), the indicator normally used to measure the continuity of supply, improved by 16% between January and September 2005 in the markets supplied by the Company.
¾ Noteworthy was the improvement in the SAIDI for its operations in Andalusia and Catalonia, with a decrease of SAIDI of 19% compared to 2004.
Spain’s utility with the highest investment levels
¾ ENDESA invested Euro 1,746 million in Spain and Portugal through September 2005, of which Euro 1,484 million (85.0%) was capex. ENDESA is the Spanish electricity company that undertakes the most investments.
¾ Euro 904 million of capex was used for upgrading electricity distribution facilities to increase quality and security of supply, in line with the expected new remuneration methodology for this activity, which accounts for the investment made by each company.
¾ The first 350 MW unit converted to imported coal at ENDESA’s power plant in As Pontes (A Coruña) was connected to the grid in the third quarter. Regarding the construction of an 800 MW CCGT at the same facility - As Pontes - work is being done under the expected schedule. The 400 MW Cristóbal Colón CCGT in Huelva is expected to start trial operations by year-end.
¾ ENDESA has acquired Portuguese renewable company FINERGE, which owns 60 MW in operation and different wind farms under construction.
¾ After this acquisition, ENDESA currently has new wind farms adding up to 305 MW under construction in the Iberian Mainland, of which 52 MW are scheduled to come on stream before the end of the year.
Relevant competitor in natural gas industry, with a 12% market share
¾ ENDESA sold a total of 16,080 GWh in the Spanish natural gas market during the first nine months of 2005, which along with a self consumption of 16,637 GWh for its generation, is equivalent to a total market share of 11.9%, thereby practically achieving the 2007 target of 12%, as outlined in the Strategic Plan.
¾ This figure validates ENDESA as a relevant competitor in the Spanish natural gas market.
¾ ENDESA has reached an agreement with EDP for the sale of its 49% stake (held through Endesa Gas) in the Portuguese company NQF Gas, for Euro 56.5 million.
This business line is expected to show strong growth EBITDA in 2005
8
¾ Estimated EBITDA for Spain & Portugal will range from Euro 2,800 million to Euro 3,150 million by year-end 2005, implying a 13% to 27% increase vs. 2004.
ELECTRICITY BUSINESS IN EUROPE
Sharp increases in main income statement lines
¾ Net income from the electricity business in Europe increased by 102.1% and accounted for 18.2% of ENDESA’s total net income in January-September 2005.
¾ EBITDA was Euro 702 million, up 68.8% on January-September 2004, while EBIT rose by 62.0% to Euro 515 million.
Debt reduced by Euro 643 million
¾ Net debt for ENDESA’s electricity business in the rest of Europe stood at Euro 1,480 million as of 30 September 2005, compared to Euro 2,123 million at the beginning of the year - a reduction of Euro 643 million, or 30.3%.
Strong growth in Endesa Italia’s financial and operating figures.
¾ EBITDA from Endesa Italia was Euro 561 million, 35.8% higher than in the first nine months of 2004, while EBIT stood at Euro 456 million, a 40.7% increase.
¾ The Company’s installed capacity has increased by 11% in the first nine months of this year, generation has increased by 9.2% and sales by 18.2%.
¾ The Company has continued developing its thermal “repowering” program. Year to date, it has finalized Ostiglia’s group 3 conversion to CCGT and has initiated trial phase operations in Tavazzano’s group 6, also converted into CCGT, and which is expected to be fully operational by the fourth quarter.
¾ ENDESA and the Italian group Merloni have signed an agreement under which the Company will acquire 51% of the Italian company MF Power, owner of three wind farms with a total capacity of 60 MW.
Snet: Good results, progress in Industrial Plan and dividend payment
¾ ENDESA has continued to unlock the value of its shareholding in Snet: in the third quarter of 2005 it sold its stake in power generator Séchilienne-Sidec for Euro 104 million and paid shareholders an interim dividend of Euro 21 million.
¾ The French generation company has contributed Euro 136 million of EBITDA and Euro 54 million of EBIT to the Company's European business.
¾ The Company has improved its efficiency ratio by 7% (measured by number of employees per installed MW).
9
In the privatization process of the Polish electricity company Dolna Odra, ENDESA was selected for exclusive negotiations
¾ ENDESA will be in exclusive negotiations over the coming weeks with the Polish government in regards to the privatisation of the 1,960 MW generation company Dolna Odra (Poland)
This business line is expected to show strong growth in EBITDA in 2005
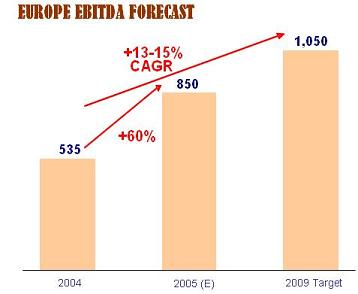
¾ Europe’s EBITDA is estimated to be around Euro 850 million by year-end 2005, a 60% increase vs. 2004.
ELECTRICITY BUSINESS IN LATIN AMERICA
Leveraging economic recovery: net income up 70.6% and double digit growth in EBITDA and EBIT
¾ ENDESA’s Latin American operations recorded a 70.6% increase in net income in the first nine months of 2005, contributing 12.0% to the Company’s total net income.
¾ EBITDA grew 15.6% compared to January-September 2004 and EBIT by 14.8%.
¾ Both EBITDA and EBIT have grown in generation and transmission, as well as in distribution businesses.
Growth in operating figures and significant operational improvements
¾ ENDESA’s companies in Latin America were able to leverage on the economic recovery and organic growth in these markets, raising output and sales by 5.4% and 5.5%, respectively.
¾ Generation margin stands at 20.6 US$/MWh, and Distribution VAD at 27.9 US$/MWh, increasing by 11% and 20% respectively, versus January-September 2004.
Cash returns in line with ENDESA’s Strategic Plan’s targets
¾ Cash returns of ENDESA’s Latin American business have totalled US$ 209.7 million during the first nine months of this year; of these US$ 53.2 million correspond to dividends and US$ 156.5 million to capital reductions.
Good performance of Enersis and Endesa Chile in the financial markets
10
¾ Enersis and Endesa Chile’s share price has increased by 34% and 63% respectively in the New York Stock Exchange during the first nine months of the year, and they are still under review for a possible improvement in their credit rating.
Regulatory progress
| ¾ | Throughout the first nine months of 2005 there has been an improvement in the regulatory framework in the Latin American countries where the companies, in which ENDESA owns an interest, operate, contributing to the development of an environment more conducive to higher profitability and growth. |
Streamlining the organisational structure
¾ ENDESA set up Endesa Brasil, S.A. in the third quarter, which will act as the holding company for the Group’s shareholdings in Brazil.
¾ Merger of Chilean companies, Chilectra and Edesur has been agreed within the framework of the project for the optimisation of organisational structure.
Development of new capacity
¾ Endesa Chile has signed the EPC contract to build a 377 MW San Isidro II CCGT and has started construction of the 32 MW Palmucho hydro facilities.
Business line expected to show strong growth in estimated EBITDA as of year-end 2005
¾ Latin American’s EBITDA is estimated to reach approximately Euro 1,750 million by year-end 2005, implying a 15% increase vs. 2004.
TELECOMS
Sale of the Auna and Smartcom stakes
¾ On November 8th, ENDESA and its partners in Auna completed the sale of 80% of the Telecom operator to France Telecom Spain, transaction that had been agreed in July 2005. With this sale, ENDESA has obtained net capital gains of Euro 1,060 million.
¾ In August, ENDESA also sold 100% of its Chilean mobile telephony subsidiary, Smartcom SA, to Mexican operator América Móvil for US$ 505 million, obtaining a net gain of Euro 51 million.
11
CONSOLIDATED RESULTS |
12
High growth in net income: +32.8%
ENDESA reported net income of Euro 1,556 million in the first nine months of 2005, a rise of 32.8% compared to the same period in 2004.
NET INCOME | |||||||||||||
| (Euro Million) | Jan-Sep 05 | % Chg vs Jan- Sep 04 | % of total Net Income Jan-Sep 04 | % of total Net Income Jan-Sep05 | |||||||||
| Spain and Portugal | 1,051 | 24.4 | 72.1 | 67.5 | |||||||||
| Rest of Europe | 283 | 102.1 | 11.9 | 18.2 | |||||||||
| Latin America | 186 | 70.6 | 9.3 | 12.0 | |||||||||
| Other businesses | 36 | (53.9 | ) | 6.7 | 2.3 | ||||||||
TOTAL | 1,556 | 32.8 | 100.0 | 100.0 | |||||||||
All the company's electricity businesses recorded strong growth in net income, with increases of 24.4% for Spain and Portugal, 102.1% for Europe and 70.6% for Latin America.
The distribution of net income between the different electricity businesses is balanced, confirming the economic logic behind the company’s geographical diversification strategy and current international footprint.
January-September 2005 results assume the recovery of the amounts contributed to finance the tariff deficit in Spain, estimated at Euro 2,500 million, of which Euro 1,104 million corresponds to ENDESA.
13
The Company has booked this amount following the same accounting criteria as the other companies in the industry. Not considering the deficit as revenue, ENDESA’s net income would be Euro 838 million, 28.5% less than in January-September 2004.
Companies financing the regulated activities tariff deficit are entitled to a full recognition, as it is reflected in ENDESA’s accounts. However, for the purpose of reflecting sensitivities to ENDESA’s results to other deficit recognition assumptions, and without meaning that it would imply any resignation of the right to the full recover of the deficit, it is worth noting that even if legislation establishes at Euro 36/MWh the remuneration to the hydro and nuclear power production, with the consequent effect on purchases at the “pool” done by the supply business, (hypothesis considered in ENDESA’s strategic plan “ENDESA: Stronger business, greater value” released on 3 October 2005), the Company’s total net income would be Euro 1,377 million, up 18% vs. the same period last year.
Strong growth in generation (+5.4%) and electricity sales (+13.8%)
The rise in net income was driven by strong growth in generation (+5.4%) and total electricity sales (+13.8%). This increase was particularly strong in ENDESA’s non-Spanish operations.
ELECTRICITY PRODUCTION AND SALES | |||||||||||||
| Production | Sales | ||||||||||||
| GWh | % chg. vs. Jan- Sep04 | GWh | % chg. vs. Jan-Sep04 | ||||||||||
| Spain and Portugal | 69,769 | (3.6 | ) | 75,381 | 3.7 | ||||||||
| Rest of Europe | 24,410 | 43.4 | 34,314 | 64.6 | |||||||||
| Latin America | 42,870 | 5.4 | 41,033 | 5.5 | |||||||||
TOTAL | 137,049 | 5.4 | 150,728 | 13.8 | |||||||||
The fall in generation in Spain and Portugal was due to the temporary shutdown of some plants in the second and third quarters, mainly as a result of inspection, maintenance and/or reconversion work.
In addition, strong growth in generation in Europe (+43.4%) was largely due to a 9.2% increase in generation at Endesa Italia, which reflects that its repowering programme is nearing completion, plus the contribution from ENDESA’s French subsidiary Snet, which in the period January-September 2004 only contributed for that month as it was not fully consolidated in ENDESA until 1st September 2004.
Finally, in Latin America the growth in generation (+5.4%) was due to a higher utilisation rate in order to meet rising demand, along with contributions from the Ralco hydro plant in Chile and the newly converted open cycle gas generator at Etevensa in Peru, both of which came on stream towards the end of last year.
Generation/sales balance
ENDESA has generated 91% of all its electricity sales in the first nine months of 2005. This balanced situation between production and demand should considerably reduce risk in its electricity business. This is a significant competitive advantage in the Spanish market, where ENDESA generated 93% of the electricity it sold in the first nine months of 2005.
14

Active management of the generation/sales balance reduces the Company's strategic exposure to fluctuations in wholesale prices, particularly important at times of high prices as at present.
Revenues growth outstrips costs
Total sales amounted to Euro 12,643 million in the first nine months of 2005 up 26.8% compared to the same period in 2004.
15
One should note that the electricity business in Spain and Portugal’s sales include sales from Spain and Portugal to other EU markets.
The increase in sales was greater in economic than in operating terms, as prices were raised to offset the increase in costs.
Growth in revenues covered both fuel costs, which were up by 29.6% during the first nine months of this year compared to the period Jan-Sep 2004 and the cost of CO2 emission rights.
Significant growth in gross margin, EBITDA and EBIT
As revenues grew ahead of costs, the Company reported significant rises in gross margin (+16.2%), EBITDA (+15.9%) and EBIT (+19.4%).
Gross margin | EBITDA | EBIT | |||||||||||||||||
| (Euro million) | Jan-Sep 05 | % chg. vs. Jan-Sep 04 | Jan-Sep 05 | % chg. vs. Jan-Sep 04 | Jan-Sep 05 | % chg. vs. Jan- Sep 04 | |||||||||||||
| Spain and Portugal | 3,659 | 6.6 | 2,380 | 6.3 | 1,634 | 12.9 | |||||||||||||
| Rest of Europe | 944 | 70.4 | 702 | 68.8 | 515 | 62.0 | |||||||||||||
| Latin America | 1,893 | 18.2 | 1,323 | 15.6 | 964 | 14.8 | |||||||||||||
| Other businesses | 2 | N/A | (6 | ) | N/A | (7 | ) | N/A | |||||||||||
TOTAL | 6,498 | 16.2 | 4,399 | 15.9 | 3,106 | 19.4 | |||||||||||||

16
Financial results: 12% improvement
ENDESA reported negative financial results of Euro 748 million for the first nine months of 2005, a 12.0% improvement on the same period of 2004.
Net financial expenses totalled Euro 814 million, 2.6% lower than in the same period of 2004.
The average cost of all of ENDESA’s financial debt was 5.41% in January-September 2005. Stripping out Enersis Group debt, it stood at 4.06%.
Cash flow: growth of 16.3%
ENDESA generated operating cash flow of Euro 2,929 million through September 2005, a rise of 16.3% on January-September 2004.
Cash flow rose sharply in all the Company's electricity businesses.
CASH FLOW | |||||||
| (Euro million) | Jan-Sep 05 | % Chg. vs Jan-Sep04 | |||||
| Spain and Portugal | 1,669 | 13.5 | |||||
| Rest of Europe | 502 | 34.2 | |||||
| Latin America | 766 | 15.2 | |||||
| Other businesses | (8 | ) | N/A | ||||
TOTAL | 2,929 | 16.3 | |||||
Investment of Euro 2,420 million, 72.1% in Spain and Portugal
Total investment by ENDESA amounted to Euro 2,420 million in the first nine months of 2005.
Of this amount, Euro 2,078 million was in capex and the remaining Euro 342 million in financial investments.
ENDESA is entitled to finance Euro 1,104 million of the tariff deficit in revenues from regulated activities in Spain. As of 30 September 2005, ENDESA had paid out Euro 744 million to finance the tariff deficit.
Financial structure: fall in leverage
As of 30 September 2005, ENDESA had a net debt of Euro 20,419 million, which is Euro 1,721 million higher than at the beginning of the year.
Of this rise, Euro 880 million was due to the euro’s depreciation vis-à-vis other currencies in which ENDESA’s debt - and that of its subsidiaries, mainly Enersis - is denominated. The remainder of the increase is the consequence of the tariff deficit financing.
17
The breakdown of debt by business line is as follows as of 30 September 2005:
BREAKDOWN BY BUSINESS OF ENDESA’S NET DEBT | |||||||||||||
| Euro million | |||||||||||||
| 30-09-05 | 01-01-05 | Change in euros | % Chg | ||||||||||
| Electricity business in Spain and Portugal | 11,452 | 9,586 | 1,866 | 19.5 | |||||||||
Electricity business in Europe ENDESA Italia Other | 1,480 995 485 | 2,123 1,293 830 | (643 (298 (345 | ) ) ) | (30.3 (23.0 (41.6 | ) ) ) | |||||||
Electricity business in Latin America Enersis group Other | 6,237 5,063 1,174 | 5,350 4,081 1,269 | 887 982 (95 | ) | 16.6 24.1 (7.5 | ) | |||||||
| Other businesses | 1,250 | 1,639 | (389 | ) | (23.7 | ) | |||||||
TOTAL | 20,419 | 18,698 | 1,721 | 9.2 | |||||||||
The average cost of Endesa’s total debt is 5.41% for the first nine months of 2005, and the average cost of Enersis Group’s debt is 9.33%. Disregarding Enersis Group, Endesa’s average cost of debt stands at 4.06% in the period.
The breakdown of the debt by currency and interest rate as of 30 September 2005, was as follows:
STRUCTURE OF ENDESA’S NET DEBT | |||||||||||||||||||
ENDESA and direct subsidiaries | Group Enersis | �� | Total ENDESA group | ||||||||||||||||
| (Euro million) | Jan-Sep 05 | % of total | Jan-Sep 05 | % of total | Jan-Sep 05 | % of total | |||||||||||||
| Euro | 14,918 | 97 | 3 | 0 | 14,921 | 73 | |||||||||||||
| Dollar | 438 | 3 | 2,427 | 48 | 2,865 | 14 | |||||||||||||
| Other currencies | 0 | 0 | 2,633 | 52 | 2,633 | 13 | |||||||||||||
Total | 15,356 | 100 | 5,063 | 100 | 20,419 | 100 | |||||||||||||
| Fixed rate | 10,162 | 66 | 4,201 | 83 | 14,363 | 70 | |||||||||||||
| Hedged | 1,808 | 12 | 322 | 6 | 2,130 | 11 | |||||||||||||
| Variable | 3,386 | 22 | 540 | 11 | 3,926 | 19 | |||||||||||||
TOTAL | 15,356 | 100 | 5,063 | 100 | 20,419 | 100 | |||||||||||||
| Avg. life (years) | 5.3 | 5.7 | 5.4 | ||||||||||||||||
The average life of the ENDESA Group’s debt was 5.4 years in the first nine months of 2005.
ENDESA enjoys a high degree of protection against interest-rate risk, since 81% of all its debt is either fixed-rate or hedged.
18
The cash and cash equivalents held by ENDESA in Spain and its direct subsidiaries, excluding Enersis, totalled Euro 4,267 million at the end of the third quarter of 2005. Out of this amount, Euro 2,228 million are undrawn, unconditional lines of credit and Euro 1,500 million correspondes to the syndicated loan transaction completed on 22 April 2005.
These balances are sufficient to cover maturities due in the next 15 months for this group of companies.
The cash and cash equivalents held by the Enersis group totalled Euro 476 million, covering debt maturities for the next months.
As of 30 September 2005, ENDESA’s total equity were Euro 15,121 million, an increase of Euro 2,623 million since the start of the year.
This increase lowered ENDESA’s financial leverage to 135.0% at 30 September 2005 from 149.6% at the start of the year.
As a result of the takeover bid by Gas Natural for ENDESA, the ratings agencies Standard & Poor’s and Fitch Ratings decided to place ENDESA’s credit rating under review for a possible downgrade, while Moody’s changed its rating outlook from stable to negative, with all three citing the negative impact of the operation on the Company’s financial situation should the bid go through.
As a result, at 16 November 2005, ENDESA’s debt had long-term credit ratings of A from Standard & Poor’s and Fitch, under review for possible downgrades, and A3 from Moody’s, with a negative outlook.
Disposal of Auna
On 29th July 2005, ENDESA and the remaining core shareholders of Spanish telecommunications operator Auna reached an agreement with Orange, a subsidiary of France Telecom, to sell the mobile telephony business that this operator carried out through its subsidiary, Amena.
19
The sale of a ENDESA´s 27.7% stake in Auna was completed on 8 November 2005, after authorisation was obtained from the European anti-trust bodies. ENDESA made a gross capital gain of Euro 1,206 million (Euro 1,060 million net of taxes) on the Euro 2,221 million proceeds.
ENDESA still holds a 5.01% stake in Auna, with a three-year hedge covenant that guarantees a minimum price equivalent to 90% of the price per share paid by France Telecom in the initial acquisition plus an annual return of 4.5%.
As a result, at 30 September 2005, the stake in Auna was not anymore recorded through the equity method. According to certain covenants in the agreement with France Telecom, Endesa did not have significantly influence over Auna’s management as of September 30, 2005.
In the balance sheet as of 30 September 2005, Endesa recorded 27.7% of its stake in Auna as “assets held for sale” at its historical cost of Euro 913 million. ENDESA has booked the remaining 5.01% of its stake in Auna not included as part of the sale agreement as a financial investment at the market value inherent in the sale to France Telecom, recording gross hidden gains against reserves of Euro 211 million (Euro 185 million after tax).
Asset disposal: Euro 917 million
ENDESA has followed during the first nine months of the period its strategy of divesting assets, resulting in disposals totalling Euro 917 million in the first nine months of 2005, and generating a gross capital gain of Euro 207 million.
The main disposal in the third quarter of 2005 was the sale of 100% of Smartcom to Mexican operator América Móvil for US$ 505 million (Euro 408 million), producing a gross capital loss of Euro 3 million (after-tax gain of Euro 51 million).
Creation of Bolonia Real Estate
ENDESA has set up the Bolonia Real Estate Company to handle various real estate assets such as old production plants, mines and distribution facilities that are already or will soon be idle.
It is worth mentioning that ENDESA's real estate assets portfolio in Spain is comprised of 43 million square meters and that the Company has identified 13 estates of 3 million square meters valued at Euro 750 million, once all urban administrative requirements are met.
ENDESA recorded the assets managed under Bolonia Real Estate as real estate investments at their historical cost of Euro 4 million.
20
Progress with the Strategic Plan |
21
The solid earnings obtained by ENDESA in the first nine months of 2005 and the expectations for the 4th quarter indicate that the Company is already obtaining a high degree of the terms presented in the Strategic Plan, as per the document, “ENDESA: Stronger business, greater value”.
Companies that have contributed to the tariff deficit have a right to full recognition, as it is reflected in ENDESA’s accounts. However, for the purpose of reflecting the sensitivities of ENDESA’s results to other deficit recognition assumptions, and without meaning that it would imply any resignation of the right to the full recover of the deficit, we have analysed two different scenarios below. The first scenario includes the assumption in the aforementioned document “ENDESA: Stronger business, greater value” of establishing remuneration for hydro and nuclear power at Euro 36/MWh with the consequent effect on purchases at the “pool” done by the supply business, while the second scenario considers tariff deficit recovery without taking into account the effects of this assumption.
| ¾ | According to these estimates, EBITDA would range from Euro 5,400 million to Euro 5,750 million, which implies a 20-27% increase on 2004 results. |
| ¾ | This means obtaining 30-41% of the targeted increase in EBITDA in the 2004-2009 Strategic Plan in only a year. |
| ¾ | Additionally, net income excluding income from the divestiture of Auna, would range from Euro 1,450 to Euro 1,700 million, implying growth of 15%-35% vs. 2004. |
| ¾ | If capital gains from the divestiture of Auna are included, net income growth will be above 100% |
| ¾ | Debt would be around Euro 18,000 million by year-end, below the Euro 18,698 million figure at the beginning of the period. |
| ¾ | Year-end financial leverage will be under 1.2, which is below the 1.4 maximum level targeted in the Strategic Plan. |
| ¾ | High growth in EBITDA is expected in all businesses: in Spain and Portugal EBITDA is expected to range from Euro 2,800 million to Euro 3,150 million, implying 13%-27% growth; in Europe it is expected to reach around Euro 850 million, implying 60% growth; and in Latin America it is expected to reach around Euro 1,750 million, implying 15% growth. |
| ¾ | Net capital gains of Euro 1,060 million obtained from the sale of its telecom business, Auna, and the expected increase in net income, will clearly help ENDESA to accomplish its commitment to distribute Euro 7 billion in dividends in the next 5 years. |
22
RESULTS BY BUSINESS LINE
23
ELECTRICITY BUSINESS IN SPAIN AND PORTUGAL
Key operating and regulatory facts for January-September 2005
High operating efficiency
ENDESA maintained its leading position in the Spanish electricity market in the first nine months of 2005, with a 37.8% market share in ordinary regime electricity generation, 42.7% in distribution, 36.7% in sales to deregulated clients and 40.7% in total sales to end customers.
Output in Spain totalled 69,769 GWh, 3.6% lower than in January-September 2004 given the low level of rainfall this year. ENDESA was also hit by downtime at group 4 of its plant in Puentes which was being converted into imported coal, and at Vandellós, from last March until last August, for technical reasons.
ENDESA has continued to improve its operating efficiency in line with the efficiency plan implemented in June, the results of which began feeding through in the third quarter. In the third quarter of 2005, ENDESA has been able to achieve a reduction of fixed costs of 3% vs. 3Q 2004 and 6.3% vs. 2Q 2005. Specifically, other fixed costs have been 14.2% lower than in 3Q 2004.
Progress in New Capacity Plan
The Company has made further progress with its 2005-2009 New Capacity Plan.
The first 350 MW unit converted to imported coal at its plant in As Pontes (A Coruña) was connected to the grid in the third quarter. Work is also underway on the construction of an 800 MW CCGT at the same facility and on the 400 MW Cristóbal Colón CCGT in Huelva, which is expected to start trial operations by year-end.
The Portuguese anti-trust authorities also gave the green light to ENDESA’s acquisition of the Portuguese renewable energies company Finerge in the third quarter of 2005. Finerge has installed capacity of 60 MW.
ENDESA is also adding another 305 MW of wind farm capacity in the Iberian Mainland. Out of which 52 MW will come on stream before the end of the year.
High growth rates in ENDESA’s distribution markets
ENDESA’s total demand in the first nine months of 2005 was 83,731 GWh, 5.6% higher than in the same period of 2004, once again showing its strong growth potential in the Spanish market.
The number of customers served by ENDESA’s distribution facilities grew by 185,961 from the same period last year. Its number of deregulated customers at the end of the third quarter was 962,573.
Improvement in quality of supply
24
The Quality Plan carried out over the last few years, which was reinforced in the second half of 2004, has contributed to a significant improvement in the Company’s quality of supply during the first nine months of 2005. This becomes especially relevant in a year with such a high growth in demand.
ENDESA’s system average interruption duration index (SAIDI) improved 16% compared to the first nine months of last year.
The Company significantly improved the quality of supply in Andalusia and Catalonia, where the SAIDI improved by 19%.
ENDESA’s retention rate for customers switching to the deregulated market was 86.9%, higher than the average for other companies in this industry, reflecting a high degree of loyalty towards the Company
Net income up 24.4%.
Net income from the electricity business in Spain and Portugal in January-September 2005 totalled Euro 1,051 million, up 24.4% on the same period in 2004. This figure represents 67.5% of ENDESA’s total net income.
ENDESA divested Euro 120 million worth of Spanish non-core assets in the first nine months of 2005, booking a gross capital gain of Euro 102 million.
EBIT: Euro 1,634 million (+12.9%)
This business posted EBIT of Euro 1,634 million in January-September 2005, an increase of 12.9% on January-September 2004.
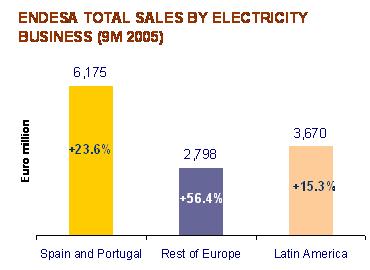
Sales increased by 23.6% to Euro 6,175 million, largely due to a rise in volumes and selling prices to end customers, and higher wholesale prices.
The increase in sales was sufficient to offset the sharp jump in fuel costs driven largely higher prices and volumes, and the net cost of the CO2 emission rights deficit.
In addition, low rainfall, high fuel costs and the cost of meeting the CO2 emission rights deficit meant that generation pool prices rose in average 81.5%.
Given the limited increase in the electricity tariff (just 1.7%) the system’s costs could not be covered, particularly generation costs, given the pool price levels. As a result, the industry incurred an estimated deficit of revenues from regulated activities of Euro 2,500 million, of which Euro 1,104 million corresponds to ENDESA.
The Company has booked this amount as a recoverable asset following the same criteria as the rest of the industry. Not considering the deficit as revenue, net income from ENDESA’s electricity business in Spain and Portugal would have fallen by 60.5%.
25
Companies financing the regulated activities tariff deficit are entitled to a full recognition, as it is reflected in ENDESA’s accounts. However, for the purpose of reflecting sensitivities to ENDESA’s results to other deficit recognition assumptions, and without meaning that it would imply any resignation of the right to the full recover of the deficit, it is worth noting that even if legislation establishes at Euro 36/MWh the remuneration to the hydro and nuclear power production, with the consequent effect on purchases at the “pool” done by the supply business, (hypothesis considered in ENDESA’s strategic plan “ENDESA: Stronger business, greater value” released on 3 October 2005), revenues in Spain & Portugal would have been Euro 275 million lower, leaving total net income from the electricity business in Spain and Portugal at Euro 872 million, 3.2% higher than in January-September 2004.
On the other hand, the negative impact on results of low rainfall and higher fuel costs is limited as the Company enjoys a more balanced generation mix than its competitors and managed to keep rising costs under control thanks to its fuel management policy.
The breakdown of EBIT for ENDESA’s electricity business in Spain and Portugal is explained in the following pages.
Revenues: 30.6%growth
Revenues of this business totalled Euro 6,651 million in the nine months of 2005, 30.6% higher than in the same period of 2004.
Of this amount, sales accounted for Euro 6,175 million, up 23.6% from January-September 2004.
SALES IN SPAIN AND PORTUGAL | |||||||||||||
| Euro million | |||||||||||||
Jan-Sep 2005 | Jan-Sep 2004 | Change | % Chg | ||||||||||
| Mainland generation under Ordinary Regime: | |||||||||||||
Supply to customers in deregulated market | 1,098 | 925 | 173 | 18.7 | |||||||||
Supply to regulated customers | 2,176 | 1,387 | 789 | 56.9 | |||||||||
| Generation in renewables/CHP | 151 | 88 | 63 | 71.6 | |||||||||
| Regulated revenues from distribution | 1,197 | 1,166 | 31 | 2.7 | |||||||||
| Non-mainland regulated generation | 975 | 784 | 191 | 24.4 | |||||||||
| Coal CTC | 17 | 59 | (42 | ) | (71.2 | ) | |||||||
| Technology CTC | -- | 142 | (142 | ) | (100.0 | ) | |||||||
| Supply to deregulated customers outside Spain | 171 | 126 | 45 | 35.7 | |||||||||
| Regulated revenues from gas distribution | 32 | 28 | 4 | 14.3 | |||||||||
| Gas supply | 216 | 102 | 114 | 111.8 | |||||||||
Other | 142 | 189 | (47 | ) | (24.9 | ) | |||||||
TOTAL | 6,175 | 4,996 | 1,179 | 23.6 | |||||||||
Mainland generation
26
Electricity demand in the Spanish mainland system rose by 6.3% in the first nine months of 2005. Ordinary regime generation increased by 3.0%, while renewables/CHP output was up by 14.4%.
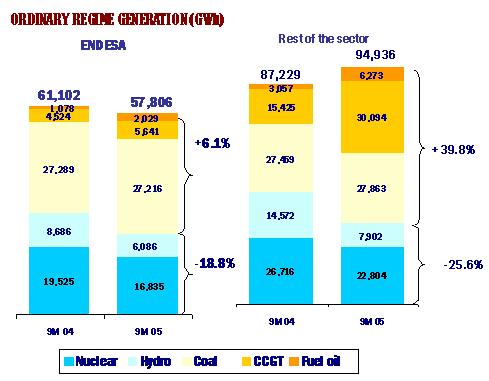
ENDESA’s mainland electricity output in the ordinary regime reached 57,806 GWh during the period, a 5.4% decrease vs. the first nine months of 2004.
The second and third quarters of the current year were characterized by two unusual factors: the technical breakdown at the Vandellós plant from March until August, and the downtime of the group 4 in As Pontes plant due to conversion into imported coal work that concluded in August. All of As Pontes other groups are expected to be converted by 2008.
On the other hand, output related to Special Regime (Renewables/CHP) was ,569 GWh, a 14.2% increase which is in line with the evolution of the rest of the industry.
Comparative advantage of ENDESA’s generation mix
Differences between the structure of ENDESA’s ordinary regime mainland output and that of the rest of the industry during the analysed period reflect the strength of the Company’s generation mix and its greater stability to the recurring sudden changes in rainfall rates in Spain.
ENDESA’s hydro output fell by 29.9% between January and September 2005 in comparison with the same period in 2004, while output for the rest of the industry declined by 45.8%. Thermal production in the industry rose by 39.8% versus an increase of just 6.1% by of ENDESA.
27
Contribution of coal plants to covering demand
The importance of ENDESA’s coal-fired plants in meeting demand was highlighted by the low levels of rainfall seen in the first nine months of 2005.
These plants have achieved an availability rate of 86.9%, meeting the requirements of the system and demonstrating that, despite new capacity based on CCGTs and wind farms already added to the grid, coal power plants are still clearly essential in meeting the country’s electricity needs.
More specifically, output from ENDESA’s coal-fired plants has covered 14.7% of demand in the Iberian Peninsula over the first nine months of 2005
Increase in ENDESA’s sales to the pool
ENDESA’s sales to the pool totalled Euro 3,776 million in the first nine months of 2005, 76.8% higher than in the same period in 2004, due to an 81.3% rise in the average pool price, including the capacity payment.
This rise in the pool price was due to higher fuel prices and the cost of meeting the CO2 emission rights deficit, together with the effects of the drought, which led to a very limited use of hydroelectric plants.
In absolute terms, the average pool price for the first nine months of 2005 including capacity payments, was Euro 59.33 per MWh vs. Euro 32.73 per MWh in January-September 2004.
ENDESA’s supply and generation subsidiaries acquired energy from the pool for a total of Euro 1,600 million, acquisitions that were offset by the energy sold by the company to the pool. The markets and time bands were the same in both cases, and the purchase price therefore matched the selling price.
Amounts derived from these sales are neutralised with purchases made by the supply subsidiary and generator. The pool sales recorded in the consolidated income statement for the first nine months of 2005 thus totalled Euro 2,176 million.
Output of ENDESA’s renewables/CHP sites
Renewable/CHP subsidiaries fully consolidated by ENDESA produced 1,569 GWh in the first nine months of 2005. That figure represents a 14.2% increase in relation to the same period of 2004. ENDESA also has holdings in other renewable/CHP companies, which generated 2,912 GWh in the first nine months.
Revenues from sales of renewable/CHP energy generated by consolidated companies totalled Euro 151 million, 71.6% more than in the same period in 2004, EBIT rose 209.5% to Euro 65 million.
Supply to deregulated customers
ENDESA had 962,573 deregulated clients as of 30 September 2005. Out of which 913.918 are customers from the mainland liberalised market, 47,368 from the non-mainland systems, and 2,007 are form other European liberalised markets outside Spain.
28
ENDESA’s sales to these customers totalled 27,442 GWh in the first nine months of 2005, 20.1% more than in the same period of 2004. Of this amount, 24,383 GWh were in the Spanish deregulated market, up 21.0% on the same period of 2004, and 3,059 GWh in other deregulated European markets, up 12.9%.
Revenues from supply to deregulated customers in Spain totalled Euro 1,178 million, a 23.9% increase on the first nine months in 2004.
Out of the revenues from supply to deregulated customers in Spain, Euro 1,098 million corresponded to the mainland liberalised market and Euro 80 million to the non-mainland market.
Finally, revenues from sales to deregulated European customers outside Spain stood at Euro 171 million, an increase of 35.7% on January-September 2004.
Distribution
ENDESA distributed 83,731 GWh of electricity in the Spanish market in the first nine months of 2005, a 5.6% increase on the same period of 2004.
Revenues from regulated distribution increased to Euro 1,197 million, 2.7% more than in January-September 2004. This minor increase does not reflect the investment effort, and also the operational and maintenance work required to increase the security and quality of supply.
Consequently, in order to attain an objective shared by all players in the electricity market, and in whose pursuit ENDESA is playing a particularly significant role, (having invested Euro 904 million in the first nine months of 2005) new regulation governing distribution should recognise substantial investment effort via adequate remuneration.
ENDESA supplied 47,939 GWh to customers in the regulated market. However, in accordance with IFRS, its turnover on this business was not booked as revenue, as the only revenue from distribution is the remuneration already included in the tariff. The rest of the turnover merely corresponds to costs incurred and passed on.
Non-mainland generation
ENDESA’s output in non-mainland systems in the first nine months of 2005 was 10,394 GWh, 5.2% more than in the same period of 2004. Sales rose 24.4% to Euro 975 million.
Royal Decree 1747/2003 governing island and other non-mainland electricity systems recognises that generation in these systems is subject to higher costs than on the mainland, owing to the larger reserve margin required, the extra cost of the specific technologies used and the higher fuel costs.
The Royal Decree lays down the general principles that must be applied to determine the compensation regarding these circumstances. Although the exact methodology for quantifying this compensation is still being developed, a draft Ministerial Order has now been prepared by the Ministry of Industry, and is currently being analysed by the Comisión Nacional de Energía (CNE)
29
ENDESA’s January-September 2005 accounts include revenues of Euro 110 million in addition to the compensation envisaged in the 2005 electricity tariff. This has been calculated, with conservative criteria, by applying the methodology set out in the draft regulation mentioned above.
No additional sum was included for previous years over and above the figure recorded as of year-end 2004.The Company awaits the definitive regulatory outcome due to be released in the following months.
Technological CTCs and deficit on regulated revenues
As already mentioned, in the first nine months of 2005 regulated revenues were not sufficient to offset system costs, leaving an estimated deficit of Euro 2,500 million.
According to the provisions of Royal Decree Law 5/2005 of 11 March, ENDESA must contribute 44.16% of the total amount of this deficit (Euro 1,104 million).
In the opinion of ENDESA’s legal advisers, taking into account the legal nature and background of this financing, as well as legal precedent, the Company is entitled to the full recovery of the sums contributed. The government should, however, establish a specific procedure for the return of these sums, as it did in 2002.
Other Spanish utilities also support our view. For this reason, ENDESA’s accounts as of 30 September 2005 include a financial asset of Euro 1,104 million to reflect its right to recover the amounts contributed in relation to the regulated revenues deficit.
In the first nine months of 2004, ENDESA’s technological CTC revenues totalled Euro 142 million.
Gas distribution and supply
ENDESA sold 15,289 GWh of gas up to September 2005, through companies who are consolidated in the Group; this amount represents a 56.1% increase on the same period in 2004.
Of this amount, 13,355 GWh were sold in the deregulated market, an increase of 69.3%, and 1,934 GWh in the regulated market, an increase of 1.4%. In addition 791 GWh of total sales correspond to companies that are not fully consolidated given their limited contribution to the Group total.
Consequently, total sales in the regulated market amounted to 2,725 GWh a 0.3% increase versus January-September 2004.
The 16,080 GWh sold in both markets, together with the 16,637 GWh of gas consumed by ENDESA’s generation plants, amount to a total of 32,717 GWh, implying an 11.9% share of the Spanish natural gas market. The target of 12% by 2007 envisaged in the Company’s Strategic Plan has therefore already been achieved.
Revenues from gas sales in the deregulated market in the first nine months of 2005 totalled Euro 216 million, an increase of 111.8% on the same period in 2004.
30
Revenues from regulated gas distribution rose 14.3% to Euro 32 million.
Other operating revenues
Other operating revenues in January-September 2005 totalled Euro 476 million, up Euro 381 million on January-September 2004.
Included under this heading is Euro 346 million, corresponding to a portion of the CO2 emission rights allocated to ENDESA within the Spanish Emissions NAP for the first nine months of the year, which are recorded as revenue.
Revenues from emissions allocated to cover the Spanish mainland are recorded at market price as of the beginning of 2005, while revenues from emissions allocated to non-mainland are recorded at average market price for the year.
31
Operating expenses
The breakdown of operating expenses in the Spanish and Portuguese business for the first nine months of 2005 is as follows:
OPERATING EXPENSE IN SPAIN AND PORTUGAL | |||||||||||||
| Euro million | |||||||||||||
| Jan-Sep 2005 | Jan-Sep 2004 | Change in Euros | % Chg | ||||||||||
| Purchases and services | 2,992 | 1,659 | 1,333 | 80.4 | |||||||||
Power purchases | 649 | 290 | 359 | 123.8 | |||||||||
Fuel consumption | 1,493 | 1,107 | 386 | 34.9 | |||||||||
Power transmission expenses | 176 | 132 | 44 | 33.3 | |||||||||
Other supplies and services | 674 | 130 | 544 | 418.5 | |||||||||
| Personnel expenses | 673 | 605 | 68 | 11.2 | |||||||||
| Other operating expenses | 706 | 680 | 26 | 3.8 | |||||||||
| Depreciation and amortization | 746 | 792 | (46 | ) | (5.8 | ) | |||||||
TOTAL | 5,117 | 3,736 | 1,381 | 37.0 | |||||||||
We would like to highlight that ENDESA’s fuel unit cost for mainland generation in ordinary regime for the first nine months of 2005 stood at €16.2/MWh, 24.7% below the rest of the industry.
Power purchases
Power purchases in the period rose by 123.8% to Euro 649 million.
The main component under this heading relates to gas purchases for supplying deregulated customers, which rose 128.9% due to the 69.3% increase in sales to this type of client and the increase in natural gas prices.
The rest correponds to transactions made in the wholesale generation market. The increase of these purchases is related with the the 81.3% increase in the average pool price.
Fuel consumption
Fuel consumption amounted to Euro 1,493 million in the first nine months of 2005, an increase of 34.9% vs. the same period in 2004.
This increase is due to the rise in fuel-oil production (higher unit costs than other technologies) and to the generalized increase in the prices of raw materials in international markets. The impact of the increase in prices has been counterbalanced by the company’s active fuel purchasing policy, which has enabled the company to beat market prices.
32
Other supplies and services
Other supplies and services expenses totalled Euro 674 million in the first nine months, up Euro 544 million vs. the same period last year.
This increase was due to the booking of Euro 477 million in expenses from emission rights required to cover the CO2 emissions made in the first nine months of the year, which totalled 39.2 million tonnes, out of which 29.8 million tonnes correspond to the mainland and 9.4 million tonnes for non-mainland emissions.
Expenses for mainland emissions were valued as follows:
¾ For the portion of these emissions covered by freely allocated emission rights, at the same price at which the revenues are booked, i.e. the market price at the beginning of 2005.
¾ For the portion of these emissions covered by rights acquired in the market, the expense is recorded at the price paid for these rights.
¾ The portion of these emissions for which ENDESA does not own rights was recorded at the market price of these rights as of 30 September 2005, Euro 22.85 per tonne.
As non-mainland territories were granted sufficient emission rights, an expense was recorded for those made in the first nine months of this year, calculated at the average price of these rights during this period, which was the same amount as the revenue recorded for freely assigned emission rights.
The net effect of revenues and expenses booked in January-September 2005 to cover CO2 emissions was Euro 131 million, corresponding to an estimated rights deficit of 5.9 million tonnes.
Personnel expenses
As of 30 September 2005, the workforce in Spain and Portugal totalled 12,730 employees, down 1.2% on 2004 year-end.
Personnel expenses amounted to Euro 673 million in January-September 2005, an increase of 11.2% vs. the same period in 2004. The increase was principally due to factors not related to regular wages.
From January to September 2005, an extra Euro 22 million was recorded in provisions to cover future pension or early-retirement commitments, primarily to offset the effects of higher real inflation over the period than that envisaged in the actuarial studies used to calculate this liability at the close of 2004. In 2004, this factor was only recorded at year-end.
Stripping out these provisions and other non-recurring expense items, mainly related to variables that affect future pensions or early-retirement commitments, personnel costs rose by 4.5%.
33
Other fixed operating expenses
Other fixed operating expenses totalled Euro 706 million in the first nine months of 2005, an increase of 3.8% with respect to the same period in 2004.
The cost reduction plan began to bear fruit in the third quarter of 2005 as evidenced by the 14.2% decline in other fixed costs for this quarter vs. the same quarter last year.
Net financial expenses: 10.3% improvement
ENDESA reported a net financial loss for the first nine months of 2005 of Euro 359 million, of which, Euro 356 million corresponds to net financial expenses. This includes Euro 45 million for the cost of preferred shares, which are considered as debt in the 2005 accounts, and are therefore recorded as financial expenses.
As regulation IAS 32 was not applied last year, in 3Q04 these preferred shares were booked as minority interests and not as financial debt.
On a like-for-like basis, net financial expenses decreased by Euro 86 million in January-September 2005, i.e. 19.5%.
As of 30 September 2005, net debt in Spain and Portugal stood at Euro 11,452 million, up from Euro 9,586 million at the beginning of this year. This rise can be explained by the Euro 744 million paid during the first nine months of the year to finance the tariff deficit, and the major distribution investment made in the period as part of ENDESA’s Quality Excellence Plan.
Equity-accounted income
Equity-accounted income for ENDESA’s electricity business in Spain and Portugal totalled Euro 42 million. This heading includes, among others, Euro 8 million in income from subsidiaries in Portugal and Euro 11 million from renewables/CHP generation subsidiaries. Equity-accounted income rose by 31.3% vs. the same period last year.
Asset disposals: Euro 102 million in capital gains
In the first nine months of 2005, ENDESA sold Euro 120 million worth of non-strategic electricity assets from its business in Spain and Portugal, posting gross capital gains of Euro 102 million. Among these we highlight the sale of land in Palma de Mallorca where GESA’s headquarters were formerly located and the sale of the “Lepanto” building in Barcelona, generating gross capital gains of Euro 89 million (Euro 75 million net of taxes).
In addition, ENDESA agreed to sell EDP the 49% stake held by Endesa Gas in Portuguese company, NQF Gas, for Euro 57 million. The deal is only pending to the materialization of certain conditions of the agreement. As a result, ENDESA ceased to account for the NQF stake under the equity method instead booking the investment under “assets held for sale”. As of 30 September 2005, ENDESA’s stake in NQF Gas had a book value of Euro 21 million. The corresponding capital gain is not reflected in the company’s financial statements as of 30 September 2005.
34
Cash flow: Euro 1,669 million
Cash flow from operations from the Spanish and Portuguese electricity business amounted to Euro 1,669 million in January-September 2005, an increase of 13.5% vs. the same period in 2004.
Investments: 70% increase in new generation capacity and 59.9% increase in distribution quality improvement
Total investment in Spain and Portugal reached Euro 1,746 million in the first nine months of 2005, up 62.7% on the same period last year.
TOTAL INVESTMENT IN SPAIN AND PORTUGAL | ||||||||||
| Euro million | ||||||||||
| Jan-Sep 2005 | Jan-Sep 2004 | % Chg | ||||||||
| Capex | 1,484 | 953 | 55.7 | |||||||
| Intangibles | 66 | 21 | 214.3 | |||||||
| Financial | 196 | 99 | 98.0 | |||||||
| Finerge | 151 | - | N/A | |||||||
Total investments | 1,746 | 1,073 | 62.7 | |||||||
CAPEX IN SPAIN AND PORTUGAL | ||||||||||
| Euro million | ||||||||||
| Jan-Sep 2005 | Jan-Sep 2004 | % Chg | ||||||||
| Generation | 544 | 320 | 70.0 | |||||||
Ordinary regime | 491 | 224 | 119.2 | |||||||
Renewables/CHP | 53 | 96 | (44.8 | |||||||
| Distribution | 916 | 573 | 59.9 | |||||||
| Others | 24 | 60 | (60.0 | ) | ||||||
Total | 1,484 | 953 | 55.7 | |||||||
85% of total investment was capex used in developing or improving electricity generation and distribution facilities, in order to maintain ENDESA’s position of leadership in the Spanish market.
The capex breakdown reflects the considerable effort made by the Company over the last few years to improve its service quality, with investment in distribution facilities accounting for 61.7% of the total.
35
Additionally, it is significant the capex done by ENDESA’s to increase its generation capacity; among which worth mentioning are: (i) the conversion to imported coal of group 4 and construction of 800 MWs of CCGT in As Pontes, (ii) the construction of 400MW CCGT in the Colon plant and (iii) the capacity increase of special regime generation.
The newly consolidated investment relates to the acquisition during the third quarter of this year of Portuguese renewables Company, Finerge, for Euro 151 million.
Although not included in the figures above, the financing of the tariff deficit is also booked as a financial investment; therefore, an additional Euro 1,104 million was accrued under this heading up to 30 September 2005.
Strong EBITDA growth for the year 2005
According to current estimates, Spain & Portugal’s EBITDA would range from Euro 2,800 million to Euro 3,150 million by year-end 2005, implying a 13% to 27% increase vs. 2004.
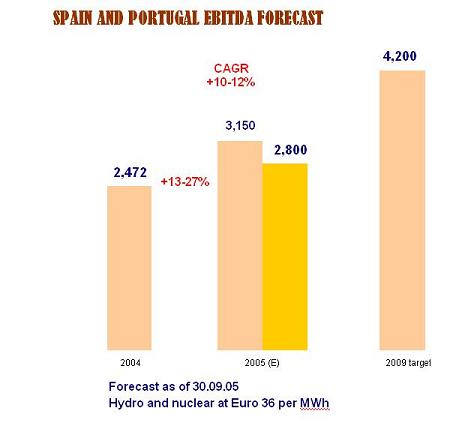
Spain and Portugal EBITDA Forecast 2004: 2,472, +13-27%, CAGR +10-12%, 2005(E): 3,150 2,800 2009 target: 4,200 Forecast as of 30.09.05 Hydro and nuclear at Euror 36 per MWh |
36
ELECTRICITY BUSINESS IN EUROPE
Excellent results and sound outlook for growth
In the rest of Europe, ENDESA focused on its two main strategic goals: consolidating its position in this market and seeking new growth opportunities.
With regards to Endesa Italia, it is worth mentioning the strong growth achieved in main operating figures during the period: installed capacity has increased by 11%, electricity output by 9.2% and sales by 18.2%.
On the other hand, in 3Q05, ENDESA and the Italian group Merloni signed an agreement pursuant to which ENDESA will acquire 51% of the Italian company MF Power, owner of three Italian wind farms with a total capacity of 60 MW.
Moreover, the construction of two combined cycle groups, 400 MW each, in Scandale (Calabria) advanced on schedule. This project was acquired at the end of December 2004 by ENDESA and ASM Brescia with a 50% stake each. Likewise, further progress was made on the construction of two of three wind farms for the company IDAS according to the contract that awarded 100% to Endesa Italia at the end of the same month. The two farms will have a total capacity of 56 MW and are expected to be commissioned by mid 2006.
In addition, the Company achieved several other relevant milestones in the first six months of the year:
37
¾ In February, the Company sold 5.33% of its holding in Endesa Italia to ASM Brescia, one of ENDESA’s partners in Endesa Italia, for Euro 159 million, booking a net capital gain of Euro 24 million. Following this transaction, ENDESA holds an 80% stake in Endesa Italia. The transaction implies a value for ENDESA Italia of Euro 2,989 million, 36.4% higher than the price ENDESA paid for its original stake in the Italian group in 2001.
¾ The repowering work to convert the Ostiglia plant’s group 3 to a 400MW combined cycle generator was completed. Group 6 of the Tavazzano power plant in Italy, which was converted to combined cycle, began
pilot testing. It is expected to come on-stream in the fourth quarter of this year.
¾ An agreement was signed with the Merloni group to supply electricity to the Italian retail market. The supply base for the power sold will be Endesa Italia’s generation portfolio. The Merloni Group contributes with a
portfolio of more than 2,000 customers and sales volumes of over 2 TWh.
¾ The Company has signed a letter of intent to construct and operate the Livorno regasification plant (Tuscany), which will allow ENDESA to acquire up to 25% of the project’s company and an off-take agreement up to
2bcm of the plant’s regasification capacity.
¾ Endesa Italia distributed a dividend of Euro 102 million in February.
Initiatives undertaken at Snet (65% owned by ENDESA) during the period fell under the auspices of the Industrial Plan presented at the beginning of 2005, the purpose of which is to develop new capacity by means of the future use of its current sites in order to achieve total new capacity of 2,000 MW in combined cycle plants and 200 MW in renewables/CHP.
The following features of this plan, among others, were carried out in Snet in the first six months of the year: the contract to sell electricity to EDF was renegotiated, a coal supply contract was signed, several agreements were reached with trade unions to ensure that labour conditions would remain stable and targets for workforce restructuring could be met, the merger of the three operating companies (Setne, Setcm and Snet itself) was initiated, and authorisation was obtained to commence construction of the Lehaucourt wind farm, which will have a total capacity of 9.2MW.
In addition on 29 July, already in the third quarter, the French generator’s Board of Directors paid out an interim dividend of Euro 21 million, of which Euro 14 million corresponded to Endesa Europa.
On September 23rd, Snet completed the sale of its 23.62% stake in power generator Séchilienne-Sidec to Ecofin Ltd. for Euro 104 million.
In addition, during the third quarter of 2005 the valuation of Snet’s assets required to calculate goodwill yielding a figure of Euro 185 million.
38
Finally, in line with its strategic objective of seeking new sources of growth in Europe, ENDESA will participate on an exclusive basis in the upcoming negotiations related to the privatisation of the Dolna Odra in Poland, with installed capacity of 1,960 MW.
Net income: up 102.1%
Net income from the electricity business in Europe totalled Euro 283 million in the first nine months of 2005, an increase of 102.1% when compared to the same period in the previous year.
The table below shows a breakdown of output and sales figures by country:
BREAKDOWN OF ENDESA’S GENERATION AND SALES IN EUROPE | |||||||||||||||||||
| Generation (GWh) | Sales (GWh) | ||||||||||||||||||
Jan-Sep 2005 | Jan-Sep 2004 | % Chg | Jan-Sep 2005 | Jan-Sep 2004 | % Chg | ||||||||||||||
| Italy | 17,329 | 15,872 | 9.12 | 23,153 | 19,589 | 18.2 | |||||||||||||
| France | 5,927 | 1,078 | 449.8 | 10,007 | 1,189 | 741.6 | |||||||||||||
| Poland* | 1,154 | 70 | 1,548.6 | 1,154 | 70 | 1,548.6 | |||||||||||||
| Total | 24,410 | 17,020 | 43.4 | 34,314 | 20,848 | 64.6 | |||||||||||||
(*) ENDESA is present in the generation business in Poland through the Bialystock co-generation plant, which is controlled by Snet. | |||||||||||||||||||
EBIT: up 62%
EBITDA and EBIT for the ENDESA’s European electricity business for the first nine months of 2005, can be broken down as follows:
EBITDA & EBIT IN EUROPE | |||||||||||||||||||
EBITDA (Euro million) | EBIT (Euro million) | ||||||||||||||||||
| Jan-Sep 2005 | Jan-Sep 2004 | % Chg | Jan-Sep 2005 | Jan-Sep 2004 | % Chg | ||||||||||||||
| Endesa Italia | 561 | 413 | 35.8 | 456 | 324 | 40.7 | |||||||||||||
| Snet | 136 | 13 | 946.2 | 54 | 4 | 1,250.0 | |||||||||||||
| Trading | 20 | - | N/A | 20 | - | N/A | |||||||||||||
| Holding & others | (15 | ) | (10 | ) | (50.0 | ) | (15 | ) | (10 | ) | (50.0 | ) | |||||||
Total | 702 | 416 | 68.8 | 515 | 318 | 62.0 | |||||||||||||
Trading operations have added Euro 20 million to EBIT. These operations can be executed without assuming any risks due to ENDESA's generation assets in Italy and France.
39
Positive performance of ENDESA Italia continues
The following table shows main components of EBIT at Endesa Italia during the first nine months of 2005.
ENDESA ITALIA KEY DATA | |||||||||||||
| Euro million | |||||||||||||
| Jan-Sep 2005 | Jan-Sep 2004 | Change in euros | % Chg | ||||||||||
| Revenues | 1,661 | 1,248 | 413 | 33.1 | |||||||||
| Energy purchases | 224 | 181 | 43 | 23.8 | |||||||||
| Fuel consumption | 648 | 528 | 120 | 22.7 | |||||||||
| Transmission expenses | 5 | 15 | (10 | ) | (66.7 | ) | |||||||
| Other supplies and services | 101 | - | 101 | N/A | |||||||||
Gross margin | 683 | 524 | 159 | 30.3 | |||||||||
| Capitalised expenses | 4 | 5 | (1 | ) | (20.0 | ) | |||||||
| Personnel expenses | 54 | 50 | 4 | 8.0 | |||||||||
| Other expenses | 72 | 66 | 6 | 9.1 | |||||||||
EBITDA | 561 | 413 | 148 | 35.8 | |||||||||
| Depreciation and amortization | 105 | 89 | 16 | 18.0 | |||||||||
EBIT | 456 | 324 | 132 | 40.7 | |||||||||
Revenues reported by the Italian group grew 33.1% in the analysed period due largely to the 18.2% increase in energy sold.
The Company sold 23,153 GWh of electricity, compared to 19,589 GWh in the same period last year, which represents an increase of 18.2%. Out of the previous amount, 5,824 GWh were acquired from third parties at a cost of Euro 224 million, representing 2,107 GWh more than in the same period of 2004.
Total electricity generation of the Company was 17,329 GWh in the period January-September 2005, an increase of 1,457 GWh or 9.2% relative to the same period in 2004. Market share in the Italian market was 8.1% during the first nine months of 2005.
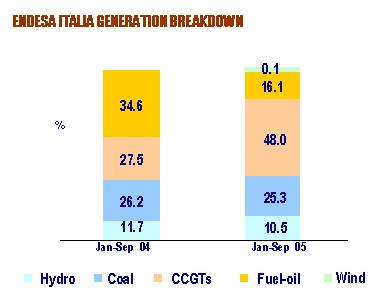
ENDESA ITALIA GENERATION BREAKDOWN Jan-Sep 04 Hydro 11.7% Coal 26.2% CCGTs 27.5% Fuel-oil 34.6% Jan-Sep 05 Hydro 10.5% Coal 25.3% CCGTs 48.0% Fuel-oil 16.1% Wind 0.1% |
40
Progress in ENDESA fulfilling Italia’s programme for repowering its thermal production plant has allowed it to increase production by using a more efficient mix that replaces fuel-gas output with power generated by CCGTs. This programme enables the Company to soften the impact of the increase in fuel prices.
Endesa Italia’s fuel costs increased in the first nine months of the year by just 22.7%, or Euro 120 million. This figure is far less than the increase in revenues resulting from the higher electricity prices triggered by the jump in fuel prices.
The positive impact of the repowering programme is also clear when we compare the breakdown by technology for the group in the first nine months of 2004 with the same period of 2005: the weight of CCGT plant in the production mix has increased from 27.5% to 48%, while the weight of fuel-gas has declined from 34.6% to 16.1%.
The line “other supplies and services” includes, among other items, the estimated cost of CO2 emissions in the first nine months of 2005, which are not expected to be covered by the emission rights to be distributed by the Italian government.
On the other hand, on 23rd June 2005, a Decree was published in Italy granting Endesa Italia the right to charge Euro 169 million in stranded costs in 2005-2009.
Euro 25 million of the total amount approved was booked as an increase in revenues on the Profit and Loss account for the first nine months of 2005 and the remaining Euro 144 million was deferred according to the useful life of the related facilities.
Debt reduced by Euro 643 million
Net debt at ENDESA’s electricity business in Europe stood at Euro 1,480 million at 30 September, 2005, compared to Euro 2,123 million at the beginning of the year - a reduction of Euro 643 million, or 30.3%.
Financial results reflected a cost of Euro 44 million in the first nine months of 2005, Euro 1 million less than in January-September 2004.
41
Cash flow: up 34.2%
Cash flow generated from operations stood at Euro 502 million, a rise of 34.2% compared to the same period in 2004.
Investments: Euro 160 million
Investment in the European electricity business was Euro 160 million in January-September 2005. Out of this amount, Euro 135 million was capex, with Euro 79 million of investment in Endesa Italia and Euro 56 million in Snet.
Financial investments for the period were Euro 21 million, including the purchase of minority interests in Sodelif, Snet’s subsidiary, amounting to Euro 6 million.
Divestments
In the first nine months of 2005, ENDESA has made the following divestments in its European business:
¾ The sale of a 5.33% stake in Endesa Italia to ASM Brescia for Euro 159 million, generating a net capital gain of Euro 24 million.
¾ The sale of Snet's 23.62% stake in the generator Séchilienne-Sidec for Euro 104 million, generating a gross capital gain of Euro 48 million (Euro 26 million after taxes and minorities).
¾ The sale of ENDESA's 18% stake in the Moroccan water utility Lydec for Euro 26 million, generating a net capital gain of Euro 12 million.
Strong EBITDA growth for the year 2005
According to current estimates, EBITDA for the European business will reach around Euro 850 million by year-end 2005, implying a 60% increase vs. 2004.
42
ELECTRICITY BUSINESS IN LATIN AMERICA
Leveraging on the economic recovery of the region: strong growth in output and sales
The trends characterising regional performance during the first half of 2005 extended into the third quarter: sustained economic growth and currency stability.
This propitious backdrop enabled high growth in demand for electricity during the first nine months of 2005 vs. 2004 with average sales growth of 5.5% in all areas in which ENDESA’s subsidiaries operate. This increase in demand boosted generation at ENDESA’s subsidiaries, which showed average growth of 5.4% compared to the same period last year.
Better economic conditions also led to widespread increases in prices and business margins. As a consequence the EBIT rose by 5.0% in generation and transmission, and 21.6% in distribution.
Growth in volume sales in generation and distribution
Generation and distribution figures for ENDESA’s Latin American subsidiaries were as follows:
GENERATION AND DISTRIBUTION AT THE LATIN AMERICAN BUSINESS | |||||||||||||
Generation (GWh) | Distribution (GWh) | ||||||||||||
| Jan-Sep 2005 | % chg | Jan-Sep 2005 | % chg | ||||||||||
| Chile | 13,778 | 14.0 | 8,847 | 4.7 | |||||||||
| Argentina | 12,046 | 3.3 | 10,498 | 4.8 | |||||||||
| Peru | 5,061 | 23.2 | 3,356 | 6.5 | |||||||||
| Colombia | 8,855 | (1.8 | ) | 7,469 | 4.2 | ||||||||
| Brazil | 3,130 | (17.3 | ) | 10,863 | 7.3 | ||||||||
TOTAL | 42,870 | 5.4 | 41,033 | 5.5 | |||||||||
Improved generation and distribution margins
Growth in demand and tighter reserve margins caused the unit margin of generation companies to increase by 11.4% in January-September 2005 compared to the same period last year, to US$ 20.6 per MWh produced.
It is significant that this increase has been achieved in an unfavourable environment due to the increase in liquid fuel prices and the gas shortages in Chile and Argentina.
The high degree pass through of the generation prices in the tariff reviews undertaken this year coupled with the operating efficiency of the companies, improved Distribution margins. Their VAD increased by 20.3% to US$ 27.9 per MWh distributed.
43
Development of regulatory framework
In the third quarter of the current year, further improvements of the regulatory framework on which ENDESA’s subsidiaries develop their activities have come into place. Main milestones are:
¾ In Argentina, agreement between Edesur and Uniren, that ratifies the 28% VAD increase as a Transition Tariff Framework, brings forward the validity of the Integral Tariff Revision (RTI) to 1 August 2006 and limits the distributor’s contribution to the so called social tariff.
¾ In Peru, Edelnor tariff review, valid for the following four years, was succesfully completed in the third quarter. A preliminary scheme, which maintains current VAD, was published on October 13th 2005.
¾ Argentinean and Brazilian Governments are redefining the conditions for the interconnection business between both countries, fact that should ease the reestablishment of the contracts for Line 1 of Cien .
In addition, during the current quarter, it’s worth noting the subscription of the Definitive Agreement for Operation and Management of Generation Projects on 17 October, that will allow installation of two CCGT with total capacity of 1,600MW. This is the first step towards the Argentinean wholesale market normalization.
Net income: up 70.6%
Net income from this business totalled Euro 186 million in the first nine months of 2005, an increase of 70.6% from the same period last year and contribution of 12% to ENDESA’s total net income in the same period.
EBIT: Growth of 14.8%
The table below shows EBITDA and EBIT for ENDESA’s Latin American electricity business, broken down by activity:
EBITDA & EBIT IN LATIN AMERICA | |||||||||||||||||||
| Euro million | |||||||||||||||||||
| EBITDA | EBIT | ||||||||||||||||||
Jan-Sep 2005 | Jan-Sep 2004 | % Chg | Jan-Sep 2005 | Jan-Sep 2004 | % Chg | ||||||||||||||
| Generation and transmission | 736 | 681 | 8.1 | 548 | 522 | 5.0 | |||||||||||||
| Distribution | 613 | 509 | 20.4 | 444 | 365 | 21.6 | |||||||||||||
| Others | (26 | ) | (45 | ) | N/A | (28 | ) | (47 | ) | N/A | |||||||||
Total | 1,323 | 1,145 | 15.6 | 964 | 840 | 14.8 | |||||||||||||
44
EBITDA and EBIT breakdown by country where ENDESA operates through fully consolidated subsidiaries as follows:
BREAKDOWN OF EBITDA AND EBIT IN LATAM BY BUSINESS LINE | |||||||||||||||||||
Generation and transmission | |||||||||||||||||||
| Euro million | EBITDA | EBIT | |||||||||||||||||
Jan-Sep 2005 | Jan-Sep 2004 | % Chg | Jan-Sep 2005 | Jan-Sep 2004 | % Chg | ||||||||||||||
| Chile | 250 | 188 | 33.0 | 171 | 127 | 34.6 | |||||||||||||
| Colombia | 171 | 160 | 6.9 | 135 | 129 | 4.7 | |||||||||||||
| Brazil - Generation | 97 | 73 | 32.9 | 83 | 63 | 31.7 | |||||||||||||
| Brazil - Transmission | 34 | 66 | (48.5 | ) | 21 | 54 | (61.1 | ) | |||||||||||
| Peru | 114 | 96 | 18.8 | 87 | 69 | 26.1 | |||||||||||||
| Argentina - Generation | 70 | 87 | (19.5 | ) | 53 | 69 | (23.2 | ) | |||||||||||
| Argentina - Transmission | - | 11 | (100.0 | ) | (2 | ) | 11 | (118.2 | ) | ||||||||||
TOTAL | 736 | 681 | 8.1 | 548 | 522 | 5.0 | |||||||||||||
Distribution | |||||||||||||||||||
| Euro million | EBITDA | EBIT | |||||||||||||||||
Jan-Sep 2005 | Jan-Sep 2004 | % Chg | Jan-Sep 2005 | Jan-Sep 2004 | % Chg | ||||||||||||||
| Chile | 139 | 130 | 6.9 | 121 | 115 | 5.2 | |||||||||||||
| Colombia | 177 | 146 | 21.2 | 119 | 96 | 24.0 | |||||||||||||
| Brazil | 202 | 123 | 64.2 | 152 | 84 | 81.0 | |||||||||||||
| Peru | 54 | 49 | 10.2 | 32 | 28 | 14.3 | |||||||||||||
| Argentina | 41 | 61 | (32.8 | ) | 20 | 42 | (52.4 | ) | |||||||||||
TOTAL | 613 | 509 | 20.4 | 444 | 365 | 21.6 | |||||||||||||
Generation and transmission
Chile
In the first nine months of 2005, generation was impacted by the gas supply problems affecting the thermal plants, which required substituting gas with more expensive liquid fuels.
45
For ENDESA’s subsidiaries this issue was more than offset by the 14% increase in energy generated from hydropower thanks to the Ralco plant joining the grid in the third quarter of 2004. Therefore, EBIT increased 34.6% in the first nine months of 2005 vs. the same period last year to Euro171 million.
Colombia
Lower rainfall led to a 1.8% reduction of energy generated. However, this fall was offset by the increase in the average sales price and the favourable trend in the Colombian peso relative to the Euro, driving EBITDA to Euro 171 million and EBIT to Euro 135 million, increasing them by 6.9% and 4.7% respectively, versus the same period last year.
Brazil - Generation
Total electricity generation fell 17.3%, due to problems of gas supply that have affected Endesa Fortaleza. However, favourable exchange rate movements together with higher prices and lower fuel consumption underpinned a 32.9% rise in EBITDA and a 31.7% jump in EBIT to Euro 97 million and Euro 83 million respectively.
Brazil - Transmission
The difficulties in finding available electricity in Argentina to export to Brazil due to gas supply restrictions had a negative impact on results at this interconnection, leading to an EBIT of Euro 21 million, Euro 33 million lower than in the same period last year.
Peru
Sales in the Peruvian generation business totalled Euro 218 million in the first nine months of 2005, 5.2% less than in the same period a year earlier. Effect of lower prices caused by improved rainfall was offset by a 23.2% increase in power generated.
Improved rainfall also drove a Euro 62 million decrease in fuel costs, contributing to a Euro 18 million rise both in EBITDA and EBIT to Euro 114 million and a Euro 87 million respectively.
Argentina
Gas supply issues led to significant increases in fuel costs (+42.5%) due to the need to generate power using liquid fuels. As a result profitability fell even though generation sales volume increased. As a result of this, EBITDA and EBIT fell by 19.5% and 23.2% to Euro 70 million and Euro 53 million respectively.
46
Distribution
Chile
EBITDA and EBIT in the Chilean distribution business rose 6.9% and 5.2% respectively, in the first nine months of the year.
These increases reflect the fact that growth in sales volume to meet higher demand is offseting the squeeze on margins caused by the latest tariff revision.
Colombia
EBITDA for the Colombian distribution business rose by 21.2% and EBIT by 24.0%. These increases were due to the 14.9% increase in sales (to Euro 448 million), sufficient to cover higher power purchase costs and the increase in fixed costs and favourable fluctuation in the euro exchange rate versus the Colombian peso.
Brazil
Sales in the Brazilian distribution business stood at Euro 905 million in the first nine months of 2005, a 37.5% increase over 2004.
This increase reflects margin expansion due enhanced generation price pass-through, and, to a lesser extent, higher volumes of energy sold.
Sales growth easily outpaced cost increases, driving EBITDA to Euro 202 million and EBIT to Euro 152 million, representing an increase of 64.2% and 81.0%, respectively, on the same period last year.
Peru
EBITDA at the Peruvian distribution business in January-September 2005 amounted to Euro 54 million, 10.2% more than in January-September 2004. EBIT grew Euro 4 million (+14.3%).
Growth was driven by a 13.4% increase in sales on of first nine months of 2004 to Euro 220 million compared to an 11.9% rise in power purchases.
Argentina
EBITDA and EBIT in the Argentine distribution business fell by Euro 20 million and Euro 22 million, respectively, compared to the first nine months of 2004.
This was largely because the January-September 2004 figures included income of Euro 10 million corresponding to the compensation received from Alsthom due to the Azopardo supply incident. Higher costs, both power purchases and fixed costs, which were not offset by a corresponding increase in revenues ahead of the upcoming tariff hike - situation that might change in the future- accounted for the rest of the fall in earnings.
47
Financial strength: 23.7% improvement in financial results
Financial results for the electricity business in Latin America reflected a loss of Euro 290 million in the first nine months of 2005, Euro 90 million less than recorded in the same period of 2004.
Exchange rate differences were Euro 105 million higher, going from losses of Euro 33 million in January-September 2004 to gains of Euro 72 million in January-September 2005.
Intragroup transactions in foreign currency, normally in dollars but, in accordance with paragraph 33 of IAS 21, not eliminated in consolidation, contributed Euro 34 million of exchange gains. At its 22 and 23 June meeting, the IASB decided to modify this paragraph, whereby translation differences are taken to reserves.
Until the EU authorities endorses this change, the previous version of IAS 21 remains in force in the IFRS adopted by the European Union. Depending on whether this change is endorsed and when it takes effect, if at all, the accounting of translation differences by ENDESA for 2005 could change.
The impact of these differences on ENDESA’s net income as of 30 September 2005 was Euro 17 million.
Net financial expenses totalled Euro 362 million, Euro 15 million or 4.3% higher than in January-September 2004. This increase relates to the performance of the Euro with respect to the Latin American currencies and the dollar, which led to an increase in debt denominated in these currencies.
Net debt at ENDESA’s Latin American business stood at Euro 6,237 million at 30 September 2005, an increase of Euro 887 million since the existing at the beginning of the year. The increase in net debt is due to the depreciation of the euro against the currencies in which the group’s Latin American subsidiaries hold their debt, representing a total increase of Euro 873 million. Stripping out the impact of this depreciation, and taking account both the Euro 113 million dividends paid to the parent company, as well as the Euro 359 millon capital reduction and dividends paid to third parties, the debt would have decreased Euro 458 million.
Enersis and Endesa Chile performance in financial markets
The strong business performance of ENDESA’s Latin American business was reflected in the share prices performance of both Enersis and Endesa Chile - ENDESA’s main subsidiaries - whose share prices have risen by 34% and 63% respectively, in the New York Stock Exchange, in the first nine months of 2005.
Two major rating agencies improved the credit rating outlook of both companies.
Cash flow: up 15.2%
Cash flow generated by the group’s business in Latin America totalled Euro 766 million in the first nine months of 2005, an increase of 15.2% with respect to 2004.
48
Investments: Euro 512 million
Investments in the Latin American electricity business were Euro 512 million in the period January-September 2005. Of this sum, Euro 384 million was capex, broken down as follows:
CAPEX IN LATIN AMERICA | ||||||||||
| Euro million | ||||||||||
| Jan-Sep 2005 | Jan-Sep 2004 | % Chg | ||||||||
| Generation | 122 | 152 | (19.7 | ) | ||||||
| Distribution and Transmission | 243 | 177 | 37.3 | |||||||
| Others | 19 | 8 | 137.5 | |||||||
Total | 384 | 337 | 13.9 | |||||||
The decrease in generation capex was due mainly to the completion of the construction of the Ralco hydroelectric plant, which, as mentioned before, came on-stream in the second half of 2004.
Financial investments for the period amounted to Euro 124 million, which includes the acquisition of minority interests in Compañía Eléctrica San Isidro, an Endesa Chile subsidiary, for USD 21 million (Euro 17 million).
Optimisation of organisational structure
In the third quarter of 2005 ENDESA set up Endesa Brasil, S.A. At the end of October, this holding company’s shareholders contributed all the assets owned by ENDESA in Brazil.
Also in the same month, an agreement was reached to merge Chilectra and Edesur, both of which were owned by Enersis, with stakes of 98.24% and 100%, respectively.
Transaction will be executed through the acquisition of Chilectra by Edesur and the operation forms part of the Group’s strategy to simplify its corporate structure.
San Isidro II and Palmucho Plants Construction (Chile)
Endesa Chile plans to build a combined cycle plant using LNG. This facility, to be called San Isidro II, will have a total installed capacity of 377 MW.
In connection with this initiative, an EPC contract was signed by the Company with Mitsubishi and the civil engineering plans are currently being drawn up.
The schedule envisages it coming on stream for open cycle plant operation with diesel in 2007, with capacity of 210 MW, moving to combined cycle diesel operation with capacity of 310MW in 2008 and to commercial operations fuelled by LNG once this arrives in Chile, currently scheduled for year 2009.
Endesa Chile started the construction of Palmucho, a 32 MW hydro power plant.
49
Strong EBITDA growth for the year 2005
According to current estimates, EBITDA for the business in Latin America will reach around Euro 1,750 million by year-end 2005, implying a 15% increase vs. 2004.
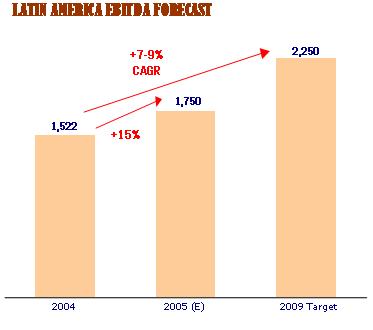
LATIN AMERICA EBITDA FORECAST 2004: 1,522 +15% 2005(E): 1,750 2009 Target: 2,250 |
50
ACCOUNTING CRITERIA
51
ENDESA has prepared its consolidated financial statements for the first nine months of 2005 in accordance with the valuation and classification criteria required by International Financial Reporting Standards (IFRS) endorsed by the European Union to date.
Under IFRS I, the date for transition to IFRS is January 1st, 2004. Therefore, figures for the third quarter of 2004 and to 31 December 2004 have also been drawn up under IFRS to facilitate comparisons. Therefore, they do not correspond to those presented in ENDESA’s 2004 consolidated financial statements, which were prepared under Spanish GAAP.
Under IFRS I, which regulates first-time adoption of IFRS, companies do not need to apply IAS 32 and 39 on financial instruments to figures from the 2004 financial statements presented for comparison purposes. ENDESA has taken up this option and 2004 figures therefore do not include the impact of IAS 32 and 39.
Note, however, that all references to balance sheet items “at 1 January 2005” or “at the start of 2005” refer to the information at 31 December 2004 adjusted for first-time application of IAS 32 and 39.
In order to facilitate investors and analysts with information regarding the effects of adopting IFRS, on 5 April 2005, the Company filed a press release containing the most significant adjustments made in transitioning from Spanish GAAP to IFRS and their implications. This press release was lodged with the Spanish securities regulator, the CNMV, under registered file no. 18131.
The consolidated financial statements for 2005 and 2004 included in the annual accounts for 2005 must be prepared under the IFRS endorsed by the European Union as of 31 December 2005. Accordingly, any change in the rules endorsed by the European Union or interpretation of the same between now and the end of the year could lead to modifications in the consolidated financial statements as of 30 September 2005, although, given year-end is near, further significant changes to the accounts of ENDESA are not expected.
52
STATISTICAL APPENDIX
53
KEY FIGURES
Electricity Generation (GWh) | 9M 2005 | 9M 2004 | % Chg | |||||||
| Electricity business in Spain and Portugal | 69,769 | 72,357 | (3.6 | ) | ||||||
| Electricity business in Europe | 24,410 | 17,020 | 43.4 | |||||||
| Electricity business in Latin America | 42,870 | 40,664 | 5.4 | |||||||
TOTAL | 137,049 | 130,041 | 5.4 | |||||||
Electricity Generation in Spain and Portugal (GWh) | 9M 2005 | 9M 2004 | % Chg | |||||||
Mainland | 59,375 | 62,476 | (5.0 | ) | ||||||
| Nuclear | 16,835 | 19,525 | (13.8 | ) | ||||||
| Coal | 27,216 | 27,289 | (0.3 | ) | ||||||
| Hydroelectric | 6,085 | 8,686 | (29.9 | ) | ||||||
| Combined cycle - CCGT | 5,641 | 4,524 | 24.7 | |||||||
| Fuel oil | 2,029 | 1,078 | 88.2 | |||||||
| Renewables/CHP | 1,569 | 1,374 | 14.2 | |||||||
Non-mainland | 10,394 | 9,881 | 5.2 | |||||||
TOTAL | 69,769 | 72,357 | (3.6 | ) | ||||||
Electricity Generation in Europe (GWh) | 9M 2005 | 9M 2004 | % Chg | |||||||
| Coal | 11,457 | 5,299 | 116.2 | |||||||
| Hydroelectric | 1,820 | 1,855 | (1.9 | ) | ||||||
| Combined cycle - CCGT | 8,318 | 4,366 | 90.5 | |||||||
| Fuel oil | 2,796 | 5,497 | (49.1 | ) | ||||||
| Wind | 19 | 3 | 533.3 | |||||||
TOTAL | 24,410 | 17,020 | 43.4 | |||||||
Electricity Generation in Latin America (GWh) | 9M 2005 | 9M 2004 | % Chg | |||||||
| Chile | 13,778 | 12,086 | 14.0 | |||||||
| Argentina | 12,046 | 11,666 | 3.3 | |||||||
| Peru | 5,061 | 4,107 | 23.2 | |||||||
| Colombia | 8,855 | 9,019 | (1.8 | ) | ||||||
| Brazil | 3,130 | 3,786 | (17.3 | ) | ||||||
TOTAL | 42,870 | 40,664 | 5.4 | |||||||
Electricity sales (GWh) | 9M 2005 | 9M 2004 | % Chg | |||||||
Electricity business in Spain and Portugal | 75,381 | 72,689 | 3.7 | |||||||
| Regulated market | 47,939 | 49,831 | (3.8 | ) | ||||||
| Deregulated market | 27,442 | 22,858 | 20.1 | |||||||
Electricity business in Europe | 34,314 | 20,848 | 64.6 | |||||||
Electricity business in Latin America | 41,033 | 38,905 | 5.5 | |||||||
| Chile | 8,847 | 8,449 | 4.7 | |||||||
| Argentina | 10,498 | 10,014 | 4.8 | |||||||
| Peru | 3,356 | 3,150 | 6.5 | |||||||
| Colombia | 7,469 | 7,165 | 4.2 | |||||||
| Brazil | 10,863 | 10,127 | 7.3 | |||||||
TOTAL | 150,728 | 132,442 | 13.8 | |||||||
54
Gas sales (GWh) | 9M 2005 | 9M 2004 | % Chg | |||||||
| Regulated market | 1,934 | 1,907 | 1.4 | |||||||
| Deregulated market | 13,355 | 7,887 | 69.3 | |||||||
TOTAL | 15,289 | 9,794 | 56.1 | |||||||
Workforce | 30-09-05 | 31-12-04 | % Chg | |||||||
| Electricity business in Spain and Portugal | 12,730 | 12,889 | (1.2 | ) | ||||||
| Electricity business in Europe | 2,313 | 2,440 | (5.2 | ) | ||||||
| Electricity business in Latin America | 12,343 | 11,735 | 5.2 | |||||||
| Other businesses | 54 | 93 | (41.9 | ) | ||||||
TOTAL | 27,440 | 27,157 | 1.0 | |||||||
FINANCIAL DATA
Key figures | 9M 2005 | 9M 2004 | % Chg | |||||||
| EPS (euros) | 1.47 | 1.11 | 32.8 | |||||||
| Cash flow per share (euros) | 2.77 | 2.40 | 15.4 | |||||||
| Book value per share (euros) | 9.90 | 8.12** | 21.8 | |||||||
Net financial debt (Euro million) | 30-09-05 | 01-01-05 | % Chg | |||||||
| Electricity business in Spain and Portugal | 11,452 | 9,586 | 19.5 | |||||||
| Electricity business in Europe | 1,480 | 2,123 | (30.3 | ) | ||||||
| ENDESA Italia | 995 | 1,293 | (23.0 | ) | ||||||
| Other | 485 | 830 | (41.6 | ) | ||||||
| Electricity business in Latin America | 6,237 | 5,350 | 16.6 | |||||||
| Enersis | 5,063 | 4,081 | 24.1 | |||||||
| Other | 1,174 | 1,269 | (7.5 | ) | ||||||
| Other businesses | 1,250 | 1,639 | (23.7 | ) | ||||||
TOTAL | 20,419 | 18,698 | 9.2 | |||||||
| Gearing (%) | 135.0 | 149.6 | N/A | |||||||
| Net debt/operating cash flow (times) | 3.5 | 3. 5* | N/A | |||||||
| Interest coverage with operating cash flow (times) | 5.9 | 5.3* | N/A | |||||||
“Rating” (16-11-05) | Long term | Short term | Outlook | |||||||
| Standard & Poor’s | A | A-1 | Revision (- | ) | ||||||
| Moody’s | A3 | P-2 | Negative | |||||||
| Fitch | A | F1 | Revision (- | ) | ||||||
55
Main fixed income issues | Spread over IRS (bp) | ||||||
30-09-05 | 31-12-04 | ||||||
| 3.7 Y €700M 4.375% Mat. September 2009 | 5 | 17 | |||||
| 6.8 Y GBP 400M 6.125% Mat. Septembre 2012 | 27 | 33 | |||||
| 7.4 Y €700M 5.375% Mat. Feb 2013 | 21 | 31 | |||||
Stock market data | 30-09-05 | 31-12-04 | % Chg | |||||||
| Market cap (Euro million) | 23,578 | 18,306 | 28.80 | |||||||
| Number of shares outstanding | 1,058,752,117 | 1,058,752,117 | -- | |||||||
| Nominal share value (€) | 1.2 | 1.2 | -- | |||||||
Stock market data | 9M 05 | 9M 04 | % Chg | |||||||
| Trading volumes (shares) | ||||||||||
| Madrid stock exchange | 2,116,538,073 | 1,707,596,826 | 23.95 | |||||||
| NYSE | 20,964,800 | 17,804,900 | 17.75 | |||||||
| Average daily trading volume (shares) | ||||||||||
| Madrid stock exchange | 11,023,635 | 8,940,298 | 23.30 | |||||||
| NYSE | 110,925 | 94,707 | 17.12 | |||||||
Share price | High 9M 2005 | Low 9M 2005 | 30-09-05 | 31-12-04 | |||||||||
| Madrid stock exchange (euros) | 22.30 | 16.63 | 22.27 | 17.29 | |||||||||
| NYSE (USD) | 26.90 | 21.63 | 26.77 | 23.27 | |||||||||
Dividends (euro cents/share) | Payable against 2004 results | |||
| Interim dividend (3-01-05) | 27.20 | |||
| Final dividend (01-07-05) | 46.62 | |||
| Total DPS | 73.82 | |||
| Pay-out (%) | 56.7 | |||
| Dividend yield (%) | 3.31 | |||
* As of September 30th, 2004.
** As of January 1st, 2005.
NOTE: The results presentation is available for download from endesa’s website (www.endesa.es).
For additional information please contact David Raya, North America
Investor Relations Office, telephone # 212 750 7200
http://www.endesa.es
56
Cautionary Statement for Purposes of the “Safe Harbor” Provisions of the United States Private Securities Litigation Reform Act of 1995.
The U.S. Private Securities Litigation Reform Act of 1995 provides a safe harbor for forward-looking statements. This presentation contains certain “forward-looking statements” regarding anticipated financial and operating results and statistics and other future events. These statements are not guarantees of future performance and are subject to material risks, uncertainties, changes and other factors which may be beyond Endesa’s control or may be difficult to predict. Forward-looking statements include, but are not limited to, information regarding: estimated future earnings; anticipated increases in wind and CCGTs generation and market share; expected increases in demand for gas and gas sourcing; management strategy and goals; estimated cost reductions; tariffs and pricing structure; estimated capital expenditures and other investments; expected asset disposals; estimated increases in capacity and output and changes in capacity mix; repowering of capacity and macroeconomic conditions. For example, the EBITDA, net income and dividend forecasts for the year ending December 31, 2005 and the EBITDA and dividends targets for 2004 to 2009 included in this presentation are forward-looking statements and are based on certain assumptions which may or may not prove correct. The principal assumptions underlying these forecasts and targets relate to regulatory environment, exchange rates, divestments, increases in production and installed capacity in the various markets where Endesa operates, increases in demand in these markets, allocation of production among different technologies increased costs associated with higher activity levels not exceeding certain levels, the market price of electricity not falling below certain levels, the cost of CCGT and the availability and cost of gas, fuel, coal and emission rights necessary to operate our business at desired levels. For all of the forward-looking statements in this presentation, Endesa claims the protection of the safe harbor for forward-looking statements contained in the Private Securities Litigation Reform Act of 1995. The following important factors, in addition to those discussed elsewhere in this presentation, could cause actual financial and operating results and statistics to differ materially from those expressed in our forward-looking statements:
Economic and Industry Conditions: materially adverse changes in economic or industry conditions generally or in our markets; the effect of existing regulations and regulatory changes; tariff reductions; the impact of any fluctuations in interest rates; the impact of fluctuations in exchange rates; natural disasters; the impact of more stringent environmental regulations and the inherent environmental risks relating to our business operations; the potential liabilities relating to our nuclear facilities.
Transaction or Commercial Factors: any delays in or failure to obtain necessary regulatory, antitrust and other approvals for our proposed acquisitions or asset disposals, or any conditions imposed in connection with such approvals; our ability to integrate acquired businesses successfully; the challenges inherent in diverting management's focus and resources from other strategic opportunities and from operational matters during the process of integrating acquired businesses; the outcome of any negotiations with partners and governments. Any delays in or failure to obtain necessary regulatory approvals, including environmental to construct new facilities, repowering or enhancement of existing facilities; shortages or changes in the price of equipment, materials or labor; opposition of political and ethnic groups; adverse changes in the political and regulatory environment in the countries where we and our related companies operate; adverse weather conditions, which may delay the completion of power plants or substations, or natural disasters, accidents or other unforeseen events; and the inability to obtain financing at rates that are satisfactory to us.
Political/Governmental Factors: political conditions in Latin America; changes in Spanish, European and foreign laws, regulations and taxes.
Operating Factors: technical difficulties; changes in operating conditions and costs; the ability to implement cost reduction plans; the ability to maintain a stable supply of coal, fuel and gas and the impact of fluctuations on fuel and gas prices; acquisitions or restructurings; the ability to implement an international and diversification strategy successfully.
Competitive Factors: the actions of competitors; changes in competition and pricing environments; the entry of new competitors in our markets.
Further information about the reasons why actual results and developments may differ materially from the expectations disclosed or implied by our forward-looking statements can be found under “Risk Factors” in our annual report on Form 20-F for the year ended December 31, 2004.
No assurance can be given that the forward-looking statements in this document will be realized. Neither Endesa nor any of its affiliates intends to update these forward-looking statements.
57
| ENDESA S.A. AND SUBSIDIARIES | ||||||||||||||||
| CONSOLIDATED BALANCE SHEETS | ||||||||||||||||
| AS OF SEPTEMBER 30, 2005, JANUARY 1, 2005 AND DECEMBER 31, 2004 | ||||||||||||||||
| (Unaudited) | ||||||||||||||||
Euro Million | ||||||||||||||||
ASSETS | 30.09.05 | 01.01.05 (1) | 31.12.04 | Variation (2) | ||||||||||||
Total fixed assets | 43,234 | 39,402 | 39,303 | 3,832 | 9.73 | % | ||||||||||
| Utility plant | 31,367 | 28,947 | 28,947 | 2,420 | 8.36 | % | ||||||||||
| Investment property | 36 | 36 | ||||||||||||||
| Intagible asset | 723 | 323 | 323 | 400 | 123.84 | % | ||||||||||
| Goodwill | 4,142 | 3,556 | 3,556 | 586 | 16.48 | % | ||||||||||
| Long term financial investments | 3,273 | 1,337 | 1,296 | 1,936 | 144.80 | % | ||||||||||
| Investments in associates | 618 | 2,173 | 2,191 | (1,555 | ) | -71.56 | % | |||||||||
| Deferred tax assets | 3,075 | 3,066 | 2,990 | 9 | 0.29 | % | ||||||||||
Total current assets | 7,742 | 7,783 | 7,879 | (41 | ) | -0.53 | % | |||||||||
| Inventories | 852 | 777 | 777 | 75 | 9.65 | % | ||||||||||
| Cash and cash equivalents | 1,015 | 2,178 | 2,178 | (1,163 | ) | -53.40 | % | |||||||||
| Other current assets | 5,875 | 4,828 | 4,924 | 1,047 | 21.69 | % | ||||||||||
Assets held for sale | 947 | 947 | N/A | |||||||||||||
TOTAL ASSETS | 51,923 | 47,185 | 47,182 | 4,738 | 10.04 | % | ||||||||||
EQUITY AND LIABILITIES | 30.09.05 | 01.01.05 (1 | ) | 31.12.04 | Variation (2) | |||||||||||
Total equity | 15,121 | 12,498 | 14,133 | 2,623 | 20.99 | % | ||||||||||
| Atributtable to equity holders of the parent company | 10,478 | 8,600 | 8,728 | 1,878 | 21.84 | % | ||||||||||
| Minority interest | 4,643 | 3,898 | 5,405 | 745 | 19.11 | % | ||||||||||
Non-current liabilities | 29,796 | 28,038 | 26,400 | 1,758 | 6.27 | % | ||||||||||
| Deferred revenues | 2,000 | 1,535 | 1,535 | 465 | 30.29 | % | ||||||||||
| Preferred shares | 1,416 | 1,409 | 7 | 0.50 | % | |||||||||||
| Long term provisions | 4,793 | 4,394 | 4,394 | 399 | 9.08 | % | ||||||||||
| Long term financial debt | 18,572 | 17,926 | 17,715 | 646 | 3.60 | % | ||||||||||
| Other non-current liabilities | 1,044 | 1,032 | 1,032 | 12 | 1.16 | % | ||||||||||
| Deferred tax liabilities | 1,971 | 1,742 | 1,724 | 229 | 13.15 | % | ||||||||||
Current liabilities | 7,006 | 6,649 | 6,649 | 357 | 5.37 | % | ||||||||||
| Short term financial debt | 1,446 | 1,541 | 1,541 | (95 | ) | -6.16 | % | |||||||||
| Trade and other payables | 5,560 | 5,108 | 5,108 | 452 | 8.85 | % | ||||||||||
TOTAL EQUITY AND LIABILITIES | 51,923 | 47,185 | 47,182 | 4,738 | 10.04 | % | ||||||||||
| (1) Includes NIC 32 and 39 effect | ||||||||||||||||
| (2) Variation from 01.01.05 | ||||||||||||||||
| ENDESA S.A. AND SUBSIDIARIES | |||||||||||||
| CONSOLIDATED STATEMENTS OF INCOME | |||||||||||||
| (Unaudited) | |||||||||||||
Euro Million | |||||||||||||
30.09.05 | 30.09.04 | Variation | |||||||||||
| REVENUES | 13,268 | 10,155 | 3,113 | 30.7 | % | ||||||||
| Sales | 12,643 | 9,970 | 2,673 | 26.8 | % | ||||||||
| Other operating revenues | 625 | 185 | 440 | 237.8 | % | ||||||||
| PURCHASES AND SERVICES | 6,770 | 4,562 | 2,208 | 48.4 | % | ||||||||
| Energy purchases | 2,640 | 1,709 | 931 | 54.5 | % | ||||||||
| Fuel procurement costs | 2,538 | 1,958 | 580 | 29.6 | % | ||||||||
| Transmission expenses | 476 | 376 | 100 | 26.6 | % | ||||||||
| Other variable purchases and services | 1,116 | 519 | 597 | 115.0 | % | ||||||||
| GROSS MARGIN | 6,498 | 5,593 | 905 | 16.2 | % | ||||||||
| Work performed by the entity and capitalized | 121 | 111 | 10 | 9.0 | % | ||||||||
| Personnel expenses | 1,035 | 884 | 151 | 17.1 | % | ||||||||
| Other fixed operating expenses | 1,185 | 1,024 | 161 | 15.7 | % | ||||||||
| GROSS OPERATING INCOME (EBITDA) | 4,399 | 3,796 | 603 | 15.9 | % | ||||||||
| Depreciation and amortization | 1,293 | 1,195 | 98 | 8.2 | % | ||||||||
| OPERATING INCOME (EBIT) | 3,106 | 2,601 | 505 | 19.4 | % | ||||||||
| FINANCIAL INCOME | (748 | ) | -850 | 102 | -12.0 | % | |||||||
| Net financial expenses | (814 | ) | -836 | 22 | -2.6 | % | |||||||
| Foreign exchanges | 66 | -14 | 80 | -571.4 | % | ||||||||
| Share of profit of associates | 65 | 54 | 11 | 20.4 | % | ||||||||
| Income from other investments | 8 | 18 | (10 | ) | -55.6 | % | |||||||
| Income from asset sales | 207 | 157 | 50 | 31.8 | % | ||||||||
| INCOME BEFORE TAXES | 2,638 | 1,980 | 658 | 33.2 | % | ||||||||
| Income tax | 711 | 507 | 204 | 40.2 | % | ||||||||
| NET INCOME | 1,927 | 1,473 | 454 | 30.8 | % | ||||||||
| Attributable to the holders of the parent company | 1,556 | 1,172 | 384 | 32.8 | % | ||||||||
| Minority interest | 371 | 301 | 70 | 23.3 | % | ||||||||
Net income per share (expressed in euros) | 1.47 | 1.11 | |||||||||||
| ENDESA S.A. AND SUBSIDIARIES | |||||||||||||
| CONSOLIDATED STATEMENTS OF INCOME | |||||||||||||
| (Unaudited) | |||||||||||||
3Q RESULTS | |||||||||||||
3Q 05 | 3Q 04 | Variation | |||||||||||
| REVENUES | 4,675 | 3,577 | 1,098 | 30.7 | % | ||||||||
| Sales | 4,423 | 3,510 | 913 | 26.0 | % | ||||||||
| Other operating revenues | 252 | 67 | 185 | 276.1 | % | ||||||||
| PURCHASES AND SERVICES | 2,397 | 1,684 | 713 | 42.3 | % | ||||||||
| Energy purchases | 906 | 611 | 295 | 48.3 | % | ||||||||
| Fuel procurement costs | 921 | 758 | 163 | 21.5 | % | ||||||||
| Transmission expenses | 173 | 131 | 42 | 32.1 | % | ||||||||
| Other variable purchases and services | 397 | 184 | 213 | 115.8 | % | ||||||||
| GROSS MARGIN | 2,278 | 1,893 | 385 | 20.3 | % | ||||||||
| Work performed by the entity and capitalized | 42 | 39 | 3 | 7.7 | % | ||||||||
| Personnel expenses | 356 | 314 | 42 | 13.4 | % | ||||||||
| Other fixed operating expenses | 389 | 368 | 21 | 5.7 | % | ||||||||
| GROSS OPERATING INCOME (EBITDA) | 1,575 | 1,250 | 325 | 26.0 | % | ||||||||
| Depreciation and amortization | 438 | 421 | 17 | 4.0 | % | ||||||||
| OPERATING INCOME (EBIT) | 1,137 | 829 | 308 | 37.2 | % | ||||||||
| FINANCIAL INCOME | (273 | ) | (258 | ) | (15 | ) | 5.8 | % | |||||
| Net financial expenses | (278 | ) | (246 | ) | (32 | ) | 13.0 | % | |||||
| Foreign exchanges | 5 | (12 | ) | 17 | -141.7 | % | |||||||
| Share of profit of associates | 26 | 27 | (1 | ) | -3.7 | % | |||||||
| Income from other investments | 1 | (4 | ) | 5 | -125.0 | % | |||||||
| Income from asset sales | 93 | 23 | 70 | 304.3 | % | ||||||||
| INCOME BEFORE TAXES | 984 | 617 | 367 | 59.5 | % | ||||||||
| Income tax | 250 | 117 | 133 | 113.7 | % | ||||||||
| NET INCOME | 734 | 500 | 234 | 46.8 | % | ||||||||
| Attributable to the holders of the parent company | 600 | 394 | 206 | 52.3 | % | ||||||||
| Minority interest | 134 | 106 | 28 | 26.4 | % | ||||||||
| ENDESA S.A. AND SUBSIDIARIES | |||||||
| CONSOLIDATED STATEMENTS OF CASH FLOWS | |||||||
| (Unaudited) | |||||||
Euro Million | |||||||
30.09.05 | 30.09.04 | ||||||
| Consolidated income before income taxes | 2,638 | 1,980 | |||||
| Amortization | 1,293 | 1,195 | |||||
| Income from asset sales | (207 | ) | (157 | ) | |||
| Income tax | (587 | ) | (342 | ) | |||
| Provisions payments | (286 | ) | (292 | ) | |||
| Other results without cash flow effect | 78 | 135 | |||||
Cash Flow from operating activities | 2,929 | 2,519 | |||||
| Change in deferred income tax | 386 | 231 | |||||
| Change in operating assets/liabilities | (821 | ) | 91 | ||||
Net cash provided by operating activities | 2,494 | 2,841 | |||||
| Acquisitions of fixed and intangible assets | (2,229 | ) | (1,617 | ) | |||
| Disposal of fixed and intangible assets | 163 | 27 | |||||
| Acquisitions of other investments | (1,040 | ) | (455 | ) | |||
| Disposal of other investments | 739 | 443 | |||||
| Cash flow from changes in perimeter | 7 | ||||||
| Subsidies and other deferred income | 191 | 129 | |||||
Net cash used for investing activities | (2,169 | ) | (1,473 | ) | |||
| New long-term debt | 2,649 | 1,160 | |||||
| Repayment of long-term debt | (1,266 | ) | (469 | ) | |||
| Net cash from financial debt with short term maturity | (1,965 | ) | (1,464 | ) | |||
| Proceeds / Payments from treasury stock | (104 | ) | |||||
| Dividends paid by the controlling company | (796 | ) | (739 | ) | |||
| Dividends paid to minority shareholders | (109 | ) | (54 | ) | |||
| Other payments to minority shareholders | (270 | ) | (104 | ) | |||
| Capital contribution from minority shareholders | 160 | (817 | ) | ||||
Net cash used from financing activities | (1,597 | ) | (2,591 | ) | |||
Total net cash | (1,272 | ) | (1,223 | ) | |||
| Effects of exchange rate changes on cash and cash equivalents | 109 | ||||||
Net increase in cash and cash equivalents | (1,163 | ) | (1,223 | ) | |||
Cash and cash equivalents at beginning of period | 2,178 | 2,091 | |||||
Cash and cash equivalents at end of period | 1,015 | 868 | |||||
ENDESA S.A. AND SUBSIDIARIES | |||||||||||||||||||||||||||||||
CHANGES IN TOTAL EQUITY | Euro Million | ||||||||||||||||||||||||||||||
(Unaudited) | |||||||||||||||||||||||||||||||
| EQUITY | |||||||||||||||||||||||||||||||
| ATRIBUTTABLE TO | EQUITY | ||||||||||||||||||||||||||||||
| CAPITAL | ADDITIONAL | REVALUATION | RESERVES | TRANSLATION | RESTRICTED | RETAINED | EQUITY HOLDERS | ATRIBUTTABLE TO | TOTAL | ||||||||||||||||||||||
| STOCK | PAID-IN CAPITAL | RESERVE | DIFFRENCES | RESERVES | EARNINGS | OF THE PARENT | MINORITY | EQUITY | |||||||||||||||||||||||
| COMPANY | INTEREST | ||||||||||||||||||||||||||||||
BALANCE 31.12.04 | 1,271 | 1,376 | 1,714 | 24 | 454 | 3,889 | 8,728 | 5,405 | 14,133 | ||||||||||||||||||||||
| CHANGES IN ACCOUNTING CRITERIA | -76 | -112 | -188 | -1,507 | -1,695 | ||||||||||||||||||||||||||
| TAXES | 27 | 33 | |||||||||||||||||||||||||||||
BALANCE 1.1.05 | 1,271 | 1,376 | 1,714 | -49 | 24 | 454 | 3,810 | 8,600 | 3,898 | 12,498 | |||||||||||||||||||||
| Investments to be sold | 240 | 240 | 240 | ||||||||||||||||||||||||||||
| Cash flow hedged | -101 | -101 | 21 | -80 | |||||||||||||||||||||||||||
| Translation differences | 743 | 743 | 644 | 1,387 | |||||||||||||||||||||||||||
| Taxes | 12 | -64 | -52 | ||||||||||||||||||||||||||||
| CHANGES IN TOTAL EQUITY | 0 | 0 | 0 | 151 | 679 | 0 | 0 | 830 | 665 | 1,495 | |||||||||||||||||||||
| Net Income | 1,556 | 1,556 | 371 | 1,927 | |||||||||||||||||||||||||||
| ATRIBUTTABLE TO EQUITY IN THE PERIOD | 0 | 0 | 0 | 151 | 679 | 0 | 1,556 | 2,386 | 1,036 | 3,422 | |||||||||||||||||||||
| Dividends | -508 | -508 | -161 | -669 | |||||||||||||||||||||||||||
| Increase / Reduction in equity subsidiaries | 0 | -248 | -248 | ||||||||||||||||||||||||||||
| Minority interest | 0 | 118 | 118 | ||||||||||||||||||||||||||||
BALANCE 30.09.05 | 1,271 | 1,376 | 1,714 | 102 | 703 | 454 | 4,858 | 10,478 | 4,643 | 15,121 | |||||||||||||||||||||
| CONSOLIDATED BALANCE SHEETS | ||||||||||||||||
| SPAIN AND PORTUGAL ELECTRICITY BUSINESS | ||||||||||||||||
| (Unaudited) | ||||||||||||||||
Euro Million | ||||||||||||||||
ASSETS | 30.09.05 | 01.01.05 (1) | 31.12.04 | Variation (2) | ||||||||||||
Total fixed assets | 22,685 | 20,331 | 20,219 | 2,354 | 11.58 | % | ||||||||||
| Utility plant | 17,380 | 16,657 | 16,657 | 723 | 4.34 | % | ||||||||||
| Investment property | 4 | 4 | ||||||||||||||
| Intagible asset | 627 | 251 | 251 | 376 | 149.80 | % | ||||||||||
| Goodwill | 146 | 146 | N/A | |||||||||||||
| Long term financial investments | 1,862 | 744 | 703 | 1,118 | 150.27 | % | ||||||||||
| Investments in associates | 423 | 402 | 402 | 21 | 5.22 | % | ||||||||||
| Deferred tax assets | 2,243 | 2,277 | 2,206 | (34 | ) | -1.49 | % | |||||||||
Total current assets | 4,215 | 4,563 | 4,659 | (348 | ) | -7.63 | % | |||||||||
| Inventories | 559 | 501 | 501 | 58 | 11.58 | % | ||||||||||
| Cash and cash equivalents | 196 | 1,306 | 1,306 | (1,110 | ) | -84.99 | % | |||||||||
| Other current assets | 3,460 | 2,756 | 2,852 | 704 | 25.54 | % | ||||||||||
Assets held for sale | 21 | 21 | N/A | |||||||||||||
TOTAL ASSETS | 26,921 | 24,894 | 24,878 | 2,027 | 8.14 | % | ||||||||||
EQUITY AND LIABILITIES | 30.09.05 | 01.01.05 (1) | 31.12.04 | Variation (2) | ||||||||||||
Total equity | 5,490 | 4,838 | 6,435 | 652 | 13.48 | % | ||||||||||
| Atributtable to equity holders of the parent company | 5,367 | 4,722 | 4,819 | 645 | 13.66 | % | ||||||||||
| Minority interest | 123 | 116 | 1,616 | 7 | 6.03 | % | ||||||||||
Non-current liabilities | 17,545 | 16,086 | 14,473 | 1,459 | 9.07 | % | ||||||||||
| Deferred revenues | 1,715 | 1,446 | 1,446 | 269 | 18.60 | % | ||||||||||
| Preferred shares | 1,416 | 1,409 | 7 | 0.50 | % | |||||||||||
| Long term provisions | 3,631 | 3,451 | 3,451 | 180 | 5.22 | % | ||||||||||
| Long term financial debt | 9,888 | 8,917 | 8,731 | 971 | 10.89 | % | ||||||||||
| Other non-current liabilities | 389 | 387 | 387 | 2 | 0.52 | % | ||||||||||
| Deferred tax liabilities | 506 | 476 | 458 | 30 | 6.30 | % | ||||||||||
Current liabilities | 3,886 | 3,970 | 3,970 | (84 | ) | -2.12 | % | |||||||||
| Short term financial debt | 344 | 566 | 566 | (222 | ) | -39.22 | % | |||||||||
| Trade and other payables | 3,542 | 3,404 | 3,404 | 138 | 4.05 | % | ||||||||||
TOTAL EQUITY AND LIABILITIES | 26,921 | 24,894 | 24,878 | 2,027 | 8.14 | % | ||||||||||
| (1) Includes NIC 32 and 39 effect | ||||||||||||||||
| (2) Variation from 01.01.05 | ||||||||||||||||
CONSOLIDATED STATEMENTS OF INCOME | |||||||||||||
SPAIN AND PORTUGAL ELECTRICITY BUSINESS | |||||||||||||
(Unaudited) | Euro Million | ||||||||||||
30.09.05 | 30.09.04 | Variation | |||||||||||
| REVENUES | 6,651 | 5,091 | 1,560 | 30.6 | % | ||||||||
| Sales | 6,175 | 4,996 | 1,179 | 23.6 | % | ||||||||
| Other operating revenues | 476 | 95 | 381 | 401.1 | % | ||||||||
| PURCHASES AND SERVICES | 2,992 | 1,659 | 1,333 | 80.3 | % | ||||||||
| Energy purchases | 649 | 290 | 359 | 123.8 | % | ||||||||
| Fuel procurement costs | 1,493 | 1,107 | 386 | 34.9 | % | ||||||||
| Transmission expenses | 176 | 132 | 44 | 33.3 | % | ||||||||
| Other variable purchases and services | 674 | 130 | 544 | 418.5 | % | ||||||||
| GROSS MARGIN | 3,659 | 3,432 | 227 | 6.6 | % | ||||||||
| Work performed by the entity and capitalized | 100 | 93 | 7 | 7.5 | % | ||||||||
| Personnel expenses | 673 | 605 | 68 | 11.2 | % | ||||||||
| Other fixed operating expenses | 706 | 680 | 26 | 3.8 | % | ||||||||
| GROSS OPERATING INCOME (EBITDA) | 2,380 | 2,240 | 140 | 6.3 | % | ||||||||
| Depreciation and amortization | 746 | 792 | (46 | ) | -5.8 | % | |||||||
| OPERATING INCOME (EBIT) | 1,634 | 1,448 | 186 | 12.8 | % | ||||||||
| FINANCIAL INCOME | (359 | ) | (392 | ) | 33 | -8.4 | % | ||||||
| Net financial expenses | (356 | ) | (397 | ) | 41 | -10.3 | % | ||||||
| Foreign exchanges | (3 | ) | 5 | (8 | ) | -160.0 | % | ||||||
| Share of profit of associates | 42 | 32 | 10 | 31.3 | % | ||||||||
| Income from other investments | 2 | 18 | (16 | ) | -88.9 | % | |||||||
| Income from asset sales | 102 | 40 | 62 | 155.0 | % | ||||||||
| INCOME BEFORE TAXES | 1,421 | 1,146 | 275 | 24.0 | % | ||||||||
| Income tax | 364 | 253 | 111 | 43.9 | % | ||||||||
| NET INCOME | 1,057 | 893 | 164 | 18.4 | % | ||||||||
| Attributable to the holders of the parent company | 1,051 | 845 | 206 | 24.4 | % | ||||||||
| Minority interest | 6 | 48 | (42 | ) | -87.5 | % | |||||||
3Q CONSOLIDATED STATEMENTS OF INCOME | |||||||||||||
SPAIN AND PORTUGAL ELECTRICITY BUSINESS | |||||||||||||
(Unaudited) | Euro Million | ||||||||||||
3Q 05 | 3Q 04 | Variation | |||||||||||
| REVENUES | 2,365 | 1,841 | 524 | 28.5 | % | ||||||||
| Sales | 2,171 | 1,809 | 362 | 20.0 | % | ||||||||
| Other operating revenues | 194 | 32 | 162 | 506.3 | % | ||||||||
| PURCHASES AND SERVICES | 1,117 | 649 | 468 | 72.1 | % | ||||||||
| Energy purchases | 221 | 105 | 116 | 110.5 | % | ||||||||
| Fuel procurement costs | 572 | 446 | 126 | 28.3 | % | ||||||||
| Transmission expenses | 67 | 46 | 21 | 45.7 | % | ||||||||
| Other variable purchases and services | 257 | 52 | 205 | 394.2 | % | ||||||||
| GROSS MARGIN | 1,248 | 1,192 | 56 | 4.7 | % | ||||||||
| Work performed by the entity and capitalized | 36 | 30 | 6 | 20.0 | % | ||||||||
| Personnel expenses | 231 | 209 | 22 | 10.5 | % | ||||||||
| Other fixed operating expenses | 218 | 254 | (36 | ) | -14.2 | % | |||||||
| GROSS OPERATING INCOME (EBITDA) | 835 | 759 | 76 | 10.0 | % | ||||||||
| Depreciation and amortization | 246 | 300 | (54 | ) | -18.0 | % | |||||||
| OPERATING INCOME (EBIT) | 589 | 459 | 130 | 28.3 | % | ||||||||
| FINANCIAL INCOME | (122 | ) | (120 | ) | (2 | ) | 1.7 | % | |||||
| Net financial expenses | (127 | ) | (124 | ) | (3 | ) | 2.4 | % | |||||
| Foreign exchanges | 5 | 4 | 1 | 25.0 | % | ||||||||
| Share of profit of associates | 21 | 26 | (5 | ) | -19.2 | % | |||||||
| Income from other investments | (4 | ) | 4 | -100.0 | % | ||||||||
| Income from asset sales | 27 | 22 | 5 | 22.7 | % | ||||||||
| INCOME BEFORE TAXES | 515 | 383 | 132 | 34.5 | % | ||||||||
| Income tax | 140 | 58 | 82 | 141.4 | % | ||||||||
| NET INCOME | 375 | 325 | 50 | 15.4 | % | ||||||||
| Attributable to the holders of the parent company | 372 | 310 | 62 | 20.0 | % | ||||||||
| Minority interest | 3 | 15 | (12 | ) | -80.0 | % | |||||||
STATEMENTS OF CASH FLOWS | |||||||
SPAIN AND PORTUGAL ELECTRICITY BUSINESS | |||||||
(Unaudited) | Euro Million | ||||||
30.09.05 | 30.09.04 | ||||||
| Consolidated income before income taxes | 1,421 | 1,146 | |||||
| Amortization | 746 | 792 | |||||
| Income from asset sales | (102 | ) | (40 | ) | |||
| Income tax | (291 | ) | (213 | ) | |||
| Provisions payments | (253 | ) | (263 | ) | |||
| Other results without cash flow effect | 148 | 48 | |||||
Cash Flow from operating activities | 1,669 | 1,470 | |||||
| Change in deferred income tax | 209 | 209 | |||||
| Change in operating assets/liabilities | (735 | ) | (420 | ) | |||
Net cash provided by operating activities | 1,143 | 1,259 | |||||
| Acquisitions of fixed and intangible assets | (1,659 | ) | (1,024 | ) | |||
| Disposal of fixed and intangible assets | 137 | 17 | |||||
| Acquisitions of other investments | (940 | ) | (125 | ) | |||
| Disposal of other investments | 2 | 65 | |||||
| Cash flow from change in perimeter | 7 | 6 | |||||
| Subsidies and other deferred income | 171 | 119 | |||||
Net cash used for investing activities | (2,282 | ) | (942 | ) | |||
| New long-term debt | 939 | (783 | ) | ||||
| Repayment of long-term debt | 981 | 683 | |||||
| Net cash from financial debt with short term maturity | (1,302 | ) | (731 | ) | |||
| Proceeds / Payments from treasury stock | (104 | ) | |||||
| Dividends paid by the controlling company | (588 | ) | (739 | ) | |||
| Dividends paid to minority shareholders | (1 | ) | (50 | ) | |||
| Other payments to minority shareholders | |||||||
| Capital contribution from minority shareholders | |||||||
Net cash used from financing activities | 29 | (1,724 | ) | ||||
Total net cash | (1,110 | ) | (1,407 | ) | |||
| Effects of exchange rate changes on cash and cash equivalents | |||||||
Net increase in cash and cash equivalents | (1,110 | ) | (1,407 | ) | |||
Cash and cash equivalents at beginning of period | 1,306 | 1,546 | |||||
Cash and cash equivalents at end of period | 196 | 139 | |||||
CONSOLIDATED BALANCE SHEETS | ||||||
EUROPE ELECTRICITY BUSINESS | ||||||
(Unaudited) | Euro Million | |||||
ASSETS | 30.09.05 | 01.01.05 (1) | 31.12.04 | Variation (2) | ||||||||||||
Total fixed assets | 5,352 | 5,367 | 5,365 | (15 | ) | -0.28 | % | |||||||||
| Utility plant | 3,485 | 3,532 | 3,532 | (47 | ) | -1.33 | % | |||||||||
| Intagible asset | 31 | 14 | 14 | 17 | 121.43 | % | ||||||||||
| Goodwill | 1,462 | 1,507 | 1,507 | (45 | ) | -2.99 | % | |||||||||
| Long term financial investments | 168 | 41 | 41 | 127 | 309.76 | % | ||||||||||
| Investments in associates | 66 | 112 | 112 | (46 | ) | -41.07 | % | |||||||||
| Deferred tax assets | 140 | 161 | 159 | (21 | ) | -13.04 | % | |||||||||
Total current assets | 1,061 | 833 | 833 | 228 | 27.37 | % | ||||||||||
| Inventories | 170 | 189 | 189 | (19 | ) | -10.05 | % | |||||||||
| Cash and cash equivalents | 190 | 61 | 61 | 129 | 211.48 | % | ||||||||||
| Other current assets | 701 | 583 | 583 | 118 | 20.24 | % | ||||||||||
TOTAL ASSETS | 6,413 | 6,200 | 6,198 | 213 | 3.44 | % | ||||||||||
EQUITY AND LIABILITIES | 30.09.05 | 01.01.05 (1) | 31.12.04 | Variation (2) | ||||||||||||
Total equity | 2,682 | 2,302 | 2,306 | 380 | 16.51 | % | ||||||||||
| Atributtable to equity holders of the parent company | 1,860 | 1,664 | 1,667 | 196 | 11.78 | % | ||||||||||
| Minority interest | 822 | 638 | 639 | 184 | 28.84 | % | ||||||||||
Non-current liabilities | 2,808 | 2,953 | 2,947 | (145 | ) | -4.91 | % | |||||||||
| Deferred revenues | 160 | 9 | 9 | 151 | 1677.78 | % | ||||||||||
| Long term provisions | 317 | 254 | 254 | 63 | 24.80 | % | ||||||||||
| Long term financial debt | 1,522 | 1,887 | 1,881 | (365 | ) | -19.34 | % | |||||||||
| Other non-current liabilities | 510 | 535 | 535 | (25 | ) | -4.67 | % | |||||||||
| Deferred tax liabilities | 299 | 268 | 268 | 31 | 11.57 | % | ||||||||||
Current liabilities | 923 | 945 | 945 | (22 | ) | -2.33 | % | |||||||||
| Short term financial debt | 148 | 297 | 297 | (149 | ) | -50.17 | % | |||||||||
| Trade and other payables | 775 | 648 | 648 | 127 | 19.60 | % | ||||||||||
TOTAL EQUITY AND LIABILITIES | 6,413 | 6,200 | 6,198 | 213 | 3.44 | % | ||||||||||
| (1) Includes NIC 32 and 39 effect | ||||||||||||||||
| (2) Variation from 01.01.05 | ||||||||||||||||
CONSOLIDATED STATEMENTS OF INCOME | |||||||||||||
EUROPEAN ELECTRICITY BUSINESS | Euro Million | ||||||||||||
(Unaudited) | |||||||||||||
30.09.05 | 30.09.04 | Variation | |||||||||||
| REVENUES | 2,884 | 1,797 | 1,087 | 60.5 | % | ||||||||
| Sales | 2,798 | 1,789 | 1,009 | 56.4 | % | ||||||||
| Other operating revenues | 86 | 8 | 78 | 975.0 | % | ||||||||
| PURCHASES AND SERVICES | 1,940 | 1,243 | 697 | 56.1 | % | ||||||||
| Energy purchases | 964 | 641 | 323 | 50.4 | % | ||||||||
| Fuel procurement costs | 822 | 564 | 258 | 45.7 | % | ||||||||
| Transmission expenses | 19 | 16 | 3 | 18.8 | % | ||||||||
| Other variable purchases and services | 135 | 22 | 113 | 513.6 | % | ||||||||
| GROSS MARGIN | 944 | 554 | 390 | 70.4 | % | ||||||||
| Work performed by the entity and capitalized | 6 | 5 | 1 | 20.0 | % | ||||||||
| Personnel expenses | 117 | 61 | 56 | 91.8 | % | ||||||||
| Other fixed operating expenses | 131 | 82 | 49 | 59.8 | % | ||||||||
| GROSS OPERATING INCOME (EBITDA) | 702 | 416 | 286 | 68.8 | % | ||||||||
| Depreciation and amortization | 187 | 98 | 89 | 90.8 | % | ||||||||
| OPERATING INCOME (EBIT) | 515 | 318 | 197 | 61.9 | % | ||||||||
| FINANCIAL INCOME | (44 | ) | (45 | ) | 1 | -2.2 | % | ||||||
| Net financial expenses | (44 | ) | (45 | ) | 1 | -2.2 | % | ||||||
| Share of profit of associates | 9 | 7 | 2 | 28.6 | % | ||||||||
| Income from asset sales | 84 | 84 | N/A | ||||||||||
| INCOME BEFORE TAXES | 564 | 280 | 284 | 101.4 | % | ||||||||
| Income tax | 201 | 112 | 89 | 79.5 | % | ||||||||
| NET INCOME | 363 | 168 | 195 | 116.1 | % | ||||||||
| Attributable to the holders of the parent company | 283 | 140 | 143 | 102.1 | % | ||||||||
| Minority interest | 80 | 28 | 52 | 185.7 | % | ||||||||
3Q CONSOLIDATED STATEMENTS OF INCOME | |||||||||||||
EUROPEAN ELECTRICITY BUSINESS | |||||||||||||
(Unaudited) | Euro Million | ||||||||||||
3Q 05 | 3Q 04 | Variation | |||||||||||
| REVENUES | 954 | 669 | 285 | 42.6 | % | ||||||||
| Sales | 913 | 667 | 246 | 36.9 | % | ||||||||
| Other operating revenues | 41 | 2 | 39 | 1950.0 | % | ||||||||
| PURCHASES AND SERVICES | 624 | 468 | 156 | 33.3 | % | ||||||||
| Energy purchases | 293 | 237 | 56 | 23.6 | % | ||||||||
| Fuel procurement costs | 284 | 217 | 67 | 30.9 | % | ||||||||
| Transmission expenses | 6 | 3 | 3 | 100.0 | % | ||||||||
| Other variable purchases and services | 41 | 11 | 30 | 272.7 | % | ||||||||
| GROSS MARGIN | 330 | 201 | 129 | 64.2 | % | ||||||||
| Work performed by the entity and capitalized | 1 | 1 | |||||||||||
| Personnel expenses | 35 | 24 | 11 | 45.8 | % | ||||||||
| Other fixed operating expenses | 47 | 34 | 13 | 38.2 | % | ||||||||
| GROSS OPERATING INCOME (EBITDA) | 249 | 144 | 105 | 72.9 | % | ||||||||
| Depreciation and amortization | 65 | 39 | 26 | 66.7 | % | ||||||||
| OPERATING INCOME (EBIT) | 184 | 105 | 79 | 75.2 | % | ||||||||
| FINANCIAL INCOME | (14 | ) | (14 | ) | |||||||||
| Net financial expenses | (15 | ) | (14 | ) | (1 | ) | 7.1 | % | |||||
| Foreign exchange | 1 | 1 | N/A | ||||||||||
| Share of profit of associates | 2 | (7 | ) | 9 | -128.6 | % | |||||||
| Income from asset sales | 48 | 48 | N/A | ||||||||||
| INCOME BEFORE TAXES | 220 | 84 | 136 | 161.9 | % | ||||||||
| Income tax | 83 | 37 | 46 | 124.3 | % | ||||||||
| NET INCOME | 137 | 47 | 90 | 191.5 | % | ||||||||
| Attributable to the holders of the parent company | 101 | 38 | 63 | 165.8 | % | ||||||||
| Minority interest | 36 | 9 | 27 | 300.0 | % | ||||||||
| STATEMENTS OF CASH FLOWS | |||||||
EUROPE ELECTRICITY BUSINESS | |||||||
(Unaudited) | |||||||
Euro Million | |||||||
30.09.05 | 30.09.04 | ||||||
| Consolidated income before income taxes | 564 | 280 | |||||
| Amortization | 187 | 98 | |||||
| Income from asset sales | (84 | ) | |||||
| Income tax | (153 | ) | 12 | ||||
| Provisions payments | (3 | ) | (12 | ) | |||
| Other results without cash flow effect | (9 | ) | (4 | ) | |||
Cash Flow from operating activities | 502 | 374 | |||||
| Change in deferred income tax | 140 | (19 | ) | ||||
| Change in operating assets/liabilities | 8 | (118 | ) | ||||
Net cash provided by operating activities | 650 | 237 | |||||
| Acquisitions of fixed and intangible assets | (208 | ) | (264 | ) | |||
| Disposal of fixed and intangible assets | 1 | ||||||
| Disposal of other investments | 190 | 249 | |||||
| Acquisitions of other investments | (20 | ) | (9 | ) | |||
Net cash used for investing activities | (37 | ) | (24 | ) | |||
| New long-term debt | 1,175 | 974 | |||||
| Repayment of long-term debt | (1,439 | ) | (211 | ) | |||
| Net cash from financial debt with short term maturity | (251 | ) | (120 | ) | |||
| Dividends paid by the controlling company | (95 | ) | |||||
| Dividends paid to minority shareholders | (28 | ) | (4 | ) | |||
| Other payments to minority shareholders | (6 | ) | |||||
| Capital contribution from minority shareholders | 160 | (817 | ) | ||||
Net cash used from financing activities | (484 | ) | (178 | ) | |||
Total net cash | 129 | 35 | |||||
Net increase in cash and cash equivalents | 129 | 35 | |||||
Cash and cash equivalents at beginning of period | 61 | 38 | |||||
Cash and cash equivalents at end of period | 190 | 73 | |||||
CONSOLIDATED BALANCE SHEETS | ||||||||||||||||
LATIN AMERICAN ELECTRICITY BUSINESS | ||||||||||||||||
(Unaudited) | ||||||||||||||||
Euro Million | ||||||||||||||||
ASSETS | 30.09.05 | 01.01.05 (1) | 31.12.04 | Variation (2) | ||||||||||||
Total fixed assets | 14,538 | 11,976 | 11,973 | 2,562 | 21.39 | % | ||||||||||
| Utility plant | 10,500 | 8,742 | 8,742 | 1,758 | 20.11 | % | ||||||||||
| Investment property | 32 | 31 | 31 | 1 | 3.23 | % | ||||||||||
| Intagible asset | 65 | 58 | 58 | 7 | 12.07 | % | ||||||||||
| Goodwill | 2,534 | 2,049 | 2,049 | 485 | 23.67 | % | ||||||||||
| Long term financial investments | 794 | 499 | 499 | 295 | 59.12 | % | ||||||||||
| Investments in associates | 150 | 183 | 183 | (33 | ) | -18.03 | % | |||||||||
| Deferred tax assets | 463 | 414 | 411 | 49 | 11.84 | % | ||||||||||
Total current assets | 2,413 | 2,311 | 2,311 | 102 | 4.41 | % | ||||||||||
| Inventories | 123 | 65 | 65 | 58 | 89.23 | % | ||||||||||
| Cash and cash equivalents | 629 | 811 | 811 | (182 | ) | -22.44 | % | |||||||||
| Other current assets | 1,661 | 1,435 | 1,435 | 226 | 15.75 | % | ||||||||||
Assets held for sale | 13 | 13 | N/A | |||||||||||||
TOTAL ASSETS | 16,964 | 14,287 | 14,284 | 2,677 | 18.74 | % | ||||||||||
EQUITY AND LIABILITIES | 30.09.05 | 01.01.05 (1) | 31.12.04 | Variation (2) | ||||||||||||
Total equity | 6,788 | 5,475 | 5,491 | 1,313 | 23.98 | % | ||||||||||
| Atributtable to equity holders of the parent company | 3,090 | 2,331 | 2,341 | 759 | 32.56 | % | ||||||||||
| Minority interest | 3,698 | 3,144 | 3,150 | 554 | 17.62 | % | ||||||||||
Non-current liabilities | 8,033 | 7,183 | 7,164 | 850 | 11.83 | % | ||||||||||
| Deferred revenues | 125 | 80 | 0 | 45 | 56.25 | % | ||||||||||
| Long term provisions | 125 | 80 | 80 | 45 | 56.25 | % | ||||||||||
| Long term financial debt | 829 | 671 | 671 | 158 | 23.55 | % | ||||||||||
| Other non-current liabilities | 5,941 | 5,509 | 5,490 | 432 | 7.84 | % | ||||||||||
| Deferred tax liabilities | 135 | 100 | 100 | 35 | 35.00 | % | ||||||||||
Current liabilities | 1,003 | 823 | 823 | 180 | 21.87 | % | ||||||||||
| Short term financial debt | 925 | 652 | 652 | 273 | 41.87 | % | ||||||||||
| Trade and other payables | 1,218 | 977 | 977 | 241 | 24.67 | % | ||||||||||
TOTAL EQUITY AND LIABILITIES | 16,964 | 14,287 | 14,284 | 2,677 | 18.74 | % | ||||||||||
| (1) Includes NIC 32 and 39 effect | ||||||||||||||||
| (2) Variation from 01.01.05 | ||||||||||||||||
CONSOLIDATED STATEMENTS OF INCOME | |||||||||||||
LATIN AMERICA ELECTRICITY BUSINESS | Euro Million | ||||||||||||
(Unaudited) | |||||||||||||
30.09.05 | 30.09.04 | Variation | |||||||||||
| REVENUES | 3,731 | 3,261 | 470 | 14.41 | % | ||||||||
| Sales | 3,670 | 3,183 | 487 | 15.30 | % | ||||||||
| Other operating revenues | 61 | 78 | (17 | ) | -21.79 | % | |||||||
| PURCHASES AND SERVICES | 1,838 | 1,659 | 179 | 10.79 | % | ||||||||
| Energy purchases | 1,027 | 778 | 249 | 32.01 | % | ||||||||
| Fuel procurement costs | 223 | 287 | (64 | ) | -22.30 | % | |||||||
| Transmission expenses | 281 | 228 | 53 | 23.25 | % | ||||||||
| Other variable purchases and services | 307 | 366 | (59 | ) | -16.12 | % | |||||||
| GROSS MARGIN | 1,893 | 1,602 | 291 | 18.16 | % | ||||||||
| Work performed by the entity and capitalized | 15 | 13 | 2 | 15.38 | % | ||||||||
| Personnel expenses | 240 | 211 | 29 | 13.74 | % | ||||||||
| Other fixed operating expenses | 345 | 259 | 86 | 33.20 | % | ||||||||
| GROSS OPERATING INCOME (EBITDA) | 1,323 | 1,145 | 178 | 15.55 | % | ||||||||
| Depreciation and amortization | 359 | 305 | 54 | 17.70 | % | ||||||||
| OPERATING INCOME (EBIT) | 964 | 840 | 124 | 14.76 | % | ||||||||
| FINANCIAL INCOME | (290 | ) | (380 | ) | 90 | 23.68 | % | ||||||
| Net financial expenses | (362 | ) | (347 | ) | (15 | ) | -4.32 | % | |||||
| Foreign exchange | 72 | (33 | ) | 105 | 318.18 | % | |||||||
| Share of profit of associates | 6 | 7 | (1 | ) | -14.29 | % | |||||||
| Income from other investments | 4 | 0 | 4 | ||||||||||
| Income from asset sales | 3 | 0 | 3 | ||||||||||
| INCOME BEFORE TAXES | 687 | 467 | 220 | 47.11 | % | ||||||||
| Income tax | 216 | 134 | 82 | 61.19 | % | ||||||||
| NET INCOME | 471 | 333 | 138 | 41.44 | % | ||||||||
| Attributable to the holders of the parent company | 186 | 109 | 77 | 70.64 | % | ||||||||
| Minority interest | 285 | 225 | 60 | 26.67 | % | ||||||||
3Q CONSOLIDATED STATEMENTS OF INCOME | |||||||||||||
LATIN AMERICA ELECTRICITY BUSINESS | |||||||||||||
(Unaudited) | Euro Million | ||||||||||||
3Q 05 | 3Q 04 | Variation | |||||||||||
| REVENUES | 1,355 | 1,130 | 225 | 19.9 | % | ||||||||
| Sales | 1,339 | 1,099 | 240 | 21.8 | % | ||||||||
| Other operating revenues | 16 | 31 | (15 | ) | -48.4 | % | |||||||
| PURCHASES AND SERVICES | 656 | 586 | 70 | 11.9 | % | ||||||||
| Energy purchases | 392 | 269 | 123 | 45.7 | % | ||||||||
| Fuel procurement costs | 65 | 102 | (37 | ) | -36.3 | % | |||||||
| Transmission expenses | 100 | 82 | 18 | 22.0 | % | ||||||||
| Other variable purchases and services | 99 | 133 | (34 | ) | -25.6 | % | |||||||
| GROSS MARGIN | 699 | 544 | 155 | 28.5 | % | ||||||||
| Work performed by the entity and capitalized | 5 | 8 | (3 | ) | -37.5 | % | |||||||
| Personnel expenses | 88 | 81 | 7 | 8.6 | % | ||||||||
| Other fixed operating expenses | 124 | 89 | 35 | 39.3 | % | ||||||||
| GROSS OPERATING INCOME (EBITDA) | 492 | 382 | 110 | 28.8 | % | ||||||||
| Depreciation and amortization | 126 | 96 | 30 | 31.3 | % | ||||||||
| OPERATING INCOME (EBIT) | 366 | 286 | 80 | 28.0 | % | ||||||||
| FINANCIAL INCOME | (122 | ) | (113 | ) | (9 | ) | 8.0 | % | |||||
| Net financial expenses | (121 | ) | (96 | ) | (25 | ) | 26.0 | % | |||||
| Foreign exchange | (1 | ) | (17 | ) | 16 | -94.1 | % | ||||||
| Share of profit of associates | 3 | 8 | (5 | ) | -62.5 | % | |||||||
| Income from other investments | 1 | 1 | N/A | ||||||||||
| Income from asset sales | 5 | 1 | 4 | 400.0 | % | ||||||||
| INCOME BEFORE TAXES | 253 | 182 | 71 | 39.0 | % | ||||||||
| Income tax | 86 | 29 | 57 | 196.6 | % | ||||||||
| NET INCOME | 167 | 153 | 14 | 9.2 | % | ||||||||
| Attributable to the holders of the parent company | 72 | 71 | 1 | 1.4 | % | ||||||||
| Minority interest | 95 | 82 | 13 | 15.9 | % | ||||||||
STATEMENTS OF CASH FLOWS | |||||||
LATIN AMERICA ELECTRICITY BUSINESS | |||||||
(Unaudited) | Euro Million | ||||||
30.09.05 | 30.09.04 | ||||||
| Consolidated income before income taxes | 687 | 468 | |||||
| Amortization | 359 | 305 | |||||
| Income tax | (193 | ) | (124 | ) | |||
| Provisions payments | (30 | ) | (17 | ) | |||
| Other results without cash flow effect | (57 | ) | 33 | ||||
Cash Flow from operating activities | 766 | 665 | |||||
| Change in deferred income tax | 87 | 24 | |||||
| Change in operating assets/liabilities | (38 | ) | 641 | ||||
Net cash provided by operating activities | 815 | 1,330 | |||||
| Acquisitions of fixed and intangible assets | (360 | ) | (313 | ) | |||
| Disposal of fixed and intangible assets | 18 | 10 | |||||
| Acquisitions of other investments | (77 | ) | (109 | ) | |||
| Disposal of other investments | 46 | 21 | |||||
| Subsidies and other deferred income | 20 | 10 | |||||
Net cash used for investing activities | (353 | ) | (381 | ) | |||
| New long-term debt | 443 | 463 | |||||
| Repayment of long-term debt | (325 | ) | (639 | ) | |||
| Net cash from financial debt with short term maturity | (414 | ) | (514 | ) | |||
| Dividends paid by the controlling company | (113 | ) | |||||
| Dividends paid to minority shareholders | (80 | ) | |||||
| Other payments to minority shareholders | (264 | ) | (104 | ) | |||
Net cash used from financing activities | (753 | ) | (794 | ) | |||
Total net cash | (291 | ) | 155 | ||||
| Effects of exchange rate changes on cash and cash equivalents | 109 | ||||||
Net increase in cash and cash equivalents | (182 | ) | 155 | ||||
Cash and cash equivalents at beginning of period | 811 | 501 | |||||
Cash and cash equivalents at end of period | 629 | 656 | |||||
CONSOLIDATED BALANCE SHEETS | ||||||
OTHER BUSINESSES | ||||||
(Unaudited) | Euro Million |
ASSETS | 30.09.05 | 01.01.05(1 | ) | 31.12.04 | Variation (2) | |||||||||||
Total fixed assets | 659 | 1,749 | 1,767 | (1,090 | ) | -62.32 | % | |||||||||
| Utility plant | 2 | 6 | 6 | (4 | ) | -66.67 | % | |||||||||
| Long term financial investments | 428 | 53 | 53 | 375 | 707.55 | % | ||||||||||
| Investments in associates | 1,476 | 1,494 | (1,476 | ) | -100.00 | % | ||||||||||
| Deferred tax assets | 229 | 214 | 214 | 15 | 7.01 | % | ||||||||||
Total current assets | 53 | 55 | 55 | (2 | ) | -3.64 | % | |||||||||
| Inventories | 1 | 1 | (1 | ) | -100.00 | % | ||||||||||
| Other current assets | 53 | 54 | 54 | (1 | ) | -1.85 | % | |||||||||
Assets held for sale | 913 | 913 | N/A | |||||||||||||
TOTAL ASSETS | 1,625 | 1,804 | 1,822 | (179 | ) | -9.92 | % | |||||||||
EQUITY AND LIABILITIES | 30.09.05 | 01.01.05 (1 | ) | 31.12.04 | Variation (2) | |||||||||||
Total equity | 161 | (117 | ) | (99 | ) | 278 | 237.61 | % | ||||||||
| Atributtable to equity holders of the parent company | 161 | (117 | ) | (99 | ) | 278 | 237.61 | % | ||||||||
Non-current liabilities | 1,410 | 1,816 | 1,816 | (406 | ) | -22.36 | % | |||||||||
| Long term provisions | 16 | 18 | 18 | (2 | ) | -11.11 | % | |||||||||
| Long term financial debt | 1,221 | 1,613 | 1,613 | (392 | ) | -24.30 | % | |||||||||
| Other non-current liabilities | 10 | 10 | 10 | |||||||||||||
| Deferred tax liabilities | 163 | 175 | 175 | (12 | ) | -6.86 | % | |||||||||
Current liabilities | 54 | 105 | 105 | (51 | ) | -48.57 | % | |||||||||
| Short term financial debt | 29 | 26 | 26 | 3 | 11.54 | % | ||||||||||
| Trade and other payables | 25 | 79 | 79 | (54 | ) | -68.35 | % | |||||||||
TOTAL EQUITY AND LIABILITIES | 1,625 | 1,804 | 1,822 | (179 | ) | -9.92 | % | |||||||||
| (1) Includes NIC 32 and 39 effect | ||||||||||||||||
| (2) Variation from 01.01.05 | ||||||||||||||||
CONSOLIDATED STATEMENTS OF INCOME | |||||||||||||
OTHER BUSINESSES | Euro Million | ||||||||||||
(Unaudited) | |||||||||||||
30.09.05 | 30.09.04 | Variation | |||||||||||
| REVENUES | 2 | 6 | (4 | ) | -66.7 | % | |||||||
| Sales | 2 | (2 | ) | -100.0 | % | ||||||||
| Other operating revenues | 2 | 4 | (2 | ) | -50.0 | % | |||||||
| PURCHASES AND SERVICES | 1 | (1 | ) | -100.0 | % | ||||||||
| Other variable purchases and services | 1 | (1 | ) | -100.0 | % | ||||||||
| GROSS MARGIN | 2 | 5 | (3 | ) | -60.0 | % | |||||||
| Personnel expenses | 5 | 7 | (2 | ) | -28.6 | % | |||||||
| Other fixed operating expenses | 3 | 3 | |||||||||||
| GROSS OPERATING INCOME (EBITDA) | (6 | ) | (5 | ) | (1 | ) | -20.0 | % | |||||
| Depreciation and amortization | 1 | 1 | N/A | ||||||||||
| OPERATING INCOME (EBIT) | (7 | ) | (5 | ) | (2 | ) | -40.0 | % | |||||
| FINANCIAL INCOME | (55 | ) | (33 | ) | (22 | ) | -66.7 | % | |||||
| Net financial expenses | (52 | ) | (47 | ) | (5 | ) | 10.6 | % | |||||
| Foreign exchanges | (3 | ) | 14 | (17 | ) | -121.4 | % | ||||||
| Share of profit of associates | 8 | 8 | |||||||||||
| Income from other investments | 2 | 2 | N/A | ||||||||||
| Income from asset sales | 18 | 116 | (98 | ) | -84.5 | % | |||||||
| INCOME BEFORE TAXES | (34 | ) | 86 | (120 | ) | -139.5 | % | ||||||
| Income tax | (70 | ) | 8 | (78 | ) | -975.0 | % | ||||||
| NET INCOME | 36 | 78 | (42 | ) | -53.8 | % | |||||||
| Attributable to the holders of the parent company | 36 | 78 | (42 | ) | -53.8 | % | |||||||
3Q CONSOLIDATED STATEMENTS OF INCOME | |||||||||||||
OTHER BUSINESSES | |||||||||||||
(Unaudited) | Euro Million | ||||||||||||
3Q 05 | 3Q 04 | Variation | |||||||||||
| REVENUES | 1 | (63 | ) | 64 | 101.6 | % | |||||||
| Sales | (65 | ) | 65 | 100.0 | % | ||||||||
| Other operating revenues | 1 | 2 | (1 | ) | -50.0 | % | |||||||
| PURCHASES AND SERVICES | (19 | ) | 19 | 100.0 | % | ||||||||
| Fuel procurement costs | (7 | ) | 7 | 100.0 | % | ||||||||
| Other variable purchases and services | (12 | ) | 12 | 100.0 | % | ||||||||
| GROSS MARGIN | 1 | (44 | ) | 45 | 102.3 | % | |||||||
| Personnel expenses | 2 | 2 | N/A | ||||||||||
| Other fixed operating expenses | (9 | ) | 9 | 100.0 | % | ||||||||
| GROSS OPERATING INCOME (EBITDA) | (1 | ) | (35 | ) | 34 | 97.1 | % | ||||||
| Depreciation and amortization | 1 | (14 | ) | 15 | 107.1 | % | |||||||
| OPERATING INCOME (EBIT) | (2 | ) | (21 | ) | 19 | 90.5 | % | ||||||
| FINANCIAL INCOME | (15 | ) | (11 | ) | (4 | ) | 36.4 | % | |||||
| Net financial expenses | (15 | ) | (12 | ) | (3 | ) | 25.0 | % | |||||
| Foreign exchange | 1 | (1 | ) | -100.0 | % | ||||||||
| Income from asset sales | 13 | 13 | N/A | ||||||||||
| INCOME BEFORE TAXES | (4 | ) | (32 | ) | 28 | 87.5 | % | ||||||
| Income tax | (59 | ) | (7 | ) | (52 | ) | 742.9 | % | |||||
| NET INCOME | 55 | (25 | ) | 80 | 320.0 | % | |||||||
| Attributable to the holders of the parent company | 55 | (25 | ) | 80 | 320.0 | % | |||||||
| Minority interest | N/A | ||||||||||||
STATEMENTS OF CASH FLOWS | |||
OTHER BUSINESSES | |||
(Unaudited) |
Euro Million | |||||||
30.09.05 | 30.09.04 | ||||||
| Consolidated income before income taxes | (34 | ) | 86 | ||||
| Amortization | 1 | ||||||
| Income from asset sales | (18 | ) | (116 | ) | |||
| Income tax | 50 | (17 | ) | ||||
| Other results without cash flow effect | (7 | ) | 57 | ||||
Cash Flow from operating activities | (8 | ) | 10 | ||||
| Change in deferred income tax | (50 | ) | 17 | ||||
| Change in operating assets/liabilities | (56 | ) | (12 | ) | |||
Net cash provided by operating activities | (114 | ) | 15 | ||||
| Acquisitions of fixed and intangible assets | (2 | ) | (16 | ) | |||
| Disposal of fixed and intangible assets | 7 | ||||||
| Acquisitions of other investments | (3 | ) | (461 | ) | |||
| Disposal of other investments | 501 | 357 | |||||
| Cash flow from change in perimeter | (6 | ) | |||||
Net cash used for investing activities | 503 | (126 | ) | ||||
| New long-term debt | 92 | 506 | |||||
| Repayment of long-term debt | (483 | ) | (302 | ) | |||
| Net cash from financial debt with short term maturity | 2 | (99 | ) | ||||
Net cash used for financing activities | (389 | ) | 105 | ||||
Total net cash | (6 | ) | |||||
Net increase in cash and cash equivalents | (6 | ) | |||||
Cash and cash equivalents at beginning of period | 6 | ||||||
Cash and cash equivalents at end of period | |||||||
Consolidated Balance Sheet Spain & Portugal by business line for the period ended September 30, 2005 | |||||||||||||
(Unaudited) | Euro Million | ||||||||||||
Generation & | Corporate Structure, | Electricity Business | |||||||||||
ASSETS | Supply | Distribution | Services & Adjustments | Spain & Portugal | |||||||||
Total fixed assets | 10,719 | 9,806 | 2,160 | 22,685 | |||||||||
| Utility plant | 8,747 | 8,205 | 432 | 17,384 | |||||||||
| Intagible asset | 429 | 138 | 60 | 627 | |||||||||
| Goodwill | 146 | 146 | |||||||||||
| Long term financial investments | 330 | 419 | 1,134 | 1,883 | |||||||||
| Investments in associates | 304 | 12 | 86 | 402 | |||||||||
| Deferred tax assets | 763 | 1,032 | 448 | 2,243 | |||||||||
Total current assets | 3,815 | 1,290 | (890 | ) | 4,215 | ||||||||
| Inventories | 546 | 17 | (4 | ) | 559 | ||||||||
| Cash and cash equivalents | 63 | 3 | 130 | 196 | |||||||||
| Other current assets | 3,206 | 1,270 | (1,016 | ) | 3,460 | ||||||||
| Investments held for sale | 21 | 21 | |||||||||||
TOTAL ASSETS | 14,534 | 11,117 | 1,270 | 26,921 | |||||||||
EQUITY AND LIABILITIES | |||||||||||||
Total equity | 4,983 | 2,173 | (1,666 | ) | 5,490 | ||||||||
| Atributtable to equity holders of the parent company | 4,963 | 2,162 | (1,758 | ) | 5,367 | ||||||||
| Minority interest | 20 | 11 | 92 | 123 | |||||||||
Non-current liabilities | 6,256 | 7,407 | 3,882 | 17,545 | |||||||||
| Deferred revenues | 147 | 1,569 | (1 | ) | 1,715 | ||||||||
| Preferred shares | 1,416 | 1,416 | |||||||||||
| Long term provisions | 1,669 | 1,491 | 471 | 3,631 | |||||||||
| Long term financial debt | 4,104 | 3,955 | 1,829 | 9,888 | |||||||||
| Other non-current liabilities | 102 | 288 | (1 | ) | 389 | ||||||||
| Deferred tax liabilities | 234 | 104 | 168 | 506 | |||||||||
Current liabilities | 3,295 | 1,537 | (946 | ) | 3,886 | ||||||||
| Short term financial debt | 52 | 199 | 93 | 344 | |||||||||
| Trade and other payables | 3,243 | 1,338 | (1,039 | ) | 3,542 | ||||||||
TOTAL EQUITY AND LIABILITIES | 14,534 | 11,117 | 1,270 | 26,921 | |||||||||
Consolidated Statement of Income Spain & Portugal by business line for the period ended September 30, 2005 | |||||||||||||
(Unaudited) | Euro Million | ||||||||||||
Generation & | Corporate Structure, | Electricity Business | |||||||||||
Supply | Distribution | Services & Adjustments | Spain & Portugal | ||||||||||
REVENUES | 5,826 | 1,436 | (611 | ) | 6,651 | ||||||||
Sales | 5,434 | 1,350 | (609 | ) | 6,175 | ||||||||
Other operating revenues | 392 | 86 | (2 | ) | 476 | ||||||||
PURCHASES AND SERVICES | 3,538 | 70 | (616 | ) | 2,992 | ||||||||
Energy purchases | 755 | 2 | (108 | ) | 649 | ||||||||
Fuel procurement costs | 1,493 | 1,493 | |||||||||||
Transmission expenses | 604 | (428 | ) | 176 | |||||||||
Other variable purchases and services | 686 | 68 | (80 | ) | 674 | ||||||||
GROSS MARGIN | 2,288 | 1,366 | 5 | 3,659 | |||||||||
Work performed by the entity and capitalized | 5 | 88 | 7 | 100 | |||||||||
Personnel expenses | 239 | 331 | 103 | 673 | |||||||||
Other fixed operating expenses | 463 | 360 | (117 | ) | 706 | ||||||||
GROSS OPERATING INCOME (EBITDA) | 1,591 | 763 | 26 | 2,380 | |||||||||
Depreciation and amortization | 425 | 310 | 11 | 746 | |||||||||
OPERATING INCOME (EBIT) | 1,166 | 453 | 15 | 1,634 | |||||||||
FINANCIAL INCOME | (118 | ) | (161 | ) | (80 | ) | (359 | ) | |||||
Net financial expenses | (119 | ) | (161 | ) | (76 | ) | (356 | ) | |||||
Foreign exchanges | 1 | (4 | ) | (3 | ) | ||||||||
Share of profit of associates | 40 | 2 | 42 | ||||||||||
Income from other investments | (3 | ) | 3 | 2 | 2 | ||||||||
Income from asset sales | 13 | 99 | (10 | ) | 102 | ||||||||
INCOME BEFORE TAXES | 1,098 | 396 | (73 | ) | 1,421 | ||||||||
Income tax | 315 | 75 | (26 | ) | 364 | ||||||||
NET INCOME | 783 | 321 | (47 | ) | 1,057 | ||||||||
Attributable to the holders of the parent company | 781 | 318 | (48 | ) | 1,051 | ||||||||
Minority interest | 2 | 3 | 1 | 6 | |||||||||
Consolidated Statement of Income Spain & Portugal by business line for the period ended September 30, 2004 | |||||||||||||
(Unaudited) | Euro Million | ||||||||||||
Generation & | Corporate Structure, | Electricity Business | |||||||||||
Supply | Distribution | Services & Adjustments | Spain & Portugal | ||||||||||
REVENUES | 4,116 | 1,398 | (423 | ) | 5,091 | ||||||||
Sales | 4,044 | 1,320 | (368 | ) | 4,996 | ||||||||
Other operating revenues | 72 | 78 | (55 | ) | 95 | ||||||||
PURCHASES AND SERVICES | 2,059 | 64 | (464 | ) | 1,659 | ||||||||
Energy purchases | 337 | (47 | ) | 290 | |||||||||
Fuel procurement costs | 1,114 | 1 | (8 | ) | 1,107 | ||||||||
Transmission expenses | 426 | 1 | (295 | ) | 132 | ||||||||
Other variable purchases and services | 182 | 62 | (114 | ) | 130 | ||||||||
GROSS MARGIN | 2,057 | 1,334 | 41 | 3,432 | |||||||||
Work performed by the entity and capitalized | 7 | 77 | 9 | 93 | |||||||||
Personnel expenses | 237 | 276 | 92 | 605 | |||||||||
Other fixed operating expenses | 447 | 365 | (132 | ) | 680 | ||||||||
GROSS OPERATING INCOME (EBITDA) | 1,380 | 770 | 90 | 2,240 | |||||||||
Depreciation and amortization | 500 | 275 | 17 | 792 | |||||||||
OPERATING INCOME (EBIT) | 880 | 495 | 73 | 1,448 | |||||||||
FINANCIAL INCOME | (136 | ) | (135 | ) | (121 | ) | (392 | ) | |||||
Net financial expenses | (136 | ) | (135 | ) | (126 | ) | (397 | ) | |||||
Foreign exchanges | 5 | 5 | |||||||||||
Share of profit of associates | 31 | 1 | 32 | ||||||||||
Income from other investments | 19 | (1 | ) | 18 | |||||||||
Income from asset sales | 1 | 27 | 12 | 40 | |||||||||
INCOME BEFORE TAXES | 795 | 387 | (36 | ) | 1,146 | ||||||||
Income tax | 238 | 104 | (89 | ) | 253 | ||||||||
NET INCOME | 557 | 283 | 53 | 893 | |||||||||
Attributable to the holders of the parent company | 557 | 281 | 7 | 845 | |||||||||
Minority interest | 2 | 46 | 48 | ||||||||||
ENDESA S.A. AND SUBSIDIARIES | ||||
CONSOLIDATED BALANCE SHEETS PRO-FORMA | ||||
(ENERSIS BY EQUITY METHOD) | ||||
AS OF SEPTEMBER 30, 2005 | ||||
(Unaudited) | ||||
Euro Million | ||||
ASSETS | 30.09.05 | |||
Total fixed assets | 32,966 | |||
| Utility plant | 21,142 | |||
| Investment property | 36 | |||
| Intagible asset | 658 | |||
| Goodwill | 1,608 | |||
| Long term financial investments | 2,581 | |||
| Investments in associates | 4,361 | |||
| Deferred tax assets | 2,580 | |||
Total current assets | 5,420 | |||
| Inventories | 735 | |||
| Cash and cash equivalents | 412 | |||
| Other current assets | 4,273 | |||
Assets held for sale | 947 | |||
TOTAL ASSETS | 39,333 | |||
EQUITY AND LIABILITIES | 30.09.05 | |||
Total equity | 11,448 | |||
| Atributtable to equity holders of the parent company | 10,478 | |||
| Minority interest | 970 | |||
Non-current liabilities | 23,035 | |||
| Deferred revenues | 1,877 | |||
| Preferred shares | 1,416 | |||
| Long term provisions | 4,101 | |||
| Long term financial debt | 13,615 | |||
| Other non-current liabilities | 909 | |||
| Deferred tax liabilities | 1,117 | |||
Current liabilities | 4,850 | |||
| Short term financial debt | 396 | |||
| Trade and other payables | 4,454 | |||
TOTAL EQUITY AND LIABILITIES | 39,333 | |||
| ENDESA S.A. AND SUBSIDIARIES | ||||
| FINANCIAL INVESTMENTS | ||||
| (ENERSIS BY EQUITY METHOD) | ||||
AS OF SEPTEMBER 30, 2005 | ||||
Euro Million | ||||
| BALANCE | ||||
GOODWILL OF GLOBAL CONSOLIDATED COMPANIES | 1,608 | LONG TERM INVESTMENTS IN SECURITIES | 619 | |
| Endesa Italia | 1,277 | Auna | 373 | |
| Snet | 185 | Red Eléctrica de España | 96 | |
| Finergé | 141 | Empresa Eléctrica de Bogotá | 37 | |
| Hidroeléctrica del Serrado | 2 | Euskaltel | 32 | |
| EE Douro | 1 | DS2 | 13 | |
| Sere | 1 | Fondos de Inversión Enertch | 6 | |
| EolVerde | 1 | Others | 62 | |
INVESTMENTS CARRIED OUT BY EQUITY METHOD AND GOODWILL | 4,361 | Assets held for sale | 947 | |
| Enersis | 2,934 | Auna | 913 | |
| Capital de Energía (Emgesa) | 280 | NQF | 21 | |
| Codensa | 250 | Cpm | 13 | |
| Investluz | 131 | |||
| Nuclenor | 90 | LOANS | 1,962 | |
| Tejo | 89 | Tariff deficit financing | 1104 | |
| Cien | 82 | Guarantees and deposits | 348 | |
| Central Termoeléctrica de Fortaleza | 72 | Italia for "Stranded Cost" | 128 | |
| Ampla | 50 | Loans to personnel | 125 | |
| Altek | 27 | Extrapeninsular additional compensations | 65 | |
| Distrilima (Edelnor) | 25 | Cien | 33 | |
| Elcogas | 22 | Megasa | 21 | |
| Teneguía Gestión Financiera, S.L. | 20 | Ecyr | 24 | |
| Dicogexsa | 20 | Emesa | 14 | |
| Eurosviluppo Elettrica S.P.A. | 19 | Ede & E.Generación for pensions capitalization | 11 | |
| Tahaddart | 19 | Gas Alicante | 9 | |
| CPE | 18 | NQF Gas | 8 | |
| AIE Ascó Vandellós | 16 | Planta Regasificadora de Sagunto | 7 | |
| Edesur | 16 | Hidroeléctrica de Camporrels | 6 | |
| Pangue | 15 | Soprolif | 5 | |
| Yacilec | 13 | Other | 54 | |
| Reganosa | 10 | |||
| Tirme | 10 | TOTAL | 9,497 | |
| Minas y Ferrocarriles de Utrillas | 9 | |||
| Cía Eólica Tierras Altas | 8 | |||
| Ecasa | 8 | |||
| Coelce | 8 | |||
| TP Sociedade Térmica Portuguesa, S.A. | 6 | |||
| Minas Gargallo | 6 | |||
| P.E. Sierra del Madero | 6 | |||
| Meridional de Gas | 6 | |||
| PE de Barbanza | 5 | |||
| Endesa Gas Transportista | 5 | |||
| Cemsa | 4 | |||
| Other | 62 | |||