FORM 6-K
SECURITIES AND EXCHANGE COMMISSION
Washington, D.C. 20549
Report of Foreign Issuer
Pursuant to Rule 13a-16 or 15d-16 of
the Securities Exchange Act of 1934
For the month of June, 2006
Commission File Number: 333-07654
ENDESA, S.A.
(Translation of Registrant's Name into English)
Ribera del Loira, 60
28042 Madrid, Spain
(Address of principal executive office)
Indicate by check mark whether the registrant files or will file
annual reports under cover of Form 20-F or Form 40-F:
| Form 20-F | X | Form 40-F |
Indicate by check mark if the registrant is submitting the Form 6-K
in paper as permitted by Regulation S-T Rule 101(b)(1):
| Yes | No | X |
Indicate by check mark if the registrant is submitting the Form 6-K
in paper as permitted by Regulation S-T Rule 101(b)(7):
| Yes | No | X |
Indicate by check mark whether by furnishing the information
contained in this Form, the Registrant is also thereby furnishing the information to the Commission
pursuant to Rule 12g3-2(b) under the Securities Exchange Act of 1934:
| Yes | No | X |
If “Yes” is marked, indicate below the file number assigned to the registrant
in connection with Rule 12g3-2(b): N/A

Lisbon, June 20th, 2006 PRESENTATION Press Dossier

ENDESA: A World Leader

Endesa is a global gas and electricity company Operating in 15 countries Installed capacity of 46 GW 185 TWh produced 203 TWh sold 23 million customers in the electricity market 21 gas bcms under medium term portfolio More than €55,000M assets Data as of end 2005

Endesa: a large and diversified business base Spain and Portugal Europe Latin America Capacity 2005 (MW) 22,416 9,397 14,095 GWh 2005 93.625 100.868 33.749 47.221 57.890 55.246
Production Sales EBITDA 2005 (€ bn) Assets (2.005) (€ bn) 3,266 887 1,878 30,204 6,837 17,136 Geographically diversified Outstanding dimension in every business Balanced portfolio in every country
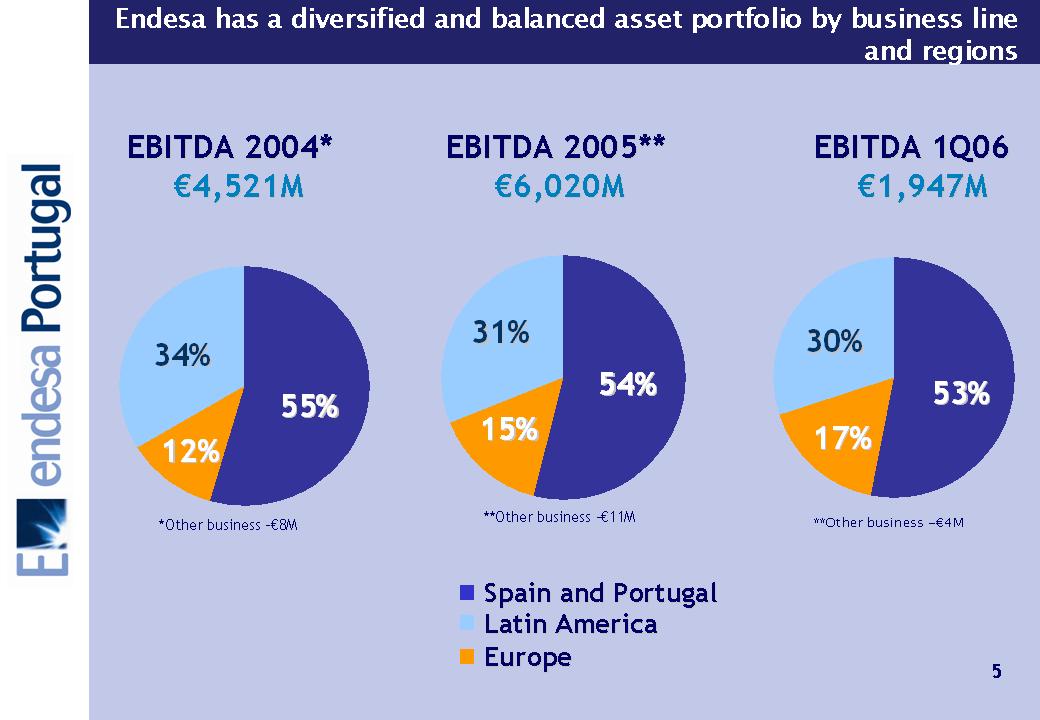
Endesa has a diversified and balanced asset portfolio by business line and regions EBITDA 2004* EBITDA 2005** EBITDA 1Q06 €4,521M €6,020M €1,947M *Other business -€8M **Other business -€11M **Other business -€4M 34% 12% 55% 31% 54% 15% 30% 17% 53%

First Quarter Results 2006 EBITDA: €1,947 M Latin America +31% Spain and Portugal +26% Europe +38% 30% 53% 17% Latin America +42% Spain and Portugal +39% Europe +49% 31% 52% 17% EBIT: €1,491 M Net Profit: €1,052 M +42% +88% Auna N.A. Latin America +171% Europe +4% Spain and Portugal +49% 16% 19% 54%

Investment Plan total: €14,600 M Investment Plan 2005-2009 €bn 2005 2005-09 Latin America 17% Europe 12% Spain and Portugal 71% Spain and Portugal 2.5 10.3 New capacity 0.9 4.6 Maintenance capex 1.6 5.7 Rest of Europe 0.4 1.8 New capacity 0.4 1.4 Maintenance capex 0.0 0.4 Latin America 0.5 2.5 New capacity 0.2 0.5 Maintenance capex 0.3 2.0 TOTAL 3.4 14.6
Latin America
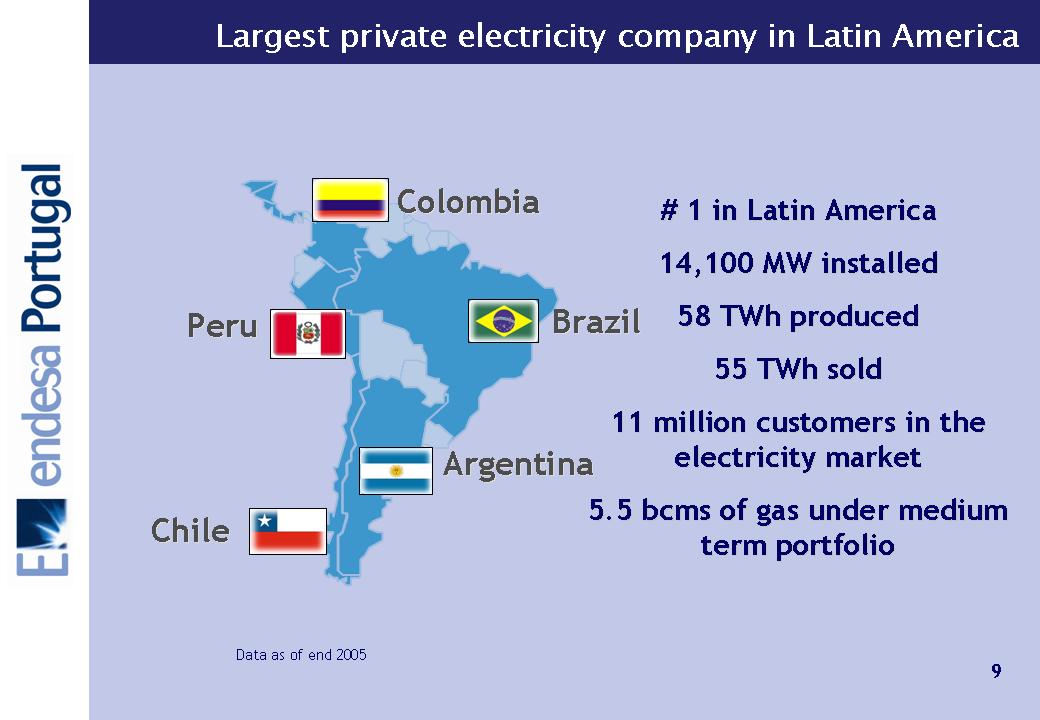
Largest private electricity company in Latin America Colombia Peru Brazil Argentina Chile # 1 in Latin America 14,100 MW installed 58 TWh produced 55 TWh sold 11 million customers in the electricity market 5.5 bcms of gas under medium term portfolio Data as of end 2005
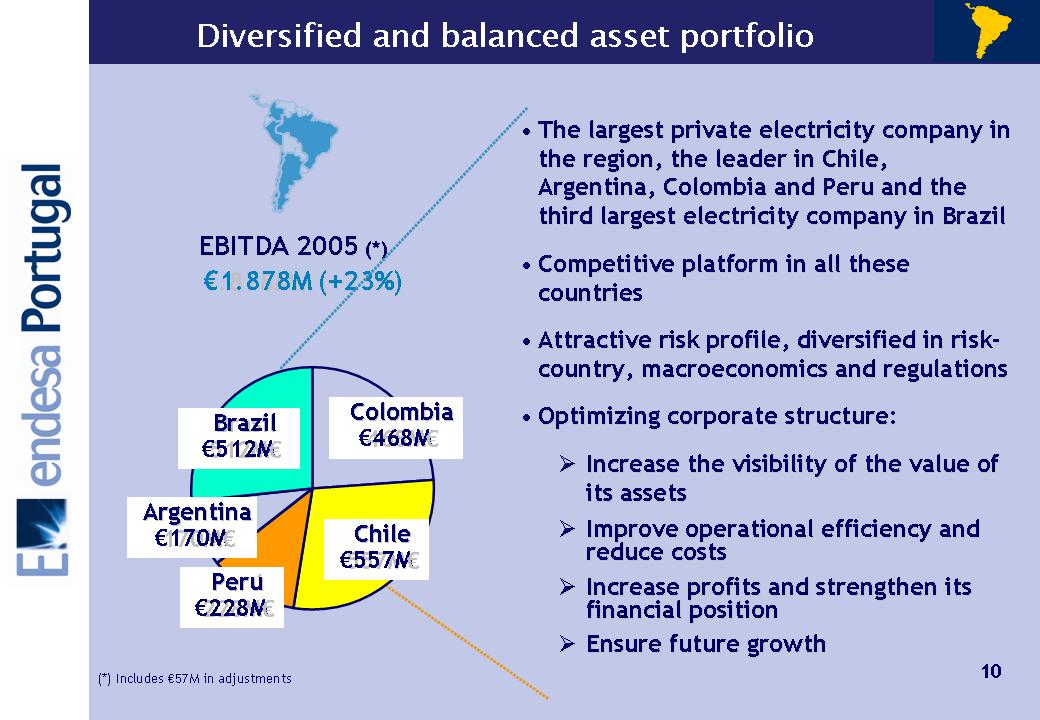
Endesa Portugal Diversified and balanced asset portfolio 1.878M €1.878M (+23%) (+23%) EBITDA 2005 EBITDA 2005 (*) (*) Chile Chile 557M €557M€ Colombia Colombia 468M €468M€ Brasil Brazil 512M €512M€ Per Perúu 228M €228M€ Argentina Argentina 170M €170M€ (*) Includes €57M in adjustments • The largest private electricity company in The largest private electricity company in the region, the leader in Chile, the region, the leader in Chile, Argentina, Colombia and Peru and the Argentina, Colombia and Peru and the third largest electricity company in Brazil third largest electricity company in Brazil • Competitive platform in all these Competitive platform in all these countries countries • Attractive risk profile, diversified in risk Attractive risk profile, diversified in risk- country, macroeconomics and regulations country, macroeconomics and regulations • Optimizing corporate structure Optimizing corporate structure: ⑀⍂⑀⍂ Increase the visibility of the value of Increase the visibility of the value of its assets its assets ⑀⍂⑀⍂ Improve operational efficiency and Improve operational efficiency and reduce costs reduce costs ⑀⍂⑀⍂ Increase profits and strengthen its Increase profits and strengthen its financial position financial position ⑀⍂⑀⍂ Ensure future growth Ensure future growth 10
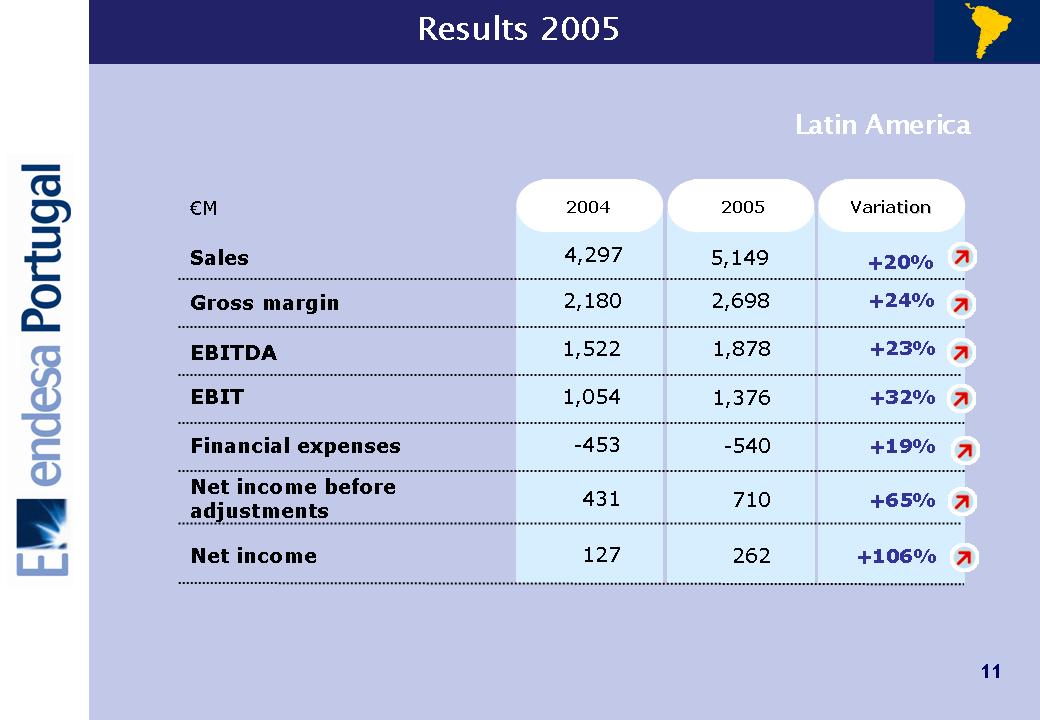
endesa Portugal Results 2005 Latin America 2004 2005 Variation tion €M Sales Gross margin EBITDA EBIT Financial expenses Net income 1,522 1,054 127 -453 4,297 2,180 +23% +32% +106% +19% +20% +24% 1,878 1,376 262 -540 5,149 2,698 431 +65% 710 Net income before adjustments 11

endesa Portugal Latin America 1Q 2005 1Q 2006 Variation tion €M Sales EBITDA EBIT Net income (1) 432 324 72 -121 1,139 591 +36% +42% +171% +16% +34% +35% 588 461 195 -140 1,531 800 192 +106% 396 Gross margin Financial expenses Net income before adjustments 12 (1) Includes an impact of €101M for the fiscal credit of the Chilectra-Elesur merger (+31% without this effect
endesa Portugal Europe
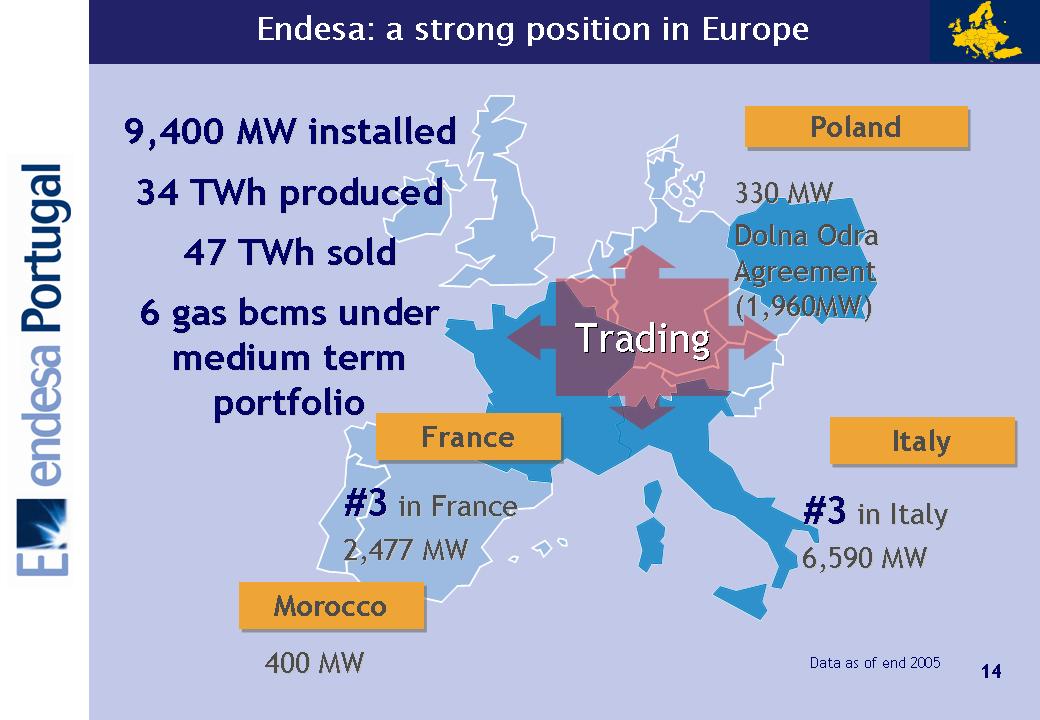
Endesa: a strong position in Europe Italy Italy Poland Poland Trading Trading Morocco Morocco France France 9,400 MW installed 9,400 MW installed 34 34 TWh TWh produced produced 47 47 TWh TWh sold sold 6 gas 6 gas bcms bcms under under medium term medium term portfolio portfolio 330 MW 330 MW Dolna Dolna Odra Odra Agreement Agreement (1,960MW) (1,960MW) #3 #3 in Italy in Italy 6,590 MW 6,590 MW #3 #3 in France in France 2,477 MW 2,477 MW 400 MW 400 MW Data as of end 2005 14
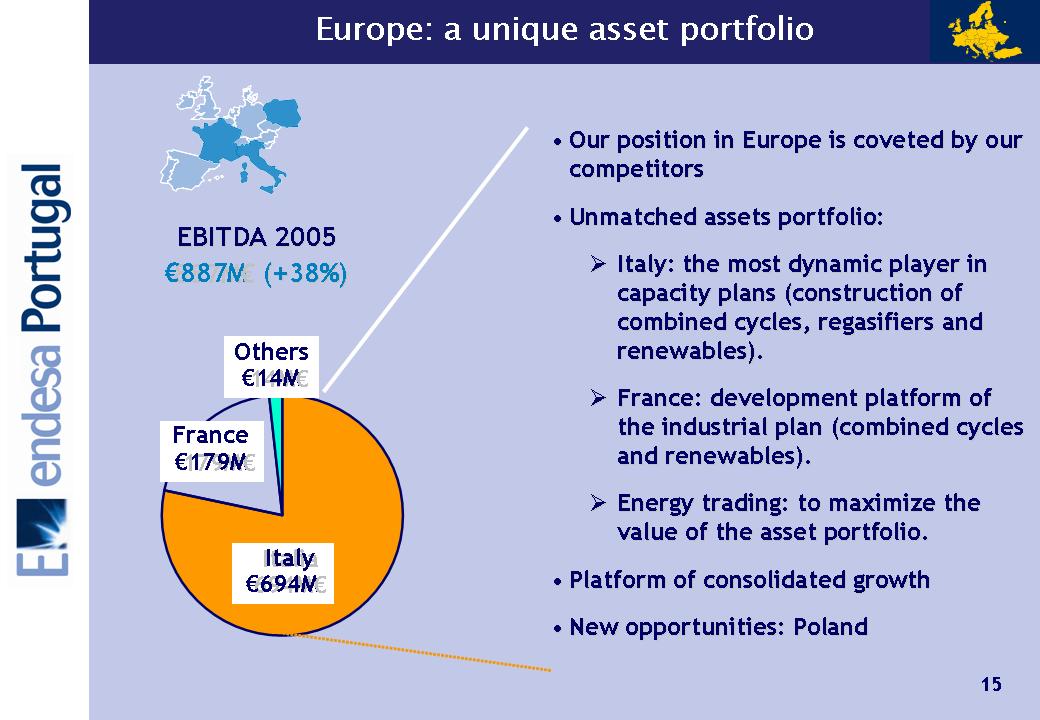
Endesa Portugal 887M €887M€ (+38%) (+38%) Italia Italy 694M €694M€ EBITDA 2005 EBITDA 2005 France 179M €179M€ 14M €14M€ • Our position in Europe is coveted by our Our position in Europe is coveted by our competitors competitors • Unmatched assets portfolio: Unmatched assets portfolio: ⑀⍂⑀⍂ Italy: the most dynamic player in Italy: the most dynamic player in capacity plans (construction of capacity plans (construction of combined cycles, regasifiers and combined cycles, regasifiers and renewables renewables). ). ⑀⍂⑀⍂ France: development platform of France: development platform of the industrial plan (combined cycles the industrial plan (combined cycles and and renewables renewables). ). ⑀⍂⑀⍂ Energy trading: to maximize the Energy trading: to maximize the value of the asset portfolio. value of the asset portfolio. • Platform of consolidated growth Platform of consolidated growth • New opportunities: Poland New opportunities: Poland Others 15

Endesa Portugal 2004 2005 Variation tion 535 370 -63 2,557 830 +66% +67% +0% +41% +47% 887 618 -63 3,598 1,223 Sales Gross margin EBITDA EBIT Financial expenses €M 169 +52% 257 Net income without disposals 169 +151% 425 Net income 16
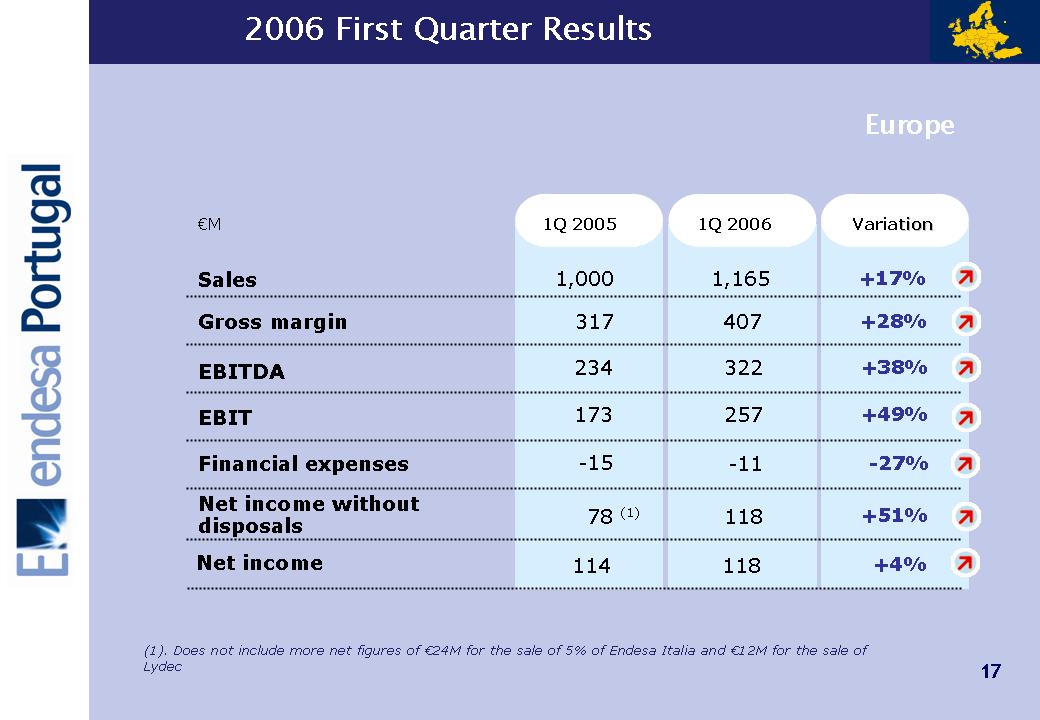
2006 First Quarter Results Europe Endesa Portugal 1Q 2005 1Q 2006 Variation tion 234 173 -15 1,000 317 +38% +49% -27% +17% +28% 322 257 -11 1,165 407 Sales Gross margin EBITDA EBIT Financial expenses €M 78 (1) +51% 118 Net income without disposals 114 +4% 118 Net income 17 (1). Does not include more net figures of €24M for the sale of 5% of Endesa Italia and €12M for the sale of Lydec

Spain and Portugal endesa Portugal 18
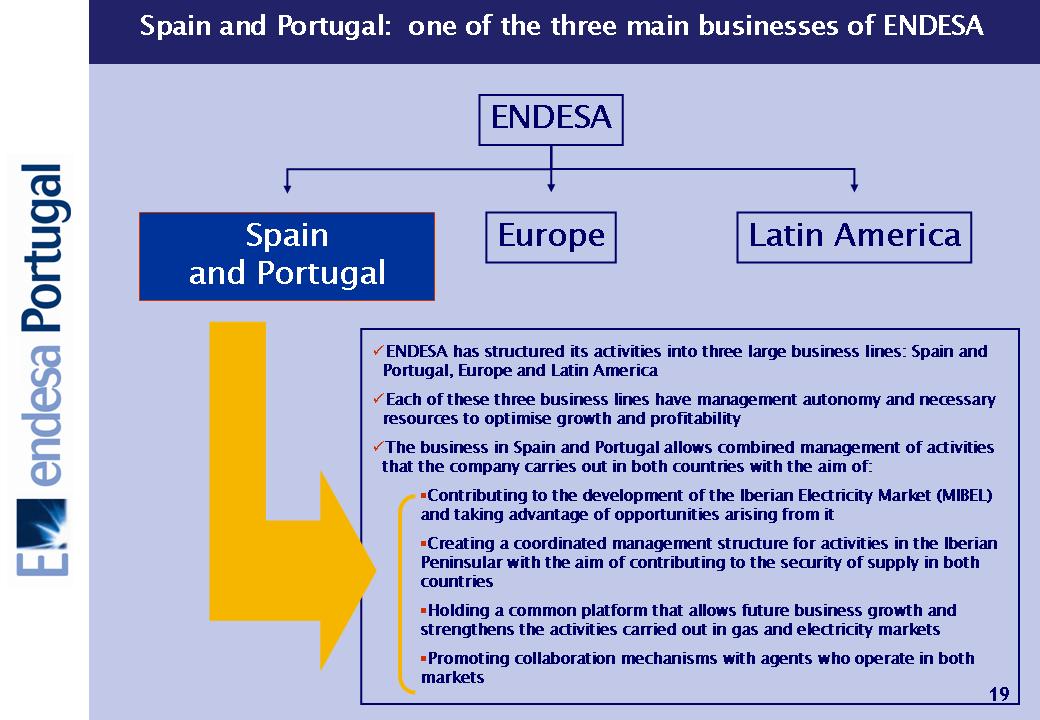
Spain and Portugal: one of the three main businesses of ENDESA ENDESA endesa Portugal Spain and Portugal Europe Latin America ⑀⏇ENDESA has structured its activities into three large business lines: Spain and Portugal, Europe and Latin America ⑀⏇Each of these three business lines have management autonomy and necessary resources to optimise growth and profitability ⑀⏇The business in Spain and Portugal allows combined management of activities that the company carries out in both countries with the aim of: ⑀⍽Contributing to the development of the Iberian Electricity Market (MIBEL) and taking advantage of opportunities arising from it ⑀⍽Creating a coordinated management structure for activities in the Iberian Peninsular with the aim of contributing to the security of supply in both countries ⑀⍽Holding a common platform that allows future business growth and strengthens the activities carried out in gas and electricity markets ⑀⍽Promoting collaboration mechanisms with agents who operate in both markets 19
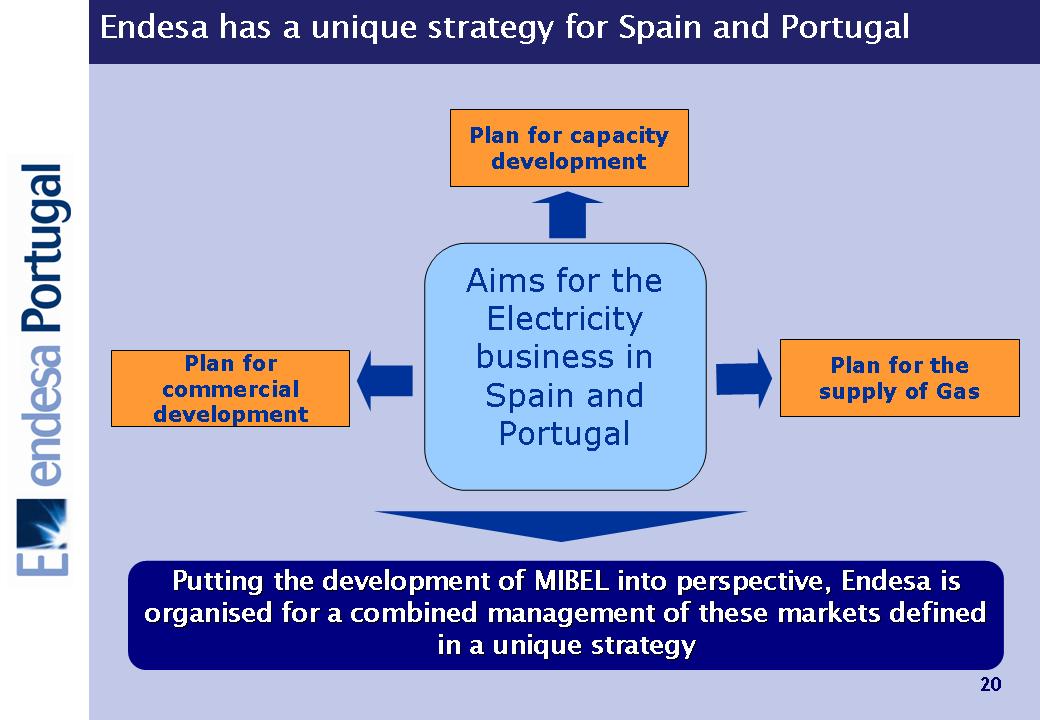
Endesa Portugal Plan for capacity development Plan for the supply of Gas Plan for commercial development Aims for the Electricity business in Spain and Portugal Putting the development of MIBEL into perspective, Endesa is Putting the development of MIBEL into perspective, Endesa is organised for a combined management of these markets defined organised for a combined management of these markets defined in a unique strategy in a unique strategy 20

MIBEL is a reality… • Important steps have been taken to create MIBEL • There is a calendar designed by governments of both countries with concrete dates for its implementation • MIBEL will be a step towards the creation of a single European electricity market ...and also an opportunity • Spain and Portugal: an attractive market with growth rates very much above the European average • Increase in competition The new Endesa structure is already considering it 21 Endesa Portugal
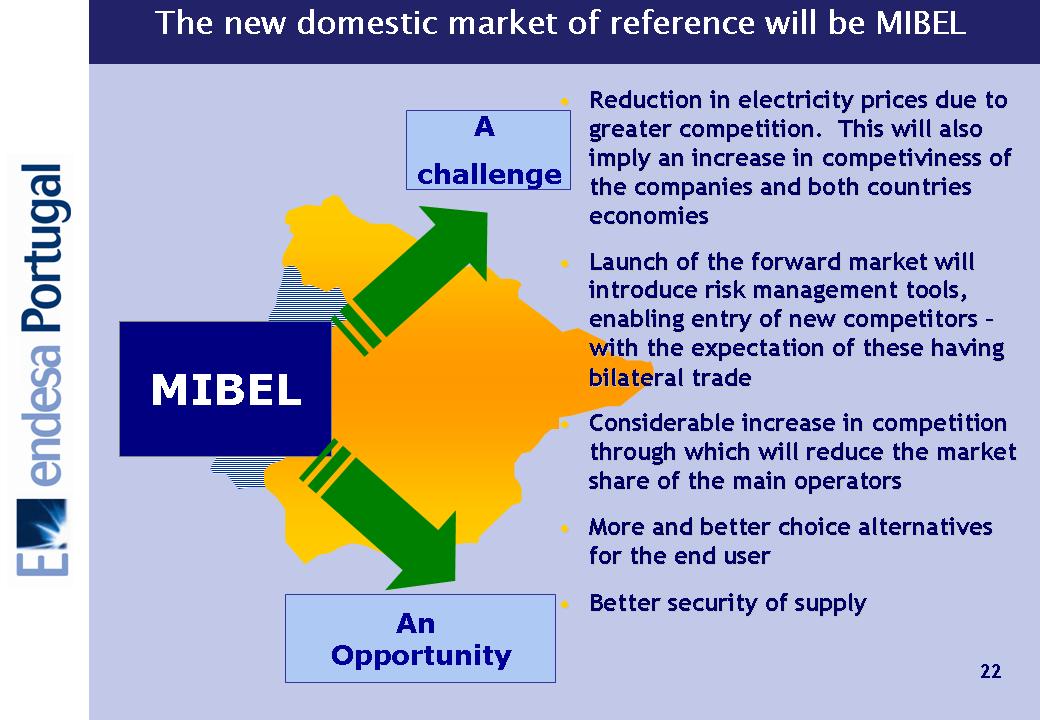
endesa Portugal The new domestic market of reference will be MIBEL • Reduction in electricity prices due to Reduction in electricity prices due to greater competition. This will also greater competition. This will also imply an increase in competiviness of imply an increase in competiviness of the companies and both countries the companies and both countries economies economies • Launch of the forward market will Launch of the forward market will introduce risk management tools, introduce risk management tools, enabling entry of new competitors enabling entry of new competitors - with the expectation of these having with the expectation of these having bilateral trade bilateral trade • Considerable increase in competition Considerable increase in competition through which will reduce the market through which will reduce the market share of the main operators share of the main operators • More and better choice alternatives More and better choice alternatives for the end user for the end user • Better security of supply Better security of supply MIBEL A challenge An Opportunity 22
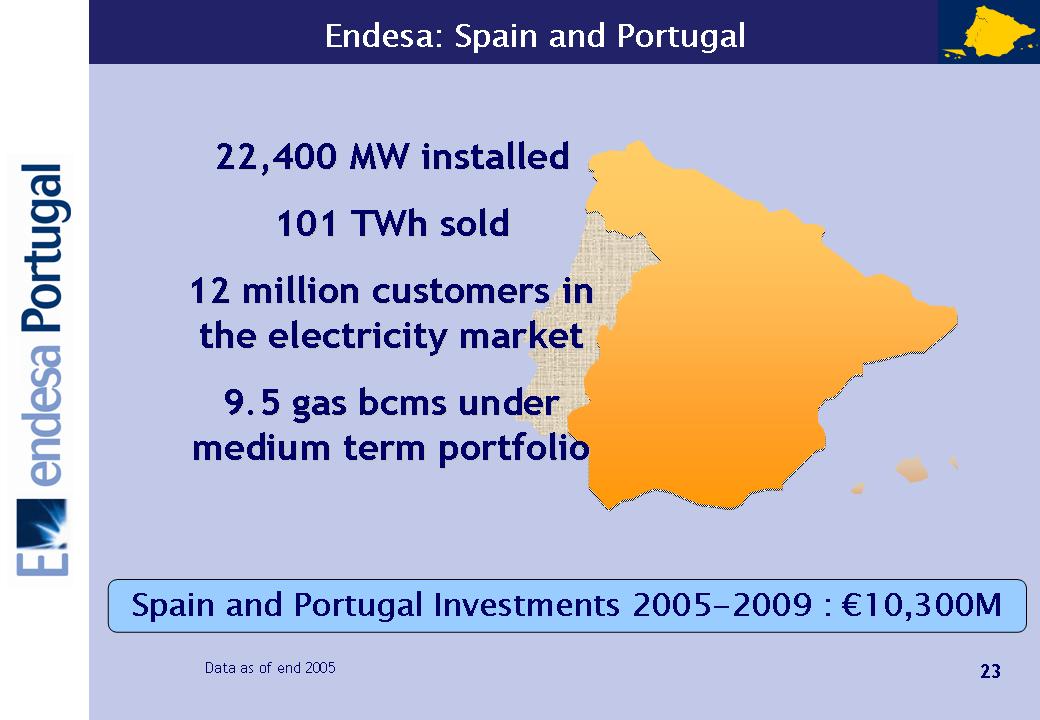
Endesa: Spain and Portugal 22,400 MW installed 22,400 MW installed 101 101 TWh TWh sold sold 12 million customers in 12 million customers in the electricity market the electricity market 9.5 gas 9.5 gas bcms bcms under under medium term portfolio medium term portfolio Spain and Portugal Investments 2005-2009 : €10,300M Data as of end 2005 23 Endesa Portugal

endesa Portugal 2004 2005 Variation tion 2,472 1,432 -501 6,648 4,352 +32% +58% +20% +32% +20% 3,266 2,264 -602 8,761 5,202 Sales Gross margin EBITDA EBIT Financial expenses €M 888 +53% 1,358 Net income 24 Endesa Portugal

Sales Gross margin EBITDA EBIT Financial expenses €M 1Q 2005 1Q 2006 Variation tion 824 558 -113 2,048 1,247 +26% +39% -28% +26% +22% 1,037 773 -81 2,578 1,527 Net income 380 +49% 568 Spain and Portugal 25 Endesa Portugal
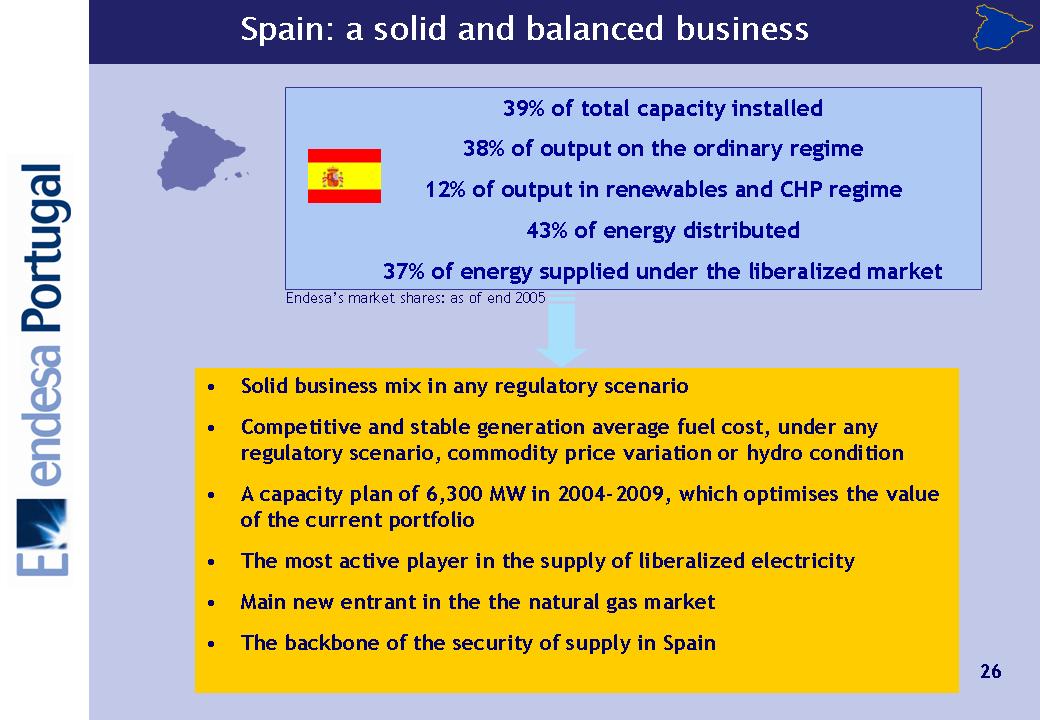
• Solid business mix in any regulatory scenario • Competitive and stable generation average fuel cost, under any regulatory scenario, commodity price variation or hydro condition • A capacity plan of 6,300 MW in 2004-2009, which optimises the value of the current portfolio • The most active player in the supply of liberalized electricity • Main new entrant in the the natural gas market • The backbone of the security of supply in Spain 39% of total capacity installed 38% of output on the ordinary regime 12% of output in renewables and CHP regime 43% of energy distributed 37% of energy supplied under the liberalized market Endesa’s market shares: as of end 2005 26 Endesa portugal
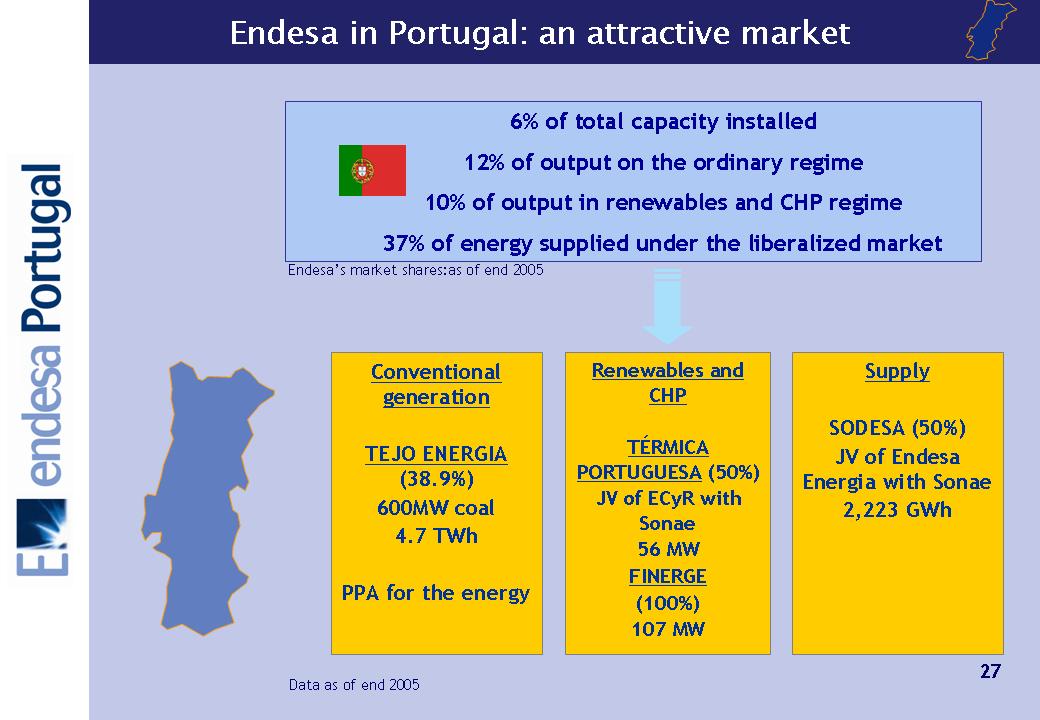
endesa portugal 6% of total capacity installed 12% of output on the ordinary regime 10% of output in renewables and CHP regime 37% of energy supplied under the liberalized market Endesa in Portugal: an attractive market Conventional generation TEJO ENERGIA (38.9%) 600MW coal 4.7 TWh PPA for the energy Renewables and CHP TÉRMICA PORTUGUESA (50%) JV of ECyR with Sonae 56 MW FINERGE (100%) 107 MW Supply SODESA (50%) JV of Endesa Energia with Sonae 2,223 GWh Data as of end 2005 27 Endesa’s market shares:as of end 2005

Endesa in Portugal - Generation Endesa portugal Abrantes Abrantes • Tejo Energia shareholder, candidate company for two 400 MW units in Pego - Abrantes • 2009 to start operations Sines Sines • Candidate in partnership with EDP for the installation of two 400 MW units • 2011 to start operations Obtaining construction permits for new CCGTs • 600 MW coal plant with a PPA contract in force to sell energy until 2021 • Once MIBEL is in place the PPA will be replaced with an alternative remuneration scheme (CMEC) Tejo Energia: IP(50 %), Endesa (38.9 %) & EDP (11.1 %) GOALS 28

Endesa in Portugal - Renewables & CHP FINERGE FINERGE • Company 100% Endesa, 4th largest wind energy player in Portugal • 107 MW in operation • 96.8 MW under construction • 385.9 MW in development TP TP • Joint Venture with Sonae (50-50%) • One of the main players of CHP • 56 MW in operation • 14 MW under construction Companies operating in renewables and CHP: TP and Finerge • Partnership of 40% EDP + 40% Endesa + 20% GENERG. ENERCON as technology partner • Target of 800 MW in the auction + 200 MW as a bonus • Installation of wind farms from 2008 onwards To win the wind energy capacity auction GOALS 29

endesa Portugal Endesa in Portugal - Supply SODESA SODESA • JV with Sonae (50%-50%) • 22% market share of the Portuguese liberalized market • 2,223 GWh sold • 2,705 customers Supply: patnership with Sonae (Sodesa) • Entering the Low Voltage market segment in September 2006 • 4,000 GWh of energy supplied on the liberalized market in 2010 Leading supplier in the SME and domestic liberalized market GOALS 30
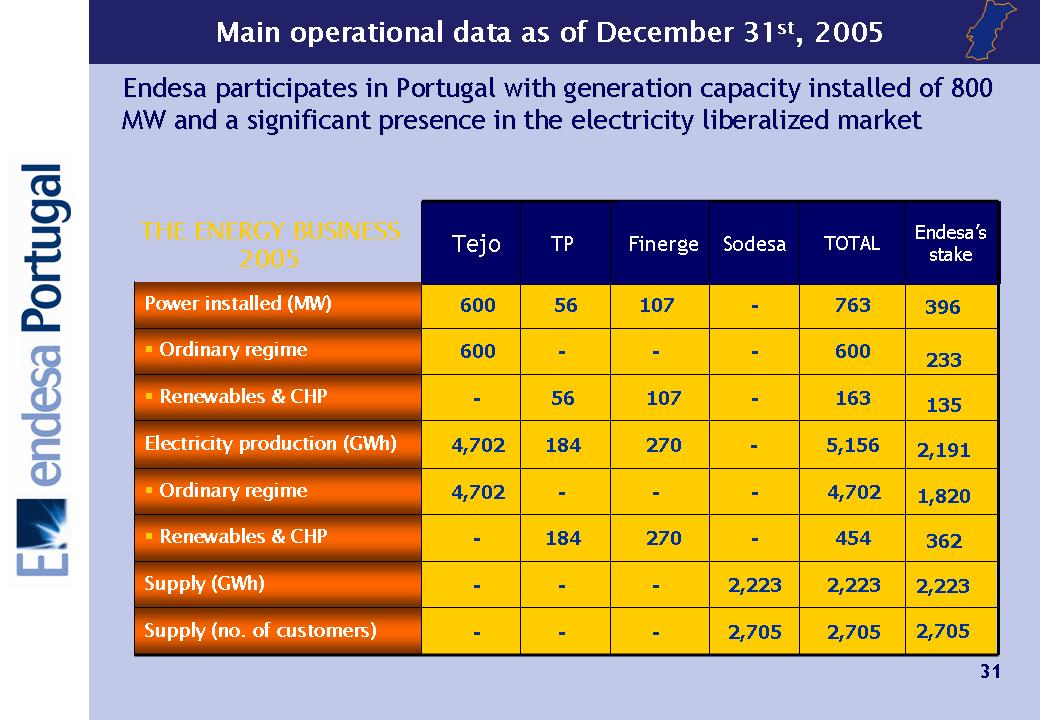
Main operational data as of December 31st, 2005 233 135 2,191 1,820 362 2,705 2,223 396 Endesa’s stake 107 2,705 2,705 - - - Supply (no. of customers) 2,223 2,223 - - - Supply (GWh) 454 - 270 184 - ⑀⍽ Renewables & CHP 4,702 - - - 4,702 ⑀⍽ Ordinary regime 5,156 - 270 184 4,702 Electricity production (GWh) 163 - 107 56 - ⑀⍽ Renewables & CHP 600 - - - 600 ⑀⍽ Ordinary regime 763 - 56 600 Power installed (MW) TOTAL Sodesa TP Tejo THE ENERGY BUSINESS 2005 Endesa participates in Portugal with generation capacity install Endesa participates in Portugal with generation capacity installed of 800 ed of 800 MW and a significant presence in the electricity liberalized mar MW and a significant presence in the electricity liberalized market ket 31 Finerge Endesa Portugal
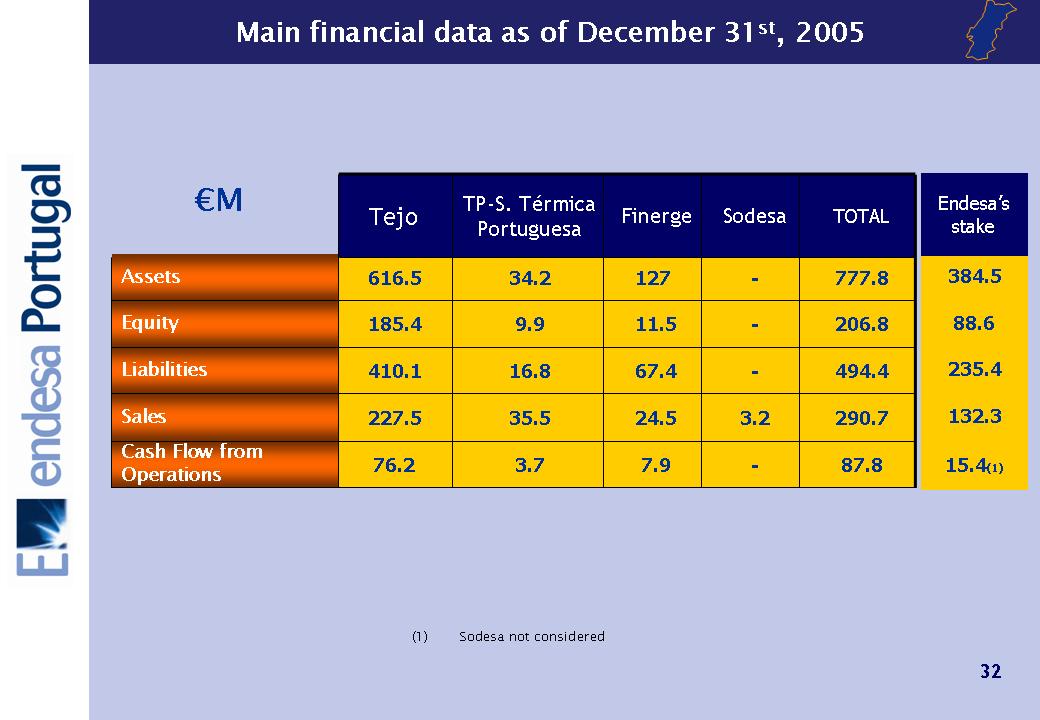
87.8 - 7.9 3.7 76.2 290.7 3.2 24.5 35.5 227.5 494.4 - 67.4 16.8 410.1 206.8 - 11.5 9.9 185.4 777.8 - 127 34.2 616.5 TOTAL Sodesa Finerge TP-S. Térmica Portuguesa Tejo Cash Flow from Operations Sales Liabilities Equity Assets (1) Sodesa not considered €M 15.4(1) 132.3 235.4 88.6 384.5 Endesa’s stake 32 Main Endesa portugal
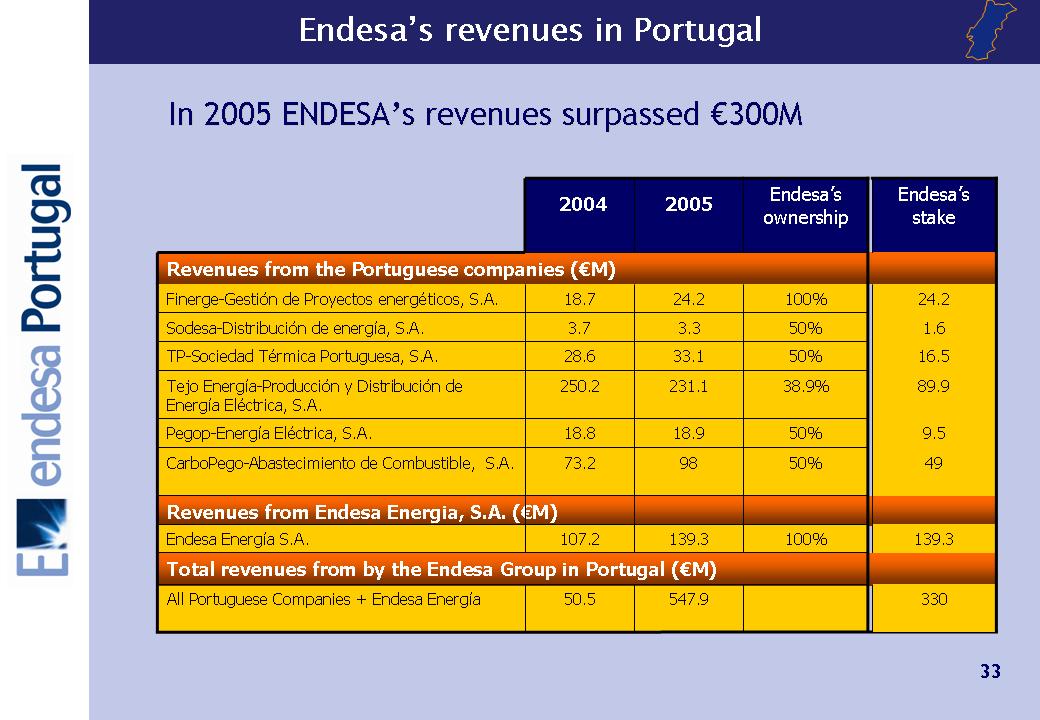
Endesa’s revenues in Portugal In 2005 In 2005 ENDESA ENDESA’s revenues surpassed revenues surpassed €300M 300M Revenues from Endesa Energia, S.A. (€M) 100% 139.3 107.2 Endesa Energía S.A. 547.9 50.5 All Portuguese Companies + Endesa Energía Total revenues from by the Endesa Group in Portugal (€M) 50% 98 73.2 CarboPego-Abastecimiento de Combustible, S.A. 50% 18.9 18.8 Pegop-Energía Eléctrica, S.A. 38.9% 231.1 250.2 Tejo Energía-Producción y Distribución de Energía Eléctrica, S.A. 50% 33.1 28.6 TP-Sociedad Térmica Portuguesa, S.A. 50% 3.3 3.7 Sodesa-Distribución de energía, S.A. 100% 24.2 18.7 Finerge-Gestión de Proyectos energéticos, S.A. Revenues from the Portuguese companies (€M) Endesa’s ownership 2005 2004 139.3 330 49 9.5 89.9 16.5 1.6 24.2 Endesa’s stake 33
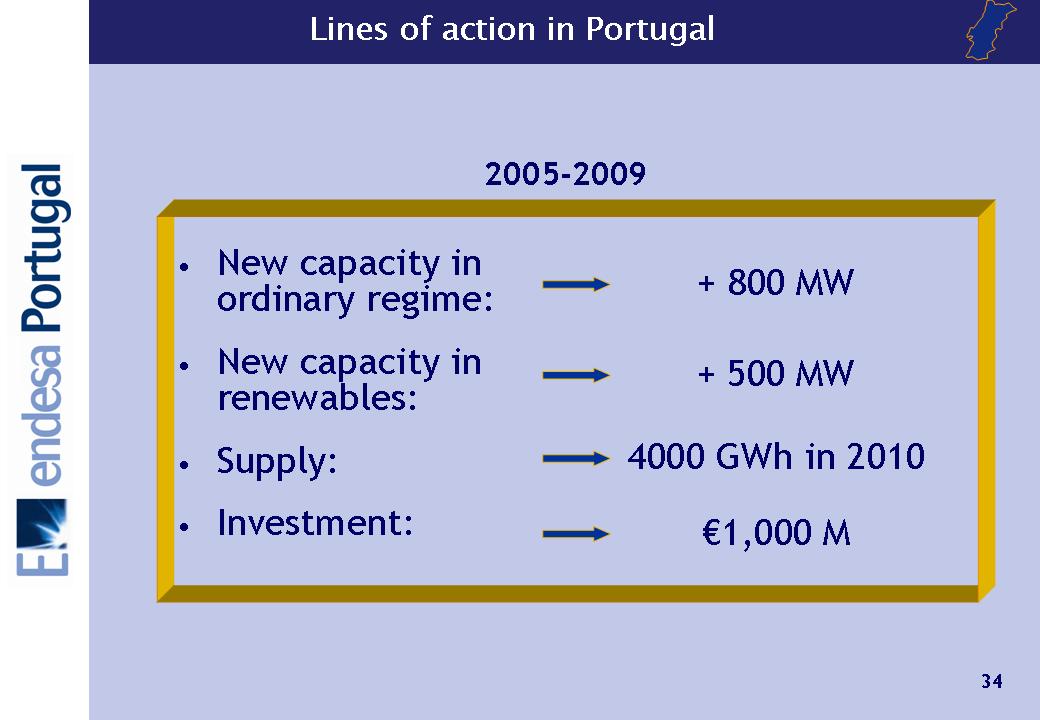
2005-2009 • New capacity in ordinary regime: • New capacity in renewables: • Supply: • Investment: + 800 MW + 500 MW 4000 GWh in 2010 €1,000 M Endesa Portugal
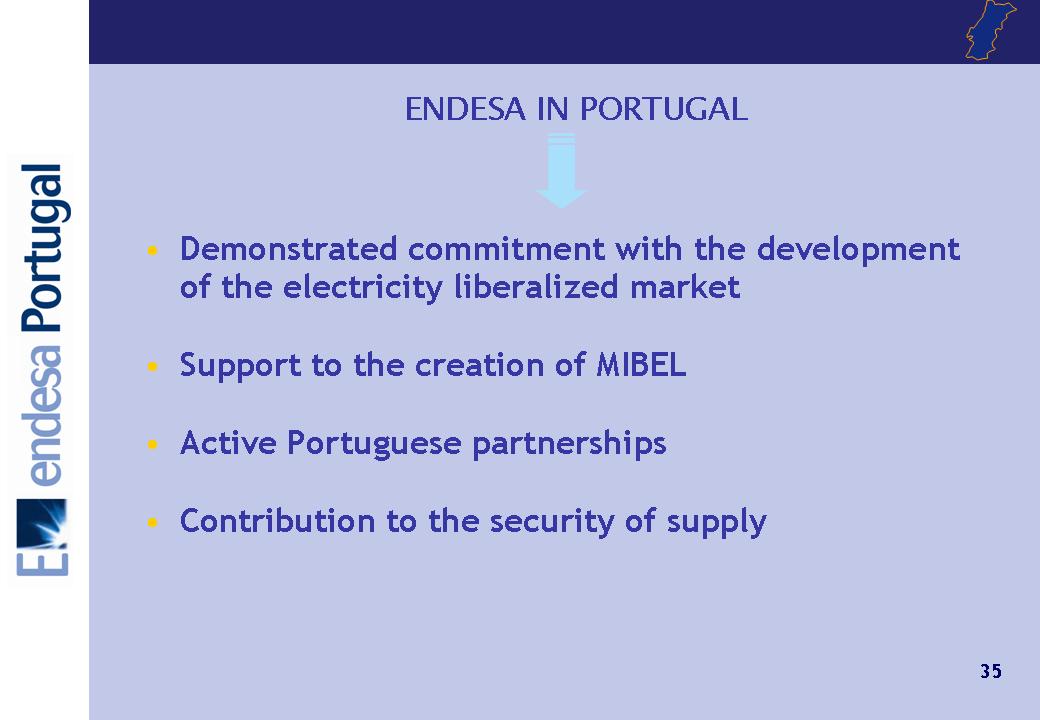
ENDESA IN PORTUGAL • Demonstrated commitment with the development of the electricity liberalized market • Support to the creation of MIBEL • Active Portuguese partnerships • Contribution to the security of supply 35 Endesa Portugal
Important Legal Information •Investors are urged to read Endesa’s Solicitation/Recommendation Statements on Schedules 14D-9 filed and/or to be filed with the U.S. Securities and Exchange Commission (the “SEC”), as they will contain important information. The Solicitation/Recommendation Statements and other public filings made from time to time by Endesa with the SEC are available without charge from the SEC’s website at www.sec.gov and at Endesa's principal executive offices in Madrid, Spain. •This presentation contains certain “forward-looking statements” regarding anticipated financial and operating results and statistics and other future events. These statements are not guarantees of future performance and are subject to material risks, uncertainties, changes and other factors which may be beyond Endesa’s control or may be difficult to predict. •Forward-looking statements include, but are not limited to, information regarding: estimated future earnings; anticipated increases in wind and CCGTs generation and market share; expected increases in demand for gas and gas sourcing; management strategy and goals; estimated cost reductions; tariffs and pricing structure; estimated capital expenditures and other investments; expected asset disposals; estimated increases in capacity and output and changes in capacity mix; repowering of capacity and macroeconomic conditions. For example, the EBITDA and dividends targets for 2004 to 2009 included in this presentation are forward-looking statements and are based on certain assumptions which may or may not prove correct. The principal assumptions underlying these forecasts and targets relate to regulatory environment, exchange rates, divestments, increases in production and installed capacity in the various markets where Endesa operates, increases in demand in these markets, allocation of production among different technologies increased costs associated with higher activity levels not exceeding certain levels, the market price of electricity not falling below certain levels, the cost of CCGT and the availability and cost of gas, fuel, coal and emission rights necessary to operate our business at desired levels. •The following important factors, in addition to those discussed elsewhere in this presentation, could cause actual financial and operating results and statistics to differ materially from those expressed in our forward-looking statements: •Economic and Industry Conditions: materially adverse changes in economic or industry conditions generally or in our markets; the effect of existing regulations and regulatory changes; tariff reductions; the impact of any fluctuations in interest rates; the impact of fluctuations in exchange rates; natural disasters; the impact of more stringent environmental regulations and the inherent environmental risks relating to our business operations; the potential liabilities relating to our nuclear facilities. •Transaction or Commercial Factors: any delays in or failure to obtain necessary regulatory, antitrust and other approvals for our proposed acquisitions or asset disposals, or any conditions imposed in connection with such approvals; our ability to integrate acquired businesses successfully; the challenges inherent in diverting management's focus and resources from other strategic opportunities and from operational matters during the process of integrating acquired businesses; the outcome of any negotiations with partners and governments. Any delays in or failure to obtain necessary regulatory approvals, including environmental to construct new facilities, repowering or enhancement of existing facilities; shortages or changes in the price of equipment, materials or labor; opposition of political and ethnic groups; adverse changes in the political and regulatory environment in the countries where we and our related companies operate; adverse weather conditions, which may delay the completion of power plants or substations, or natural disasters, accidents or other unforeseen events; and the inability to obtain financing at rates that are satisfactory to us. •Political/Governmental Factors: political conditions in Latin America; changes in Spanish, European and foreign laws, regulations and taxes. •Operating Factors: technical difficulties; changes in operating conditions and costs; the ability to implement cost reduction plans; the ability to maintain a stable supply of coal, fuel and gas and the impact of fluctuations on fuel and gas prices; acquisitions or restructurings; the ability to implement an international and diversification strategy successfully. •Competitive Factors: the actions of competitors; changes in competition and pricing environments; the entry of new competitors in our markets. •Further information about the reasons why actual results and developments may differ materially from the expectations disclosed or implied by our forward-looking statements can be found under “Risk Factors” in our annual report on Form 20-F for the year ended December 31, 2005. •No assurance can be given that the forward-looking statements in this document will be realized. Except as may be required by applicable law, neither Endesa nor any of its affiliates intends to update these forward-looking statements. endesa Portugal
Pursuant to the requirements of the Securities Exchange Act of 1934, the registrant has duly caused this report to be signed on its behalf by the undersigned, thereunto duly authorized.
ENDESA, S.A. | ||
| | | |
Dated: June 20th, 2006 | By: | /s/ Álvaro Pérez de Lema |
Name: Álvaro Pérez de Lema | ||
| Title: Manager of North America Investor Relations | ||