FORM 6-K
SECURITIES AND EXCHANGE COMMISSION
Washington, D.C. 20549
Report of Foreign Issuer
Pursuant to Rule 13a-16 or 15d-16 of
the Securities Exchange Act of 1934
For the month of February 21, 2007
Commission File Number: 333-07654
ENDESA, S.A.
(Translation of Registrant's Name into English)
Ribera del Loira, 60
28042 Madrid, Spain
(Address of principal executive office)
Indicate by check mark whether the registrant files or will file
annual reports under cover of Form 20-F or Form 40-F:
| Form 20-F | X | Form 40-F |
Indicate by check mark if the registrant is submitting the Form 6-K
in paper as permitted by Regulation S-T Rule 101(b)(1):
| Yes | No | X |
Indicate by check mark if the registrant is submitting the Form 6-K
in paper as permitted by Regulation S-T Rule 101(b)(7):
| Yes | No | X |
Indicate by check mark whether by furnishing the information
contained in this Form, the Registrant is also thereby furnishing the information to the Commission
pursuant to Rule 12g3-2(b) under the Securities Exchange Act of 1934:
| Yes | No | X |
If “Yes” is marked, indicate below the file number assigned to the registrant
in connection with Rule 12g3-2(b): N/A
SIGNATURES
Pursuant to the requirements of the Securities Exchange Act of 1934, the registrant has duly caused this report to be signed on its behalf by the undersigned, thereunto duly authorized.
| ENDESA, S.A. | |
| Dated: February 21, 2007 | By: /s/ Álvaro Pérez de Lema |
| Name: Álvaro Pérez de Lema | |
| Title: Manager of North America Investor Relations |

Results
JANUARY-DECEMBER 2006
Madrid, February 22, 2007
1
Endesa reports 2006 net income of Euro 2,969 million
Stripping out capital gains from asset sales, net income was Euro 2,576 million, up 40% over 2005.
Excellent results firmly underpinned by efficient business management
Gross operating profit (EBITDA) rose 18.6% vs. 2005 to Euro 7,139 million.
Operating profit (EBIT) advanced 23.4% to Euro 5,239 million.
Strong bottom line growth in all businesses
The Spanish and Portuguese business recorded net income of Euro 1,843 million, up 35.7% over 2005.
Net income from the business in Europe rose 16% to Euro 493 million.
In Latin America, net income jumped by 76.3% to Euro 462 million.
These results put ENDESA firmly on track to meet 2005-2009 strategic targets
The Company’s proactive business management policy and its healthy project portfolio meant that 2006 net income and EBITDA growth beat the guidance given to the market.
ENDESA’s reported 2006 results are in line with preliminary figures provided to the market on 24 January, 2007.
2
CONTENTS
Key facts and figures for 2006 4
Consolidated results 14
Progress on strategic targets 24
Results by business line 27
Business in Spain and Portugal 28
Business in Europe 42
Business in Latin America 49
Statistical appendix 59
3
KEY FACTS AND FIGURES
FOR 12M06
4
STRONG NET INCOME GROWTH IN ALL BUSINESSES
¾ ENDESA reports net income of Euro 2,969 million for 2006, 6.7% less than in 2005 due to recognition in 4Q05 of capital gains of Euro 1,115 million from the sale of Auna.
¾ Stripping out capital gains from asset sales, net profit was Euro 2,576 million, up 40% over 2005.
¾ The business in Spain and Portugal posted net income of Euro 1,843 million in 2006, an increase of 35.7%.
¾ Net income from business in Europe rose 16% to Euro 493 million.
¾ Net income from business in Latin America jumped 76.3% to Euro 462 million.
¾ Net income in Spain and Portugal reflects ENDESA’s best estimate of the impact of Royal Decree Law 3/2006 based on information available as of the 2006 close, specifically the provisions of the aforementioned legislation and the National Energy Commission’s (CNE) interpretation thereof. The Ministry of Industry, Tourism and Trade has stated that the definitive amounts will not be announced before June 2007; variations, if any, on the amounts booked in 2006 will be recognised in 2007. Nonetheless, these potential modifications are not expected to have a material impact on the Company’s consolidated financial statements.
STRONG INCREASES IN MAIN INCOME STATEMENT ITEMS
¾ Gross profit in 2006 was Euro 10,434 million, 14.3% higher than in 2005.
¾ EBITDA rose 18.6% to Euro 7,139 million.
¾ EBIT increased 23.4% to Euro 5,239 million.
¾ Cash flow from operating activities totalled Euro 4,643 million, 10.3% higher than in 2005.
IMPROVED OUTPUT AND SHARP INCREASE IN ELECTRICITY SALES IN ALL BUSINESSES
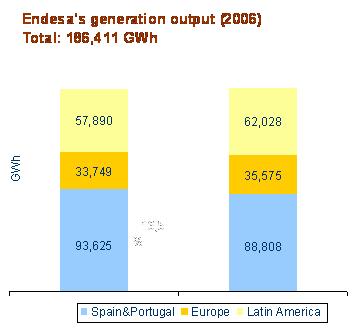
¾ ENDESA’s total generation output in 2006 amounted to 186,411 GWh, an increase of 0.6% over 2005.
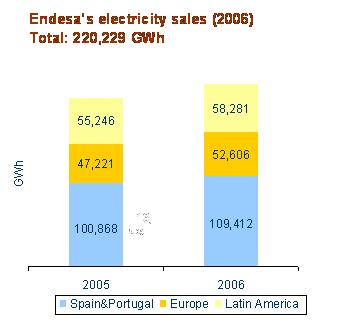
¾ Sales totalled 220,299 GWh, 8.3% more than in 2005, with increases of 8.5% in the Spanish and Portuguese business, 11.4% in Europe and 5.5% in Latin America.
2006 RESULTS SURPASSED STRATEGIC TARGETS
¾ ENDESA’s 2006 EBITDA and net income exceeded strategic targets set by the Company for the year.
¾ The full-year 2006 results are in line with preliminary results presented to the market on 24 January, 2007.
5
BUSINESS IN SPAIN AND PORTUGAL
Sharp growth in main income statement items against a backdrop of regulatory change
¾ Net income from business in Spain and Portugal increased by 35.7% over 2005 to Euro 1,843 million and accounted for 62.1% of ENDESA's total net income.
¾ EBITDA grew 17.4% to Euro 3,835 million and EBIT by 19.5% to Euro 2,705 million.
¾ Excellent performance by this business was achieved despite having to account generation sales to the Company’s regulated customers at the provisional price of Euro 42.35/MWh pursuant to Royal Decree Law 3/2006, significantly below market prices. The negative impact of this Royal Decree Law on EBITDA and net income was Euro 345 million and Euro 224 million, respectively.
¾ With the enactment in 1Q06 of the regulation for the island and non-mainland electricity systems, in 2006 ENDESA booked Euro 186 million of higher compensation after tax for generation in these systems between 2001 and 2005.
¾ 2006 figures also include a Euro 1,341 million asset in connection with the revenue shortfall from regulated activities in the period, net of the value of the CO2 emission rights allocated free of charge - Euro 121 million - pursuant to the application of Royal Decree Law 3/2006.
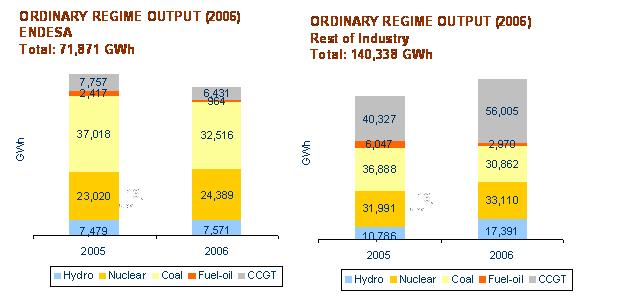
Competitive position reinforced by mainland generation mix
¾ In 2006, ENDESA’s hydro and nuclear generation output accounted for 44.5% of the mainland generation mix, compared to 36% for the rest of the sector.
¾ ENDESA’s mainland thermal plants achieved a 79% load factor in 2006, well above the 61% average for the rest of the sector. The load factor at the Company’s coal plants was a noteworthy 75.6%.
¾ The trend in ENDESA’s mainland fuel costs in 2006 was positive, dropping 4% over 2005, compared to an estimated 6.1% rise for the rest of the sector.
Active management of CO2 emission costs
¾ ENDESA has a broad portfolio of carbon credits derived from its Clean Development Mechanisms (CDM). ENDESA has signed Emissions Reduction Purchase Agreements (ERPA) for a total of 86 million tonnes of CO2 and Letters of Intent (LOI) for 24 million tonnes of additional volume.
1,187 MW of new installed capacity
¾ ENDESA added 1,187 MW of new capacity to its generation facilities in 2006, representing significant progress in the New Capacity Plan.
6
¾ New capacity includes the completion of the 400 MW Cristóbal Colón CCGT in Huelva, 512 MW in non-mainland systems installed to meet growing demand in these markets, and 275 MW of new renewables/CHP capacity.
¾ Work on the 800M MW CCGT plant (La Coruña) is progressing according to schedule. This plant is scheduled to be commissioned in 2007. The conversion to imported coal of the 367 MW group 3 at this facility was completed in December 2006.
¾ In 2006 ENDESA signed an agreement with Isofotón, the producer of photovoltaic panels, with the aim of ensuring that ENDESA has access to the equipment required to develop the 100 MW of solar powered facilities that the Company plans to install in the coming years
¾ In October 2006, the Eólicas consortium in Portugal - in which Endesa has a 30% stake - was awarded the project to develop 1,200 MW of wind capacity, the largest in the Portuguese wind tender.
¾ ENDESA, together with International Power, has been awarded a connection point for two 400MW CCGTs at the Tejo site. The operating license should be awarded during this year.
Strong growth in EBIT from CHP and renewables: +19.7%
¾ Revenues from sales of renewable/CHP energy generated by ENDESA’s consolidated companies totalled Euro 256 million, 6.7% more than in 2005.
¾ EBITDA from this business increased by 19.7% to Euro 176 million, and EBIT by 15% to Euro 115 million.
Service quality at record high levels; value unlocked at the supply business
¾ Last year in Spain ENDESA recorded its highest ever service level. The 2006 cumulative average interruption duration index (SAIDI) was 1 hour and 55 minutes, an improvement of 30% over 2005.
¾ These figures confirm the success of the operational enhancements implemented and investments made in new distribution infrastructure in recent years. They enable the Company to consolidate its market position and leverage the value of its broad customer base, which currently stands at 11,216,518 in the regulated market and 1,077,806 in the deregulated market.
¾ Sales by ENDESA in the deregulated market rose 2.8% to 37,813 GWh in 2006, with an average sales price was Euro 74.45/MWh. This activity represents an important hedge against wholesale market price volatility, as well as providing the generation business with a reasonable and guaranteed return over the medium and long term.
ENDESA: the largest investor of any Spanish utility
¾ ENDESA invested Euro 2,921 million in Spain and Portugal in 2006, of which Euro 2,630 million, or 90%, was capex. This underscores its status as the largest investor among Spanish utilities.
¾ Euro 1,408 million of capex was spent on distribution facilities.
7
Total market share of 11.6% in the natural gas market
¾ ENDESA sold a total of 27,479 GWh in the Spanish natural gas market in 2006, 21.6% more than in 2005. These sales, coupled with gas consumption by its own plants, represent a market share of 11.6%.
¾ Revenues from gas sales in the deregulated market in 2006 totalled Euro 647 million, up 98.5% from 2005, while regulated gas distribution revenues were Euro 46 million, an increase of 17.9%. Both businesses contributed to gross margin by Euro 150 million.
BUSINESS IN EUROPE
Growth in the main financial indicators underscores the strength of the business
¾ Net income from the business in Europe increased by 16% to Euro 493 million in 2006 vs. 2005 and accounted for 16.6% of ENDESA’s total net income.
¾ This figure includes Euro 118 million after minorities related to the increase in value of this business caused by the restatement of the tax basis of Endesa Italia’s fixed assets to their book values, in accordance with Italian legislation.
¾ EBITDA stood at Euro 1,116 million, up 25.8% versus 2005, and EBIT at Euro 846 million, an increase of 36.9%.
Excellent results underpinned by strong operating performance
¾ ENDESA’s total generation in Europe in 2006 amounted to 35,575 GWh, an increase of 5.4% on the year before.
¾ Electricity sales were up 11.4% to 52,606 GWh.
Italy: strong growth in main financial indicators plus progress on new capacity and regasification projects
¾ EBITDA at ENDESA Italia was Euro 916 million, 32% higher than in 2005, while EBIT stood at Euro 749 million, a 38.2% increase.
¾ Construction on the two 400MW CCGTs at the Scandale plant (Calabria), in which ENDESA owns 50%, is proceeding according to schedule, as is the preliminary work on the offshore regasification terminal off Livorno, which is scheduled to come on-stream at the start of 2009.
¾ In September, Endesa Europa acquired 58.35% of Centro Energia Teverola and Centro Energia Ferrara. Each of these companies owns a 170 MW CCGT subject to a subsidised tariff.
¾ In line with planned growth in renewable energies, in 2006 the company added the Iardino and Vizzini wind farms, already operational, to its generation mix. The Montecute and Trapani farms will come on stream in the early months of 2007. These four facilities add 112 MW to installed capacity.
8
¾ In 2006 Endesa Italia sold 32,970 GWh of electricity, of which 18,828 GWh, or 57%, were accounted for by direct sales to large end customers. Thus, the supply business goes a long way to ensuring the placement of the business’ significant generation capacity.
France: good performance by Snet with significant new capacity projects and new supply contracts
¾ In 2006, French generator Snet, which began to operate under the Endesa France name at year-end, contributed Euro 196 million to ENDESA’s EBITDA, 9.5% more than in 2005, and Euro 98 million to EBIT, an increase of 58.1%.
¾ Total electricity sales rose 16.6% to 19,022 GWh, an increase of 16.6% over 2005.
¾ The French operator closed significant supply deals during the period. It signed an agreement with the French multinational company Auchan to supply 400 GWh of power in 2006 and another with the French railway operator SNCF to supply 6,600 GWh in the period 2007-2011.
¾ In the generation business, after receiving the pertinent permits, construction began on two 400 MW CCGTs at the Émile Huchet site. Meanwhile, the development of an additional 800 MW CCGT in Lacq and another with capacity of over 400 MW, which could be located its Lucy or Hornaing sites, is being studied.
¾ In addition, Endesa France acquired the right to build a 10MW wind farm in Léhaucourt and has committed to new wind projects in other regions such as Ambon, Muzillac and Cernon, which will add combined capacity of nearing 65 MW.
BUSINESS IN LATIN AMERICA
Sharp increases in main financial figures, underscoring progress by this business
¾ ENDESA’s Latin American operations posted a 76.3% increase in 2006 net income to Euro 462 million, contributing 15.6% to the Company's total net income.
¾ EBITDA and EBIT rose 16.5% and 22.7% to Euro 2,188 million and Euro 1,688 million, respectively.
¾ Increases in EBITDA and EBIT were attained in both generation & transmission (+19.4% and +27.7%, respectively) and in distribution (+15.4% and +18.5%, respectively), highlighting the strong business momentum underpinned by operations.
Increased margins in generation and distribution
¾ The generation unit margin reached US$26.2/MWh, an increase of 24.2% compared to 2005, and the distribution unit margin reached US$34.6/MWh, an increase of 7.8%.
9
Sharp pick-up in generation, distribution and sales and lower energy losses across all countries
¾ ENDESA’s total generation in Latin America in 2006 amounted to 62,028 GWh, an increase of 7.1% on the year before, while distribution increased 5.5% to 58,281 GWh. The Company recorded significant increases in both generation and distribution in all its countries of operation.
¾ Organic growth of the markets in which ENDESA operates drove total revenues from its Latin American companies 15.1% higher in 2006.
¾ ENDESA’s total customer base in Latin America was 11.6 million at December 31, 2006, i.e., 362,000 more than at the beginning of the period.
¾ Energy distribution losses were lower in all countries in 2006, most notably in Argentina and Brazil, where losses were down 0.6 percentage points compared to 2005.
New generation facilities
¾ Capacity at ENDESA’s Latin American companies increased last year by 222 MW essentially as a result of the contribution of the Termocartagena plant (Colombia) acquired in 2006 and the completion and operation in October of the first CCGT in Peru, adding installed capacity at year-end of 457 MW.
¾ Throughout 2006, work continued on schedule on the construction of the 377 MW San Isidro II CCGT and on the 32 MW Palmucho hydro facility, both in Chile.
¾ Centrales Hidroeléctricas de Aysén was incorporated, 51%-owned by ENDESA’s subsidiary, Endesa Chile, and 49% by Colbún. The purpose of this new company is to analyse, finance, build and operate the Aysén Project, which consists of four hydro plants with a total capacity of approximately 2,400 MW. Construction is currently scheduled to begin in 2008.
Cash return target for 2009: 35% completed
¾ Cash returns from ENDESA’s Latin American business to the parent company in 2006 totalled Euro 253 million.
¾ This, coupled with the Euro 308 million achieved in 2005, means that 35% of the strategic target for 2009 has now been achieved.
Rating upgrade for Enersis and Endesa Chile
¾ In May, rating agency Fitch upgraded its ratings for Enersis and Endesa Chile from BBB- to BBB, stable outlook, while in December, Moody’s upgraded its ratings from Ba1 to Baa3, also with a stable outlook. Also in December, Standard & Poor’s placed its BBB- ratings for both utilities under review for a possible upgrade.
¾ These upgrades mean that Enersis and Endesa Chile have recovered their rated investment status at all three rating agencies.
10
Debt reduction
¾ In 2006 net debt in the Latin American business declined by 8%, or Euro 491 million, to Euro 5,618 million by year-end.
Regulatory development: increase in Edesur’s tariffs enacted
¾ The Argentine Senate ratified the agreement signed between UNIREN and Edesur establishing the framework for a complete tariff overhaul. The presidential decree ratifying this agreement was enacted in December 2006 and entails, among other measures, a 38% increase the DCV (distribution cumulative value), to be applied retroactively from November 2005.
Optimisation of ownership structure
¾ Throughout 2006 significant progress was made on streamlining the organisational structure of the business in Latin America, thanks to the stake taken by IFC in the capital of Endesa Brasil, the merger and takeover of Etevensa by Edegel in Peru and the completion of the Chilectra - Elesur merger in Chile.
¾ In Colombia, the boards of Emgesa and Betania approved the merger of the two utilities. This merger, to be completed in 2007, will give rise to the largest generator in Colombia, with installed capacity of 2,789 MW.
DISPOSALS
¾ Pursuant to an agreement reached in December 2005, in 1Q06 ENDESA sold its 5.01% stake in telecoms operator Auna to Deutsche Bank. This deal, which generated net capital gains of Euro 171 million, marked full disposal of the Company’s telecom business - one of the main goals of the Strategic Plan.
¾ In May, ENDESA sold its 49% stake in the Portuguese company NQF Gas for Euro 59 million, booking a net capital gain of Euro 21 million.
¾ In the second quarter, the generation business of Brazilian company, Ampla - whose core business is the distribution and sale of electricity to over 2 million customers - was sold for Euro 39 million, generating a gross capital gain of Euro 30 million and a net capital gain after taxes and minorities of Euro 12 million.
¾ In the third quarter, ENDESA sold, through its subsidiary Bolonia Real Estate, assets on the so-called “Levante Sector” of Palma de Mallorca to the Neinver Group for Euro 240 million, generating a net capital gain of Euro 165 million.
SUSTAINABILITY
¾ In September 2006, ENDESA was rated the leading electric utility in Europe and the world for its commitment to sustainable development, according to the Dow Jones Sustainability World Index and Dow Jones Sustainability Stoxx Index, respectively.
11
¾ These indices, regarded as global benchmarks in the field of sustainability, select leading companies from across different industries that stand out for their commitment to making sustainable development one of the cornerstones of their business strategy.
¾ ENDESA has been selected for inclusion in these indices for the sixth year in a row. Some of the areas where ENDESA was most highly rated this year include codes of conduct, customer relations, environmental policy, climate change strategy, workplace health and safety, and social initiatives.
DIVIDENDS
¾ Total shareholder remuneration in 2006 against 2005 results amounted to Euro 2,541 million, equivalent to a gross dividend payment of Euro 2.4 per share, made up of the gross interim dividend of Euro 0.305 paid out on January 2, 2006 and the gross final dividend of Euro 2.095 per share paid out on July 3.
12
CONSOLIDATED RESULTS
13
2006 net income: Euro 2,969 million
ENDESA reported net income of Euro 2,969 million in 2006, 6.7% less than in 2005 due to the recognition in 4Q05 of capital gains of Euro 1,115 million from the sale of Auna.
Stripping out capital gains from asset sales from both years, 2006 net income was Euro 2,576 million, up 40% over 2005.
| 2006 NET INCOME | |||||||||||||
Euro million | % Chg vs. 2005 | % of NI 2006 | % of NI 2005 | ||||||||||
| Spain and Portugal | 1,843 | 35.7 | 62.1 | 42.7 | |||||||||
| Rest of Europe | 493 | 16.0 | 16.6 | 13.4 | |||||||||
| Latin America | 462 | 76.3 | 15.6 | 8.2 | |||||||||
| Other businesses (*) | 171 | (85.0 | ) | 5.7 | 35.7 | ||||||||
TOTAL | 2,969 | (6.7 | ) | 100.0 | 100.0 | ||||||||
(*) Corresponds in both years primarily to capital gains from disposal of Auna.
These results reflect ENDESA’s best estimate of the impact of Royal Decree Law 3/2006 based on information available at the 2006 close, specifically the provisions of the aforementioned legislation and the National Energy Commission’s (CNE) interpretation thereof.
These estimates were compiled based on analysis of the various scenarios arising from a reasonable interpretation of Royal Decree Law 3/2006. The positive or negative differences generated by each of the scenarios contemplated to the amounts recognised in the 2006 accounts are not material to the Group’s overall financial statements. The Ministry of Industry, Tourism and Trade has stated that the definitive amount of the revenue deficit from regulated activities will not be announced before June 2007; variations, if any, on the amounts booked in the 2006 accounts will be recognised in 2007.
Net income growth across all the Company’s electricity businesses.
The business in Spain and Portugal posted net income of Euro 1,843 million in 2006, an increase of 35.7% over 2005.
This includes Euro 186 million of higher compensation, net of tax, from the non-mainland generation deficit for the period 2001-2005 pursuant to the Ministerial Orders passed on March 30, 2006 and is Euro 137 million lower due to the impairment of deferred taxes as a result of lower corporate tax rates enacted in Spain for the coming years.
In Europe, net income advanced 16% to Euro 493 million. This figure includes Euro 118 million, net of minority interests, related to a write-up in the valuation of this business as Endesa Italia revalued the tax bases of its fixed assets to their book values, as allowed by current legislation in Italy.
Finally, net income for Latin America was Euro 462 million, 76.3% more than in 2005. This figure includes Euro 101 million, net of minority interests, from a tax credit obtained in Latin America as a result of the organisational restructurings undertaken in the region.
14

Total electricity sales significantly higher: +8.3%
Both electricity output (+0.6%) and electricity sales (+8.3%) rose in 2006 vs. 2005.
Increases were particularly high in European and Latin American businesses, where output rose by 5.4% and 7.1%, respectively, offsetting the 5.1% drop in output in Spain.
Total electricity sales the Spanish and Portuguese, European and Latin American businesses rose by 8.5%, 11.4% and 5.5%, respectively.
ELECTRICITY OUTPUT AND SALES IN 2006 | |||||||||||||
| Output | Sales | ||||||||||||
| GWh | % Chg vs. 2005 | GWh | % Chg vs. 2005 | ||||||||||
| Spain and Portugal | 88,808 | (5.1 | ) | 109,412 | 8.5 | ||||||||
| Rest of Europe | 35,575 | 5.4 | 52,606 | 11.4 | |||||||||
| Latin America | 62,028 | 7.1 | 58,281 | 5.5 | |||||||||
TOTAL | 186,411 | 0.6 | 220,299 | 8.3 | |||||||||
Appropriate output/sales balance
ENDESA met 84.6% of its total electricity sales in 2006 from its own output.
This balanced situation between production and demand should considerably mitigate the risk of its electricity business and provides ENDESA with a significant competitive advantage.
15
 |  |
Gross profit: up 14.3%
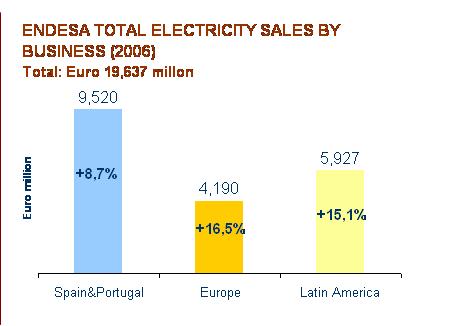
The Company’s total revenues in 2006 amounted to Euro 19,637 million, an increase of 12.2% on the year before, outstripping growth in physical electricity sales.
Sales growth was greater by value than by volume because of increases in electricity prices in countries where the Company operates due to higher power generation costs.
16
The growth in revenues in 2006 offset the 11.5% increase in purchases and service expenses (variable costs), which was caused by increases in fuel costs and energy purchases.
Gross profit was Euro 10,434 million in 2006, an increase of 14.3% over 2005.
Strong growth in EBITDA (+18.6%) and EBIT (+23.4%)
While revenues and purchases and service expenses rose significantly, personnel expenses and fixed operating expenses increased by just 3.9% and 8.8%, respectively, driving EBITDA to Euro 7,139 million, 18.6% higher than in 2005. With depreciation and amortisation rising just 7% due to the Company’s investment policy, EBIT advanced to Euro 5,239 million, up 23.4%.
Gross profit | EBITDA | EBIT | |||||||||||||||||
| Euro million | % Chg vs. 2005 | Euro million | % Chg vs. 2005 | Euro million | % Chg vs. 2005 | ||||||||||||||
| Spain and Portugal | 5,859 | 12.6 | 3,835 | 17.4 | 2,705 | 19.5 | |||||||||||||
| Rest of Europe | 1,466 | 19.9 | 1,116 | 25.8 | 846 | 36.9 | |||||||||||||
| Latin America | 3,109 | 15.2 | 2,188 | 16.5 | 1,688 | 22.7 | |||||||||||||
TOTAL | 10,434 | 14.3 | 7,139 | 18.6 | 5,239 | 23.4 | |||||||||||||

Net financial expenses: 22.9% lower
ENDESA reported net financial losses of Euro 939 million in 2006, a 25% improvement on 2005.
Net interest expense totalled Euro 969 million, 22.9% lower than in 2005. This figure includes revenue of Euro 54 million due to the utilisation of higher interest rates to discount provisions. In 2005 the discounting of provisions gave rise to financial expense of Euro 111 million.
17
The increase in net debt caused by financing the revenue deficit on regulated activities in Spain does not impact net financial expenses. Both the cumulative amount of the deficit financed and the amounts pending collection as compensation for the non-mainland generation deficit earn interest that offset the expenses.
Asset disposals
1Q06 marked the end of the period for Auna shareholders to exercise their pre-emptive rights on the 5.01% stake ENDESA sold to Deutsche Bank on December 30, 2005.
After the end of this period, the sale of these shares was formalised and all the conditions required under International Financial Reporting Standards (IFRS) regarding the derecognition of the shares from ENDESA’s balance sheet and the recognition of the related capital gain in its income statement have been met.
Therefore, as indicated in ENDESA’s consolidated financial statements for the year ended December 31, 2005, in 2006 the Company recorded a capital of Euro 196 million (Euro 171 million after tax) for the sale of the aforementioned investment. With this disposal, the “Other businesses” line has been removed from ENDESA’s accounts, so that in 2006 this capital gain is the only entry under this caption.
In addition, in 2Q06, ENDESA sold its 49% holding in NQF Gas for Euro 59 million, booking a capital gain of Euro 27 million (Euro 21 million net of taxes) and sold off the generation assets of Brazilian operator, Ampla, for Euro 39 million, recording a gain of Euro 30 million (Euro 12 million after taxes and minorities).
Finally, in 3Q06, and as part of ENDESA’s strategic goal of maximising value of its real estate assets, the Company, through its subsidiary Bolonia Real Estate, sold assets through a competitive process in the so-called “Levante Sector” of Palma de Mallorca to the Neinver Group. The assets sold include planning rights for approximately 180,000m2.
In addition, the Company made a financial investment in the Neiver Group company which will head up the land’s development, taking a 45% stake. The sole purpose of this investment is to participate, based on its percentage ownership, in potential additional capital gains that could arise from the future development of the land in question. ENDESA will not participate in the management of this company and its investment risk is limited to the amount of capital contributed.
The total deal size is Euro 240 million, generating a gross capital gain of Euro 185 million (Euro 165 million after-tax), net of the costs of transferring the electric facilities that were located on the land and the cost of the 45% equity stake taken in the development company.
Finally, in 4Q06, ENDESA awarded BNP Paribas and Banesto the mandate to securitise its receivable in relation to the 2005 revenue deficit from regulated activities in Spain. The amount monetised, Euro 1,676 million, is subject to modification as a result of potential changes to certain variables used to determine the settlement of this receivable vis-à-vis the assumptions used by the Company. Since the Company’s analysis revealed that it has transferred substantially all the risks and benefits associated with the ownership of the collection rights on the 2005 revenue shortfall from regulated activities, it has accordingly derecognised the aforementioned asset from the consolidated balance sheet.
18
Cash flow from operating activities: +10.3%
Cash flow from operating activities in 2006 amounted to Euro 4,643 million, up 10.3% on 2005.
CASH FLOW FROM OPERATING ACTIVITIES | |||||||
| Euro million | % Chg vs. 2005 | ||||||
| Spain and Portugal | 2,721 | 2.0 | |||||
| Rest of Europe | 704 | 20.1 | |||||
| Latin America | 1,218 | 3.2 | |||||
TOTAL | 4,643 | 10.3 | |||||
Investment: Euro 4,336 million
ENDESA invested a total of Euro 4,336 million in 2006. Of this figure, Euro 3,897 million was capex and the remaining Euro 439 million was invested in financial investments.
INVESTMENTS | ||||||||||
| Euro million | ||||||||||
| Capex and intangible assets | Financial | TOTAL | ||||||||
Spain and Portugal (1) | 2,730 | 191 | 2,921 | |||||||
| Rest of Europe | 277 | 186 | 463 | |||||||
| Latin America | 890 | 62 | 952 | |||||||
TOTAL | 3,897 | 439 | 4,336 | |||||||
(1) In addition, the Company booked a financial investment of Euro 1,341 million for the revenue deficit from regulated activities in 2006.
Debt performance
ENDESA’s net debt was Euro 19,840 million at year-end 2006, 8.5% higher than at year-end 2005.
BREAKDOWN BY BUSINESS LINE OF ENDESA’S NET DEBT | |||||||||||||
Euro million | |||||||||||||
31/12/06 | 31/12/05 | Change | % Chg | ||||||||||
| Business in Spain and Portugal | 12,548 | 11,461 | 1,087 | 9.5 | |||||||||
| Business in Europe | 1,674 | 1,286 | 388 | 30.2 | |||||||||
| -Endesa Italia | 748 | 815 | (67 | ) | (8.2 | ) | |||||||
| -Other | 926 | 471 | 455 | 96.6 | |||||||||
| Business in Latin America | 5,618 | 6,109 | (491 | ) | (8.0 | ) | |||||||
| -Enersis Group | 4,749 | 5,207 | (458 | ) | (8.8 | ) | |||||||
| -Other | 869 | 902 | (33 | ) | (3.7 | ) | |||||||
| Other businesses (1) | -- | (575 | ) | 575 | NA | ||||||||
TOTAL | 19,840 | 18,281 | 1,559 | 8.5 | |||||||||
(1) At December 31, 2006, there was no debt assigned to “Other businesses” as this business line disappeared as such with the sale of the 5.01% stake in Auna completed in February 2006. The remaining debt balance was included in the electricity business in Spain and Portugal.
The increase in net debt in Spain and Portugal is due to the Euro 609 million increase in receivables related to the tariff deficit on regulated activities in 2006 and the non-mainland generation deficit. It also reflects the Euro 1,341 million dividend payment made in July in connection with the capital gains realised in 2005 and which led to a debt reduction in that year. The distribution of this income to its shareholders was approved by ENDESA’s shareholders in general meeting.
In Europe, the Euro 388 million increase in debt was caused by the extraordinary corporate income tax payment the Company had to make in 2006 in order to take advantage of tax credits generated by the increase in the tax basis of the business’ assets and to fund acquisitions made during the year which entailed the assumption of debt.
19
In Latin America, debt was reduced by Euro 491 million in 2006 due for the most part to the performance of the euro relative to the currencies in which the debt is denominated.
When assessing ENDESA’s debt level, it must be remembered that at December 31, 2006, ENDESA had the recognised right to collect Euro 2,789 million in connection with several regulatory matters: Euro 1,341 million for financing the revenue deficit from regulated activities, Euro 1,438 million in compensation for the non-mainland generation deficit and Euro 10 million of stranded costs in Italy. Stripping out these regulatory items, ENDESA’s net debt at year-end 2006 was Euro 17,051 million.
The average cost of ENDESA’s total debt was 5.45% in 2006, while the cost of the debt corresponding to the ENERSIS Group was 9.12%. Stripping out Enersis Group debt, the average cost of ENDESA’s debt was 4.19%.
STRUCTURE OF ENDESA’S NET DEBT | |||||||||||||||||||
ENDESA and direct subsidiaries | Enersis Group | Total ENDESA Group | |||||||||||||||||
| Euro million | % of total | Euro million | % of total | Euro million | % of total | ||||||||||||||
| Euro | 15,029 | 100 | -- | -- | 15,029 | 76 | |||||||||||||
| Dollar | 62 | -- | 2,194 | 46 | 2,256 | 11 | |||||||||||||
| Other currencies | -- | -- | 2,555 | 54 | 2,555 | 13 | |||||||||||||
Total | 15,091 | 100 | 4,749 | 100 | 19,840 | 100 | |||||||||||||
| Fixed rate | 7,397 | 49 | 3,588 | 76 | 10,985 | 55 | |||||||||||||
| Hedged | 1,720 | 11 | 249 | 5 | 1,969 | 10 | |||||||||||||
| Floating | 5,974 | 40 | 912 | 19 | 6,886 | 35 | |||||||||||||
TOTAL | 15,091 | 100 | 4,749 | 100 | 19,840 | 100 | |||||||||||||
| Avg. life (years) | 5.2 | 5.2 | 5.2 | ||||||||||||||||
The average life of the ENDESA Group’s debt at December 31, 2006 was 5.2 years.
ENDESA enjoys a high degree of protection against interest-rate risk, since 65% of its total debt is either fixed-rate or hedged. Stripping out pending regulatory assets in Spain, which carry floating-rate interest, this percentage rises to 76%.
At year-end 2006, ENDESA in Spain and its direct subsidiaries, excluding the Enersis Group, had liquidity of Euro 6,197 million, of which Euro 5,854 million corresponded to unconditional undrawn credit lines. These balances are sufficient to cover the debt falling due over the next 20 months. In addition, the Enersis Group had liquidity of Euro 1,218 million, of which Euro 596 million corresponded to unconditional undrawn credit lines from syndicated loans. This liquidity covers debt maturities for the next 22 months.
ENDESA’s financial leverage stood at 124.5% at December 31, 2006, comfortably ahead of the strategic target of keeping leverage below 140%.
20
As a result of Gas Natural’s takeover bid for ENDESA launched in September 2005, the ratings agencies Standard & Poor’s and Fitch Ratings decided to place ENDESA’s rating on creditwatch, while Moody’s changed its rating outlook from stable to negative. In all three cases, the changes were due to the negative impact the transaction would have, were it to go ahead, on the new company’s financial position.
Today, although Gas Natural withdrew its takeover bid on 1 February 2007, the rating agencies have not modified ENDESA’s ratings in anticipation of the resolution of E.ON’s ongoing takeover bid. As of February 22, 2007, ENDESA’s long-term debt ratings are: Standard & Poor’s, A, under review for a possible downgrade; Moody’s, A3, negative outlook, and Fitch, A+, under review for a possible downgrade.
21
PROGRESS ON STRATEGIC TARGETS
22
Actual results in line with preliminary figures communicated to the market in January 2007
ENDESA’s full-year 2006 results are in line with preliminary estimates presented to the market on 24 January, 2007:
| § | ENDESA recorded 2006 net income of Euro 2,969 million compared to the estimated Euro 2,950 million presented to the market in January. |
| o | As communicated in January, 2006 net income was strongly underpinned by ordinary net income of Euro 2,576 million, Euro 19 million above the preliminary figure disclosed. |
| § | Definitive EBITDA was Euro 7,139 million vs. the Euro 7,140 million announced last January. |
| § | Actual EBITDA was in line with preliminary estimates across each of the businesses. |
| o | Business in Spain and Portugal posted 2006 EBITDA of Euro 3,835 million, compared to the preliminary estimate of Euro 3,834 million. |
| o | EBITDA in the European business was Euro 1,116 million vs. the Euro 1,117 million announced last January. |
| o | EBITDA in the Latin American business reached Euro 2,188 million, compared to the preliminary 2006 estimate of Euro 2,189. |
The 2006 results confirm that the Company surpassed its strategic targets
As anticipated in the preliminary earnings presentation on January 2007, the definitive 2006 results confirm that ENDESA exceeded the strategic targets set for the year and position the Company’s businesses optimally for the coming years.
At Euro 7,139 million, EBITDA was Euro 209 million ahead of the most recent EBITDA guidance provided by the Company.
This outperformance was uniform across the Company’s businesses:
| § | EBITDA in the business in Spain and Portugal (Euro 3,835 million) came in Euro 85 million ahead of the Company’s 2006 target. |
| § | EBITDA in the European business was Euro 1,116 million, Euro 16 million ahead of the most recent guidance. |
| § | At Euro 2,188 million, EBITDA in the Latin American business was Euro 108 million higher than most recent 2006 target communicated to the market. |
Finally, leverage stood at 124.5% at December 31, comfortably below the strategic target of keeping leverage below 140%.
23
Excellent business outlook in the wake of 2006 results
Building on the 2006 results and the outlook for their respective markets, the Company’s businesses are optimally positioned to achieve excellent results in the years to come.
2009 estimated EBITDA will amount to Euro 8,500 million, equivalent in a comparable basis to a compound average annual growth of 8% in 2006-09.
In Spain and Portugal, continued rollout of the New Capacity Plan, the recently announced regulatory developments affecting the distribution business and the operation of the wholesale markets and the additional improvement for the Efficiency Plan lead to an EBITDA target for 2009 of Euro 4,630 million, equivalent to a compound average annual growth in 2006-2009 of 7%.
In Europe, the Italian business will be driven by new CCGT and renewable energy capacity, access to natural gas supply at attractive prices and self-supply of green certificates. Meanwhile in France, new CCGTs and renewable facilities will also be added to installed capacity and the supply portfolio will be more balanced. These capacity related initiatives could be topped up by activities in new markets, all of which could drive estimated EBITDA in 2009 towards Euro 1,400 million, compound annual growth of 8% between 2006 and 2009.
Finally, the next three years in the Latin American business will be marked by completion of the generation facilities currently under construction, which entail a significant increase in capacity, notably in Chile, an estimated increase in the number of customers of 1.3 million and the beneficial effects of regulatory trends, especially in Argentina. Based on these prospects, EBITDA in Latin America is expected to reach Euro 2,470 million in 2009, compound average annual growth of 4% in 2006-2009.
24
RESULTS BY BUSINESS LINE
25
BUSINESS IN SPAIN AND PORTUGAL
Net income up 35.7% to Euro 1,843 million
Net income from this business was Euro 1,843 million in 2006, an increase of 35.7% on 2005 and equivalent to 62.1% to the Company’s overall bottom line.
EBITDA rose 17.4% to Euro 3,835 million and EBIT by 19.5% to Euro 2,705 million.
These outstanding results are underpinned by active business management with the goal of leveraging the Company’s solid fundamentals and competitive advantages in an environment marked in 2006 by significant regulatory change.
In terms of operating management, we highlight the maintenance of an appropriate balance between output and sales, the enhanced generation mix in the mainland, high load factors at its thermal facilities compared to its peers, the slowdown in fuel price increases, progress on the New Capacity Plan, record supply quality levels, ongoing supply activities to hedge against trends in wholesale prices and an active presence in the CDM market, which has yielded enough emission rights certificates to meet its commitments on emission reductions in Spain and the rest of Europe.
On the regulatory front, the negative after-tax impact on 2006 figures of recognising the impact of Royal Decree Law 3/2006 was Euro 224 million.
The same Royal Decree Law provides that a definitive price will be set based on objective and transparent market criteria. According to these criteria the final price applied by the Spanish government to settle electricity sold to regulated customers in areas where ENDESA acts as a distributor should be significantly higher than the provisional price of Euro 42.35/MWh. The positive impact, if any, arising from a higher definitive settlement price will be recognised in the 2007 annual accounts.
The mechanism for deducting remuneration from regulated generation by the value of greenhouse gas emissions provided for in Royal Decree Law 3/2006 is also pending development by the government. The 2006 accounts recognise a Euro 121 million deduction in this connection based on ENDESA’s best estimate at the close of the accounts, taking into consideration the provisions of the aforementioned Royal Decree Law and the CNE’s interpretation thereof.
In 2006, ENDESA recorded under revenues the amount corresponding to compensation for the non-mainland generation historical deficit calculated in accordance with the Ministerial Orders passed on March 30, 2006, which was above the amounts booked at March 31, 2006. This concept amounted to Euro 227 million and was booked as sales. The effect of these amounts on ENDESA’s net income is Euro 186 million.
Finally, it is worth highlighting that the results for the business in Spain and Portugal reflect ENDESA’s best estimate of the impact of Royal Decree Law 3/2006 based on information available at the balance sheet close, specifically the provisions of the aforementioned legislation and the CNE’s interpretation thereof.
26
These estimates were compiled based on analysis of various scenarios arising from a reasonable interpretation of Royal Decree Law 3/2006. The positive or negative differences generated by each of the scenarios contemplated to the amounts recognised in the 2006 accounts are in no instance material to the Group’s overall financial statements. The Ministry of Industry, Tourism and Trade has stated that the definitive amount of the revenue deficit from regulated activities will not be announced before June 2007; variations, if any, on the amounts booked in 2006 will be recognised in 2007.
Key operating highlights
Spain’s leading electric utility
Throughout 2006 ENDESA maintained its leading position in the Spanish electricity market, with a 33.9% market share in ordinary regime electricity generation, 43.1% in electricity distributed, 55.6% in sales to deregulated customers and 43.6% in total sales to end customers.
Competitive advantages in generation relative to peers
In Spain, the Company produced a total of 88,808 GWh in 2006, compared to total demand of 109,412 GWh. This means it met 81.2% of its demand from its own output.
In addition, nuclear and hydro powered energy represented 44.5% of the Company’s generation mix, compared to 36% for the rest of the sector. Furthermore, at 79%, the load factor at its thermal facilities was also higher than at its competitors (61%). The load factor at the Company’s coal plants was a noteworthy 75.6%.
All this on top of a positive trend in ENDESA’s mainland fuel costs, which fell 4% year-over-year, compared to an estimated average 6,1% increase for the rest of the sector.
1,187 MW of new installed capacity in 2006
ENDESA added 1,187 MW of new capacity to its generation facilities in 2006, marking significant progress on the New Capacity Plan.
The breakdown of this new capacity is as follows:
| o | Completion and connection to the network of the 400 MW Cristóbal Colón CCGT in Huelva. When the CCGT begins commercial operations it will replace the capacity of the plant’s existing fuel and fuel-oil/gas groups. |
| o | New installed capacity on the island and non-mainland systems of 512 MW, in line with growing demand in these markets. |
| o | 275 MW in renewables/CHP. |
Construction of the 800MW CCGT at the As Pontes site in La Coruña continued on schedule. At the same facility, the conversion of group 3 (367 MW of installed capacity) to imported coal was completed in December. In addition, the Company signed an agreement with Hunosa for the incorporation of a company to build and operate a 400 MW CCGT at Mieres (Asturias).
27
Also ENDESA signed a collaboration agreement with Isofotón, producer of photovoltaic panels, with the aim of ensuring that ENDESA has access to the equipment required to develop 100MW of solar powered facilities that the Company plans to install over the coming years. The agreement additionally contemplates the participation of both companies with the regional government of Andalusia in a polysilicone plant, the seventh in the world, which will guarantee supply of this raw material for the manufacture of photovoltaic modules.
In October 2006, the Eólicas de Portugal consortium - in which Endesa has a 30% stake - was awarded the project to develop 1,200 MW of wind capacity, the largest in the Portuguese wind tender. The Eólicas de Portugal project entails investment of over Euro 1,500 million between 2006 and 2011 and the instalment of 48 wind farms with capacity of between 20 and 25 MW at a broad range of sites throughout Portugal as well as the creation of more than 1,800 new jobs.
Finally, ENDESA, together with International Power, has been awarded a connection point for two 400MW CCGTs at the Tejo site. The operating license should be awarded during this year.
Market performance: all-time record in supply quality and value unlocked at the supply business
As already mentioned, in 2006 ENDESA’s total demand in Spain, measured by sales, was 109,412 GWh. This represents an 8.5% increase on 2005, compared to an average increase of 2.4% for the overall Spanish electricity sector.
The number of customers serviced by ENDESA in the regulated market stood at 11,216,518 million at year-end, 2006, i.e., 250,218 more than at the beginning of the period.
In 2006, the cumulative interruption index (SAIDI) in ENDESA’s markets was 1 hour and 55 minutes, an improvement of 30% vs. 2005, marking excellent supply continuity levels in all markets served by the Company in Spain.
This result marks a record high in the continuity of supply by ENDESA in Spain, reflecting the success of significant investments made in distribution facilities in recent years and the efficiency enhancements implemented, also in the distribution business, within the framework of its Quality Plan.
In the deregulated market, ENDESA ended December with 1,077,806 customers, 8% more than the year earlier. The Company’s position in this market provides a hedge against the volatility of pool prices and other regulatory and market risks, as well as providing the generation business with a reasonable and guaranteed return over the medium and long term.
Carbon credit purchases
ENDESA presently boasts a broad portfolio of carbon credits derived from its Clean Development Mechanisms (CDM). Specifically, it has signed Emissions Reduction Purchase Agreements (ERPA) for a total of 86 million tonnes of CO2 and Letters of Intent (LOI) for 24 million tonnes of additional volume.
The emission rights acquired under these agreements will permit ENDESA to meet to its CO2 emission reduction commitments for its operations in Spain, Portugal, France and Italy required by the Directive on Emissions Trading.
28
With these, ENDESA is still the leading private purchaser of carbon credits via the “Endesa Climate Initiative”, a pioneering program in this arena through which it has obtained contracts representing approximately 7% of the total ERCs (emission rights certificates) corresponding to all the projects currently registered with the UN.
NAP 2008-2012: compatible with ENDESA’s competitive generation portfolio
On July 12, 2006, the government unveiled the details of its proposed 2008-2012 National Allocation Plan for emission rights. ENDESA believes that its allocation, together with its portfolio of carbon credits, guarantees that the Company’s generation assets will operate on a fully efficient and competitive basis and furthermore is fully compatible with the targets contained in its Strategic Plan.
We would highlight that:
| · | In terms of allocation of rights to coal plants, preference is granted, in accordance with the provisions of the National Mining Plan, to those using Spanish coal and plants that have made technological modifications to comply with the Community Directive on Large Combustion Plants (desulphurisation scrapers, conversion to imported coal, etc.), which means that all of ENDESA’s coal plants would be applicable for this criteria. |
| · | In relation to thermal plants in the island and non-mainland systems, the incremental costs that could arise from an emission rights deficit would be fully recognised for purposes of remuneration of generation activities, pursuant to the provisions of Royal Decree 1,747/2003 and the Ministerial Orders dated March 30, 2006. |
Regulatory update for 2006
Real Decree Law 3/2006
Royal Decree Law 3/2006, enacted towards the end of February of last year, entailed material changes that have affected power generation revenues in the period.
| · | Since March 3, 2006, sales to the wholesale generation market that match purchases by a distributor belonging to the same group for sale to the regulated market are settled at the provisional price of Euro 42.35/MWh. ENDESA’s accounts since that date have been drawn up based on this price. However, the Royal Decree Law stipulates that the government will set the definitive price based on objective and transparent market prices. |
| · | The amount finally recognised for each business group for financing the deficit in regulated revenues in 2006 will be deducted by the value of the CO2 emission rights received free of charge during the period from January 1 and March 2, 2006 - Euro 121 million in the case of ENDESA. |
| · | Since March 3, 2006, revenues from power sales on the OMEL organised market at the established price for the market are reduced by the value of the freely allocated emission rights related to those revenues. |
29
The tariff deficit
The increase in electricity tariffs implemented in 2006, the measures enacted by Royal Decree Law 3/2006 to reduce the deficit in revenues from regulated revenues and the reduction in the amount allocated to the nuclear moratorium were not sufficient to ensure that the system’s regulated revenues cover system costs in 2006 in their entirety, particularly generation costs. This led to a deficit in revenues from regulated activities, estimated at Euro 3,311 million, of which Euro 1,462 million corresponds to ENDESA.
Pursuant to the provisions of Royal Decree 1634/2006 of December 29, setting the 2007 tariff, ENDESA is entitled to recover its entire portion of the tariff deficit, net of Euro 121 million corresponding to the valuation of the CO2 emission rights allocated to ENDESA free of charge in the first two months of the year. Accordingly, the remaining Euro 1,341 million has been booked as a financial investment.
Completion of the regulatory framework for non-mainland systems
On March 30, 2006 the Ministry of Industry, Tourism and Trade approved the Ministerial Orders which fully develop Royal Decree 1747/2003 governing Spain’s island and non-mainland systems. These orders establish the methodology for calculating regulated remuneration on generation in these systems and, accordingly, the compensation to be received by the utilities operating in them.
Application of the orders gives rise to nominal compensation to ENDESA in excess of the provisional amounts recognised between 2001 and 2005 of Euro 227 million.
With the regulatory framework in place, island and non-mainland generation business is guaranteed sufficient revenues going forward to meet costs of the business and allow for appropriate fuel price hedges, while ensuring a reasonable return.
Elimination of Competition Transition Costs (CTCs)
On June 23, the Spanish cabinet passed Royal Decree Law 7/2006, adopting emergency measures for the energy sector. Among other measures, this law repealed the sixth transitory provision of the Electricity Industry Law 54/1997, of November 27, regarding stranded costs (CTCs), thereby eliminating them.
The elimination of the CTC mechanism has no impact whatsoever on ENDESA’s financial statements, as the Company has no future CTCs pending recovery, nor does it expect any future collections as, under current circumstances, the estimated amounts will be recovered through the market.
In addition, the Royal Decree Law empowers the government to set premiums on domestic coal consumption outside the framework of the CTCs, so their elimination also does not affect future collection of these premiums by ENDESA.
Sharp growth in sales: +8.7%
Revenues in the electricity business in Spain and Portugal totalled Euro 10,090 million in 2006, up 8.8% on 2005. Of this amount, sales accounted for Euro 9,520 million, 8.7% higher than in 2005.
30
Growth was primarily due to increase in demand, the rise in final prices and volume sales to deregulated customers, to higher pool prices in January and February, i.e. before Royal Decree Law 3/2006 came into effect, and to the application of the Ministerial Orders regulating the calculation of remuneration for island and non-mainland generation.
SPAIN AND PORTUGAL SALES | |||||||||||||
| Euro million | |||||||||||||
| 2006 | 2005 | Change | % Chg | ||||||||||
| Mainland generation under Ordinary Regime | |||||||||||||
Sales to deregulated customers | 1,789 | 1,487 | 302 | 20.3 | |||||||||
Other sales in the OMEL | 2,360 | 3,012 | (652 | ) | (21.6 | ) | |||||||
| Renewable/CHP generation | 256 | 240 | 16 | 6.7 | |||||||||
| Regulated revenues from distribution | 1,784 | 1,602 | 182 | 11.4 | |||||||||
| Non-mainland generation and supply* | 2,098 | 1,548 | 550 | 35.5 | |||||||||
| Supply to deregulated customers outside Spain | 299 | 220 | 79 | 35.9 | |||||||||
| Regulated revenues from gas distribution | 46 | 39 | 7 | 17.9 | |||||||||
| Unregulated gas supply | 647 | 326 | 321 | 98.5 | |||||||||
| Other sales and services rendered | 241 | 287 | (46 | ) | (16.0 | ) | |||||||
TOTAL | 9,520 | 8,761 | 759 | 8.7 | |||||||||
* The figure for 2006 includes Euro 227 million corresponding to compensation for the non-mainland generation deficit calculated in accordance with the Ministerial Orders passed on March 30, 2006, which was above the amounts recorded at December 31, 2005.
Mainland generation
ENDESA’s mainland electricity output totalled 74,347 GWh in 2006, 3.5% less than in 2005.
Of this amount, 71,871 GWh corresponded to electricity generated under the ordinary regime (-7.5%) and 2,476 GWh under renewables/CHP (+16.8%).
The fall in ordinary regime generation was mostly due to higher hydro output by the system as a whole, to scheduled maintenance downtime at several thermal groups and ENDESA’s prioritisation of margins over market share.
BREAKDOWN OF GENERATION SALES | ||||
GWh | ||||
| Sales to supply through bilateral contracts | 33,350 | |||
| Sales to distribution from March 3, 2006 (Euro 42.35/MWh) | 19,407 | |||
| Sales at pool price | 19,114 | |||
TOTAL | 71,871 | |||
31
Sales to the ordinary regime totalled Euro 4,149 million in 2006, Euro 350 million or 7.8% lower than the year before.
This amount includes sales made after March 3 to Endesa Distribución to supply regulated companies in ENDESA’s distribution territories, which were recognised at a provisional price of Euro 42.35/MWh in accordance with Royal Decree Law 3/2006.
This provisional price is below the average pool price in 2006 which was Euro 64.83/MWh, 3.2% above that of 2005.
As indicated above, ENDESA has recognised sales made to supply regulated companies in ENDESA’s distribution territories in its 2006 annual accounts at a provisional price of Euro 42.35/MWh in accordance with Royal Decree Law 3/2006. It is worth reiterating that the same Royal Decree Law establishes that this price will be updated and settled based on objective and transparent market prices.
Since market prices last year were above Euro 42.35/MWh, ENDESA is due an additional receivable that has not been recognised in its 2006 annual accounts as it is a contingent asset subject to legal establishment of the definitive price, the remuneration from which, if any, will be recognised in the 2007 accounts.
The negative before-tax impact on 2006 figures from selling the 19,407 GWh produced between March and December, i.e. the electricity sold to regulated customers in the markets where ENDESA acts as a distributor, at the provisional price of Euro 42.35/MWh, pursuant to the Royal Decree Law 3/2006, was Euro 224 million.
Moreover, also in accordance with Royal Decree Law 3/2006, the aforementioned revenue figure was reduced by Euro 121 million, the amount that ENDESA estimates will be deducted from the revenue deficit from regulated activities in connection with the CO2 emission rights allocated free of charge.
32
ENDESA renewable/CHP generation: +16.8%
Renewable and CHP generation companies fully consolidated by ENDESA produced 2,476 GWh in 2006, 16.8% more than in 2005. In addition, ENDESA has holdings in other renewable/CHP companies, which generated 3,742 GWh in the same period.
Revenues from sales of renewable/CHP energy generated by consolidated companies totalled Euro 256 million, 6.7% more than in 2005. This underpinned a 19.7% increase in EBITDA to Euro 176 million and a 15% increase in EBIT to Euro 115 million.
Supply to deregulated customers
In the supply to deregulated customers business, in a departure from the decisions taken by other operators to exit this segment in light of high pool prices and related regulatory updates, ENDESA has opted to pursue a selective supply strategy.
This strategy, which targets higher value added customers, enables ENDESA to leverage the advantages of its vertical integration in generation-supply and its highly competitive generation mix, providing the Company with an appropriate hedge against regulatory risk and volatility in wholesale market prices. This policy will allow ENDESA to achieve reasonable, guaranteed returns over the medium and long run from the generation business, thus maximising shareholder returns.
This selective supply policy drove a 14.9% increase in the average selling price to final customers in the deregulated market in 2006 vs. 2005.
ENDESA had 1,077,806 deregulated customers at December 31, 2006, of which 1,012,751 corresponded to the Spanish mainland deregulated market, 61,255 to the non-mainland systems and 3,800 to other European deregulated markets.
ENDESA’s sales to these customers totalled 37,813 GWh in 2006, 2.8% more than in 2005. Of this amount, 33,534 GWh were sold on the Spanish deregulated market, an increase of 3.1%, and 4,279 GWh on other deregulated European markets, up 1.0%.
Revenues from supply to deregulated customers in Spain (excluding tolls paid to Endesa Distribución), totalled Euro 1,926 million, a 20% increase on 2005. Of this amount, Euro 1,789 million corresponded to the mainland deregulated market and Euro 137 million to the non-mainland market.
Revenues from supply to deregulated European markets other than Spain rose 35.9% to Euro 299 million.
As for customer service, ENDESA’s retention rate for customers switching to the deregulated market was 101.9%, which means that the Company is generating net new customers. By this measure, ENDESA is outperforming all its competitors, reflecting the high degree of loyalty towards the Company.
Distribution
ENDESA distributed 115,063 GWh of electricity in the Spanish market in 2006, 2.9% more than the previous year.
33
Revenues from regulated distribution activities totalled Euro 1,784 million, up 11.4% on 2005. This included Euro 43 million in settlements from prior years, mostly from incentives for energy losses. Stripping out this effect, revenues from regulated distribution activities would have increased by 8.7%.
ENDESA supplied 71,599 GWh to customers on the regulated Spanish market in the period, 11.7% more than in 2005.
Non-mainland generation
ENDESA’s output in non-peninsular systems rose 4.7% in 2006 vs. 2005 to 14,461 GWh. Sales were 35.5% higher, at Euro 2,098 million.
As indicated previously, these sales include Euro 227 million of additional compensation above that recorded at December 31, 2005 for deficits in the non-mainland systems in 2001-2005 as recognised in the Ministerial Orders of March 30.
Gas distribution and supply: total market share of 11.6%
ENDESA sold a total of 27,479 GWh of natural gas in Spain 2006, 21.6% more than in 2005. Of this amount, 23,697 GWh were sold to customers in the deregulated market, 27.7% more than in 2005, and 3,782 GWh to regulated customers through all the gas companies in Spain in which ENDESA has stakes, an increase of 6.3% on the year before.
The 27,479 GWh sold in both the regulated and deregulated markets and the amount consumed in ENDESA’s own generation plants imply an 11.6% market share.
Revenues from gas sales in the deregulated market rose 98.5% to Euro 647 million in 2006 vs. 2005. Revenues from regulated gas distribution totalled Euro 46 million, up 17.9% on 2005. The two businesses contributed a combined gross profit of Euro 150 million.
Other operating revenues
Other operating revenues in 2006 came to Euro 570 million, Euro 57 million more than in 2005.
This item includes Euro 254 million corresponding to the portion of CO2 emission rights allocated to ENDESA in 2006 within the scope of the Spanish National Allocation Plan for emissions, which are recorded under revenues.
This figure is Euro 83 million lower than in 2005, mostly because the rights received in 2006 were recognised at a lower value than those allocated in 2005. Lower revenue is offset by lower expense recorded for the use of the emission rights.
34
Operating expenses
The breakdown of operating expenses in the Spanish and Portuguese business in 2006 is provided below:
OPERATING EXPENSE IN SPAIN AND PORTUGAL | |||||||||||||
| Euro million | |||||||||||||
| 2006 | 2005 | Change | % Chg | ||||||||||
| Purchases and services | 4,231 | 4,072 | 159 | 3.9 | |||||||||
Power purchases | 995 | 875 | 120 | 13.7 | |||||||||
Fuel consumption | 2,143 | 2,057 | 86 | 4.2 | |||||||||
Power transmission expenses | 365 | 273 | 92 | 33.7 | |||||||||
Other supplies and services | 728 | 867 | (139 | ) | (16.0 | ) | |||||||
| Personnel expenses | 1,062 | 1,041 | 21 | 2.0 | |||||||||
| Other operating expenses | 1,124 | 1,034 | 90 | 8.7 | |||||||||
| Depreciation and amortisation | 1,130 | 1,002 | 128 | 12.8 | |||||||||
TOTAL | 7,547 | 7,149 | 398 | 5.6 | |||||||||
Power purchases
Power purchases in the period rose 13.7% to Euro 995 million. These mainly entail gas purchases to supply deregulated customers, which rose as a result of increases in sales to these customers and in gas prices.
Fuel consumption
Fuel consumption amounted to Euro 2,143 million in 2006, an increase of 4.2% on 2005.
This increase is due to the generalised increase in raw materials prices on international markets. These higher costs, however, were offset by the Company’s proactive fuel procurement policy, which resulted in below-market purchasing prices.
Compared to the estimated 6.1% increase in fuel costs at the rest of the utilities in the mainland system, ENDESA's fell by 4%. This has considerably strengthened the Company’s competitive position with respect to price and generation mix.
Other supplies and services
Expenses under this item totalled Euro 728 million in 2006, Euro 139 million more than in 2005.
This increase reflects the recognition of Euro 301 million of expenses in connection with rights acquired to cover the CO2 emissions made in 2006, which totalled 46.5 million tonnes: 34.8 million tonnes for mainland and 11.7 million for non-mainland production. Expenses related to the use of emission rights were Euro 221 million lower than in 2005, due to the lower volume of emissions recorded in 2006 and lower value assigned to them.
“Other supplies and services” also includes a Euro 51 million reversal equivalent to the amount Extremadura regional government must reimburse ENDESA in connection with the environmental impact tax on its plants paid by the Company from 1998 to 2005 after the Constitutional Court ruled this to be unconstitutional on June 13.
35
Personnel expenses
At year-end, the workforce in Spain and Portugal was 12,666, 43 fewer than at the end of 2005.
Personnel expenses rose 2.0% in 2006 to Euro 1,062 vs. 2005. These expenses include Euro 136 million corresponding to a headcount reduction provision, mainly related to salary revisions implemented in light of actual inflation, a new layoff program in connection with the Mining Plan and to the provision for the early layoff of specific workforce groups, which will help the Company to achieve part of the cost cutting targets.
Net financial expenses: 33.9% lower
ENDESA reported net financial losses in the business in Spain and Portugal for 2006 of Euro 392 million, a 35.6% improvement on 2005.
Net financial expenses include Euro 11 million of revenue corresponding to interest accrued to December 31, 2006 for the environmental impact tax paid by ENDESA from 1998 to 2005, which, as pointed out previously, must be reimbursed to the Company by the Extremadura regional government and revenue of Euro 54 million arising from the application of a lower rate to discount obligations under workforce reductions programs. In 2005, this calculation resulted in an expense of Euro 111 million.
When assessing financial results, the Euro 2,779 million receivable corresponding to the tariff deficit and non-mainland compensation, both of which bear financial interest, must be considered.
Net financial debt at the Spain and Portugal business at December 31, 2006 stood at Euro 12,548 million vs. Euro 11,461 million at December 31, 2005. This increase is due to the Euro 609 million net increase in receivables related to the generation tariff deficit on regulated activities and in non-mainland generation in 2006 as well as the Euro 1,341 million dividend payment made in July in connection with capital gains realised in 2005, which had contributed to reducing debt that year. It was determined at the General Shareholders’ Meeting to distribute these capital gains to shareholders.
Equity-accounted income
Equity-accounted income in the business in Spain and Portugal totalled Euro 53 million, a 20.5% increase vs. 2005. This amount includes, among others, the contribution from Nuclenor.
Tax
Income tax includes a loss of Euro 137 million deriving from the lower carrying amount of deferred tax credits following the corporate income tax rate cut enacted in Spain. The 35% rate prevailing in 2006 will be reduced to 32.5% in 2007 and to 30% in 2008 and beyond.
36
Meanwhile, 2006 marked the completion of corporate income tax inspection of the tax group headed up by ENDESA for the period 1998-2001. The Company did not have to recognise any expense as a result of the inspection.
Cash flow from operating activities: Euro 2,721 million (+2%)
Cash flow from operations from the Spanish and Portuguese electricity business totalled Euro 2,721 million in 2006, an increase of 2% on 2005.
EBITDA growth outpaced the increase in cash flow from operating activities due higher taxes paid in 2006 vs. 2005 and higher payments in relation to workforce reduction programs, as a result of the externalisation in 2006 of a portion of the commitments thereunder.
Investments: Euro 2,921 million
Investments in Spain and Portugal totalled Euro 2,921 million in 2006. The breakdown is as follows:
| TOTAL INVESTMENT IN SPAIN AND PORTUGAL | ||||||||||
| Euro million | ||||||||||
| 2006 | 2005 | % Chg | ||||||||
| Capex | 2,630 | 2,382 | 10.4 | |||||||
| Intangibles | 100 | 66 | 51.5 | |||||||
| Financial | 191 | 212 | (9.9 | ) | ||||||
Total investments | 2,921 | 2,660 | 9.8 | |||||||
CAPEX IN SPAIN AND PORTUGAL | ||||||||||
| Euro million | ||||||||||
| 2006 | 2005 | % Chg | ||||||||
| Generation | 1,171 | 943 | 24.2 | |||||||
Ordinary regime | 840 | 799 | 5.1 | |||||||
Renewables/CHP | 331 | 144 | 129.9 | |||||||
| Distribution | 1,408 | 1,389 | 1.4 | |||||||
| Other | 51 | 50 | 2.0 | |||||||
Total | 2,630 | 2,382 | 10.4 | |||||||
90% of total investment was spent on capex to develop or enhance electricity generation and distribution facilities.
The breakdown of capex reflects the considerable effort the Company has been making to improve service quality in Spain, with investment in distribution facilities accounting for 53.5% of the total. As already stated, these investments are underpinning the improvement in the quality of customer service provided to the Company’s broad customer base in the regulated market in Spain.
We would highlight the significant increase in capital expenditure to expand ENDESA’s generation capacity, including the construction of the Cristobol Colón (400 MW) and As Pontes (800 MW) CCGTs as well as capacity increases in renewables/CHP, where investment totalled Euro 331 million, 129.9% more than in 2005.
37
BUSINESS IN EUROPE
Net income of Euro 493 million (+16%)
Net income from the electricity business in Europe totalled Euro 493 million in 2006, an increase of 16% on 2005.
This figure includes Euro 118 million after minorities due to an increase in value of the business caused by restatement of the tax base of Endesa Italia’s fixed assets to their book values, in accordance with Italian law.
These results confirm the steady improvement in this business area, firmly driven by positive performance of its operating indicators and efficiency gains, and ENDESA’s ability to leverage growth opportunities in its markets by developing new CCGT and renewable capacity, gas infrastructure and increasing sales to end customers, thereby ensuring the long-term sale under favourable terms of the power produced by its generators.
In 2006, ENDESA’s business in Europe focused on achieving two of its main strategic targets: consolidating its current competitive position and seeking new growth opportunities.
Key operating highlights
New generation capacity
During the third quarter, Endesa Europa acquired 58.35% of Centro Energia Teverola and Centro Energia Ferrara from the Italian companies Merloni Invest, MPE and Fineldo.
Each of these companies owns a 170 MW CCGT subject to a subsidised tariff. This first is located in the Emilia Romaña region in the north of Italy and the second in Campania, in the south. Foster Wheeler Italiana owns 41.65% of each.
Meanwhile, construction continued according to schedule on the two 400MW Scandale CCGTs in Calabria in which owns 50%.
In line with planned growth in renewable energies, in 2006 the company added the Iardino and Vizzini wind farms, already operational, to its generation mix. The Montecute and Trapani farms will come on stream in the early months of 2007. These four facilities add 112 MW to installed capacity.
All these projects mark a major step forward for Endesa Italia towards achieving its target of having 400 MW of installed wind capacity by 2010.
Meanwhile, during the third quarter, the French generating company Snet, which has been operating under the Endesa France name since the end of 2006, received authorisation from the local government in the French city of Saint Avold to build two CCGTs with a combined capacity of 800 MW on the Émile Huchet site. Estimated investment totals Euro 400 million. The facility is expected to begin commercial operations in the first half of 2009. The Company is also considering installing another two new CCGTs, one 800 MW at Lacq and one 400 MW one at either the Hornaing or Lucy sites.
38
Elsewhere, during the year the Company won the tender to build a 10MW Léhaucourt wind farm and has nearly 65 MW of new wind projects committed to other sites, such as Ambon, Muzillac or Cernon.
These initiatives form part of the business plan to develop up to a total of 2,000 MW of new capacity in CCGTs and 200 MW in renewables/CHP.
Gas infrastructure
In 2006, preliminary work continued on the offshore regasification terminal to be built off the coast of Livorno, Italy.
Estimated investment amounts to around Euro 400 million and authorised regasification capacity is close to 4 billion cubic metres (bcm) per annum, of which, under the terms of the agreements negotiated, Endesa Europa will be entitled to approximately half.
The company owns 25.5% of the development company for the facility.
With the project’s other partners - local companies AMGA and ASA from Livorno and Genoa, respectively -a new partnership was created for joint management.
This capacity will be used to feed the CCGTs currently operated by the Company in Italy and those planned for the coming years. Construction is scheduled to take around 24 months, with the terminal expected to come on stream for the start of 2009.
These projects guarantee competitive gas supplies for the Italian market and increase the flexibility of ENDESA’s fuel mix at its different sites throughout the Mediterranean basin.
Supply
This year, Endesa Europa and the Italian group, Merloni, have begun selling electricity to the Italian retail market through MPE Energia, a 50/50 joint venture. Merloni brings to the JV a portfolio of more than 5,000 points of supply across all Italian regions, and up to 2 TWh of sales volume.
Meanwhile, Snet closed significant supply deals in 2006 such as the agreement signed with the French multinational company Auchan (Alcampo) to supply 400 GWh of power in 2006 and another with SNCF (the French railway operator) to supply 6,600 GWh between 2007 and 2011.
Sharp increase in output and sales
ENDESA’s total output in Europe in 2006 amounted to 35,575 GWh, an increase of 5.4% on the year before. Electricity sales rose 11.4% to 52,606 GWh.
BREAKDOWN OF ENDESA’S OUTPUT AND SALES IN EUROPE | |||||||||||||||||||
| Output (GWh) | Sales (GWh) | ||||||||||||||||||
| 2006 | 2005 | % Chg | 2006 | 2005 | % Chg | ||||||||||||||
| Italy | 25,723 | 23,362 | 10.1 | 33,584 | 30,911 | 8.6 | |||||||||||||
| France | 8,248 | 8,689 | (5.1 | ) | 17,418 | 14,612 | 19.2 | ||||||||||||
| Poland* | 1,604 | 1,698 | (5.5 | ) | 1,604 | 1,698 | (5.5 | ) | |||||||||||
| Total | 35,575 | 33,749 | 5.4 | 52,606 | 47,221 | 11.4 | |||||||||||||
(*) ENDESA is present in the generation business in Poland through the Bialystock CHP, which is controlled by Snet.
39

EBITDA: +25.8%
Endesa Europa posted EBITDA in 2006 of Euro 1,116 million, up 25.8% year-over-year, and EBIT of Euro 846 million, an increase of 36.9%.
EBITDA & EBIT IN EUROPE | |||||||||||||||||||
EBITDA (Euro million) | EBIT (Euro million) | ||||||||||||||||||
| 2006 | 2005 | % Chg | 2006 | 2005 | % Chg | ||||||||||||||
| Italy (*) | 916 | 694 | 32.0 | 749 | 542 | 38.2 | |||||||||||||
| Snet | 196 | 179 | 9.5 | 98 | 62 | 58.1 | |||||||||||||
| Trading | 42 | 46 | (8.7 | ) | 42 | 46 | (8.7 | ) | |||||||||||
| Holding & others | (38 | ) | (32 | ) | (18.8 | ) | (43 | ) | (32 | ) | (34.4 | ) | |||||||
Total | 1,116 | 887 | 25.8 | 846 | 618 | 36.9 | |||||||||||||
(*) Includes Endesa Italia and 4 months of operations in 2006 of Teverola and Ferrara, acquired in September 2006.
Endesa Italia continues to improve
Endesa Italia’s revenues totalled Euro 2,915 million in 2006, an increase of 30.0% from last year.
This growth was mainly the result of a 8.6% increase in electricity sold and a 27.6% increase in average electricity prices in the Italian market.
40
ENDESA ITALIA KEY DATA | |||||||||||||
| Euro million | |||||||||||||
| 2006 | 2005 | Change | % Chg | ||||||||||
| Revenues | 2,915 | 2,242 | 673 | 30.0 | |||||||||
| Gross profit | 1,087 | 853 | 234 | 27.4 | |||||||||
| EBITDA | 916 | 694 | 222 | 32.0 | |||||||||
| EBIT | 749 | 542 | 207 | 38.2 | |||||||||
Endesa Italia generated a total of 25,723 GWh of electricity in 2006, an increase of 2,361 GWh or 10.1% vs. 2005. Its market share in Italy at year-end stood at 8.5%.
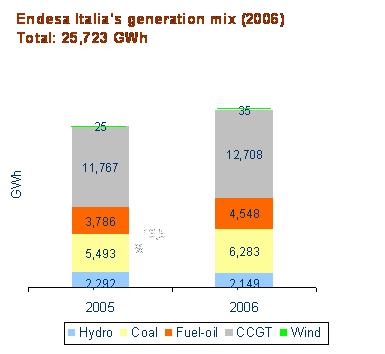
Endesa Italy’s generation structure in 2006 reflects a higher percentage of fuel-oil production than last year (17.7% vs. 16.2%), as a result of the application of extraordinary measures to reduce gas consumption through March in order to guarantee supply.
Although Endesa Italia’s fuel costs increased by Euro 254 million in 2006, this was less than the increase in revenues (Euro 673 million) due to higher electricity prices.
On February 23, 2006 the Italian government approved the National Allocation Plan (NAP) for greenhouse gas emission rights, which was subsequently ratified by EU authorities. This NAP allocates Endesa Italia 33.9 million tonnes for the period 2005-2007.
On May 4, 2006 the Italian national CO2 emission rights register was formally set up for the rights allocated in the NAP and those acquired. Endesa Italia booked Euro 66 million of revenues in 2006 from the free allocation and use of emission rights and Euro 110 million of expenses for the cost of emissions. Accordingly, the net cost of emission rights in the income statement was Euro 44 million, corresponding to an estimated deficit of 3.4 million tonnes of CO2.
41
Finally, Endesa Italia restated the tax base of its fixed assets to their book value, in accordance with Italian legislation. Therefore, it recorded a Euro 148 million lower corporate tax charge (Euro 118 million after minorities) corresponding to the tax savings provided for in this norm.
Earnings growth at Snet continues to gather pace
Earnings at Snet, which has been operating commercially under the Endesa France name since the end of 2006, continued to gather momentum in the fourth quarter of 2006. EBITDA in 2006 rose 9.5% to Euro 196 million for the full-year and EBIT by 58.1% to Euro 98 million vs. 2005.
SNET KEY DATA | |||||||||||||
| Euro million | |||||||||||||
| 2006 | 2005 | Change | % Chg | ||||||||||
| Revenues | 1,082 | 899 | 183 | 20.4 | |||||||||
| Gross profit | 332 | 322 | 10 | 3.1 | |||||||||
| EBITDA | 196 | 179 | 17 | 9.5 | |||||||||
| EBIT | 98 | 62 | 36 | 58.1 | |||||||||
Revenues rose 20.4% year-over-year in 2006 to Euro 1,082 million, mostly driven by the 16.6% growth in energy sales to 19,022 GWh.
Variables costs were Euro 173 million higher, basically as a result of the Euro 216 million increase in energy purchases, although this was offset by tighter control over transmission expenses and other variable purchases, which were jointly 47.2% lower than in 2005.
Finally, in 2006, Snet completed the headcount reduction plan, resulting in a 25% decrease in the total workforce; the operator had 1,373 employees on staff when Endesa Europa took control of the company. These layoffs led to a 12% reduction in personnel costs and came within the framework of discussions with union representatives.
European debt: Euro 1,674 million
ENDESA’s business in Europe had net financial debt at December 31, 2006 of Euro 1,674 million, Euro 388 million more than at the end of 2005.
This debt derives from a one-off income tax payment in 2Q06 linked to tax credits obtained in 2005 and 2006 and to acquisition in the third quarter of majority shareholdings in Centro Energia Teverola and Centro Energia Ferrara, owners of the CCGTs, and the assumption of their debt.
Net financial results in 2006 amounted to an expense of Euro 56 million, a decrease of Euro 8 million from 2005.
Cash flow from operating activities: Euro 704 million
Operating cash flow generated in the European business in 2006 totalled Euro 704 million, an increase of 20.1% on the Euro 586 million generated in 2005, despite the aforementioned one-off tax payment.
42
Investments: Euro 463 million
Investments in 2006 in the European business totalled Euro 463 million, of which Euro 271 million were capex, Euro 132 million in Italy and Euro 139 million in France.
These amounts included the acquisition of 58.35% stakes in Centro Energia Teverola and Centro Energia Ferrara for Euro 57 million and Euro 35 million, respectively. ENDESA began fully consolidating these companies on September 1, 2006.
Dividends
ENDESA’s investees in Europe paid dividends to the parent in 2006.
Endesa Italia paid shareholders Euro 176 million, of which Euro 140.8 million corresponded to Endesa Europa. In January 2007, Endesa Italia agreed to pay its shareholders a dividend against 2006 results of Euro 206 million, of which Euro 172.8 million corresponded to Endesa Europa.
In addition, an agreement was reached at Snet’s General Shareholders’ Meeting held on March 2006 to pay shareholders Euro 59.7 million in dividends. After the Euro 21.2 million interim dividend paid on March 9, Snet paid out a final dividend of Euro 38.5 million, of which Euro 25 million corresponded to Endesa Europa.
Furthermore, on December 2006 Snet’s Board of Directors approved a dividend payment of Euro 36 million against 2006 Results, of which Euro 23.4 million corresponds to Endesa Europa.
Finally, at its meeting of May 31, the Board of Directors of Moroccan utility Energie Electrique de Tahaddart approved the payment of Euro 6 million of dividends to shareholders, of which Euro 1.9 million corresponded to Endesa Europa.
43
BUSINESS IN LATIN AMERICA
Strong growth in net income: +76.3%
Net income at ENDESA’s Latin American business totalled Euro 462 million in 2006, an increase of Euro 200 million, or 76.3%, on 2005 and equivalent to 15.6% of ENDESA’s total net income.
This sharp growth reflects favourable economic trends witnessed in the region since 2005, marked by higher growth and more stable exchange rates in ENDESA’s operating markets.
ENDESA’s subsidiaries have leveraged the growth in generation output and demand deriving from this improved environment, achieving all-time high unit margins thanks to ongoing operational efficiency efforts, the efficient structure of their generation mix and their broad and growing customer base.
Against this backdrop, the strategic logic behind the various capacity additions and regasification facilities being developed or in the planning stage is clear.
Highlights
Growth in volume sales in generation and distribution
As indicated, improved economic environment in the countries where ENDESA has subsidiaries led to sharp increases - all above 3.9% - in demand in 2006. Particularly noteworthy were the increases in demand in Argentina (10.4%), Peru (7.7%) and Chile (5.9%).
Higher demand underpinned total electricity sales by these subsidiaries of 58,281 GWh, up 5.5% vs. 2005, with particularly significant growth in Peru (+7.6%) and Colombia (+6.5%).
Regarding output, ENDESA generated 62,028 GWh in the region in 2006, a 7.1% increase vs. 2005. Output rose 7.7% in like-for-like terms, i.e., stripping out the 2005 generation from the plants disposed of by Brazilian company Ampla, whose core business is the distribution of electricity, in 2006. The largest increases were in Brazil (+14.9%, after deducting the aforementioned output) and Chile (+6.4%).
OUTPUT AND SALES IN THE LATIN AMERICAN BUSINESS | |||||||||||||
| Output (GWh) | Sales (GWh) | ||||||||||||
| 2006 | % Chg vs. 2005 | 2006 | % Chg vs. 2005 | ||||||||||
| Chile | 19,973 | 6.4 | 12,377 | 4.4 | |||||||||
| Argentina | 17,752 | 9.9 | 14,837 | 5.8 | |||||||||
| Peru | 7,250 | 5.1 | 4,874 | 7.6 | |||||||||
| Colombia | 12,564 | 5.9 | 10,755 | 6.5 | |||||||||
| Brazil | 4,489 | 6.6 | 15,438 | 4.6 | |||||||||
TOTAL | 62,028 | 7.1 | 58,281 | 5.5 | |||||||||
44

Improvement in generation and distribution margins
Growth in demand, tighter reserve margins and favourable generation mix at ENDESA’s subsidiaries caused the unit margin of generation companies to increase by 24.2% in 2006 vs. 2005 to US$26.2 per MWh produced.
Generation margins, measured in dollars, increased sharply, above all in Chile (+53.4%) thanks to higher wholesale prices and a greater contribution by hydro in the generation mix with and to higher prices; and in Argentina (+37.2%), thanks to higher rainfall and accordingly hydro output and higher prices due to the pass-through of greater fuel costs to the wholesale electricity market (MEM). Conversely, in Colombia higher rainfall triggered lower spot market prices and therefore lower average unit margins compared to last year.
In distribution, operating margins were considerably boosted by improved pass-through of generation costs in Brazil and operating efficiency improvements at the companies, leading to a considerable improvement in their operating indicators. The unit margin stood at $34.6/MWh distributed, an increase of 7.8% vs. 2005.
Reduction in distribution losses
Energy distribution losses were 11.2% in 2006, 0.6 percentage points below the level recorded in 2005.
Improvements were made in all countries, especially in Argentina and Brazil, where the percentage of losses declined by 0.9 and 0.7 percentage points, respectively. These improvements reflect the achievements made in technological innovation, as illustrated by the development and rollout of the new Ampla grid in Brazil.
45
New gas and electricity facilities
Centrales Hidroeléctricas de Aysén (51%-owned by Endesa Chile, a subsidiary of ENDESA, and 49% by Colbún) was incorporated in September 2006. The purpose of the new company is to study, finance, build and operate the Aysén Project.
This project entails construction, starting in 2008, of four hydro plants with total installed capacity of approximately 2,400 MW, the last of which is currently estimated to come on stream towards the end of 2018. It will require total investment of US$3,600 million, of which US$1,500 million will be earmarked for the 2,000km high voltage line required to transmit the energy generated and whose construction will be put out to tender, and USD2,100 million will be allotted to the four hydro plants. Therefore, in proportion to its stake in the project, Endesa Chile will have to invest at least 51% of this, i.e. US$1,071 million.
Also in 2006, Endesa Chile continued work on the 377MW San Isidro II CCGT and the 32MW Palmucho hydro plant, both in Chile.
In May 2006, the first stone was placed on the regasification plant included in the liquefied natural gas (LNG) project being carried out in Quintero (Chile), in which Endesa Chile will have a 20% stake. The other partners are British Gas, Metrogas and ENAP. This plant will ensure fuel supply to the capacity addition facilities to be put into operation in Chile.
ENDESA Eco continued to work on the Canela wind farm in Chile, which in its initial phase will have installed capacity of 9 MW out of total planned capacity of 18MW, and on the 9 MW Ojos de Agua mini hydro station. Both projects were started in 1Q06.
In Peru, construction on the first and second CCGTs at the Ventanilla site was completed, and commercial operations began in July and October, 2006, respectively. The start-up of both CCGTs brought an additional 166 MW of new capacity on stream (with 24 MW pending certification), making the company’s generation mix much more competitive.
Meanwhile, in Colombia, the acquisition of the Termocartagena thermal plant closed. Nominal capacity at this plant is 186 MW (at December official registered capacity was 142 MW).
Finally, in July 2006 construction officially began in Panama on the transmission line of the SIEPAC project to interconnect the electricity grids of six Central American countries. The network owner (Empresa Propietaria de la Red, or EPR) is responsible for carrying out the project. Partners include the six Central American countries involved, Colombian company ISA and ENDESA (12.5% stake).
Optimisation of ownership structure
In 2006, ENDESA completed the organisational restructuring underway in Brazil, Peru and Chile:
| · | In Brazil, the Endesa Brasil holding company owns all the assets ENDESA holds directly and indirectly in this country. In July, International Finance Corporation (IFC), a World Bank affiliate with 178 member countries, acquired 2.7% of this holding company. The transaction values Endesa Brasil’s equity at a total of US$1,850 million, equivalent to an EV/EBITDA 2005 multiple of 6.65x. |
46
| · | In Peru, the merger and takeover of Etevensa by Edegel. This transaction, which closed on June 1, results in a more balanced overall generation mix (51% hydro and 49% thermal), which will, among other things, reduce volatility of revenues as a result of variations in rainfall. |
| · | In Chile, the Chilectra-Elesur merger closed |
| · | In Colombia, the boards of Emgesa and Betania approved the merger of the two utilities. This merger, to be completed in 2007, will give rise to the largest generator in Colombia, with installed capacity of 2,789 MW. |
Regulatory update
Regulatory highlights in 2006 in the Latin American countries where ENDESA has operations:
Brazil
| · | The tariffs applied to Brazilian companies, Ampla and Coelce, were modified, by 2.9% and 10.01%, respectively. |
| · | The methodology for setting distribution tariffs was improved based on the redefinition of the asset remuneration bases for the next 10 years and the increased transparency injected into the WACC calculation. |
Colombia
| · | The electricity regulator passed a resolution modifying the calculation to limit generation market share, providing ENDESA’s subsidiaries with access to higher market volume. |
| · | On November 1, 2006 the so-called Reliability Charge came into effect, substituting the previous Capacity Charge. We highlight the following aspects of this new piece of legislation: |
| | From December 2006 to at least November 2009, there will be a transition period during which a pro rata charge will be paid for energies certified by the regulator. |
| | In the first half of 2007, energy auctions will be held for up to 20 years in order to define the expansion required beyond December 2009, when new projects will be put out to tender and existing projects will become price takers. |
Argentina
| · | Regarding the bilateral agreement between Argentina and Brazil, the Argentine Secretary for Energy issued a resolution permitting companies with export contracts to renegotiate them to encourage imports in order to meet demand. |
| · | The Argentine Senate ratified the agreement between UNIREN and Edesur establishing the framework for a complete tariff overhaul. A presidential decree ratifying this process was passed in December 2006, enacting the 38% increase in the DCV (distribution cumulative value) to be implemented retroactively from November 2005, among other measures. The 2006 accounts do not recognise any income in this connection. |
| · | A trust has been set up to enable the Argentine companies under the Foninvemem agreement - awarded 1,600 MW of CCGTS - to obtain the necessary administrative and operating resources. |
47
Chile
| · | The first long-term energy tenders (15 years) were completed pursuant to the "Ley Corta", guaranteeing distributors' demand for 2010-2024 at a fixed price and with guaranteed pass-through. In contrast to node pricing, this new system reduces the regulator’s discretion over prices. |
Peru
| · | The Peruvian Congress passed an amendment to the Electricity Concession Law, the main features of which are as follows: |
| | The establishment of a mechanism for tenders at fixed prices over a period of 10 years to encourage investment and contracting with distributors, with guaranteed pass-through. |
| | The establishment of a new centrally planned regulation, with 30-year concessions and guaranteed payment. |
| | Greater involvement by generators, distributors, transmission companies and deregulated customers in the domestic electricity system operator. |
| | The option of spot purchase for deregulated demand of distributors and large deregulated customers. |
The new law helps to unlock the value of ENDESA’s generation assets in Peru through rising prices and long-term contracts.
EBITDA: +16.5%
EBITDA in the Latin American business totalled Euro 2,188 million in 2006, a 16.5% increase on 2005.
EBIT rose 22.7% to Euro 1,688 million.
EBITDA & EBIT IN LATIN AMERICA | |||||||||||||||||||
| Euro million | EBITDA | EBIT | |||||||||||||||||
| 2006 | 2005 | % Chg | 2006 | 2005 | % Chg | ||||||||||||||
| Generation and transmission | 1,238 | 1,037 | 19.4 | 981 | 768 | 27.7 | |||||||||||||
| Distribution | 1,036 | 898 | 15.4 | 802 | 677 | 18.5 | |||||||||||||
| Other | (86 | ) | (57 | ) | NA | (95 | ) | (69 | ) | NA | |||||||||
TOTAL | 2,188 | 1,878 | 16.5 | 1,688 | 1,376 | 22.7 | |||||||||||||
48
The table below shows the breakdown of EBITDA and EBIT of ENDESA’s fully consolidated subsidiaries by business line and country:
BREAKDOWN OF EBITDA AND EBIT IN LATAM BY BUSINESS LINE AND COUNTRY | |||||||||||||||||||
Generation and transmission | |||||||||||||||||||
| Euro million | EBITDA | EBIT | |||||||||||||||||
| 2006 | 2005 | % Chg | 2006 | 2005 | % Chg | ||||||||||||||
| Chile | 576 | 365 | 57.8 | 483 | 248 | 94.8 | |||||||||||||
| Colombia | 227 | 232 | (2.2 | ) | 182 | 183 | (0.5 | ) | |||||||||||
| Brazil - Generation | 159 | 128 | 24.2 | 140 | 111 | 26.1 | |||||||||||||
| Brazil - Transmission | (23 | ) | 55 | (141.8 | ) | (41 | ) | 38 | (207.9 | ) | |||||||||
| Peru | 150 | 154 | (2.6 | ) | 108 | 114 | (5.3 | ) | |||||||||||
| Argentina - Generation | 149 | 93 | 60.2 | 111 | 66 | 68.2 | |||||||||||||
| Argentina - Transmission | - | 10 | (100.0 | ) | (2 | ) | 8 | (125.0 | ) | ||||||||||
TOTAL | 1,238 | 1,037 | 19.4 | 981 | 768 | 27.7 | |||||||||||||
Distribution | |||||||||||||||||||
| Euro million | EBITDA | EBIT | |||||||||||||||||
| 2006 | 2005 | % Chg | 2006 | 2005 | % Chg | ||||||||||||||
| Chile | 201 | 192 | 4.7 | 178 | 168 | 6.0 | |||||||||||||
| Colombia | 277 | 236 | 17.4 | 213 | 165 | 29.1 | |||||||||||||
| Brazil | 422 | 329 | 28.3 | 335 | 262 | 27.9 | |||||||||||||
| Peru | 87 | 74 | 17.6 | 54 | 44 | 22.7 | |||||||||||||
| Argentina | 49 | 67 | (26.9 | ) | 22 | 38 | (42.1 | ) | |||||||||||
TOTAL | 1,036 | 898 | 15.4 | 802 | 677 | 18.5 | |||||||||||||
Generation and transmission
Chile
Energy output in 2006 rose 6.4% to 19,973 GWh. Moreover, the generation mix improved, with hydro generation increasing to account for 86% of generation. This helped protect earnings from the rise in fuel prices, such as natural gas.
This, together with the favourable trend in the Chilean peso vis-à-vis the euro and higher wholesale prices, generated a 57.8% increase in EBITDA and a 94.8% increase in EBIT to Euro 576 million and Euro 483 million, respectively.
Colombia
Electricity generation output was 5.9% higher than in 2005, nearly offsetting the adverse trend in prices as a result of high level of rainfall last year. Hence, EBITDA was just Euro 5 million lower than in 2005, at Euro 227 million, while EBIT was Euro 1 million lower at Euro 182 million.
Brazil - Generation
ENDESA’s subsidiaries in Brazil generated total output in 2006 of 4,489 GWh, 6.6% more than in 2005. This increase was essentially due to a 9.7% increase in hydro output at the Cachoeira Dourada facility.
The increase in electricity sales, the improvement in the generation mix and favourable exchange rate movements underpinned a 24.2% rise in EBITDA and a 26.1% jump in EBIT to Euro 159 million and Euro 140 million, respectively.
49
Brazil - Transmission
The difficulties in exporting electricity from Argentina to Brazil due to gas supply restrictions continued, undermining results at this interconnection.
EBITDA in 2006 showed a loss of Euro 23 million, compared to income of Euro 55 million in 2005, while EBIT was a negative Euro 41 million, compared to positive Euro 38 million the year before.
At present, the company Cien is looking into the possibility of modifying the use of the interconnection between Argentina and Brazil so that in the future, instead of buying and selling electricity, the interconnection can be used by the various Brazilian and Argentine electricity system agents, in exchange for appropriate consideration. This business switch would enable Cien’s assets to generate a reasonable return once again.
Peru
Higher electricity prices in Peru were insufficient to offset higher fuel prices. Accordingly, despite the 5.1% increase in output, EBITDA declined 2.6% to Euro 150 million and EBIT was Euro 6 million lower than in 2005 at Euro 108 million.
Argentina
Although gas supply difficulties continued to trigger increases in fuel costs (47.7%) due to the need to generate power using liquid fuels, higher sales (+43.9%) due to increased output, notably hydro output (+28%), coupled with improvements in prices, boosted margins.
EBITDA rose 60.2% in 2006 vs. 2005 to Euro 149 million and EBIT by 68.2% to Euro 111 million.
Distribution
Chile
Revenues rose 18.1% thanks to exchange rates, higher volume sales (4.4%) and the higher unit price resulting from changes in the tariff indexation. Topline growth underpinned a 4.7% rise in EBITDA to Euro 201 million and a 6% increase in EBIT to Euro 178 million.
Colombia
EBITDA at the Colombian distribution business was Euro 277 million, 17.4% higher than in 2005, while EBIT stood at Euro 213 million, up 29.1%. The increases were driven by a 3.6% increase in revenues and by other operating income from the new business undertaken by Codensa Hogar.
Brazil
Distribution sales in Brazil came to Euro 1,557 million in 2006, an 18% increase on 2005. The increase was driven by wider margins stemming from the enhanced pass-through of generation prices to customers and, to a lesser extent, higher volume sales (+4.6%).
These factors, coupled with a significant decline in energy losses, led to increases in EBITDA and EBIT of 28.3% and 27.9%, respectively, to Euro 422 million and Euro 335 million.
50
Peru
EBITDA from distribution in Peru came to Euro 87 million in 2006, a 17.6% increase on 2005, due to 7.6% higher revenues. Meanwhile, EBIT rose 22.7% to Euro 54 million.
Argentina
The tariff increase had not yet been enacted by year-end. As a result, the 1.4% increase in revenues from distribution was not enough to make up for the 6% rise in energy purchases.
This led to a 26.9% decline in EBITDA, to Euro 49 million, and a 42.1% drop in EBIT, to Euro 22 million. This trend will be reversed and Edesur’s results are expected to grow significantly in 2007 thanks to the 28% tariff hike enacted in December of last year.
Financial results: Euro 491 million
Financial results for the business in Latin America in 2006 reflected a net loss of Euro 491 million, Euro 33 million less than in 2005.
Net exchange rate gains increased Euro 6 million from Euro 16 million in 2005 to Euro 22 million in 2006. Net interest expense totalled Euro 513 million, Euro 27 million or 5% lower than in 2005.
Net debt at ENDESA’s Latin American business stood at Euro 5,618 million at December 31, 2006, a reduction of Euro 491 since the start of the year. This decrease is due, among other factors, to the appreciation of the euro vis-à-vis the currencies in which ENDESA’s Latin American subsidiaries’ debt is denominated. This accounted for Euro 486 million of the reduction.
The cash flows generated during the period enabled the distribution to the parent company and minority shareholders of Euro 372 million without modifying the debt reduction path.
In May, Fitch Ratings upgraded its ratings for Enersis and Endesa Chile from BBB- to BBB, stable outlook, while in December, Moody’s upgraded its ratings for both companies from Ba1 to Baa3, also with a stable outlook. Also in December, Standard & Poor’s placed its BBB- ratings for both utilities under review for a possible upgrade. These upgrades mean that Enersis and Endesa Chile have recovered their rated investment status at all three rating agencies.
Cash flow from operating activities: +3.2%
ENDESA’s business in Latin America generated Euro 1,218 million of cash flow in 2006, an increase of 3.2% with respect to 2005.
EBITDA growth outpaced increase in cash flow from operating activities mainly due to higher tax payments in 2006 vs. 2005 as well as the payment of certain lawsuits in Brazil which has been fully provisioned.
51
Cash returns: Euro 253 million
Cash returns from ENDESA’s Latin American business to the parent company in 2006 totalled Euro 253 million.
The strong financial situation of our business in the region and the favourable outlook has allowed for an increased of total cash flow returns targets during 2005-2009 from US$ 1,000 million to US$ 1,600 million.
This, coupled with the Euro 308 million received in 2005, means that 35% of the 2009 strategic target has now been achieved.
Investments: Euro 952 million
Investment in Latin America in 2006 totalled Euro 952 million, of which Euro 869 million was capex.
Progress on the new capacity plan meant generation capex totalled Euro 328 million in 2006, up 97.6% over 2005. Distribution capex was 26.4% higher due to higher demand in the markets served by Endesa’s companies as well as higher raw materials costs.
CAPITAL EXPENDITURE IN LATIN AMERICA | ||||||||||
| Euro million | ||||||||||
| 2006 | 2005 | % Chg | ||||||||
| Generation | 328 | 166 | 97.6 | |||||||
| Distribution and transmission | 493 | 390 | 26.4 | |||||||
| Other | 48 | 44 | 9.1 | |||||||
TOTAL | 869 | 600 | 44.8 | |||||||
52
STATISTICAL APPENDIX
53
KEY FIGURES
Electricity Generation Output (GWh) | 2006 | 2005 | % Chg | |||||||
| Business in Spain and Portugal | 88,808 | 93,625 | (5.1 | ) | ||||||
| Business in Europe | 35,575 | 33,749 | 5.4 | |||||||
| Business in Latin America | 62,028 | 57,890 | 7.1 | |||||||
TOTAL | 186,411 | 185,264 | 0.6 | |||||||
Electricity Generation Output in Spain and Portugal (GWh) | 2006 | 2005 | % Chg | |||||||
Mainland | 74,347 | 79,811 | (6.8 | ) | ||||||
| Nuclear | 24,389 | 23,020 | 5.9 | |||||||
| Coal | 32,516 | 37,018 | (12.2 | ) | ||||||
| Hydro | 7,571 | 7,479 | 1.2 | |||||||
| Combined cycle - CCGT | 6,431 | 7,757 | (17.1 | ) | ||||||
| Fuel oil | 964 | 2,417 | (60.1 | ) | ||||||
| Renewables/CHP | 2,476 | 2,120 | 16.8 | |||||||
Non-mainland | 14,461 | 13,814 | 4.7 | |||||||
TOTAL | 88,808 | 93,625 | (5.1 | ) | ||||||
Electricity Generation Output in Europe (GWh) | 2006 | 2005 | % Chg | |||||||
| Coal | 16,135 | 15,880 | 1.6 | |||||||
| Hydro | 2,149 | 2,292 | (6.2 | ) | ||||||
| Combined cycle - CCGT | 12,708 | 11,766 | 8.0 | |||||||
| Fuel oil | 4,548 | 3,786 | 20.1 | |||||||
| Wind | 35 | 25 | 40.0 | |||||||
TOTAL | 35,575 | 33,749 | 5.4 | |||||||
Electricity Generation Output in Latin America (GWh) | 2006 | 2005 | % Chg | |||||||
| Chile | 19,973 | 18,764 | 6.4 | |||||||
| Argentina | 17,752 | 16,154 | 9.9 | |||||||
| Peru | 7,250 | 6,895 | 5.1 | |||||||
| Colombia | 12,564 | 11,864 | 5.9 | |||||||
| Brazil | 4,489 | 4,213 | 6.6 | |||||||
TOTAL | 62,028 | 57,890 | 7.1 | |||||||
Electricity sales (GWh) | 2006 | 2005 | % Chg | |||||||
Business in Spain and Portugal | 109,412 | 100,868 | 8.5 | |||||||
| Regulated market | 71,599 | 64,095 | 11.7 | |||||||
| Deregulated market | 37,813 | 36,773 | 2.8 | |||||||
Business in Europe | 52,606 | 47,221 | 11.4 | |||||||
| Italy | 33,584 | 30,911 | 8.6 | |||||||
| France | 17,418 | 14,612 | 19.2 | |||||||
| Poland | 1,604 | 1,698 | (5.5 | ) | ||||||
Business in Latin America | 58,281 | 55,246 | 5.5 | |||||||
| Chile | 12,377 | 11,851 | 4.4 | |||||||
| Argentina | 14,837 | 14,018 | 5.8 | |||||||
| Peru | 4,874 | 4,530 | 7.6 | |||||||
| Colombia | 10,755 | 10,094 | 6.5 | |||||||
| Brazil | 15,438 | 14,753 | 4.6 | |||||||
TOTAL | 220,299 | 203,335 | 8.3 | |||||||
54
Gas sales (GWh) | 2006 | 2005 | % Chg | |||||||
| Regulated market | 3,782 | 4,037 | (6.3 | ) | ||||||
| Deregulated market | 23,697 | 18,558 | 27.7 | |||||||
TOTAL | 27,479 | 22,595 | 21.6 | |||||||
Workforce | 31/12/06 | 31/12/05 | % Chg | |||||||
| Business in Spain and Portugal | 12,666 | 12,709 | (0.3 | ) | ||||||
| Business in Europe | 2,130 | 2,153 | (1.1 | ) | ||||||
| Business in Latin America | 11,962 | 12,317 | (2.9 | ) | ||||||
| Other businesses | -- | 25 | NA | |||||||
TOTAL | 26,758 | 27,204 | (1.6 | ) | ||||||
FINANCIAL DATA
Key figures | 2006 | 2005 | % Chg | |||||||
| EPS (Euro) | 2,8 | 3,0 | (6.7 | ) | ||||||
| CFPS (Euro) | 4,4 | 4,0 | 10.3 | |||||||
| BVPS (Euro) | 10.66 | 10.95 | (2.6 | ) | ||||||
Net financial debt (Euro million) | 31/12/06 | 31/12/05 | % Chg | |||||||
| Business in Spain and Portugal | 12,548 | 11,461 | 9.5 | |||||||
| Business in Europe | 1,674 | 1,286 | 30.2 | |||||||
| Endesa Italia | 748 | 815 | (8.2 | ) | ||||||
| Other | 926 | 471 | 96.6 | |||||||
| Business in Latin America | 5,618 | 6,109 | (8.0 | ) | ||||||
| Enersis | 4,749 | 5,207 | (8.8 | ) | ||||||
| Other | 869 | 902 | (3.7 | ) | ||||||
| Other businesses (1) | -- | (575 | ) | NA | ||||||
TOTAL | 19,840 | 18,281 | 8.5 | |||||||
| Financial leverage (%) | 124.5 | 112.0 | NA | |||||||
| Net debt/Operating cash flow (times) | 2.8 | 3.0 | NA | |||||||
| Interest coverage by operating cash flow (times) | 7.4 | 5.7 | NA | |||||||
(1) At December 31, 2006, there was no debt assigned to “Other businesses”, as it disappeared as such with the sale of the 5.01% stake in Auna in February 2006 and was allocated to the electricity business in Spain and Portugal.
Ratings (22/02/07) | Long term | Short term | Outlook |
| Standard & Poor’s | A | A-1 | Creditwatch (-) |
| Moody’s | A3 | P-2 | Negative |
| Fitch | A+ | F1 | Creditwatch (-) |
Main fixed-income issues | Spread over IRS (bp) | |
31/12/06 | 31/12/05 | |
| 2.5Y Euro 700M 4.375% Mat. June 2009 | 6 | 5 |
| 5.5Y GBP 400M 6.125% Mat. June 2012 | 25 | 28 |
| 6.2Y Euro 700M 5.375% Mat. Feb. 2013 | 24 | 18 |
Stock market data | 31/12/06 | 31/12/05 | % Chg | |||||||
| Market cap (Euro million) | 37,935 | 23,525 | 61.3 | |||||||
| Number of shares outstanding | 1,058,752,117 | 1,058,752,117 | -- | |||||||
| Nominal share value (Euro) | 1.2 | 1.2 | -- | |||||||
55
Stock market data | 2006 | 2005 | % Chg | |||||||
| Trading volumes (shares) | ||||||||||
| Madrid stock exchange | 3,041,387,906 | 2,602,871,497 | 16.9 | |||||||
| NYSE | 23,581,900 | 28,068,500 | (16.0 | ) | ||||||
| Average daily trading volume (shares) | ||||||||||
| Madrid stock exchange | 11,973,968 | 10,167,467 | 17.8 | |||||||
| NYSE | 93,952 | 111,383 | (15.7 | ) | ||||||
Share price | 2006 high | 2006 low | 31/12/06 | 31/12/05 | |||||||||
| Madrid stock exchange (Euro) | 36.25 | 21.70 | 35.83 | 22.22 | |||||||||
| NYSE (USD) | 47.78 | 26.30 | 46.52 | 26.01 | |||||||||
56
IMPORTANT LEGAL DISCLAIMER
Investors are urged to read E.ON’s tender offer statement, the report of Endesa’s board of directors with respect to the E.ON offer, the Notice of Endesa’s EGM and other material relating thereto, all as filed with the Comisión Nacional del Mercado de Valores (the "CNMV"), as well as Endesa’s Solicitation/Recommendation Statement on Schedule 14D-9 as amended from time to time and filed by Endesa with the U.S. Securities and Exchange Commission (the “SEC”). Such documents, further amendments thereto and other public filings made from time to time by Endesa with the CNMV or the SEC contain important information and are available without charge from the Endesa’s website at www.endesa.es, from the the CNMV’s website at www.cnmv.es and from the SEC’s website at www.sec.gov and at Endesa’s principal executive offices in Madrid, Spain.
This presentation contains certain estimates or predictions (“forward-looking statements”) regarding financial and operating statistics and results and other future events. These statements are not guarantees of future performance and are subject to material risks, uncertainties, changes and other factors that may be beyond Endesa’s control or that may be difficult to predict.
These forward-looking statements include, but are not limited to, information regarding: estimated future earnings; anticipated increases in wind and CCGTs generation and market share; expected increases in demand for and supply of gas; management strategy and goals; estimated cost reductions; tariffs and pricing structure; estimated investments; expected asset disposals; estimated increases in capacity and output and changes in capacity mix; repowering of capacity and macroeconomic conditions. For example, the EBITDA targets for 2007 to 2009 (which corresponds to gross operating profit in Endesa’s IFRS financial statements) included in this presentation are forward-looking statements that are based on certain assumptions that may or may not prove correct. The principal assumptions underlying these forecasts and targets relate to the regulatory environment, exchange rates, divestments, increases in production and installed capacity in the markets in which Endesa operates, increases in demand in those markets, allocation of production among different technologies, cost increases associated with a higher activity level not exceeding certain limits, the market price of electricity not falling below certain levels, the cost of CCGT and the availability and cost of gas, coal, fuel-oil and emission rights necessary to operate our business at desired levels.
For all of the forward looking statements in this presentation, Endesa claims the protection of the safe harbor for forward looking statements contained in the Private Securities Litigation Reform Act of 1995.
The following factors and circumstances, in addition to those discussed elsewhere in this presentation, could cause actual financial and operating results and statistics to differ materially from those expressed in our forward-looking statements:
Economic and Industry Conditions: significant adverse changes in the conditions of the industry, the general economy or our markets; the effect of the prevailing regulations or changes in them; tariff reductions; the impact of interest rate fluctuations; the impact of exchange rate fluctuations; natural disasters; the impact of more restrictive environmental regulations and the environmental risks inherent to our business; potential liabilities relating to our nuclear facilities.
Commercial or Transactional Factors: delays in or impossibility of obtaining necessary regulatory, antitrust and other approvals for our proposed acquisitions or asset disposals, or any conditions imposed in connection with such approvals; our ability to integrate acquired businesses successfully; the challenges inherent in diverting resources and management's focus away from other strategic opportunities and from operational matters during the process of integrating acquired businesses; the outcome of any negotiations with partners and governments; delays in or impossibility of obtaining necessary authorizations or reclassifications for our real estate assets; delays in or impossibility of obtaining regulatory authorizations, including those related to the environment, for the construction of new facilities, repowering or improvement of existing facilities; shortage of or changes in the price of equipment, material or labor; opposition of political or ethnic groups; adverse changes of a political or regulatory nature in the countries where we or our companies operate; adverse weather conditions, natural disasters, accidents or other unforeseen events; and the impossibility of obtaining financing at what we consider satisfactory interest rates.
Governmental and Political Factors: political conditions in Latin America; changes in Spanish, European and foreign laws, regulations and taxes.
Operating Factors: technical problems; changes in operating conditions and costs; capacity to execute cost-reduction plans; capacity to maintain a stable supply of coal, fuel and gas and the impact of price fluctuations of coal, fuel and gas; acquisitions or restructuring; capacity to successfully execute a strategy of internationalization and diversification.
Competitive Factors: the actions of competitors; changes in competition and pricing environments; the entry of new competitors in our markets.
Further details on the factors that may cause actual results and other developments to differ significantly from the expectations implied or explicitly contained in the presentation are given in the Risk Factors section of Form 20-F filed with the SEC and in the Registration Document of Endesa Stock filed with the Spanish National Securities Regulator.
No assurance can be given that the forward-looking statements in this document will be prove correct. Except as may be required by applicable law, neither Endesa nor any of its affiliates intends to update these forward-looking statements.
57
| ENDESA S.A. AND SUBSIDIARIES | |||||||||||||
| CONSOLIDATED BALANCE SHEETS | |||||||||||||
| AS OF DECEMBER 31, 2006 AND DECEMBER 31, 2005 | |||||||||||||
| (Unaudited) | |||||||||||||
Euro Million | |||||||||||||
ASSETS | 31.12.06 | 31.12.05 | Variation | ||||||||||
Total fixed assets | 46,380 | 45,742 | 638 | 1.39 | % | ||||||||
| Utility plant | 33,714 | 32,313 | 1,401 | 4.34 | % | ||||||||
| Investment property | 81 | 71 | 10 | 14.08 | % | ||||||||
| Intangible asset | 804 | 863 | (59 | ) | -6.84 | % | |||||||
| Goodwill | 3,986 | 4,278 | (292 | ) | -6.83 | % | |||||||
| Long term financial investments | 4,482 | 4,134 | 348 | 8.42 | % | ||||||||
| Investments in associates | 649 | 623 | 26 | 4.17 | % | ||||||||
| Deferred tax assets | 2,664 | 3,460 | (796 | ) | -23.01 | % | |||||||
Total current assets | 7,708 | 9,623 | (1,915 | ) | -19.90 | % | |||||||
| Inventories | 882 | 812 | 70 | 8.62 | % | ||||||||
| Trade and other receivables | 5,819 | 6,098 | (279 | ) | -4.58 | % | |||||||
| Short term financial investments | 39 | 77 | (38 | ) | -49.35 | % | |||||||
| Cash and cash equivalents | 965 | 2,614 | (1,649 | ) | -63.08 | % | |||||||
| Assets held for sale | 3 | 22 | (19 | ) | -86.36 | % | |||||||
TOTAL ASSETS | 54,088 | 55,365 | (1,277 | ) | -2.31 | % | |||||||
EQUITY AND LIABILITIES | 31.12.06 | 31.12.05 | Variation | ||||||||||
Total equity | 15,936 | 16,327 | (391 | ) | -2.39 | % | |||||||
| Atributtable to equity holders of the parent company | 11,291 | 11,590 | (299 | ) | -2.58 | % | |||||||
| Minority interest | 4,645 | 4,737 | (92 | ) | -1.94 | % | |||||||
Non-current liabilities | 30,007 | 28,630 | 1,377 | 4.81 | % | ||||||||
| Deferred revenues | 2,442 | 2,062 | 380 | 18.43 | % | ||||||||
| Preferred shares | 1,430 | 1,419 | 11 | 0.78 | % | ||||||||
| Long term provisions | 4,442 | 5,097 | (655 | ) | -12.85 | % | |||||||
| Long term financial debt | 19,057 | 17,168 | 1,889 | 11.00 | % | ||||||||
| Other non-current liabilities | 985 | 1,032 | (47 | ) | -4.55 | % | |||||||
| Deferred tax liabilities | 1,651 | 1,852 | (201 | ) | -10.85 | % | |||||||
Current liabilities | 8,145 | 10,408 | (2,263 | ) | -21.74 | % | |||||||
| Short term financial debt | 629 | 2,450 | (1,821 | ) | -74.33 | % | |||||||
| Trade and other payables | 7,516 | 7,958 | (442 | ) | -5.55 | % | |||||||
TOTAL EQUITY AND LIABILITIES | 54,088 | 55,365 | (1,277 | ) | -2.31 | % | |||||||
58
| ENDESA S.A. AND SUBSIDIARIES | |||||||||||||
| CONSOLIDATED STATEMENTS OF INCOME | |||||||||||||
| (Unaudited) | |||||||||||||
Euro Million | |||||||||||||
31.12.06 | 31.12.05 | Variation | |||||||||||
| REVENUES | 20,580 | 18,229 | 2,351 | 12.90 | % | ||||||||
| Sales | 19,637 | 17,508 | 2,129 | 12.16 | % | ||||||||
| Other operating revenues | 943 | 721 | 222 | 30.79 | % | ||||||||
| PURCHASES AND SERVICES | 10,146 | 9,103 | 1,043 | 11.46 | % | ||||||||
| Energy purchases | 3,943 | 3,367 | 576 | 17.11 | % | ||||||||
| Fuel procurement costs | 3,997 | 3,578 | 419 | 11.71 | % | ||||||||
| Transmission expenses | 738 | 651 | 87 | 13.36 | % | ||||||||
| Other variable purchases and services | 1,468 | 1,507 | (39 | ) | -2.59 | % | |||||||
| GROSS MARGIN | 10,434 | 9,126 | 1,308 | 14.33 | % | ||||||||
| Work performed by the entity and capitalized | 194 | 170 | 24 | 14.12 | % | ||||||||
| Personnel expenses | 1,608 | 1,547 | 61 | 3.94 | % | ||||||||
| Other fixed operating expenses | 1,881 | 1,729 | 152 | 8.79 | % | ||||||||
| GROSS OPERATING INCOME (EBITDA) | 7,139 | 6,020 | 1,119 | 18.59 | % | ||||||||
| Depreciation and amortization | 1,900 | 1,776 | 124 | 6.98 | % | ||||||||
| OPERATING INCOME (EBIT) | 5,239 | 4,244 | 995 | 23.44 | % | ||||||||
| FINANCIAL INCOME | (939 | ) | (1,252 | ) | 313 | -25.00 | % | ||||||
| Net financial expenses | (969 | ) | (1,257 | ) | 288 | -22.91 | % | ||||||
| Foreign exchanges | 30 | 5 | 25 | 500.00 | % | ||||||||
| Share of profit of associates | 63 | 67 | (4 | ) | -5.97 | % | |||||||
| Income from other investments | 10 | 2 | 8 | 400.00 | % | ||||||||
| Income from asset sales | 432 | 1,486 | (1,054 | ) | -70.93 | % | |||||||
| INCOME BEFORE TAXES | 4,805 | 4,547 | 258 | 5.67 | % | ||||||||
| Income tax | 1,007 | 790 | 217 | 27.47 | % | ||||||||
| PROFIT FOR THE PERIOD | 3,798 | 3,757 | 41 | 1.09 | % | ||||||||
| Attributable to the holders of the parent company | 2,969 | 3,182 | (213 | ) | -6.69 | % | |||||||
| Minority interest | 829 | 575 | 254 | 44.17 | % | ||||||||
Net income per share (expressed in euros) | 2.80 | 3.01 | -0.20 | -6.69 | % | ||||||||
59
| ENDESA S.A. AND SUBSIDIARIES | |||||||||||||
| CONSOLIDATED STATEMENTS OF INCOME | |||||||||||||
| (Unaudited) | |||||||||||||
4Q RESULTS | |||||||||||||
4Q 06 | 4Q 05 | Variation | |||||||||||
| REVENUES | 4,848 | 4,961 | (113 | ) | -2.28 | % | |||||||
| Sales | 4,790 | 4,865 | (75 | ) | -1.54 | % | |||||||
| Other operating revenues | 58 | 96 | (38 | ) | -39.58 | % | |||||||
| PURCHASES AND SERVICES | 2,233 | 2,333 | (100 | ) | -4.29 | % | |||||||
| Energy purchases | 1,029 | 727 | 302 | 41.54 | % | ||||||||
| Fuel procurement costs | 893 | 1,040 | (147 | ) | -14.13 | % | |||||||
| Transmission expenses | 185 | 175 | 10 | 5.71 | % | ||||||||
| Other variable purchases and services | 126 | 391 | (265 | ) | -67.77 | % | |||||||
| GROSS MARGIN | 2,615 | 2,628 | (13 | ) | -0.49 | % | |||||||
| Work performed by the entity and capitalized | 68 | 49 | 19 | 38.78 | % | ||||||||
| Personnel expenses | 458 | 512 | (54 | ) | -10.55 | % | |||||||
| Other fixed operating expenses | 565 | 544 | 21 | 3.86 | % | ||||||||
| GROSS OPERATING INCOME (EBITDA) | 1,660 | 1,621 | 39 | 2.41 | % | ||||||||
| Depreciation and amortization | 530 | 483 | 47 | 9.73 | % | ||||||||
| OPERATING INCOME (EBIT) | 1,130 | 1,138 | (8 | ) | -0.70 | % | |||||||
| FINANCIAL INCOME | (219 | ) | (504 | ) | 285 | -56.55 | % | ||||||
| Net financial expenses | (233 | ) | (443 | ) | 210 | -47.40 | % | ||||||
| Foreign exchanges | 14 | (61 | ) | 75 | 122.95 | % | |||||||
| Share of profit of associates | 3 | 2 | 1 | 50.00 | % | ||||||||
| Income from other investments | 1 | (6 | ) | 7 | 116.67 | % | |||||||
| Income from asset sales | (21 | ) | 1,279 | (1,300 | ) | -101.64 | % | ||||||
| INCOME BEFORE TAXES | 894 | 1,909 | (1,015 | ) | -53.17 | % | |||||||
| Income tax | 271 | 79 | 192 | 243.04 | % | ||||||||
| NET INCOME | 623 | 1,830 | (1,207 | ) | -65.96 | % | |||||||
| Attributable to the holders of the parent company | 461 | 1,626 | (1,165 | ) | -71.65 | % | |||||||
| Minority interest | 162 | 204 | (42 | ) | -20.59 | % | |||||||
60
| ENDESA S.A. AND SUBSIDIARIES | ||||||||||
| CONSOLIDATED STATEMENTS OF CASH FLOWS | ||||||||||
| (Unaudited) | ||||||||||
Euro Million | ||||||||||
31.12.06 | 31.12.05 | |||||||||
| Consolidated income before income taxes | 4,805 | 4,547 | ||||||||
| Amortization | 1,900 | 1,776 | ||||||||
| Income from asset sales | (432 | ) | (1,486 | ) | ||||||
| Income tax | (735 | ) | (650 | ) | ||||||
| Provisions payments | (805 | ) | (443 | ) | ||||||
| Other results without cash flow effect | (90 | ) | 465 | |||||||
Cash Flow from operating activities | 4,643 | 4,209 | ||||||||
| Change in deferred income tax | (322 | ) | 341 | |||||||
| Change in operating assets/liabilities | (443 | ) | (1,188 | ) | ||||||
Net cash provided by operating activities | 3,878 | 3,362 | ||||||||
| Acquisitions of fixed and intangible assets | (3,545 | ) | (3,247 | ) | ||||||
| Disposal of fixed and intangible assets | 409 | 183 | ||||||||
| Investments in stakes of subsidiaries | (181 | ) | (178 | ) | ||||||
| Disposal of stakes in subsidiaries | 249 | |||||||||
| Acquisitions of other investments | (2,189 | ) | (1,316 | ) | ||||||
| Disposal of other investments | 1,983 | 3,270 | ||||||||
| Cash flow from changes in perimeter | 48 | 9 | ||||||||
| Subsidies and other deferred income | 392 | 312 | ||||||||
Net cash used for investing activities | (3,083 | ) | (718 | ) | ||||||
| New long-term debt | 5,228 | 3,030 | ||||||||
| Repayment of long-term debt | (1,947 | ) | (1,737 | ) | ||||||
| Net cash from financial debt with short term maturity | (2,755 | ) | (2,366 | ) | ||||||
| Dividends paid by the controlling company | (2,541 | ) | (796 | ) | ||||||
| Dividends paid to minority shareholders | (226 | ) | (174 | ) | ||||||
| Other payments to minority shareholders | (167 | ) | (283 | ) | ||||||
Net cash used for financing activities | (2,408 | ) | (2,326 | ) | ||||||
Total net cash | (1,613 | ) | 318 | |||||||
| Effects of exchange rate changes on cash and cash equivalents | (36 | ) | 118 | |||||||
Net increase in cash and cash equivalents | (1,649 | ) | 436 | |||||||
Cash and cash equivalents at beginning of period | 2,614 | 2,178 | ||||||||
Cash and cash equivalents at end of period | 965 | 2,614 | ||||||||
61
ENDESA S.A. AND SUBSIDIARIES | ||||||||||
CONSOLIDATED STATEMENT OF RECOGNISED INCOME AND EXPENSE - 31 DECEMBER 2006 | ||||||||||
(Unaudited) | Euro Million | |||||||||
Of the Parent | Of Minority Interests | Total | ||||||||
NET PROFIT RECOGNISED DIRECTLY IN EQUITY | (503 | ) | (366 | ) | (869 | ) | ||||
| In assets and liability revaluation reserves | (81 | ) | (55 | ) | (136 | ) | ||||
| Available-for-sale investments | (170 | ) | (170 | ) | ||||||
| Cash flow hedge | 122 | (61 | ) | 61 | ||||||
| Tax effect | (39 | ) | 6 | (33 | ) | |||||
| Tax rate change effect | 6 | 6 | ||||||||
| In retained profit | (20 | ) | (20 | ) | ||||||
| Actuarial gains and losses in pensions | 24 | 24 | ||||||||
| Tax effect | (7 | ) | (7 | ) | ||||||
| Tax rate change effect | (37 | ) | (37 | ) | ||||||
| In translation differences | (402 | ) | (311 | ) | (713 | ) | ||||
| Gross translation differences | (402 | ) | (311 | ) | (713 | ) | ||||
PROFIT FOR THE PERIOD | 2,969 | 829 | 3,798 | |||||||
TOTAL INCOME AND EXPENSES RECOGNISED | 2,466 | 463 | 2,929 | |||||||
62
| CONSOLIDATED BALANCE SHEETS | |||||||||||||
| SPAIN AND PORTUGAL ELECTRICITY BUSINESS | |||||||||||||
(Unaudited) | Euro Million | ||||||||||||
ASSETS | 31.12.06 | 31.12.05 | Variation | ||||||||||
Total fixed assets | 26,330 | 24,507 | 1,823 | 7.44 | % | ||||||||
| Utility plant | 19,758 | 18,176 | 1,582 | 8.70 | % | ||||||||
| Investment property | 32 | 4 | 28 | 700.00 | % | ||||||||
| Intangible asset | 660 | 720 | (60 | ) | -8.33 | % | |||||||
| Goodwill | 61 | 148 | (87 | ) | -58.78 | % | |||||||
| Long term financial investments | 3,839 | 2,788 | 1,051 | 37.70 | % | ||||||||
| Investments in associates | 407 | 370 | 37 | 10.00 | % | ||||||||
| Deferred tax assets | 1,573 | 2,301 | (728 | ) | -31.64 | % | |||||||
Total current assets | 3,924 | 5,697 | (1,773 | ) | -31.12 | % | |||||||
| Inventories | 615 | 548 | 67 | 12.23 | % | ||||||||
| Trade and other receivables | 3,099 | 3,573 | (474 | ) | -13.27 | % | |||||||
| Short term financial investments | 35 | 22 | 13 | 59.09 | % | ||||||||
| Cash and cash equivalents | 175 | 1,532 | (1,357 | ) | -88.58 | % | |||||||
| Assets held for sale | 22 | (22 | ) | -100.00 | % | ||||||||
TOTAL ASSETS | 30,254 | 30,204 | 50 | 0.17 | % | ||||||||
EQUITY AND LIABILITIES | 31.12.06 | 31.12.05 | Variation | ||||||||||
Total equity | 5,980 | 6,037 | (57 | ) | -0.94 | % | |||||||
| Atributtable to equity holders of the parent company | 5,936 | 5,918 | 18 | 0.30 | % | ||||||||
| Minority interest | 44 | 119 | (75 | ) | -63.03 | % | |||||||
Non-current liabilities | 19,513 | 18,236 | 1,277 | 7.00 | % | ||||||||
| Deferred revenues | 2,185 | 1,799 | 386 | 21.46 | % | ||||||||
| Preferred shares | 1,430 | 1,419 | 11 | 0.78 | % | ||||||||
| Long term provisions | 3,407 | 3,800 | (393 | ) | -10.34 | % | |||||||
| Long term financial debt | 11,613 | 10,300 | 1,313 | 12.75 | % | ||||||||
| Other non-current liabilities | 444 | 400 | 44 | 11.00 | % | ||||||||
| Deferred tax liabilities | 434 | 518 | (84 | ) | -16.22 | % | |||||||
Current liabilities | 4,761 | 5,931 | (1,170 | ) | -19.73 | % | |||||||
| Short term financial debt | (9 | ) | 1,188 | (1,197 | ) | -100.76 | % | ||||||
| Trade and other payables | 4,770 | 4,743 | 27 | 0.57 | % | ||||||||
TOTAL EQUITY AND LIABILITIES | 30,254 | 30,204 | 50 | 0.17 | % | ||||||||
63
CONSOLIDATED STATEMENTS OF INCOME | |||||||||||||
SPAIN AND PORTUGAL ELECTRICITY BUSINESS | Euro Million | ||||||||||||
(Unaudited) | |||||||||||||
31.12.06 | 31.12.05 | Variation | |||||||||||
| REVENUES | 10,090 | 9,274 | 816 | 8.80 | % | ||||||||
| Sales | 9,520 | 8,761 | 759 | 8.66 | % | ||||||||
| Other operating revenues | 570 | 513 | 57 | 11.11 | % | ||||||||
| PURCHASES AND SERVICES | 4,231 | 4,072 | 159 | 3.90 | % | ||||||||
| Energy purchases | 995 | 875 | 120 | 13.71 | % | ||||||||
| Fuel procurement costs | 2,143 | 2,057 | 86 | 4.18 | % | ||||||||
| Transmission expenses | 365 | 273 | 92 | 33.70 | % | ||||||||
| Other variable purchases and services | 728 | 867 | (139 | ) | -16.03 | % | |||||||
| GROSS MARGIN | 5,859 | 5,202 | 657 | 12.63 | % | ||||||||
| Work performed by the entity and capitalized | 162 | 139 | 23 | 16.55 | % | ||||||||
| Personnel expenses | 1,062 | 1,041 | 21 | 2.02 | % | ||||||||
| Other fixed operating expenses | 1,124 | 1,034 | 90 | 8.70 | % | ||||||||
| GROSS OPERATING INCOME (EBITDA) | 3,835 | 3,266 | 569 | 17.42 | % | ||||||||
| Depreciation and amortization | 1,130 | 1,002 | 128 | 12.77 | % | ||||||||
| OPERATING INCOME (EBIT) | 2,705 | 2,264 | 441 | 19.48 | % | ||||||||
| FINANCIAL INCOME | (392 | ) | (609 | ) | 217 | -35.63 | % | ||||||
| Net financial expenses | (398 | ) | (602 | ) | 204 | -33.89 | % | ||||||
| Foreign exchanges | 6 | (7 | ) | 13 | 185.71 | % | |||||||
| Share of profit of associates | 53 | 44 | 9 | 20.45 | % | ||||||||
| Income from other investments | 6 | 6 | |||||||||||
| Income from asset sales | 214 | 96 | 118 | 122.92 | % | ||||||||
| INCOME BEFORE TAXES | 2,586 | 1,801 | 785 | 43.59 | % | ||||||||
| Income tax | 731 | 434 | 297 | 68.43 | % | ||||||||
| PROFIT FOR THE PERIOD | 1,855 | 1,367 | 488 | 35.70 | % | ||||||||
| Attributable to the holders of the parent company | 1,843 | 1,358 | 485 | 35.71 | % | ||||||||
| Minority interest | 12 | 9 | 3 | 33.33 | % | ||||||||
64
4Q CONSOLIDATED STATEMENTS OF INCOME | |||||||||||||
SPAIN AND PORTUGAL ELECTRICITY BUSINESS | |||||||||||||
(Unaudited) | Euro Million | ||||||||||||
4Q 06 | 4Q 05 | Variation | |||||||||||
| REVENUES | 2,280 | 2,623 | (343 | ) | -13.08 | % | |||||||
| Sales | 2,285 | 2,586 | (301 | ) | -11.64 | % | |||||||
| Other operating revenues | (5 | ) | 37 | (42 | ) | -113.51 | % | ||||||
| PURCHASES AND SERVICES | 760 | 1,080 | (320 | ) | -29.63 | % | |||||||
| Energy purchases | 228 | 226 | 2 | 0.88 | % | ||||||||
| Fuel procurement costs | 448 | 564 | (116 | ) | -20.57 | % | |||||||
| Transmission expenses | 93 | 97 | (4 | ) | -4.12 | % | |||||||
| Other variable purchases and services | (9 | ) | 193 | (202 | ) | -104.66 | % | ||||||
| GROSS MARGIN | 1,520 | 1,543 | (23 | ) | -1.49 | % | |||||||
| Work performed by the entity and capitalized | 57 | 39 | 18 | 46.15 | % | ||||||||
| Personnel expenses | 304 | 368 | (64 | ) | -17.39 | % | |||||||
| Other fixed operating expenses | 364 | 328 | 36 | 10.98 | % | ||||||||
| GROSS OPERATING INCOME (EBITDA) | 909 | 886 | 23 | 2.60 | % | ||||||||
| Depreciation and amortization | 316 | 256 | 60 | 23.44 | % | ||||||||
| OPERATING INCOME (EBIT) | 593 | 630 | (37 | ) | -5.87 | % | |||||||
| FINANCIAL INCOME | (67 | ) | (250 | ) | 183 | -73.20 | % | ||||||
| Net financial expenses | (74 | ) | (246 | ) | 172 | -69.92 | % | ||||||
| Foreign exchanges | 7 | (4 | ) | 11 | 275.00 | % | |||||||
| Share of profit of associates | 2 | (2 | ) | -100.00 | % | ||||||||
| Income from other investments | (2 | ) | 4 | (6 | ) | -150.00 | % | ||||||
| Income from asset sales | (4 | ) | (6 | ) | 2 | 33.33 | % | ||||||
| INCOME BEFORE TAXES | 520 | 380 | 140 | 36.84 | % | ||||||||
| Income tax | 177 | 70 | 107 | 152.86 | % | ||||||||
| NET INCOME | 343 | 310 | 33 | 10.65 | % | ||||||||
| Attributable to the holders of the parent company | 340 | 307 | 33 | 10.75 | % | ||||||||
| Minority interest | 3 | 3 | |||||||||||
65
| STATEMENTS OF CASH FLOWS | ||||||||||
| SPAIN AND PORTUGAL ELECTRICITY BUSINESS | ||||||||||
| (Unaudited) | Euro Million | |||||||||
31.12.06 | 31.12.05 | |||||||||
| Consolidated income before income taxes | 2,586 | 1,801 | ||||||||
| Amortization | 1,130 | 1,002 | ||||||||
| Income from asset sales | (214 | ) | (96 | ) | ||||||
| Income tax | (165 | ) | 29 | |||||||
| Provisions payments | (598 | ) | (399 | ) | ||||||
| Other results without cash flow effect | (18 | ) | 332 | |||||||
Cash Flow from operating activities | 2,721 | 2,669 | ||||||||
| Change in deferred income tax | (212 | ) | (208 | ) | ||||||
| Change in operating assets/liabilities | (199 | ) | (1,222 | ) | ||||||
Net cash provided by operating activities | 2,310 | 1,239 | ||||||||
| Acquisitions of fixed and intangible assets | (2,363 | ) | (2,301 | ) | ||||||
| Disposal of fixed and intangible assets | 305 | 149 | ||||||||
| Investments in stakes of subsidiaries | (7 | ) | (151 | ) | ||||||
| Acquisitions of other investments | (2,033 | ) | (980 | ) | ||||||
| Disposal of other investments | 1,860 | 15 | ||||||||
| Cash flow from change in perimeter | 9 | |||||||||
| Subsidies and other deferred income | 349 | 298 | ||||||||
Net cash used for investing activities | (1,889 | ) | (2,961 | ) | ||||||
| New long-term debt | 2,898 | 1,193 | ||||||||
| Repayment of long-term debt | (1,029 | ) | 2,133 | |||||||
| Net cash from financial debt with short term maturity | (1,712 | ) | (1,501 | ) | ||||||
| Dividends paid by the controlling company | (2,241 | ) | 132 | |||||||
| Dividends paid to minority shareholders | (2 | ) | (9 | ) | ||||||
| Other payments to minority shareholders | (70 | ) | ||||||||
Net cash used for financing activities | (2,156 | ) | 1,948 | |||||||
Total net cash | (1,735 | ) | 226 | |||||||
Net increase in cash and cash equivalents | (1,735 | ) | 226 | |||||||
Cash and cash equivalents at beginning of period | 1,910 | 1,306 | ||||||||
Cash and cash equivalents at end of period | 175 | 1,532 | ||||||||
66
| CONSOLIDATED BALANCE SHEETS | ||||||||||||||||
| EUROPE ELECTRICITY BUSINESS | ||||||||||||||||
| (Unaudited) | Euro Million | |||||||||||||||
ASSETS | 31.12.06 | 31.12.05 | Variation | |||||||||||||
Total fixed assets | 6,068 | 5,692 | 376 | 6.61 | % | |||||||||||
| Utility plant | 3,872 | 3,572 | 300 | 8.40 | % | |||||||||||
| Intangible asset | 66 | 74 | (8 | ) | -10.81 | % | ||||||||||
| Goodwill | 1,653 | 1,471 | 182 | 12.37 | % | |||||||||||
| Endesa Italia | 1,387 | 1,293 | 94 | 7.27 | % | |||||||||||
| Snet | 201 | 178 | 23 | 12.92 | % | |||||||||||
| CE Teverola | 34 | 34 | N/A | |||||||||||||
| CE Ferrara | 27 | 27 | N/A | |||||||||||||
| PE Monte Cute | 2 | 2 | N/A | |||||||||||||
| PE Marco Aurelio | 2 | 2 | N/A | |||||||||||||
| Long term financial investments | 89 | 151 | (62 | ) | -41.06 | % | ||||||||||
| Investments in associates | 81 | 78 | 3 | 3.85 | % | |||||||||||
| Deferred tax assets | 307 | 346 | (39 | ) | -11.27 | % | ||||||||||
Total current assets | 1,171 | 1,145 | 26 | 2.27 | % | |||||||||||
| Inventories | 176 | 150 | 26 | 17.33 | % | |||||||||||
| Trade and other receivables | 862 | 868 | (6 | ) | -0.69 | % | ||||||||||
| Short term financial investments | 1 | 1 | N/A | |||||||||||||
| Cash and cash equivalents | 132 | 127 | 5 | 3.94 | % | |||||||||||
TOTAL ASSETS | 7,239 | 6,837 | 402 | 5.88 | % | |||||||||||
EQUITY AND LIABILITIES | 31.12.06 | 31.12.05 | Variation | ||||||||||
Total equity | 3,292 | 2,834 | 458 | 16.16 | % | ||||||||
| Atributtable to equity holders of the parent company | 2,333 | 1,979 | 354 | 17.89 | % | ||||||||
| Minority interest | 959 | 855 | 104 | 12.16 | % | ||||||||
Non-current liabilities | 2,757 | 2,704 | 53 | 1.96 | % | ||||||||
| Deferred revenues | 116 | 148 | (32 | ) | -21.62 | % | |||||||
| Long term provisions | 274 | 342 | (68 | ) | -19.88 | % | |||||||
| Long term financial debt | 1,643 | 1,390 | 253 | 18.20 | % | ||||||||
| Other non-current liabilities | 427 | 503 | (76 | ) | -15.11 | % | |||||||
| Deferred tax liabilities | 297 | 321 | (24 | ) | -7.48 | % | |||||||
Current liabilities | 1,190 | 1,299 | (109 | ) | -8.39 | % | |||||||
| Short term financial debt | 163 | 23 | 140 | 608.70 | % | ||||||||
| Trade and other payables | 1,027 | 1,276 | (249 | ) | -19.51 | % | |||||||
TOTAL EQUITY AND LIABILITIES | 7,239 | 6,837 | 402 | 5.88 | % | ||||||||
67
CONSOLIDATED STATEMENTS OF INCOME | |||||||||||||
EUROPEAN ELECTRICITY BUSINESS | Euro Million | ||||||||||||
(Unaudited) | |||||||||||||
31.12.06 | 31.12.05 | Variation | |||||||||||
| REVENUES | 4,411 | 3,720 | 691 | 18.58 | % | ||||||||
| Sales | 4,190 | 3,598 | 592 | 16.45 | % | ||||||||
| Other operating revenues | 221 | 122 | 99 | 81.15 | % | ||||||||
| PURCHASES AND SERVICES | 2,945 | 2,497 | 448 | 17.94 | % | ||||||||
| Energy purchases | 1,219 | 1,087 | 132 | 12.14 | % | ||||||||
| Fuel procurement costs | 1,447 | 1,189 | 258 | 21.70 | % | ||||||||
| Transmission expenses | 10 | 10 | |||||||||||
| Other variable purchases and services | 269 | 211 | 58 | 27.49 | % | ||||||||
| GROSS MARGIN | 1,466 | 1,223 | 243 | 19.87 | % | ||||||||
| Work performed by the entity and capitalized | 4 | 9 | (5 | ) | �� | -55.56 | % | ||||||
| Personnel expenses | 149 | 161 | (12 | ) | -7.45 | % | |||||||
| Other fixed operating expenses | 205 | 184 | 21 | 11.41 | % | ||||||||
| GROSS OPERATING INCOME (EBITDA) | 1,116 | 887 | 229 | 25.82 | % | ||||||||
| Depreciation and amortization | 270 | 269 | 1 | 0.37 | % | ||||||||
| OPERATING INCOME (EBIT) | 846 | 618 | 228 | 36.89 | % | ||||||||
| FINANCIAL INCOME | (56 | ) | (64 | ) | 8 | -12.50 | % | ||||||
| Net financial expenses | (58 | ) | (63 | ) | 5 | -7.94 | % | ||||||
| Foreign exchanges | 2 | (1 | ) | 3 | 300.00 | % | |||||||
| Share of profit of associates | 1 | 9 | (8 | ) | -88.89 | % | |||||||
| Income from asset sales | 1 | 84 | (83 | ) | -98.81 | % | |||||||
| INCOME BEFORE TAXES | 792 | 647 | 145 | 22.41 | % | ||||||||
| Income tax | 157 | 104 | 53 | 50.96 | % | ||||||||
| PROFIT FOR THE PERIOD | 635 | 543 | 92 | 16.94 | % | ||||||||
| Attributable to the holders of the parent company | 493 | 425 | 68 | 16.00 | % | ||||||||
| Minority interest | 142 | 118 | 24 | 20.34 | % | ||||||||
68
4Q CONSOLIDATED STATEMENTS OF INCOME | |||||||||||||
EUROPEAN ELECTRICITY BUSINESS | |||||||||||||
(Unaudited) | Euro Million | ||||||||||||
4Q 06 | 4Q 05 | Variation | |||||||||||
| REVENUES | 1,078 | 836 | 242 | 28.95 | % | ||||||||
| Sales | 1,077 | 800 | 277 | 34.63 | % | ||||||||
| Other operating revenues | 1 | 36 | (35 | ) | -97.22 | % | |||||||
| PURCHASES AND SERVICES | 749 | 557 | 192 | 34.47 | % | ||||||||
| Energy purchases | 348 | 123 | 225 | 182.93 | % | ||||||||
| Fuel procurement costs | 376 | 367 | 9 | 2.45 | % | ||||||||
| Transmission expenses | 3 | (9 | ) | 12 | 133.33 | % | |||||||
| Other variable purchases and services | 22 | 76 | (54 | ) | -71.05 | % | |||||||
| GROSS MARGIN | 329 | 279 | 50 | 17.92 | % | ||||||||
| Work performed by the entity and capitalized | 2 | 3 | (1 | ) | -33.33 | % | |||||||
| Personnel expenses | 39 | 44 | (5 | ) | -11.36 | % | |||||||
| Other fixed operating expenses | 66 | 53 | 13 | 24.53 | % | ||||||||
| GROSS OPERATING INCOME (EBITDA) | 226 | 185 | 41 | 22.16 | % | ||||||||
| Depreciation and amortization | 73 | 82 | (9 | ) | -10.98 | % | |||||||
| OPERATING INCOME (EBIT) | 153 | 103 | 50 | 48.54 | % | ||||||||
| FINANCIAL INCOME | (20 | ) | (20 | ) | |||||||||
| Net financial expenses | (20 | ) | (19 | ) | (1 | ) | 5.26 | % | |||||
| Foreign exchange | (1 | ) | 1 | 100.00 | % | ||||||||
| Share of profit of associates | 2 | 2 | N/A | ||||||||||
| Income from asset sales | 1 | 1 | N/A | ||||||||||
| INCOME BEFORE TAXES | 136 | 83 | 53 | 63.86 | % | ||||||||
| Income tax | 51 | (97 | ) | 148 | 152.58 | % | |||||||
| NET INCOME | 85 | 180 | (95 | ) | -52.78 | % | |||||||
| Attributable to the holders of the parent company | 67 | 142 | (75 | ) | -52.82 | % | |||||||
| Minority interest | 18 | 38 | (20 | ) | -52.63 | % | |||||||
69
| STATEMENTS OF CASH FLOWS | ||||||||||
| EUROPE ELECTRICITY BUSINESS | ||||||||||
| (Unaudited) | Euro Million | |||||||||
31.12.06 | 31.12.05 | |||||||||
| Consolidated income before income taxes | 792 | 647 | ||||||||
| Amortization | 270 | 269 | ||||||||
| Income from asset sales | (1 | ) | (84 | ) | ||||||
| Income tax | (244 | ) | (241 | ) | ||||||
| Provisions payments | (39 | ) | (6 | ) | ||||||
| Other results without cash flow effect | (74 | ) | 1 | |||||||
Cash Flow from operating activities | 704 | 586 | ||||||||
| Change in deferred income tax | (137 | ) | 210 | |||||||
| Change in operating assets/liabilities | (251 | ) | 186 | |||||||
Net cash provided by operating activities | 316 | 982 | ||||||||
| Acquisitions of fixed and intangible assets | (298 | ) | (364 | ) | ||||||
| Disposal of fixed and intangible assets | 3 | 2 | ||||||||
| Investments in stakes of subsidiaries | (174 | ) | (10 | ) | ||||||
| Disposal of stakes in subsidiaries | 159 | |||||||||
| Disposal of other investments | 114 | 203 | ||||||||
| Acquisitions of other investments | (106 | ) | (15 | ) | ||||||
| Cash flow from changes in perimeter | 48 | |||||||||
Net cash used for investing activities | (413 | ) | (25 | ) | ||||||
| New long-term debt | 845 | 1,174 | ||||||||
| Repayment of long-term debt | (582 | ) | (1,567 | ) | ||||||
| Net cash from financial debt with short term maturity | 88 | (375 | ) | |||||||
| Dividends paid by the controlling company | (187 | ) | (95 | ) | ||||||
| Dividends paid to minority shareholders | (62 | ) | (28 | ) | ||||||
Net cash used for financing activities | 102 | (891 | ) | |||||||
Total net cash | 5 | 66 | ||||||||
| Net increase in cash and cash equivalents | 5 | 66 | ||||||||
Cash and cash equivalents at beginning of period | 127 | 61 | ||||||||
Cash and cash equivalents at end of period | 132 | 127 | ||||||||
70
CONSOLIDATED BALANCE SHEETS | |||||||||||||
LATIN AMERICAN ELECTRICITY BUSINESS | |||||||||||||
(Unaudited) | |||||||||||||
Euro Million | |||||||||||||
ASSETS | 31.12.06 | 31.12.05 | Variation | ||||||||||
Total fixed assets | 13,982 | 14,755 | (773 | ) | -5.24 | % | |||||||
| Utility plant | 10,084 | 10,565 | (481 | ) | -4.55 | % | |||||||
| Investment property | 49 | 67 | (18 | ) | -26.87 | % | |||||||
| Intangible asset | 78 | 69 | 9 | 13.04 | % | ||||||||
| Goodwill | 2,272 | 2,659 | (387 | ) | -14.55 | % | |||||||
| Long term financial investments | 554 | 574 | (20 | ) | -3.48 | % | |||||||
| Investments in associates | 161 | 167 | (6 | ) | -3.59 | % | |||||||
| Deferred tax assets | 784 | 654 | 130 | 19.88 | % | ||||||||
Total current assets | 2,613 | 2,381 | 232 | 9.74 | % | ||||||||
| Inventories | 91 | 114 | (23 | ) | -20.18 | % | |||||||
| Trade and other receivables | 1,858 | 1,635 | 223 | 13.64 | % | ||||||||
| Short term financial investments | 3 | 55 | (52 | ) | -94.55 | % | |||||||
| Cash and cash equivalents | 658 | 577 | 81 | 14.04 | % | ||||||||
| Assets held for sale | 3 | 3 | N/A | ||||||||||
TOTAL ASSETS | 16,595 | 17,136 | (541 | ) | -3.16 | % | |||||||
EQUITY AND LIABILITIES | 31.12.06 | 31.12.05 | Variation | ||||||||||
Total equity | 6,664 | 6,927 | (263 | ) | -3.80 | % | |||||||
| Atributtable to equity holders of the parent company | 3,022 | 3,164 | (142 | ) | -4.49 | % | |||||||
| Minority interest | 3,642 | 3,763 | (121 | ) | -3.22 | % | |||||||
Non-current liabilities | 7,737 | 7,589 | 148 | 1.95 | % | ||||||||
| Deferred revenues | 141 | 115 | 26 | 22.61 | % | ||||||||
| Long term provisions | 761 | 890 | (129 | ) | -14.49 | % | |||||||
| Long term financial debt | 5,801 | 5,478 | 323 | 5.90 | % | ||||||||
| Other non-current liabilities | 114 | 122 | (8 | ) | -6.56 | % | |||||||
| Deferred tax liabilities | 920 | 984 | (64 | ) | -6.50 | % | |||||||
Current liabilities | 2,194 | 2,620 | (426 | ) | -16.26 | % | |||||||
| Short term financial debt | 475 | 1,208 | (733 | ) | -60.68 | % | |||||||
| Trade and other payables | 1,719 | 1,412 | 307 | 21.74 | % | ||||||||
TOTAL EQUITY AND LIABILITIES | 16,595 | 17,136 | (541 | ) | -3.16 | % | |||||||
71
CONSOLIDATED STATEMENTS OF INCOME | |||||||||||||
LATIN AMERICA ELECTRICITY BUSINESS | Euro Million | ||||||||||||
(Unaudited) | |||||||||||||
31.12.06 | 31.12.05 | Variation | |||||||||||
| REVENUES | 6,079 | 5,232 | 847 | 16.19 | % | ||||||||
| Sales | 5,927 | 5,149 | 778 | 15.11 | % | ||||||||
| Other operating revenues | 152 | 83 | 69 | 83.13 | % | ||||||||
| PURCHASES AND SERVICES | 2,970 | 2,534 | 436 | 17.21 | % | ||||||||
| Energy purchases | 1,729 | 1,405 | 324 | 23.06 | % | ||||||||
| Fuel procurement costs | 407 | 332 | 75 | 22.59 | % | ||||||||
| Transmission expenses | 363 | 368 | (5 | ) | (1.36 | %) | |||||||
| Other variable purchases and services | 471 | 429 | 42 | 9.79 | % | ||||||||
| GROSS MARGIN | 3,109 | 2,698 | 411 | 15.23 | % | ||||||||
| Work performed by the entity and capitalized | 28 | 22 | 6 | 27.27 | % | ||||||||
| Personnel expenses | 397 | 337 | 60 | 17.80 | % | ||||||||
| Other fixed operating expenses | 552 | 505 | 47 | 9.31 | % | ||||||||
| GROSS OPERATING INCOME (EBITDA) | 2,188 | 1,878 | 310 | 16.51 | % | ||||||||
| Depreciation and amortization | 500 | 502 | (2 | ) | (0.40 | %) | |||||||
| OPERATING INCOME (EBIT) | 1,688 | 1,376 | 312 | 22.67 | % | ||||||||
| FINANCIAL INCOME | (491 | ) | (524 | ) | 33 | (6.30 | %) | ||||||
| Net financial expenses | (513 | ) | (540 | ) | 27 | (5.00 | %) | ||||||
| Foreign exchange | 22 | 16 | 6 | 37.50 | % | ||||||||
| Share of profit of associates | 9 | 6 | 3 | 50.00 | % | ||||||||
| Income from other investments | 4 | 6 | (2 | ) | (33.33 | %) | |||||||
| Income from asset sales | 21 | 14 | 7 | 50.00 | % | ||||||||
| INCOME BEFORE TAXES | 1,231 | 878 | 353 | 40.21 | % | ||||||||
| Income tax | 94 | 168 | (74 | ) | (44.05 | %) | |||||||
| PROFIT FOR THE PERIOD | 1,137 | 710 | 427 | 60.14 | % | ||||||||
| Attributable to the holders of the parent company | 462 | 262 | 200 | 76.34 | % | ||||||||
| Minority interest | 675 | 448 | 227 | 50.67 | % | ||||||||
72
4Q CONSOLIDATED STATEMENTS OF INCOME | |||||||||||||
LATIN AMERICA ELECTRICITY BUSINESS | |||||||||||||
(Unaudited) | Euro Million | ||||||||||||
4Q 06 | 4Q 05 | Variation | |||||||||||
| REVENUES | 1,490 | 1,501 | (11 | ) | -0.73 | % | |||||||
| Sales | 1,428 | 1,479 | (51 | ) | -3.45 | % | |||||||
| Other operating revenues | 62 | 22 | 40 | 181.82 | % | ||||||||
| PURCHASES AND SERVICES | 724 | 696 | 28 | 4.02 | % | ||||||||
| Energy purchases | 453 | 378 | 75 | 19.84 | % | ||||||||
| Fuel procurement costs | 69 | 109 | (40 | ) | -36.70 | % | |||||||
| Transmission expenses | 89 | 87 | 2 | 2.30 | % | ||||||||
| Other variable purchases and services | 113 | 122 | (9 | ) | -7.38 | % | |||||||
| GROSS MARGIN | 766 | 805 | (39 | ) | -4.84 | % | |||||||
| Work performed by the entity and capitalized | 9 | 7 | 2 | 28.57 | % | ||||||||
| Personnel expenses | 115 | 97 | 18 | 18.56 | % | ||||||||
| Other fixed operating expenses | 135 | 160 | (25 | ) | -15.63 | % | |||||||
| GROSS OPERATING INCOME (EBITDA) | 525 | 555 | (30 | ) | -5.41 | % | |||||||
| Depreciation and amortization | 141 | 143 | (2 | ) | -1.40 | % | |||||||
| OPERATING INCOME (EBIT) | 384 | 412 | (28 | ) | -6.80 | % | |||||||
| FINANCIAL INCOME | (132 | ) | (234 | ) | 102 | -43.59 | % | ||||||
| Net financial expenses | (139 | ) | (178 | ) | 39 | -21.91 | % | ||||||
| Foreign exchange | 7 | (56 | ) | 63 | 112.50 | % | |||||||
| Share of profit of associates | 1 | 1 | N/A | ||||||||||
| Income from other investments | 3 | 2 | 1 | 50.00 | % | ||||||||
| Income from asset sales | (18 | ) | 11 | (29 | ) | -263.64 | % | ||||||
| INCOME BEFORE TAXES | 238 | 191 | 47 | 24.61 | % | ||||||||
| Income tax | 43 | (48 | ) | 91 | -189.58 | % | |||||||
| NET INCOME | 195 | 239 | (44 | ) | -18.41 | % | |||||||
| Attributable to the holders of the parent company | 54 | 76 | (22 | ) | -28.95 | % | |||||||
| Minority interest | 141 | 163 | (22 | ) | -13.50 | % | |||||||
73
| STATEMENTS OF CASH FLOWS | ||||||||||
LATIN AMERICA ELECTRICITY BUSINESS | ||||||||||
| (Unaudited) | Euro Million | |||||||||
31.12.06 | 31.12.05 | |||||||||
| Consolidated income before income taxes | 1,231 | 878 | ||||||||
| Amortization | 500 | 502 | ||||||||
| Income from asset sales | (21 | ) | (14 | ) | ||||||
| Income tax | (326 | ) | (271 | ) | ||||||
| Provisions payments | (168 | ) | (38 | ) | ||||||
| Other results without cash flow effect | 2 | 123 | ||||||||
Cash Flow from operating activities | 1,218 | 1,180 | ||||||||
| Change in deferred income tax | 27 | 172 | ||||||||
| Change in operating assets/liabilities | 6 | (46 | ) | |||||||
Net cash provided by operating activities | 1,251 | 1,306 | ||||||||
| Acquisitions of fixed and intangible assets | (884 | ) | (581 | ) | ||||||
| Disposal of fixed and intangible assets | 101 | 32 | ||||||||
| Acquisiton of subsidiaries' stakes | (17 | ) | ||||||||
| Acquisitions of other investments | (70 | ) | (91 | ) | ||||||
| Disposal of other investments | 29 | 40 | ||||||||
| Subsidies and other deferred income | 43 | 14 | ||||||||
Net cash used for investing activities | (781 | ) | (603 | ) | ||||||
| New long-term debt | 1,485 | 569 | ||||||||
| Repayment of long-term debt | (336 | ) | (597 | ) | ||||||
| Net cash from financial debt with short term maturity | (1,131 | ) | (494 | ) | ||||||
| Dividends paid by the controlling company | (113 | ) | (113 | ) | ||||||
| Payments to minority shareholders | (162 | ) | (137 | ) | ||||||
| Other payments to minority shareholders | (97 | ) | (283 | ) | ||||||
Net cash used for financing activities | (354 | ) | (1,055 | ) | ||||||
Total net cash | 116 | (352 | ) | |||||||
| Effects of exchange rate changes on cash and cash equivalents | (35 | ) | 118 | |||||||
Net increase in cash and cash equivalents | 81 | (234 | ) | |||||||
Cash and cash equivalents at beginning of period | 577 | 811 | ||||||||
Cash and cash equivalents at end of period | 658 | 577 | ||||||||
74
CONSOLIDATED STATEMENTS OF INCOME | ||||||||||
OTHER BUSINESSES | Euro Million | |||||||||
(Unaudited) | ||||||||||
31.12.06 | 31.12.05 | Variation | ||||||||
| REVENUES | 3 | (3 | ) | |||||||
| Sales | ||||||||||
| Other operating revenues | 3 | (3 | ) | |||||||
| PURCHASES AND SERVICES | ||||||||||
| Energy purchases | ||||||||||
| Fuel procurement costs | ||||||||||
| Transmission expenses | ||||||||||
| Other variable purchases and services | ||||||||||
| GROSS MARGIN | 3 | (3 | ) | |||||||
| Work performed by the entity and capitalized | ||||||||||
| Personnel expenses | 8 | (8 | ) | |||||||
| Other fixed operating expenses | 6 | (6 | ) | |||||||
| GROSS OPERATING INCOME (EBITDA) | (11 | ) | 11 | |||||||
| Depreciation and amortization | 3 | (3 | ) | |||||||
| OPERATING INCOME (EBIT) | (14 | ) | 14 | |||||||
| FINANCIAL INCOME | (55 | ) | 55 | |||||||
| Net financial expenses | (52 | ) | 52 | |||||||
| Foreign exchanges | (3 | ) | 3 | |||||||
| Share of profit of associates | 8 | (8 | ) | |||||||
| Income from other investments | (10 | ) | 10 | |||||||
| Income from asset sales | 196 | 1,292 | (1,096 | ) | ||||||
| INCOME BEFORE TAXES | 196 | 1,221 | (1,025 | ) | ||||||
| Income tax | 25 | 84 | (59 | ) | ||||||
| PROFIT FOR THE PERIOD | 171 | 1,137 | (966 | ) | ||||||
| Attributable to the holders of the parent company | 171 | 1,137 | (966 | ) | ||||||
| Minority interest | ||||||||||
75
| Consolidated Balance Sheet Spain & Portugal by business line for the period ended December 31, 2006 | |||||||||||||
(Unaudited) | Euro Million | ||||||||||||
| ASSETS | Generation & Supply | Distribution | Corporate Structure, Services & Adjustments | Electricity Business Spain & Portugal | |||||||||
Total fixed assets | 12,897 | 10,990 | 2,443 | 26,330 | |||||||||
| Utility plant | 9,779 | 9,544 | 435 | 19,758 | |||||||||
| Investment property | 29 | 3 | 32 | ||||||||||
| Intagible asset | 459 | 145 | 56 | 660 | |||||||||
| Goodwill | 61 | 61 | |||||||||||
| Long term financial investments | 1,565 | 419 | 1,855 | 3,839 | |||||||||
| Investments in associates | 353 | 57 | (3 | ) | 407 | ||||||||
| Deferred tax assets | 680 | 796 | 97 | 1,573 | |||||||||
Total current assets | 2,406 | 1,671 | (153 | ) | 3,924 | ||||||||
| Inventories | 590 | 25 | 615 | ||||||||||
| Cash and cash equivalents | 131 | 16 | 28 | 175 | |||||||||
| Other current assets | 1,685 | 1,630 | (181 | ) | 3,134 | ||||||||
TOTAL ASSETS | 15,303 | 12,661 | 2,290 | 30,254 | |||||||||
EQUITY AND LIABILITIES | |||||||||||||
Total equity | 4,297 | 1,932 | (249 | ) | 5,980 | ||||||||
| Atributtable to equity holders of the parent company | 4,271 | 1,918 | (253 | ) | 5,936 | ||||||||
| Minority interest | 26 | 14 | 4 | 44 | |||||||||
Non-current liabilities | 7,808 | 8,451 | 3,254 | 19,513 | |||||||||
| Deferred revenues | 82 | 2,130 | (27 | ) | 2,185 | ||||||||
| Preferred shares | 1,430 | 1,430 | |||||||||||
| Long term provisions | 1,538 | 1,567 | 302 | 3,407 | |||||||||
| Long term financial debt | 5,834 | 4,341 | 1,438 | 11,613 | |||||||||
| Other non-current liabilities | 116 | 317 | 11 | 444 | |||||||||
| Deferred tax liabilities | 238 | 96 | 100 | 434 | |||||||||
Current liabilities | 3,198 | 2,278 | (715 | ) | 4,761 | ||||||||
| Short term financial debt | 51 | 162 | (222 | ) | (9 | ) | |||||||
| Trade and other payables | 3,147 | 2,116 | (493 | ) | 4,770 | ||||||||
TOTAL EQUITY AND LIABILITIES | 15,303 | 12,661 | 2,290 | 30,254 | |||||||||
76
Consolidated Balance Sheet Spain & Portugal by business line for the period ended December 31, 2005 | |||||||||||||
Euro Million | |||||||||||||
Generation & | Corporate Structure, | Electricity Business | |||||||||||
ASSETS | Supply | Distribution | Services & Adjustments | Spain & Portugal | |||||||||
Total fixed assets | 11,858 | 10,220 | 2,429 | 24,507 | |||||||||
| Utility plant | 9,153 | 8,592 | 431 | 18,176 | |||||||||
| Investment property | 4 | 4 | |||||||||||
| Intagible asset | 539 | 142 | 39 | 720 | |||||||||
| Goodwill | 148 | 148 | |||||||||||
| Long term financial investments | 841 | 379 | 1,568 | �� | 2,788 | ||||||||
| Investments in associates | 273 | 11 | 86 | 370 | |||||||||
| Deferred tax assets | 904 | 1,092 | 305 | 2,301 | |||||||||
Total current assets | 4,237 | 2,003 | (543 | ) | 5,697 | ||||||||
| Inventories | 534 | 19 | (5 | ) | 548 | ||||||||
| Cash and cash equivalents | 121 | 25 | 1,386 | 1,532 | |||||||||
| Other current assets | 3,582 | 1,937 | (1,924 | ) | 3,595 | ||||||||
| Assets held for sale | 22 | 22 | |||||||||||
TOTAL ASSETS | 16,095 | 12,223 | 1,886 | 30,204 | |||||||||
EQUITY AND LIABILITIES | |||||||||||||
Total equity | 4,448 | 1,733 | (144 | ) | 6,037 | ||||||||
| Atributtable to equity holders of the parent company | 4,430 | 1,723 | (235 | ) | 5,918 | ||||||||
| Minority interest | 18 | 10 | 91 | 119 | |||||||||
Non-current liabilities | 6,051 | 8,359 | 3,826 | 18,236 | |||||||||
| Deferred revenues | 86 | 1,720 | (7 | ) | 1,799 | ||||||||
| Preferred shares | 1,419 | 1,419 | |||||||||||
| Long term provisions | 1,608 | 1,874 | 318 | 3,800 | |||||||||
| Long term financial debt | 4,008 | 4,374 | 1,918 | 10,300 | |||||||||
| Other non-current liabilities | 108 | 293 | (1 | ) | 400 | ||||||||
| Deferred tax liabilities | 241 | 98 | 179 | 518 | |||||||||
Current liabilities | 5,596 | 2,131 | (1,796 | ) | 5,931 | ||||||||
| Short term financial debt | 554 | 205 | 429 | 1,188 | |||||||||
| Trade and other payables | 5,042 | 1,926 | (2,225 | ) | 4,743 | ||||||||
TOTAL EQUITY AND LIABILITIES | 16,095 | 12,223 | 1,886 | 30,204 | |||||||||
77
Consolidated Statement of Income Spain & Portugal by business line for the period ended December 31, 2006 | |||||||||||||
(Unaudited) | Euro Million | ||||||||||||
Generation & | Corporate Structure, | Electricity Business | |||||||||||
Supply | Distribution | Services & Adjustments | Spain & Portugal | ||||||||||
REVENUES | 8,700 | 2,166 | (776 | ) | 10,090 | ||||||||
Sales | 8,272 | 2,016 | (768 | ) | 9,520 | ||||||||
Other operating revenues | 428 | 150 | (8 | ) | 570 | ||||||||
PURCHASES AND SERVICES | 4,846 | 187 | (802 | ) | 4,231 | ||||||||
Energy purchases | 1,130 | 4 | (139 | ) | 995 | ||||||||
Fuel procurement costs | 2,143 | 2,143 | |||||||||||
Transmission expenses | 961 | (596 | ) | 365 | |||||||||
Other variable purchases and services | 612 | 183 | (67 | ) | 728 | ||||||||
GROSS MARGIN | 3,854 | 1,979 | 26 | 5,859 | |||||||||
Work performed by the entity and capitalized | 16 | 127 | 19 | 162 | |||||||||
Personnel expenses | 388 | 485 | 189 | 1,062 | |||||||||
Other fixed operating expenses | 772 | 510 | (158 | ) | 1,124 | ||||||||
GROSS OPERATING INCOME (EBITDA) | 2,710 | 1,111 | 14 | 3,835 | |||||||||
Depreciation and amortization | 680 | 431 | 19 | 1,130 | |||||||||
OPERATING INCOME (EBIT) | 2,030 | 680 | (5 | ) | 2,705 | ||||||||
FINANCIAL INCOME | (159 | ) | (180 | ) | (53 | ) | (392 | ) | |||||
Net financial expenses | (154 | ) | (180 | ) | (64 | ) | (398 | ) | |||||
Foreign exchanges | (5 | ) | 11 | 6 | |||||||||
Share of profit of associates | 50 | 3 | 53 | ||||||||||
Income from other investments | (2 | ) | 2 | 6 | 6 | ||||||||
Income from asset sales | 21 | 261 | (68 | ) | 214 | ||||||||
INCOME BEFORE TAXES | 1,940 | 766 | (120 | ) | 2,586 | ||||||||
Income tax | 568 | 230 | (67 | ) | 731 | ||||||||
PROFIT FOR THE PERIOD | 1,372 | 536 | (53 | ) | 1,855 | ||||||||
Attributable to the holders of the parent company | 1,374 | 531 | (62 | ) | 1,843 | ||||||||
Minority interest | (2 | ) | 5 | 9 | 12 | ||||||||
78
Consolidated Statement of Income Spain & Portugal by business line for the period ended December 31, 2005 | |||||||||||||
(Unaudited) | |||||||||||||
Euro Million | |||||||||||||
Generation & | Corporate Structure, | Electricity Business | |||||||||||
Supply | Distribution | Services & Adjustments | Spain & Portugal | ||||||||||
REVENUES | 8,140 | 1,944 | (810 | ) | 9,274 | ||||||||
Sales | 7,740 | 1,824 | (803 | ) | 8,761 | ||||||||
Other operating revenues | 400 | 120 | (7 | ) | 513 | ||||||||
PURCHASES AND SERVICES | 4,761 | 138 | (827 | ) | 4,072 | ||||||||
Energy purchases | 1,017 | 2 | (144 | ) | 875 | ||||||||
Fuel procurement costs | 2,057 | 2,057 | |||||||||||
Transmission expenses | 828 | 1 | (556 | ) | 273 | ||||||||
Other variable purchases and services | 859 | 135 | (127 | ) | 867 | ||||||||
GROSS MARGIN | 3,379 | 1,806 | 17 | 5,202 | |||||||||
Work performed by the entity and capitalized | 7 | 116 | 16 | 139 | |||||||||
Personnel expenses | 391 | 518 | 132 | 1,041 | |||||||||
Other fixed operating expenses | 678 | 515 | (159 | ) | 1,034 | ||||||||
GROSS OPERATING INCOME (EBITDA) | 2,317 | 889 | 60 | 3,266 | |||||||||
Depreciation and amortization | 571 | 410 | 21 | 1,002 | |||||||||
OPERATING INCOME (EBIT) | 1,746 | 479 | 39 | 2,264 | |||||||||
FINANCIAL INCOME | (241 | ) | (250 | ) | (118 | ) | (609 | ) | |||||
Net financial expenses | (241 | ) | (250 | ) | (111 | ) | (602 | ) | |||||
Foreign exchanges | (7 | ) | (7 | ) | |||||||||
Share of profit of associates | 41 | 3 | 44 | ||||||||||
Income from other investments | 1 | 2 | 3 | 6 | |||||||||
Income from asset sales | 106 | (10 | ) | 96 | |||||||||
INCOME BEFORE TAXES | 1,547 | 340 | (86 | ) | 1,801 | ||||||||
Income tax | 401 | 138 | (105 | ) | 434 | ||||||||
PROFIT FOR THE PERIOD | 1,146 | 202 | 19 | 1,367 | |||||||||
Attributable to the holders of the parent company | 1,144 | 199 | 15 | 1,358 | |||||||||
Minority interest | 2 | 3 | 4 | 9 | |||||||||
79