FORM 6-K
SECURITIES AND EXCHANGE COMMISSION
Washington, D.C. 20549
Report of Foreign Issuer
Pursuant to Rule 13a-16 or 15d-16 of
the Securities Exchange Act of 1934
For the month of May, 2007
Commission File Number: 333-07654
ENDESA, S.A.
(Translation of Registrant's Name into English)
Ribera del Loira, 60
28042 Madrid, Spain
(Address of principal executive office)
Indicate by check mark whether the registrant files or will file
annual reports under cover of Form 20-F or Form 40-F:
| Form 20-F | X | Form 40-F |
Indicate by check mark if the registrant is submitting the Form 6-K
in paper as permitted by Regulation S-T Rule 101(b)(1):
| Yes | No | X |
Indicate by check mark if the registrant is submitting the Form 6-K
in paper as permitted by Regulation S-T Rule 101(b)(7):
| Yes | No | X |
Indicate by check mark whether by furnishing the information
contained in this Form, the Registrant is also thereby furnishing the information to the Commission
pursuant to Rule 12g3-2(b) under the Securities Exchange Act of 1934:
| Yes | No | X |
If “Yes” is marked, indicate below the file number assigned to the registrant
in connection with Rule 12g3-2(b): N/A
SIGNATURES
Pursuant to the requirements of the Securities Exchange Act of 1934, the registrant has duly caused this report to be signed on its behalf by the undersigned, thereunto duly authorized.
| ENDESA, S.A. | |
| Dated: May 4, 2007 | By: /s/ Álvaro Pérez de Lema |
| Name: Álvaro Pérez de Lema | |
| Title: Manager of North America Investor Relations |

1Q07 Results Strong growth across the businesses May 4, 2007
1Q 2007 Results ?? Results in line with 2007 targets ?? Strong like-for-like growth in a demanding scenario ?? Dividend in line with the announced target
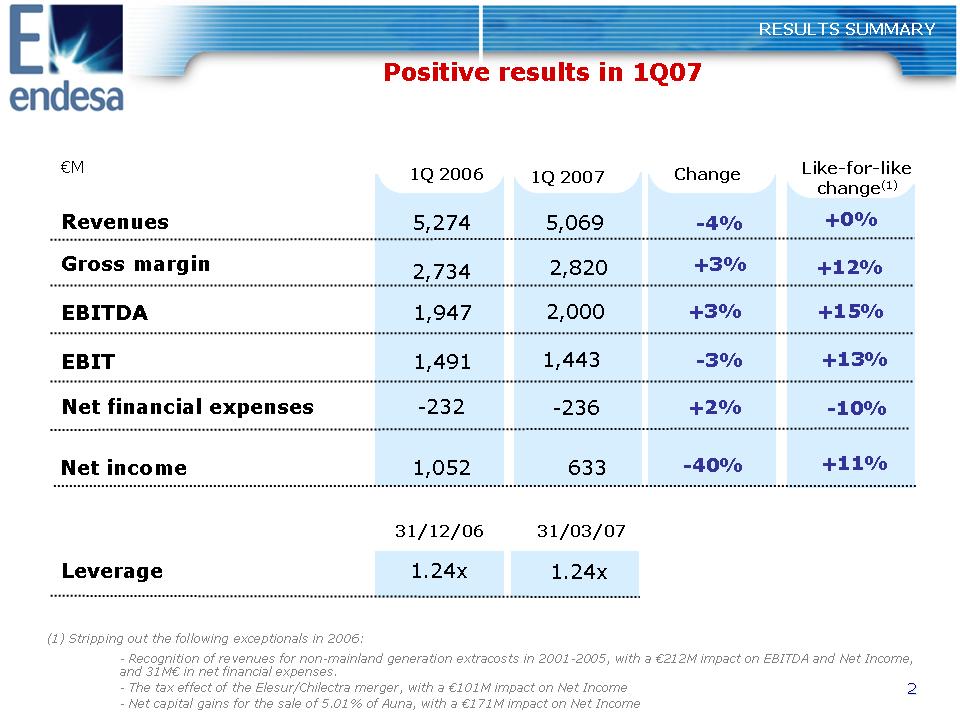
2 +15% +13% +11% Change 31/12/06 +3% -3% +2% -4% +3% 2,000 1,443 -236 1.24x 5,069 2,820 633 -40% 1Q 2006 1,947 1,491 -232 1.24x 5,274 2,734 1,052 1Q 2007 31/03/07 Positive results in 1Q07 RESULTS SUMMARY Revenues Gross margin EBITDA EBIT Net financial expenses Leverage €M Net income Like-for-like change(1) (1) Stripping out the following exceptionals in 2006: - Recognition of revenues for non-mainland generation extracosts in 2001-2005, with a €212M impact on EBITDA and Net Income, and 31M€ in net financial expenses. - The tax effect of the Elesur/Chilectra merger, with a €101M impact on Net Income - Net capital gains for the sale of 5.01% of Auna, with a €171M impact on Net Income +0% +12% -10%
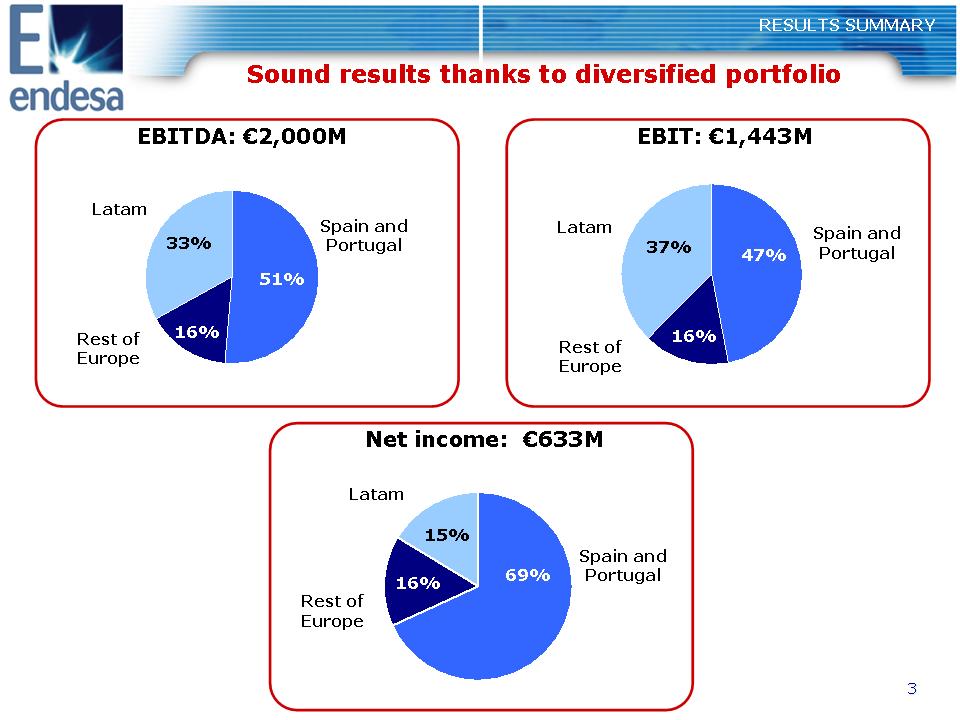
3 Sound results thanks to diversified portfolio RESULTS SUMMARY EBITDA: €2,000M Spain and Portugal Latam Rest of Europe 51% 16% 33% EBIT: €1,443M Net income: €633M Spain and Portugal 69% Rest of Europe 16% Latam 37% Rest of Europe 16% Latam Spain and Portugal 47% 15%
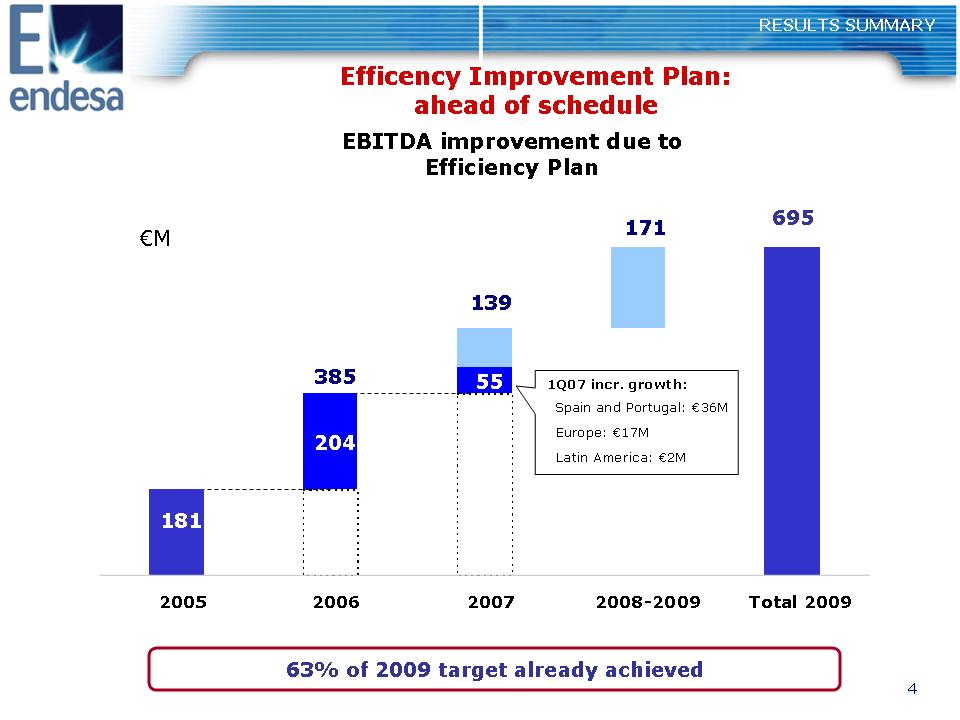
4 Efficency Improvement Plan: ahead of schedule RESULTS SUMMARY EBITDA improvement due to Efficiency Plan €M 1Q07 incr. growth: • Europe: €17M • Latin America: €2M • Spain and Portugal: €36M 63% of 2009 target already achieved 181 171 55 204 695 139 385 2005 2006 2007 2008-2009 Total 2009
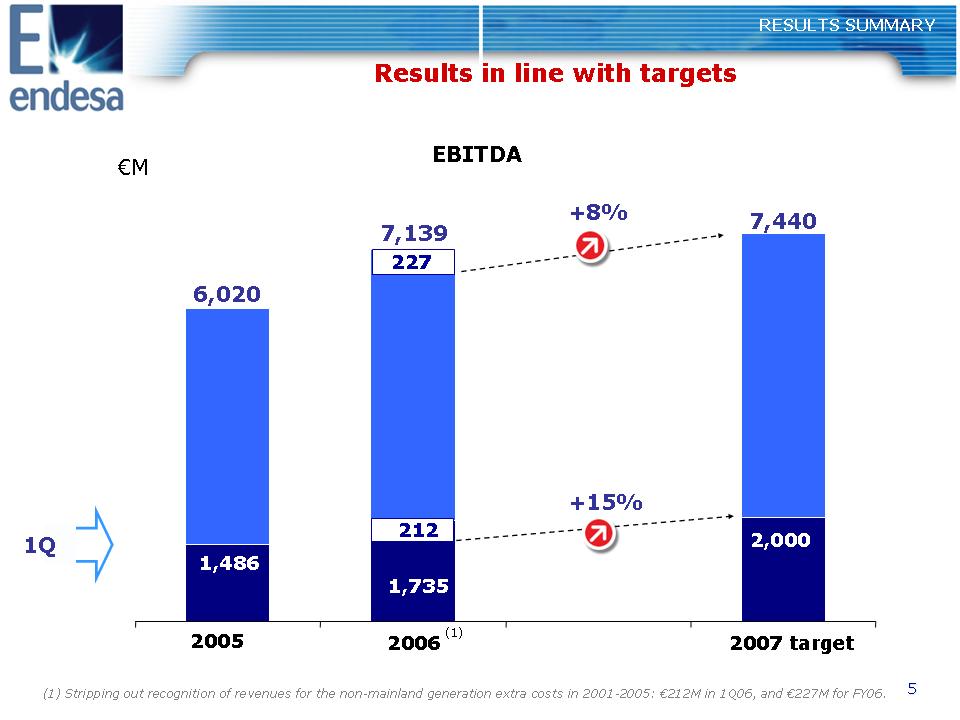
5 2005 2006 2007 target Results in line with targets RESULTS SUMMARY +8% 6,020 7,139 €M EBITDA +15% 1,735 1,486 1Q 7,440 2,000 (1) (1) Stripping out recognition of revenues for the non-mainland generation extra costs in 2001-2005: €212M in 1Q06, and €227M for FY06. 212 227
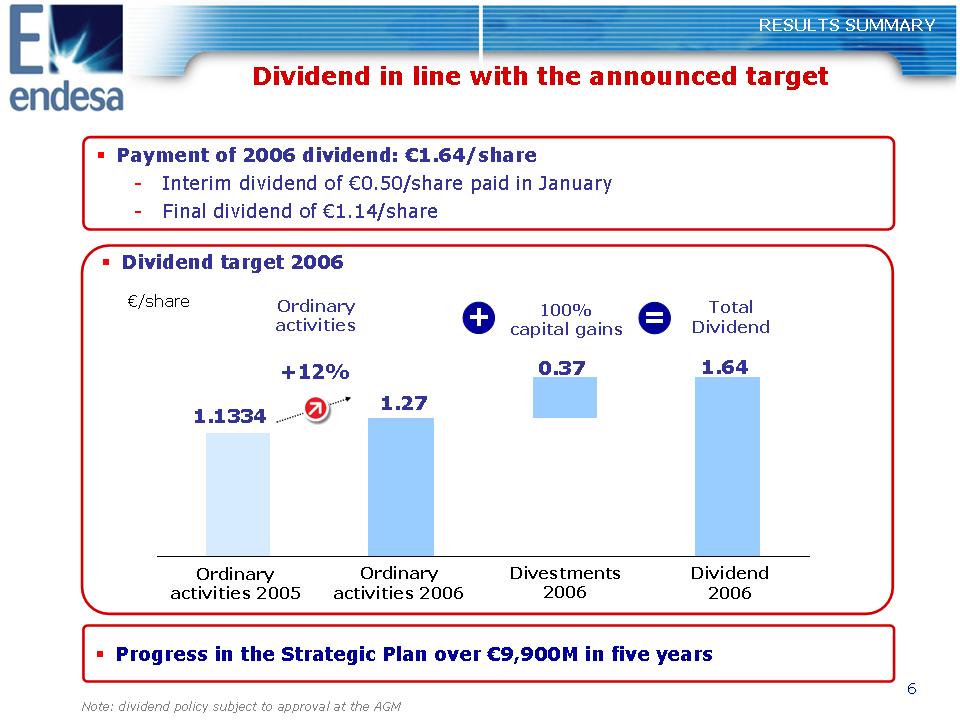
6 ?? Dividend target 2006 Dividend in line with the announced target RESULTS SUMMARY ?? Payment of 2006 dividend: €1.64/share - Interim dividend of €0.50/share paid in January - Final dividend of €1.14/share Ordinary activities 2005 Ordinary activities 2006 Divestments 2006 €/share 1.1334 +12% 0.37 1.64 Ordinary activities + 100% capital gains Total Dividend = Dividend 2006 2,0950 0,3050 1.27 ?? Progress in the Strategic Plan over €9,900M in five years Note: dividend policy subject to approval at the AGM

1Q07 Results Spain and Portugal 1Q07 Results
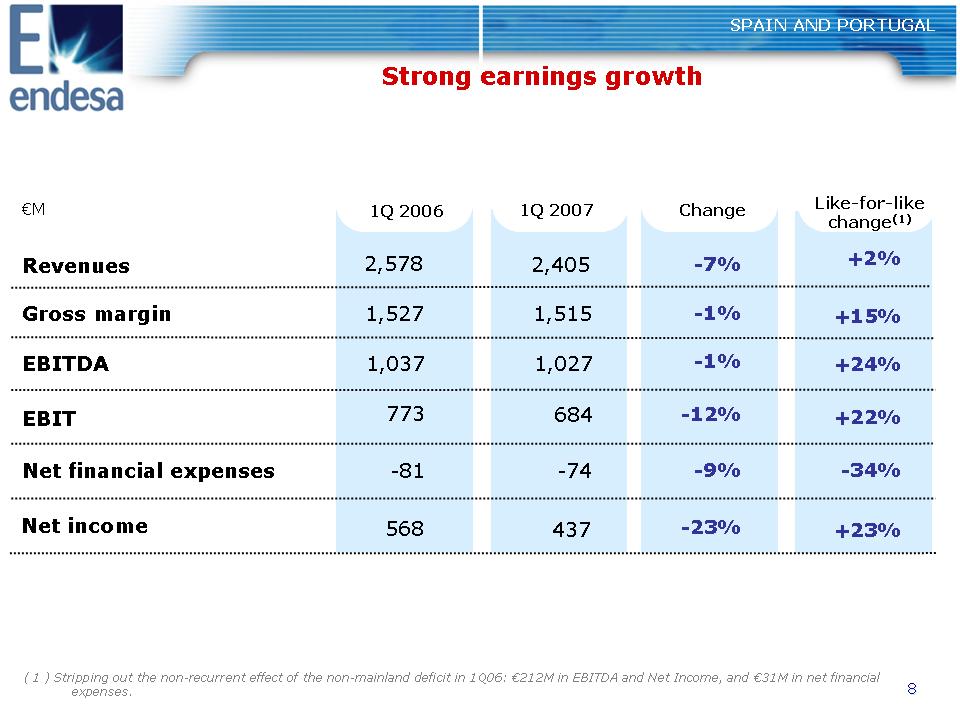
8 SPAIN AND PORTUGAL Strong earnings growth Revenues Gross margin EBITDA EBIT Net financial expenses €M 1Q 2007 Change -1% -12% -9% -7% -1% 1,027 684 -74 2,405 1,515 Net income -23% 437 1,037 773 -81 2,578 1,527 568 1Q 2006 Like-for-like change(1) +24% +22% +23% ( 1 ) Stripping out the non-recurrent effect of the non-mainland deficit in 1Q06: €212M in EBITDA and Net Income, and €31M in net financial expenses. +2% +15% -34%
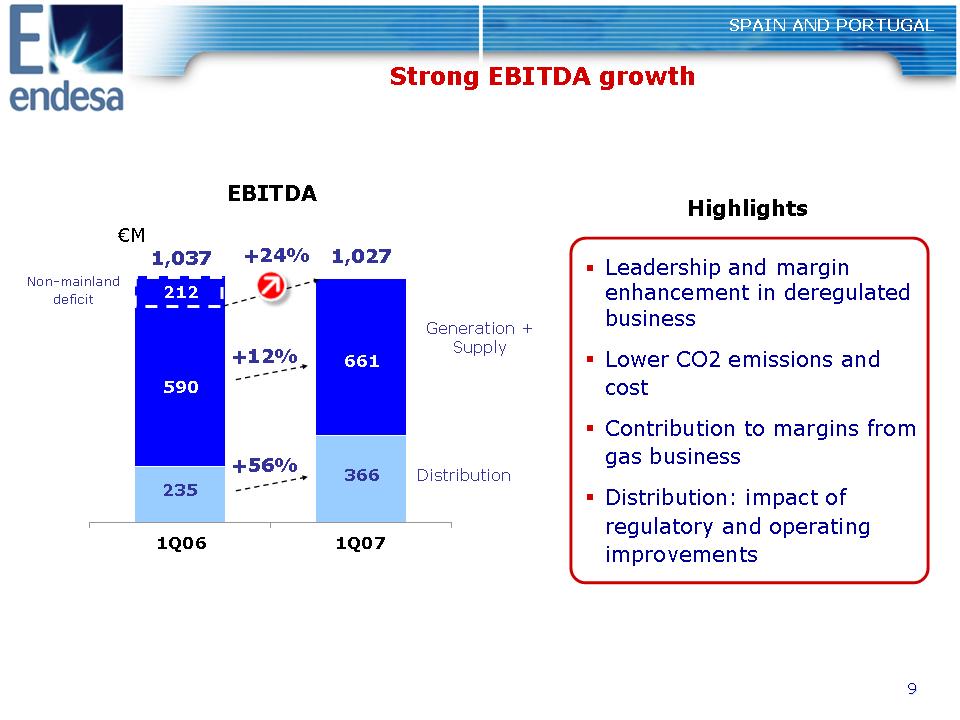
9 SPAIN AND PORTUGAL Strong EBITDA growth Generation + Supply Distribution 1Q07 1,037 1,027 +24% EBITDA 235 661 590 1Q06 €M 366 Highlights ?? Leadership and margin enhancement in deregulated business ?? Lower CO2 emissions and cost ?? Contribution to margins from gas business ?? Distribution: impact of regulatory and operating improvements Non-mainland deficit 212 +12% +56%
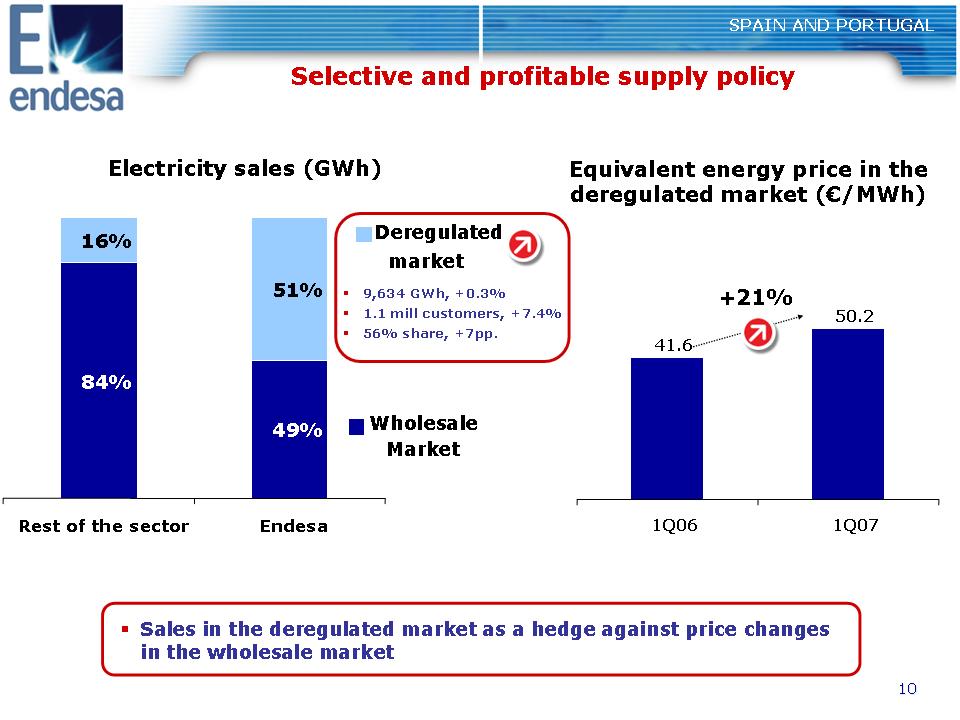
10 16% 51% 49% 84% Rest of the sector Endesa Selective and profitable supply policy SPAIN AND PORTUGAL ?? Sales in the deregulated market as a hedge against price changes in the wholesale market Electricity sales (GWh) Equivalent energy price in the deregulated market (€/MWh) +21% Deregulated market Wholesale Market ?? 9,634 GWh, +0.3% ?? 1.1 mill customers, +7.4% ?? 56% share, +7pp. 50.2 41.6 1Q06 1Q07
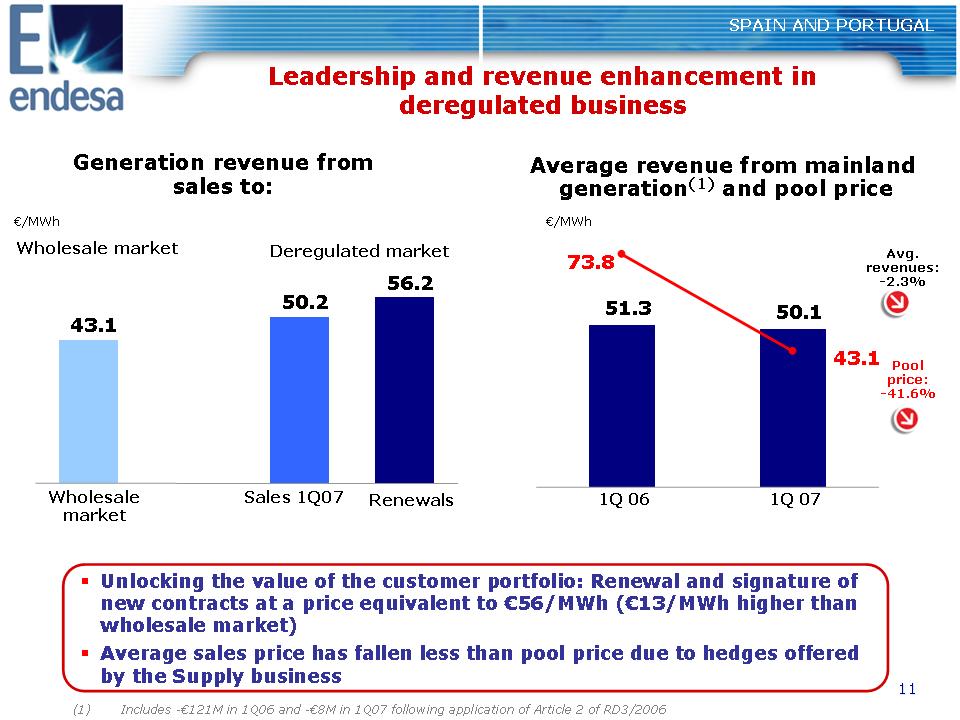
11 SPAIN AND PORTUGAL Leadership and revenue enhancement in deregulated business Average revenue from mainland generation(1) and pool price Generation revenue from sales to: (1) Includes -€121M in 1Q06 and -€8M in 1Q07 following application of Article 2 of RD3/2006 €/MWh Pool price: -41,6% Avg. revenues: -2,3% €/MWh Deregulated market Wholesale market ?? Unlocking the value of the customer portfolio: Renewal and signature of new contracts at a price equivalent to €56/MWh (€13/MWh higher than wholesale market) ?? Average sales price has fallen less than pool price due to hedges offered by the Supply business 43.1 50.2 56.2 Wholesale market Sales 1Q07 Renewals 50.1 51.3 43,1 73.8 1Q 06 1Q 07
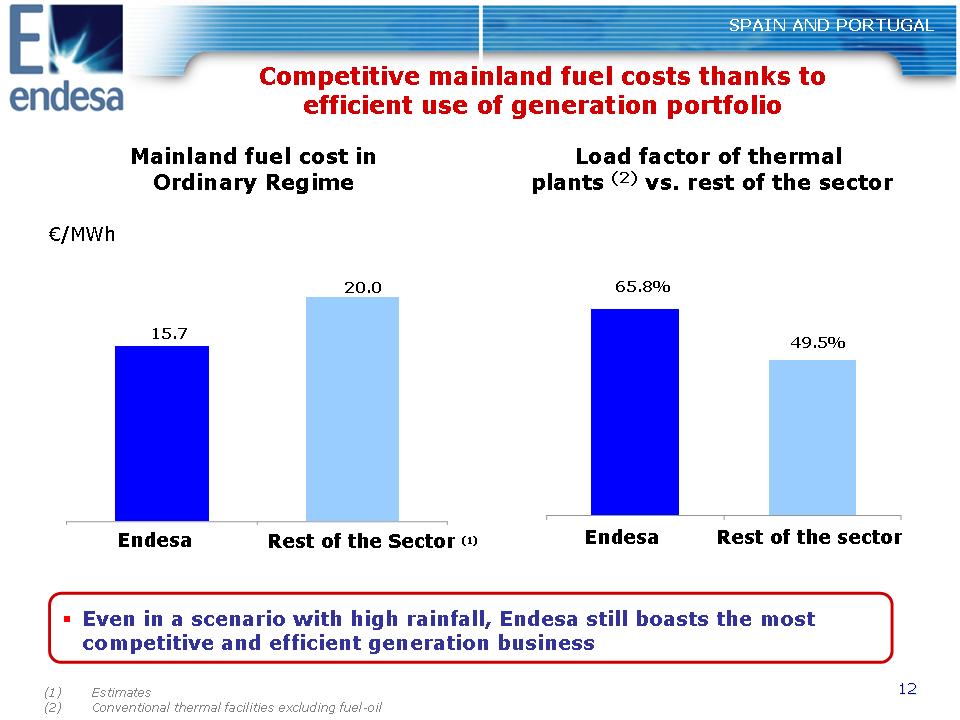
12 SPAIN AND PORTUGAL Competitive mainland fuel costs thanks to efficient use of generation portfolio Endesa (1) Estimates (2) Conventional thermal facilities excluding fuel-oil Mainland fuel cost in Ordinary Regime Rest of the Sector (1) Load factor of thermal plants (2) vs. rest of the sector Rest of the sector Endesa ?? Even in a scenario with high rainfall, Endesa still boasts the most competitive and efficient generation business €/MWh 20.0 15.7 49.5% 65.8%
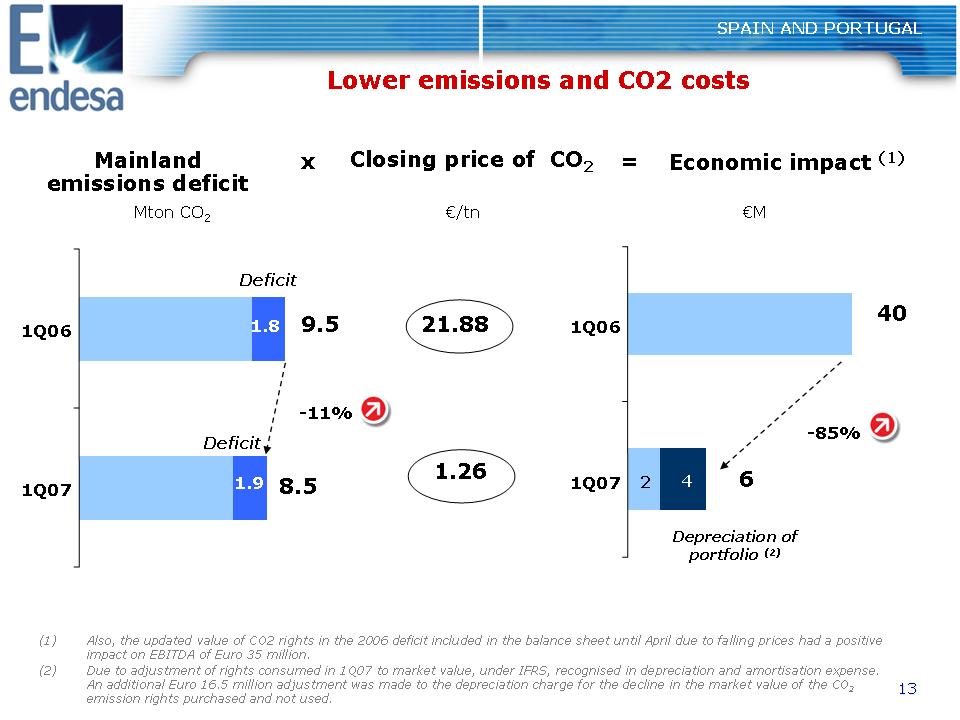
13 (1) Also, the updated value of CO2 rights in the 2006 deficit included in the balance sheet until April due to falling prices had a positive impact on EBITDA of Euro 35 million. (2) Due to adjustment of rights consumed in 1Q07 to market value, under IFRS, recognised in depreciation and amortisation expense. An additional Euro 16.5 million adjustment was made to the depreciation charge for the decline in the market value of the CO2 emission rights purchased and not used. Lower emissions and CO2 costs SPAIN AND PORTUGAL Mainland emissions deficit Mton CO2 Economic impact (1) Closing price of CO2 €/tn €M x = 9,5 1,8 8,5 1,9 Deficit Deficit 21.88 1.26 40 6 -11% Depreciation of portfolio (2) 1Q07 1Q06 4 1Q07 1Q06 2 -85%
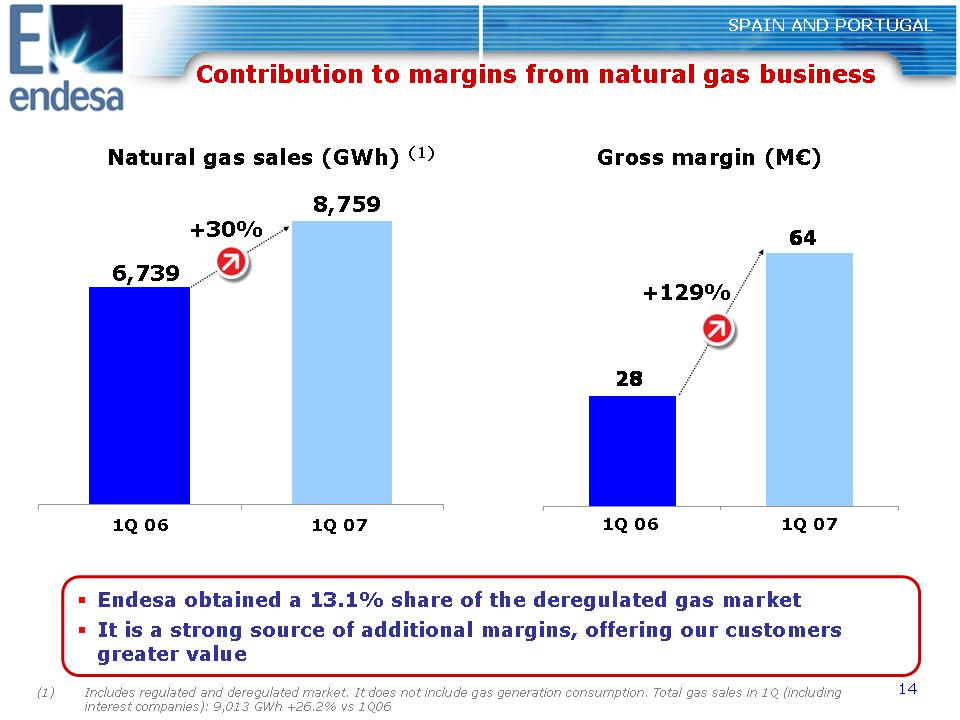
14 SPAIN AND PORTUGAL Contribution to margins from natural gas business Natural gas sales (GWh) (1) Gross margin (M€) 1Q 07 1Q 06 +30% (1) Includes regulated and deregulated market. It does not include gas generation consumption. Total gas sales in 1Q (including interest companies): 9,013 GWh +26.2% vs 1Q06 ?? Endesa obtained a 13.1% share of the deregulated gas market ?? It is a strong source of additional margins, offering our customers greater value 8,759 6,739 64 28 1Q 07 1Q 06 +129%
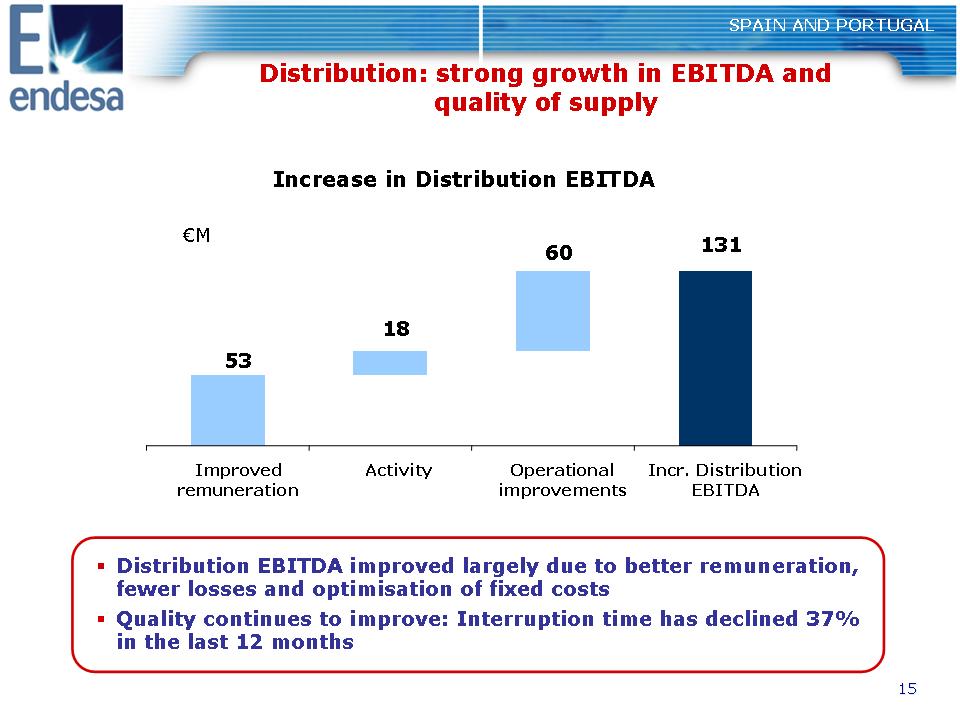
15 SPAIN AND PORTUGAL Distribution: strong growth in EBITDA and quality of supply €M ?? Distribution EBITDA improved largely due to better remuneration, fewer losses and optimisation of fixed costs ?? Quality continues to improve: Interruption time has declined 37% in the last 12 months Increase in Distribution EBITDA 53 18 60 131 Improved remuneration Activity Operational improvements Incr. Distribution EBITDA
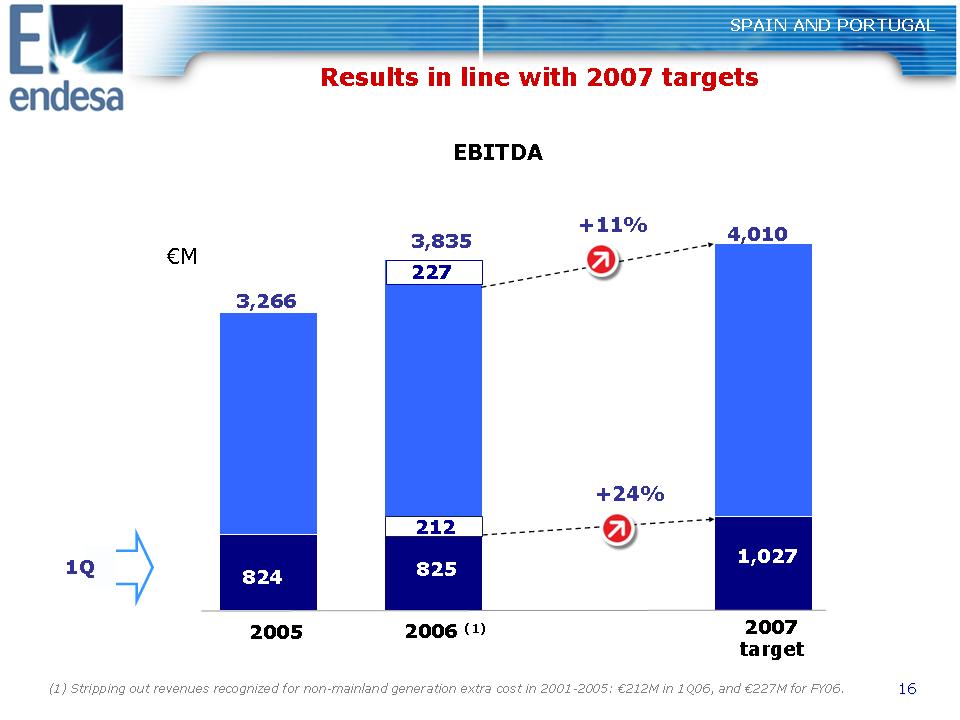
16 SPAIN AND PORTUGAL Results in line with 2007 targets EBITDA 3,266 2005 2006 (1) 3,835 824 1,027 1Q €M 2007 target 4,010 825 +11% +24% (1) Stripping out revenues recognized for non-mainland generation extra cost in 2001-2005: €212M in 1Q06, and €227M for FY06. 212 227
17 1Q07 Results Europe 1Q07 Results
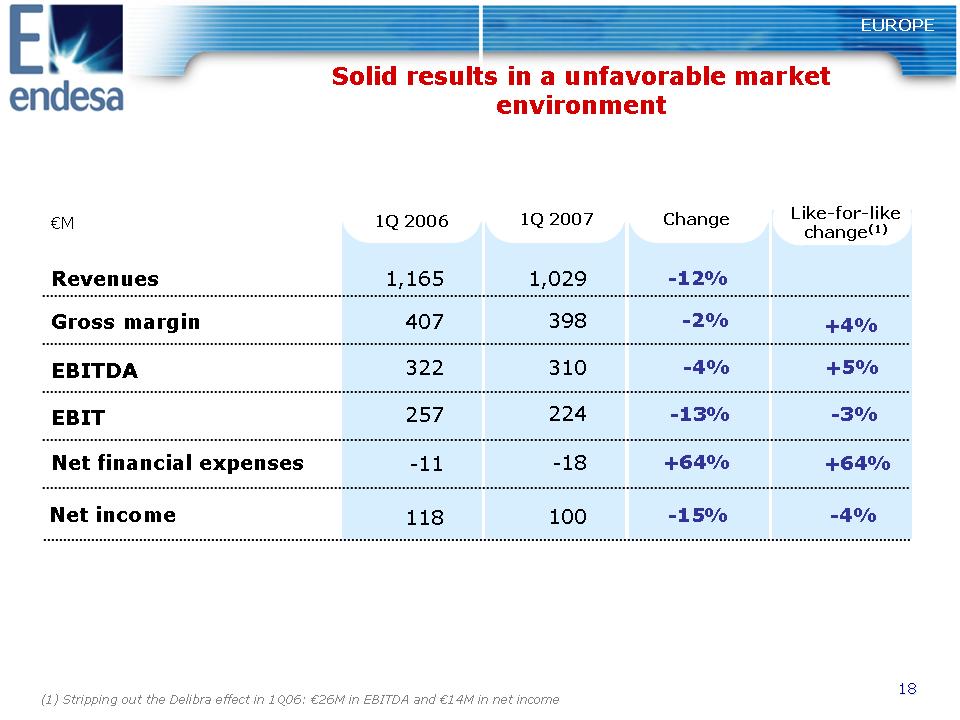
18 1Q 2007 Change -4% -13% +64% -12% -2% 310 224 -18 1,029 398 -15% 100 1Q 2006 322 257 -11 1,165 407 118 +5% -3% -4% Like-for-like change(1) EUROPE Solid results in a unfavorable market environment Revenues Gross margin EBITDA EBIT Net financial expenses €M Net income (1) Stripping out the Delibra effect in 1Q06: €26M in EBITDA and €14M in net income +4% +64%
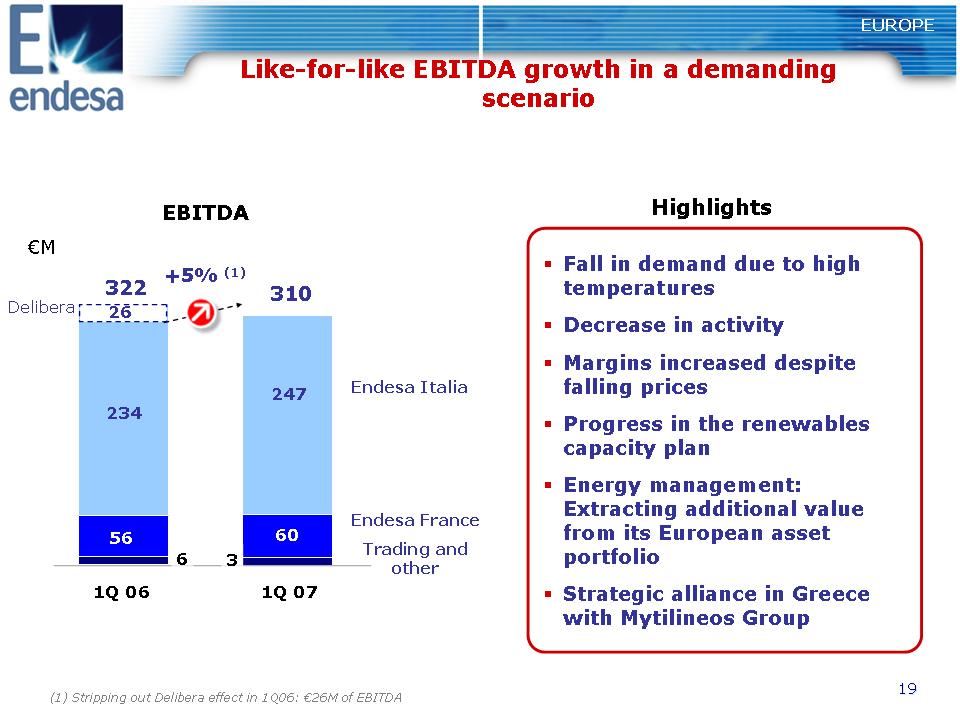
19 EUROPE Like-for-like EBITDA growth in a demanding scenario 322 310 +5% (1) EBITDA 234 247 56 1Q 06 1Q 07 Endesa France Endesa Italia €M Trading and other Highlights 60 6 3 Delibera 26 ?? Fall in demand due to high temperatures ?? Decrease in activity ?? Margins increased despite falling prices ?? Progress in the renewables capacity plan ?? Energy management: Extracting additional value from its European asset portfolio ?? Strategic alliance in Greece with Mytilineos Group (1) Stripping out Delibera effect in 1Q06: €26M of EBITDA
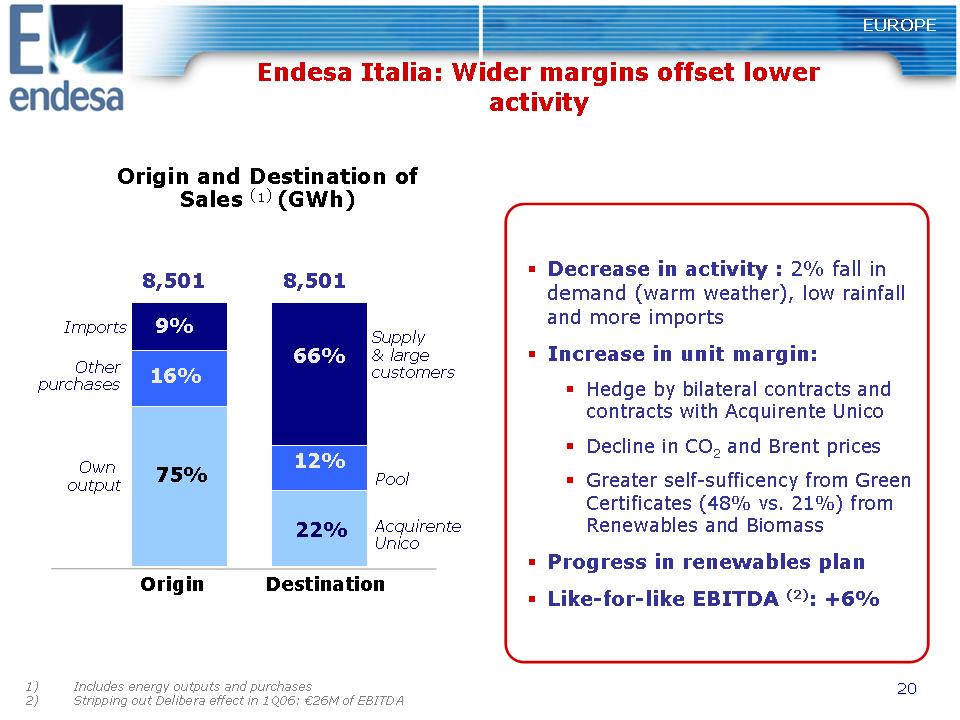
20 Endesa Italia: Wider margins offset lower activity EUROPE ?? Decrease in activity : 2% fall in demand (warm weather), low rainfall and more imports ?? Increase in unit margin: ?? Hedge by bilateral contracts and contracts with Acquirente Unico ?? Decline in CO2 and Brent prices ?? Greater self-sufficency from Green Certificates (48% vs. 21%) from Renewables and Biomass ?? Progress in renewables plan ?? Like-for-like EBITDA (2): +6% 1) Includes energy outputs and purchases 2) Stripping out Delibera effect in 1Q06: €26M of EBITDA Origin and Destination of Sales (1) (GWh) Supply & large customers Destination Origin Acquirente Unico Pool 75% 8,501 22% 12% 66% 16% 9% 8,501 Imports Own output Other purchases
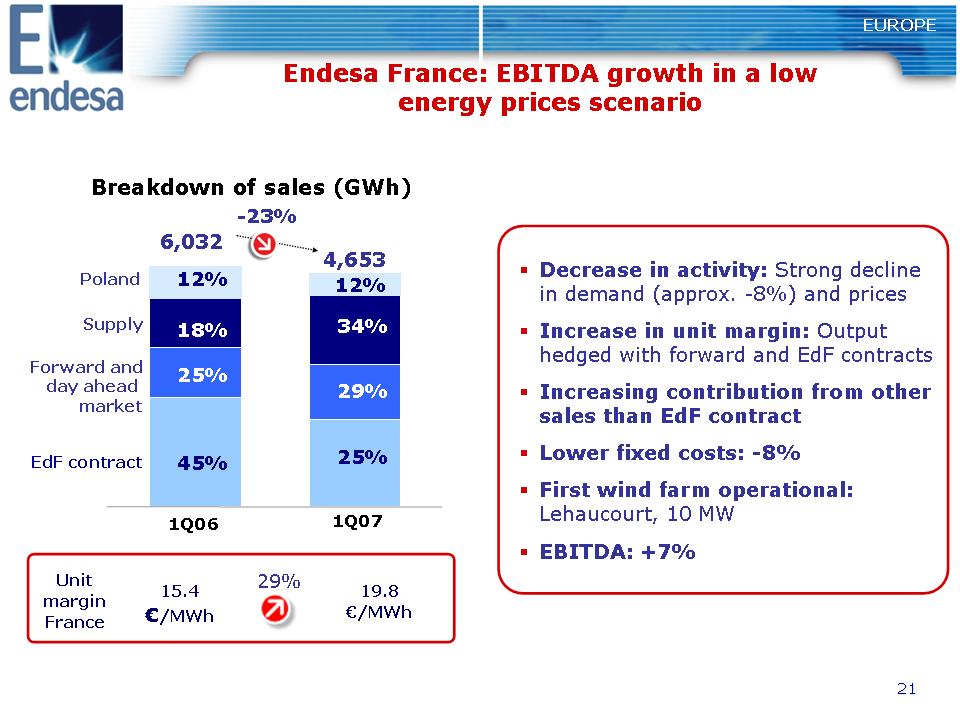
21 EUROPE Endesa France: EBITDA growth in a low energy prices scenario ?? Decrease in activity: Strong decline in demand (approx. -8%) and prices ?? Increase in unit margin: Output hedged with forward and EdF contracts ?? Increasing contribution from other sales than EdF contract ?? Lower fixed costs: -8% ?? First wind farm operational: Lehaucourt, 10 MW ?? EBITDA: +7% 1Q07 1Q06 EdF contract Forward and day ahead market Supply Poland Breakdown of sales (GWh) 25% 29% 34% 45% 25% 18% 12% 12% 4,653 6,032 -23% Unit margin France 15.4 €/MWh 19.8 €/MWh 29%

22 EUROPE Integrated management of asset portfolio Trading EBITDA: €15M Additional contributions: - Endesa Italia: €11M - Endesa France: €5M 16 GWh 776 GWh 18 GWh 25 GWh 5 GWh 20 GWh 7 GWh Physical assets Virtual assets Interconnection 100 GWh 15 GWh

23 EUROPE Greece: strategic alliance with Mytilineos group One of the most attractive markets in Europe ?? Lack of capacity ?? High prices ?? Barriers to entry Endesa Hellas: Joint Venture with the Mytilineos Group Assets (MW) Date of Operation Contribution to Endesa: €485M + Success premium + Price adjustment Total €600M ~ IRR 10% Repeating Italy and France experience. Meeting 2009 targets. EBITDA: Endesa Italia Endesa France Endesa Hellas 280 900 €M 95 200 0 80 2009 Beginning Beginning Beginning 2006 2006 50.01% 49.99% NEWCO Also, CCGT and coal option Renewables CCGT CHP 400 150 412 511 54 June 2007 June 2009 In operation 2010 2012
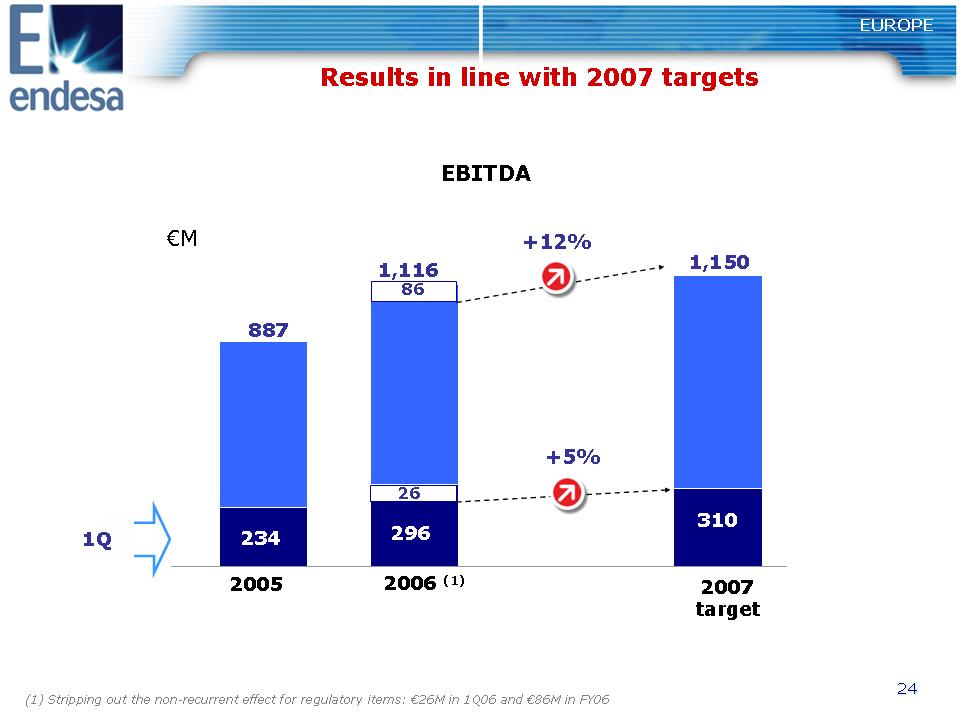
24 EUROPE EBITDA 887 2005 1,116 296 +12% 1Q +5% 234 €M 2007 target 310 1,150 26 Results in line with 2007 targets 86 (1) Stripping out the non-recurrent effect for regulatory items: €26M in 1Q06 and €86M in FY06 2006 (1)
25 1Q07 Results Strong growth across all businesses Latin America 1Q07 Results
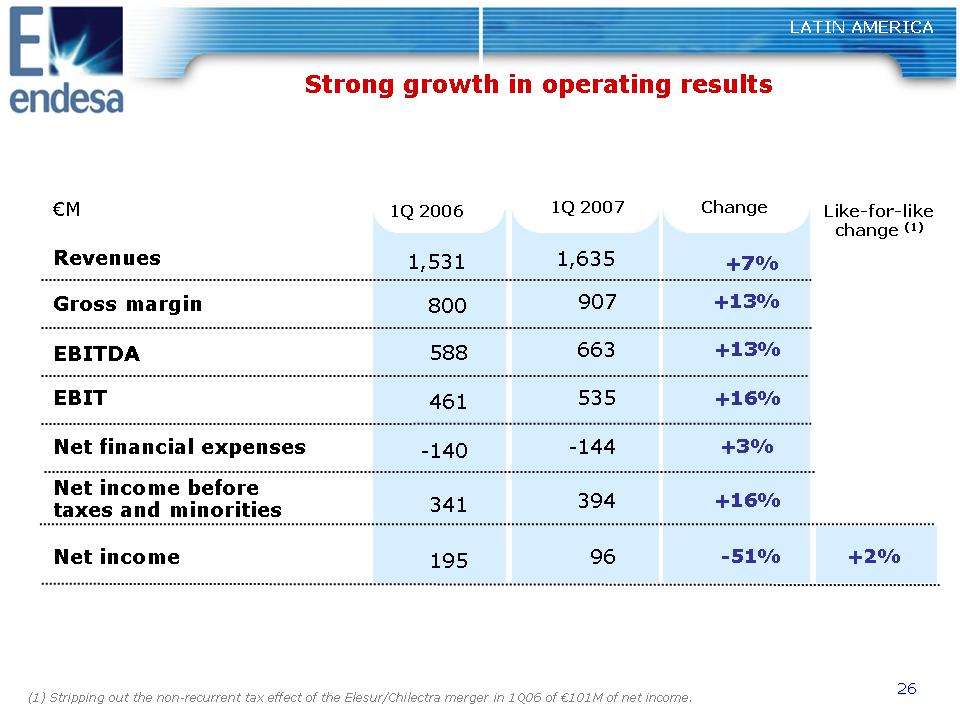
26 LATIN AMERICA Strong growth in operating results 1Q 2007 Change €M Revenues Gross margin EBITDA EBIT Net financial expenses Net income before taxes and minorities Net income +13% +16% -51% +3% +7% +13% 663 535 96 -144 1,635 907 +16% 394 (1) Stripping out the non-recurrent tax effect of the Elesur/Chilectra merger in 1Q06 of €101M of net income. 1Q 2006 588 461 195 -140 1,531 800 341 Like-for-like change (1) +2%
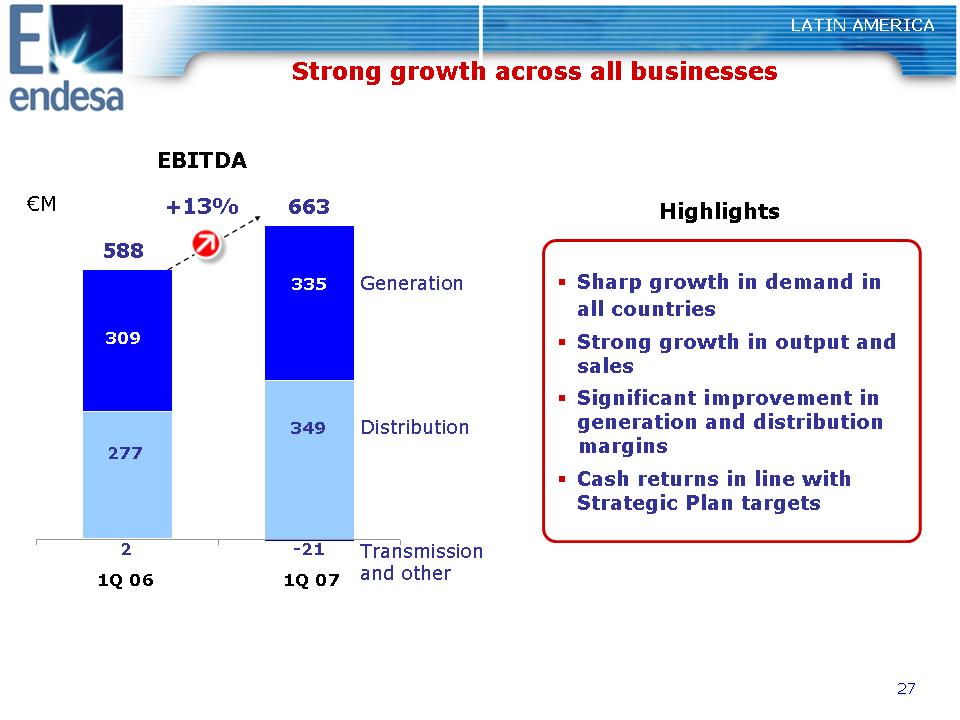
27 LATIN AMERICA Strong growth across all businesses 588 663 +13% EBITDA 277 335 349 309 1Q 07 1Q 06 €M 2 Distribution Transmission and other Generation -21 Highlights ?? Sharp growth in demand in all countries ?? Strong growth in output and sales ?? Significant improvement in generation and distribution margins ?? Cash returns in line with the Strategic Plan targets
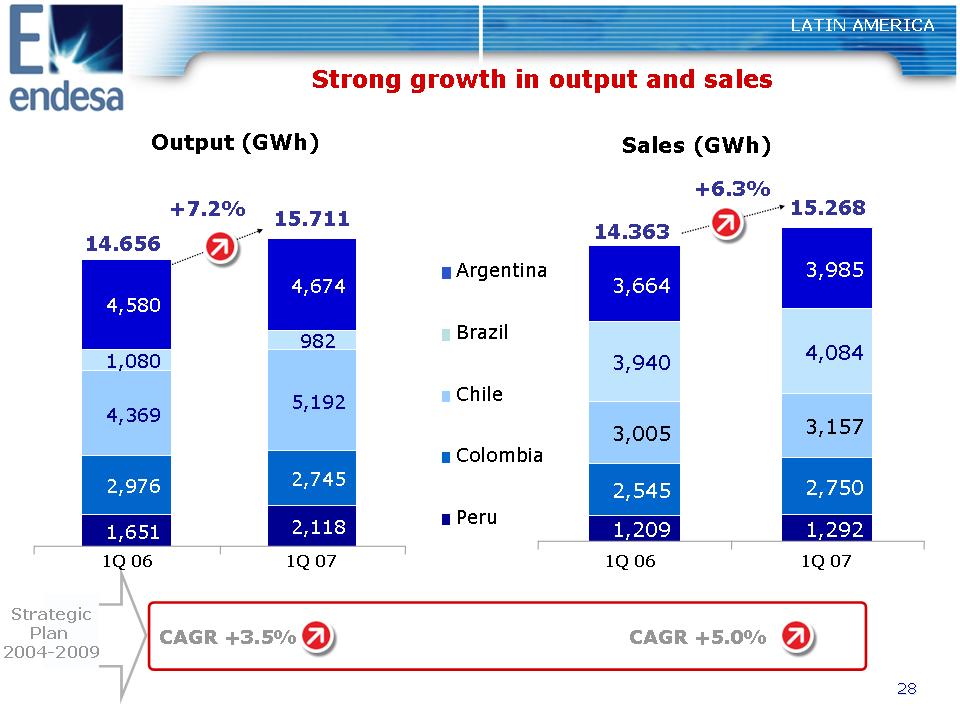
28 LATIN AMERICA 15.711 +7.2% Output (GWh) 1Q 07 1Q 06 Argentina Brazil Chile Colombia Peru Sales (GWh) 15.268 +6.3% CAGR +3.5% CAGR +5.0% Strategic Plan 2004-2009 14.656 14.363 1Q 07 1Q 06 Strong growth in output and sales 1,651 2,118 2,976 2,745 4,369 5,192 1,080 982 4,580 4,674 1,209 1,292 2,545 2,750 3,005 3,157 3,940 4,084 3,664 3,985
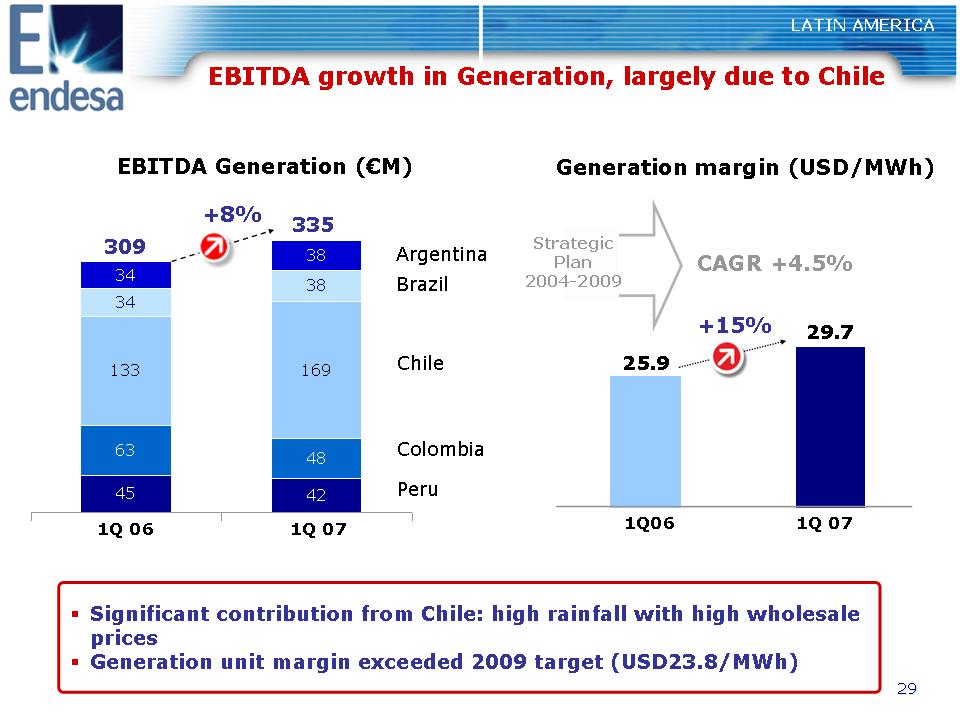
29 EBITDA growth in Generation, largely due to Chile 45 42 63 48 133 169 34 38 34 38 EBITDA Generation (€M) 1Q 07 1Q 06 Argentina Brazil Chile Colombia Peru +8% 309 335 ?? Significant contribution from Chile: high rainfall with high wholesale prices ?? Generation unit margin exceeded 2009 target (USD23.8/MWh) +15% 1Q06 CAGR +4.5% Generation margin (USD/MWh) 1Q 07 Strategic Plan 2004-2009 29.7 25.9 LATIN AMERICA
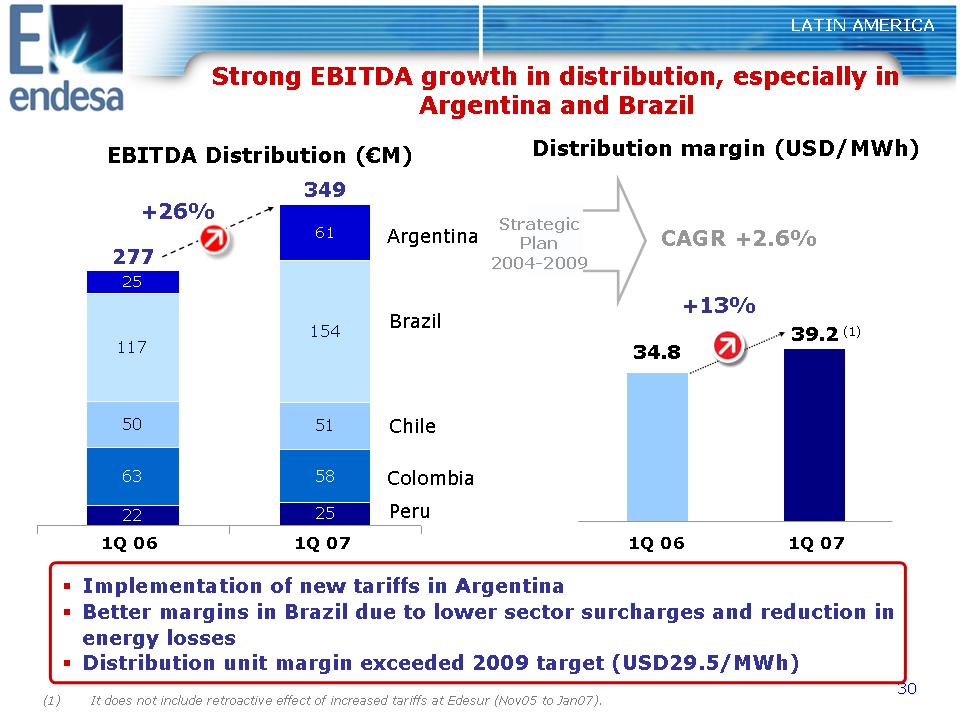
30 Strong EBITDA growth in distribution, especially in Argentina and Brazil 22 25 63 58 50 51 117 154 61 25 EBITDA Distribution (€M) Argentina Brazil Chile Colombia Peru +26% 277 349 +13% CAGR +2.6% Distribution margin (USD/MWh) Strategic Plan 2004-2009 ?? Implementation of new tariffs in Argentina ?? Better margins in Brazil due to lower sector surcharges and reduction in energy losses ?? Distribution unit margin exceeded 2009 target (USD29.5/MWh) 39.2 (1) 34.8 1Q 07 1Q 06 1Q 07 1Q 06 (1) It does not include retroactive effect of increased tariffs at Edesur (Nov05 to Jan07). LATIN AMERICA
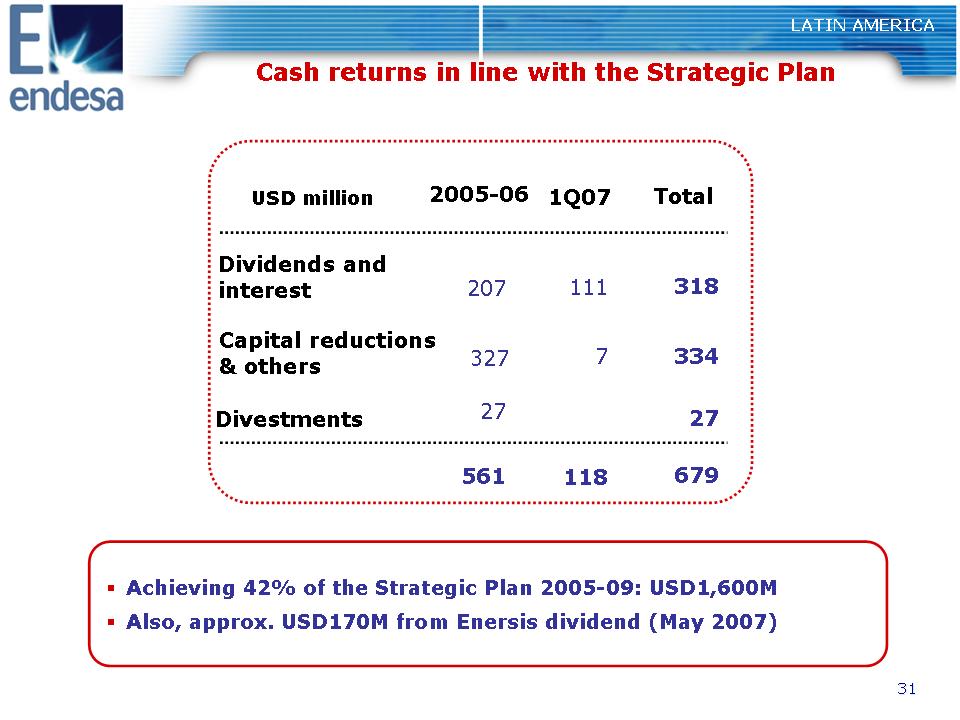
31 Cash returns in line with the Strategic Plan LATIN AMERICA ?? Achieving 42% of the Strategic Plan 2005-09: USD1,600M ?? Also, approx. USD170M from Enersis dividend (May 2007) 1Q07 USD million Dividends and interest Capital reductions & others Divestments Total 7 111 118 334 318 679 27 2005-06 327 207 561 27
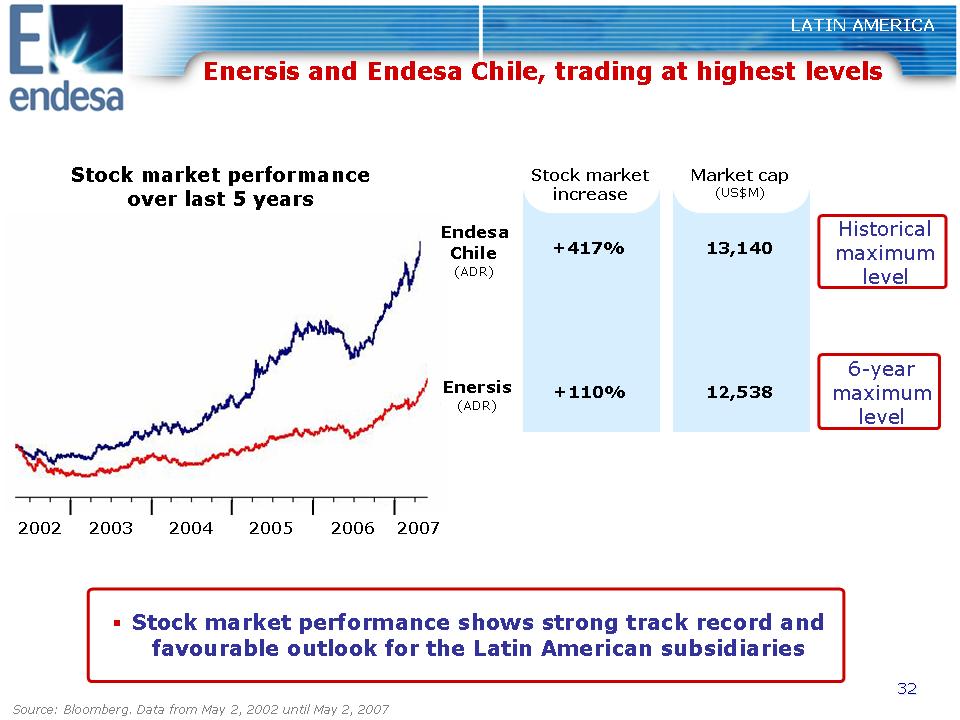
32 Stock market increase LATIN AMERICA Enersis and Endesa Chile, trading at highest levels Stock market performance over last 5 years ?? Stock market performance shows the strong track record and favourable outlook for the Latin American subsidiaries +417% +110% Market cap (US$M) 13,140 12,538 Historical maximum level 6-year maximum level 2002 2003 2004 2006 2007 2005 Source: Bloomberg. Data from May 2, 2002 until May 2, 2007 Endesa Chile (ADR) Enersis (ADR)
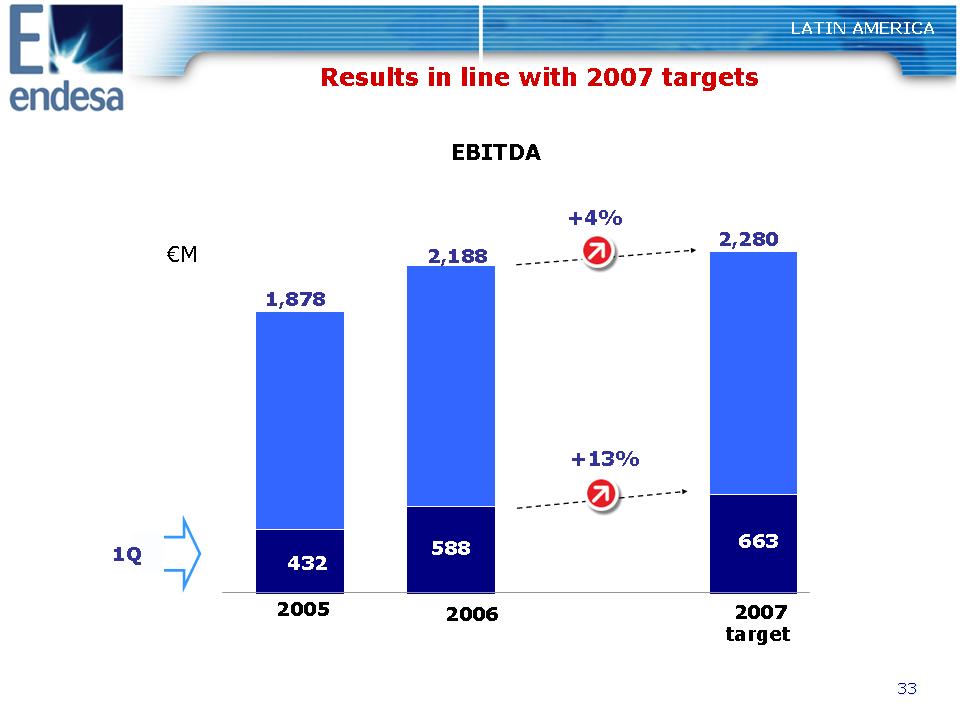
33 LATIN AMERICA Results in line with 2007 targets EBITDA 1,878 2005 2007 target 2,280 663 +4% 1Q +13% 432 €M 2,188 588 2006
34 1Q07 Results Strong growth across all businesses Financial analysis 1Q07 Results
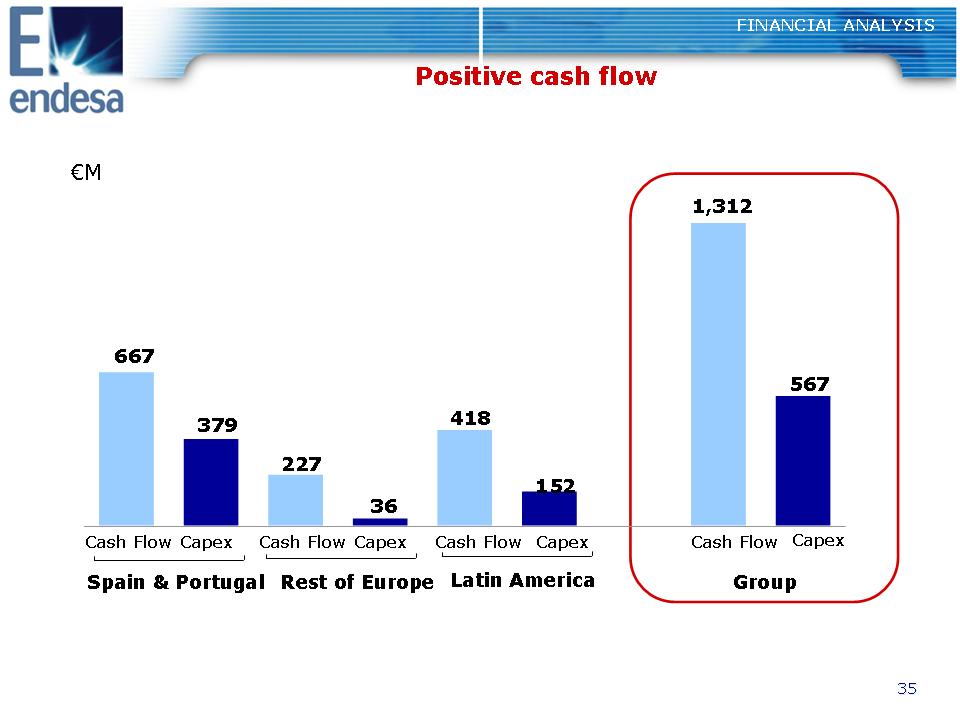
35 FINANCIAL ANALYSIS Positive cash flow €M Spain & Portugal Cash Flow Capex Rest of Europe Latin America Cash Flow Capex Cash Flow Capex Group Cash Flow Capex 1,312 418 227 667 567 152 36 379
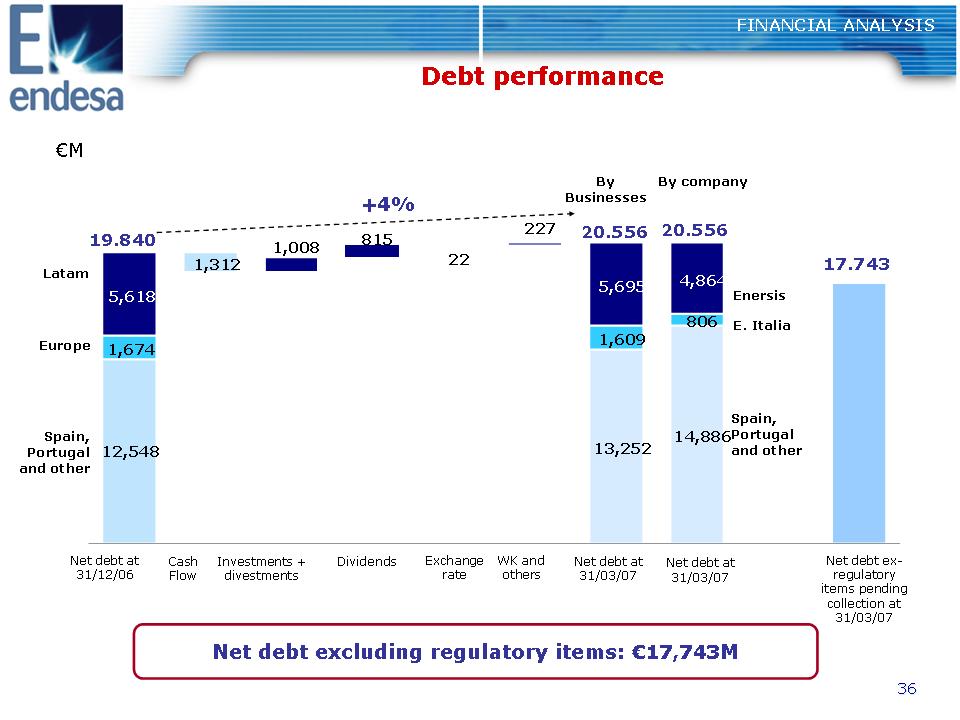
36 Debt performance FINANCIAL ANALYSIS By Businesses By company Latam Europe Spain, Portugal and other Enersis E. Italia Spain, Portugal and other €M 19.840 +4% Net debt at 31/12/06 Net debt at 31/03/07 Cash Flow Investments + divestments Dividends Exchange rate WK and others Net debt at 31/03/07 Net debt exregulatory items pending collection at 31/03/07 17.743 Net debt excluding regulatory items: €17,743M 20.556 20.556 12,548 13,252 14,886 1,674 1,609 806 5,618 5,695 4,864 227 815 22 1,008 1,312
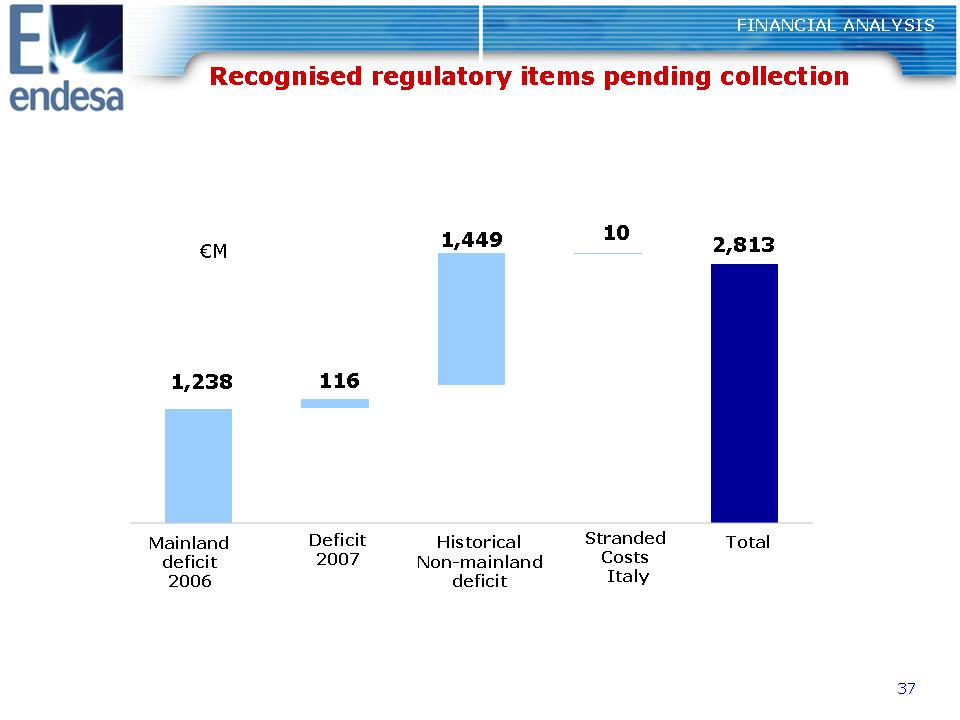
37 Recognised regulatory items pending collection FINANCIAL ANALYSIS Mainland deficit 2006 Historical Non-mainland deficit Stranded Costs Italy Total €M Deficit 2007 2,813 1,449 10 116 1,238
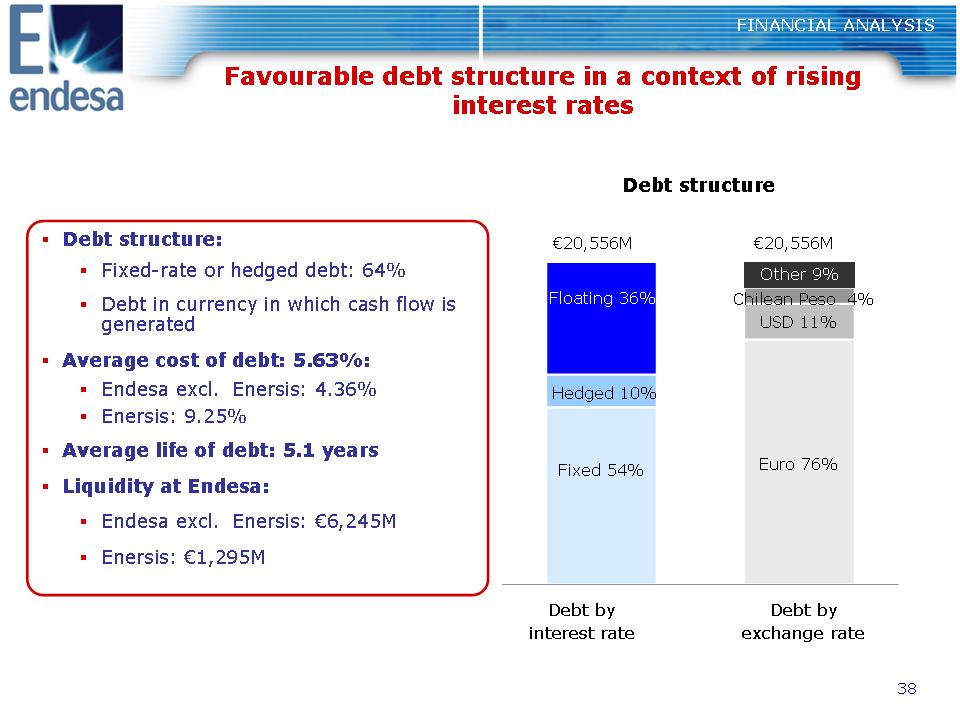
38 Debt by interest rate Debt by exchange rate Favourable debt structure in a context of rising interest rates FINANCIAL ANALYSIS Debt structure Euro 76% USD 11% Chilean Peso 4% Other 9% Fixed 54% Hedged 10% Floating 36% ?? Debt structure: ?? Fixed-rate or hedged debt: 64% ?? Debt in currency in which cash flow is generated ?? Average cost of debt: 5.63%: ?? Endesa excl. Enersis: 4.36% ?? Enersis: 9.25% ?? Average life of debt: 5.1 years ?? Liquidity at Endesa: ?? Endesa excl. Enersis: €6,245M ?? Enersis: €1,295M €20,556M €20,556M
39 Conclusions ?? Solid earnings in a demanding scenario ?? Diversified business portfolio in highly attractive markets ?? Expected results in line with announced targets ?? Active management of the businesses: growth, efficiency and investments. ?? An experienced and committed team CONCLUSIONS

40 1Q07 Back-up
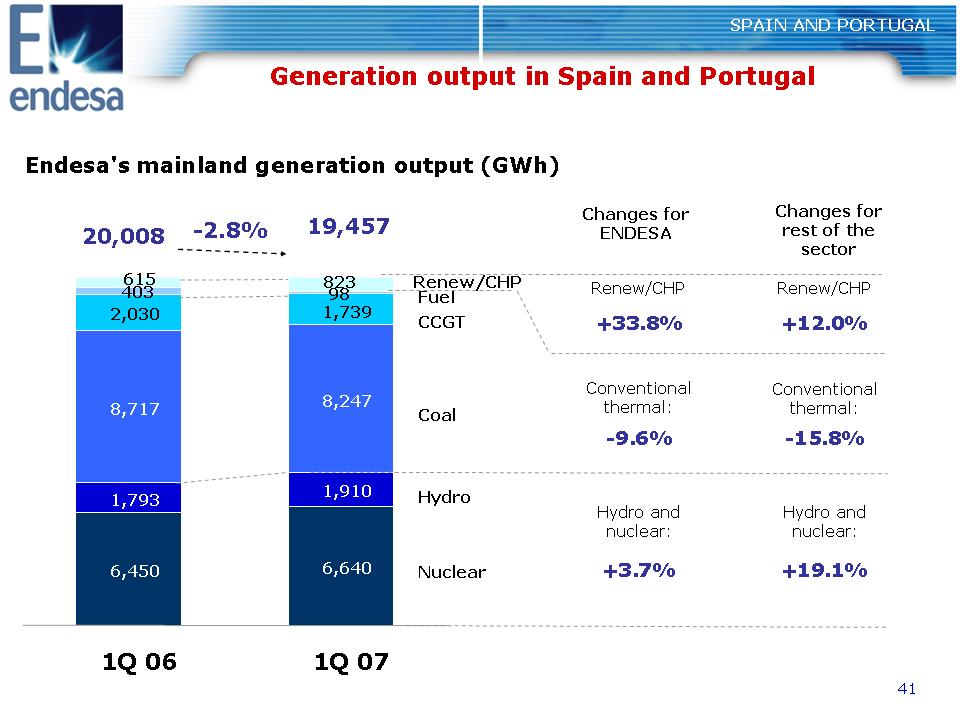
41 Generation output in Spain and Portugal SPAIN AND PORTUGAL Endesa's mainland generation output (GWh) Nuclear Hydro CCGT Coal Fuel +3.7% 19,457 20,008 -2.8% Renew/CHP 6,450 6,640 1,793 1,910 8,717 8,247 2,030 1,739 98 403 615 823 1Q 06 1Q 07 Hydro and nuclear: +33.8% Renew/CHP -9.6% Conventional thermal: Changes for ENDESA +19.1% -15.8% +12.0% Changes for rest of the sector Renew/CHP Conventional thermal: Hydro and nuclear:
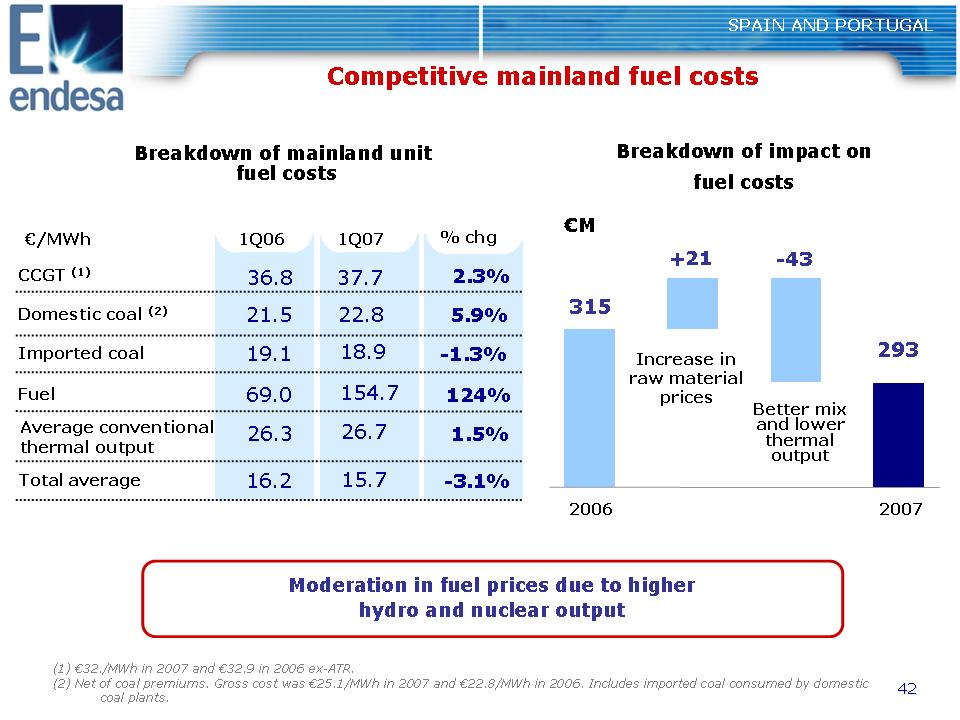
42 SPAIN AND PORTUGAL Competitive mainland fuel costs Breakdown of impact on fuel costs (1) €32./MWh in 2007 and €32.9 in 2006 ex-ATR. (2) Net of coal premiums. Gross cost was €25.1/MWh in 2007 and €22.8/MWh in 2006. Includes imported coal consumed by domestic coal plants. Breakdown of mainland unit fuel costs Moderation in fuel prices due to higher hydro and nuclear output €/MWh 1Q06 1Q07 CCGT (1) 37.7 2.3% Domestic coal (2) 21.5 5.9% Imported coal 19.1 -1.3% Fuel 69.0 124% Total average 16.2 -3.1% % chg Average conventional thermal output 18.9 154.7 15.7 26.7 26.3 1.5% 2006 2007 315 Increase in raw material prices Better mix and lower thermal output +21 -43 €M 293 36.8 22.8
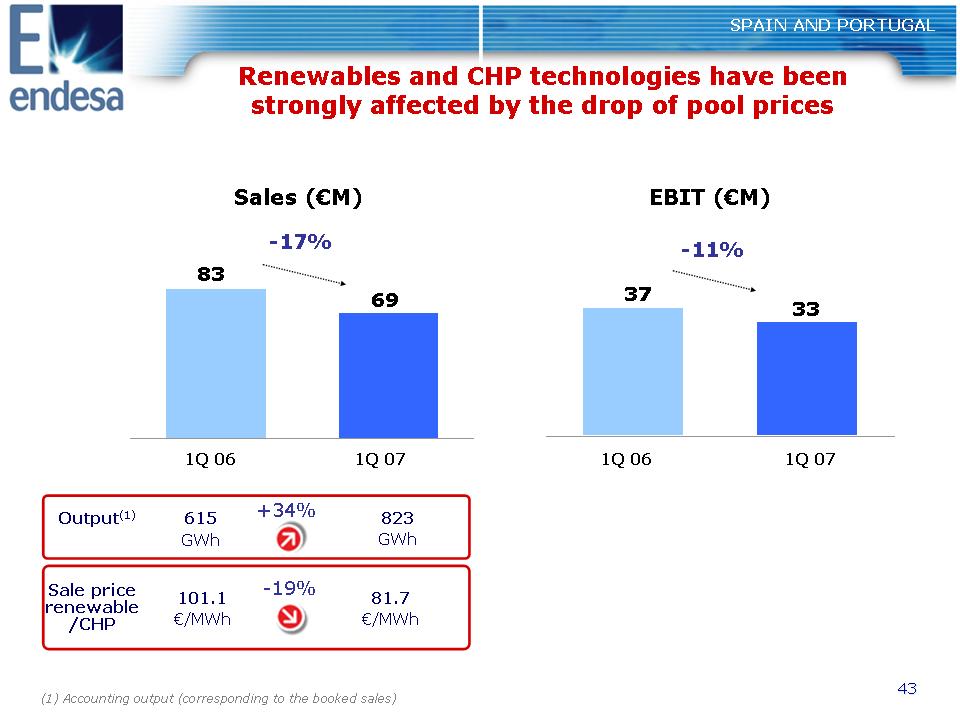
SPAIN AND PORTUGAL Renewables and CHP technologies have been strongly affected by the drop of pool prices (1) Accounting output (corresponding to the booked sales) EBIT (€M) -11% 37 -17% Sales (€M) 83 141 1Q 07 1Q 06 1Q 07 1Q 06 69 33 101.1 €/MWh 81.7 €/MWh -19% Output(1) 615 GWh 823 GWh +34% Sale price renewable /CHP
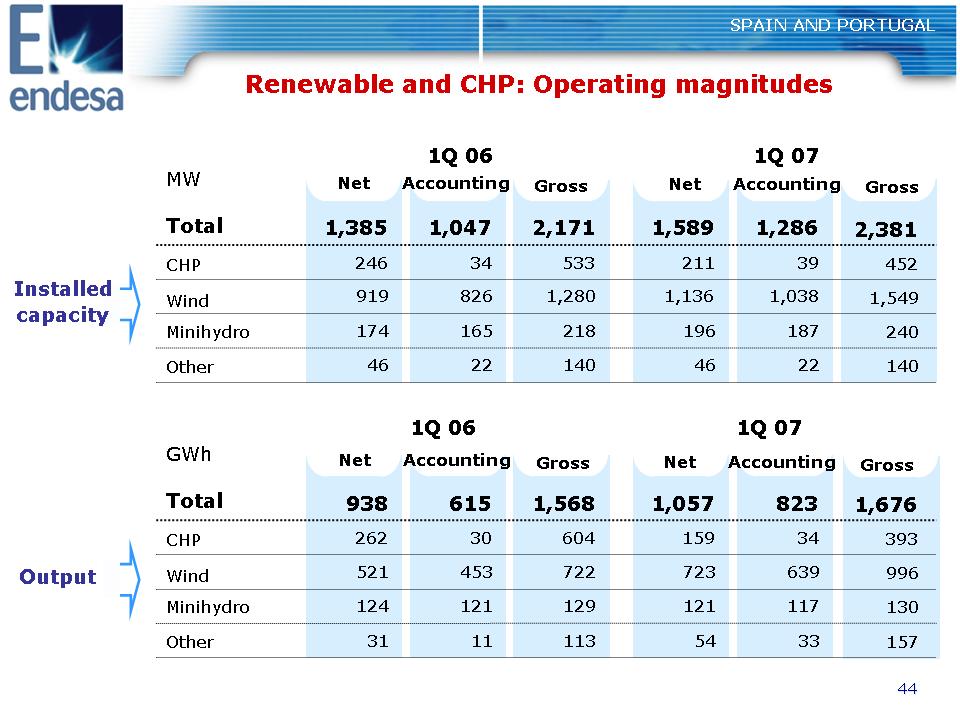
44 Renewable and CHP: Operating magnitudes MW Total CHP Wind Minihydro Other Net Accounting Gross 1Q 06 1Q 07 Installed capacity GWh Total CHP Wind Minihydro Other Output Net Accounting Gross 1Q 06 1Q 07 Net Accounting Gross Net Accounting Gross 919 174 46 246 826 165 22 34 1,280 218 140 533 1,136 196 46 211 1,038 187 22 39 1,549 240 140 452 1,385 1,047 2,171 1,589 1,286 2,381 938 521 124 31 262 615 453 121 11 30 1,568 722 129 113 604 1,057 723 121 54 159 823 639 117 33 34 1,676 996 130 157 393 SPAIN AND PORTUGAL
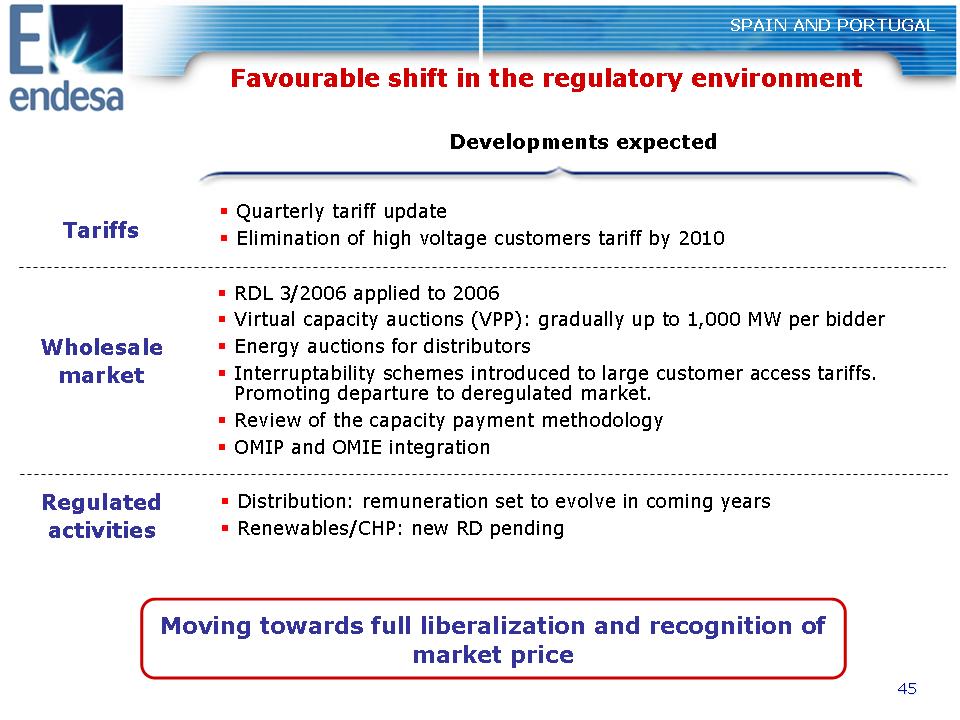
45 Favourable shift in the regulatory environment SPAIN AND PORTUGAL Tariffs Regulated activities ?? Quarterly tariff update ?? Elimination of high voltage customers tariff by 2010 Developments expected ?? Distribution: remuneration set to evolve in coming years ?? Renewables/CHP: new RD pending Moving towards full liberalization and recognition of market price ?? RDL 3/2006 applied to 2006 ?? Virtual capacity auctions (VPP): gradually up to 1,000 MW per bidder ?? Energy auctions for distributors ?? Interruptability schemes introduced to large customer access tariffs. Promoting departure to deregulated market. ?? Review of the capacity payment methodology ?? OMIP and OMIE integration Wholesale market
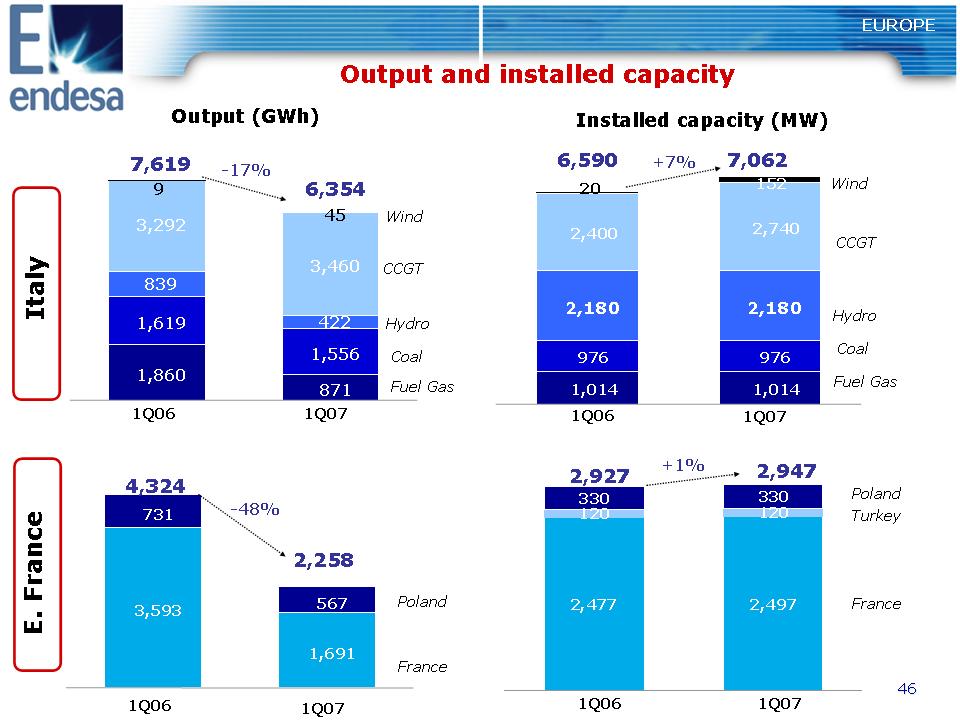
46 3,593 1,691 731 567 Output and installed capacity EUROPE Output (GWh) Fuel Gas Coal Hydro CCGT 7,619 -17% 1Q06 1Q07 Wind 6,354 Installed capacity (MW) France Poland 4,324 -48% 1Q06 1Q07 2,258 Italy E. France 7,062 6,590 1Q06 1Q07 +7% Fuel Gas Coal Hydro CCGT Wind 1,860 871 1,619 1,556 839 422 3,292 3,460 45 9 1,014 1,014 976 976 2,180 2,180 2,400 2,740 152 20 120 120 330 330 2,497 2,477 France Poland 2,927 2,947 +1% Turkey 1Q06 1Q07
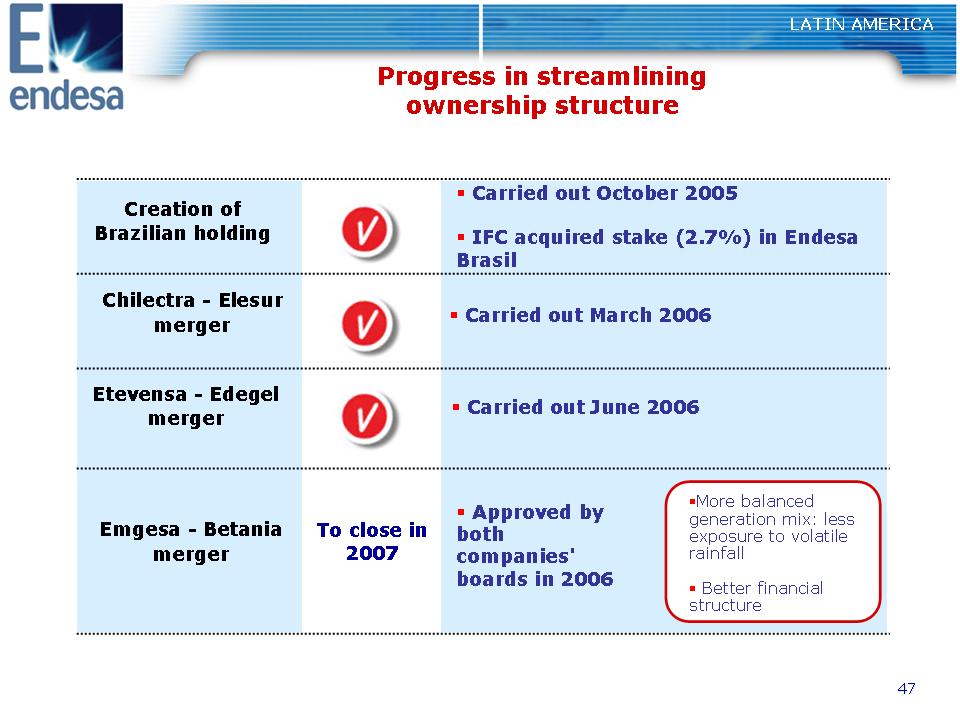
47 LATIN AMERICA Progress in streamlining ownership structure Etevensa - Edegel merger ?? Carried out June 2006 Creation of Brazilian holding ?? Carried out October 2005 ?? IFC acquired stake (2.7%) in Endesa Brasil Chilectra - Elesur merger ?? Carried out March 2006 Emgesa - Betania merger To close in 2007 ?? Approved by both companies' boards in 2006 ??More balanced generation mix: less exposure to volatile rainfall ?? Better financial structure
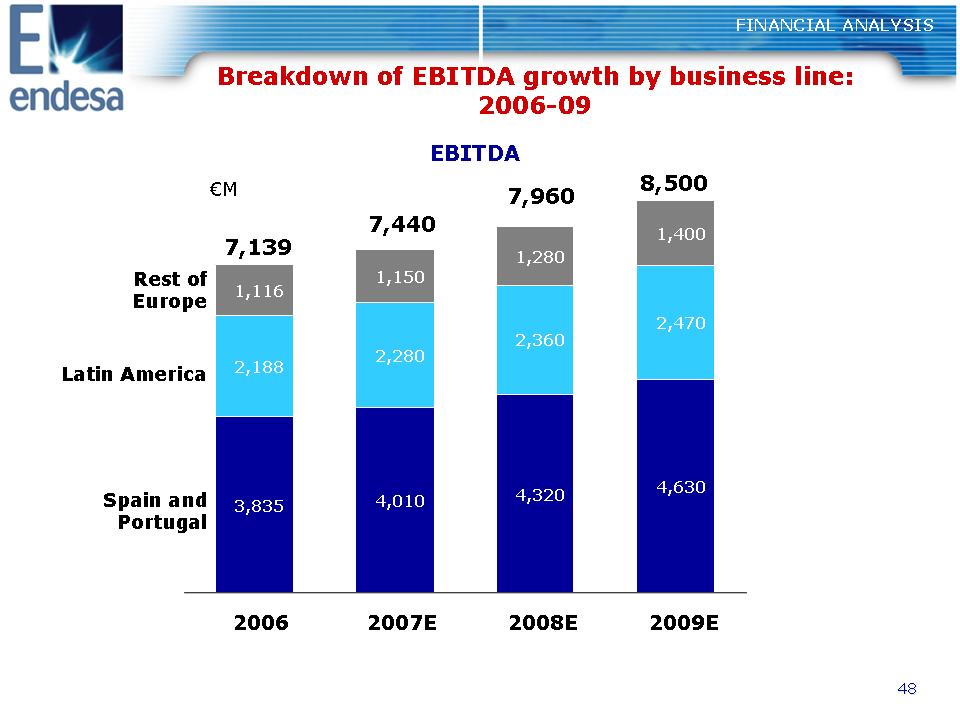
48 Breakdown of EBITDA growth by business line: 2006-09 EBITDA €M 7,139 7,440 7,960 8,500 Spain and Portugal Rest of Europe Latin America 3,835 4,010 4,320 4,630 2,188 2,280 2,360 2,470 1,150 1,280 1,400 1,116 2006 2007E 2008E 2009E FINANCIAL ANALYSIS
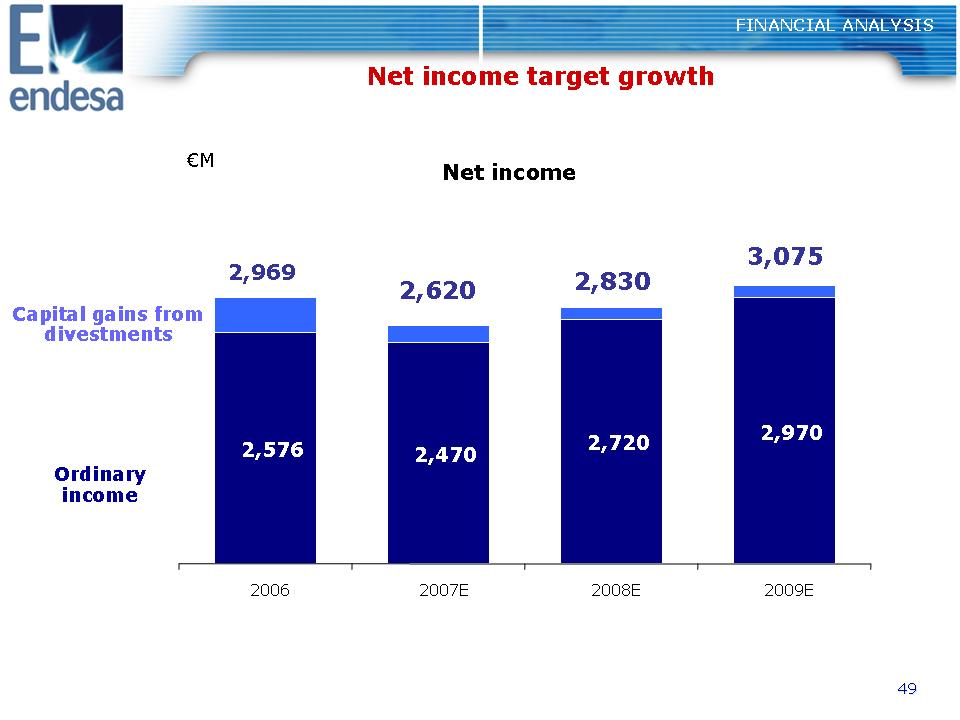
49 Net income Net income target growth Ordinary income Capital gains from divestments €M 3,075 2,620 2,830 2,969 2,576 2,470 2,720 2,970 2006 2007E 2008E 2009E FINANCIAL ANALYSIS
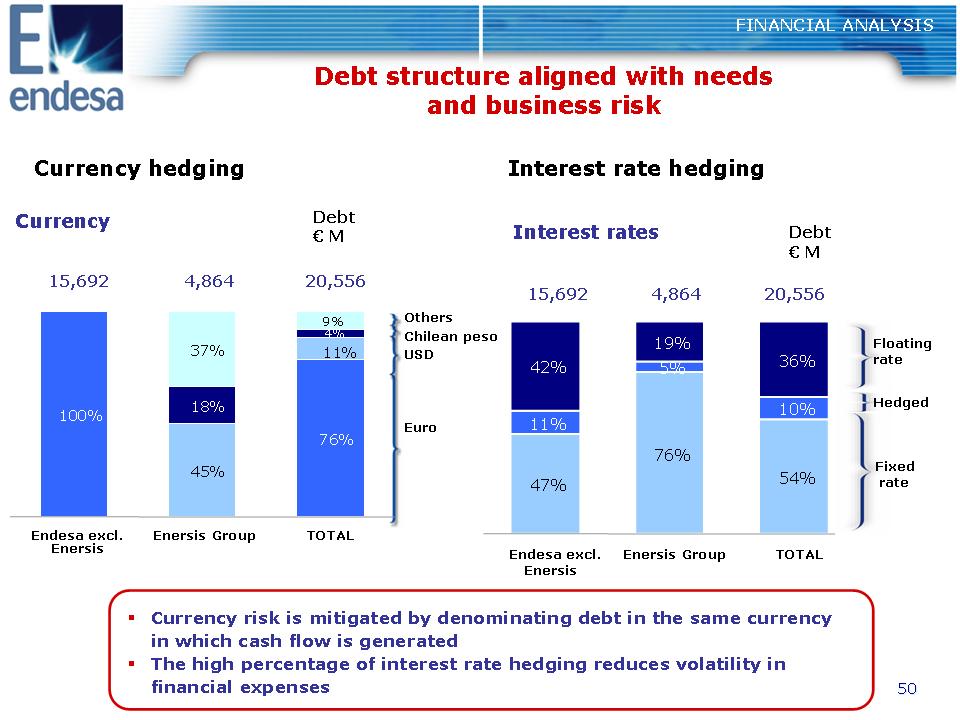
50 47% 76% 54% 11% 10% 42% 19% 36% 5% Endesa excl. Enersis Enersis Group TOTAL FINANCIAL ANALYSIS Debt structure aligned with needs and business risk ?? Currency risk is mitigated by denominating debt in the same currency in which cash flow is generated ?? The high percentage of interest rate hedging reduces volatility in financial expenses Currency Currency hedging Debt € M 15,692 4,864 20,556 Euro USD Chilean peso Others Interest rates Interest rate hedging Debt € M Fixed rate Hedged Floating rate 15,692 4,864 20,556 100% 76% 45% 18% 11% 4% 37% 9% Endesa excl. Enersis Enersis Group TOTAL
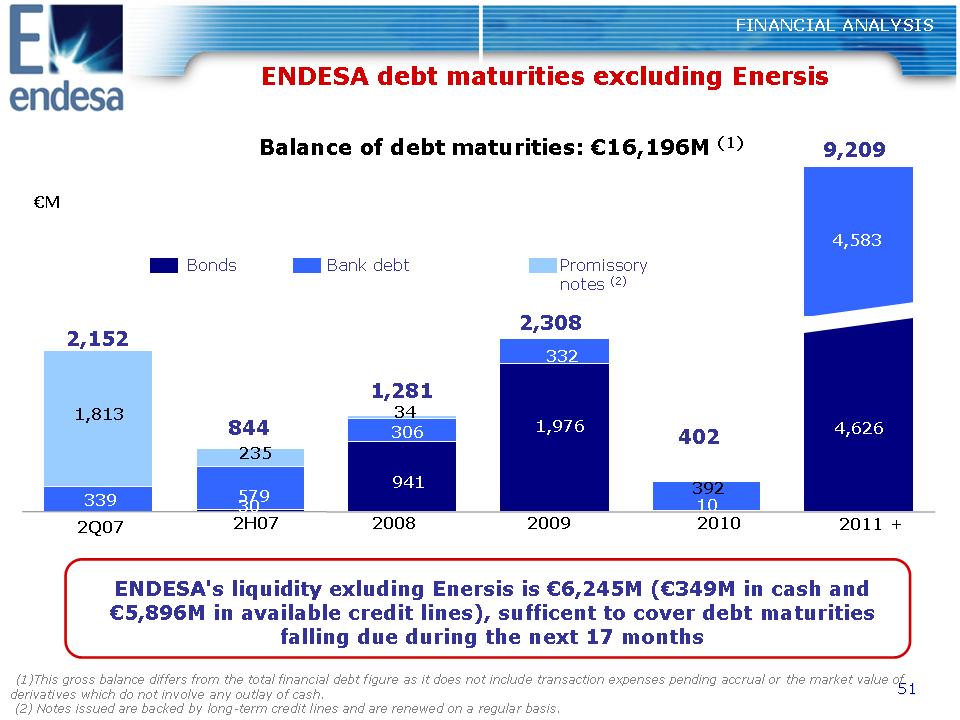
51 10 1,976 941 579 392 339 332 306 1,813 235 FINANCIAL ANALYSIS ENDESA debt maturities excluding Enersis Balance of debt maturities: €16,196M (1) ENDESA's liquidity exluding Enersis is €6,245M (€349M in cash and €5,896M in available credit lines), sufficent to cover debt maturities falling due during the next 17 months €M 2H07 2008 2009 2010 2,152 844 1,281 2,308 402 Bonds Promissory notes (2) Bank debt (1)This gross balance differs from the total financial debt figure as it does not include transaction expenses pending accrual or the market value of derivatives which do not involve any outlay of cash. (2) Notes issued are backed by long-term credit lines and are renewed on a regular basis. 2011 + 9,209 2Q07 30 4,583 4,626 34
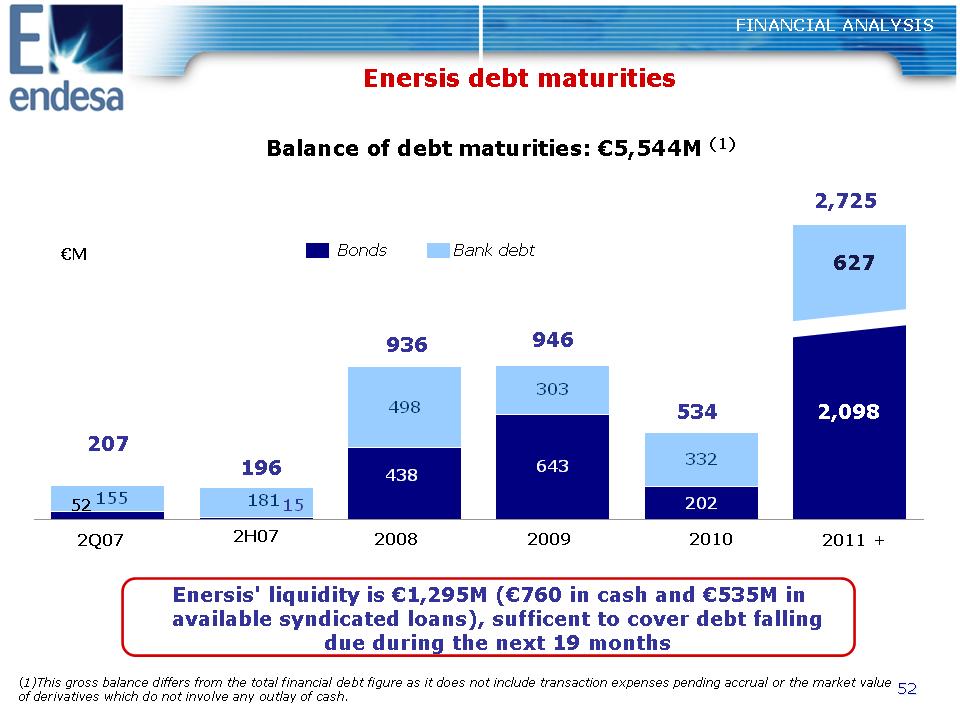
52 FINANCIAL ANALYSIS Enersis debt maturities 202 498 332 438 15 643 181 303 155 €M Balance of debt maturities: €5,544M (1) 2,725 2008 2009 2010 Bonds Bank debt Enersis' liquidity is €1,295M (€760 in cash and €535M in available syndicated loans), sufficent to cover debt falling due during the next 19 months 534 946 936 196 207 2011 + (1)This gross balance differs from the total financial debt figure as it does not include transaction expenses pending accrual or the market value of derivatives which do not involve any outlay of cash. 2H07 2Q07 52 627 2,098
53 Legal Information This document was made available to shareholders of Endesa, S.A.. In relation with the announced joint offer by ENEL SpA and Acciona, S.A., Endesa shareholders are urged to read the report of Endesa’s board of directors when it is filed by the Company with the Comisión Nacional del Mercado de Valores (the "CNMV"), as well as Endesa's Solicitation/Recommendation Statement on Schedule 14D-9 when it is filed by the Company with the U.S. Securities and Exchange Commission (the "SEC"), as it will contain important information. Such documents and other public filings made from time to time by Endesa with the CNMV or the SEC are available without charge from the Endesa’s website at www.endesa.es, from the the CNMV’s website at www.cnmv.es and from the SEC’s website at www.sec.gov and at Endesa’s principal executive offices in Madrid, Spain. This presentation contains certain “forward-looking” statements regarding anticipated financial and operating results and statistics and other future events. These statements are not guarantees of future performance and they are subject to material risks, uncertainties, changes and other factors that may be beyond ENDESA’s control or may be difficult to predict. Forward-looking statements include, but are not limited to, information regarding: estimated future earnings; anticipated increases in wind and CCGTs generation and market share; expected increases in demand for gas and gas sourcing; management strategy and goals; estimated cost reductions; tariffs and pricing structure; estimated capital expenditures and other investments; estimated asset disposals; estimated increases in capacity and output and changes in capacity mix; repowering of capacity and macroeconomic conditions. For example, the EBITDA (gross operating profit as per ENDESA’s consolidated income statement) target for 2007-2009 included in this presentation are forward-looking statements and are based on certain assumptions which may or may not prove correct. The main assumptions on which these expectations and targets are based are related to the regulatory setting, exchange rates, divestments, increases in production and installed capacity in markets where ENDESA operates, increases in demand in these markets, assigning of production amongst different technologies, increases in costs associated with higher activity that do not exceed certain limits, electricity prices not below certain levels, the cost of CCGT plants, and the availability and cost of the gas, coal, fuel oil and emission rights necessary to run our business at the desired levels. In these statements we avail ourselves of the protection provided by the Private Securities Litigation Reform Act of 1995 of the United States of America with respect to forward-looking statements. The following important factors, in addition to those discussed elsewhere in this presentation, could cause actual financial and operating results and statistics to differ materially from those expressed in our forward-looking statements: Economic and industry conditions: significant adverse changes in the conditions of the industry, the general economy or our markets; the effect of the prevailing regulations or changes in them; tariff reductions; the impact of interest rate fluctuations; the impact of exchange rate fluctuations; natural disasters; the impact of more restrictive environmental regulations and the environmental risks inherent to our activity; potential liabilities relating to our nuclear facilities. Transaction or commercial factors: any delays in or failure to obtain necessary regulatory, antitrust and other approvals for our proposed acquisitions or asset disposals, or any conditions imposed in connection with such approvals; our ability to integrate acquired businesses successfully; the challenges inherent in diverting management's focus and resources from other strategic opportunities and from operational matters during the process of integrating acquired businesses; the outcome of any negotiations with partners and governments. Delays in or impossibility of obtaining the pertinent permits and rezoning orders in relation to real estate assets. Delays in or impossibility of obtaining regulatory authorisation, including that related to the environment, for the construction of new facilities, repowering or improvement of existing facilities; shortage of or changes in the price of equipment, material or labour; opposition of political or ethnic groups; adverse changes of a political or regulatory nature in the countries where we or our companies operate; adverse weather conditions, natural disasters, accidents or other unforeseen events, and the impossibility of obtaining financing at what we consider satisfactory interest rates. Political/governmental factors: political conditions in Latin America; changes in Spanish, European and foreign laws, regulations and taxes. Operating factors: technical problems; changes in operating conditions and costs; capacity to execute cost-reduction plans; capacity to maintain a stable supply of coal, fuel and gas and the impact of the price fluctuations of coal, fuel and gas; acquisitions or restructuring; capacity to successfully execute a strategy of internationalisation and diversification. Competitive factors: the actions of competitors; changes in competition and pricing environments; the entry of new competitors in our markets. Further details on the factors that may cause actual results and other developments to differ significantly from the expectations implied or explicitly contained in the presentation are given in the Risk Factors section of Form 20-F filed with the SEC and in the ENDESA Share Registration Statement filed with the Comisión Nacional del Mercado de Valores (the Spanish securities regulator or the “CNMV” for its initials in Spanish). No assurance can be given that the forward-looking statements in this document will be realised. Except as may be required by applicable law, neither Endesa nor any of its affiliates intends to update these forward-looking statements.
54 1Q07 Results Strong growth across all businesses May 4, 2007 1Q 2007 Results