FORM 6-K
SECURITIES AND EXCHANGE COMMISSION
Washington, D.C. 20549
Report of Foreign Issuer
Pursuant to Rule 13a-16 or 15d-16 of
the Securities Exchange Act of 1934
For the month of June, 2007
Commission File Number: 333-07654
ENDESA, S.A.
(Translation of Registrant's Name into English)
Ribera del Loira, 60
28042 Madrid, Spain
(Address of principal executive office)
Indicate by check mark whether the registrant files or will file
annual reports under cover of Form 20-F or Form 40-F:
| Form 20-F | X | Form 40-F |
Indicate by check mark if the registrant is submitting the Form 6-K
in paper as permitted by Regulation S-T Rule 101(b)(1):
| Yes | No | X |
Indicate by check mark if the registrant is submitting the Form 6-K
in paper as permitted by Regulation S-T Rule 101(b)(7):
| Yes | No | X |
Indicate by check mark whether by furnishing the information
contained in this Form, the Registrant is also thereby furnishing the information to the Commission
pursuant to Rule 12g3-2(b) under the Securities Exchange Act of 1934:
| Yes | No | X |
If “Yes” is marked, indicate below the file number assigned to the registrant
in connection with Rule 12g3-2(b): N/A
Endesa Red Growth and Profitability Jose Luis Marin Lopez-Otero Chief Executive Endesa Red Valencia, June 25, 2007
Contents Endesa Red now Results obtained Regulatory framework Our "route map": Strategic plan A future of growth and profitability 1
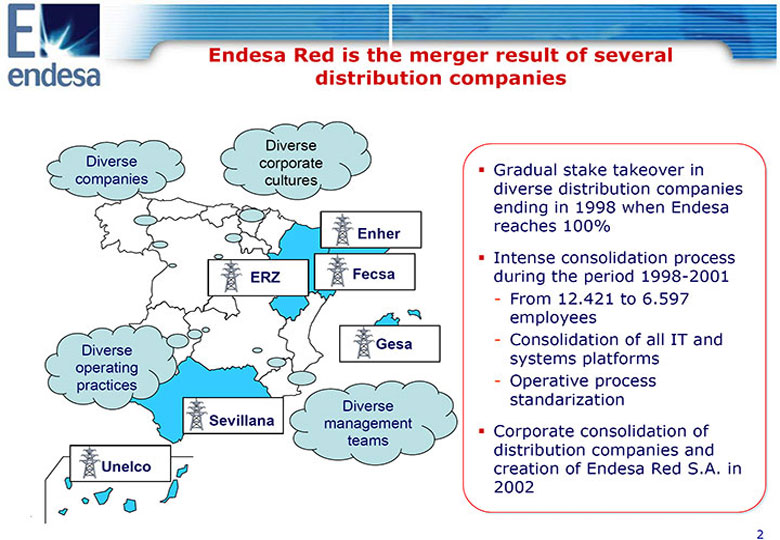
Endesa Red is the merger result of several distribution companies Diverse Diverse corporate Gradual stake takeover in companies cultures diverse distribution companies ending in 1998 when Endesa reaches 100% Enher Intense consolidation process ERZ Fecsa during the period 1998-2001 - - From 12.421 to 6.597 employees Gesa - Consolidation of all IT and Diverse systems platforms operating practices - Operative process Diverse standarization Sevillana management Corporate consolidation of teams distribution companies and Unelco creation of Endesa Red S.A. in 2002 2
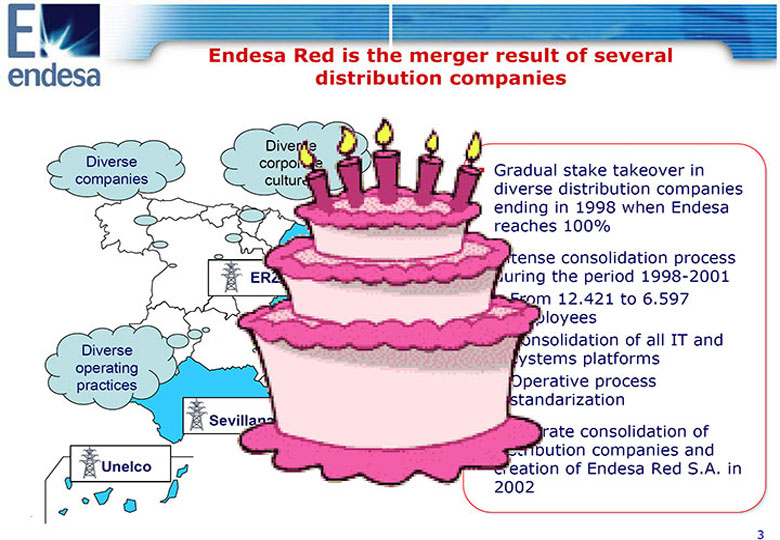
Endesa Red is the merger result of several distribution companies Diverse Diverse corporate Gradual stake takeover in companies cultures diverse distribution companies ending in 1998 when Endesa reaches 100% Enher Intense consolidation process ERZ Fecsa during the period 1998-2001 - From 12.421 to 6.597 employees Gesa - Consolidation of all IT and Diverse systems platforms operating practices Operative process Diverse standarization Sevillana management Corporate consolidation of teams distribution companies and Unelco creation of Endesa Red S.A. in 2002 3
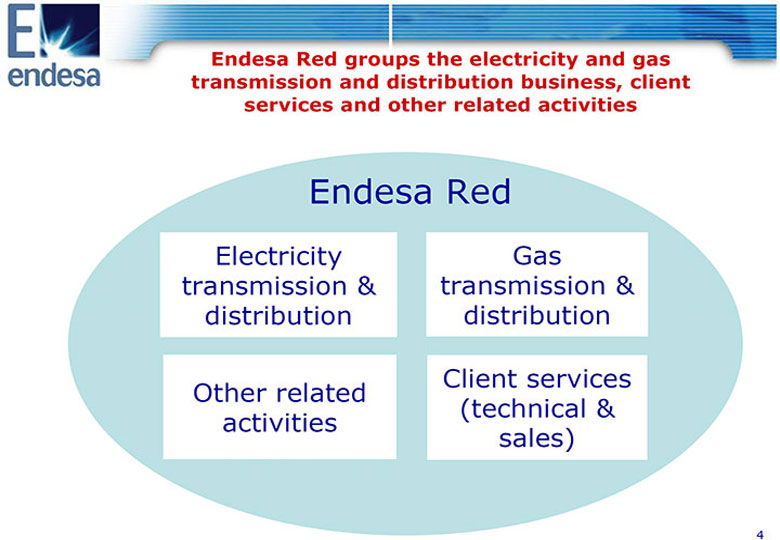
Endesa Red groups the electricity and gas transmission and distribution business, client services and other related activities Endesa Red Electricity Gas transmission &transmission & distribution distribution Client services Other related (technical &activities sales) 4
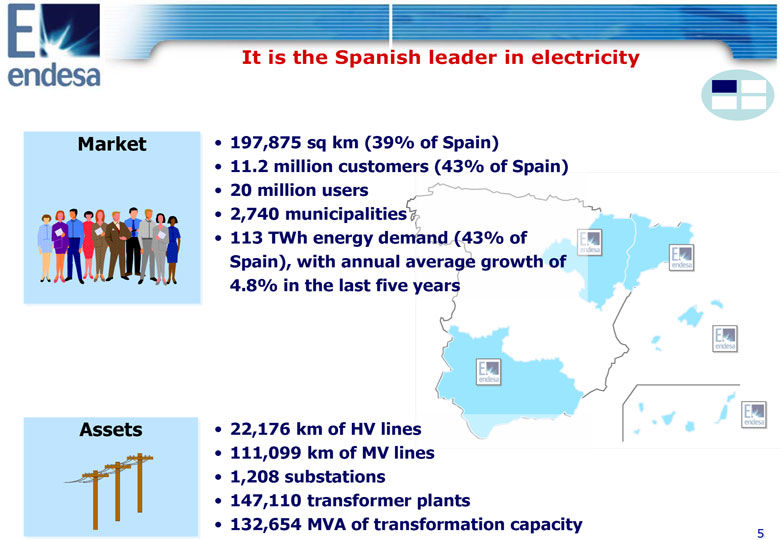
It is the Spanish leader in electricity Market 197,875 sq km (39% of Spain) 11.2 million customers (43% of Spain) 20 million users 2,740 municipalities 113 TWh energy demand (43% of Spain), with annual average growth of 4.8% in the last five years Assets 22,176 km of HV lines 111,099 km of MV lines 1,208 substations 147,110 transformer plants 132,654 MVA of transformation capacity 5
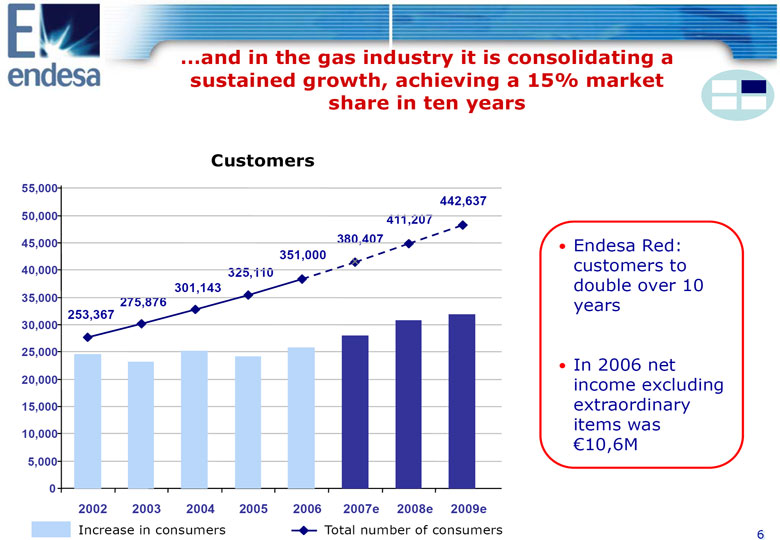
and in the gas industry it is consolidating a sustained growth, achieving a 15% market share in ten years Customers 55,000 442,637 50,000 411,207 45,000 380,407 Endesa Red: 351,000 40,000 325,110 customers to 301,143 double over 10 35,000 275,876 years 253,367 30,000 25,000 In 2006 net 20,000 income 15,000 excluding extraordinary 10,000 items was 5,000 (euro)10,6M 0 2002 2003 2004 2005 2006 2007e 2008e 2009e Increase in consumers Total number of consumers 6
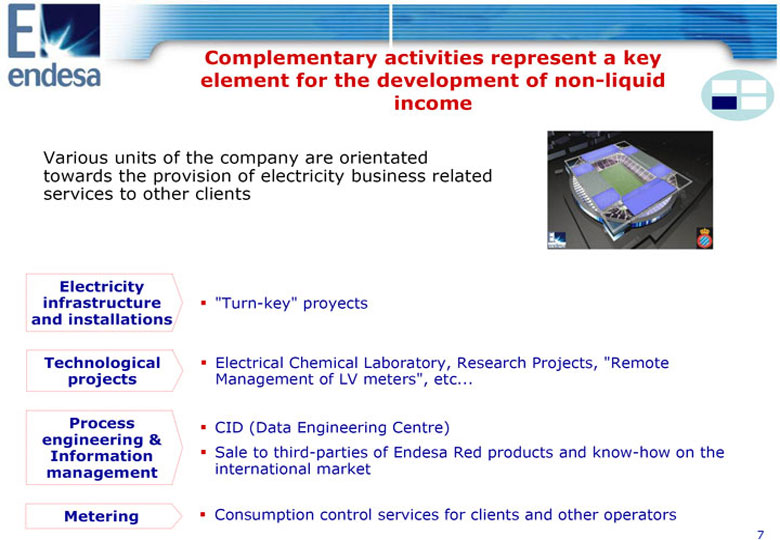
Complementary activities represent a key element for the development of non-liquid income Various units of the company are orientated towards the provision of electricity business related services to other clients Electricity infrastructure "Turn-key" proyects and installations Technological Electrical Chemical Laboratory, Research Projects, "Remote projects Management of LV meters", etc... Process CID (Data Engineering Centre) engineering & Information Sale to third-parties of Endesa Red products and know-how on the management international market Metering Consumption control services for clients and other operators 7
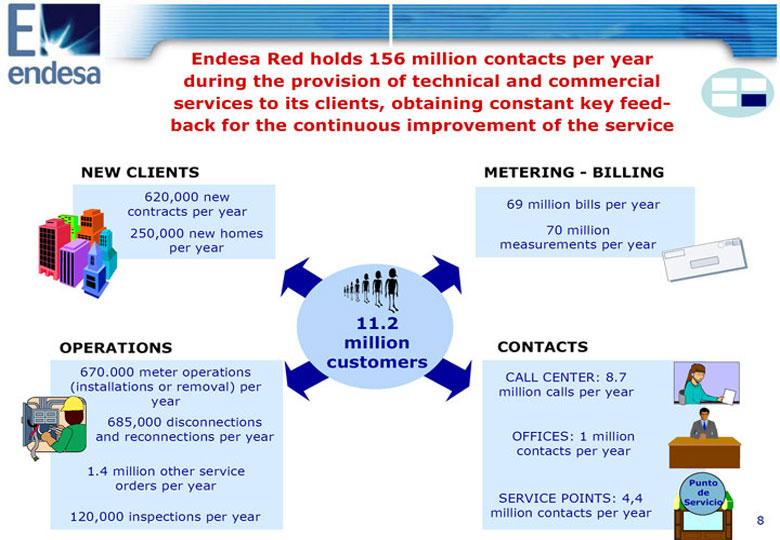
Endesa Red holds 156 million contacts per year during the provision of technical and commercial services to its clients, obtaining constant key feedback for the continuous improvement of the service NEW CLIENTS METERING - BILLING 620,000 new 69 million bills per year contracts per year 250,000 new homes 70 million per year measurements per year 11.2 OPERATIONS million CONTACTS customers 670.000 meter operations CALL CENTER: 8.7 (installations or removal) per million calls per year year 685,000 disconnections and reconnections per year OFFICES: 1 million contacts per year 1.4 million other service orders per year Punto SERVICE POINTS: 4,4 de Servicio 120,000 inspections per year million contacts per year 8
Contents Endesa Red now Results obtained Regulatory framework Our "route map": Strategic plan A future of growth and profitability 9

Endesa Red measures its results on the basis of the four dimensions of its Business Vision... Sustainability Profitability Quality Safety 10
Endesa Red measures its results on the basis of the four dimensions of its Business Vision... ... and all this in a dynamic environment Patrocinador Oficial de la 32a Ameerica’s Cup 11
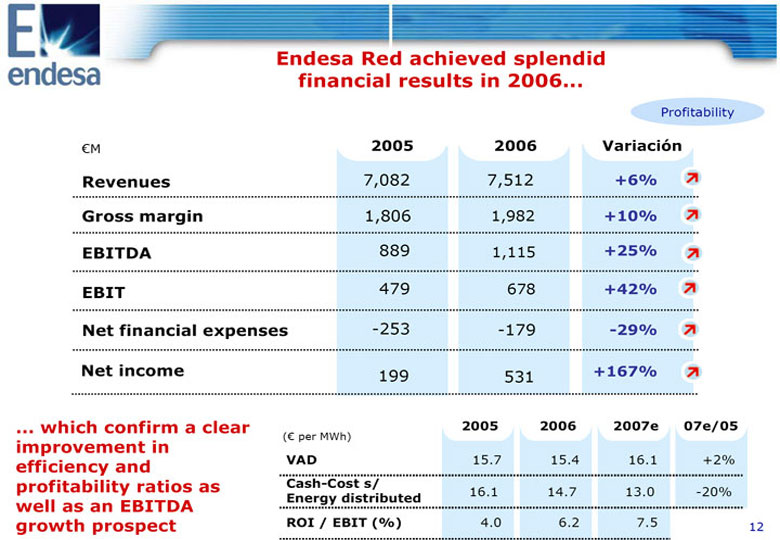
Endesa Red achieved splendid financial results in 2006... Profitability (euro)M 2005 2006 Variacion Revenues 7,082 7,512 +6% Gross margin 1,806 1,982 +10% EBITDA 889 1,115 +25% EBIT 479 678 +42% Net financial expenses -253 -179 -29% Net income 199 531 +167% ... which confirm a clear 2005 2006 2007e 07e/05 ((euro) per MWh) improvement in efficiency and VAD 15.7 15.4 16.1 +2% profitability ratios as Cash-Cost s/ Energy distributed 16.1 14.7 13.0 -20% well as an EBITDA growth prospect ROI / EBIT (%) 4.0 6.2 7.5 12
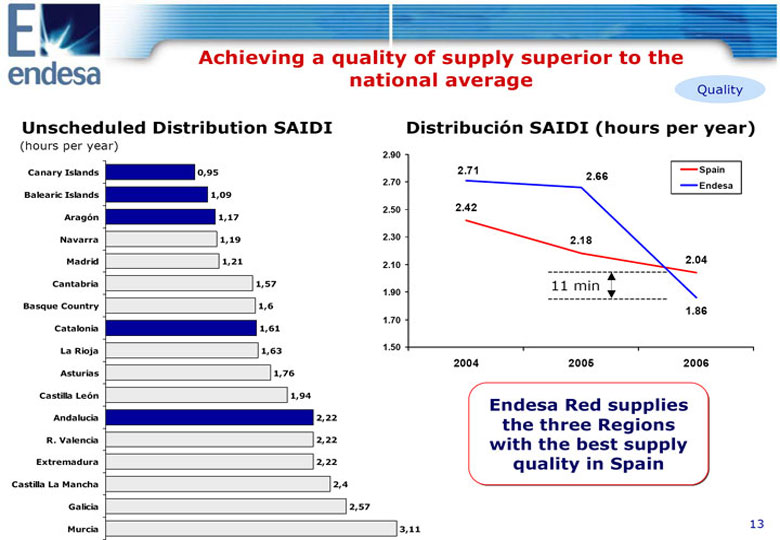
Achieving a quality of supply superior to the national average Quality Unscheduled Distribution SAIDI Distribucion SAIDI (hours per year) (hours per year) 2.90 Canary Islands 0,95 2.71 Spain 2.66 2.70 Endesa Balearic Islands 1,09 2.50 2.42 Aragon 1,17 Navarra 1,19 2.30 2.18 Madrid 1,21 2.04 2.10 Cantabria 1,57 11 min 1.90 Basque Country 1,6 1.86 1.70 Catalonia 1,61 La Rioja 1,63 1.50 2004 2005 2006 Asturias 1,76 Castilla Leon 1,94 Endesa Red supplies Andalucia 2,22 the three Regions R. Valencia 2,22 with the best supply Extremadura 2,22 quality in Spain Castilla La Mancha 2,4 Galicia 2,57 Murcia 3,11 13
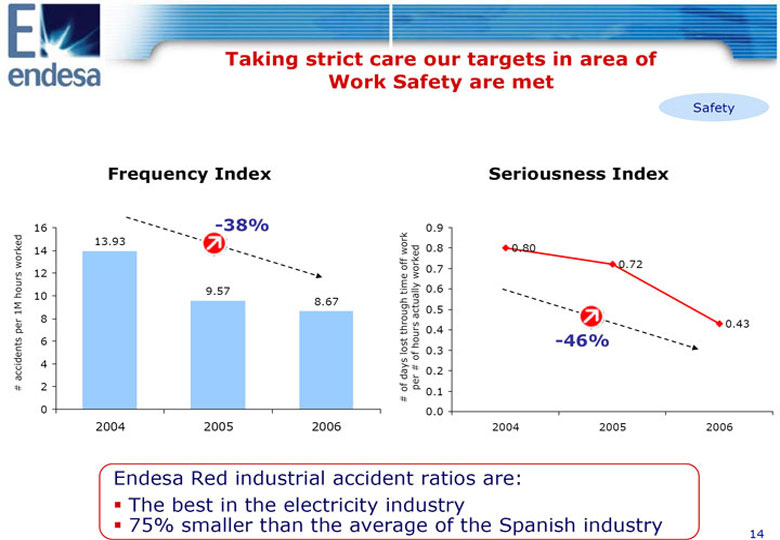
Taking strict care our targets in area of Work Safety are met Safety Frequency Index Seriousness Index 16 -38% 0.9 13.93 14 0.8 0.80 0.7 0.72 12 9.57 0.6 10 8.67 0.5 8 0.43 0.4 6 -46% 0.3 4 per # of hours actually worked 0.2 # accidents per 1M hours worked 2 # of days lost through time off work 0.1 0 0.0 2004 2005 2006 2004 2005 2006 Endesa Red industrial accident ratios are: The best in the electricity industry 75% smaller than the average of the Spanish industry 14
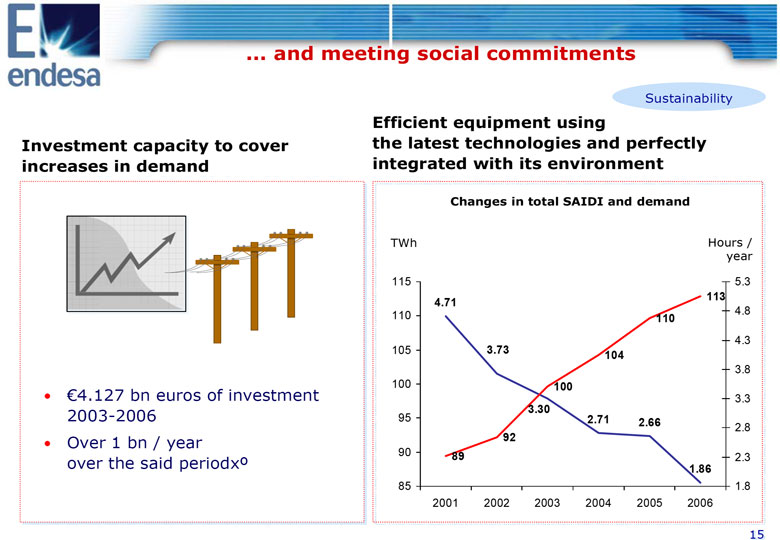
.... and meeting social commitments Sustainability Efficient equipment using Investment capacity to cover the latest technologies and perfectly increases in demand integrated with its environment Changes in total SAIDI and demand TWh Hours / year 115 5.3 113 4.71 110 4.8 110 4.3 105 3.73 104 3.8 100 100 o (euro)4.127 bn euros of investment 3.3 3.30 2003-2006 95 2.71 2.66 2.8 o Over 1 bn / year 92 90 89 2.3 over the said periodx(0) 1.86 85 1.8 2001 2002 2003 2004 2005 2006 15
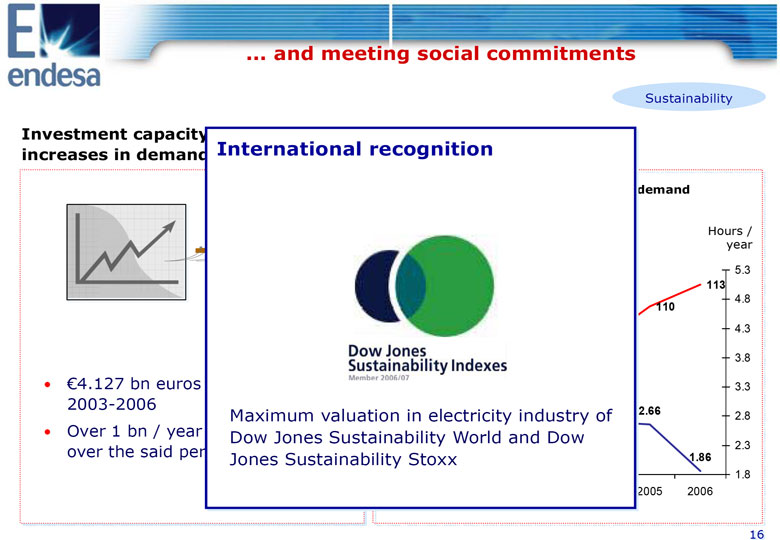
.... and meeting social commitments Sustainability Investment capacity increases in demand International recognition demand Hours / year 5.3 113 4.8 110 4.3 3.8 o (euro)4.127 bn euros 3.3 2003-2006 2.66 Maximum valuation in electricity industry of 2.8 o Over 1 bn / year Dow Jones Sustainability World and Dow over the said 2.3 Jones Sustainability Stoxx 1.86 1.8 2005 2006 16
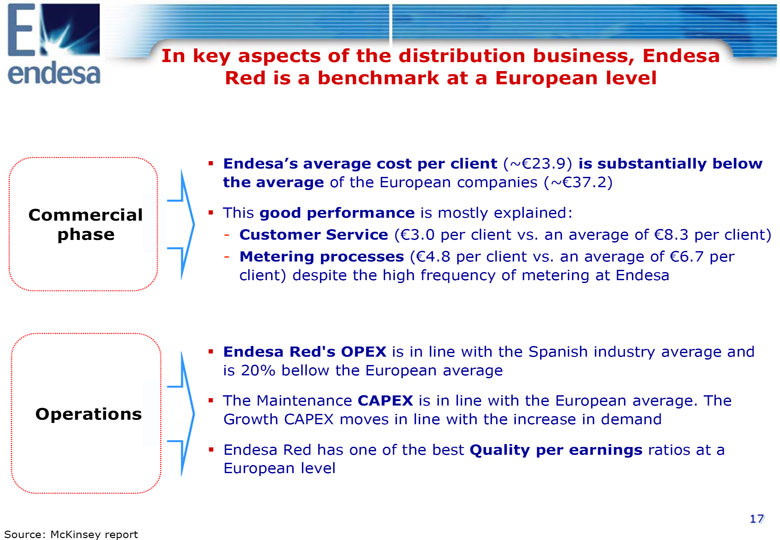
In key aspects of the distribution business, Endesa Red is a benchmark at a European level Endesa's average cost per client (~(euro)23.9) is substantially below the average of the European companies (~(euro)37.2) Commercial This good performance is mostly explained: phase - Customer Service ((euro)3.0 per client vs. an average of (euro)8.3 per client) - Metering processes ((euro)4.8 per client vs. an average of (euro)6.7 per client) despite the high frequency of metering at Endesa Endesa Red's OPEX is in line with the Spanish industry average and is 20% bellow the European average The Maintenance CAPEX is in line with the European average. The Operations Growth CAPEX moves in line with the increase in demand Endesa Red has one of the best Quality per earnings ratios at a European level 17
Source: McKinsey report Contents Endesa Red now Results obtained Regulatory framework Our "route map": Strategic plan A future of growth and profitability 18
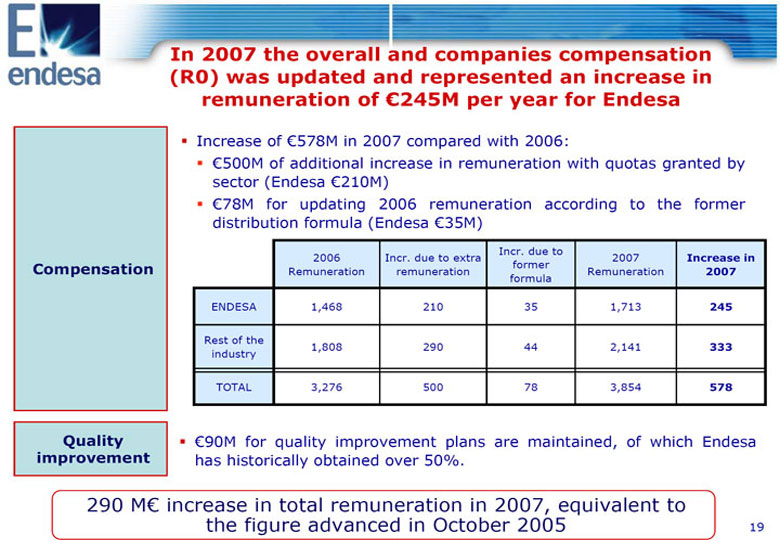
In 2007 the overall and companies compensation (R0) was updated and represented an increase in remuneration of (euro)245M per year for Endesa Increase of (euro)578M in 2007 compared with 2006: (euro)500M of additional increase in remuneration with quotas granted by sector (Endesa (euro)210M) (euro)78M for updating 2006 remuneration according to the former distribution formula (Endesa (euro)35M) Incr. due to 2006 Incr. due to extra 2007 Increase in Compensation former Remuneration remuneration Remuneration 2007 formula ENDESA 1,468 210 35 1,713 245 Rest of the 1,808 290 44 2,141 333 industry TOTAL 3,276 500 78 3,854 578 Quality (euro)90M for quality improvement plans are maintained, of which Endesa improvement has historically obtained over 50%. 290 M(euro) increase in total remuneration in 2007, equivalent to the figure advanced in October 2005 19
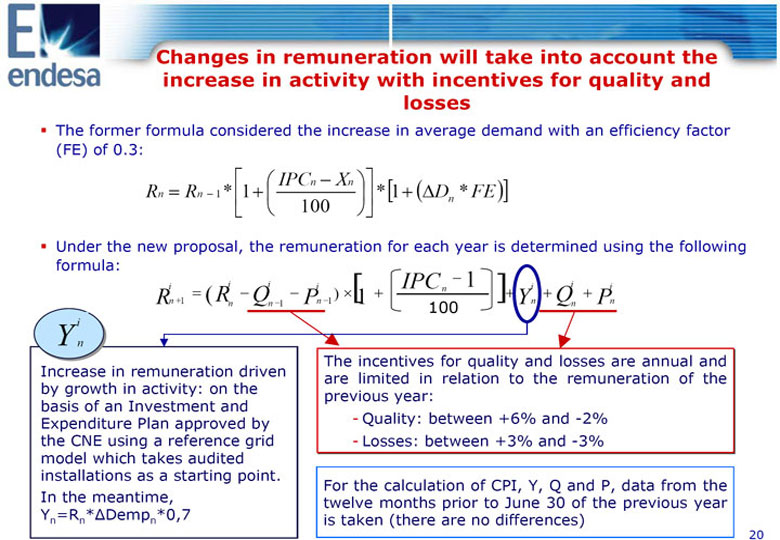
Changes in remuneration will take into account the increase in activity with incentives for quality and losses The former formula considered the increase in average demand with an efficiency factor (FE) of 0.3: IPCn - Xn ( ) Rn = Rn -1 * 1+ *[1+ Dn * FE ] 100 Under the new proposal, the remuneration for each year is determined using the following formula: - 1 i i i i IPC i i i = (R -Q - ) x[ + n ]+ +Q + Rn +1 n n -1 Pn -1 1 100 Yn n Pn Y(i)n The incentives for quality and losses are annual and Increase in remuneration driven are limited in relation to the remuneration of the by growth in activity: on the previous year: basis of an Investment and Expenditure Plan approved by - Quality: between +6% and -2% the CNE using a reference grid - Losses: between +3% and -3% model which takes audited installations as a starting point. For the calculation of CPI, Y, Q and P, data from the In the meantime, twelve months prior to June 30 of the previous year (Y)n(=R)n(*)(Demp)n(*0,7) is taken (there are no differences) 20

The transposition of the EU Directive moves towards the unbundling of activities and the end of tariff Unbundling of supply and distribution, giving responsibility of the commercialization of the regulated energy (tariff) to the supplier company Criteria to guarantee the independent management of the distributor will be Unbundling of activities established in each electricity company. The CNE will carry out a supervising role Once tariff disappears, only supply of last resort will remain - Integral tariff will disappear in January 1, 2009 - The Tariff of Last Resort will progressively be restricted and, beyond January 1, 2011, it will be only available to domestic users below 50 of Last Resort kW Disappearance of tariffs and Tariff A Supervisory Office for supplier changes must be established A single transmission company for the primary transmission grid (= 380kV) Secondary transmission assets with specific characteristics can be carried and Distrib. out by distribution companies under the authorization of the Industry Transm. Ministry and the Regions 21

Contents Endesa Red now Results obtained Regulatory framework Our "route map": Strategic plan A future of growth and profitability 22
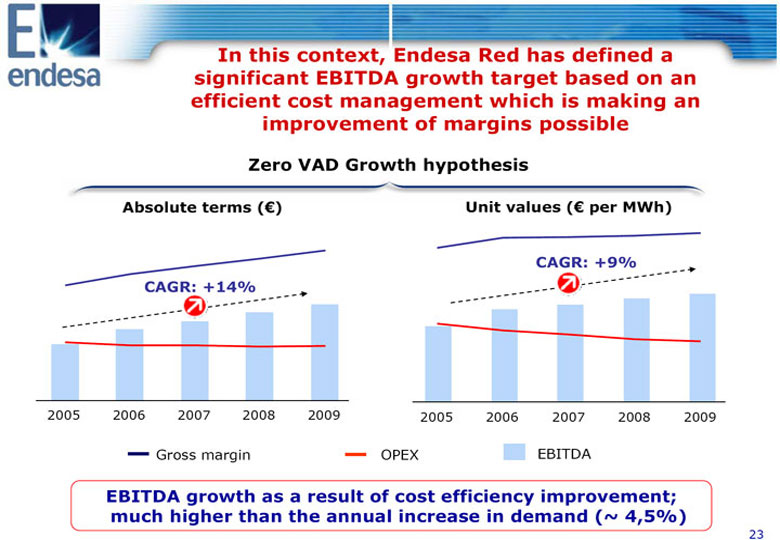
In this context, Endesa Red has defined a significant EBITDA growth target based on an efficient cost management which is making an improvement of margins possible Zero VAD Growth hypothesis Absolute terms (euro) Unit values ((euro) per MWh) CAGR: +9% CAGR: +14% 2005 2006 2007 2008 2009 2005 2006 2007 2008 2009 Gross margin OPEX EBITDA EBITDA growth as a result of cost efficiency improvement; much higher than the annual increase in demand (~ 4,5%) 23
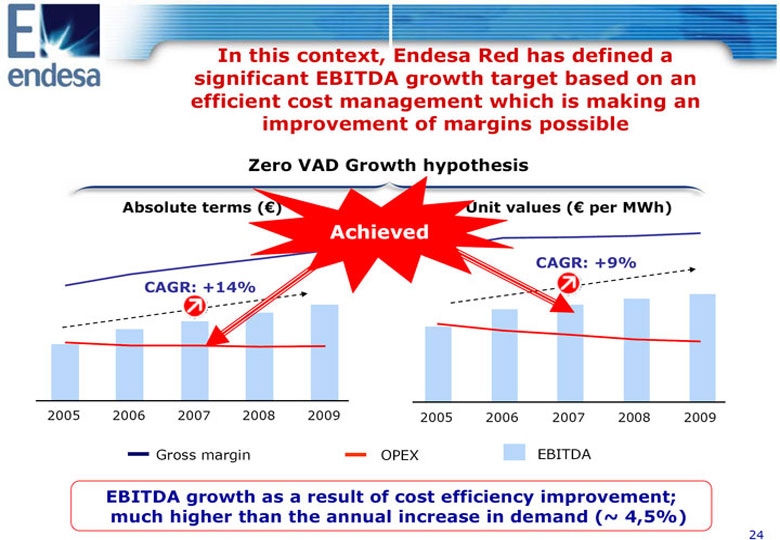
In this context, Endesa Red has defined a significant EBITDA growth target based on an efficient cost management which is making an improvement of margins possible Zero VAD Growth hypothesis Absolute terms ((euro)) Unit values ((euro) per MWh) Achieved CAGR: +9% CAGR: +14% 2005 2006 2007 2008 2009 2005 2006 2007 2008 2009 Gross margin OPEX EBITDA EBITDA growth as a result of cost efficiency improvement; much higher than the annual increase in demand (~ 4,5%) 24
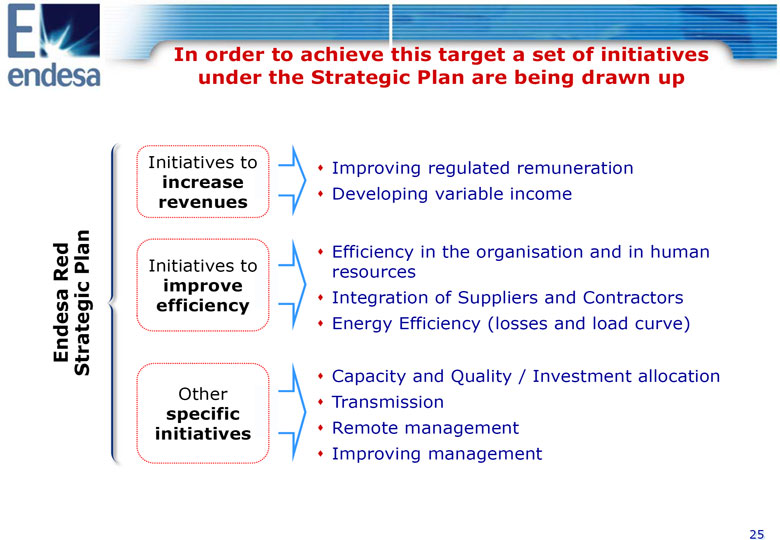
In order to achieve this target a set of initiatives under the Strategic Plan are being drawn up Initiatives to Improving regulated remuneration increase revenues Developing variable income Efficiency in the organisation and in human Plan Initiatives to resources improve efficiency Integration of Suppliers and Contractors Endesa Red Strategic Energy Efficiency (losses and load curve) Capacity and Quality / Investment allocation Other Transmission specific initiatives Remote management Improving management 25
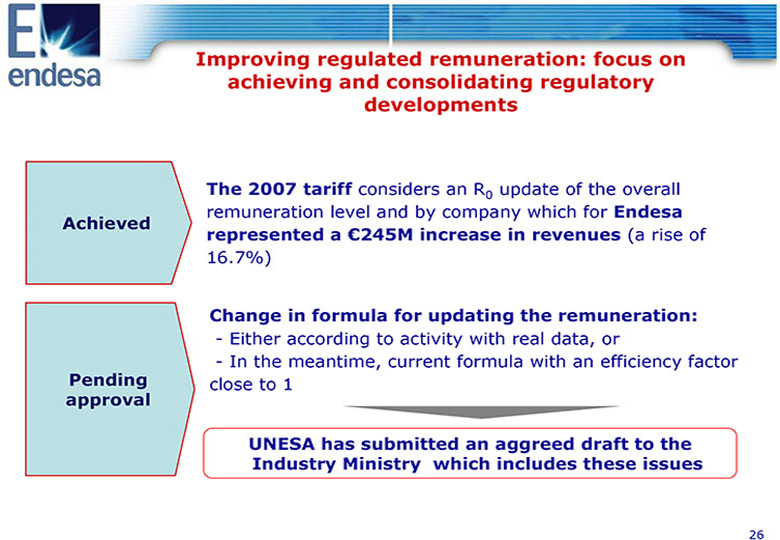
Improving regulated remuneration: focus on achieving and consolidating regulatory developments The 2007 tariff considers an R0 update of the overall remuneration level and by company which for Endesa Achieved represented a (euro)245M increase in revenues (a rise of 16.7%) Change in formula for updating the remuneration: - Either according to activity with real data, or - In the meantime, current formula with an efficiency factor Pending close to 1 approval UNESA has submitted an aggreed draft to the Industry Ministry which includes these issues 26
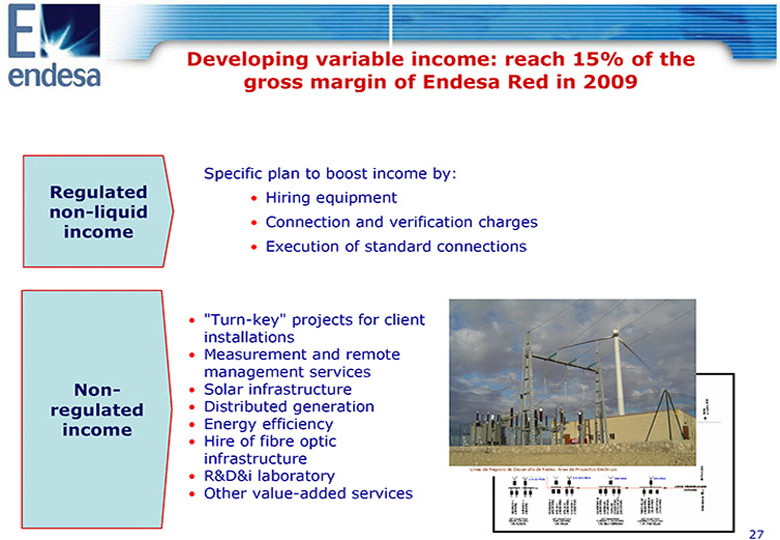
Developing variable income: reach 15% of the gross margin of Endesa Red in 2009 Specific plan to boost income by: Regulated o Hiring equipment non-liquid o Connection and verification charges income o Execution of standard connections o "Turn-key" projects for client installations o Measurement and remote management services Non- o Solar infrastructure regulated o Distributed generation income o Energy efficiency o Hire of fibre optic infrastructure o R&D&i laboratory o Other value-added services 27
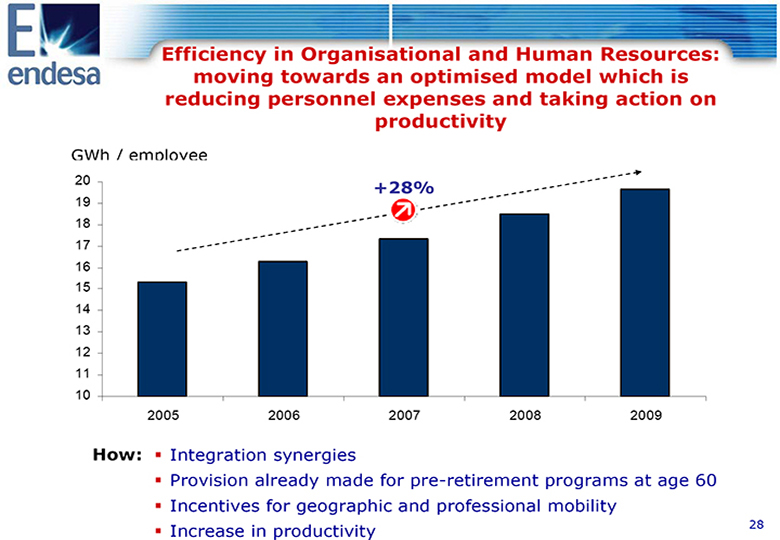
Efficiency in Organisational and Human Resources: moving towards an optimised model which is reducing personnel expenses and taking action on productivity GWh / employee 20 +28% 19 18 17 16 15 14 13 12 11 10 2005 2006 2007 2008 2009 How: Integration synergies Provision already made for pre-retirement programs at age 60 Incentives for geographic and professional mobility Increase in productivity 28
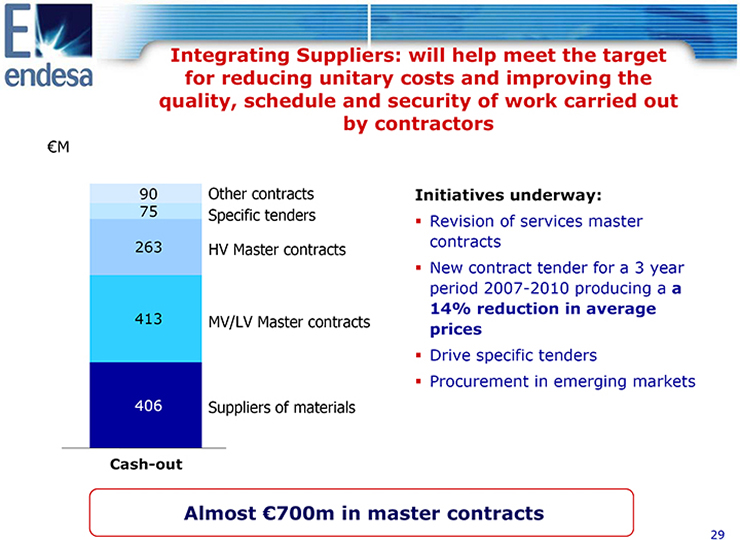
Integrating Suppliers: will help meet the target for reducing unitary costs and improving the quality, schedule and security of work carried out by contractors (euro)M 90 Other contracts Initiatives underway: 75 Specific tenders Revision of services master 263 contracts HV Master contracts New contract tender for a 3 year period 2007-2010 producing a a 14% reduction in average 413 MV/LV Master contracts prices Drive specific tenders Procurement in emerging markets 406 Suppliers of materials Cash-out Almost (euro)700m in master contracts 29
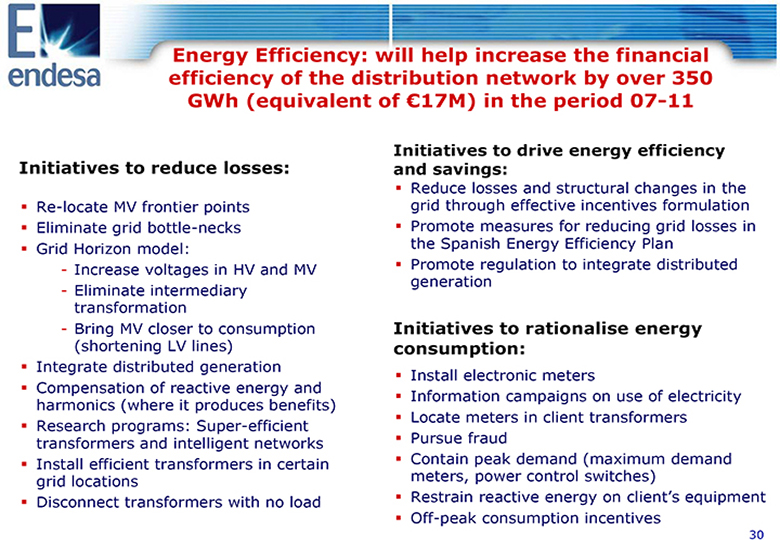
Energy Efficiency: will help increase the financial efficiency of the distribution network by over 350 GWh (equivalent of (euro)17M) in the period 07-11 Initiatives to drive energy efficiency Initiatives to reduce losses: and savings: Reduce losses and structural changes in the Re-locate MV frontier points grid through effective incentives formulation Eliminate grid bottle-necks Promote measures for reducing grid losses in Grid Horizon model: the Spanish Energy Efficiency Plan - Increase voltages in HV and MV Promote regulation to integrate distributed generation - Eliminate intermediary transformation - Bring MV closer to consumption Initiatives to rationalise energy (shortening LV lines) consumption: Integrate distributed generation Install electronic meters Compensation of reactive energy and Information campaigns on use of electricity harmonics (where it produces benefits) Locate meters in client transformers Research programs: Super-efficient transformers and intelligent networks Pursue fraud Install efficient transformers in certain Contain peak demand (maximum demand grid locations meters, power control switches) Disconnect transformers with no load Restrain reactive energy on client's equipment Off-peak consumption incentives 30
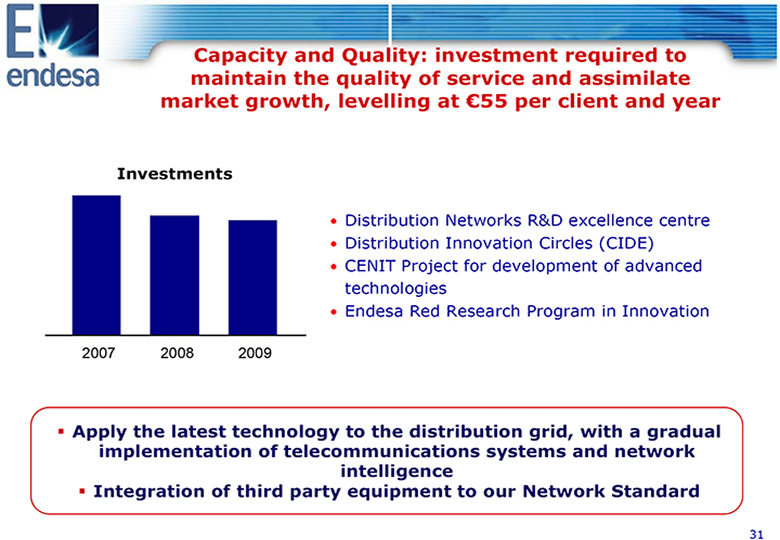
Capacity and Quality: investment required to maintain the quality of service and assimilate market growth, levelling at (euro)55 per client and year Investments o Distribution Networks R&D excellence centre o Distribution Innovation Circles (CIDE) o CENIT Project for development of advanced technologies o Endesa Red Research Program in Innovation 2007 2008 2009 Apply the latest technology to the distribution grid, with a gradual implementation of telecommunications systems and network intelligence Integration of third party equipment to our Network Standard 31
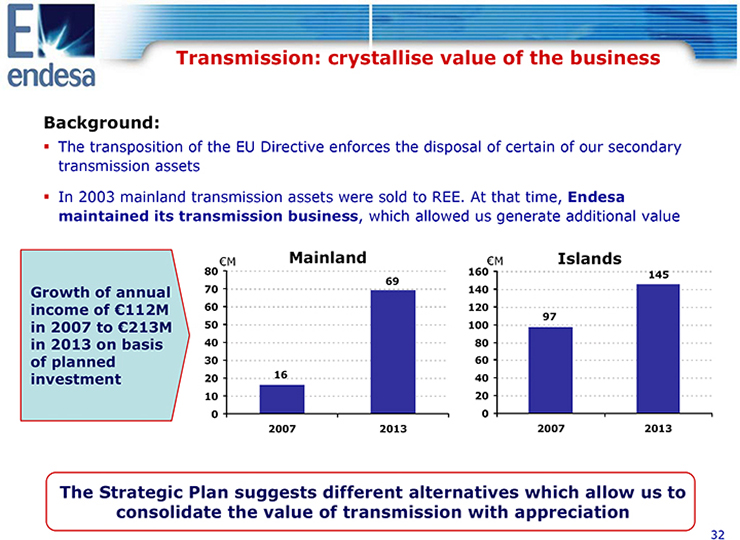
Transmission: crystallise value of the business Background: The transposition of the EU Directive enforces the disposal of certain of our secondary transmission assets In 2003 mainland transmission assets were sold to REE. At that time, Endesa maintained its transmission business, which allowed us generate additional value (euro)M Mainland (euro)M Islands 80 160 145 69 Growth of annual 70 140 income of (euro)112M 60 120 97 in 2007 to (euro)213M 50 100 in 2013 on basis 40 80 of planned 30 60 investment 20 16 40 10 20 0 0 2007 2013 2007 2013 The Strategic Plan suggests different alternatives which allow us to consolidate the value of transmission with appreciation 32
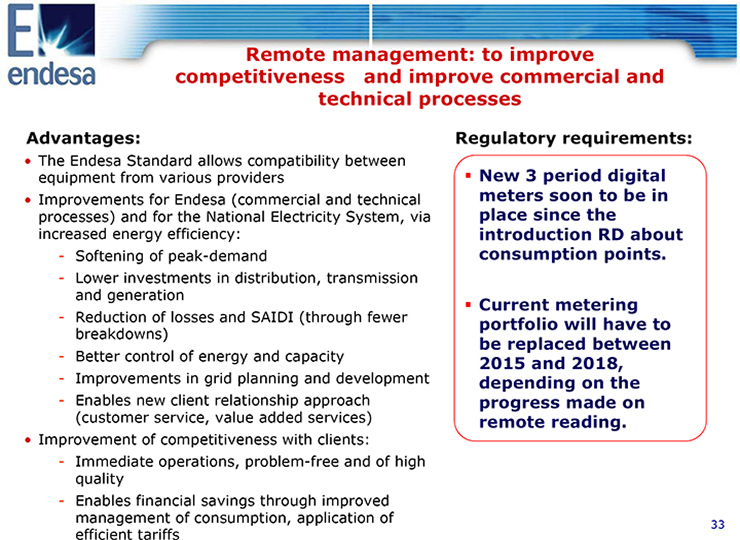
Remote management: to improve competitiveness and improve commercial and technical processes Advantages: Regulatory requirements: o The Endesa Standard allows compatibility between equipment from various providers New 3 period digital o Improvements for Endesa (commercial and technical meters soon to be in processes) and for the National Electricity System, via place since the increased energy efficiency: introduction RD about - Softening of peak-demand consumption points. - Lower investments in distribution, transmission and generation Current metering - Reduction of losses and SAIDI (through fewer portfolio will have to breakdowns) be replaced between - Better control of energy and capacity 2015 and 2018, - Improvements in grid planning and development depending on the - Enables new client relationship approach progress made on (customer service, value added services) remote reading. o Improvement of competitiveness with clients: - Immediate operations, problem-free and of high quality - Enables financial savings through improved management of consumption, application of efficient tariffs 33
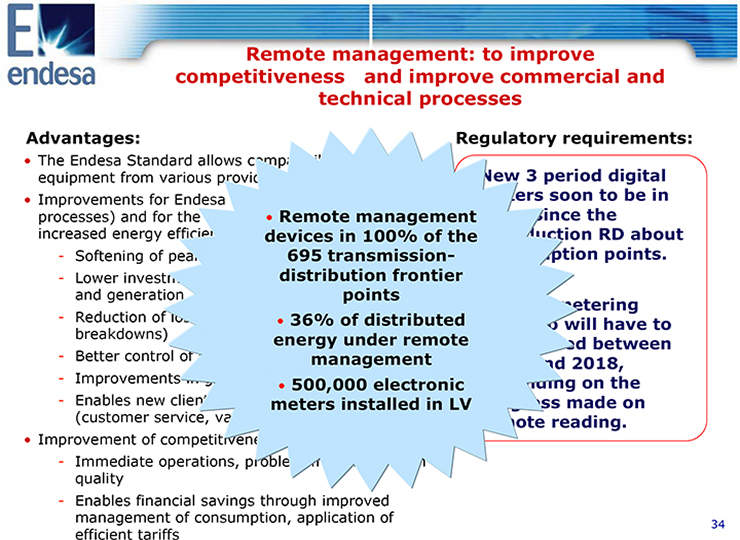
Remote management: to improve competitiveness and improve commercial and technical processes Advantages: Regulatory requirements: New 3 period digital meters soon to be in place since the introduction RD about consumption points. Current metering portfolio will have to be replaced between 2015 and 2018, depending on the progress made on remote reading. o The Endesa Standard allows compatibility between equipment from various providers o Improvements for Endesa (commercial and technical processes) and for the National Electricity System, via increased energy efficiency: - Softening of peak-demand - Lower investments in distribution, transmission and generation - Reduction of losses and SAIDI (through fewer breakdowns) - Better control of energy and capacity - Improvements in grid planning and development - Enables new client relationship approach (customer service, value added services) o Improvement of competitiveness with clients: - Immediate operations, problem-free and of high quality - Enables financial savings through improved management of consumption, application of efficient tariffs o Remote management devices in 100% of the 695 transmission-distribution frontier points o 36% of distributed energy under remote management o 500,000 electronic meters installed in LV 34
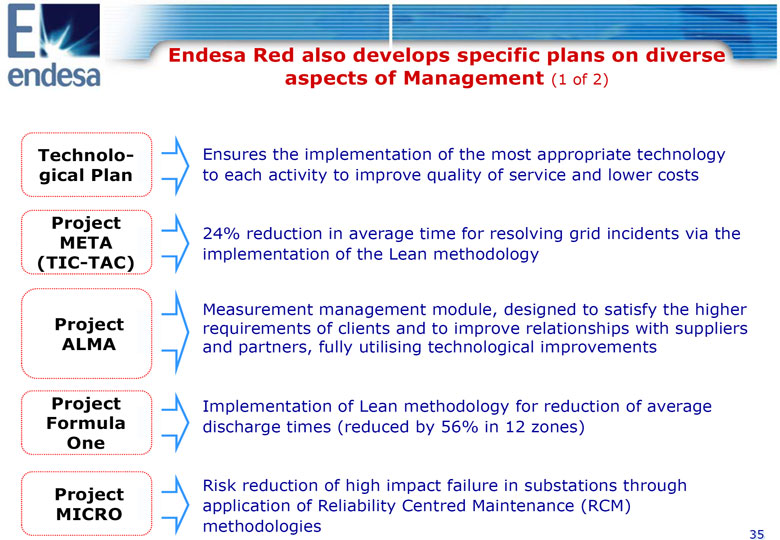
Endesa Red also develops specific plans on diverse aspects of Management (1 of 2) Technolo- Ensures the implementation of the most appropriate technology gical Plan to each activity to improve quality of service and lower costs Project META 24% reduction in average time for resolving grid incidents via the (TIC-TAC) implementation of the Lean methodology Measurement management module, designed to satisfy the higher Project requirements of clients and to improve relationships with suppliers ALMA and partners, fully utilising technological improvements Project Implementation of Lean methodology for reduction of average Formula discharge times (reduced by 56% in 12 zones) One Project Risk reduction of high impact failure in substations through MICRO application of Reliability Centred Maintenance (RCM) methodologies 35
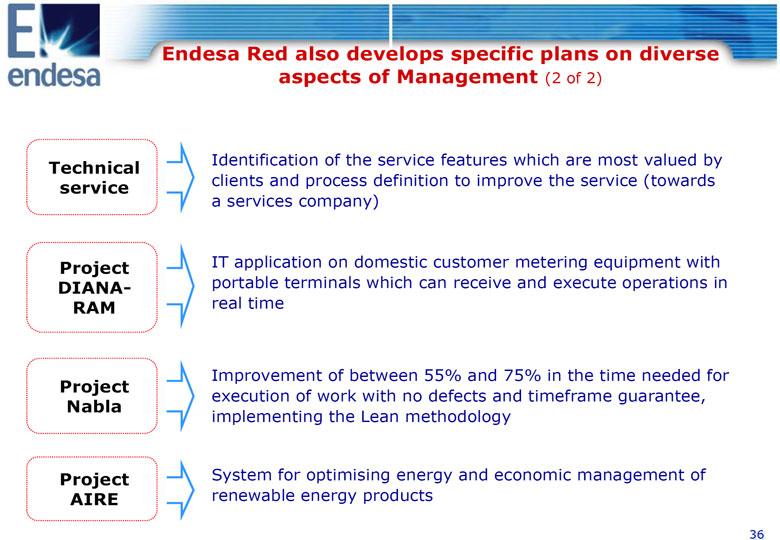
Endesa Red also develops specific plans on diverse aspects of Management (2 of 2) Technical Identification of the service features which are most valued by service clients and process definition to improve the service (towards a services company) Project IT application on domestic customer metering equipment with DIANA- portable terminals which can receive and execute operations in RAM real time Improvement of between 55% and 75% in the time needed for Project execution of work with no defects and timeframe guarantee, Nabla implementing the Lean methodology Project System for optimising energy and economic management of AIRE renewable energy products 36
Contents Endesa Red now Results obtained Regulatory framework Our "route map": Strategic plan A future of growth and profitability 37
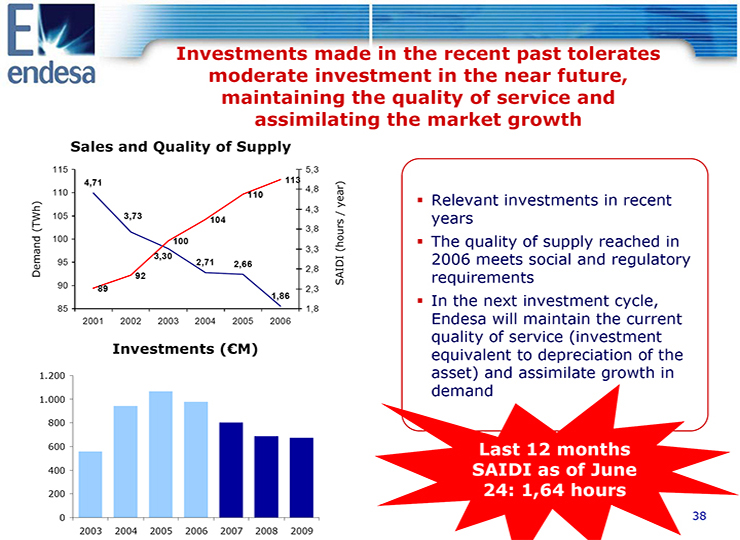
Investments made in the recent past tolerates moderate investment in the near future, maintaining the quality of service and assimilating the market growth Sales and Quality of Supply 115 5,3 4,71 113 110 4,8 110 Relevant investments in recent 4,3 / year) 105 3,73 104 years 3,8 100 100 The quality of supply reached in 3,3 3,30 2006 meets social and regulatory 95 2,71 2,66 Demand (TWh) 2,8 92 SAIDI (hours requirements 90 89 2,3 1,86 In the next investment cycle, 85 1,8 2001 2002 2003 2004 2005 2006 Endesa will maintain the current quality of service (investment Investments ((euro)M) equivalent to depreciation of the 1.200 asset) and assimilate growth in demand 1.000 800 600 Last 12 months 400 SAIDI as of June 200 24: 1,64 hours 0 38
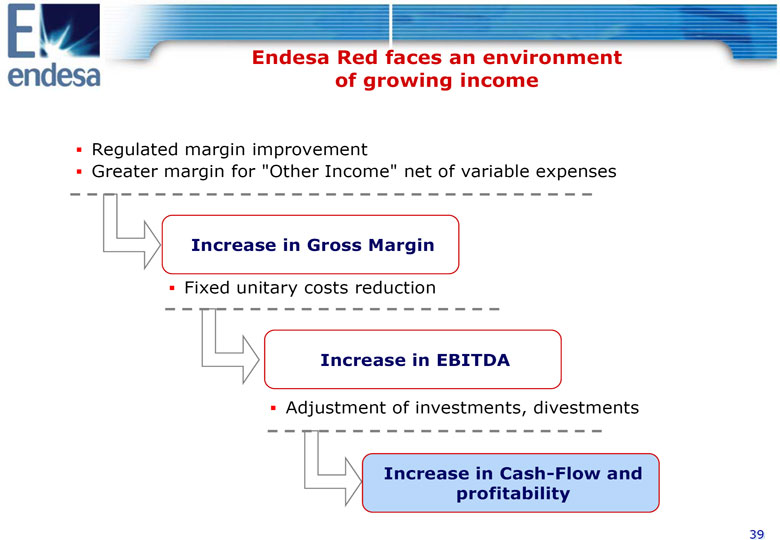
2003 2004 2005 2006 2007 2008 2009 Endesa Red faces an environment of growing income Regulated margin improvement Greater margin for "Other Income" net of variable expenses Increase in Gross Margin Fixed unitary costs reduction Increase in EBITDA Adjustment of investments, divestments Increase in Cash-Flow and profitability 39
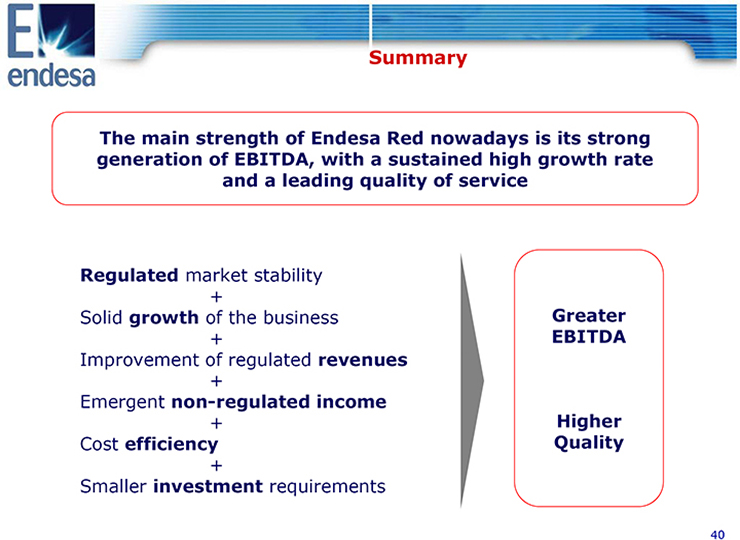
Summary The main strength of Endesa Red nowadays is its strong generation of EBITDA, with a sustained high growth rate and a leading quality of service Regulated market stability + Solid growth of the business Greater + EBITDA Improvement of regulated revenues + Emergent non-regulated income + Higher Cost efficiency Quality + Smaller investment requirements 40
Legal Information This document was made available to shareholders of Endesa, S.A.. In relation with the announced joint offer by ENEL SpA and Acciona, S.A., Endesa shareholders are urged to read the report of Endesa's board of directors when it is filed by the Company with the Comision Nacional del Mercado de Valores (the "CNMV"), as well as Endesa's Solicitation/Recommendation Statement on Schedule 14D-9 when it is filed by the Company with the U.S. Securities and Exchange Commission (the "SEC"), as it will contain important information. Such documents and other public filings made from time to time by Endesa with the CNMV or the SEC are available without charge from the Endesa's website at www.endesa.es, from the the CNMV's website at www.cnmv.es and from the SEC's website at www.sec.gov and at Endesa's principal executive offices in Madrid, Spain. This presentation contains certain "forward-looking" statements regarding anticipated financial and operating results and statistics and other future events. These statements are not guarantees of future performance and they are subject to material risks, uncertainties, changes and other factors that may be beyond ENDESA's control or may be difficult to predict. Forward-looking statements include, but are not limited to, information regarding: estimated future earnings; anticipated increases in wind and CCGTs generation and market share; expected increases in demand for gas and gas sourcing; management strategy and goals; estimated cost reductions; tariffs and pricing structure; estimated capital expenditures and other investments; estimated asset disposals; estimated increases in capacity and output and changes in capacity mix; repowering of capacity and macroeconomic conditions. For example, the investment plan for 2007-2009 included in this presentation are forward-looking statements and are based on certain assumptions which may or may not prove correct. The main assumptions on which these expectations and targets are based are related to the regulatory setting, exchange rates, divestments, increases in production and installed capacity in markets where ENDESA operates, increases in demand in these markets, assigning of production amongst different technologies, increases in costs associated with higher activity that do not exceed certain limits, electricity prices not below certain levels, the cost of CCGT plants, and the availability and cost of the gas, coal, fuel oil and emission rights necessary to run our business at the desired levels. In these statements we avail ourselves of the protection provided by the Private Securities Litigation Reform Act of 1995 of the United States of America with respect to forward-looking statements. The following important factors, in addition to those discussed elsewhere in this presentation, could cause actual financial and operating results and statistics to differ materially from those expressed in our forward-looking statements: Economic and industry conditions: significant adverse changes in the conditions of the industry, the general economy or our markets; the effect of the prevailing regulations or changes in them; tariff reductions; the impact of interest rate fluctuations; the impact of exchange rate fluctuations; natural disasters; the impact of more restrictive environmental regulations and the environmental risks inherent to our activity; potential liabilities relating to our nuclear facilities. Transaction or commercial factors: any delays in or failure to obtain necessary regulatory, antitrust and other approvals for our proposed acquisitions or asset disposals, or any conditions imposed in connection with such approvals; our ability to integrate acquired businesses successfully; the challenges inherent in diverting management's focus and resources from other strategic opportunities and from operational matters during the process of integrating acquired businesses; the outcome of any negotiations with partners and governments. Delays in or impossibility of obtaining the pertinent permits and rezoning orders in relation to real estate assets. Delays in or impossibility of obtaining regulatory authorisation, including that related to the environment, for the construction of new facilities, repowering or improvement of existing facilities; shortage of or changes in the price of equipment, material or labour; opposition of political or ethnic groups; adverse changes of a political or regulatory nature in the countries where we or our companies operate; adverse weather conditions, natural disasters, accidents or other unforeseen events, and the impossibility of obtaining financing at what we consider satisfactory interest rates. Political/governmental factors: political conditions in Latin America; changes in Spanish, European and foreign laws, regulations and taxes. Operating factors: technical problems; changes in operating conditions and costs; capacity to execute cost-reduction plans; capacity to maintain a stable supply of coal, fuel and gas and the impact of the price fluctuations of coal, fuel and gas; acquisitions or restructuring; capacity to successfully execute a strategy of internationalisation and diversification. Competitive factors: the actions of competitors; changes in competition and pricing environments; the entry of new competitors in our markets. Further details on the factors that may cause actual results and other developments to differ significantly from the expectations implied or explicitly contained in the presentation are given in the Risk Factors section of Form 20-F filed with the SEC and in the ENDESA Share Registration Statement filed with the Comision Nacional del Mercado de Valores (the Spanish securities regulator or the "CNMV" for its initials in Spanish). No assurance can be given that the forward-looking statements in this document will be realised. Except as may be required by applicable law, neither Endesa nor any of its affiliates intends to update these forward-looking statements. 41
Endesa Red Growth and Profitability Jose Luis Marin Lopez-Otero Chief Executive Endesa Red Valencia, June 25, 2007
SIGNATURES
Pursuant to the requirements of the Securities Exchange Act of 1934, the registrant has duly caused this report to be signed on its behalf by the undersigned, thereunto duly authorized.
| ENDESA, S.A. | |
| Dated: June 25, 2007 | By: /s/ Álvaro Pérez de Lema |
| Name: Álvaro Pérez de Lema | |
| Title: Manager of North America Investor Relations |