UNITED STATES SECURITIES AND EXCHANGE COMMISSION
Washington, D.C. 20549
FORM 10-K
|
| | |
| þ |
| ANNUAL REPORT PURSUANT TO SECTION 13 OR 15(d) OF THE SECURITIES EXCHANGE ACT OF 1934 |
| | | For the fiscal year ended December 31, 2012 |
OR
|
| | |
| ¨ |
| TRANSITION REPORT PURSUANT TO SECTION 13 OR 15(d) OF THE SECURITIES EXCHANGE ACT OF 1934 |
| | | For the transition period from to . |
Commission File No. 001-13683
Remy International, Inc.
(Exact name of registrant as specified in its charter)
|
| |
| Delaware | 35-1909253 |
| (State or other jurisdiction of incorporation or organization) | (I.R.S. Employer Identification No.) |
| | |
| 600 Corporation Drive, Pendleton, Indiana | 46064 |
| (Address of principal executive offices) | (Zip code) |
| (765) 778-6499 |
| (Registrant's telephone number, including area code) |
Securities registered pursuant to Section 12(b) of the Act:
|
| |
| Title of Each Class | Name of Each Exchange on Which Registered |
| Common Stock, $0.0001 par value per share | The NASDAQ Stock Market LLC |
Securities registered pursuant to Section 12(g) of the Act:
None
Indicate by check mark if the registrant is a well-known seasoned issuer, as defined in Rule 405 of the Securities Act. Yes ¨ No þ
Indicate by check mark if the registrant is not required to file reports pursuant to Section 13 or Section 15(d) of the Act. Yes ¨ No þ
Indicate by check mark whether the registrant: (1) has filed all reports required to be filed by Section 13 or 15(d) of the Securities Exchange Act of 1934 during the preceding 12 months (or for such shorter period that the registrant was required to file such reports), and (2) has been subject to such filing requirements for the past 90 days. Yes þ No ¨
Indicate by check mark whether the registrant has submitted electronically and posted on its corporate Website, if any, every Interactive Data File required to be submitted and posted pursuant to Rule 405 of Regulation S-T (§232.405 of this chapter) during the preceding 12 months (or for such shorter period that the registrant was required to submit and post such files). Yes þ No ¨
Indicate by check mark if disclosure of delinquent filers pursuant to Item 405 of Regulation S-K (§229.405 of this chapter) is not contained herein, and will not be contained, to the best of registrant’s knowledge, in definitive proxy or information statements incorporated by reference in Part III of this Form 10-K or any amendment to this Form 10-K. ¨
Indicate by check mark whether the registrant is a large accelerated filer, an accelerated filer, a non-accelerated filer, or a smaller reporting company. See the definitions of “large accelerated filer,” “accelerated filer” and “smaller reporting company” in Rule 12b-2 of the Exchange Act (Check one):
|
| | | |
Large accelerated filer ¨ | Accelerated filer ¨ | Non-accelerated filer þ | Smaller reporting company ¨ |
Indicate by check mark whether the registrant is a shell company (as defined in Rule 12b-2 of the Exchange Act). Yes ¨ No þ
The aggregate market value of common stock held by nonaffiliates of the registrant (14,880,611 shares) based on the average bid and asked price of such common stock as reported on the OTC Pink Sheets on June 29, 2012, which was the last business day of the registrant's most recently completed second fiscal quarter, was $224.0 million. For purposes of this computation, all officers, directors, and 10% beneficial owners of the registrant are deemed to be affiliates. Such determination should not be deemed to be an admission that such officers, directors, or 10% beneficial owners are, in fact, affiliates of the registrant.
Number of shares of the registrant’s common stock outstanding as of January 31, 2013: 31,865,008
DOCUMENTS INCORPORATED BY REFERENCE
Certain portions, as expressly described in this report, of the Registrant’s Proxy Statement on schedule 14A for the fiscal year ended December 31, 2012, to be filed within 120 days after the close of the fiscal year that is the subject of this report, are incorporated by reference into Part III, Items 10-14.
Table of contents
|
| | |
| | PART I | Page |
| Item 1. | | |
| Item 1A. | | |
| Item 1B. | | |
| Item 2. | | |
| Item 3. | | |
| Item 4. | | |
| | PART II | |
| Item 5. | | |
| Item 6. | | |
| Item 7. | | |
| Item 7A. | | |
| Item 8. | | |
| Item 9. | | |
| Item 9A. | | |
| Item 9B. | | |
| | PART III | |
| Item 10. | | |
| Item 11. | | |
| Item 12. | | |
| Item 13. | | |
| Item 14. | | |
| | PART IV | |
| Item 15. | | |
FORWARD-LOOKING STATEMENTS
Certain statements contained or incorporated in this Annual Report on Form 10-K which are not statements of historical fact constitute “Forward-Looking Statements” within the meaning of the Private Securities Litigation Reform Act of 1995 (the “Reform Act”). Forward-looking statements give current expectations or forecasts of future events. Words such as “anticipate,” “believe,” “estimate,” “expect,” “intend,” “may”, “plan,” “seek” and other words and terms of similar meaning in connection with discussions of future operating or financial performance signify forward-looking statements. Remy International, Inc. (the “Company”) also, from time to time, may provide oral or written forward-looking statements in other materials released to the public. Such statements are made in good faith by the Company pursuant to the “Safe Harbor” provisions of the Reform Act.
Any or all forward-looking statements included in this report or in any other public statements may ultimately be incorrect. Forward-looking statements may involve known and unknown risks, uncertainties and other factors, which may cause the actual results, performance, experience or achievements of the Company to differ materially from any future results, performance, experience or achievements expressed or implied by such forward-looking statements. The Company undertakes no obligation to update any forward-looking statements, whether as a result of new information, future events, or otherwise.
Listed in the Risk Factors section are some of the factors that could potentially cause actual results to differ materially from historical and expected future results. Other factors besides these listed could also materially affect the Company's business.
Part I
Item 1. Business
We are a global market leader in the design, manufacture, remanufacture, marketing and distribution of non-discretionary, rotating electrical components for light and commercial vehicles for original equipment manufacturers, or OEMs, and the aftermarket. We sell our products worldwide primarily under the well-recognized “Delco Remy,” “Remy” and “World Wide Automotive” brand names, as well as our customers' well-recognized private label brand names. For the year ended December 31, 2012, we generated net sales of $1.1 billion, net income of $138.6 million and adjusted EBITDA of $153.5 million, representing 13.5% of our 2012 net sales. For the year ended December 31, 2011, we generated net sales of $1.2 billion, net income attributable to Remy International, Inc. of $71.9 million, net income attributable to common stockholders of $62.2 million and adjusted EBITDA of $172.4 million, including $7.3 million of non-recurring benefits, representing 14.4% of our 2011 net sales. For additional information about our financial position and results of operations, including domestic and international revenues, as well as our long-lived assets, total assets and stockholders' equity, see the notes to our consolidated financial statements included elsewhere in this Form 10-K. The Company was incorporated in Delaware in 1993 and currently has one single reportable segment.
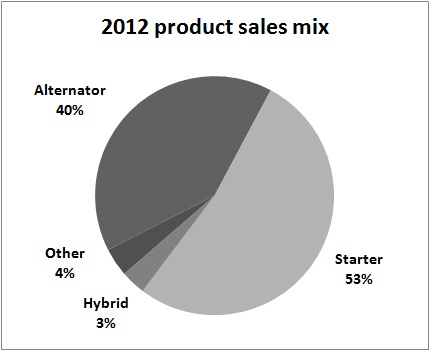
Our principal products include starter motors, alternators and hybrid electric motors. Our starters and alternators are used globally in light vehicle, commercial vehicle, industrial, construction and agricultural applications. We also design, develop and manufacture hybrid electric motors that are used in both light and commercial vehicles including construction, public transit and agricultural applications. These include both pure electric applications as well as hybrid applications, where our electric motors are combined with traditional gasoline or diesel propulsion systems. While the market for these systems is in early stages of development, our technology and capabilities are ideally suited for this growing product category.
We design and market products suited for both light and commercial vehicle applications. Our light vehicle products continue to evolve to meet the technological demands of increasing vehicle electrical loads, improved fuel efficiency, reduced weight and lowered electrical and mechanical noise. Commercial vehicle applications are generally more demanding and require highly engineered and durable starters and alternators.
We sell new starters, alternators and hybrid electric motors to U.S. and non-U.S. original equipment manufacturers ("OEMs") for factory installation on new vehicles. We sell remanufactured and new starters and alternators to aftermarket customers, mainly retailers in North America, warehouse distributors in North America and Europe and OEMs globally for the original equipment service, or OES, market. As a leading remanufacturer, we obtain used starters and alternators, which we refer to as cores, that we disassemble, clean, combine with new subcomponents and reassemble into saleable, finished products, which are tested to meet OEM requirements. We have captured leading positions in many key markets by leveraging our global reach and established customer relationships.
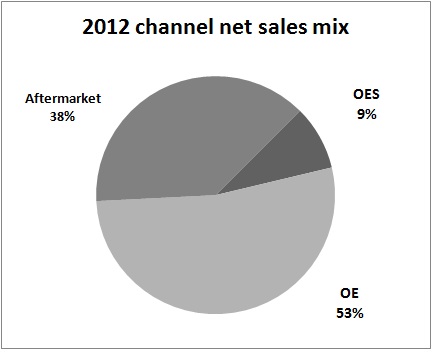
We believe there are benefits to serving both original equipment, or OE, and aftermarket customers. Our OE business is driven primarily by new vehicle production. Aftermarket demand is more stable given that our aftermarket products are used for non-discretionary repairs. We believe aftermarket demand remains relatively flat in periods of decreasing OEM sales volumes as customers look to extend the service lives of their existing vehicles by purchasing aftermarket replacement parts rather than new vehicles. This aftermarket demand stabilizes the variability of our OE sales. Our aftermarket and remanufacturing knowledge regarding product reliability allows us to regularly update and enhance new product specifications in our OE and new-build aftermarket businesses. Our expertise in OE product design allows us to bring components to the aftermarket quickly and efficiently, which enhances our brands, giving us a competitive advantage.
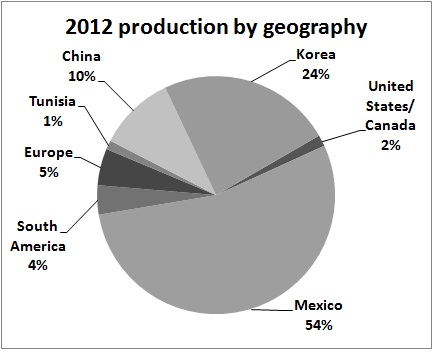
We operate a global, low-cost manufacturing and sourcing network capable of producing technology-driven products. Our 14 primary manufacturing and remanufacturing facilities are located in eight countries, including Brazil, Canada, China, Hungary, Mexico, South Korea and Tunisia. We have two manufacturing facilities in the United States which support a portion of our hybrid electric motor assembly and our locomotive remanufacturing operations. Neither of these two U.S. manufacturing facilities is unionized. Our low-cost strategy results in direct labor costs of less than 2% of net sales. Our global network of manufacturing facilities employs common tools and processes to drive efficiency improvements and reduce waste. We can shift capacity between operations to minimize costs to adapt to changes in demand, raw material costs and exchange and transportation rates. Because of our established presence and available capacity throughout the world, we are well-positioned for growth with minimal incremental investment. See "Item 1A. Risk Factors--Our global operations subject us to risks and uncertainties" and Note 2 and Note 20 to the consolidated financial statements included elsewhere in this Form 10-K for additional information.
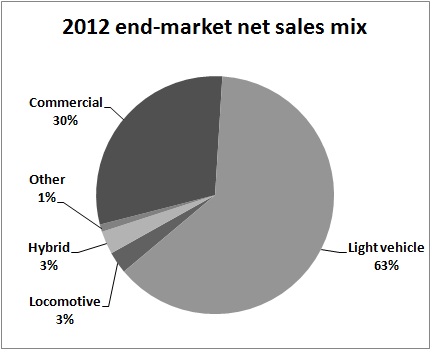
We sell our products globally through an extensive distribution and logistics network. We employ a direct sales force that develops and maintains sales relationships directly with global OEMs, OE dealer networks, commercial vehicle fleets, North American retailers and warehouse distributors around the world. We have a broad customer base, as illustrated below.
We enhance our technology and expand our product lines by investing in new product development and ongoing research. Our OE customers continue to increase their requirements for power, durability and reliability, as well as for increased fuel-efficiency and mechanical and electrical noise reduction. We have over 300 engineers focused on design, application and manufacturing. These engineers work in close collaboration with customers and have a thorough understanding of our product application. Our engineering efforts are designed to create value through innovation, new product features and aggressive cost control. Our 110 years of expertise in rotating electrical components led to the development of our hybrid electric motor capabilities, a natural extension of our products.
Our prior experience in manufacturing process development has provided us with significant, proprietary know-how in hybrid electric motor manufacturing. The U.S. Department of Energy, or the DOE, awarded us a grant in 2009, pursuant to which it agreed to match up to $60.2 million of eligible expenditures we make through 2012 for the commercialization of hybrid electric motor technology. We obtained agreements from the DOE to extend the period of eligibility for the grant through 2013. As of December 31, 2012, we have completed the first phase of the grant award and have received $36.0 million of the total grant. During 2012, a number of our hybrid customers have delayed their programs. We are now moderating our investments until the market develops, and we have elected not to initiate the next phase of the capacity requirements for the grant funding at this time.
We are well-positioned for strong and stable growth, both organically and through opportunistic acquisitions, due to our balanced portfolio of products, strong brand names, focus on new technologies, strategic global footprint and market expertise. These strengths have contributed to our solid operating margins and cash flow profile. Since 2007, our margins have improved significantly as a result of our ongoing productivity initiatives, which included capacity and workforce realignments, the implementation of lean manufacturing principles and the expansion of global purchasing initiatives. In 2010 and 2011, we completed a series of financial transactions focused on improving the strength and flexibility of our capital structure, including a debt refinancing and stockholder rights offering. As a result of these transactions, we extended our debt maturities, reduced our future interest payments and accessed substantial liquidity to execute our strategic plans. Our strengthened balance sheet now provides us with greater ability to reinvest in our business and pursue growth opportunities, including acquisitions.
Our industry
Original equipment market
Light and commercial vehicle production trends. Our OE business is influenced by trends in the light vehicle, commercial vehicle, construction and industrial markets. Common applications include passenger cars and light trucks, delivery vans, transit buses, over-the-road trucks, military vehicles, bulldozers and track-type vehicles, mining equipment, tractors and recreational vehicles.
According to IHS Global Insight, global light vehicle production is forecasted to grow from 81.2 million units in 2012 to 97.0 million units in 2016. In addition, global commercial vehicle production is forecasted to grow from 3.0 million units in 2012 to 3.7 million units in 2016.
Demand for alternators. Overall electrical power requirements have risen as OEMs introduce additional electronics in new vehicles, such as new safety, control, communication and entertainment features and emission control technology in heavy vehicles. We believe OEMs will continue to demand more efficient, more powerful yet durable alternators as electronic vehicle content continues to grow.
Increased deployment of start-stop technology starters. Start-stop technology is designed to shut a vehicle's engine off when it is stopped and rapidly restart it when the driver releases the brake pedal before accelerating. The two primary benefits of start-stop technology are improved fuel economy and green house gas reduction. Various start-stop technologies are estimated to improve fuel economy by 3-12%. Currently there are two competing technologies--Belt Alternator Starter (BAS) and Starter Based Start Stop (SBSS). According to IHS Global Insight, start-stop technology is forecasted to more than triple by 2018, growing from 8.8 million units in 2012 to 34.5 million units in 2018.
OE platform standardization and globalization. Increasingly, OEMs are requiring that their suppliers establish global production capabilities to meet their needs in local markets as they expand internationally and increase platform standardization. We believe our global proximity to customer production will be increasingly valuable.
Aftermarket
Aftermarket demand is based on the need for replacement vehicle parts. Vehicle parts may need to be replaced due to age or failure based on the level of usage and the overall quality and durability of the original part. However, improvements in product quality generally lower the replacement rate for aftermarket products. The aftermarket in mature markets differs from that in growing markets. In North America and Europe, there is a well-established aftermarket, with numerous distribution channels for replacement parts. In the U.S. market, there has also been a growing trend for retail distributors to work directly with installers. However, in growing markets, such as China, parts are generally repaired in individual repair shops. There is potential for significant growth as these markets mature.
Hybrid electric motors
Hybrid electric vehicles use technologies that combine traditional gasoline or diesel propulsion systems with electric motors to reduce emissions and be more fuel efficient. The electric motors used in hybrid vehicles can also be used to provide propulsion for electric-only vehicles. Fuel prices, emission standards and government legislation influence the demand for hybrid electric motors. For instance, the U.S. Environmental Protection Agency and the Department of Transportation's National Highway Traffic Safety Administration have issued a joint rule and announced further initiatives that require and will impose increasing standards to reduce greenhouse gas emissions and improve fuel efficiency. We believe corporations with large distribution operations will continue to add hybrid vehicles to their fleets as part of their corporate responsibility initiatives focused on reducing fuel consumption and pollution. In addition, continued volatility of, and the potential for higher, fuel costs in the future may have a positive impact on demand for hybrid electric motors as consumers seek more energy-efficient solutions.
Our competitive strengths
We believe the following competitive strengths enable us to compete effectively in our industry:
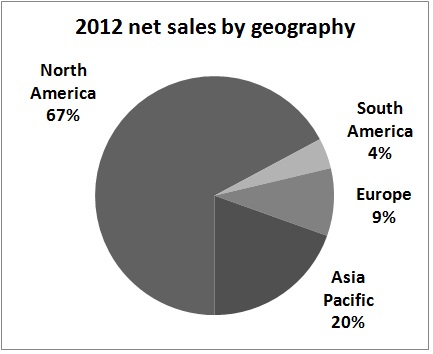
Leading market position and strong brand recognition. We hold leading market and production positions in North America, Europe, South Korea and China across all our products. Our leading market position was established through 100 years of experience delivering superior service, quality and product innovation under the well-recognized brand names, “Delco Remy,” “Remy” and “World Wide Automotive.” In recent years, we have received a number of awards in recognition of our merits, from customers, suppliers and industry associations.
Well-balanced revenue base and end-market exposure. We have a diverse portfolio of revenue sources with OE and aftermarket products that serve both light and commercial vehicle applications. This balance can help us mitigate the inherent cyclicality of demand in any one channel or end-market. We offer our products on a diverse mix of OE vehicle platforms, reflecting the balanced portfolio approach of our business model and the breadth of our product capabilities. We believe our overall diversification provides us with an opportunity to participate in an economic recovery without being overly exposed to any single market.
Innovative, technology-driven product offerings. We are committed to product and manufacturing innovation to improve quality, efficiency and cost for our customers. Our starters address customer requirements for high-power, durability and reliability, while our alternators address the growing demand for high-output, low-noise and high-efficiency performance. We also continue to lead in the production of hybrid electric motors, providing high-output, custom designs for standardized platforms. Our HVH electric motor technology, which we continue to introduce into automotive, agricultural, military and specialty markets, is among the industry leaders in power density and torque density.
Global, low-cost manufacturing, distribution and supply-chain. Our efficient manufacturing capabilities lower costs and address OEMs' engineering requirements. We are well-positioned for continued growth and protected by significant barriers to entry from suppliers who cannot support OEMs on a global scale. We conduct no manufacturing activity in the United States, with the exception of hybrid electric motors and our locomotive power assembly remanufacturing operations.
Strong operating margins and cash flow profile. We believe our operating margins and cash flow from operations provide financial flexibility and enable us to reinvest capital in our business for growth. Our base business, other than our hybrid electric motors, requires low levels of capital expenditures of approximately 1% to 2% of our net sales.
Experienced management team with track record of accomplishments. Our management team, led by industry veteran, CEO John H. Weber, has implemented a number of strategic, operational and financial restructuring initiatives to reposition us for potential profitable growth. Mr. Weber is transitioning from the CEO position effective February 28, 2013 and will remain a member of the Board of Directors. John J. Pittas, Chief Commercial Officer, will succeed Mr. Weber as CEO and President effective March 1, 2013. Mr. Pittas has held various senior management positions with the Company since joining in 2006. Mr. Weber will remain as a Director of Remy International, Inc. Key accomplishments of the management team since the start of 2007 have included:
| |
| • | realigning our manufacturing to low-cost regions; |
•reducing headcount by 15% from 7,800 to 6,600;
•winning numerous aftermarket customers in both Europe and North America;
•securing global platform wins with several customers;
•developing an industry-leading hybrid electric motor platform; and
•increasing our operating margins from (4.5)% in 2006 to 8.6% in 2012.
Our strategy
It is our goal to be the leading global manufacturer and remanufacturer of starters and alternators, yielding superior financial returns. Further, we seek to be a leading participant in the production of hybrid electric motors. We believe the competitive strengths described above provide us with significant opportunities for future growth in our industry. Our strategies for capitalizing on these opportunities include the following:
Build upon market-leading positions in commercial vehicle products. We seek to use our strength in producing durable, high-output starters and alternators for commercial vehicles to increase our market share and capitalize on the growing OE demand for these components over the next few years. We intend to use our know-how in rotating electrical components and strong customer relationships to continue to build our leading market share in the growing aftermarket for commercial vehicle parts.
Expand manufacturing for growth markets in Asia and South America. We have a significant presence in high-growth markets such as China, South Korea and Brazil and are committed to further investment in these regions. We have both wholly owned and joint venture operations in China. China produces more commercial diesel engines and vehicles than any other country in the world.
Continue to invest in hybrid electric motors for commercial vehicles. We are committed to grow in the hybrid electric motor market. We are the leading non-OEM producer of hybrid electric motors in North America. We intend to focus primarily on commercial vehicle applications, which include trucks, buses, off-road equipment and military vehicles, where power density and torque density are primary considerations. With an emphasis on medium-duty and specialty applications, we have over 20 vehicle projects in various stages of development. Since 2009, we have signed a number of long-term supply agreements for commercial vehicle applications. We have created a competitive advantage through our manufacturing capacity and intellectual property portfolio.
Leverage benefits of having both an OE and aftermarket presence. Our aftermarket business has access to the latest technology developed by our OE business. As a result, we are able to provide our aftermarket customers with new products faster than competitors. Our aftermarket presence provides our OE business with useful knowledge regarding long-term product performance and durability. We use this aftermarket knowledge to regularly update and enhance new product offerings in our OE business.
Provide value-added services that enhance customer performance. We provide our aftermarket customers with valuable category management services that strengthen our customer relationships and provide both of us with a competitive advantage. Our Remy Optimized Inventory and Vendor Managed Inventory programs support customer growth and product category profitability. These services have enabled us to improve our customer retention and expand product sales.
Selectively pursue strategic partnerships and acquisitions. We will selectively pursue strategic partnerships and acquisitions that leverage our core competencies. We will remain disciplined in our approach and only close a transaction after a thorough due diligence process. We believe there are significant opportunities in this fragmented industry. We have demonstrated our ability to rationalize and integrate operations and realize cost savings. We believe our balance sheet gives us the flexibility to support this strategy.
Products
We produce a broad range of new starters and alternators for both light and commercial vehicles. We also manufacture electric traction motors used for electric and hybrid vehicle applications. We produce a diverse array of remanufactured starters and alternators as well. Finally, we remanufacture power assemblies for locomotive diesel engines, and also sell a small amount of remanufactured steering gear and brake calipers for light vehicles in Europe.
New starters
We produce a wide range of starters in the industry, with global applications ranging from small cars to industrial engines and the largest mining trucks and locomotives. We make two types of starters: traditional straight drive starters and more technologically advanced gear reduction starters. Gear reduction starters offer greater output at lower weight than comparable straight drive designs. Reduced component weight is extremely important to OEMs, as total vehicle weight is a critical factor for fuel economy. Straight drive starters are used to produce the high torque and power required to start very large displacement engines used in off-highway trucks, tanks and locomotives.
Some light vehicles use a “start/stop” technology, in which the engine automatically shuts down while the vehicle is stopped rather than idling, and then a power source assists the engine in restarting when the vehicle departs. This
approach, which is sometimes referred to as “mild hybrid,” helps meet strict fuel efficiency and CO2 emission regulations. In this design, a separate hybrid electric motor does not power the vehicle. We developed a starter-based start/stop product and launched the product with Hyundai in 2011. In small displacement engines, like those in wide use in light vehicles in Asia, the alternator can be used as the “mild hybrid” power source rather than a starter.
Light vehicles
Our starter products for light vehicle applications offer greater power output in lighter packages for vehicles that are designed to meet increasingly more stringent fuel economy regulations. For example, we launched a redesigned automotive starter that produces more power with 14% less weight than our previous design. We also sell new starters for a wide range of light vehicle models for use as replacement parts.
Commercial vehicles
We manufacture a broad range of heavy-duty starters for use primarily with large diesel engines. Our standard units cover a very wide range of torque and speed requirements. Our commercial vehicle product development for starters has focused on generating more power, torque and life, while reducing size. OEMs are designing engines for more starts per day as anti-idling legislation requires trucks to shut down while loading/unloading freight or stopped for driver downtime. We have developed a patented technology which offers the longest service life as measured by the number of starts and highest output power to drive faster starts. We launched a fully sealed starter for very harsh environments. This starter is well suited for off-highway and military applications. Our portfolio covers the market demand for a higher number of starts and larger engines in North America while also meeting the needs of smaller displacement engines typically used in Europe and Asia.
New alternators
Light vehicles
We offer an extensive range of alternator products for light vehicles designed to cover most output requirements for standard and high-efficiency, low noise units. This diverse portfolio provides proven new parts for OEMs globally, as well as for use as replacement parts.
Commercial vehicles
The increased use of electricity-powered components in commercial vehicles, including in connection with technologies designed to reduce engine emissions, is resulting in higher electrical load requirements. Our product offerings include high-output alternators designed to meet these increasing load demands. These industry changes are also resulting in higher under-hood temperatures and increased vibration. Our products are designed to operate at higher temperatures and provide increased durability. We have developed high temperature heavy-duty alternators that satisfy the standard portion of the market where price is a critical buying factor. We launched a unit which is 10% smaller and operates at a significantly higher temperature (125ºC) than any other unit on the market. Our experience in designing alternators for both light vehicles and commercial vehicles enables us to apply advances made in one vehicle class to others and generates a volume benefit by the ability to share internal components across vehicle classes.
Hybrid electric motors
We make electric traction motors for electric and hybrid vehicle applications, which we refer to as our hybrid electric motors. In a hybrid vehicle application, our electric traction motor is combined with a gasoline or diesel propulsion system to assist in powering the vehicle. Our motors have been used in hybrid bus transmissions since 2002 and on automotive applications since 2007. Our patented winding processes in conjunction with a permanent magnet design deliver among the highest power density and torque density in the industry. This technology provides the basis of our standard platform, allowing commercial and specialty vehicle applications to utilize a common design, create competitive scale and reduce cost.
Remanufactured products
We offer a diverse array of remanufactured starters and alternators for light vehicles. These products include substantially all makes and models of domestic and imported starters and alternators. For commercial vehicles, our remanufactured starters and alternators are predominantly products that we originally manufactured. We also remanufacture power assemblies for locomotive diesel engines and sell a small amount of remanufactured steering gear and brake calipers for light vehicles in Europe.
Starter and alternator technology continues to evolve. We can introduce new models of remanufactured starters and alternators faster than others because we have often made the original product that is being remanufactured.
We also bring our knowledge of advances in technology to bear in remanufacturing products originally made by others.
Customers and distribution channels
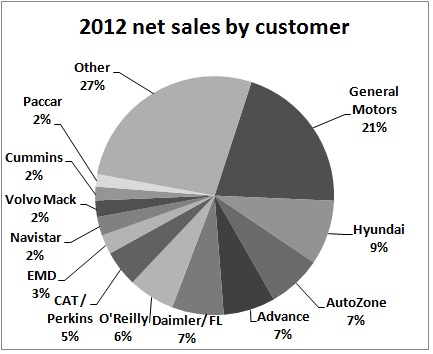
Our customer base includes global light and commercial vehicle manufacturers and a large number of retailers, distributors and installers of automotive aftermarket parts. Our credit evaluation process and the geographical dispersion of sales transactions help to mitigate credit risk concentration. We conduct a significant amount of business with GM, three large automotive parts retailers, and a large original equipment manufacturer. Net sales to these customers in the aggregate represented 50.1%, 49.1%, and 49.6% of consolidated net sales for the years ended December 31, 2012, 2011, and 2010, respectively.
GM represents our largest customer and accounted for approximately 20.7%, 20.7%, and 23.0% of the sales for the years ended December 31, 2012, 2011, and 2010, respectively.
OEMs
Our OEM customers include a broad range of global light vehicle producers around the world. GM is our largest OEM customer for light vehicle products, evenly split between North America and the rest of world. Hyundai is our fastest growing OEM customer. It is gaining market share globally, and we have been gaining market share within Hyundai. We are currently their largest supplier of starters and are growing our share of their alternator business. Other notable light vehicle customers include Daimler, DPCA (Dongfeng Peugeot Citroen Automotive), Geely and BYD. Our goal is to expand our customer base and grow with customers who are growing, including Hyundai and other Asian customers.
Principal commercial vehicle OEM customers include Daimler, Caterpillar, Navistar, Mack and Volvo, and Cummins. This mix provides a balance between on-highway trucks and off-highway applications. We also have very strong brand recognition and traditional relationships with the leading operators of commercial vehicle fleets. These fleets will often specify Delco Remy parts as required equipment on their new vehicle purchases from OEMs, and will in many cases purchase upgrades that we offer for increased durability and longer service life as premium options. A key focus of our marketing efforts in commercial vehicle products for OEMs is securing orders for upgrades, which help us generate profits. Currently, our commercial vehicle OEM sales are primarily in North and South America, although we have a growing share in Asia and Europe that we are seeking to expand.
Aftermarket
We are a leading North American rotating electrical supplier to aftermarket customers. We sell both remanufactured and new light vehicle and commercial vehicle starters and alternators into the aftermarket in the United States, Canada, Mexico and Europe, and aftermarket commercial vehicle starters and alternators in Brazil. In North America, we primarily sell our aftermarket products to automotive parts retailers, including AutoZone, Advance Auto Parts and O'Reilly Auto Parts. We also supply warehouse distributors, where we are the preferred supplier of some of the largest buying groups, OES customers, and other smaller middlemen (sometimes called “jobbers”) who distribute parts to installers. We sell substantially more remanufactured units than new units. This mix is consistent with sales in the aftermarket overall.
Auto parts retailers sell parts primarily to the "do it yourself" ("DIY") market. Consumers who purchase parts from the DIY channel generally install parts into their vehicles themselves. In most cases, this is a less expensive alternative to having the repair performed by a professional installer. The second market is the professional installer market, commonly known as the “do it for me” market. This market is served by traditional warehouse distributors, retail chains and the dealer networks. Generally, the consumer in this channel is a professional parts installer. However, large national retailers have increased their efforts to sell to installers and to other smaller middlemen. This change in approach has increased the retailers' market share in the “do it for me” market and hence overall. We are well-positioned to participate in the retailers' growth given our strong relationships with large retailers.
Our primary customers in the aftermarket for commercial vehicle parts are OE dealer networks, independent warehouse distributors and leased truck service groups. Our relationships with trucking fleets also benefit our aftermarket sales, as the fleet operators will often specify that Delco Remy products be used both for initial installation and for subsequent replacements.
In Europe, we principally sell aftermarket products through the warehouse distribution channel. Retail distribution is less developed in Europe than in North America.
Our locomotive assemblies are sold predominantly to Caterpillar's Electro-Motive Diesel (EMD) division.
Sales and distribution
We have an extensive global distribution and logistics network. We employ a direct sales force that develops and maintains sales relationships with our OEM, retail, warehouse distributor and other aftermarket customers, as well as with major North American truck fleet operators. These sales efforts are supplemented by a network of field service engineers and product service engineers. We also use representative agencies to service aftermarket customers in some cases.
Manufacturing and facilities
We operate a global, low-cost manufacturing and sourcing network capable of producing technology-driven products. Our 14 primary manufacturing and remanufacturing facilities are located in eight countries, including Brazil, China, Hungary, Mexico, South Korea, Tunisia, Canada and the United States. There are two manufacturing facilities in the United States, which support a portion of our hybrid electric motor assembly and our locomotive power assembly remanufacturing operations. Neither of these two U.S. manufacturing facilities is unionized. Our low-cost strategy results in direct labor costs of less than 2% of net sales. Our global network of manufacturing facilities employs common tools and processes to drive efficiency improvements and reduce waste. We can shift capacity between operations to minimize cost to adapt to changes in demand, raw material costs and exchange and transportation rates. Because of our established presence and available capacity throughout the world, we are well-positioned for growth with minimal incremental investment.
We have eight manufacturing facilities making new products for OE/OES customers, including two in Mexico, two in China, and one in each of Brazil, South Korea, Hungary and Anderson, Indiana. These modern facilities utilize a flexible cell-based manufacturing approach for production lines for improved flexibility and efficiency in both low- and high-volume production runs. Each operation within a cell is optimized to ensure one-piece flow and other lean operational concepts. Cell manufacturing allows us to match production output better to variable customer requirements while reducing inventory and improving quality. The effectiveness of our approach was tested and proven in the recent market downturn and subsequent recovery. Our distribution facility for these products in North America is in Laredo, TX.
We produce our remanufactured starters and alternators for sale in North America in two facilities in Mexico. For Europe, our remanufactured starters and alternators are made in factories in Tunisia and Hungary. We source our new products for aftermarket sales through third parties, primarily in Asia and from our own manufacturing operations. Our distribution, engineering and administration facilities for these products are in Edmond, Oklahoma for North America and in Brussels for Europe. We conduct no manufacturing in the United States for products sold to our aftermarket customers other than for locomotive power assemblies, which are remanufactured in Peru, Indiana and Winnipeg, Canada.
In our remanufacturing operations, we obtain used starters, alternators and locomotive power assemblies, commonly known as cores, and use them to produce remanufactured products. Most cores are obtained from our customers, who generally deliver us a core for each remanufactured product we sell them. Their end customers in turn deliver their used starter or alternator to the vendor as part of the purchase of the replacement part. We buy approximately 10% of the cores we use from secondary market vendors.
When we receive cores, we sort them by make and model. During remanufacturing, we disassemble the cores into their component parts. We then thoroughly clean, test and refurbish those components that can be incorporated into remanufactured products. We then reassemble remanufactured parts into a finished product. We conduct in-process inspection and testing at various stages of the remanufacturing process. We then inspect each finished product which is tested to meet OEM requirements.
In all our operations, we use frequent communication meetings at all levels of the organization to provide training and instruction, as well as to assure a cohesive, focused effort toward common goals which has proven to be a key element of our recent success. All of our manufacturing facilities are TS certified (a quality and process certification that is a prerequisite for supplying most OEMs), and received numerous supplier quality and performance awards.
Engineering and development
Our engineering staff works both independently and with OEM and aftermarket customers to design new products, improve performance and technical features of existing products and develop methods to lower manufacturing costs. We have over 300 engineers focused on design, application and manufacturing. These engineers work in close collaboration with customers and have a thorough understanding of our product application. Our engineering efforts are designed to create value through innovation, new product features and aggressive cost control.
Our expertise in rotating electrical components led to the development of our hybrid electric motor capabilities as a natural extension of our products. Our HVH electric motor technology is among the industry leaders in power density and torque density. We are applying it in automotive, agricultural, military and specialty markets. Our prior investment in manufacturing process development has provided us with significant, proprietary know-how in hybrid electric motor manufacturing.
For additional information on research and development activities, see Note 2 to our consolidated financial statements included elsewhere in this Form 10-K.
Competition
The automotive components market is highly competitive. Most OEMs and aftermarket customers source the parts that we sell from a limited number of suppliers. We principally compete for new OEM business both at the beginning of the development of new platforms and upon the redesign of existing platforms. New-platform development generally begins two to five years before those models are marketed to the public. Once a supplier has been designated to supply parts for a new program, an OEM usually will continue to purchase those parts from the designated producer for the life of the program, although not necessarily for a redesign. In the aftermarket, many retailers and warehouse distributors purchase starters and alternators from only one or two suppliers, under contracts that run for up to five years. When contracts are up for renewal, competitors tend to bid very aggressively to replace the incumbent supplier, although the cost of switching from the incumbent tends to mitigate this competition.
Our customers typically evaluate us and other suppliers based on many criteria such as quality, price/cost competitiveness, product performance, reliability and timeliness of delivery, new product and technology development capability, excellence and flexibility in operations, degree of global and local presence, effectiveness of customer service and overall management capability. We compete with a number of companies that supply vehicle manufacturers throughout the world. In the light vehicle market, our principal competitors include BBB Industries, Bosch, Denso, Hitachi, Mitsubishi, Motorcar Parts of America and Valeo. In the commercial vehicle market, our competitors include Bosch, Denso, Mitsubishi and Prestolite.
Patents, licenses and trademarks
We have an intellectual property portfolio that includes over 400 issued and pending patents in the United States and foreign countries. While we believe this intellectual property in the aggregate is important to our competitive position, no single patent or patent application is material to us.
We own the “Remy” and “World Wide Automotive” trademarks. Pursuant to a trademark license agreement between us and GM, GM granted us an exclusive license to use the “Delco Remy” trademark on and in connection with automotive starters and heavy-duty starters and alternators. This license is extendable indefinitely at our option upon payment of a fixed $100,000 annual licensing fee to GM. The “Remy” and “Delco Remy” trademarks are registered in the United States, Canada and Mexico and in most major markets worldwide. GM has agreed with us that, upon our request, GM will register the “Delco Remy” trademark in any jurisdiction where it is not currently registered.
Purchased materials
We continually aim to reduce input material and component costs and streamline our supply chain. Our global sourcing strategy is designed to ensure the desired quality and the lowest delivered cost of our required inputs. Our strategy focuses on local material sourcing and the development of standardized processes in freight and logistics that result in the lowest total cost for our global operations.
Principal purchased materials for our business include aluminum castings, gray and ductile iron castings, armatures, solenoids, copper wire, electronics, steel shafts, forgings, bearings, commutators, magnets and carbon brushes. All of these materials are presently readily available from multiple suppliers. We do not foresee difficulty in obtaining adequate inventory supplies. We generally follow the industry practice of passing on to our original equipment customers a portion of the costs or benefits of fluctuation in copper, steel and aluminum prices. For our copper exposure not passed through to customers, we generally purchase hedges for a significant portion and also have a natural hedge in copper, aluminum and steel scrap recovered in our remanufacturing operations. In general, we do not hedge our aluminum and steel exposures. For high volume materials, we typically purchase a portion of our raw materials through multiple-year contracts with price adjustments allowed for changes in metals prices and currency exchange rates.
Foreign operations
Information about our foreign operations is set forth in tables relating to geographic information in Note 20 to our consolidated financial statements included in this Form 10-K.
Employees
As of December 31, 2012, we employed 6,631 people, of which 1,519 were salaried and administrative employees and 5,112 were hourly employees. We had 934 of our employees based in the United States. Our employees represented by trade unions were approximately 3,120, or 47% of our employees in nine countries. Efforts to organize labor unions at facilities that are not currently unionized may be commenced at any time; however, we are not aware of any current efforts. We believe that our relations with our employees are satisfactory.
History
On July 31, 1994, our predecessor, Remy Worldwide Holdings, Inc., purchased substantially all of the assets, other than facilities, of the Delco Remy division of GM in a leveraged buyout. The specific business activities purchased were engaged in the design, manufacture, remanufacture and sale of starters and alternators, among other things, for light and commercial vehicles. The predecessors to these businesses first started their operations nearly 100 years ago. When we first separated from GM in 1994, we sold a substantial majority of our products to GM. Over the years, we have substantially diversified our revenue base.
On October 8, 2007, our predecessor and its domestic subsidiaries, filed voluntary petitions under a prepackaged arrangement for relief under Chapter 11 of the U.S. Bankruptcy Code. The petitions were filed in the U.S. Bankruptcy Court for the District of Delaware, and this proceeding was administered under Case No. 07-11481 (KJC). During bankruptcy, our predecessor operated its business as debtors-in-possession under the jurisdiction of the bankruptcy court and in accordance with the Bankruptcy Code and orders of the Bankruptcy Court. Our subsidiaries in Canada, Europe, Asia Pacific, Mexico and Brazil were not included in the filings. On November 20, 2007, the Bankruptcy Court confirmed the proposed plan of reorganization pursuant to the Bankruptcy Code, and we emerged from bankruptcy protection on December 6, 2007, the effective date of the plan of reorganization.
The plan of reorganization generally provided for the full payment or reinstatement of allowed administrative claims, priority claims and secured claims. The plan provided for the issuance, by us, of new equity and debt securities to our and our predecessor's creditors in full satisfaction of allowed unsecured claims. Further, our current supply agreement with GM has been in effect since July 31, 2007 when it was renegotiated in connection with our Chapter 11 proceeding.
GM and certain of its direct and indirect subsidiaries filed on June 1, 2009 for protection under Chapter 11 of the U.S. Bankruptcy Code. On July 10, 2009, a substantial portion of GM began operations under a new corporate legal structure, called new GM, which acquired substantially all of the assets of the pre-bankruptcy GM. Under this process, we received payment on substantially all amounts invoiced at the time GM filed for bankruptcy and we entered into a Cure Agreement in which new GM assumed all principal contracts under which we conduct our business with them.
Environmental regulation
Our facilities and operations are subject to a wide variety of federal, state, local and foreign environmental laws, regulations, ordinances and directives. These laws, regulations, ordinances and directives, which we collectively refer to as environmental laws, include those related to air emissions, wastewater discharges, chemical and hazardous material, substance and waste management, treatment, storage or disposal, restriction on use of certain hazardous materials and the investigation and remediation of contamination. These environmental laws also require us to obtain permits for some of our operations from governmental authorities. These authorities can modify or revoke our permits and can enforce compliance through fines and injunctions. Our operations also are governed by laws relating to workplace safety and worker health, primarily the Occupational Safety and Health Act, its implementing regulations and analogous state laws and regulations, and foreign counterparts to these laws and regulations, which we refer to as employee safety laws. The nature of our operations exposes us to the risk of liabilities or claims with respect to environmental and employee safety laws.
We believe that the future cost of complying with existing environmental laws (or liability for known environmental claims) and employee safety laws will not have a material adverse effect on our business, financial condition and results of operations. However, future events, such as the enactment of new laws, changes in existing environmental laws and employee safety laws, or their interpretation, or the discovery of presently unknown
conditions, may give rise to additional compliance costs or liabilities. For example, in January 2011, the U.S. Environmental Protection Agency began regulating greenhouse gas emissions from certain mobile and stationary sources pursuant to the Clean Air Act. Future legislative and regulatory initiatives concerning climate change or the reduction of greenhouse gas emissions could affect our business (including indirect impacts of regulation on business trends, such as customer demand), financial condition and results of operations. In addition, future international initiatives concerning climate change or greenhouse gas emissions could give rise to additional compliance costs or liabilities.
Certain environmental laws hold current and former owners or operators of land or businesses liable for their own, and as to current owners or operators only, for previous owners' or operators', releases of hazardous substances or wastes, and for releases at third-party waste disposal sites. Because of the nature of our operations, the long history of industrial uses at some of our facilities, the operations of predecessor owners or operators of certain of the businesses and the use, production and release of hazardous substances or wastes at these sites, we could become liable under environmental laws for investigation and cleanup of contaminated sites. Some of our current or former facilities have experienced in the past or are currently undergoing some level of regulatory scrutiny or investigation or remediation activities, and are, or may become, subject to further regulatory inspections, future requests for investigation or liability for past practices.
Asbestos Claims and Litigation
We have historically been named as a defendant in a number of lawsuits alleging exposure to asbestos and asbestos-containing products by former GM employees. We were successful in getting these matters dismissed on the grounds that the plaintiffs were employees of GM, not our company, following the 1994 asset purchase of the Delco Remy Division of GM. We also received an indemnification from GM concerning costs associated with asbestos exposure claims involving former GM employees.
GM and certain of its direct and indirect subsidiaries filed on June 1, 2009 for protection under Chapter 11 of the U.S. Bankruptcy Code. On July 10, 2009, a substantial portion of GM began operations under a new corporate legal structure, called new GM, which acquired substantially all of the assets of the pre-bankruptcy GM. Following GM's June 2009 filing for protection under Chapter 11 of the U.S. Bankruptcy Code, the indemnification and certain other arrangements were disputed. However, we negotiated a settlement of these issues with new GM whereby, through an Order of the United States Bankruptcy Court for the Southern District of New York, we were accorded protected party status, which requires that any future asbestos exposure claims by former GM employees be directed to an asbestos trust, rather than brought against us directly.
Item 1A. Risk factors
In addition to the normal risks of business, we are subject to significant risks and uncertainties, including those listed below and others described elsewhere in this Annual Report on Form 10-K. Any of the risks described herein could result in a significant or material adverse effect on our results of operations or financial condition.
General economic conditions may have an adverse effect on our business, financial condition and results of operations.
The recent global financial crisis has impacted our business and our customers' businesses in the United States and globally. During 2009, the United States experienced its lowest light vehicle production rate in over 25 years, and commercial vehicle production declined by 38%. Since 2009, U.S. vehicle production has improved, but is still less than the average for the period during 2000 to 2007. The light and commercial vehicle industries in Europe and Asia faced similar trends. Continued weakness or deteriorating conditions in the U.S. or global economy that result in reduction of vehicle production and sales by our customers may harm our business, financial condition and results of operations. Additionally, in a down-cycle economic environment, we may experience increased competitive pricing pressure and customer turnover.
Deteriorating economic conditions impact driving habits of both consumers and commercial operators, leading to a reduction in miles driven. If total miles driven decreases, demand for our aftermarket products could decline due to a reduction in the need for replacement parts.
Difficult economic conditions may cause changes to the business models, products, financial condition, consumer financing and rebate programs of the OEMs. This could reduce the number of vehicles produced and purchased, which would, in turn, reduce the demand for both our OEM and aftermarket products. Our contracts do not require our customers to purchase any minimum volume of our products.
Recent economic conditions have generally increased the availability of capital and decreased the cost of financing. If we, our customers or our suppliers experience a material tightening in the availability of credit, it could adversely affect us. Among other possible effects, we may have to pay suppliers in advance or on short credit terms, which would harm our liquidity or lead to production interruptions.
Risks specific to the light and commercial vehicle industries affect our business.
Our operations, and, in particular, our OE business, are inherently cyclical and depend on many industry-specific factors such as:
| |
| • | credit availability and interest rates; |
| |
| • | fuel prices and availability; |
| |
| • | consumer confidence, spending and preference; |
| |
| • | costs related to environmental hazards; |
| |
| • | governmental incentives; and |
Our business may also be adversely affected by regulatory requirements, trade agreements, our customers' labor relations issues, reduced demand for our customers' product programs that we currently support, the receipt of sales orders for new or redesigned products that replace our current product programs and other factors. The current political environment has led, and may lead in the future, to further federal, state and local government budget cuts. We have in the past received governmental grants that benefit our industry. A significant adverse change in any of these factors may reduce automotive production and sales by our customers, which would materially harm our business, financial condition and results of operations.
Inventory levels and our OE customers' production levels also affect our OE sales. We cannot predict when our customers either increase or reduce inventory levels. This may result in variability in our sales and financial condition. Uncertainty regarding inventory levels may be exacerbated by our customers or governments initiating or terminating consumer financing programs.
Longer useful product life of parts may reduce aftermarket demand for some of our products.
In 2011 and 2012, roughly half of our net sales were to aftermarket customers. The average useful life of automotive parts has been steadily increasing in recent years due to improved quality and innovations in products and technologies. The longer product lives allow vehicle owners to replace parts of their vehicles less often. Additional increases in the average useful life of automotive parts are likely to reduce the demand for our aftermarket products, which could materially harm our business, financial condition and results of operations.
We may incur material losses and costs as a result of product liability and warranty claims, litigation and other disputes and claims.
We are exposed to warranty and product liability claims if our products fail to perform as expected. We have in the past been, and may in the future be, required to participate in a recall of those products. If public safety concerns are raised, we may have to participate in a recall even if our products are ultimately found not to be defective. Vehicle manufacturers have experienced increasing recall campaigns in recent years. Our customers and other OEMs are increasingly looking to us and other suppliers for contribution when faced with recalls and product liability claims. If our customers demand higher warranty-related cost recoveries, or if our products fail to perform as expected, our business, financial condition and results of operations could materially suffer.
We may also be exposed to product liability claims, warranty claims and damage to our reputation if our products (including the parts of our products produced by third-party suppliers) actually or allegedly fail to perform as expected or the use of our products results, or is alleged to result, in bodily injury or property damage. Recalls may also cause us to lose additional business from our customers. Material product defect issues may subject us to recalls of those products and restrictions on bidding on new customer programs. We have in the past incurred, and could in the future incur, material warranty or product liability losses and costs to defend these claims.
We are also involved in various legal proceedings incidental to our business. See “Business-Legal proceedings.” There can be no assurance as to the ultimate outcome of any of these legal proceedings, and future legal proceedings may materially harm our business, financial condition and results of operations.
Changes in the cost and availability of raw materials and supplied components could harm our financial performance.
We purchase raw materials and component parts from outside sources. The availability and prices of raw materials and component parts may change due to, among other things, new laws or regulations, increased demand from the
automotive sector and the broader economy, suppliers' allocations to other purchasers, interruptions in production by suppliers, changes in exchange rates and worldwide price levels. In recent years, market conditions have caused significant increases in the price of some raw materials and component parts and, in some cases, reductions in short-term availability. We are especially susceptible to changes in the price and availability of copper, aluminum, steel and certain rare earth magnets. The price of these materials has fluctuated significantly in recent years. An increase in the price of these magnets, or a reduction in their supply, could harm our business.
Raw material price inflation and availability have placed significant operational and financial burdens on automotive suppliers at all levels, and are expected to continue for the foreseeable future. Our need to maintain a continuing supply of raw materials and components makes it difficult to resist price increases and surcharges imposed by our suppliers. Further, it is difficult to pass cost increases through to our customers, and, if passed through, recovery is typically delayed. Because the recognition of the cost/benefit and the price recovery/reduction do not occur in the same period, the impact of a change in commodity cost is not necessarily offset by the change in sales price in the same period. Accordingly, a change in the supply of, or price for, raw materials and components could materially harm our business, financial condition and results of operations.
Disruptions in our or our customers' supply chain may harm our business.
We depend on a limited number of suppliers for certain key components and materials. In order to reduce costs, our industry has been rationalizing and consolidating its supply base. Suppliers may delay deliveries to us due to failures caused by production issues, and they may also deliver non-conforming products. Recently, several suppliers have ceased operations.
If one of our suppliers experiences a supply shortage or disruption, we may be unable to procure the components from another source to produce the affected products. The lack of a subcomponent necessary to manufacture one of our products could force us to cease production. Shortages and disruptions could be caused by many problems, such as closures of one of our suppliers' plants or critical manufacturing lines due to strikes, mechanical breakdowns, electrical outages, fires, explosions or political upheaval, or logistical complications due to weather, natural disasters, mechanical failures or delayed customs processing. Also, we and our suppliers deliver products on a just-in-time basis, which is designed to maintain low inventory levels but increases the risk of supply disruptions.
Products delivered by our suppliers may fail to meet quality standards. Potential quality issues could force us to halt deliveries while we revalidate the affected products. When deliveries are not timely, we have to absorb the cost of identifying and solving the problem, as well as expeditiously producing replacement components or products. We may also incur costs associated with “catching up,” such as overtime and premium freight. Our customers may halt or delay their production for the same reason if one of their suppliers fails to deliver necessary components. This may cause our customers to suspend their orders or instruct us to suspend delivery of our products, which may harm our business, financial condition and results of operations. In turn, if we cause a customer to halt production, the customer may seek to recoup its losses and expenses from us, which could be significant or include consequential losses.
Shortages of and volatility in the price of oil may materially harm our business, financial condition and results of operations.
The price and availability of oil impacts our business in numerous ways. Oil prices are very volatile. In general an increase in oil prices, or a shortage of oil, may reduce demand for vehicles or shift demand to smaller, more fuel-efficient vehicles, which provide lower profit margins. Also, an increase in oil prices may reduce the average number of miles driven. Lower vehicle demand or average number of miles driven would, in turn, reduce the demand for both our OE and aftermarket products. An increase in the price of oil could also increase the cost of the plastic components we use in our products. Conversely, lower fuel prices may negatively impact demand for hybrid-powered vehicles, which may also adversely affect our business. Accordingly, shortages and volatility in the price of oil may materially harm our business, financial condition and results of operations.
The loss or the deteriorating financial condition of a major customer could materially harm our business, financial condition and results of operations.
The majority of our sales are to automotive and heavy-duty OEMs, OEM dealer networks, automotive parts retail chains and warehouse distributors. We depend on a small number of customers with strong purchasing power. Our five largest customers represented 50% and 49% of our net sales for 2012 and 2011, respectively. GM, our largest customer, accounted for 21% and 21% of our net sales for 2012 and 2011, respectively.
One or more of our top customers may cease to require all or any portion of the products or services we currently provide or may develop alternative sources, including their own in-house operations, for those products or services.
Customers may restructure, which could include significant capacity reductions or reorganization under bankruptcy laws. The loss of any of our major customers, reduction in their demand for our products or substantial restructuring activities by our major customers could materially harm our business, financial condition and results of operations. OE and OES customers accounted for 62% and 61% of our net sales for 2012 and 2011, respectively.
We face substantial competition. Our failure to compete effectively could adversely affect our net sales and results of operations.
The automotive industry is highly competitive. We and most of our competitors are seeking to expand market share with new and existing customers. Our customers award business based on, among other things, price, quality, service, delivery, manufacturing and distribution capability, design and technology. Our competitors' efforts to grow market share could exert downward pressure on our product pricing and margins. Overseas manufacturers, particularly those located in China, are increasing their operations and could become a significant competitive force in the future. If we are unable to differentiate our products or maintain low-cost manufacturing, we may lose market share or be forced to reduce prices, which would lower our margins. Our business may also suffer if we fail to meet customer requirements.
Some of our competitors may have advantages over us, which could affect our ability to compete effectively. For example, some of our competitors:
| |
| • | are divisions or subsidiaries of companies that are larger and have substantially greater financial resources than we do; |
| |
| • | are affiliated with OEMs or have a “preferred status” as a result of special relationships with certain customers; |
| |
| • | have economic advantages as compared to our business, such as patents and existing underutilized capacity; and |
| |
| • | are domiciled in areas that we are targeting for growth. |
OEMs and suppliers are developing strategies to reduce costs and gain a competitive advantage. These strategies include supply base consolidation and global sourcing. The consolidation trend among automotive parts suppliers is resulting in fewer, larger suppliers who benefit from purchasing and distribution economies of scale. If we cannot achieve cost savings and operational improvements sufficient to allow us to compete favorably in the future, our financial condition and results of operations could suffer due to a reduction of, or inability to increase, sales sufficient to offset other price increases.
Our competitors may foresee the course of market development more accurately than we do, develop products that are superior to our products, have the ability to produce similar products at a lower cost than we can or adapt more quickly than we do to new technologies or evolving regulatory, industry or customer requirements.
Work stoppages or other labor issues at our facilities or the facilities of our customers or suppliers could adversely affect our operations.
Some of our employees, a substantial number of the employees of our largest customers, the employees of our suppliers and the employees of other suppliers to the automotive industry are members of industrial trade unions and are employed under the terms of collective bargaining agreements. To our knowledge, 3,120 of our employees globally are represented by trade unions. Difficult conditions in the light and commercial vehicle industries and actions taken by us, our customers, our suppliers and other suppliers to address negative industry conditions may have the side effect of exacerbating labor relations problems, which could increase the possibility of work stoppages.
We may not be able to negotiate acceptable contracts with unions, and our failure to do so may result in work stoppages. We have agreements with a number of unions in different countries. These agreements expire or are subject to renewal at various times. One or more of these unions could elect not to renew its contract with us. Also, work stoppages at our customers, our suppliers or other suppliers to the automotive industry could cause us to shut down our production facilities or prevent us from meeting our delivery obligations to our customers. The industry's reliance on just-in-time delivery of components could also worsen the effects of any work stoppage. A work stoppage at one or more of our facilities, or the facilities of suppliers and our customers, could materially harm our business, financial condition and results of operations.
Our success partly depends on our development of improved technology-based products and our ability to adapt to changing technology.
Some of our products are subject to changing technology or may become less desirable or be rendered obsolete by changes in legislative, regulatory or industry requirements. Our continued success depends on our ability to
anticipate and adapt to these changes. We may be unable to achieve and maintain the technological advances, machinery and knowledge that may be necessary for us to remain competitive.
We may need to incur capital expenditures and invest in research and development and manufacturing in amounts exceeding our current expectations. We may decide to develop specific technologies and capabilities in anticipation of customers' demands for new innovations and technologies. If this demand does not materialize, then we may be unable to recover the costs incurred to develop those particular technologies and capabilities. If we are unable to recover these costs, or if any development programs do not progress as expected, our business could materially suffer.
To compete, we must be able to launch new products to meet our customers' demand in a timely manner. However, we may be unable to install and certify the equipment needed to manufacture products for new programs in time for the start of production. Transitioning our manufacturing facilities and resources to full production under new product programs may impact production rates and other operational efficiency measures at our facilities. Our customers may not launch new product programs on schedule. Our failure to successfully launch new products, a delay by our customers in introducing our new products or a failure by our customers to successfully launch new programs, could materially harm our business, financial condition and results of operations.
We are also subject to the risks generally associated with new product introductions and applications, including lack of market acceptance of our customers' vehicles or of our products, delays in product development and failure of products to operate properly. Further, we may be unable to adequately protect our technological developments, which could prevent us from maintaining a sustainable competitive advantage.
A failure to attract and retain executive officers and key personnel could harm our ability to operate effectively.
Our ability to operate our business and implement our strategies effectively partly depends on the efforts of our executive officers and other key employees. Our future success will depend on, among other factors, our ability to attract and retain other qualified personnel in key areas, including engineering, sales and marketing, operations,
information technology and finance. The loss of the services of any of our key employees or our failure to attract or retain other qualified personnel could materially harm our business, financial condition and results of operations.
We may be unable to take advantage of, or successfully complete, potential acquisitions, business combinations and joint ventures.
We may pursue acquisitions, business combinations or joint ventures that we believe present opportunities to enhance our market position, extend our technological and manufacturing capabilities or realize significant synergies, operating expense reductions or overhead cost savings. This strategy will partly depend on whether suitable acquisition targets or joint ventures are available on acceptable terms and our ability to finance the purchase price of acquisitions or the investment in joint ventures. We may also be unable to take advantage of potential acquisitions, business combinations or joint ventures because of regulatory or other concerns. For example, the agreements governing our indebtedness may restrict our ability to engage in certain mergers or similar transactions.
Acquisitions, business combinations and joint ventures may expose us to additional risks.
Any acquisition, business combination or joint venture that we engage in could present a variety of risks. These risks include the following:
| |
| • | the incurrence of debt or contingent liabilities and an increase in interest expense and amortization expenses related to intangible assets with definite lives; |
| |
| • | our failure to discover liabilities of the acquired company for which we may be responsible as a successor owner or operator, despite any investigation we make before the acquisition; |
| |
| • | the diversion of management's attention from our core operations as they attend to any business integration issues that may arise; |
| |
| • | the loss of key personnel of the acquired company or joint venture counterparty; |
| |
| • | our becoming subject to material liabilities as a result of failure to negotiate adequate indemnification rights; |
| |
| • | difficulties in combining the standards, processes, procedures and controls of the new business with those of our existing operations; |
| |
| • | difficulties in coordinating new product and process development; |
| |
| • | difficulties in integrating product technologies; and |
| |
| • | increases in the scope, geographic diversity and complexity of our operations. |
Our failure to integrate acquired businesses successfully into our existing businesses could cause us to incur unanticipated expenses and losses, which could materially harm our business, financial condition and results of operations.
We are party to a joint venture in China with Hubei Shendian Electric and may enter into additional joint ventures in the future. Our interests may not always be aligned with the interests of our joint venture partners. For example, our partners may negotiate on behalf of customers of the joint venture for sales terms that are not in the best interest of the joint venture. Our joint venture partner owns a business that could compete with the joint venture and our businesses. Accordingly, there may be a misalignment of incentives between us and our joint venture partners that could materially harm our business, financial condition and results of operations.
Our lean manufacturing and other cost saving plans may not be effective.
Our operations strategy includes goals such as improving inventory management, customer delivery, plant and distribution facility consolidation and the integration of back-office functions across our businesses. If we are unable to realize anticipated benefits from these measures, our business, financial condition and results of operations may suffer. Moreover, the implementation of cost-saving plans and facilities integration may disrupt our operations and financial performance.
Our global operations subject us to risks and uncertainties.
We have business and technical offices and manufacturing facilities in many countries, including Brazil, China, Hungary, Mexico, South Korea and Tunisia, which may have less developed political and economic environments than the United States. International operations are subject to certain risks inherent in conducting business outside the United States, including the following:
| |
| • | general economic conditions in the countries in which we operate could have an adverse effect on our earnings from operations in those countries; |
| |
| • | agreements may be difficult to enforce and receivables may be difficult to collect through a foreign country's legal system; |
| |
| • | foreign customers may have longer payment cycles; |
| |
| • | foreign countries may impose additional withholding taxes or otherwise tax our foreign income, impose burdensome tariffs or adopt other restrictions on foreign trade or investment (such as repatriation restrictions or requirements, quotas, exchange controls and antidumping duties); |
| |
| • | intellectual property rights may be more difficult to enforce in foreign countries; |
| |
| • | unexpected adverse changes in foreign laws or regulatory requirements may occur; |
| |
| • | compliance with a variety of foreign laws and regulations may be difficult; |
| |
| • | overlap of different tax structures may subject us to additional taxes; |
| |
| • | changes in currency exchange rates; |
| |
| • | export and import restrictions, including tariffs and embargoes; |
| |
| • | shutdowns or delays at international borders; |
| |
| • | more expansive rights of foreign labor unions; |
| |
| • | nationalization, expropriation and other governmental action; |
| |
| • | political and civil instability; |
| |
| • | domestic or international terrorist events, wars and other hostilities; |
| |
| • | laws governing international relations (including the Foreign Corrupt Practices Act and the U.S. Export Administration Act); and |
| |
| • | global operations may strain our internal control over financial reporting or cause us to expend additional resources to keep those controls effective. |
If certain of the risks described were to occur, we may decide to shift some of our operations from one jurisdiction to another, which could result in added costs. If we acquire new businesses, we may be unable to effectively and quickly implement pre-existing controls and procedures intended to mitigate these uncertainties and risks. The longer supply chains resulting from global operations may also increase our working capital requirements. These uncertainties could materially harm our business, financial condition and results of operations. As we continue to expand our business globally, our success will partly depend on our ability to anticipate and effectively manage these and other risks.
The recent European debt crisis could adversely affect our business.
The recent European debt crisis and related European financial restructuring efforts have contributed to instability in credit markets and may cause the value of the Euro to further deteriorate. Although Greece, Italy, Ireland, Portugal and Spain have been affected the most severely by the debt crisis, the general financial instability in stressed European countries could create general instability and uncertainty in the entire European Union and globally.
Approximately $103.3 million of our net sales in 2012 were to European customers. If the European economy worsens, it could adversely affect our European sales. The diminished liquidity and credit availability in Europe may adversely affect the ability of our customers in the region to pay for our products, which may lead to an increase in our allowance for doubtful accounts or write-offs of accounts receivable.
International trade policies may impact demand for our products and our competitive position.
Government policies on international trade and investment such as import quotas, capital controls or tariffs, whether adopted by individual governments or addressed by regional trade blocs, can affect the demand for our products and services, impact the competitive position of our products or prevent us from being able to sell products in certain countries. The implementation of more restrictive trade policies, such as more detailed inspections, higher tariffs or new barriers to entry, in countries in which we sell large quantities of products and services could negatively impact our business, results of operations and financial condition. For example, a government's adoption of “buy national” policies or retaliation by another government against such policies could have a negative impact on our results of operations.
We are exposed to domestic and foreign currency fluctuations that could harm our business, financial condition and results of operations.
As a result of our global presence, a significant portion of our net sales and expenses are denominated in currencies other than the U.S. dollar. We are accordingly subject to foreign currency risks and foreign exchange exposure. These risks and exposures include:
| |
| • | transaction exposure, which arises when the cost of a product originates in one currency and the product is sold in another currency; |
| |
| • | translation exposure on our income statement, which arises when the income statements of our foreign subsidiaries are translated into U.S. dollars; and |
| |
| • | translation exposure on our balance sheet, which arises when the balance sheets of our foreign subsidiaries are translated into U.S. dollars. |
We source many of our parts, components and finished products from Mexico, Europe, North Africa and Asia. The cost of these products could fluctuate with changes in currency exchange rates. Changes in currency exchange rates could also affect product demand and require us to reduce our prices to remain competitive.
During the years ended December 31, 2012 and 2011, approximately 34% and 37%, respectively, of our net sales were transacted outside the United States. Fluctuations in exchange rates may affect product demand and may adversely affect the profitability in U.S. dollars of products and services provided by us in foreign markets where payment for our products and services is made in the local currency.
The financial crisis during 2008 and 2009 caused extreme and unprecedented volatility in foreign currency exchange rates. These fluctuations may occur again and may impact our financial results. We cannot predict when, or if, this volatility will cease or the extent of its impact on our future financial results. Accordingly, exchange rate fluctuations may therefore materially harm our business, financial condition and results of operations.
Our future growth will be influenced by the adoption of hybrid and electric vehicles.
Our growth will be influenced by the adoption of hybrid and electric vehicles, and we are subject to the risk of any reduced demand for hybrid or electric vehicles. If customers do not adopt hybrid and electric vehicles, our business, financial condition and results of operations will be affected. The market for hybrid and electric vehicles is relatively new and rapidly evolving and is characterized by rapidly changing technologies, price competition, additional
competitors, evolving government regulation and industry standards, frequent new vehicle announcements and changing customer demands and behaviors. Factors that may influence the adoption of hybrid and electric vehicles include:
| |
| • | perceptions about hybrid vehicle and electric vehicle quality, safety, design, performance and cost, especially if adverse events occur that are linked to the quality or safety of hybrid or electric vehicles; |
| |
| • | the availability of vehicles using alternative technologies or fuel sources; |
| |
| • | perceptions about, and the actual cost of purchasing and operating, vehicles using alternative technologies or fuel sources; |
| |
| • | improvements in the fuel economy of the internal combustion engine; |
| |
| • | the availability of service for hybrid and electric vehicles; |
| |
| • | the environmental consciousness of customers; |
| |
| • | volatility in the cost of oil, gasoline and diesel; |
| |
| • | perceptions of the dependency of the United States on oil from unstable or hostile countries, and government regulations and economic incentives promoting fuel efficiency and alternate forms of energy; |
| |
| • | the availability of tax and other governmental incentives to purchase and operate hybrid or electric vehicles or future regulation requiring increased use of non-polluting vehicles; and |
Additionally, our customers may become subject to regulations that require them to alter the design of their hybrid or electric vehicles, which could negatively impact consumer interest in their vehicles, resulting in a decline in the demand for our products. The influence of any of the factors described above may cause current or potential customers to cease to purchase our products, which could materially harm our business, financial condition and results of operations.
Escalating pricing pressures from our customers and other customer requirements may harm our business, financial condition and results of operations.
The automotive industry has been characterized by significant pricing pressure from customers for many years. This trend is partly attributable to the strong purchasing power of major OEMs and aftermarket customers. Virtually all automakers and aftermarket customers have implemented aggressive price reduction initiatives and objectives each year with their suppliers, and we expect these actions to continue in the future. As our customers grow, including through consolidation, their ability to exert pricing pressure increases. Our customers often expect us to quote fixed prices or contractually obligate us to accept prices with annual price reductions. Price reductions have impacted our sales and profit margins and are expected to continue to do so in the future. Accordingly, our future profitability will partly depend on our ability to reduce costs. If we are unable to offset customer price reductions through improved operating efficiencies, new manufacturing processes, technological improvements, sourcing alternatives and other cost reduction initiatives, these price reductions may materially harm our business, financial condition and results of operations.
Our supply agreements with some of our customers require us to provide our products at predetermined prices. In some cases, these prices decline over the course of the contract. The costs that we incur to fulfill these contracts may vary substantially from our initial estimates. Unanticipated cost increases may occur as a result of several factors, including increases in the costs of labor, components or materials. Although in some cases we are permitted to pass on to our customers the cost increases associated with specific materials, cost increases that we cannot pass on to our customers could harm our business, financial condition, and results of operations.
Further, consistent with common industry practice, a majority of our aftermarket customers, including both large retail customers and smaller warehouse distributors, require us to agree to terms that reduce the customer's investment in inventory held for sale. These measures include extended payment terms for purchased inventory (often coupled with customer-supplied factoring arrangements), our supply of inventory without our receipt from them of a cash deposit in respect of the cores included in the finished goods, and other arrangements. Participation in these initiatives requires us to incur factoring costs and to invest increased financial resources in cores. To the extent these demands increase in number and dollar volume, our financial condition and results of operations could suffer if our financing costs increase or we are unable to obtain adequate financing.
In addition, certain of our agreements with customers subject us to penalties if we fail to provide a minimum level of order fulfillment. To the extent we are unable to obtain certain materials or remanufacture the products under such
contracts or we are unable to maintain necessary inventory levels, our financial condition and results of operations could be adversely affected.
Circumstances over which we have no control may affect our ability to deliver products to customers and the cost of shipping and handling.
We rely on third parties to handle and transport components and raw materials to our facilities and finished products to our customers. Due to factors beyond our control, including changes in fuel prices, political events, border crossing difficulties, governmental regulation of transportation, changes in market rates, carrier availability, disruptions in transportation infrastructure and acts of God, we may not receive components and raw materials, and may not be able to transport our products to our customers, in a timely and cost-effective manner, which could materially harm our business, financial condition and results of operations.
Freight costs are strongly correlated to oil prices, have been volatile in the past and are likely to be volatile in the future. As we incur substantial freight costs to transport materials and components from our suppliers, and to deliver finished products to our customers, an increase in freight costs could increase our operating costs, which we may be unable to pass to our customers.
Assertions by or against us relating to intellectual property rights could materially harm our business.
Our industry is characterized by companies that hold large numbers of patents and other intellectual property rights and that vigorously pursue, protect and enforce intellectual property rights. There are likely issued patents owned by third parties that may relate to technology used in our industry and to which we do not have licenses. From time to time, third parties may assert against us and our customers and distributors their patent and other intellectual property rights to technologies that are important to our business. See Note 21 to our consolidated financial statements included elsewhere in this Form 10-K for additional information.
Claims that our products or technology infringe third-party intellectual property rights, regardless of their merit or resolution, are frequently costly to defend or settle and divert the efforts and attention of our management and technical personnel. In addition, many of our supply agreements require us to indemnify our customers and distributors from third-party infringement claims, which have in the past required, and may in the future require, that we defend those claims and might require that we pay damages in the case of adverse rulings. Claims of this sort also could harm our relationships with our customers and might deter future customers from doing business with us. We may not prevail in these proceedings given the complex technical issues and inherent uncertainties in intellectual property litigation. If any pending or future proceedings result in an adverse outcome, we could be required to:
| |
| • | cease the manufacture, use or sale of the infringing products or technology; |
| |
| • | pay substantial damages for infringement; |
| |
| • | expend significant resources to develop non-infringing products or technology; |
| |
| • | license technology from the third-party claiming infringement, which we may not be able to do on commercially reasonable terms or at all; |
| |
| • | enter into cross-licenses with our competitors, which could weaken our overall intellectual property portfolio; |
| |
| • | lose the opportunity to license our technology to others or to collect royalty payments based on our intellectual property rights; |
| |
| • | pay substantial damages to our customers or end users to discontinue use or replace infringing technology with non-infringing technology; or |
| |
| • | relinquish rights associated with one or more of our patent claims, if our claims are held invalid or otherwise unenforceable. |
Any of the foregoing results could have a material adverse effect on our business, financial condition and results of operations.
We use a significant amount of intellectual property in our business. If we are unable to protect our intellectual property, our business could suffer.
Our success partly depends on our ability to protect our intellectual property and other proprietary rights. To accomplish this, we rely on a combination of intellectual property rights, including patents, trademarks and trade secrets, as well as customary contractual protections with our customers, distributors, employees and consultants, and through security measures to protect our trade secrets. It is possible that:
| |
| • | our present or future patents, trademarks, trade secrets and other intellectual property rights will lapse or be invalidated, circumvented, challenged, abandoned or, in the case of third-party patents licensed or sub-licensed to us, be licensed to others; |
| |
| • | our intellectual property rights may not provide any competitive advantages to us; |
| |
| • | our pending or future patent applications may not be issued or may not have the coverage we originally sought; and |
| |
| • | our intellectual property rights may not be enforceable in jurisdictions where competition is intense or where legal protection may be weak. |
Our competitors may develop technologies that are similar or superior to our proprietary technologies, duplicate our proprietary technologies or design around the patents we own or license. If we pursue litigation to assert our intellectual property rights, an adverse decision in the litigation could limit our ability to assert our intellectual property rights, limit the value of our technology or otherwise harm our business.
We are also a party to a number of patent and intellectual property license agreements. Some of these license agreements require us to make one-time or periodic payments to the counterparties. We may need to obtain additional licenses or renew existing license agreements in the future, which we may not be able to do on acceptable terms.
Our confidentiality agreements with our employees and others may not adequately prevent the disclosure of our trade secrets and other proprietary information.
We have devoted substantial resources to the development of our trade secrets and other proprietary information. In order to protect our trade secrets and other proprietary information, we rely in part on confidentiality agreements with our employees, partners, independent contractors and other advisors. These agreements may not effectively prevent the disclosure of our confidential information and may not provide an adequate remedy in the event of unauthorized disclosure. Others may also independently discover our trade secrets and proprietary information. Costly and time-consuming litigation could be necessary to enforce and determine the scope of our trade secret and other proprietary rights, and the failure to obtain or maintain trade secret protection could harm our competitive position.
Indemnity provisions in various agreements potentially expose us to substantial liability for intellectual property infringement and other losses.
Our product agreements with certain customers include standard indemnification provisions under which we agree to indemnify customers for losses as a result of intellectual property infringement claims and, in some cases, for damages caused by us to property or persons. To the extent not covered by applicable insurance, a large indemnity payment could harm our business.
We are the subject of various legal proceedings that could have a material adverse effect on our revenue and profitability.
We are involved in various litigation matters, and may, from time to time be involved in or the subject of governmental or regulatory agency inquiries or investigations. See Note 21 to our consolidated financial statements included elsewhere in this Form 10-K for additional information.
If we are unsuccessful in our defense in the litigation matters, or compliance with any governmental or regulatory rules, we may be forced to pay damages or fines and/or change our business practices, any of which could have a material adverse effect on our business and results of operations.
We have recorded a significant amount of goodwill and other intangible assets, which may become impaired in the future.
We have recorded a significant amount of goodwill and other identifiable intangible assets, including customer relationships, trademarks and developed technologies. Goodwill, which represents the excess of reorganization value over the fair value of the net assets of the businesses acquired, was $271.4 million as of December 31, 2012, or 24.6% of our total assets. Other intangible assets, net, were $99.3 million as of December 31, 2012, or 9.0% of our total assets.
Impairment of goodwill and other identifiable intangible assets may result from, among other things, deterioration in our performance, adverse market conditions, adverse changes in applicable laws or regulations, including changes that restrict the activities of or affect the products sold by our business, and a variety of other factors. The amount of
any quantified impairment must be expensed immediately as a charge that is included in operating income. We are subject to financial statement risk if goodwill or other identifiable intangible assets become impaired.
Unexpected changes in core availability or the market value of cores may harm our financial condition.
Cores are used starters or alternators that customers exchange when they purchase new products. If usable, we refurbish these cores into a remanufactured product that we sell to our aftermarket customers. If the availability of usable cores declines, we may have to purchase cores in the open market at values that may harm our business, financial condition and results of operations. If core market values decline below cost, then we would record a charge against our operating income for the devaluation of core inventory. This devaluation may harm our results of operations.
Environmental and health and safety liabilities and requirements could require us to incur material costs.
We are subject to various U.S. and foreign laws and regulations relating to environmental protection and worker health and safety, including those governing:
| |
| • | discharges of pollutants into the ground, air and water; |
| |
| • | the generation, handling, use, storage, transportation, treatment and disposal of hazardous substances and waste materials; and |
| |
| • | the investigation and cleanup of contaminated properties. |
The nature of our operations exposes us to the risk of liabilities and claims with respect to environmental matters, including on-site and off-site treatment, storage and disposal of hazardous substances and wastes. We have given indemnities to subsequent owners for certain of our former operational sites, and we have separately received indemnification, subject to certain limitations, with respect to one of those sites. We could incur material costs in connection with these matters, including in connection with sites where we do not have indemnifications from third parties, where the indemnitor ceases to pay under its indemnity obligations or where the indemnities otherwise become inapplicable or unavailable.
Environmental and health-related requirements are complex, subject to change and have tended to become more and more stringent. Future developments could require us to make additional expenditures to modify or curtail our operations, install pollution control equipment or investigate and clean up contaminated sites. These developments may include:
| |
| • | the discovery of new information concerning past releases of hazardous substances or wastes; |
| |
| • | the discovery or occurrence of compliance problems relating to our operations; |
| |
| • | changes in existing environmental laws or regulations or their interpretation, or the enactment of new laws or regulations; and |
| |
| • | more rigorous enforcement by regulatory authorities. |
These events could cause us to incur various expenditures and could also subject us to fines or sanctions, obligations to investigate or remediate contamination or restore natural resources, liability for third party property damage or personal injury claims and the imposition of new permitting requirements and/or the modification or revocation of our existing operating permits, among other effects. These and other developments could materially harm our business, financial condition and results of operation. See “Business-Environmental regulation.”
The catastrophic loss of one of our manufacturing facilities could harm our business, financial condition and results of operations.
While we manufacture our products in several facilities and maintain insurance covering our facilities, including business interruption insurance, a catastrophic loss of the use of all or a portion of one of our manufacturing facilities due to accident, labor issues, weather conditions, natural disaster, civil unrest or otherwise, whether short or long-term, could materially harm our business, financial condition and results of operations.
Changes in tax legislation in local jurisdictions may have an impact on our overall effective tax rate, which, in turn, may harm our profitability.
Our overall effective tax rate is equal to our total tax expense as a percentage of our pre-tax income or loss before tax. However, tax expenses and benefits are determined separately for each of our taxpaying entities or groups of entities that is consolidated for tax purposes in each jurisdiction. Losses in these jurisdictions may provide no current financial statement tax benefit. As a result, changes in the mix of profits and losses between jurisdictions, among other factors, could have a significant impact on our overall effective tax rate. Further, changes in tax
legislation, such as changes in tax rates, transfer pricing regimes, the applicability of value added taxes and the imposition of new taxes, could have an adverse effect on profitability.
Certain of our officers and directors have interests and positions that could present potential conflicts.
A number of our directors and officers hold similar positions with our controlling shareholder, FNF, and certain of FNF's affiliates. For example, Douglas K. Ammerman is a director of the Company and is also a director of FNF. Similarly, William P. Foley, II, George P. Scanlon and Brent B. Bickett, who are also directors of the Company, serve as executive officers of FNF. In addition, Michael L. Gravelle, our Senior Vice President, General Counsel and Corporate Secretary, serves as Executive Vice President, General Counsel and Corporate Secretary of FNF. As a result of the foregoing, there may be circumstances where certain of our executive officers and directors may be subject to conflicts of interest with respect to, among other things: (i) our ongoing relationship with FNF, including related party agreements and other arrangements with respect to the administration of tax matters, employee benefits and indemnification; and (ii) conflicts of time with respect to matters potentially or actually involving or affecting the Company.
We seek to manage these potential conflicts through abstention, oversight by independent members of our Board of Directors and provisions in our agreements with FNF, if any. However, there can be no assurance that such measures will be effective or that we will be able to resolve all potential conflicts with FNF, or that the resolution of any such conflicts will be no less favorable to us than if we were dealing with unaffiliated persons or third parties.
We have significant amounts of debt and require significant cash flow to service our debt.
We have a significant amount of indebtedness, will continue to have a significant amount of indebtedness and may issue additional debt in the future. Our high levels of indebtedness could have important consequences, including:
| |
| • | adversely affecting our stock price; |
| |
| • | requiring us to dedicate a substantial portion of our cash flow from operations to payments on indebtedness, which reduces the availability of cash flow to fund working capital, capital expenditures, research and development efforts and other general corporate purposes; |
| |
| • | increasing our vulnerability to adverse general economic or industry conditions; |
| |
| • | limiting our flexibility in planning for, or reacting to, changes in our business or the industry in which we operate; |
| |
| • | making it more difficult for us to satisfy our obligations under our financing documents; |
| |
| • | impairing our ability to obtain additional financing in the future for working capital, capital expenditures, debt service requirements, acquisitions, general corporate purposes or other purposes; |
| |
| • | placing us at a competitive disadvantage to our competitors who are not as highly leveraged; and |
| |
| • | triggering an event of default under our credit facilities if we fail to comply with the related financial and other restrictive covenants. |
In order to adequately service our indebtedness, we require a significant amount of cash. Our future cash flow is subject to some factors that are beyond our control, and our future cash flow may not be sufficient to meet our obligations and commitments. If we are unable to generate sufficient cash flow from operations in the future to service our indebtedness and to meet our other commitments, we will be required to adopt one or more alternatives, such as delaying capital expenditures, refinancing or restructuring our indebtedness, selling material assets or operations or seeking to raise additional debt or equity capital. These actions may not be implemented on a timely basis or on satisfactory terms, or at all, and may not enable us to continue to satisfy our capital requirements. Restrictive covenants in our indebtedness may prohibit us from adopting any of these alternatives (with the failure to comply with these covenants resulting in an event of default which, if not cured or waived, could result in the acceleration of all of our indebtedness). Our assets and cash flow may be insufficient to fully repay borrowings under our outstanding debt instruments, if accelerated upon an event of default. We may be unable to repay, refinance or restructure the payments of those debt instruments.
Our debt instruments restrict our current and future operations.
The agreements governing our indebtedness impose significant operating and financial restrictions on us. These restrictions limit our ability and the ability of our subsidiaries to, among other things:
| |
| • | incur or guarantee additional debt, incur liens or issue certain equity; |
| |
| • | declare or make distributions to our stockholders, repurchase equity or prepay certain debt; |
| |
| • | make loans and certain investments; |
| |
| • | make certain acquisitions of equity or assets; |
| |
| • | enter into certain transactions with affiliates; |
| |
| • | enter into mergers, acquisitions and other business combinations; |
| |
| • | consolidate, transfer, sell or otherwise dispose of certain assets; |
| |
| • | enter into sale and leaseback transactions; |
| |
| • | enter into restrictive agreements; |
| |
| • | make capital expenditures; |
| |
| • | amend or modify organizational documents; and |
| |
| • | engage in businesses other than the businesses we currently conduct. |
In addition to the restrictions and covenants listed above, our debt instruments require us to comply with specified financial maintenance covenants. These restrictions or covenants could limit our ability to plan for or react to market conditions or meet certain capital needs and could otherwise restrict our corporate activities.
Any one or more of the risks discussed in this section, as well as events not yet contemplated, could result in our failing to meet the covenants and restrictions described above. Events beyond our control may affect our ability to comply with these covenants and restrictions, and an adverse development affecting our business could require us to seek waivers or amendments of these covenants or restrictions or alternative or additional sources of financing. We may be unable to obtain these waivers, amendments or alternatives on favorable terms, if at all.
A breach of any of the covenants or restrictions contained in any of our existing or future debt instruments, including our inability to comply with the financial maintenance covenants in these debt instruments, could result in an event of default under these debt instruments. An event of default could permit the agent or lenders under the debt instruments to discontinue lending, to accelerate the related debt, as well as any other debt to which a cross acceleration or cross default provision applies, and to institute enforcement proceedings against our assets that secure the extensions of credit under our outstanding indebtedness. The agent or lenders could terminate any commitments they had made to supply us with further funds. If the agent or lenders require immediate repayments, we may not be able to repay them in full. This could harm our financial results, liquidity, cash flow and our ability to service our indebtedness and could lead to our bankruptcy.
Substantially all of our domestic subsidiaries' assets are pledged as collateral under our credit facilities.
Substantially all of our domestic subsidiaries' assets are pledged as collateral for these borrowings. If we are unable to repay all secured borrowings when due, whether at maturity or if declared due and payable following a default, the agent or the lenders, as applicable, would have the right to proceed against the assets pledged to secure the indebtedness and may sell these assets in order to repay those borrowings, which could materially harm our business, financial condition and results of operations.
We operate as a holding company and depend on our subsidiaries for cash to satisfy the obligations of the holding company.
Remy International, Inc. is a holding company. Our subsidiaries conduct all of our operations and own substantially all of our assets. Our cash flow and our ability to meet our obligations depend on the cash flow of our subsidiaries. The payment of funds in the form of dividends, inter-company payments, tax sharing payments and other payments may in some instances be subject to restrictions under the terms of our subsidiaries' financing arrangements.
Our variable rate indebtedness exposes us to interest rate risk, which could cause our debt costs to increase significantly.
A significant portion of our borrowings accrue interest at variable rates and expose us to interest rate risks. A 1% increase in the current variable rate would have an immaterial impact on our interest expense because the rate on our Term B loan, our primary debt facility, would not rise above the LIBOR floor rate of 1.75% set under our Term B loan agreement. In addition, we have interest rate swaps in place with respect to 50% of the principal amount of our Term B loan.
Our ability to borrow under our revolving credit facility is subject to fluctuations of our borrowing base and periodic appraisals of certain of our assets. An appraisal could result in the reduction of available borrowings under this facility, which would harm our liquidity.
The borrowings available under our revolving credit facility are subject to fluctuations in the calculation of a borrowing base, which is based on the value of our domestic accounts receivable and inventory. The administrative agent for this facility causes a third party to perform an appraisal of the assets included in the calculation of the borrowing base either on a semi-annual basis or more frequently if our availability under the facility is less than $23.75 million during any 12-month period. If certain material defaults under the facility have occurred and are continuing, then the administrative agent has the right to perform this appraisal as often as it deems necessary in its sole discretion. If an appraisal results in a significant reduction of the borrowing base, then a portion of the outstanding indebtedness under the facility could become immediately due and payable.
Our principal stockholders have substantial control over us and will be able to influence corporate matters.
Our directors, executive officers and holders of more than 5% of our common stock, together with their affiliates, beneficially owned, in the aggregate, approximately 56.3% of our outstanding common stock as of December 31, 2012. Our major stockholder, Fidelity National Special Opportunities, Inc. (a subsidiary of Fidelity National Financial, Inc. or NYSE:FNF), owned approximately 51% of our outstanding common stock as of December 31, 2012. On January 31, 2013, FNF executives or affiliated Board members comprised four (4) of the eight (8) member Board of Directors. As a result, we are a subsidiary of FNF who will be able to control or exercise significant influence over all matters requiring stockholder approval, including the election of directors and approval of significant corporate transactions, such as a merger or other sale of our company or its assets. This concentration of ownership will limit your ability to influence corporate matters and may delay or prevent a third party from acquiring control over us.
Additionally, Delaware law permits corporations to adopt provisions renouncing any interest or expectancy in certain opportunities that are presented to the company or its officers, directors or stockholders. Our certificate of incorporation renounces any interest or expectancy that we have in, or in being offered an opportunity to participate in, corporate opportunities that are from time to time presented to members of our board of directors who are not our employees, other than opportunities expressly presented to such directors solely in their capacity as our director. For purposes of these provisions, a director who is the chairman of our board of directors shall not be deemed to be an employee of the company solely by reason of holding such position. These provisions apply even if the opportunity is one that we might reasonably have pursued or had the ability or desire to pursue if granted the opportunity to do so. Furthermore, no such person is liable to us for breach of any fiduciary duty, as a director or otherwise, by reason of the fact that such person personally or on behalf of any other person pursues or acquires such business opportunity, directs such business opportunity to another person or fails to present such business opportunity, or information regarding such business opportunity, to the company.
As a result, our non-employee directors may become aware, from time to time, of certain business opportunities such as acquisition opportunities and may direct such opportunities to other businesses in which they have invested or which they advise, in which case we may not become aware of or otherwise have the ability to pursue such opportunities. Further, such businesses may choose to compete with us for these opportunities. Our renouncing our interest and expectancy in any business opportunity that may be from time to time presented to such persons could adversely impact our business or prospects if attractive business opportunities are procured by such persons, or are directed by such persons to other businesses, for their own benefit rather than for ours.
Future sales of our common stock by our stockholders could cause our stock price to decline.
The market price of our common stock could decline as a result of sales of a large number of shares of our common stock in the market, or the perception that these sales will occur.
We have granted registration rights to some of our stockholders. If these holders exercise their registration rights, we must register, under the Securities Act, the offer and sale of shares of our common stock held by them. In the aggregate, as of December 31, 2012, these registration rights covered approximately 19.4 million shares of our common stock that were then outstanding. An exercise of these registration rights, or similar registration rights that may apply to securities we may issue in the future, could result in additional sales of our common stock in the market, which could cause our stock price to fall.
The exercise of registration rights, and the sale of shares into public markets by our stockholders, could also harm our ability to raise additional equity or other capital.
The requirements of being a public company may strain our resources, divert management's attention and affect our ability to attract and retain qualified board members and executives.
As a public company, we incur significant legal, accounting and other expenses that are not incurred as a private company, including costs associated with public company reporting requirements. We incur costs associated with the Sarbanes-Oxley Act of 2002, the Dodd-Frank Wall Street Reform and Consumer Protection Act and related rules implemented or to be implemented by the Securities and Exchange Commission, or SEC, and the requirements of NASDAQ.
The expenses incurred by public companies generally for reporting and corporate governance purposes have been increasing. We expect that laws and regulations affecting public companies will increase our legal and financial compliance costs and make some activities more time-consuming and costly, although we are currently unable to estimate these costs with any degree of certainty. These laws and regulations could also make it more difficult or costly for us to obtain certain types of insurance, including director and officer liability insurance, and we may be forced to accept reduced policy limits and coverage or incur substantially higher costs to obtain the same or similar
coverage. These laws and regulations could also make it more difficult for us to attract and retain qualified persons to serve on our board of directors, on our board committees or as our executive officers and may divert management's attention. If we are unable to satisfy our obligations as a public company, we could be subject to delisting of our common stock from NASDAQ, fines, sanctions and other regulatory action and potentially civil litigation.
If we do not timely satisfy the requirements of Section 404 of the Sarbanes-Oxley Act of 2002, the trading price of our common stock could be adversely affected.
We are subject to section 404 of the Sarbanes-Oxley Act of 2002 and the related rules of the SEC, which generally require our management and independent registered public accounting firm to report on the effectiveness of our internal control over financial reporting. We expect that our management and our independent registered public accounting firm will have to provide the first of such reports with our annual report for the fiscal year ending December 31, 2013. To date, we have never conducted a review of our internal control for the purpose of providing the reports required by these rules. During the course of our review and testing, we may identify deficiencies and be unable to remediate them before we must provide the required reports. We have identified material weaknesses and significant deficiencies in our internal controls over financial reporting in the past and we may identify additional deficiencies or weaknesses again in the future.
We or our independent registered public accounting firm may not be able to conclude that we have effective internal control over financial reporting, which could harm our operating results, cause investors to lose confidence in our reported financial information and cause the trading price of our stock to fall.
Item 1B. Unresolved Staff Comments
None.
Item 2. Properties
Our world headquarters is located at 600 Corporation Drive, Pendleton, Indiana 46064. We lease our headquarters. As of December 31, 2012 we had a total of 27 facilities in 10 countries. The following table sets forth certain information regarding these facilities.
|
| | | |
| Location | Number of facilities | Use | Owned/leased |
| United States | | | |
| Anderson, IN | 1 | Engineering/Manufacturing | Leased |
| Edmond, OK | 1 | Warehouse/Engineering | Owned |
| Laredo, TX | 1 | Warehouse | Leased |
| Pendleton, IN | 1 | Engineering/Headquarters | Leased |
| Peru, IN | 1 | Manufacturing/Warehouse/Engineering | Leased |
| Taylorsville, MS | 1 | Warehouse | Leased |
| Troy, MI | 1 | Office | Leased |
| Europe | | | |
| Heist Op Den Berg, Belgium | 1 | Warehouse/Office | Leased |
| Mezokovesd, Hungary | 1 | Engineering/Manufacturing | Owned |
| Miskolc, Hungary | 1 | Engineering/Manufacturing | Owned |
| Sutton Coldfield, United Kingdom | 1 | Warehouse | Leased |
| Brazil | | | |
| Brusque | 1 | Engineering/Manufacturing | Leased |
| Sao Paulo | 1 | Office | Leased |
| Canada | | | |
| Mississauga | 1 | Warehouse | Leased |
| Winnipeg | 2 | Manufacturing/Warehouse | Owned/Leased |
| China | | | |
| Jingzhou City(1) | 1 | Engineering/Manufacturing | Leased |
| Shanghai | 1 | Office | Leased |
| Wuhan | 1 | Engineering/Manufacturing | Leased |
| Mexico | | | |
| Piedras Negras | 1 | Manufacturing/Warehouse/Office | Leased |
| San Luis Potosi | 3 | Engineering/Manufacturing/
Warehouse/Office | Leased |
| South Korea | | | |
| Kyungsangnam | 1 | Manufacturing/Warehouse | Owned |
| Dae-Gu | 1 | Engineering/Office | Leased |
| Seoul | 1 | Office | Leased |
| Tunisia | | | |
| Jemmal | 1 | Manufacturing | Leased |
| Total | 27 | | |
| | | | |
(1)We operate both our wholly owned subsidiary and our joint venture out of this facility.
Item 3. Legal Proceedings
The information concerning the legal proceedings involving the Company contained in Note 21 to the consolidated financial statements included in Part II, Item 8 of this Report is incorporated herein by reference.
Item 4. Mine Safety Disclosures
Not applicable.
Part II
Item 5. Market for Registrant's Common Equity, Related Stockholder Matters and Issuer Purchases of Equity Securities
Market for common stock
Prior to December 13, 2012, there was no active public market for our common stock, although our common stock was quoted on the Over-The-Counter Pink Sheets (“OTC Pink Sheets”) since December 14, 2007 under the symbol “RMYI.” On December 13, 2012, we became a listed company on the NASDAQ Stock Market, LLC and trade under the symbol "REMY".
The following table sets forth, for the periods indicated, the high and low prices quoted for our common stock on the OTC Pink Sheets through December 12, 2012 and NASDAQ Stock Market, LLC from December 13, 2012 to December 31, 2012.
|
| | | | | | | |
| | Stock High Price |
| Stock Low Price |
| Cash Dividends Declared |
|
| Fiscal Year Ending December 31, 2012 | | | |
| First quarter | $21.00 | $16.50 | $ | — |
|
| Second quarter | 18.25 |
| 14.00 |
| 0.10 |
|
| Third quarter | 20.50 |
| 15.00 |
| 0.10 |
|
| Fourth quarter | 17.50 |
| 15.34 |
| 0.10 |
|
| Fiscal Year Ending December 31, 2011 | |
| |
| |
| First quarter | $24.00 | $14.00 | $ | — |
|
| Second quarter | 28.00 |
| 22.00 |
| — |
|
| Third quarter | 25.85 |
| 16.05 |
| — |
|
| Fourth quarter | 17.40 |
| 14.00 |
| — |
|
Performance Graph
Set forth below is a graph comparing cumulative total stockholder return on our common stock against the cumulative total return on the S & P 500 Index and against the cumulative total return on the S & P Supercomposite Auto Components Industry Index (S15AUTC) based on currently available data. The graph assumes an initial investment of $100 on December 13, 2012, the date of our NASDAQ listing, and reflects the cumulative total return on that investment, including reinvestment of all dividends where applicable, through December 31, 2012.
|
| | | | |
| | 12/13/2012 |
| 12/31/2012 |
|
| REMY, INC. | 100.00 |
| 96.97 |
|
| S&P 500 | 100.00 |
| 100.47 |
|
| S & P Supercomposite Auto Components Index | 100.00 |
| 108.37 |
|
On January 31, 2013 the last reported sale price of our common stock on the NASDAQ Stock Market, LLC was $17.00 per share and we had approximately 154 stockholders of record.
On January 31, 2013, the Board declared a a quarterly cash dividend of $0.10 per share. The dividend will be payable on February 28, 2013 to stockholders of record as of the close of business February 14, 2013.
Our current dividend policy anticipates the payment of quarterly dividends in the future. The declaration and payment of dividends will be at the discretion of our Board of Directors and will be dependent upon our future earnings, financial condition and capital requirements. Our ability to declare dividends is subject to restrictions
under our existing credit agreement. We do not believe the restrictions contained in our credit agreement will, in the foreseeable future, adversely affect our ability to pay cash dividends at the current dividend rate.
On December 21, 2012, we completed our Employee Stock Purchase plan which resulted in the issuance of 11,107 shares of common stock. The offering was for shares of common stock in a subscription offering to eligible employees of Remy and certain of their immediate family members. This was the initial public offering of the common stock of Remy, as requested on Form S-1 (File No. 333-173081) and declared effective by the SEC on November 2, 2012. The initial public offering price was $17.00 per share. Any person purchasing shares in that offering received extra shares for no additional consideration (“additional shares”) at a rate of 15 shares for every 100 shares purchased, with any fraction of an additional share rounded down. The minimum number of shares that a person could have subscribed to purchase in that offering was 100 shares and the maximum (not including additional shares that would be issued) was 200 shares. The proceeds of that offering were used for general business purposes.
On February 14, 2013, we filed a Form S-8 to register 5,500,000 shares which may be issued pursuant to the Remy International, Inc. Omnibus Incentive Plan. The Omnibus Incentive Plan became effective on October 27, 2010 and was amended on March 24, 2011, and permits the granting of nonqualified stock options, incentive stock options, stock appreciation rights, restricted stock, restricted stock units, performance shares, performance units and other cash or share based awards.
Item 6. Selected Financial Data
The following tables should be read in conjunction with "Item 7—Management's Discussion and Analysis of Financial Condition and Results of Operations" and our consolidated financial statements included under Item 8 below. The historical results presented below are not necessarily indicative of financial results for future periods.
|
| | | | | | | | | | | | | | | |
| | Years ended December 31, | |
| | 2012 | 2011 | 2010 | 2009 | 2008 |
| | (in thousands, except per share data) | |
| Consolidated Statement of Operations Data: | | | | | |
| | | | | | |
| Net sales | $ | 1,133,547 |
| $ | 1,194,953 |
| $ | 1,103,799 |
| $ | 910,745 |
| $ | 1,100,805 |
|
| Cost of goods sold | 895,843 |
| 925,052 |
| 866,761 |
| 720,723 |
| 916,375 |
|
| Gross profit | 237,704 |
| 269,901 |
| 237,038 |
| 190,022 |
| 184,430 |
|
| Selling, general and administrative expenses | 129,520 |
| 139,685 |
| 127,405 |
| 101,827 |
| 109,683 |
|
| Reorganization items | — |
| — |
| — |
| — |
| 2,762 |
|
| Intangible asset impairment charges | — |
| 5,600 |
| — |
| 4,000 |
| 1,500 |
|
| Restructuring and other charges | 10,271 |
| 3,572 |
| 3,963 |
| 7,583 |
| 15,325 |
|
| Operating income | 97,913 |
| 121,044 |
| 105,670 |
| 76,612 |
| 55,160 |
|
| Other income | — |
| — |
| — |
| — |
| 2,223 |
|
| Interest expense | 27,757 |
| 30,900 |
| 46,739 |
| 49,534 |
| 54,938 |
|
| Loss on extinguishment of debt | — |
| — |
| 19,403 |
| — |
| — |
|
| Income before income taxes | 70,156 |
| 90,144 |
| 39,528 |
| 27,078 |
| 2,445 |
|
| Income tax (benefit) expense | (71,229 | ) | 14,813 |
| 18,337 |
| 13,018 |
| 6,818 |
|
| Net income (loss) | 141,385 |
| 75,331 |
| 21,191 |
| 14,060 |
| (4,373 | ) |
| Less: Net income attributable to noncontrolling interest | 2,774 |
| 3,445 |
| 4,273 |
| 3,272 |
| 1,403 |
|
| Net income (loss) attributable to Remy International, Inc. | 138,611 |
| 71,886 |
| 16,918 |
| 10,788 |
| (5,776 | ) |
| Preferred stock dividends | — |
| (2,114 | ) | (30,571 | ) | (25,581 | ) | (23,145 | ) |
| Loss on extinguishment of preferred stock | — |
| (7,572 | ) | — |
| — |
| — |
|
| Net income (loss) attributable to common stockholders | $ | 138,611 |
| $ | 62,200 |
| $ | (13,653 | ) | $ | (14,793 | ) | $ | (28,921 | ) |
| Basic earnings (loss) per share: |
|
|
| |
|
| Earnings (loss) per share | $ | 4.53 |
| $ | 2.14 |
| $ | (1.33 | ) | $ | (1.46 | ) | $ | (2.89 | ) |
| Weighted average shares outstanding | 30,616 |
| 29,096 |
| 10,278 |
| 10,130 |
| 10,004 |
|
| Diluted earnings (loss) per share: |
|
|
| |
|
| Earnings (loss) per share | $ | 4.47 |
| $ | 2.10 |
| $ | (1.33 | ) | $ | (1.46 | ) | $ | (2.89 | ) |
| Weighted average shares outstanding | 30,990 |
| 29,674 |
| 10,278 |
| 10,130 |
| 10,004 |
|
|
| | | | | | | | | | | | | | | |
| | As of December 31, | |
| | 2012 |
| 2011 |
| 2010 |
| 2009 |
| 2008 |
|
| | (in thousands) | |
| Consolidated Balance Sheet Data: | | |
| |
| |
| |
|
| Cash and cash equivalents | $ | 111,733 |
| $ | 91,684 |
| $ | 37,514 |
| $ | 30,171 |
| $ | 18,744 |
|
| Working capital | 230,332 |
| 139,567 |
| 81,762 |
| 72,723 |
| 69,890 |
|
| Total assets | 1,101,215 |
| 1,029,519 |
| 969,156 |
| 927,255 |
| 929,217 |
|
| Long-term debt, net of current maturities | 284,475 |
| 286,680 |
| 317,769 |
| 337,905 |
| 345,133 |
|
| Post-retirement benefits other than pensions, net of current portion | 1,969 |
| 1,918 |
| 1,371 |
| 1,552 |
| 5,261 |
|
| Accrued pension benefits, net of current portion | 31,762 |
| 31,060 |
| 21,002 |
| 17,816 |
| 20,949 |
|
| Redeemable preferred stock | — |
| — |
| 166,116 |
| 135,545 |
| 109,964 |
|
| Retained earnings (accumulated deficit) | 186,483 |
| 57,433 |
| (14,453 | ) | (10,535 | ) | (10,313 | ) |
| Total equity | 471,508 |
| 317,344 |
| 77,473 |
| 82,988 |
| 81,451 |
|
Item 7. Management's Discussion and Analysis of Financial Condition and Results of Operations
You should read the following discussion and analysis of our financial condition and results of operations in conjunction with our financial statements and related notes contained elsewhere in this Form 10-K. This discussion contains forward-looking statements based upon current expectations that involve risks, uncertainties, and assumptions. Our actual results may differ materially from those anticipated in these forward-looking statements as a result of a variety of factors, including those set forth under “Risk factors” and elsewhere in this Form 10-K.
Executive Overview
Our Business
We are a global market leader in the design, manufacture, remanufacture, marketing and distribution of non-discretionary, rotating electrical components for light and commercial vehicles for original equipment manufacturers, or OEMs, and the aftermarket. We sell our products worldwide primarily under the well-recognized “Delco Remy,” “Remy” and “World Wide Automotive” brand names, as well as our customers' well-recognized private label brand names.
Our principal products for both light and commercial vehicles include:
| |
| • | new starters and alternators; |
| |
| • | remanufactured starters and alternators; and |
We sell our new starters, alternators and hybrid electric motors to U.S. and non-U.S. OEMs for factory installation on new vehicles. We sell remanufactured and new starters and alternators to aftermarket customers, mainly retailers in North America, warehouse distributors in North America and Europe, and OEMs globally for the original equipment service ("OES"), market. We sell a small volume of remanufactured locomotive power assemblies in North America, and steering gear and brake calipers for light vehicles in Europe.
Financial Results
During 2012, net income was $141.4 million, an increase of $66.1 million over the same period in 2011. During the year, we reached the conclusion that the net deferred tax assets in the United States and in certain foreign locations are more likely than not to be utilized. As such, the valuation allowances previously recorded against those net deferred tax assets have been reversed resulting in an income tax benefit of $89.4 million in 2012. During the year, $10.3 million of restructuring and other charges was recorded for operational restructure.
Recent Trends and Conditions
General economic conditions
During the last half of 2012, the U.S. commercial vehicle market softened. Demand in Europe remains weak, and China economic growth slowed. The prolonged economic uncertainties in Europe continue as the ongoing sovereign debt crisis and banking concerns in the Euro zone have resulted in recessionary conditions throughout the region with low consumer demand for vehicles. The global automotive industry remains susceptible to uncertain economic conditions that could adversely impact consumer demand for vehicles.
Weather can affect aftermarket sales of starters and alternators. Extreme cold can damage starters and extreme heat can increase alternator failures. In both cases, this extreme weather can stimulate sales of aftermarket starters and alternators. In early 2011, the Midwest and Northeast United States experienced a relatively harsh winter. We did not experience the same effect in 2012.
Materials and pricing pressure
Overall commodity price fluctuation is an ongoing concern for our business and has been an operational and financial focus. We have pass-through pricing agreements with a number of our customers that reduce our exposure to metals price volatility. Where metals price volatility is not covered by customer agreements, we utilize hedging instruments where appropriate, taking into consideration their cost and their effectiveness. Copper prices are lower than in 2011, but the prices increased during the latter part of 2012 from earlier in the year.
We use rare earth magnets in certain motors. During 2011, China, a major source of rare earth magnets, reduced its export quotas for rare earth minerals, causing a significant increase in cost. In 2012, prices have decreased from their peak in 2011. In addition, we have changed the material content and design of certain starter motors in an effort to mitigate cost fluctuations in the future.
In our remanufacturing operations, our principal inputs are cores, approximately 90% of which we receive in exchange for remanufactured units. When we have to purchase cores rather than receiving them in exchange for remanufactured units, we are affected by market pricing of cores. The cost of cores fluctuates based on a number of factors, including supply and demand and the underlying value of the commodities that the cores contain.
Additionally, pressure from our customers to reduce prices is characteristic of the automotive supply industry. Historically, we have taken steps to reduce costs and minimize or resist price reductions.
Foreign currencies
During 2012 and 2011, approximately 34% and 37%, respectively, of our net sales were transacted outside the United States. The functional currency of our foreign operations is generally the local currency, while our financial statements are presented in U.S. dollars. Foreign exchange has an unfavorable impact on net sales when the U.S. dollar is relatively strong as compared with foreign currencies and a favorable impact on net sales when the U.S. dollar is relatively weak as compared with foreign currencies. While we employ financial instruments to hedge certain exposures related to transactions from fluctuations in foreign currency exchange rates, these hedging actions do not entirely insulate us from currency effects and such programs may not always be available to us at economically reasonable costs. During 2012, we experienced a negative impact from foreign currency effects on our reported earnings in U.S. dollars compared to 2011, primarily resulting from the translation of results denominated in other currencies, mainly the South Korean Won, Euro and Brazilian Real.
Operational efficiency efforts
In general, our long-term objectives are geared toward profitably growing our business, expanding our innovative technologies, winning new contracts, generating cash and strengthening our market position. On an ongoing basis, we evaluate our competitive position and determine what actions may be required to maintain and improve that position.
We continue to focus on investing appropriate levels of capital to support anticipated expansion in significant growth markets, such as China. These investments are critical as they position us to benefit from expected long-term growth opportunities.
We believe that a continued focus on research, development and engineering activities is critical to maintaining our leadership position in the industry and meeting our long-term objectives. As a result, we continue our commitment to invest in facilities and infrastructure in order to support new business awards and achieve our long-term growth plans. During the quarter, a number of our hybrid customers delayed launches of their products. We are now moderating our investments until the market develops. We have elected not to initiate the next phase of capacity despite the DOE grant funding.
Although we believe that we have established a firm foundation for profitability, we continue to evaluate our global manufacturing and supply chain to further streamline our operations. During 2012, we completed the closure of our facility in Matehuala, Mexico. We are in the process of closing our Mezokovesd, Hungary plant and transferring the production to our other facilities in Hungary, Mexico and Korea.
General factors affecting customer demand
Original equipment market
The demand for components in the OE market is cyclical and depends on levels of new vehicle production. Production and sale of new vehicles, in turn, depend on the economy, consumer confidence, discounts and incentives offered by automakers and the availability of funds to finance purchases. The economy and the price of gasoline also affect the types of vehicles sold. In general, larger vehicles tend to be more profitable for manufacturers and auto parts suppliers.
Light duty vehicle production increased globally in 2012 by 6% over 2011. Our two largest light duty OE customers underperformed the global market, and our light duty net sales decreased in 2012 by 7% from 2011. Global commercial vehicle production for the year ended December 31, 2012, was 6% lower than in the previous year. Our commercial net sales decreased 9% in 2012 from 2011 as the strength of certain of our customers did not fully offset weakness at others.
Our OEM customers generally also conduct original equipment supply (OES) and other aftermarket operations. These customers do not always distinguish whether the parts purchased are for new vehicle manufacture or for aftermarket operations, particularly in respect of parts for light vehicles. In this Form 10-K, our net sales figures and related revenue-based percentages that we present for OEM include OES sales to our OEM customers, unless otherwise noted.
Aftermarket
Aftermarket sales of starters and alternators for light vehicles do not follow the same cycles as OEM sales. Differing business cycles in the aftermarket and original equipment channels help us to mitigate the variability in our revenues. Aftermarket sales are principally affected by the strength of the economy and gas prices. In a weaker economy, drivers tend to keep their vehicles and repair them rather than buying new vehicles. Lower gas prices have historically tended to result in more miles driven, which increases the frequency with which auto repairs are needed. However, a weak economy may reduce miles driven. Miles driven in the U.S. has been relatively flat in the last two years. Further, government programs designed to encourage owners of older cars to trade them in for new cars can reduce the number of cars on the road that require repairs. Finally, improved durability of OE and aftermarket parts reduces the number of units sold in the aftermarket.
Weather can also affect aftermarket sales of starters and alternators. Extreme cold can damage starters and extreme heat can increase alternator failures. In both cases, this extreme weather can stimulate sales of aftermarket starters and alternators.
The aftermarket for light vehicle components is extremely competitive. Many retailers and warehouse distributors purchase starters and alternators from only one or two suppliers, under contracts that run for five years or less. When contracts are up for renewal, competitors tend to bid very aggressively to replace the incumbent supplier, although the cost of switching from the incumbent tends to mitigate this competition.
Aftermarket demand for commercial vehicles is driven more by general economic activity as compared to light vehicles. The key parameters driving on-highway demand are freight miles driven and fleet capacity utilization, which generally indicate truck usage and wear.
Non - GAAP measurements - Adjusted EBITDA
Adjusted EBITDA is not a measure of performance defined in accordance with accounting principles generally accepted in the United States (U.S. GAAP). We use adjusted EBITDA as a supplement to our U.S. GAAP results in evaluating our business. Other companies in our industry define adjusted EBITDA differently from us and, as a result, our measure is not comparable to similarly titled measures used by other companies in our industry.
We define adjusted EBITDA as net income attributable to common stockholders before interest expense, tax expense, depreciation and amortization, stock-based compensation expense, net income attributable to noncontrolling interest, restructuring, other charges and other impairment charges, loss on extinguishment of debt,
preferred stock dividends, loss on extinguishment of preferred stock and other adjustments as set forth in the reconciliations provided below.
Adjusted EBITDA is one of the key factors upon which we assess performance. As an analytical tool, adjusted EBITDA assists us in comparing our performance over various reporting periods on a consistent basis because it excludes items that we do not believe reflect our ongoing operating performance.
Adjusted EBITDA should not be considered as an alternative to net income as an indicator of our performance, as an alternative to net cash provided by operating activities as a measure of liquidity, or as an alternative to any other measure prescribed by U.S. GAAP. There are limitations to using non-U.S. GAAP measures such as adjusted EBITDA. Although we believe that adjusted EBITDA may make an evaluation of our operating performance more consistent because it removes items that do not reflect our ongoing operations, adjusted EBITDA excludes certain financial information that some may consider important in evaluating our performance.
The following table sets forth a reconciliation of adjusted EBITDA to its most directly comparable U.S. GAAP measure, net income attributable to common stockholders.
|
| | | | | | | | | |
| | Years ended December 31, | |
| | 2012 |
| 2011 |
| 2010 |
|
| | | (in thousands) | |
| Net income (loss) attributable to common stockholders | $ | 138,611 |
| $ | 62,200 |
| $ | (13,653 | ) |
| Adjustments: | | |
| |
|
| Interest expense | 27,757 |
| 30,900 |
| 46,739 |
|
| Income tax (benefit) expense | (71,229 | ) | 14,813 |
| 18,337 |
|
| Depreciation and amortization | 38,060 |
| 35,252 |
| 29,269 |
|
| Stock-based compensation expense | 7,261 |
| 6,884 |
| 1,196 |
|
| Net income attributable to noncontrolling interest | 2,774 |
| 3,445 |
| 4,273 |
|
| Restructuring and other charges | 10,271 |
| 3,572 |
| 3,963 |
|
| Intangible asset impairment charges | — |
| 5,600 |
| — |
|
| Preferred stock dividends | — |
| 2,114 |
| 30,571 |
|
| Loss on extinguishment of preferred stock | — |
| 7,572 |
| — |
|
| Loss on extinguishment of debt | — |
| — |
| 19,403 |
|
| Other | 24 |
| 24 |
| — |
|
| Total adjustments | 14,918 |
| 110,176 |
| 153,751 |
|
| Adjusted EBITDA | $ | 153,529 |
| $ | 172,376 |
| $ | 140,098 |
|
Results of operations
Year ended December 31, 2012 compared to year ended December 31, 2011
The following table presents our consolidated results of operations for the years ended December 31, 2012 and 2011.
|
| | | | | | | | |
| | Years ended December 31, | | % Increase/ |
|
| | 2012 | 2011 | (Decrease) |
|
| | (in thousands) |
| Net sales | $ | 1,133,547 |
| $ | 1,194,953 |
| (5.1 | )% |
| Cost of goods sold | 895,843 |
| 925,052 |
| (3.2 | )% |
| Gross profit | 237,704 |
| 269,901 |
| (11.9 | )% |
| Selling, general, and administrative expenses | 129,520 |
| 139,685 |
| (7.3 | )% |
| Intangible assets impairment charges | — |
| 5,600 |
| (100.0 | )% |
| Restructuring and other charges | 10,271 |
| 3,572 |
| 187.5 | % |
| Operating income | 97,913 |
| 121,044 |
| (19.1 | )% |
| Interest expense | 27,757 |
| 30,900 |
| (10.2 | )% |
| Income before income taxes | 70,156 |
| 90,144 |
| (22.2 | )% |
| Income tax expense | (71,229 | ) | 14,813 |
| (580.9 | )% |
| Net income | 141,385 |
| 75,331 |
| 87.7 | % |
| Less net income attributable to noncontrolling interest | 2,774 |
| 3,445 |
| (19.5 | )% |
| Net income attributable to Remy International, Inc. | 138,611 |
| 71,886 |
| 92.8 | % |
| Preferred stock dividends | — |
| (2,114 | ) | (100.0 | )% |
| Loss on extinguishment of preferred stock | — |
| (7,572 | ) | (100.0 | )% |
| Net income (loss) attributable to common stockholders | $ | 138,611 |
| $ | 62,200 |
| 122.8 | % |
Net sales
Net sales decreased by $(61.4) million, or (5.1)%, to $1.1 billion for the year ended December 31, 2012, from $1.2 billion for the year ended December 31, 2011. Volume accounted for $30.4 million of the decrease while mix and pricing contributed another $26.5 million, partially offset by metals recovery of $9.4 million.
Net sales of new starters and alternators to OEMs in the year ended December 31, 2012 decreased in both light vehicle and commercial vehicle products. Net sales of light vehicle starters and alternators to OEMs were $396.6 million in the year ended December 31, 2012, a $29.8 million, or 7.0%, decrease from $426.4 million in the same period in 2011. Net sales of commercial vehicle starters and alternators to OEMs were $267.2 million in the year ended December 31, 2012, a $25.2 million, or 8.6%, decrease from $292.4 million in the same period in 2011. Our two largest light duty OEM customers underperformed the global market. The North America commercial vehicle Class 5-8 market softened in the last half of 2012, with the fourth quarter down 8.5% from the same period in 2011. Our net sales decreased 9% from 2011 to 2012 as the strength of certain of our customers did not fully offset weakness at others. We also sold $35.7 million of hybrid electric motors to OEMs in the year ended December 31, 2012, as compared to $25.5 million in the same period in 2011. The increase of $10.2 million was due mainly to new product and customer launches in 2012.
Net sales of light vehicle products to aftermarket customers were $318.9 million in the year ended December 31, 2012, a $11.6 million, or 3.5% decrease from $330.5 million in the same period in 2011. Our global units sold to aftermarket customers for light vehicles increased in 2012 from 2011 due to market share gains, but our net sales declined 4% due to mix and pricing pressures. Net sales of starters and alternators for commercial vehicles to aftermarket customers were $73.6 million in 2012, a decrease of $5.9 million, or 7.4% from $79.5 million in 2011.
Net sales of remanufactured locomotive power trains and multiline products, which consist of a small volume of remanufactured steering gear and brake calipers we sell in Europe, to aftermarket customers were $41.6 million in the year ended December 31, 2012, a $0.9 million, or 2.2% increase from 2011.
Foreign currency translation had a net unfavorable impact on net sales of $13.9 million in the year ended December 31, 2012 compared to the same period in 2011.
Cost of goods sold
Cost of goods sold primarily represents materials, labor and overhead production costs associated with our products and production facilities. Cost of goods sold decreased $(29.2) million, or (3.2)%, to $895.8 million in the year ended December 31, 2012 from $925.1 million in 2011. Cost of goods sold as a percentage of net sales increased during the year ended December 31, 2012 to 79.0% from 77.4% for the year ended December 31, 2011. Cost of goods sold in the year ended December 31, 2011 benefited from a $7.3 million gain related to a settlement with an OE customer and an insurance settlement, in addition to a commodity hedge gain of $6.7 million. Excluding the impact of these settlements and gains, our cost of goods sold would have been 78.6% of net sales for the year ended December 31, 2011.
Gross profit
As a result of the above, gross profit as a percentage of sales decreased to 21.0% for the year ended December 31, 2012 from 22.6% for the year ended December 31, 2011.
Selling, general and administrative expenses
For the year ended December 31, 2012, selling, general and administrative expenses, or SG&A, were $129.5 million, which represents a decrease of $(10.2) million, or (7.3)%, from SG&A of $139.7 million for the year ended December 31, 2011. The decrease is primarily related to the realization of cost saving initiatives and restructuring actions.
Intangible asset impairment charge
We had no intangible asset impairment charge in 2012. For 2011, intangible asset impairment charge was $5.6 million relating to a defined-life intangible trade name. In 2011, that trade name was fully impaired as a result of revenue generated by the products sold under our trade name being shifted to products sold under one of our customer’s private label brand.
Restructuring and other charges
Restructuring and other charges, including fixed asset impairments, increased by $6.7 million, or 187.5%, to $10.3 million for the year ended December 31, 2012 compared to $3.6 million for the year ended December 31, 2011. Restructuring charges in 2012 were reductions in force related to further management realignment, the closure of our Matehuala, Mexico facility, and certain Europe operations, and exit costs related to our Mexico, Europe and Virginia facilities. During the second quarter of 2012, the company engaged a consulting firm to assist in the analysis of the North America operations. The other charges are related to these consulting fees and other related expenses. The fixed asset impairment charges relate to the closure of our facilities in Matehuala, Mexico and Mezokovesd, Hungary.
Interest expense, net
Interest expense decreased by $(3.1) million, or (10.2)%, to $27.8 million for the year ended December 31, 2012, as compared to $30.9 million for the year ended December 31, 2011. Interest expense on long-term borrowings was lower due to lower amounts borrowed, and a lower interest rate, on our term loan and revolving credit facility than the previous year.
Income taxes
Tax (benefit) expense decreased by $(86.0) million from $14.8 million for the year ended December 31, 2011 to $(71.2) million for the year ended December 31, 2012. This decrease was primarily due to release of U.S. and certain foreign valuation allowances during the year. See "Valuation allowances on deferred income tax assets" section in our "Critical Accounting Policies" discussion below.
Preferred stock dividends
Preferred stock dividends for the year ended December 31, 2012 were zero compared to $(2.1) million for the year ended December 31, 2011. We exchanged 48,004 preferred shares on January 18, 2011 for common shares and
redeemed the remaining preferred shares and paid accumulated dividends on January 31, 2011. As a result, we did not have preferred stock dividends after January 2011.
Net income (loss) attributable to common stockholders
Our net income (loss) attributable to common stockholders for the year ended December 31, 2012 was $138.6 million as compared to $62.2 million for the year ended December 31, 2011, for the reasons described above.
Year ended December 31, 2011 compared to year ended December 31, 2010
The following table presents our consolidated results of operations for the years ended December 31, 2011 and 2010.
|
| | | | | | | | |
| | Year ended December 31, | | % Increase/ |
|
| | 2011 |
| 2010 |
| (Decrease) |
|
| | (in thousands) | | |
| Net sales | $ | 1,194,953 |
| $ | 1,103,799 |
| 8.3 | % |
| Cost of goods sold | 925,052 |
| 866,761 |
| 6.7 | % |
| Gross profit | 269,901 |
| 237,038 |
| 13.9 | % |
| Selling, general, and administrative expenses | 139,685 |
| 127,405 |
| 9.6 | % |
| Intangible asset impairment charges | 5,600 |
| — |
| 100.0 | % |
| Restructuring and other charges | 3,572 |
| 3,963 |
| (9.9 | )% |
| Operating income | 121,044 |
| 105,670 |
| 14.5 | % |
| Interest expense | 30,900 |
| 46,739 |
| (33.9 | )% |
| Loss on extinguishment of debt | — |
| 19,403 |
| (100 | )% |
| Income before income taxes | 90,144 |
| 39,528 |
| 128.1 | % |
| Income tax expense | 14,813 |
| 18,337 |
| (19.2 | )% |
| Net income | 75,331 |
| 21,191 |
| 255.5 | % |
| Less net income attributable to noncontrolling interest | 3,445 |
| 4,273 |
| (19.4 | )% |
| Net income attributable to Remy International, Inc. | 71,886 |
| 16,918 |
| 324.9 | % |
| Preferred stock dividends | (2,114 | ) | (30,571 | ) | (93.1 | )% |
| Loss on extinguishment of preferred stock | (7,572 | ) | — |
| 100.0 | % |
| Net income (loss) attributable to common stockholders | $ | 62,200 |
| $ | (13,653 | ) | (555.6 | )% |
Net sales
Net sales increased by $91.2 million, or 8.3%, to $1.2 billion for the year ended December 31, 2011, from $1.1 billion for the year ended December 31, 2010. A majority of the increase was due to an increase in volume of sales with existing and some new customers. Increased unit volume accounted for $64.0 million of the increase over 2010, while product mix and pricing contributed an additional $27.2 million to the increase.
Net sales of new starters and alternators to OEMs in the year ended December 31, 2011 increased in both light vehicle and commercial vehicle products. Net sales of light vehicle starters and alternators to OEMs were $426.4 million in 2011, a $30.5 million, or 7.7%, increase over $395.9 million in 2010. Net sales of commercial vehicle starters and alternators to OEMs were $292.4 million in 2011, a $49.8 million, or 20.5% increase over $242.6 million in 2010. Our sales in these categories continued to outpace the growth in new vehicle production due in part to market share gains by us with OEMs and by the vehicles for which we supply products. We also benefitted from an increase in vehicle sales by GM, Hyundai and other makers for which we supply products that resulted from the slowdown in production by their Japanese competitors in 2011 due to the Japan tsunami. In addition, certain GM programs ended in late 2011, slowing our growth in net sales. We have been selected for future GM programs that have not yet started. Our sales of commercial vehicle products to OEMs were also higher due to an unusual volume of our products sold to their OES operations as a result of the unusually harsh winter weather in late 2010 and the first quarter of 2011 and due to an increase in freight miles driven, both of which increased the replacement rate. We also sold $25.5 million of hybrid electric motors to OEMs in 2011, as compared to $38.2 million in 2010. The decrease of $12.7 million was due mainly to the termination of production of the Daimler/BMW hybrid program in
Europe during 2010 and decreased sales of the light-duty hybrid trucks and heavy-duty hybrid buses in North America during 2011.
Net sales of light vehicle products to aftermarket customers were $330.5 million in 2011, a $23.5 million, or 7.7%, increase from $307.0 million in 2010, despite competitive pressures and other external factors, such as the the economy and higher gas prices. Our retailer sales included an unusually high level of inventory replenishment in the first half of 2011. Sales to our retailer customers also benefitted from their continued market share gains. Net sales of starters and alternators for commercial vehicles to aftermarket customers were $79.5 million in 2011, a decrease of $1.0 million, or 1.2% from $80.5 million in 2010.
Net sales of remanufactured locomotive power trains and multiline products, which consist of a small volume of remanufactured steering gear and brake calipers we sell in Europe to aftermarket customers, were $40.7 million in 2011, a $1.1 million, or 2.8% increase from 2010.
Foreign currency translation had a net favorable impact on net sales of $18.6 million in 2011 compared to 2010. This favorable impact was due mainly to the weakening of the U.S. dollar in relation to the South Korean Won, the Euro, the Chinese Renminbi, and the Brazilian Real.
Cost of goods sold
Cost of goods sold primarily represents materials, labor and overhead production costs associated with our products and production facilities. Cost of goods sold increased $58.3 million, or 6.7%, to $925.1 million in 2011 from $866.8 million in 2010. Cost of goods sold as a percentage of net sales decreased during 2011 to 77.4% from 78.5% for 2010. The decrease is due in part to a commodity hedge gain of $6.7 million recorded in 2011 as compared to a $2.0 million gain in 2010, as well as a $7.3 million gain related to a settlement with an OE customer and an insurance settlement, both recorded in 2011. In addition, we recorded an additional warranty expense of $11.6 million related to a change in warranty estimate and a specific quality issue during 2010. Excluding the $7.3 million impact of the settlements in 2011 and the $11.6 million warranty expense in 2010, our cost of goods sold would have been 78.0% of net sales for 2011 compared to 77.5% of net sales for 2010. The increase in our cost of goods sold as a percentage of net sales in 2011 is due primarily to increased commodity prices, partially offset by a decrease in overhead costs due to continued efficiencies and cost control. We incurred increased spending on commodities (excluding rare earth metals) of $33.9 million in 2011 compared to 2010. Of this increase, $24.0 million was due to higher prices and $9.9 million was from increased volume.
Gross Profit
As a result of the above, gross profit in 2011 increased by $32.9 million, or 13.9%, to $269.9 million for the year ended December 31, 2011 from $237.0 million for the year ended December 31, 2010. Gross profit as a percent of net sales, or gross margin, was 22.6% for the year ended December 31, 2011 compared to 21.5% for the year ended December 31, 2010.
Selling, general and administrative expenses
In 2011, selling, general and administrative expenses, or SG&A, increased $12.3 million, or 9.6%, from $127.4 million in 2010 to $139.7 million in 2011. SG&A as a percent of net sales increased from 11.5% in 2010 to 11.7% in 2011. The increase is primarily related to increased investments in engineering resources, particularly related to hybrid technology, and legal expenses related to a successful International Trade Commission claim we brought to protect our patented technology.
Intangible asset impairment charge
For 2011, the intangible asset impairment charge was $5.6 million relating to a defined-life intangible trade name. In 2011, that trade name was fully impaired as a result of revenue generated by the products sold under our trade name being shifted to products sold under one of our customer’s private label brand.
Restructuring and other charges
Restructuring and other charges, including fixed asset impairments, decreased by $(0.4) million, or (9.9)%, to $3.6 million for the year ended December 31, 2011 compared to $4.0 million in 2010.
Interest expense, net
Interest expense decreased by $(15.8) million, or (33.9)%, to $30.9 million in 2011 from $46.7 million in 2010. Interest expense on long-term borrowings was $15.4 million lower in 2011 than in 2010 due to lower amounts
borrowed, and a lower interest rate, on our term loan and revolving credit facility when compared to the outstanding amounts on, and rates under, our prior debt facilities.
Income taxes
Tax expense decreased by $(3.5) million from $18.3 million in 2010 to $14.8 million in 2011. This decrease was due to a higher proportion of our overall taxable income in 2011 being earned in the U.S. where we reduced the corresponding valuation allowances to offset the related tax expense.
Preferred stock dividends
Preferred stock dividends in 2011 were $(2.1) million compared to $(30.6) million for 2010. We exchanged of 48,004 shares on January 18, 2011 for common shares and redeemed of the remaining preferred shares and paid accumulated dividends on January 31, 2011. As a result, we did not have preferred stock dividends after January 2011.
Net income (loss) attributable to common stockholders
Our net income attributable to common stockholders in 2011 was $62.2 million as compared to a loss of $(13.7) million in 2010, for the reasons described above.
Liquidity and capital resources
Our cash requirements generally consist of working capital, capital expenditures, research and development programs, and debt service.
Our primary sources of liquidity are cash flows generated from operations and the various borrowing and factoring arrangements described below, including our revolving credit facility and government grants. We actively manage our working capital and associated cash requirements and continually seek more effective use of cash.
We believe that cash generated from operations, together with the amounts available under financing arrangements discussed below, as well as cash on hand, will be adequate to meet our liquidity requirements for at least the next twelve months. If we make a large acquisition or engage in certain other strategic transactions, we may need to enter into additional borrowing arrangements or obtain additional equity capital. No assurance can be given that such funds would be available to us at such time.
As of December 31, 2012, we had cash and cash equivalents on hand of $111.7 million representing a $20.0 million increase compared to the $91.7 million cash and cash equivalents on hand as of December 31, 2011. Cash and cash equivalents as of December 31, 2011 represented an increase of $54.2 million over $37.5 million on hand at December 31, 2010. Total liquidity as of December 31, 2012, including cash on hand and availability under financing arrangements, was $197.6 million.
Cash flows
The following table shows the components of our cash flows for the periods presented:
|
| | | | | | | | | |
| | Year ended December 31, | |
| | 2012 |
| 2011 |
| 2010 |
|
| | (in thousands) | |
| Net cash provided by (used in): | | | |
| Operating activities before changes in operating assets and liabilities | $ | 97,023 |
| $ | 118,577 |
| $ | 33,556 |
|
| Changes in operating assets and liabilities | (31,248 | ) | (49,030 | ) | 7,302 |
|
| Operating activities | 65,775 |
| 69,547 |
| 40,858 |
|
| Investing activities | (22,714 | ) | (18,981 | ) | (15,013 | ) |
| Financing activities | (25,453 | ) | 6,857 |
| (18,629 | ) |
Cash flows-Operating activities
Cash provided by operating activities was $65.8 million and $69.5 million for the years ended December 31, 2012 and 2011, respectively. The most significant changes in operating activities for the year ended December 31, 2012
compared to the year ended December 31, 2011 was the decrease in net income before income taxes, partially offset by an increase in cash provided by changes in trade receivables due to lower volumes.
Cash provided by operating activities for the year ended December 31, 2011, was $69.5 million, as compared to $40.9 million for the year ended December 31, 2010. Cash provided by operating activities before changes in operating assets and liabilities increased by $85.0 million primarily due to the payment of the accrued interest on the third-priority floating rate secured payment in kind (PIK) Notes.
During 2012, changes in operating assets and liabilities resulted in a negative cash flow of $(31.2) million, primarily related to payment of the annual and deferred compensation bonus plans of $15.2 million, customer obligations of $8.8 million, investments in core return rights of $5.0 million, and increases in customer contract intangibles of $5.0 million, partially offset by cash inflows due to decrease in accounts receivable. During 2011 and 2010, cash flows from changes in operating assets and liabilities were $(49.0) million and $7.3 million, respectively. The primary reasons for the lower amount in 2011 was the payment of the annual and deferred compensation bonus plans of $10.2 million and a $20.5 million increase in intangible assets related to customer contracts and intellectual property. The 2010 amount was driven by a $13.1 million increase in accrued compensation at December 31, 2010 as compared to the prior year, partially offset by increases in inventory levels and accounts receivable balances at the end of 2010 in response to higher demand. We manage our working capital by monitoring key metrics principally associated with inventory, accounts receivable and accounts payable.
Cash flows-Investing activities
Cash used in investing activities for all years reflected above consists of purchases of property, plant and equipment, partially offset by government grant proceeds.
Cash flows-Financing activities
Cash used in financing activities for the year ended December 31, 2012 was $(25.5) million, consisting primarily of $16.1 million in debt repayments and $9.2 million in dividend payments. Cash provided by financing activities was $6.9 million for the year ended December 31, 2011, primarily from net proceeds of $39.9 million generated from the common stock rights offering, less preferred stock redemption and dividends, that occurred in January 2011. See "Capital Stock Transactions" under "Financial Arrangements" below for further discussion.
Cash used by financing activities for the year ended December 31, 2010, was $(18.6) million related to the refinancing of our debt during the fourth quarter, including payment of associated fees and expenses, causing an increase in our revolver balance as of December 31, 2010.
Financing arrangements
By the end of January 2011, we had completed a series of transactions focused on improving the strength and flexibility of our capital structure. As a result of these transactions, we significantly extended and consolidated our debt maturities, reduced our future interest payments and eliminated substantial preferred stock obligations.
Revolving credit facility
In December 2010, we entered into an asset-based revolving credit facility (ABL), replacing our previous senior secured revolving credit facility. The revolving credit facility bears interest, varying with the level of available borrowing, at our election of either (i) a base rate plus 1.00%-1.50% per annum or (ii) at an applicable LIBOR rate plus 2.00%-2.50% per annum. The base rate is defined as the greatest of (x) the weighted average of the overnight federal funds rate over the relevant period plus 0.50%; (y) the three-month LIBOR plus 1.00%; and (z) the “prime rate” announced by Wells Fargo from time to time. All amounts outstanding under the revolving credit facility must be repaid by December 17, 2015. The facility is secured by a first priority lien on our domestic accounts receivable and inventory and a second priority lien on the stock of our subsidiaries and substantially all our domestic assets other than accounts receivable and inventory. The facility permits us to borrow an amount based on the amount of pledged collateral, subject to an overall limit of $95.0 million of borrowings.
At December 31, 2012, the revolver balance was zero. Based upon the collateral supporting the ABL, the amount borrowed, and the outstanding letters of credit of $2.9 million, there was additional availability for borrowing of $69.0 million on December 31, 2012.
Term loan
In December 2010, we entered into a $300.0 million term B loan with a syndicate of lenders. Our term loan is secured by a first priority lien on the stock of our subsidiaries and substantially all our domestic assets other than accounts receivable and inventory pledged under our ABL and a second priority lien on our domestic accounts receivable and inventory. The term loan bears interest at a rate consisting of LIBOR (subject to a floor of 1.75%) plus 4.5% per annum, and matures on December 17, 2016. Principal payments in the amount of $0.8 million are due at the end of each calendar quarter with termination and final payment no later than December 17, 2016. At December 31, 2012, the interest rate on the term loan, prior to the effect of the interest rate swaps described below, was 6.25%.
The term loan contains various restrictive covenants, which include, among other things: (i) a maximum leverage ratio, decreasing over the term of the facility; (ii) a minimum interest coverage ratio, increasing over the term of the facility; (iii) limitations on capital expenditures; (iv) mandatory prepayments upon certain asset sales and debt issuances; (v) requirements for minimum liquidity; and (vi) limitations on the payment of dividends in excess of a specified amount. The term loan also includes events of default customary for a facility of this type, including a cross-default provision under which the lenders may declare the loan in default if we (i) fail to make a payment when due under any debt having a principal amount greater than $5.0 million or (ii) breach any other covenant in any such debt as a result of which the holders of such debt are permitted to accelerate its maturity.
We used the proceeds from our term loan, together with borrowings under our revolving credit facility and cash on hand, to repay all outstanding amounts under our former term loans. Our former term loans are described in Note 11 to our 2012 consolidated financial statements included elsewhere herein.
In connection with our term loan, we entered into interest rate swaps under which we pay interest at 3.345% on a notional amount of $150.0 million and receive interest on such amount at LIBOR. Such swaps mature on December 31, 2013. After giving effect to these swaps, the average borrowing rate on our new term loan as of December 31, 2012 was 7.07%.
Assuming the 2010 refinancing of our prior term loans had been completed as of December 31, 2009 and our term loan and the related interest rate swaps had been in effect since that date, our interest expense in 2010 would have been $14.7 million lower than reflected in our results of operations for 2010.
Non-U.S. borrowing arrangements
We have revolving credit facilities with 4 Korean banks with a total facility amount of approximately $16.8 million of which $6.1 million is borrowed at average interest rates of 4.54% at December 31, 2012. In Hungary, there is a revolving credit facility and a note payable with 2 separate banks for a credit facility of $5.5 million of which $3.0 million is borrowed at average interest rates of 2.61% at December 31, 2012. Also, in Belgium we have revolving loans with 2 banks for a credit facility of $3.7 million with nothing borrowed at December 31, 2012.
Factoring agreements
We have entered into factoring agreements with various domestic and European financial institutions to sell our accounts receivable under nonrecourse agreements. These transactions are accounted for as a reduction in accounts receivable because the agreements transfer effective control over and risk related to the receivables to the buyers. We do not service any factored accounts after the factoring has occurred. We utilize factoring arrangements as an integral part of our financing. The aggregate gross amount factored under these facilities was $183.5 million as of December 31, 2012 and $204.5 million as of December 31, 2011. The cost of factoring such accounts receivable for the years ended December 31, 2012, 2011 and 2010 was $5.5 million, $6.5 million and $6.8 million respectively.
Capital stock transactions
In January 2011, we completed a common stock rights offering in which eligible stockholders exercised rights to purchase 19,723,786 shares of common stock at a price of $11.00 per share. The total proceeds to us were $217.0 million, consisting of $123.4 million in cash proceeds and the delivery to us of 48,004 shares of our Series A and Series B preferred stock, having a total liquidation preference and accrued dividends of $93.5 million, which shares were exchanged for common stock in lieu of cash payment. The cash proceeds from the rights offering were used to pay the accrued dividends on the preferred stock that remained outstanding after the offering and to redeem the remaining preferred shares, with the remainder used to repay borrowings under our new revolving credit agreement and for general corporate purposes.
Contractual obligations
Our long-term contractual obligations as of December 31, 2012 are shown in the following table:
|
| | | | | | | | | | | | | | | |
| | Payments due by period | |
Contractual obligations(1) | Total | Less than 1 year | 1 - 3 years | 4 - 5 years | More than 5 years |
| | (in thousands) | |
Long-term debt(2) | $ | 286,978 |
| $ | 3,000 |
| $ | 6,000 |
| $ | 277,978 |
| $ | — |
|
| Capital lease obligations | 3,053 |
| 470 |
| 991 |
| 939 |
| 653 |
|
Customer obligations(3) | 13,626 |
| 9,291 |
| 4,335 |
| — |
| — |
|
| Operating leases | 16,915 |
| 5,320 |
| 6,386 |
| 4,172 |
| 1,037 |
|
Pension and other post retirement benefits funding(4) | 31,018 |
| 3,399 |
| 6,116 |
| 5,775 |
| 15,728 |
|
| Other | 1,929 |
| 970 |
| 959 |
| — |
| — |
|
| Total contractual cash obligations | $ | 353,519 |
| $ | 22,450 |
| $ | 24,787 |
| $ | 288,864 |
| $ | 17,418 |
|
| |
| (1) | Possible payments of $10.4 million related to uncertain tax positions are not included in the table because management cannot make reasonable reliable estimates of when cash settlement will occur, if ever. These uncertain tax positions are discussed in Note 16 to our consolidated financial statements. |
| |
| (2) | Excludes original issue discount/premium. |
| |
| (3) | Customer obligations relate to liabilities when we enter into new or amend existing customer contracts. These contracts designate us to be the exclusive supplier to the respective customer, product line or distribution center and require us to compensate these customers over several years for store support. We have also entered into arrangements with certain customers under which we purchased the cores held in their inventory. Credits to be issued to these customers for these arrangements are recorded at net present value and are reflected as customer obligations. |
| |
| (4) | We sponsor defined benefit pension plans that cover a significant portion of our U.S. employees and certain U.K. employees. These plans for U.S. employees were frozen in 2006. Our funding policy is to contribute amounts to provide the plans with sufficient assets to meet future benefit payment requirements consistent with actuarial determinations of the funding requirements of federal laws. In 2013, we expect to contribute approximately $1.7 million to our U.S. pension plans and nothing to the U.K. pension plan. Estimated pension and other benefit payments are based on the current composition of pension plans and current actuarial assumptions. Pension funding will continue beyond year five. However, estimated pension funding is excluded from the table after year five. See Note 17 to our consolidated financial statements for the funding status of our pension plans and other postretirement benefit plans at December 31, 2012. |
Contingencies
For information concerning various claims, lawsuits and administrative proceedings to which we are subject, see “Business-Legal proceedings.”
We also have liabilities recorded for various environmental matters. As of December 31, 2012, we had reserves for environmental matters of $1.0 million. We expect to pay approximately $0.3 million in 2012 in relation to these matters. See “Business-Environmental regulation.”
Off-Balance sheet arrangements
We do not have any material off-balance sheet arrangements.
Accounting pronouncements
For a discussion of certain pending accounting pronouncements, see Note 2 to our consolidated financial statements included elsewhere in this Form 10-K.
Critical accounting policies and estimates
Our accounting policies, including those described below, require management to make significant estimates and assumptions using information available at the time the estimates are made. Actual amounts could differ significantly from these estimates. See Note 2 to our consolidated financial statements included elsewhere in this Form 10-K for a summary of the significant accounting policies and methods used in the preparation of our consolidated financial statements. We believe the following are the critical accounting policies that currently affect our consolidated financial position and results of operations.
Accounting for remanufacturing operations
Core Assets
Remanufacturing is the process where failed or used components, commonly known as cores, are disassembled into subcomponents, cleaned, inspected, combined with new subcomponents and reassembled into saleable, finished products which are tested to meet OEM requirements. We receive cores from our customers under two principal types of arrangements. First, with some of our aftermarket customers, when we sell a finished product to the customer, we receive a “core deposit” from the customer in cash in respect of the core contained in the finished product. The customer may then receive a refund of this core deposit if it returns a core to us, although it is not obligated to do so. Our customers receive cores from their own customers (for example, a consumer in a retail store, who can receive cash back if he returns the failed starter or alternator to the store). Most of the time in these arrangements, our customers return a core to us to receive a refund. In the second type of arrangement, we do not charge a core deposit. Instead, our agreement with the customer requires the customer to deliver us a used core for every finished product we sell them. If they do not return a core to us within a specified period, they must pay us in cash for the unreturned core.
When we receive a core from a customer in either type of arrangement, or when we purchase cores from third party core vendors (as we sometimes do when, for example, we have a shortage of certain types of cores), we record the value of the core as an asset in our core inventory at the lower of cost or fair market value. The value of a core declines over its estimated useful life and is devalued accordingly.
We also recognize assets which we call “core rights of return” prior to the actual return of cores under the second type of arrangement described above, as well as under arrangements we have sometimes made with customers to purchase certain cores held in their inventory (again, prior to any delivery of the cores to us). We sometimes enter into these purchase arrangements when we acquire a new customer or expand our product offerings with a customer, to enable the customer to buy its way out of its existing core return obligations to the former vendor. The core return right assets are recorded based on known units that are the subject of the arrangements and are valued based on the underlying core inventory values.
Carrying values for core inventory and core rights of return are evaluated by comparing current core prices obtained from core brokers to the recorded values of our core assets. The devaluation of core carrying value is reflected as a charge to cost of goods sold. In determining the estimate of core devaluation, we make assumptions regarding future demand for remanufactured product in the aftermarket. If the core held in inventory or subject to the right of return is deemed to be obsolete or in excess of current and future projected demand, it is written down and charged to cost of goods sold. If actual market conditions are less favorable than those projected, reductions in the value of inventory and core return rights may be required. Core inventory and core return right assets were $31.2 million and $33.9 million, respectively, at December 31, 2012.
Core Liabilities
When we collect a deposit on the sale of a core as described above, our customers have the right to return a core to us for the return of their deposit. As a result, we also record a liability upon such sale based on core units expected to be returned to us. This liability is an amount equal to the deposit less the estimated value in our inventory of the core to be returned. We adjust this “core liability” based on customer return trends and consideration of current inventory values. Actual customer returns that exceed our estimates and reductions in core inventory values could each result in changes to our estimate of core liabilities. Core liabilities were $7.0 million at December 31, 2012. We generally limit the number of cores returned by customers to the number of similar remanufactured cores previously shipped to each customer.
Valuation of long-lived assets
When events or circumstances indicate a potential impairment to the carrying value, we evaluate the carrying value of long-lived assets, including certain intangible assets, for recoverability through an undiscounted cash flow analysis. When such events or circumstances arise which indicate the long-lived asset is not recoverable, fair market value is determined by asset, or the appropriate grouping of assets, and is compared to the asset's carrying value to determine if impairment exists. Asset impairments are recorded as a charge to operations, based on the amount by which the carrying value exceeds the fair market value.
Goodwill and intangible assets
Goodwill represents the excess of the reorganization value assigned by the Bankruptcy Court upon our emergence from bankruptcy on December 6, 2007, over the net assets' fair value as determined in accordance with FASB
Accounting Standards Codification, or ASC, ASC Topic 852, Reorganizations. The balance at December 31, 2012 was $271.4 million, or 24.6% of total consolidated assets. Indefinite-lived intangible assets, consisting of trade names, were stated at estimated fair value as a result of fresh-start reporting, and have a carrying value of $48.2 million as of December 31, 2012.
In accordance with ASC 350, Intangibles-Goodwill and Other, we perform impairment testing of goodwill and indefinite-lived intangible assets on at least an annual basis. To test goodwill for impairment, we estimate the fair value of each reporting unit and compare the fair value to the carrying value. If the carrying value exceeds the fair value, then a possible impairment of goodwill exists and requires further evaluation. Fair values are based on guideline company multiples and the cash flows projected in the reporting units' strategic plans and long-range planning forecasts, discounted at a risk-adjusted rate of return. The projected profit margin assumptions included in the plans are based on the current cost structure, anticipated price givebacks provided to our customers and cost reductions/increases. If different assumptions were used in these plans, the related cash flows used in measuring fair value could be different and impairment of goodwill might be required to be recorded.
Based on the results of the annual impairment review in the fourth quarter of 2012, we determined that the fair value of each of our reporting units with goodwill significantly exceeded the carrying value of the assets. A hypothetical 10% decrease to the fair value of each our reporting units with goodwill would not have triggered an impairment of goodwill. Impairment of goodwill may result from, among other things, deterioration in our performance, adverse market conditions, adverse changes in applicable laws or regulations, including changes that restrict the activities of or affect the products sold by our business, and a variety of other factors.
For our indefinite-lived intangible assets, our fair value analysis was based on a relief from royalty methodology utilizing the projected future revenues, and applying a royalty rate based on similar arm's length licensing transactions for the related margins. In 2009, we wrote down the value of a trade name by $4.0 million because of declines in expected future revenues to be generated under the name. As a result of a change in economic conditions, in 2010 we reassessed the useful life of this trade name which previously had an indefinite life. On December 31, 2010, we assigned a 10-year useful life to this trade name, which had a value at that date of $6.0 million. In the third quarter of 2011, we fully impaired our defined-life intangible trade name by $5.6 million. The impairment was the result of a change in revenue being generated by the products sold under our trade name to products sold under our customer's private label brand.
Definite-lived intangible assets have been stated at estimated fair value as a result of fresh-start reporting. The values of other intangible assets with determinable useful lives are amortized on a basis to reflect the pattern of economic benefit consumed. Certain amortization of intangibles associated with specific aftermarket customers is recorded as a reduction of sales.
See Note 7 to our consolidated financial statements included elsewhere in this Form 10-K for further information on goodwill and other intangible assets.
Warranty
We provide certain warranties relating to quality and performance of our products. An allowance for the estimated future cost of product warranties and other defective product returns is based on management's estimates of product failure rates, customer eligibility and the costs of repair or exchange. The specific terms and conditions of the warranties vary depending upon the customer and the product sold. The allowance is recorded when revenues are recognized upon sale of the product. If product failure rates, our customers' return policies regarding their customers' returns or the cost of repair or exchange of returned items differ adversely from those assumed in management's estimates, revisions to the estimated warranty liability may be required, which could have an adverse effect on our financial results and condition. We recorded a warranty provision of $36.3 million and $45.6 million in our results of operations for 2012 and 2011, respectively, and our balance in accrued warranty was $27.2 million and $30.3 million as of December 31, 2012 and 2011, respectively.
Valuation allowances on deferred income tax assets
We review the likelihood that we will realize the benefit of our deferred tax assets and therefore the need for valuation allowances on a quarterly basis, or more frequently if events indicate that a review is required. In determining the requirement for a valuation allowance, the historical and projected financial results of the legal entity or consolidated group recording the net deferred tax asset is considered, along with all other available positive and negative evidence. The factors considered in our determination of the probability of the realization of the deferred tax assets include historical taxable income, projected future taxable income, the expected timing of
the reversals of existing temporary differences and tax planning strategies. If, based upon the weight of available evidence, it is more likely than not the deferred tax assets will not be realized, a valuation allowance is recorded.
There is no corresponding income tax benefit recognized with respect to losses incurred and no corresponding income tax expense recognized with respect to earnings generated in jurisdictions with a valuation allowance. This causes variability in our effective tax rate. We intend to maintain the valuation allowance until it is more likely than not that the net deferred tax asset will be realized. If operating results improve or deteriorate on a sustained basis, our conclusions regarding the need for a valuation allowance could change, resulting in either the reversal or initial recognition of a valuation allowance in the future, which could have a significant impact on income tax expense in the period recognized and subsequent periods.
Failure to achieve forecasted taxable income may affect the ultimate realization of certain deferred tax assets arising from post emergence operations and pre-emergence net operating losses. Factors that may affect our ability to achieve sufficient forecasted taxable income include, but are not limited to, general economic conditions, increased competition or other market conditions, costs incurred or delays in product availability.
As part of the review in determining the need for a valuation allowance, we assess the potential release of existing valuation allowances. Based upon this assessment, we have concluded that there is more than a remote possibility that the existing valuation allowance on our net deferred tax assets could be released. As of December 31, 2012 we have recorded a valuation allowance of $(16.0) million on deferred tax assets of $123.6 million. If such a release of the valuation allowance occurs, it will have a significant impact on net income in the quarter in which it is deemed appropriate to release the reserve.
Income taxes
We currently pay taxes in certain jurisdictions outside the United States. We do not currently pay taxes in certain jurisdictions, including the United States, either due to current operating losses or the use of tax loss carryforwards that are recorded in our consolidated financial statements as deferred income tax assets. As of December 31, 2012, we had U.S. tax loss carryforwards in the amount of $127.0 million, and foreign tax loss carryforwards in the amount of $54.6 million. Pursuant to Internal Revenue Code Section 382, we are limited to approximately $10.6 million use in any one year of the pre-bankruptcy net operating loss carryforward and credit equivalents in our federal income tax return.
Certain tax loss carryforwards are required to be utilized within a certain time period or the loss is forfeited. The tax loss carryforwards for the United States expire between 2023 and 2030, while the tax loss carryforwards for the foreign jurisdictions expire between 2013 and 2021. We have recorded a valuation allowance against the deferred tax assets related to certain of these loss carryforwards. The use of tax loss carryforwards reduces future taxable income and cash taxes.
As part of the review in determining the need for a valuation allowance, we assess the potential release of existing valuation allowances. Based upon this assessment, valuation allowances previously recorded against the net deferred tax assets in the United States have been reversed resulting in an income tax benefit of $(84.7) million during the third quarter of 2012. As of December 31, 2012, we have retained a valuation allowance of approximately $5.6 million on certain U.S. deferred tax assets. If a release of the remaining U.S. valuation allowance occurs, it will have a significant impact on net income in the period in which it occurs. This valuation allowance is recorded against a capital loss and certain tax credits where the ability to use or realize is less than likely.
During the fourth quarter of 2012, we concluded that certain foreign locations no longer needed a valuation allowance and have recorded a release of $(4.7) million of valuation allowance which was recognized as an income tax benefit.
Our effective tax rate for the years ended December 31, 2012 and 2011, was (101.5)% and 16.4%, respectively. These rates differ from the U.S. statutory rate mainly due to non-deductible expenses and changes in valuation allowances. We anticipate our effective tax rate for 2013 will be below the U.S. statutory rate. Our effective rate may vary due to income earned in various jurisdictions and changes in valuation allowances.
Arrangements with aftermarket customers
Consistent with common industry practice, a majority of our aftermarket customers, including both large retail customers and smaller warehouse distributors, require us to agree to terms that reduce the customer's investment in inventory held for sale. These measures principally include extended payment terms for purchased inventory and our supply of inventory without our receipt from the customer of a cash deposit in respect of the cores included in the finished goods. We also sometimes enter into arrangements with new customers in which we purchase the
customer's core inventory from the customer. (For a further discussion of cores and related cash flows and accounting, see “-Critical accounting policies and estimates-Accounting for remanufacturing operations”.) These arrangements increase our financing costs. We incur these costs under the factoring agreements discussed below and, to a lesser extent, under our revolving credit facility. In general, the factoring agreements in which we participate are part of arrangements that have been put in place by our aftermarket customers for their vendors. Our agreements with these customers grant them extended payment terms if they make factoring arrangements available to us. Under the factoring agreements, we sell our accounts receivable at a discount, which represents the cost of the arrangements, and the purchasers look only to the credit of our customers for collection. The majority of our factoring arrangements are with aftermarket customers. We include factoring cost in interest expense in our statements of operations.
Item 7A. Quantitative and Qualitative Disclosures about Market Risk
Our primary market risk arises from fluctuations in foreign currency exchange rates, interest rates and commodity prices. We manage foreign currency exchange rate risk, interest rate risk and commodity price risk by using various derivative instruments. We do not use these instruments for speculative or trading purposes. If we did not use derivative instruments, our exposure to these risks would be higher. We are exposed to credit loss in the event of nonperformance by the counterparties to these derivative financial instruments. We attempt to manage this exposure by entering into agreements directly with a number of major financial institutions that meet our credit standards and that we expect will fully satisfy their obligations under the contracts. However, given recent disruptions in the financial markets, including the bankruptcy, insolvency or restructuring of some financial institutions, the financial institutions with whom we contract may not be able to fully satisfy their contractual obligations.
Foreign currency exchange rate risk
We use derivative financial instruments to manage foreign currency exchange rate risks. We use forward contracts and, to a lesser extent, option collar transactions to protect our cash flow from adverse movements in exchange rates. We review foreign currency exposures monthly, and we consider any natural offsets before entering into a derivative financial instrument. See Note 4 to our consolidated financial statements for further information on outstanding foreign currency contracts as of December 31, 2012 and 2011.
Interest rate risk
We are subject to interest rate risk in connection with the issuance of variable-rate debt. To manage interest costs and as required by our loan covenants, we use interest rate swap agreements to exchange variable-rate interest payment obligations for fixed rates for a period of three years. Our exposure to interest rate risk arises primarily from changes in LIBOR. As of December 31, 2012, approximately 98.9% of our total debt was at variable interest rates (or 52.1%, when considering the effect of the interest rate swaps), as compared to 99.2% (or 51.9%, when considering the effect of the interest rate swaps) as of December 31, 2011.
Commodity price risk
Our production processes depend on the supply of certain components whose raw materials are exposed to price fluctuations on the open market. We enter into commodity price forward contracts primarily to manage the volatility associated with forecasted purchases. We monitor our commodity price risk exposures regularly in an effort to maximize the overall effectiveness of these forward contracts. The principal raw material whose price we hedge is copper. We use forward contracts to mitigate commodity price risk associated with raw materials, generally related to purchases we forecast for up to twelve months in the future. We also purchase certain commodities during the normal course of business.
Sensitivity analysis
We use a sensitivity analysis model to calculate the fair value, cash flows or statement of operations impact that a hypothetical 10% change in market rates would have on our debt and derivative instruments. For derivative instruments, we use applicable forward rates in effect as of December 31, 2012 to calculate the fair value or cash flow impact resulting from this hypothetical change in market rates. The analysis does not reflect any potential change in the level of variable rate borrowings or derivative instruments outstanding that could take place if these hypothetical conditions prevailed. The results of the sensitivity model calculations follow:
|
| | | | | | | |
| | Assuming a 10% increase in rates |
| Assuming a 10% decrease in rates |
| Change in |
| | (in thousands) |
| Market Risk | | | |
| Foreign Currency Rate Sensitivity: | | | |
| Forwards(1) | | | |
| Short US $ | $ | (6,835 | ) | $ | 6,835 |
| Fair Value |
| Long US $ | $ | 7,384 |
| $ | (7,384 | ) | Fair Value |
| Short EUR € | $ | (1,843 | ) | $ | 1,843 |
| Fair Value |
| Short GBP £ | $ | (221 | ) | $ | 221 |
| Fair Value |
| Debt(2) | |
| |
| |
| Foreign currency denominated | $ | 910 |
| $ | (910 | ) | Fair Value |
| Interest Rate Sensitivity: | |
| |
| |
| Debt | |
| |
| |
| Variable rate | $ | 318 |
| $ | (318 | ) | Fair Value |
| Swaps | |
| |
| |
| Pay fixed/receive variable | * |
| * |
| Earnings |
| Commodity Price Sensitivity: | |
| |
| |
| Forward contracts | $ | 5,211 |
| $ | (5,211 | ) | Fair Value |
| |
| (1) | Calculated using underlying positions assuming a 10% change in the value of the U.S. dollar vs. foreign currencies. For the Short EUR and Short GBP, we utilized a 10% change in the value of the Euro vs. foreign currencies. |
| |
| (2) | Calculated using a 10% change in the value of the foreign currency. |
| |
| * | A hypothetical change in interest rates of 10% from the current spot rate would have an immaterial impact as increases or decreases in the swap liability would be offset by a corresponding increase or decrease in the asset value of our interest rate floor of 1.75%. |
Item 8. Financial Statements and Supplementary Data
Report of Independent Registered Public Accounting Firm
The Board of Directors and Stockholders of
Remy International, Inc.
We have audited the accompanying consolidated balance sheets of Remy International, Inc. as of December 31, 2012 and 2011, and the related consolidated statements of operations, comprehensive income, changes in stockholders' equity, and cash flows for each of the three years in the period ended December 31, 2012. Our audits also included the financial statement schedule listed in the Index at Item 15, Schedule II, of Form 10-K. These financial statements and schedule are the responsibility of the Company's management. Our responsibility is to express an opinion on these financial statements and schedule based on our audits.
We conducted our audits in accordance with the standards of the Public Company Accounting Oversight Board (United States). Those standards require that we plan and perform the audit to obtain reasonable assurance about whether the financial statements are free of material misstatement. We were not engaged to perform an audit of the Company's internal control over financial reporting. Our audits included consideration of internal control over financial reporting as a basis for designing audit procedures that are appropriate in the circumstances, but not for the purpose of expressing an opinion on the effectiveness of the Company's internal control over financial reporting. Accordingly, we express no such opinion. An audit also includes examining, on a test basis, evidence supporting the amounts and disclosures in the financial statements, assessing the accounting principles used and significant estimates made by management, and evaluating the overall financial statement presentation. We believe that our audits provide a reasonable basis for our opinion.
In our opinion, the financial statements referred to above present fairly, in all material respects, the consolidated financial position of Remy International, Inc. at December 31, 2012 and 2011, and the consolidated results of its operations and its cash flows for each of the three years in the period ended December 31, 2012, in conformity with U.S. generally accepted accounting principles. Also, in our opinion, the related financial statement schedule, when considered in relation to the basic financial statements taken as a whole, presents fairly in all material respects the information set forth therein.
/s/ Ernst & Young LLP
Indianapolis, Indiana
February 26, 2013
Remy International, Inc.
Consolidated balance sheets |
| | | | | | |
| | As of December 31, | |
| (In thousands, except share information) | 2012 |
| 2011 |
|
| Assets: | |
| Current assets: | |
| |
|
| Cash and cash equivalents | $ | 111,733 |
| $ | 91,684 |
|
| Trade accounts receivable (less allowances of $1,931 and $1,612) | 170,637 |
| 190,943 |
|
| Other receivables | 17,203 |
| 15,815 |
|
| Inventories | 158,936 |
| 152,000 |
|
| Deferred income taxes | 36,315 |
| 6,188 |
|
| Prepaid expenses and other current assets | 15,431 |
| 10,046 |
|
| Total current assets | 510,255 |
| 466,676 |
|
| Property, plant and equipment | 227,955 |
| 211,722 |
|
| Less accumulated depreciation and amortization | (86,072 | ) | (72,551 | ) |
| Property, plant and equipment, net | 141,883 |
| 139,171 |
|
| Deferred financing costs, net of amortization | 4,867 |
| 6,179 |
|
| Goodwill | 271,418 |
| 271,418 |
|
| Intangibles, net | 99,329 |
| 111,580 |
|
| Other noncurrent assets | 73,463 |
| 34,495 |
|
| Total assets | $ | 1,101,215 |
| $ | 1,029,519 |
|
| Liabilities and Equity: | | |
| Current liabilities: | | |
| Short-term debt | $ | 9,098 |
| $ | 14,243 |
|
| Current maturities of long-term debt | 3,470 |
| 10,268 |
|
| Accounts payable | 155,407 |
| 155,474 |
|
| Accrued interest | 112 |
| 79 |
|
| Accrued restructuring | 3,679 |
| 2,925 |
|
| Other current liabilities and accrued expenses | 108,157 |
| 144,120 |
|
| Total current liabilities | 279,923 |
| 327,109 |
|
| Long-term debt, net of current maturities | 284,475 |
| 286,680 |
|
| Postretirement benefits other than pensions | 1,969 |
| 1,918 |
|
| Accrued pension benefits | 31,762 |
| 31,060 |
|
| Deferred income taxes | 2,390 |
| 27,734 |
|
| Other noncurrent liabilities | 29,188 |
| 37,674 |
|
| Equity: | |
| |
|
| Remy International, Inc. stockholders' equity: | |
| |
|
| Common stock, par value of $0.0001; 31,865,008 shares outstanding at December 31, 2012, and 31,351,310 shares outstanding at December 31, 2011 | 3 |
| 3 |
|
| Treasury stock, at cost; 133,467 treasury shares at December 31, 2012, and 116,057 treasury shares at December 31, 2011 | (229 | ) | — |
|
| Additional paid-in capital | 323,912 |
| 316,801 |
|
| Retained earnings | 186,483 |
| 57,433 |
|
| Accumulated other comprehensive loss | (50,307 | ) | (65,730 | ) |
| Total Remy International, Inc. stockholders' equity | 459,862 |
| 308,507 |
|
| Noncontrolling interest | 11,646 |
| 8,837 |
|
| Total equity | 471,508 |
| 317,344 |
|
| Total liabilities and equity | $ | 1,101,215 |
| $ | 1,029,519 |
|
See accompanying notes to consolidated financial statements.
Remy International, Inc.
Consolidated statements of operations
|
| | | | | | | | | |
| | Years ended December 31, | |
| (In thousands of dollars, except per share amounts) | 2012 |
| 2011 |
| 2010 |
|
| Net sales | $ | 1,133,547 |
| $ | 1,194,953 |
| $ | 1,103,799 |
|
| Cost of goods sold | 895,843 |
| 925,052 |
| 866,761 |
|
| Gross profit | 237,704 |
| 269,901 |
| 237,038 |
|
| Selling, general, and administrative expenses | 129,520 |
| 139,685 |
| 127,405 |
|
| Intangible asset impairment charges | — |
| 5,600 |
| — |
|
| Restructuring and other charges | 10,271 |
| 3,572 |
| 3,963 |
|
| Operating income | 97,913 |
| 121,044 |
| 105,670 |
|
| Interest expense | 27,757 |
| 30,900 |
| 46,739 |
|
| Loss on extinguishment of debt | — |
| — |
| 19,403 |
|
| Income before income taxes | 70,156 |
| 90,144 |
| 39,528 |
|
| Income tax (benefit) expense | (71,229 | ) | 14,813 |
| 18,337 |
|
| Net income | 141,385 |
| 75,331 |
| 21,191 |
|
| Less net income attributable to noncontrolling interest | 2,774 |
| 3,445 |
| 4,273 |
|
| Net income attributable to Remy International, Inc. | 138,611 |
| 71,886 |
| 16,918 |
|
| Preferred stock dividends | — |
| (2,114 | ) | (30,571 | ) |
| Loss on extinguishment of preferred stock | — |
| (7,572 | ) | — |
|
| Net income (loss) attributable to common stockholders | $ | 138,611 |
| $ | 62,200 |
| $ | (13,653 | ) |
| | |
|
| |
| Basic earnings (loss) per share: | |
| |
| |
|
| Earnings (loss) per share | $ | 4.53 |
| $ | 2.14 |
| $ | (1.33 | ) |
| Weighted average shares outstanding | 30,616 |
| 29,096 |
| 10,278 |
|
| Diluted earnings (loss) per share: | |
|
| |
| Earnings (loss) per share | $ | 4.47 |
| $ | 2.10 |
| $ | (1.33 | ) |
| Weighted average shares outstanding | 30,990 |
| 29,674 |
| 10,278 |
|
See accompanying notes to consolidated financial statements.
Remy International, Inc.
Consolidated statements of comprehensive income
|
| | | | | | | | | |
| | Years ended December 31, | |
| (In thousands): | 2012 |
| 2011 |
| 2010 |
|
| | |
| Net income | $ | 141,385 |
| $ | 75,331 |
| $ | 21,191 |
|
| Other comprehensive income (loss): | | | |
| Foreign currency translation adjustments | 2,799 |
| (4,309 | ) | 1,791 |
|
| Currency forward contracts, net of tax | 12,939 |
| (10,225 | ) | 374 |
|
| Commodity contracts, net of tax | 2,542 |
| (14,464 | ) | 5,513 |
|
| Interest rate swaps, net of tax | — |
| — |
| 2,452 |
|
| Employee benefit plans, net of tax | (2,822 | ) | (15,002 | ) | (4,041 | ) |
| Total other comprehensive income (loss), net of tax | 15,458 |
| (44,000 | ) | 6,089 |
|
| Comprehensive income attributable to Remy International, Inc. | 156,843 |
| 31,331 |
| 27,280 |
|
| Less: Comprehensive income attributable to noncontrolling interest | 2,774 |
| 3,445 |
| 4,273 |
|
| Less: Other Comprehensive income (loss) attributable to noncontrolling interest- Foreign currency translation | 35 |
| 373 |
| (22 | ) |
| Comprehensive income attributable to common stockholders | $ | 154,034 |
| $ | 27,513 |
| $ | 23,029 |
|
See accompanying notes to unaudited condensed consolidated financial statements.
Remy International, Inc.
Consolidated statements of changes in stockholders' equity
|
| | | | | | | | | | | | | | | | | | | | | |
| (In thousands of dollars) | Common stock |
| Treasury Stock |
| Additional paid-in capital |
| Retained earnings (accumulated deficit) |
| Accumulated other comprehensive income (loss) |
| Total Remy International, Inc. stockholders' equity |
| Non-controlling interest |
|
| Balances at December 31, 2009 | $ | 1 |
| $ | — |
| $ | 112,471 |
| $ | (10,535 | ) | $ | (27,468 | ) | $ | 74,469 |
| $ | 8,519 |
|
| Net income | |
| | |
| 21,191 |
| |
| 21,191 |
| 4,273 |
|
| Less net income attributable to noncontrolling interest | |
| | |
| (4,273 | ) | |
| (4,273 | ) | |
|
| Foreign currency translation | |
| | |
| |
| 1,813 |
| 1,813 |
| (22 | ) |
| Unrealized gains on derivative instruments and interest rate swaps, net of tax | |
| | |
| |
| 8,339 |
| 8,339 |
| |
|
| Defined benefit plans, net of tax | |
| | |
| |
| (4,041 | ) | (4,041 | ) | |
|
| Total comprehensive income | |
| | |
| |
| |
| 23,029 |
| 4,251 |
|
| Less distribution to noncontrolling interest | |
| | |
| |
| |
| |
| (3,420 | ) |
| Stock-based compensation | |
| | 1,196 |
| |
| |
| 1,196 |
| |
|
| Preferred stock dividends | |
| | (9,735 | ) | (20,836 | ) | |
| (30,571 | ) | |
|
| Balances at December 31, 2010 | 1 |
| — |
| 103,932 |
| (14,453 | ) | (21,357 | ) | 68,123 |
| 9,350 |
|
| Net income | |
| | |
| 75,331 |
| |
| 75,331 |
| 3,445 |
|
| Less net income attributable to noncontrolling interest | |
| | |
| (3,445 | ) | |
| (3,445 | ) | |
|
| Foreign currency translation | |
| | |
| |
| (4,682 | ) | (4,682 | ) | 373 |
|
| Unrealized gains on derivative instruments and interest rate swaps, net of tax | |
| | |
| |
| (24,689 | ) | (24,689 | ) | |
|
| Defined benefit plans, net of tax | |
| | |
| |
| (15,002 | ) | (15,002 | ) | |
|
| Total comprehensive income | |
| | |
| |
| |
| 27,513 |
| 3,818 |
|
| Issuance of common stock, net of proceeds | 2 |
| | 215,710 |
| | | 215,712 |
| |
| Reclassification of restricted stock award to liability award | | | (39 | ) | | | (39 | ) | |
| Less distribution to noncontrolling interest | | | | | | | (4,331 | ) |
| Stock-based compensation | |
| | 6,884 |
| | |
| 6,884 |
| |
|
| Preferred stock dividends | |
| | (2,114 | ) |
|
| |
| (2,114 | ) | |
|
| Loss on extinguishment of preferred stock | | | (7,572 | ) | | | (7,572 | ) | |
| Balances at December 31, 2011 | 3 |
| — |
| 316,801 |
| 57,433 |
| (65,730 | ) | 308,507 |
| 8,837 |
|
| Net income | |
| | |
| 141,385 |
| |
| 141,385 |
| 2,774 |
|
| Less net income attributable to noncontrolling interest | |
| | |
| (2,774 | ) | |
| (2,774 | ) | |
|
| Foreign currency translation | |
| | |
| | 2,764 |
| 2,764 |
| 35 |
|
| Unrealized losses on derivative instruments and interest rate swaps, net of tax | |
| | |
| | 15,481 |
| 15,481 |
| |
| Defined benefit plans, net of tax | |
| | |
| |
| (2,822 | ) | (2,822 | ) | |
| Total comprehensive income | |
| | |
| |
| | 154,034 |
| 2,809 |
|
| Acquisition of treasury shares | | (229 | ) | | | | (229 | ) | |
| Reclassification of restricted stock award to liability award | |
| | (150 | ) | | | (150 | ) | |
| Stock-based compensation | |
| | 7,261 |
| | |
| 7,261 |
| |
|
| Common stock dividends | | | | (9,561 | ) | | (9,561 | ) | |
| Balances at December 31, 2012 | $ | 3 |
| $ | (229 | ) | $ | 323,912 |
| $ | 186,483 |
| $ | (50,307 | ) | $ | 459,862 |
| $ | 11,646 |
|
Remy International, Inc.
Consolidated statements of cash flows
|
| | | | | | | | | | | |
| | | | Years ended December 31, | |
| (In thousands of dollars) | 2012 |
| 2011 |
| 2010 |
|
| Cash Flows from Operating Activities: | | | |
| Net income | $ | 141,385 |
| $ | 75,331 |
| $ | 21,191 |
|
| Adjustments to reconcile net income to cash provided by operating activities: | | | |
| | Depreciation and amortization | 38,060 |
| 35,252 |
| 29,269 |
|
| | Amortization of debt issuance costs | 1,773 |
| 1,800 |
| 1,868 |
|
| | Stock-based compensation | 7,261 |
| 6,884 |
| 1,196 |
|
| | Loss on extinguishment of debt | — |
| — |
| 19,403 |
|
| | Intangible asset impairment charges | — |
| 5,600 |
| — |
|
| | Interest paid on PIK note redemption | — |
| — |
| (33,040 | ) |
| | Deferred income taxes | (88,967 | ) | (2,845 | ) | 1,305 |
|
| | Accrued pension and postretirement benefits, net | (3,056 | ) | (4,311 | ) | (3,096 | ) |
| | Restructuring and other charges | 10,271 |
| 3,572 |
| 3,963 |
|
| | Cash payments for restructuring charges | (6,957 | ) | (1,237 | ) | (3,253 | ) |
| | Other | (2,747 | ) | (1,469 | ) | (5,250 | ) |
| | Changes in operating assets and liabilities, net of restructuring charges: | | | |
| | | Accounts receivable | 20,534 |
| 210 |
| (24,241 | ) |
| | | Inventories | (5,732 | ) | (10,708 | ) | (13,888 | ) |
| | | Accounts payable | (1,032 | ) | (4,705 | ) | 28,471 |
|
| | | Other current assets and liabilities, net | (21,437 | ) | (15,027 | ) | 20,768 |
|
| | | Other noncurrent assets, liabilities, and other | (23,581 | ) | (18,800 | ) | (3,808 | ) |
| Net cash provided by operating activities | 65,775 |
| 69,547 |
| 40,858 |
|
| Cash Flows from Investing Activities: | | | |
| Net proceeds on sale of assets | 268 |
| — |
| — |
|
| Purchases of property, plant and equipment | (24,467 | ) | (21,167 | ) | (19,086 | ) |
| Government grant proceeds related to capital expenditures | 1,485 |
| 2,186 |
| 4,073 |
|
| Net cash used in investing activities | (22,714 | ) | (18,981 | ) | (15,013 | ) |
| Cash Flows from Financing Activities: | | | |
| Change in short-term debt and revolver | (5,738 | ) | (25,233 | ) | 13,235 |
|
| Proceeds from issuance of long-term debt | — |
| — |
| 297,000 |
|
| Payments made on long-term debt, including capital leases | (10,403 | ) | (3,347 | ) | (305,297 | ) |
| Payments related to premium and other debt extinguishment costs | — |
| — |
| (13,022 | ) |
| Distributions to noncontrolling interest, net | — |
| (4,331 | ) | (3,420 | ) |
| Net proceeds from common stock rights offering | — |
| 122,177 |
| — |
|
| Dividend payments on preferred stock | — |
| (37,399 | ) | — |
|
| Cash payments on redemption of preferred stock | — |
| (44,869 | ) | — |
|
| Common stock repurchased | (229 | ) | — |
| — |
|
| Dividend payments on common stock | (9,226 | ) | — |
| — |
|
| Debt issuance costs | — |
| (141 | ) | (7,125 | ) |
| Other | 143 |
| — |
| — |
|
| Net cash (used in) provided by financing activities | (25,453 | ) | 6,857 |
| (18,629 | ) |
| Effect of exchange rate changes on cash and cash equivalents | 2,441 |
| (3,253 | ) | 127 |
|
| Net increase in cash and cash equivalents | 20,049 |
| 54,170 |
| 7,343 |
|
| Cash and cash equivalents at beginning of period | 91,684 |
| 37,514 |
| 30,171 |
|
| Cash and cash equivalents at end of period | $ | 111,733 |
| $ | 91,684 |
| $ | 37,514 |
|
| Supplemental information: | |
| |
| |
|
| Noncash investing and financing activities | |
| |
| |
|
| | Purchases of property, plant and equipment in accounts payable | $ | 2,338 |
| $ | 4,252 |
| $ | 1,315 |
|
| | Purchases of property, plant and equipment with capital lease | $ | 939 |
| $ | — |
| $ | — |
|
Remy International, Inc.
Notes to consolidated financial statements
1. Description of the business
Business
Remy International, Inc. (together with its subsidiaries, “we”, “our”, “us”, “Remy” or the “Company”) is a leading
global vehicular parts designer, manufacturer, remanufacturer, marketer and distributor of aftermarket and original
equipment electrical components for automobiles, light trucks, heavy-duty trucks and other vehicles. We sell our
products worldwide primarily under the “Delco Remy”, “Remy”, and “World Wide Automotive” brand names and our
customers' widely recognized private label brand names. Our products include light-duty and heavy-duty starters
and alternators for both the original equipment and the remanufactured markets, and hybrid power technology.
These products are principally sold or distributed to original equipment manufacturers (“OEMs”) for both original
equipment manufacture and aftermarket operations, as well as to warehouse distributors and retail automotive parts
chains. We sell our products principally in North America, Europe, Latin America and Asia-Pacific.
We are one of the largest producers in the world of remanufactured starters and alternators for the aftermarket. Our
remanufacturing operations obtain failed products, commonly known as cores, from our customers as returns.
These cores are an essential material needed for the remanufacturing operations. We have expanded our
operations to become a low cost, global manufacturer and remanufacturer with a more balanced business mix
between the aftermarket and the original equipment market, especially in the heavy duty OEM market, since we
separated from General Motors Corporation (“GM”) in 1994, when we were essentially an original equipment
supplier predominantly to GM.
In general, our business is influenced by the underlying trends in the automobile, light truck, and heavy-duty truck,
construction and industrial markets. We have been able to reduce the cyclical nature of some of our businesses
with the diversity of OEM markets between the automotive, heavy-duty truck and industrial markets by focusing on
our remanufacturing capabilities and our aftermarket business.
The automotive parts market is highly competitive. Competition is based primarily on quality of products, service,
delivery, technical support and price. Most OEMs and aftermarket distributors source parts from one or two
suppliers and we compete with a number of companies who supply automobile manufacturers throughout the world.
On August 14, 2012, Fidelity National Special Opportunities, Inc., a subsidiary of Fidelity National Financial, Inc. (NYSE:FNF), a leading provider of title insurance, mortgage services and restaurant and diversified services, purchased additional shares of Remy International, Inc. common stock, thereby increasing its ownership position above 50%. As a result, FNF began consolidating the financial results of Remy in the third quarter of 2012. As of December 31, 2012, FNF held a 51% ownership interest in Remy, comprised of 16,342,508 shares of our common stock. Additionally, FNF and related subsidiaries held $28,698,000 principal amount of our Term B Loan as of December 31, 2012.
As of December 31, 2011, FNF held a 47% ownership interest in Remy, comprised of 14,805,195 shares of our common stock. Additionally, FNF and related subsidiaries held $29,700,000 principal amount of our Term B Loan as of December 31, 2011.
During the year ended December 31, 2011, FNF acquired an additional 9,870,130 shares of our common stock in our rights offering. In connection with the rights offering, FNF exchanged 42,359 shares of our Series A and Series B preferred shares and board members exchanged 565 shares of our Series B preferred shares for common stock. The remaining preferred shares owned by the board members were redeemed on January 31, 2011.
As of December 31, 2010, FNF held a 46% ownership interest in Remy, comprised of 4,935,065 shares of our common stock and 42,359 shares of our Series A and Series B preferred stock. Additionally, board members held 1,000 shares of our Series B preferred as of December 31, 2010. On December 17, 2010, we extinguished our Third-Priority Floating Secured PIK Notes of which FNF held $50,306,000.
2. Summary of significant accounting policies
Basis of presentation and principles of consolidation
The consolidated financial statements include the accounts of Remy International, Inc., all wholly-owned subsidiaries, and any partially-owned subsidiary that we have the ability to control. Control generally equates to ownership percentage, whereby investments that are more than 50% owned are consolidated. Investments in companies in which we hold an ownership interest of 20% to 50% over which we exercise significant influence are accounted for by the equity method. Currently, we account for all 20% to 50% owned entities under the equity method. Investments in companies in which we hold an ownership interest of less than 20% are accounted for on the cost basis. Such investments were not material at December 31, 2012, and 2011. All significant intercompany accounts and transactions have been eliminated.
Use of estimates
The preparation of the consolidated financial statements in conformity with accounting principles generally accepted in the United States (U.S. GAAP) requires management to make certain estimates and assumptions that affect the reported amounts of assets and liabilities, the disclosure of contingent assets and liabilities at the date of the financial statements, and the reported amounts of revenue and expense during the year. Actual results could differ from these estimates.
Revenue recognition
Revenue is recognized when persuasive evidence of an arrangement exists, delivery has occurred or services have been rendered, ownership has transferred, the seller's price to the buyer is fixed and determinable, and collectability is reasonably assured. Sales are recorded upon shipment of product to customers and transfer of title and risk of loss under standard commercial terms (typically, F.O.B. shipping point). We recognize shipping and handling costs as costs of goods sold with the related amounts billed to customers as sales. Accruals for sales returns, price protection, and other allowances are provided at the time of shipment based upon past experience. Adjustments to such returns and allowances are made as new information becomes available. We accrue for rebates, price protection, and other customer sales allowances in accordance with specific customer arrangements. Such rebates are recorded as a reduction of sales.
Accounting for remanufacturing operations
Core deposits
Remanufacturing is the process where failed or used components, commonly known as cores, are disassembled into subcomponents, cleaned, inspected, tested, combined with new subcomponents and reassembled into saleable, finished products. With many customers, a deposit is charged for the core. Upon return of a core, we grant the customer a credit based on the core deposit value. Deposits charged by us totaled $87,866,000, $113,670,000, and $109,106,000 for the years ended December 31, 2012, 2011, and 2010, respectively. Core deposits are excluded from revenue. We generally limit core returns to the quantity of similar, remanufactured cores previously sold to the customer.
Core liability
We record a liability for core returns based on cores expected to be returned. This liability is recorded in “Other current liabilities and accrued expenses” in the accompanying consolidated balance sheets. The liability represents the difference between the core deposit value to be credited to the customer and the estimated core inventory value of the core to be returned. Revisions to these estimates are made periodically to consider current costs and customer return trends.
Core inventory
Upon receipt of a core, we record inventory at lower of cost or fair market value. The value of a core declines over its estimated useful life (ranging from 4 to 30 years) and is devalued accordingly. Carrying value of the core inventory is evaluated by comparing current prices obtained from core brokers to carrying cost. The devaluation of core carrying value is reflected as a charge to cost of goods sold. Core inventory that is deemed to be obsolete or in excess of current and future projected demand is written down to the lower of cost or market and charged to cost of goods sold. Core inventories are classified as “Inventories” in the accompanying consolidated balance sheets.
Customer contract intangibles
Upon entering into new or extending existing contracts, we may be required to purchase certain cores and inventory from our customers at retail prices, or be obligated to provide certain agreed support. The excess of the prices paid for the cores and inventory over fair value, and the value of any agreed support, are recorded as contract intangibles and amortized as a reduction to revenue on a method to reflect the pattern of economic benefit consumed. Customer contract intangibles that are determined in accordance with the provisions of Financial Accounting Standards Board (FASB) Accounting Standards Codification (ASC) Topic 805, Business Combinations, and which are not paid to the customers, are amortized and recorded in cost of goods sold. Contract intangibles are included in “Intangibles, net” in the noncurrent asset section of the accompanying consolidated balance sheets.
Customer obligations
Customer obligations relate to liabilities when we enter into new or amend existing customer contracts. These contracts designate us to be the exclusive supplier to the respective customer, product line or distribution center and require us to compensate these customers over several years.
In addition, we have entered into arrangements with certain customers where we purchased the cores held in their inventory. Credits to be issued to these customers for these arrangements are recorded at net present value and are reflected as “Customer obligations.” These obligations are included in “Other current liabilities and accrued expenses” and “Other noncurrent liabilities” in the accompanying consolidated balance sheets. Subsequent to the arrangements, the inventory owned by these customers only represents the exchange value of the remanufactured product.
Right of core return
When we enter into arrangements to purchase certain cores held in a customer's inventory or when the customer is not charged a deposit for the core, we have the right to receive a core from the customer in return for every exchange unit supplied to them. We classify such rights as “Core return rights” in “Other noncurrent assets” in the accompanying consolidated balance sheets. The core return rights are valued based on the underlying core inventory values. Devaluation of these rights is charged to cost of goods sold. On a periodic basis, we settle with a customer for cores that have not been returned.
Research and development
We conduct research and development programs that are expected to contribute to future earnings. Such costs are included in selling, general and administrative expenses in the consolidated statements of operations. Company-funded research and development expenses were approximately $26,004,000, $26,548,000, and $17,522,000, for the years ended December 31, 2012, 2011, and 2010, respectively.
Customer-funded research and development expenses, recorded as an offset to research and development expense in selling, general and administrative expenses, were approximately $967,000, $405,000, and $232,000, for the years ended December 31, 2012, 2011, and 2010, respectively.
Government grants
We record government grants when there is reasonable assurance that the grant will be received and we will comply with the conditions attached to the grants received. Grants related to income are recorded as an offset to the related expense in the accompanying statements of operations. Grants related to assets are recorded as deferred revenue and recognized on a straight-line basis over the useful life of the related asset. We continue to evaluate our compliance with the conditions attached to the related grants.
The U.S. Department of Energy, or the DOE, awarded us a grant in 2009, pursuant to which it agreed to match up to $60,200,000 of eligible expenditures we make through 2012 for the commercialization of hybrid electric motor technology. We obtained agreements from the DOE to extend the period of eligibility for the grant through 2013. As of December 31, 2012, we have completed the first phase of the grant award and have received $36,000,000 of the total grant. During 2012, a number of our hybrid customers have delayed their programs. We are now moderating our investments until the market develops, and we have elected not to initiate the next phase of the capacity requirements for the grant funding at this time.
In addition, we received various grants and subsidies from foreign jurisdictions during the three year period ended December 31, 2012.
The amounts recognized in the accompanying consolidated statements of operations as government grants were as follows (in thousands of dollars):
|
| | | | | | | | | |
| | 2012 |
| 2011 |
| 2010 |
|
| Reduction of cost of goods sold | $ | 4,820 |
| $ | 5,529 |
| $ | 5,326 |
|
| Reduction of selling, general, and administrative expenses | $ | 6,491 |
| $ | 7,691 |
| $ | 3,910 |
|
We had deferred revenue of $7,414,000 and $6,012,000 related to government grants as of December 31, 2012 and 2011, respectively.
Cash and cash equivalents
All cash balances and highly liquid investments with maturities of ninety days or less when acquired are considered cash and cash equivalents. The carrying amount of cash equivalents approximates fair value.
Trade accounts receivable and allowance for doubtful accounts
Trade accounts receivable is stated at net realizable value, which approximates fair value. Substantially all of our trade accounts receivable are due from customers in the original equipment and aftermarket automotive industries, both domestically and internationally. Trade accounts receivable include notes receivables of $29,091,000 and $25,367,000 as of December 31, 2012 and 2011, respectively, which are primarily due within the next six months. Trade accounts receivable is reduced by an allowance for amounts that are expected to become uncollectible in the future and for disputed items. We perform periodic credit evaluations of our customers' financial condition and generally do not require collateral. We maintain allowances for doubtful customer accounts for estimated losses resulting from the inability of our customers to make required payments. The allowance for doubtful accounts is developed based on several factors including customers' credit quality, historical write-off experience and any known specific issues or disputes which exist as of the balance sheet date. If the financial condition of our customers were to deteriorate, resulting in an impairment of their ability to make payments, additional allowances may be required.
Inventories other than core inventory
Inventories other than core inventory are carried at the lower of cost or market determined on the first-in, first-out (FIFO) method. We evaluate inventories on a regular basis to identify inventory on hand that may be obsolete or in excess of current and future projected market demand. For inventory deemed to be obsolete or in excess of current and future projected market demand, we record an inventory reserve and a charge to cost of goods sold to reduce carrying cost to lower of cost or market.
Property, plant and equipment
Property, plant and equipment are recorded at cost. Major expenditures that significantly extend the useful life or enhance the usability of the property, plant or equipment are capitalized. Depreciation is calculated primarily using the straight-line method over the estimated useful lives of the related assets (15 to 40 years for buildings, and 3 to 15 years for tooling, machinery and equipment). Capital leases and leasehold improvements are amortized over the shorter of the lease term or their estimated useful life.
Valuation of long-lived assets
When events or circumstances indicate a potential impairment to the carrying value, we evaluate the carrying value of long-lived assets, including certain intangible assets, for recoverability through an undiscounted cash flow analysis. When such events or circumstances arise which indicate the long-lived asset is not recoverable, fair market value is determined by asset, or the appropriate grouping of assets, and is compared to the asset's carrying value to determine if impairment exists. Asset impairments are recorded as a charge to operations, based on the amount by which the carrying value exceeds the fair market value. Long-lived assets to be disposed of other than by sale are considered held and used until such time the asset is disposed.
Tooling
Tooling, which is included in machinery and equipment in the accompanying consolidated balance sheets, includes the costs to design and develop tools, dies, jigs and other items owned by us and used in the manufacture of products sold under long-term supply agreements. Tooling is amortized over the tool's expected life. Tooling that involves new technology not covered by a customer supply agreement is expensed as incurred. Engineering, testing and other costs incurred in the design and development of products and product components are expensed as incurred.
Goodwill and other intangible assets
Goodwill and indefinite-lived intangible assets are not amortized, but are tested for impairment at least annually. We perform our annual impairment test in the fourth quarter of each fiscal year, or more frequently if impairment indicators arise. We determine goodwill impairment charges by comparing the carrying value of each reporting unit to the fair value of the reporting unit. In determining fair value of reporting units, we utilize discounted cash flow analyses and guideline company market multiples. Where the carrying value exceeds the fair value for a particular reporting unit, goodwill impairment charges may be recognized.
Definite-lived intangible assets have been stated at estimated fair value as a result of fresh-start reporting. The values of other intangible assets with determinable useful lives are amortized on a basis to reflect the pattern of economic benefit consumed. Prior to the application of fresh-start, intangible assets were stated at cost. Certain amortization of intangibles associated with specific customers in the aftermarket business is recorded as a reduction of sales.
Foreign currency translation
Each of our foreign subsidiaries' functional currency as of December 31, 2012, is its local currency, with the exception of our subsidiaries in Mexico, for which the U.S. dollar is the functional currency since substantially all of the purchases and sales are denominated in U.S. dollars, and in Hungary, for which the Euro is the functional currency as substantially all of the purchases and sales are denominated in Euro. Financial statements of foreign subsidiaries for which the functional currency is their local currency are translated into U.S. dollars using the exchange rate at each balance sheet date for assets and liabilities and at the average exchange rate for each year for revenue and expenses. Translation adjustments are recorded as a separate component of stockholders' equity and reflected in other comprehensive income (loss) (“OCI”). For each of our foreign subsidiaries, gains and losses arising from transactions denominated in a currency other than the functional currency are included in the accompanying consolidated statements of operations. We evaluate our foreign subsidiaries' functional currency on an ongoing basis.
Derivative financial instruments
In the normal course of business, our operations are exposed to continuing fluctuations in foreign currency values, interest rates and commodity prices that can affect the cost of operating, investing and financing. Accordingly, we address a portion of these risks through a controlled program of risk management that includes the use of derivative financial instruments. We have historically used derivative financial instruments for the purpose of hedging currency, interest rate, and commodity exposures, which exist as a part of ongoing business operations.
As a policy, we do not engage in speculative or leveraged transactions, nor do we hold or issue derivative financial instruments for trading purposes. Our objectives for holding derivatives are to minimize risks using the most effective and cost-efficient methods available. Management routinely reviews the effectiveness of the use of derivative financial instruments.
We recognize all of our derivative instruments as either assets or liabilities at fair value. The accounting for changes in the fair value (i.e., gains or losses) of a derivative instrument depends on whether it has been designated, and is effective, as a hedge and further, on the type of hedging relationship. For those derivative instruments that are designated and qualify as hedging instruments, a company must designate the hedging instrument, based upon the exposure being hedged, as a fair value hedge, cash flow hedge or a hedge of a net investment in a foreign operation. Gains and losses related to a hedge are either recognized in income immediately to offset the gain or loss on the hedged item or are deferred and reported as a component of “Accumulated other comprehensive income (loss)” (“AOCI”) and subsequently recognized in earnings when the hedged item affects earnings. The change in fair value of the ineffective portion of a financial instrument, determined using the change in fair value method, is recognized in earnings immediately. The gain or loss related to financial instruments that are not designated as hedges is recognized immediately in earnings.
Warranty
We provide certain warranties relating to quality and performance of our products. An allowance for the estimated future cost of product warranties and other defective product returns is based on management's estimate of product failure rates and customer eligibility. If these factors differ from management's estimates, revisions to the estimated warranty liability may be required. The specific terms and conditions of the warranties vary depending upon the customer and the product sold.
Income taxes
We account for income taxes in accordance with FASB ASC Topic 740, Income Taxes, which requires deferred tax assets and liabilities to be recognized using enacted tax rates for the effect of temporary differences between the book and tax bases of recorded assets and liabilities. FASB ASC Topic 740 also requires deferred tax assets be reduced by a valuation allowance if it is more likely than not that some portion or all of the deferred tax asset will not be realized.
We assess the need to maintain a valuation allowance for deferred tax assets based on an assessment of whether it is more likely than not that deferred tax benefits will be realized through the generation of future taxable income. Appropriate consideration is given to all available evidence, both positive and negative, in assessing the need for a valuation allowance.
Failure to achieve forecasted taxable income may affect the ultimate realization of certain deferred tax assets arising from net operating losses. Factors that may affect our ability to achieve sufficient forecasted taxable income include, but are not limited to, general economic conditions, increased competition or other market conditions, costs incurred or delays in product availability.
Pension and postretirement plans
We maintain limited defined benefit pension plans and other postretirement benefit plans, as well as a supplemental employee retirement plan covering certain executives. Costs associated with these plans are based on actuarial computations. Inherent in these valuations are key assumptions regarding discount rates, expected return on plan assets, rates of compensation increases, and the rates of health care benefit increases. If future trends in these assumptions prove to differ from management's assumptions, revisions to the plan assets and benefit obligations may be required.
Earnings per share
Basic earnings (loss) per share are calculated by dividing net earnings (loss) by the weighted average shares outstanding during the period. Diluted earnings per share are based on the weighted average number of shares outstanding plus the assumed issuance of common shares and related adjustment to net income (loss) attributable to common stockholders related to all potentially dilutive securities. For the years ended December 31, 2012 and 2011, in applying the treasury stock method, equivalent shares of unvested restricted stock and restricted stock units of 374,288 and 578,288 shares, respectively, were included in the weighted average shares outstanding in the diluted calculation. For the year ended December 31, 2010, in applying the treasury stock method, equivalent shares of unvested restricted stock and restricted stock units of 72,245 were antidilutive and excluded from the basic and dilutive calculation.
Recent accounting adoptions
In June 2011, the FASB issued ASU No. 2011-05, Comprehensive Income (Topic 220), Presentation of Comprehensive Income, to improve the comparability, consistency and transparency of financial reporting and to increase the prominence of items reported in other comprehensive income. In December 2011, the FASB issued ASU No. 2011-12, Comprehensive Income (Topic 220), Deferral of the Effective Date for Amendments to the Presentation of Reclassifications of Items Out of Accumulated Other Comprehensive Income in Accounting Standards Update No. 2011-05, which supersedes changes to those paragraphs in Update 2011-05 that pertain to how, when and where reclassification adjustments are presented. ASU No. 2011-12 is effective for fiscal years, and interim periods within those years, beginning after December 15, 2011 and should be applied retroactively. We adopted this guidance on January 1, 2012. The adoption of this guidance did not have a material impact on our consolidated financial position, results of operations or cash flows.
New accounting pronouncements
In December 2011, the FASB issued ASU No. 2011-11, Balance Sheet (Topic 210), Disclosures about Offsetting Assets and Liabilities, which requires an entity to disclose information about offsetting and related arrangements to enable users of its financial statements to understand the effect of those arrangements on its financial position. ASU No. 2011-11 is effective for annual reporting periods beginning on or after January 1, 2013 and interim periods within those annual periods. The adoption of ASU No. 2011-11 is expected to increase our disclosures, but is not expected to have an impact on our consolidated financial position, results of operations or cash flows.
In July 2012, the FASB issued ASU No. 2012-02, Intangibles-Goodwill and Other (Topic 350), Testing Indefinite-Lived Intangible Assets for Impairment, which permits an entity to first assess qualitative factors to determine whether it is more likely than not that an indefinite-lived intangible asset is impaired as a basis for determining whether it is necessary to perform the quantitative impairment test. ASU No. 2012-02 is effective for annual reporting periods beginning on or after September 15, 2012 and interim periods within those annual periods. The adoption of this guidance is not expected to have an impact on our consolidated financial position, results of operations or cash flows.
In February 2013, the FASB issued ASU No. 2013-02, Comprehensive Income (Topic 220), Reporting of Amounts Reclassified Out of Accumulated Other Comprehensive Income, which requires an entity to provide information about the amounts reclassified out of accumulated other comprehensive income by component. In addition, an entity is required to present, either on the face of the statement where net income is presented or in the notes, significant amounts reclassified out of accumulated other comprehensive income by the respective line items of net income but only if the amount reclassified is required under U.S. GAAP to be reclassified to net income in its entirety in the same reporting period. ASU No. 2013-02 is effective prospectively for reporting periods beginning after December 15, 2012. The adoption of ASU No. 2013-02 is expected to increase our disclosures, but is not expected to have an impact on our consolidated financial position, results of operations or cash flows.
3. Fair value measurements
FASB ASC Topic 820, Fair Value Measurements and Disclosures, clarifies that fair value is an exit price, representing the amount that would be received to sell an asset or paid to transfer a liability in an orderly transaction between market participants. As such, fair value is a market-based measurement that should be determined based upon assumptions that market participants would use in pricing an asset or liability. As a basis for considering such assumptions, FASB ASC Topic 820 establishes a three-tier fair value hierarchy, which prioritizes the inputs used in measuring fair value as follows:
|
| |
| Level 1: | Observable inputs such as quoted prices in active markets; |
| Level 2: | Inputs, other than quoted prices in active markets, that are observable either directly or indirectly; and |
| Level 3: | Unobservable inputs in which there is little or no market data, which require the reporting entity to develop its own assumptions. |
An asset's or liability's fair value measurement level within the fair value hierarchy is based on the lowest level of any input that is significant to the fair value measurement. Valuation techniques used need to maximize the use of observable inputs and minimize the use of unobservable inputs.
Assets and liabilities measured at fair value are based on one or more of the following three valuation techniques noted in FASB ASC Topic 820:
| |
| A. | Market approach: Prices and other relevant information generated by market transactions involving identical or comparable assets or liabilities. |
| |
| B. | Cost approach: Amount that would be required to replace the service capacity of an asset (replacement cost). |
| |
| C. | Income approach: Techniques to convert future amounts to a single present amount based upon market expectations (including present value techniques, option-pricing and excess earnings models). |
Assets and liabilities remeasured and disclosed at fair value on a recurring basis as of December 31, 2012 and 2011, are set forth in the table below:
|
| | | | | | | | | | | | | | |
| | As of December 31, 2012 | As of December 31, 2011 |
| (In thousands of dollars) | Asset/ (liability) |
| Level 2 |
| Valuation technique | Asset/ (liability) |
| Level 2 |
| Valuation technique |
| Interest rate swap contracts | $ | (2,218 | ) | $ | (2,218 | ) | C | $ | (4,157 | ) | $ | (4,157 | ) | C |
| Foreign exchange contracts | 5,328 |
| 5,328 |
| C | (11,732 | ) | (11,732 | ) | C |
| Commodity contracts | (1,315 | ) | (1,315 | ) | C | (5,404 | ) | (5,404 | ) | C |
We calculate the fair value of our interest rate swap contracts, commodity contracts and foreign currency contracts using quoted interest rate curves, quoted commodity forward rates and quoted currency forward rates. For contracts which, when aggregated by counterparty, are in a liability position, the discount rates are adjusted by the credit spread that market participants would apply if buying these contracts from our counterparties.
The following table presents our defined benefit plan assets measured at fair value on a recurring basis as of December 31, 2012:
|
| | | | | | | |
| (In thousands of dollars) | Total |
| Level 1 |
| Valuation technique |
| U.S. Plans: | | | |
| Interest-bearing cash and equivalents | $ | 2,329 |
| $ | 2,329 |
| A |
| Investments with Registered Investment Companies: | |
| |
| |
| Fixed income securities | 12,838 |
| 12,838 |
| A |
| Equity securities | 22,732 |
| 22,732 |
| A |
| | 37,899 |
| 37,899 |
| |
| U.K. Plans: | |
| |
| |
| Interest-bearing cash and equivalents | 89 |
| 89 |
| A |
| Investments with Registered Investment Companies: | |
| |
| |
| Fixed income securities | 3,792 |
| 3,792 |
| A |
| Equity securities | 5,569 |
| 5,569 |
| A |
| | 9,450 |
| 9,450 |
| |
| Total | $ | 47,349 |
| $ | 47,349 |
| |
The following table presents our defined benefit plan assets measured at fair value on a recurring basis as of December 31, 2011:
|
| | | | | | | |
| (In thousands of dollars) | Total |
| Level 1 |
| Valuation technique |
| U.S. Plans: | | | |
| Interest-bearing cash and equivalents | $ | 1,977 |
| $ | 1,977 |
| A |
| Investments with Registered Investment Companies: | |
| |
| |
| Fixed income securities | 11,241 |
| 11,241 |
| A |
| Equity securities | 20,087 |
| 20,087 |
| A |
| | 33,305 |
| 33,305 |
| |
| U.K. Plans: | |
| |
| |
| Interest-bearing cash and equivalents | 159 |
| 159 |
| A |
| Investments with Registered Investment Companies: | |
| |
| |
| Fixed income securities | 2,446 |
| 2,446 |
| A |
| Equity securities | 5,855 |
| 5,855 |
| A |
| | 8,460 |
| 8,460 |
| |
| Total | $ | 41,765 |
| $ | 41,765 |
| |
Investments with registered investment companies are valued at the closing price reported on the active market on which the funds are traded.
In addition to items that are measured at fair value on a recurring basis, we also have assets and liabilities that are measured at fair value on a nonrecurring basis. As these assets and liabilities are not measured at fair value on a recurring basis, they are not included in the tables above. Assets and liabilities that are measured at fair value on a nonrecurring basis include long-lived assets (see Notes 6, 7 and 15). We have determined that the fair value measurements included in each of these assets and liabilities rely primarily on our assumptions as observable inputs are not available. As such, we have determined that each of these fair value measurements reside within Level 3 of the fair value hierarchy.
4. Financial instruments
Foreign currency risk
We manufacture and sell our products primarily in North America, South America, Asia, Europe and Africa. As a result our financial results could be significantly affected by factors such as changes in foreign currency exchange rates or weak economic conditions in foreign markets in which we manufacture and sell our products. We generally try to use natural hedges within our foreign currency activities, including the matching of revenues and costs, to minimize foreign currency risk. Where natural hedges are not in place, we consider managing certain aspects of our foreign currency activities through the use of foreign exchange contracts. We primarily utilize forward exchange contracts with maturities generally within twenty-four months to hedge against currency rate fluctuations, some of which are designated as hedges.
As of December 31, 2012 and 2011, we had the following outstanding foreign currency contracts that were entered into to hedge forecasted purchases and revenues, respectively:
|
| | | | | | |
| (In thousands) | Currency denomination as of December 31, | |
| Foreign currency contract | 2012 |
| 2011 |
|
| South Korean Won Forward | $ | 55,546 |
| $ | 41,287 |
|
| Mexican Peso Forward | $ | 66,674 |
| $ | 58,892 |
|
| Brazilian Real Forward | $ | 18,055 |
| $ | 11,400 |
|
| Hungarian Forint Forward | € | 13,565 |
| € | 19,400 |
|
| British Pound Forward | £ | 1,370 |
| £ | 1,850 |
|
Accumulated unrealized net gains of $3,426,000 and net losses of $(9,513,000) were recorded in accumulated other comprehensive income (loss) (AOCI) as of December 31, 2012, and 2011, respectively. As of December 31, 2012, gains, net of tax, of $4,256,000 are expected to be reclassified to the consolidated statement of operations within the next twelve months. Any ineffectiveness during the years ended December 31, 2012, 2011, and 2010, respectively was immaterial. The Mexican Peso contracts with 2011 settlements were undesignated hedges and the changes in the fair value were recorded as cost of goods sold in the consolidated statement of operations.
Interest rate risk
During 2010, we entered into an interest rate swap agreement in respect of 50% of the outstanding principal balance of our Term B Loan under which we swap a variable LIBOR rate with a floor of 1.750% to a fixed rate of 3.345%. The Term B Loan $150,000,000 notional value interest rate swap expires December 31, 2013. Due to the significant value of the terminated swaps which were rolled into this swap, this interest rate swap is an undesignated hedge and changes in the fair value are recorded as interest expense in the accompanying consolidated statements of operations.
During 2009, we entered into two interest rate swap agreements that effectively converted $50,000,000 of our First Lien Term Loans from a variable interest rate to a fixed rate of 2.500%, and $50,000,000 of our Second Lien Term Loan from a variable interest rate to a fixed rate of 2.600%.
During 2008, we entered into two interest rate swap agreements that effectively converted $100,000,000 of our First and Second Lien Term Loans from a variable interest rate to a fixed rate of 3.585%, and $50,000,000 of our First Lien Term Loan from a variable interest rate to a fixed rate of 3.390%. The $100,000,000 notional value interest rate swap expired on December 13, 2010.
Since the First and Second Lien Term Loan interest rate swaps hedged the variability of interest payments on variable rate debt with the same terms, they qualified for cash flow hedge accounting treatment. As the interest related to the First and Second Lien Term Loans was no longer probable of occurring as a result of the debt refinancing in December 2010 (Note 11), we recognized the remaining amounts of the interest rate swaps in AOCI of $4,213,000 as interest expense in 2010.
During 2008, we terminated certain interest rate swap agreements resulting in a gain that is amortized as an offset to interest expense over the original term of the agreements. We recognized the remaining amounts of the gain in AOCI of $175,000 as a reduction of interest expense on December 17, 2010, in connection with the debt refinancing (see Note 11).
The interest rate swaps reduce our overall interest rate risk. However, due to the remaining outstanding borrowings on the Term B Loan and other borrowing facilities that continue to have variable interest rates, management believes that interest rate risk to us could be material if there are significant adverse changes in interest rates.
Commodity price risk
Our production processes are dependent upon the supply of certain components whose raw materials are exposed to price fluctuations on the open market. The primary purpose of our commodity price forward contract activity is to manage the volatility associated with forecasted purchases. We monitor our commodity price risk exposures regularly to maximize the overall effectiveness of our commodity forward contracts. The principal raw material hedged is copper. Forward contracts are used to mitigate commodity price risk associated with raw materials, generally related to purchases forecast for up to twenty-four months in the future. Additionally, we purchase certain commodities during the normal course of business which result in physical delivery and are excluded from hedge accounting.
We had thirty-six commodity price hedge contracts outstanding at December 31, 2012, and thirty-nine commodity price hedge contracts outstanding at December 31, 2011, with combined notional quantities of 6,566 and 4,882 metric tons of copper, respectively. These contracts mature within the next eighteen months. These contracts were designated as cash flow hedging instruments. Accumulated unrealized net losses of $(1,288,000) and $(5,326,000), excluding the tax effect, were recorded in AOCI as of December 31, 2012, and 2011, respectively. As of December 31, 2012, pre-tax losses of $(1,552,000) are expected to be reclassified to the accompanying consolidated statement of operations within the next 12 months. Hedge ineffectiveness during the years ended December 31, 2012, 2011, and 2010, was immaterial.
Other
We present our derivative positions and any related material collateral under master netting agreements on a net basis. We have entered into International Swaps and Derivatives Association agreements with each of its significant derivative counterparties. These agreements provide bilateral netting and offsetting of accounts that are in a liability position with those that are in an asset position. These agreements do not require us to maintain a minimum credit rating in order to be in compliance with the terms of the agreements and do not contain any margin call provisions or collateral requirements that could be triggered by derivative instruments in a net liability position. As of December 31, 2012, we have not posted any collateral to support its derivatives in a liability position.
For derivatives designated as cash flow hedges, changes in the time value are excluded from the assessment of hedge effectiveness. Unrealized gains and losses associated with ineffective hedges, determined using the change in fair value method, are recognized in the accompanying consolidated statements of operations. Derivative gains and losses included in AOCI for effective hedges are reclassified into the accompanying consolidated statements of operations upon recognition of the hedged transaction.
Any derivative instrument designated initially, but no longer effective as a hedge, or initially not effective as a hedge, is recorded at fair value and the related gains and losses are recognized in the accompanying consolidated statements of operations. Our undesignated hedges are primarily foreign currency hedges as the entity with the derivative transaction does not bear the foreign currency risk, and our interest rate swaps whose fair value at inception of the instrument due to the roll over of existing interest rate swaps resulted in ineffectiveness.
The following table discloses the fair values and balance sheet locations of our derivative instruments:
|
| | | | | | | | | | | | | | |
| | Asset derivatives | | Liability derivatives | |
| | Balance sheet location | As of December 31, | | Balance sheet location | As of December 31, | |
| (In thousands of dollars) | | 2012 |
| 2011 |
| | 2012 |
| 2011 |
|
| Derivatives designated as hedging instruments: | | |
| |
| | |
| |
|
| Commodity contracts | Prepaid expenses and other current assets | $ | 427 |
| $ | 80 |
| Other current liabilities and accrued expenses | $ | 2,009 |
| $ | 5,620 |
|
| Commodity contracts | Other noncurrent assets | 267 |
| 136 |
| Other noncurrent liabilities | — |
| — |
|
| Foreign currency contracts | Prepaid expenses and other current assets | 5,537 |
| 1,315 |
| Other current liabilities and accrued expenses | 26 |
| 12,947 |
|
| Foreign currency contracts | Other noncurrent assets | 127 |
| — |
| Other noncurrent liabilities | 310 |
| 100 |
|
| Total derivatives designated as hedging instruments | | $ | 6,358 |
| $ | 1,531 |
| | $ | 2,345 |
| $ | 18,667 |
|
| | | | | | | |
| Derivatives not designated as hedging instruments: | | |
| |
| | |
| |
|
| Interest rate swap contracts | Prepaid expenses and other current assets | $ | — |
| $ | — |
| Other current liabilities and accrued expenses | $ | 2,218 |
| $ | 2,209 |
|
| Interest rate swap contracts | Other noncurrent assets | — |
| — |
| Other noncurrent liabilities | — |
| 1,948 |
|
| Total derivatives not designated as hedging instruments | | $ | — |
| $ | — |
| | $ | 2,218 |
| $ | 4,157 |
|
The following tables disclose the effect of our derivative instruments on the accompanying consolidated statement of operations for the year ended December 31, 2012 (in thousands of dollars):
|
| | | | | | | | | | | |
Derivatives designated as cash flow hedging instruments | Amount of gain (loss) recognized in OCI on derivatives (effective portion) | Location of gain (loss) reclassified from AOCI into income (effective portion) | Amount of gain (loss) reclassified from AOCI into income (effective portion) | Location of gain (loss) recognized in income on derivatives (ineffective portion and amount excluded from effectiveness testing) | Amount of gain (loss) recognized in income on derivatives (ineffective portion and amount excluded from effectiveness testing) |
| Commodity contracts | $ | (5 | ) | Cost of goods sold | $ | (4,043 | ) | Cost of goods sold | $ | (7 | ) |
| Foreign currency contracts | 12,809 |
| Cost of goods sold | (2,965 | ) | Cost of goods sold | — |
|
| | $ | 12,804 |
| | $ | (7,008 | ) | | $ | (7 | ) |
|
| | | | |
| Derivatives not designated as hedging instruments | Location of gain (loss) recognized in income on derivatives | Amount of gain (loss) recognized in income on derivatives |
| Interest rate swap | Interest expense | $ | (466 | ) |
The following tables disclose the effect of our derivative instruments on the accompanying consolidated statement of operations for the year ended December 31, 2011 (in thousands of dollars):
|
| | | | | | | | | | | |
Derivatives designated as cash flow hedging instruments | Amount of gain (loss) recognized in OCI on derivatives (effective portion) | Location of gain (loss) reclassified from AOCI into income (effective portion) | Amount of gain (loss) reclassified from AOCI into income (effective portion) | Location of gain (loss) recognized in income on derivatives (ineffective portion and amount excluded from effectiveness testing) | Amount of gain (loss) recognized in income on derivatives (ineffective portion and amount excluded from effectiveness testing) |
| Commodity contracts | $ | (7,722 | ) | Cost of goods sold | $ | 6,742 |
| Cost of goods sold | $ | (91 | ) |
Foreign currency contracts | (7,567 | ) | Cost of goods sold | 2,658 |
| Cost of goods sold | — |
|
| | $ | (15,289 | ) | | $ | 9,400 |
| | $ | (91 | ) |
|
| | | | |
| Derivatives not designated as hedging instruments | Location of gain (loss) recognized in income on derivatives | Amount of gain (loss) recognized in income on derivatives |
| Foreign currency contracts | Cost of goods sold | $ | (2,213 | ) |
| Interest rate swap contracts | Interest expense | (1,659 | ) |
Concentrations of credit risk
Financial instruments, which potentially subject us to concentrations of credit risk, consist primarily of accounts receivable and cash investments. We require placement of cash in financial institutions evaluated as highly creditworthy. Our customer base includes global light and commercial vehicle manufacturers and a large number of retailers, distributors and installers of automotive aftermarket parts. Our credit evaluation process and the geographical dispersion of sales transactions help to mitigate credit risk concentration. We conduct a significant amount of business with GM, three large automotive parts retailers, and a large original equipment manufacturer. Net sales to these customers in the aggregate represented 50.1%, 49.1%, and 49.6% of consolidated net sales for the years ended December 31, 2012, 2011, and 2010, respectively.
GM represents our largest customer and accounted for approximately 20.7%, 20.7%, and 23.0% of the sales for the years ended December 31, 2012, 2011, and 2010, respectively.
Accounts receivable factoring arrangements
We have entered into factoring agreements with various domestic and European financial institutions to sell our accounts receivable under nonrecourse agreements. These are treated as a sale. The transactions are accounted for as a reduction in accounts receivable as the agreements transfer effective control over and risk related to the receivables to the buyers. We do not service any domestic accounts after the factoring has occurred. We do not have any servicing assets or liabilities. We utilize factoring arrangements as an integral part of financing for us. The cost of factoring such accounts receivable is reflected in the accompanying consolidated statements of operations as interest expense with other financing costs. The cost of factoring such accounts receivable for the years ended December 31, 2012, 2011, and 2010, was $5,472,000, $6,501,000 and $6,758,000, respectively. Gross amounts factored under these facilities as of December 31, 2012, and 2011, were $183,547,000 and $204,453,000, respectively. Any change in the availability of these factoring arrangements could have a material adverse effect on our financial condition.
5. Inventories
Net inventories consisted of the following:
|
| | | | | | |
| | As of December 31, | |
| (In thousands of dollars) | 2012 |
| 2011 |
|
| Raw materials | $ | 47,972 |
| $ | 51,974 |
|
| Core inventory | 31,191 |
| 26,715 |
|
| Work-in-process | 9,934 |
| 9,844 |
|
| Finished goods | 69,839 |
| 63,467 |
|
| | $ | 158,936 |
| $ | 152,000 |
|
Raw materials also include materials consumed in the manufacturing and remanufacturing process, but not directly incorporated into the finished products.
6. Property, plant and equipment
Property, plant and equipment consisted of the following:
|
| | | | | | |
| | As of December 31, | |
| (In thousands of dollars) | 2012 |
| 2011 |
|
| Land and buildings | $ | 43,272 |
| $ | 41,776 |
|
| Machinery and equipment | 184,683 |
| 169,946 |
|
| | $ | 227,955 |
| $ | 211,722 |
|
Depreciation and amortization expense of property, plant, and equipment for the years ended December 31, 2012, 2011, and 2010, was $19,161,000, $19,110,000, and $18,643,000, respectively.
7. Goodwill and other intangible assets
The following table represents the carrying value of other intangible assets:
|
| | | | | | | | | | | | | | | | | | |
| | As of December 31, 2012 | | As of December 31, 2011 | |
| (In thousands of dollars) | Carrying value |
| Accumulated amortization |
| Net |
| Carrying value |
| Accumulated amortization |
| Net |
|
| Definite-life intangibles: | | | | | | |
| Intellectual property | $ | 14,370 |
| $ | 4,082 |
| $ | 10,288 |
| $ | 12,705 |
| $ | 3,508 |
| $ | 9,197 |
|
| Customer relationships | 35,500 |
| 15,150 |
| 20,350 |
| 35,500 |
| 13,170 |
| 22,330 |
|
| Customer contract | 95,389 |
| 74,898 |
| 20,491 |
| 90,406 |
| 58,553 |
| 31,853 |
|
| Total | 145,259 |
| 94,130 |
| 51,129 |
| 138,611 |
| 75,231 |
| 63,380 |
|
| Indefinite-life intangibles: | | | | | | |
| Trade names | 48,200 |
| — |
| 48,200 |
| 48,200 |
| — |
| 48,200 |
|
| Intangible assets, net | $ | 193,459 |
| $ | 94,130 |
| $ | 99,329 |
| $ | 186,811 |
| $ | 75,231 |
| $ | 111,580 |
|
Intellectual property primarily consists of patent filing costs, purchases of intellectual property, and $9,000,000 assigned as a result of applying fresh-start accounting in 2007 for the value of trade secrets, patents, and regulatory approvals. The value assigned in fresh-start accounting is based on the relief from royalty method utilizing the forecasted revenue and applying a royalty rate based on similar arm's length licensing transactions. The weighted average useful life of intellectual property intangibles as of December 31, 2012 was 11.2 years. In 2012 and 2011, we added $1,665,000 and $1,475,000 of intellectual property, respectively, at cost with a weighted average life of approximately 15 years.
Customer relationships consist of $35,500,000 assigned during fresh-start in 2007 based on the value of our relationship with certain customers and the ability to generate future recurring income. The amortization period is 10 years based on an estimate of the remaining useful life.
Customer contract intangibles consist of the excess of the prices paid for the cores and inventory over fair value, and the value of any agreed support for new contracts with customers and $29,800,000 assigned as a result of applying fresh-start accounting in 2007 based on our contracts with certain customers and the associated revenue streams. The weighted average useful life of the customer contract intangibles is 4.0 years. During 2012, and 2011, we had additions of approximately $4,985,000 and $19,033,000, respectively, with a weighted average useful life of 4.0 years and 3.2 years, respectively, based on the estimated useful lives of the contracts. We do not typically assume a renewal or extension of the terms in determining the amortization period.
As a result of fresh-start accounting, we recorded $59,700,000 of trade names based on the earnings potential and relief of costs associated with licensing the trade names. Our trade names were assigned an indefinite life. As a result of the change in economic conditions in 2010, we reassessed the useful life of a certain indefinite life trade name. On December 31, 2010, we assigned a 10-year useful life to the trade name which had a value of $6,000,000.
In the third quarter of 2011, we fully impaired our defined-life intangible trade name by $5,600,000, and recorded
the loss in the consolidated statement of operations in intangible asset impairment charges. The impairment was
the result of a change in revenue being generated by the products sold under our trade name to products sold under our customer's private label brand. Our Level 3 estimated fair value analysis was based on a relief from royalty methodology utilizing the projected future revenues, and applying a royalty rate based on similar arm's length licensing transactions for the related margins. The intangible asset impairment was recorded in the accompanying consolidated statements of operations in “Intangible asset impairment charges.”
We have entered into several transactions and agreements with GM and certain of its subsidiaries related to their respective businesses. Pursuant to a Trademark License Agreement between us and GM, GM granted us an exclusive license to use the “Delco Remy” trademark on and in connection with automotive starters and heavy-duty starters and alternators initially until July 31, 2004, and extendable indefinitely upon payment of a fixed $100,000 annual licensing fee to GM. The “Delco Remy” and “Remy” trademarks are registered in the U.S., Canada and Mexico and in major markets worldwide. We own the “Remy” trademark. GM has agreed that upon our request, they will register the “Delco Remy” trademark in any jurisdiction where they are not currently registered.
A summary of goodwill is as follows:
|
| | | |
| (In thousands of dollars) | |
| Balance as of December 31, 2010 | $ | 270,314 |
|
| Adjustments | 1,104 |
|
| Balance as of December 31, 2011 | $ | 271,418 |
|
| Adjustments | — |
|
| Balance as of December 31, 2012 | $ | 271,418 |
|
In 2011, we recorded an immaterial correction of an error pursuant to FASB ASC Topic 250, Accounting Changes and Error Corrections. The errors related to unrecorded noncurrent taxes payable and unsupported noncurrent deferred tax liabilities which related to periods prior to November 30, 2007. As a result of application of the provisions of FASB ASC Topic 852, Reorganizations, in November 2007, the error should be reflected in our fresh-start adjustments. As of December 31, 2011, we have accordingly adjusted our goodwill to reflect the impact of the error. We have not restated the prior year balance sheet due to immateriality. In 2011, goodwill and other noncurrent liabilities were increased by $1,104,000.
Definite-lived intangible assets are being amortized to reflect the pattern of economic benefit consumed. We do not assume any residual value in our intangible assets. Amortization expense of definite-lived intangibles for the years ended December 31, 2012, 2011, and 2010 was $18,899,000, $22,448,000, and $20,892,000, respectively. Estimated future amortization, in thousands of dollars, for intangibles with definite lives at December 31, 2012, is:
|
| | | |
| 2013 | $ | 16,444 |
|
| 2014 | 11,037 |
|
| 2015 | 7,009 |
|
| 2016 | 7,149 |
|
| 2017 | 6,687 |
|
8. Other noncurrent assets
Other noncurrent assets primarily consisted of core return rights of $33,908,000 and noncurrent deferred tax assets of $32,907,000 as of December 31, 2012. Other noncurrent assets primarily consisted of core return rights of $28,941,000 and noncurrent deferred tax assets of $1,789,000 as of December 31, 2011.
9. Other current liabilities and accrued expenses
Other current liabilities and accrued expenses consist of the following:
|
| | | | | | |
| | As of December 31, | |
| (In thousands of dollars) | 2012 |
| 2011 |
|
| Accrued warranty | $ | 23,374 |
| $ | 25,609 |
|
| Accrued wages and benefits | 18,531 |
| 32,486 |
|
| Current portion of customer obligations | 9,326 |
| 8,388 |
|
| Rebates, stocklifts, discounts and returns | 15,865 |
| 16,645 |
|
| Current deferred revenue | 2,882 |
| 4,087 |
|
| Other | 38,179 |
| 56,905 |
|
| | $ | 108,157 |
| $ | 144,120 |
|
Changes to our current and noncurrent accrued warranty were as follows:
|
| | | | | | | | | |
| | Years ended December 31, | |
| (In thousands of dollars) | 2012 |
| 2011 |
| 2010 |
|
| Balance at beginning of period | $ | 30,278 |
| $ | 32,510 |
| $ | 23,179 |
|
| Provision for warranty | 36,281 |
| 45,597 |
| 58,205 |
|
| Payments and charges against the accrual | (39,365 | ) | (47,829 | ) | (48,874 | ) |
| Balance at end of period | $ | 27,194 |
| $ | 30,278 |
| $ | 32,510 |
|
10. Other noncurrent liabilities
Other noncurrent liabilities consist of the following:
|
| | | | | | |
| | As of December 31, | |
| (In thousands of dollars) | 2012 |
| 2011 |
|
| Customer obligations, net of current portion | $ | 3,689 |
| $ | 12,528 |
|
| Noncurrent deferred revenue | 5,755 |
| 6,393 |
|
| Other | 19,744 |
| 18,753 |
|
| | $ | 29,188 |
| $ | 37,674 |
|
We operate globally to take advantage of global economic conditions and related cost structures. We are subject to various duties and import/export taxes. We actively review our import/export processes in North and South America, Europe and Asia to verify the appropriate import duty classification, value and duty rate, including import value added tax. As part of this review process, we identified a potential exposure related to customs duties in the U.S. We notified and entered into negotiations with the U.S. Department of Commerce (DOC) on this matter and reached a settlement with them. The settlement, dated October 1, 2007, requires us to pay a total of $7,279,000 plus interest as follows: $500,000 after acceptance of the note by the DOC; $970,000 thereafter annually, commencing June 30, 2008, with a final annual payment of $959,000 due on June 30, 2014. Interest began to accrue upon our emergence from bankruptcy. Early payment is permitted without penalty. The noncurrent balance included in other in the other noncurrent liabilities table as of December 31, 2012 and 2011 was $959,000 and $1,929,000, respectively. The current balance included in other current liabilities and accrued expenses as of December 31, 2012 and 2011 was $970,000 for both periods.
11. Debt
Borrowings under long-term debt arrangements, net of discounts, consisted of the following:
|
| | | | | | |
| | As of December 31, | |
| (In thousands of dollars) | 2012 |
| 2011 |
|
Asset-Based Revolving Credit Facility-Maturity date of December 17, 2015 | $ | — |
| $ | — |
|
Term B Loan-Maturity date of December 17, 2016 | 284,892 |
| 294,452 |
|
| Total Senior Credit Facility and Notes | 284,892 |
| 294,452 |
|
| Capital leases | 3,053 |
| 2,496 |
|
| Less current maturities | (3,470 | ) | (10,268 | ) |
| Long-term debt less current maturities | $ | 284,475 |
| $ | 286,680 |
|
Future maturities of long-term debt outstanding at December 31, 2012, including capital lease obligations, and excluding original issue discount, in thousands of dollars, consist of the following:
|
| | | |
| 2013 | $ | 3,470 |
|
| 2014 | 3,484 |
|
| 2015 | 3,507 |
|
| 2016 | 278,505 |
|
| 2017 | 412 |
|
| Thereafter | 653 |
|
In December 2010, we entered into a $95,000,000, five year, Asset-Based Revolving Credit Facility (“ABL”), replacing our previous Senior Secured Revolving Credit Agreement. The ABL is secured by substantially all domestic accounts receivable and inventory. It bears interest, varying with the level of available borrowing, at a defined Base Rate plus 1.00%-1.50% per annum or, at our election, at an applicable LIBOR Rate plus 2.00%-2.50% per annum and is paid monthly. At December 31, 2012, the revolver balance was zero. Based upon the collateral supporting the ABL, the amount borrowed, and the outstanding letters of credit of $2,860,000, there was additional availability for borrowing of $68,996,000 on December 31, 2012. We will incur an unused commitment fee ranging from 0.375% to 0.50% on the unused amount of commitments under the ABL. The ABL agreement matures on December 17, 2015.
In December 2010, we entered into a $300,000,000 Term B Loan (“Term B”) facility with original issue discount of $3,000,000. The Term B is secured by a first priority lien on the stock of our subsidiaries and substantially all domestic assets other than accounts receivable and inventory pledged to the ABL. The Term B bears an interest rate consisting of LIBOR (subject to a floor of 1.75%) plus 4.5% per annum. The Term B matures on December 17, 2016. Principal payments in the amount of $750,000 are due at the end of each calendar quarter with termination and final payment no later than December 17, 2016. The Term B facility is subject to an excess cash calculation
which may require the payment of additional principal on an annual basis. As of December 31, 2012, the excess cash calculation was zero. During the year ended December 31, 2012, we made additional principal payments of $7,021,000 under the excess cash calculation provisions. At December 31, 2012, the average borrowing rate, including the impact of the interest rate swaps, was 7.07%. Proceeds from the Term B, ABL, and cash on hand were used to pay off our then-existing First and Second Lien Credit Facilities, Third-Priority Floating Rate Secured PIK Notes, and all associated fees and expenses.
We recorded a $(19,403,000) loss on early extinguishment of debt during the fourth quarter 2010, as a result of the repayment of $153,829,000 in aggregate principal amount of our outstanding First Lien Credit Facility, $50,000,000 outstanding principal of our Second Lien Credit Facility, and $133,040,000 (including previous interest of $33,040,000) in aggregate principal amount of our outstanding Third-Priority Floating Rate Secured PIK Notes. The loss includes the call premium on the Third-Priority Floating Rate Secured PIK Notes, the write-off of associated deferred financing fees, and the original issue discount on the First and Second Lien Credit Facilities. The loss on extinguishment is separately stated on our accompanying consolidated statements of operations.
As of December 31, 2012, the estimated fair value of our Term B Loan was $290,029,000. The estimated fair value was $5,137,000 more than the carrying value. As of December 31, 2011, the estimated fair values of our Term B Loan was $293,658,000. The estimated fair value was $794,000 less than the carrying value. The Level 2 fair market values are developed by the use of estimates obtained from brokers and other appropriate valuation
techniques based on information available as of December 31, 2012 and 2011. The fair value estimates do not necessarily reflect the values we could realize in the current markets. Because of their short-term nature or variable interest rate, we believe the carrying value for short-term debt and the revolving credit agreement closely approximates their fair value.
All credit agreements contain various covenants and representations that are customary for transactions of this nature. We are in compliance with all covenants as of December 31, 2012. Our debt covenants include certain earnings requirements, capital expenditure limits and liquidity ratios. Dividends and additional borrowings are limited under the covenants.
Short-term debt
We have revolving credit facilities with four Korean banks with a total facility amount of approximately $16,805,000 of which $6,069,000 is borrowed at average interest rates of 4.54% at December 31, 2012. In Hungary, there is a revolving credit facility and a note payable with two separate banks for a credit facility of $5,457,000 of which $3,029,000 is borrowed at average interest rates of 2.61% at December 31, 2012. Also, in Belgium we have revolving loans with two banks for a credit facility of $3,695,000 with nothing borrowed at December 31, 2012.
Capital leases
Capital leases have been capitalized using nominal interest rates ranging from 4.5% to 15.1% as determined by the dates we entered into the leases. We had assets under capital leases of approximately $3,883,000 at December 31, 2012 and approximately $3,345,000 at December 31, 2011, net of accumulated amortization.
12. Redeemable preferred stock
Series A Preferred Stock- As of December 31, 2010, 27,000 shares of Series A preferred stock, with a par value of $0.0001 per share, were issued and outstanding in the amount of $27,000,000, the liquidation preference amount. Preferred stockholders received a “Backstop Fee” of $500,000, which has been netted against the issuance proceeds. Series A preferred stockholders have no voting rights, except as defined in Exhibit A of the Amended and Restated Certificate of Incorporation as in effect on December 31, 2010. Dividends are cumulative whether or not declared by the board of directors and have been accrued in the amount of $739,000, and $9,488,000 for the years ended December 31, 2011, and 2010, respectively.
Series B Preferred Stock- As of December 31, 2010, 60,000 shares of Series B preferred stock, with par value of $0.0001 per share, were issued and outstanding in the amount of $60,000,000, the liquidation preference amount. Preferred stockholders received a “Backstop Fee” of $1,200,000, which has been netted against the issuance proceeds. Series B preferred stockholders have no voting rights, except as defined in Exhibit B of the Amended and Restated Certificate of Incorporation as in effect on December 31, 2010. Dividends are cumulative whether or not declared by the board of directors and have been accrued in the amount of $1,375,000, and $21,083,000 for the years ended December 31, 2011, and 2010, respectively.
The holders of the preferred stock were entitled to dividends which accrued on a daily basis at an annual rate of three month LIBOR plus 20% on the liquidation preference amount. If not declared and paid quarterly, such dividends were added to the liquidation preference and accrue and compound at such dividend rate (i.e. compounded quarterly with PIK). The dividends accrued and remained unpaid until conversion or liquidation, prior and in preference to any declaration or payment of any dividend on the common stock. Any partial payments, for dividends or in liquidation, were made pro rata among the holders of the preferred stock. No dividend or distribution to common stockholders could be made unless all prior dividends on the preferred stock, since the closing date, are paid or declared and sufficient funds for the payment have been set aside.
January 2011 Series A and Series B preferred stock redemption
On January 14, 2011, we received the requisite two-thirds common stockholder vote approving the amendment to our Amended and Restated Certificate of Incorporation as in effect on December 31, 2010 to allow us to redeem our Series A preferred stock and Series B preferred stock at our option. The amendment to the Amended and Restated Certificate of Incorporation allowed for us to redeem the Series A and Series B Preferred Stock at a redemption price equal to 115% of the liquidation preference plus accrued and unpaid dividends to the date of payment of the redemption proceeds.
On January 19, 2011, the board of directors declared a dividend of $37,246,000 on the shares of Series A and Series B preferred stock to stockholders of record on January 20, 2011, and issued a notice of redemption of the
remaining Series A and Series B preferred stock. On January 31, 2011, we redeemed our outstanding shares of Series A and Series B preferred stock for $45,022,000, which included $5,872,000 premium of liquidation preference at redemption and accrued dividends of $153,000. In January 2011, we recorded a loss on extinguishment of our preferred shares of $(7,572,000) related to the premium on liquidation preference at redemption and $1,700,000 related to the “Backstop Fees.”
13. Stockholders' equity
Common stock
On December 12, 2012, we amended our Amended and Restated Certificate of Incorporation. The amendment authorizes the Company to issue 280,000,000 shares, consisting of 240,000,000 shares of common stock, par value $0.0001 per share, and 40,000,000 shares of preferred stock, par value $0.0001 per share. As of December 31, 2012, there are 31,865,008 common stock shares outstanding and no preferred stock shares outstanding.
The holders of common stock are entitled to one vote on all matters properly submitted on which the common stockholders are entitled to vote.
December 2012 employee stock purchase plan
On December 21, 2012, we completed our Employee Stock Purchase plan which resulted in the issuance of 11,107 shares of common stock. The offering was for shares of common stock in a subscription offering to eligible employees of Remy and certain of their immediate family members. This is the initial public offering of the common stock of Remy. The initial public offering price was $17.00 per share.
Any person purchasing shares in this offering received extra shares for no additional consideration (“additional shares”) at a rate of 15 shares for every 100 shares purchased, with any fraction of an additional share rounded down.
The minimum number of shares that a person could have subscribed to purchase in this offering was 100 shares and the maximum (not including additional shares that would be issued) was 200 shares.
January 2011 common stock rights offering
On January 14, 2011, we received the requisite two-thirds common stockholder vote approving the rights offering with certain related parties and the proposed amendment to our certificate of incorporation which allowed us to redeem our Series A preferred stock and Series B preferred stock at our option.
Pursuant to the terms of the January 2011 rights offering, we offered shares of common stock at a price of $11.00 per share to existing holders of common stock as of November 12, 2010, who certified to the Company that they are accredited investors or institutional accredited investors.
Eligible stockholders exercised rights for 19,723,786 shares of common stock for $216,961,000, consisting of cash proceeds of approximately $123,426,000, and the cancellation of 48,004 shares of preferred stock having an aggregate liquidation preference and accrued dividends of approximately $93,535,000. Subsequent to the January 2011 rights offering, we had 31,467,367 shares of common stock issued. We utilized the proceeds from the January 2011 rights offering to redeem our remaining outstanding Series A and Series B preferred shares as discussed in Note 12.
Treasury Stock
In 2012, we withheld 15,276 shares at cost to satisfy tax obligations for our Employee Stock Purchase Plan and certain vesting of shares under the Company's stock-based compensation plan.
Dividend Payment
During 2012, we declared a quarterly cash dividends of ten cents ($0.10) per share, and paid amounts totaling $9,226,000. As of December 31, 2012, a dividend payable of $335,000 is recorded for unvested restricted shares and is payable upon vesting
On January 31, 2013, the Board declared a a quarterly cash dividend of ten cents, $0.10, per share. The dividend will be payable on February 28, 2013 to Shareholders of Record as of the close of business February 14, 2013.
14. Accumulated other comprehensive income (loss)
Our other comprehensive income (loss) consists of the following:
|
| | | | | | | | | | | | | | | | | | |
| (In thousands of dollars) | Foreign currency translation adjustment |
| Unrealized gains (losses) on currency hedges |
| Unrealized gains (losses) on commodity hedges |
| Interest rate swaps |
| Employee benefit plan adjustment |
| Accumulated other comprehensive income (loss) |
|
| Balances at January 1, 2010 | $ | (19,755 | ) | $ | 338 |
| $ | 93 |
| $ | (4,026 | ) | $ | (4,118 | ) | $ | (27,468 | ) |
| Current year amount | 1,813 |
| 544 |
| 9,045 |
| 4,026 |
| (6,037 | ) | 9,391 |
|
| Applicable income taxes | — |
| (170 | ) | (3,532 | ) | (1,574 | ) | 1,996 |
| (3,280 | ) |
| Other comprehensive income (loss) | 1,813 |
| 374 |
| 5,513 |
| 2,452 |
| (4,041 | ) | 6,111 |
|
| Balances at December 31, 2010 | (17,942 | ) | 712 |
| 5,606 |
| (1,574 | ) | (8,159 | ) | (21,357 | ) |
| Current year amount | (4,682 | ) | (12,269 | ) | (14,464 | ) | — |
| (15,002 | ) | (46,417 | ) |
| Applicable income taxes | — |
| 2,044 |
| — |
| — |
| — |
| 2,044 |
|
| Other comprehensive loss | (4,682 | ) | (10,225 | ) | (14,464 | ) | — |
| (15,002 | ) | (44,373 | ) |
| Balances at December 31, 2011 | (22,624 | ) | (9,513 | ) | (8,858 | ) | (1,574 | ) | (23,161 | ) | (65,730 | ) |
| Current year amount | 2,764 |
| 15,774 |
| 4,038 |
| — |
| (3,421 | ) | 19,155 |
|
| Applicable income taxes | — |
| (2,835 | ) | (1,496 | ) | — |
| 599 |
| (3,732 | ) |
| Other comprehensive income | 2,764 |
| 12,939 |
| 2,542 |
| — |
| (2,822 | ) | 15,423 |
|
| Balances at December 31, 2012 | $ | (19,860 | ) | $ | 3,426 |
| $ | (6,316 | ) | $ | (1,574 | ) | $ | (25,983 | ) | $ | (50,307 | ) |
15. Restructuring and other charges
We account for restructuring costs in accordance with FASB ASC Topic 420, Exit or Disposal Cost Obligations, and FASB ASC Topic 12, Compensation - Nonretirement Postemployment Benefits. Restructuring costs consist of costs associated with business realignment and streamlining activities and entail exit costs such as lease termination costs, certain operating costs relating to closed leased facilities, employee severance and related costs, and certain other related costs. Such costs are recorded when the liability is incurred in accordance with the prescribed accounting at the then estimated amounts. These estimates are subject to the inherent risk of uncertainty in the estimation process, especially as to the accrual of future net rental charges on exited facilities. Subsequent changes to such estimates are recorded as restructuring charges in the year the change in the estimate is made.
Most of our restructuring activities over the last three years relate to management's ongoing plan for capacity realignment and streamlining of operations to meet the demands of the various markets we serve and the current economic conditions, and to make us more cost competitive. The restructuring activities primarily relate to the following categories:
| |
| • | Capacity alignment and streamlining of both our facilities and our workforce to become more cost competitive through consolidation of excess capacity, movement of operations to lower cost facilities, and streamlining of our workforce; |
| |
| • | Streamlining of our workforce in facilities that were not consolidated to become more cost competitive; and |
| |
| • | Management realignment in efforts to simplify the structure. |
Significant components of restructuring expenses for the approved activities are:
|
| | | | | | | | | | | | | | | |
| | Expense incurred in | | |
| (In thousands of dollars) | Total expected costs |
| 2012 |
| 2011 |
| 2010 |
| Estimated future expense |
|
| 2012 Activities | |
| |
| |
| |
| |
|
| Severance | $ | 4,315 |
| $ | 3,738 |
| $ | — |
| $ | — |
| $ | 577 |
|
| Exit costs | 813 |
| 410 |
| — |
| — |
| 403 |
|
| Other charges | 1,687 |
| 1,687 |
| — |
| — |
| — |
|
| | $ | 6,815 |
| $ | 5,835 |
| $ | — |
| $ | — |
| $ | 980 |
|
| 2011 Activities | |
| |
| |
| |
| |
|
| Severance | $ | 4,518 |
| $ | 1,635 |
| $ | 2,883 |
| $ | — |
| $ | — |
|
| Exit costs | 801 |
| 241 |
| 560 |
| — |
| — |
|
| | $ | 5,319 |
| $ | 1,876 |
| $ | 3,443 |
| $ | — |
| $ | — |
|
| 2010 Activities | |
| |
| |
| |
| |
|
| Severance | $ | 1,779 |
| $ | — |
| $ | 112 |
| $ | 1,667 |
| $ | — |
|
| Exit costs | 227 |
| — |
| 17 |
| 210 |
| — |
|
| | $ | 2,006 |
| $ | — |
| $ | 129 |
| $ | 1,877 |
| $ | — |
|
We intend to fund the future restructuring expenses from our existing revolver facility and funds generated from operations.
Restructuring charges and asset impairments are as follows:
|
| | | | | | | | | |
| | Years ended December 31, | |
| (In thousands of dollars) | 2012 |
| 2011 |
| 2010 |
|
| Severance and termination benefits | $ | 5,373 |
| $ | 2,995 |
| $ | 1,660 |
|
| Exit costs | 651 |
| 577 |
| 15 |
|
| Other charges | 1,687 |
| — |
| — |
|
| Asset impairments | 2,560 |
| — |
| 2,288 |
|
| Total restructuring and other charges | $ | 10,271 |
| $ | 3,572 |
| $ | 3,963 |
|
During 2012, the restructuring charges related to reductions in force related to further management realignment, the closure of our Matehuala, Mexico facility and Europe operations, and exit costs related to our Mexico, Europe and Virginia facilities. During the second quarter of 2012, the company engaged a consulting firm to assist in the analysis of the North America operations. The other charges are related to these consulting fees and other related expenses. The fixed asset impairment charges primarily relate to the closure of our facilities in Matehuala, Mexico and Mezokovesd, Hungary. These impairment charges for our land and buildings for the anticipated closure of our Mezokovesd, Hungary facility are based on real estate appraisals based on Level 3 fair value. Machinery and equipment impairment is based on estimated salvage values for equipment based on Level 3 fair value approach.
During 2011, restructuring charges for severance costs relate to a management realignment, reductions in force in both Europe and the United States, and exit costs in Europe and continued consolidation of our North American facilities, including the closure of our operations in Virginia.
In 2010, severance costs were incurred primarily related to postemployment benefit expense in accordance with ASC Topic 712, Compensation, at one of our European facilities and severance and other fees associated with the closure of our Virginia manufacturing operations and further consolidation of our North American facilities. During 2010, we settled a lease agreement for an amount less than we had accrued in previous periods resulting in a reversal of restructuring charges of $454,000. During the third quarter 2010, we liquidated the Remy Automotive Poland legal entity which resulted in the recognition of impairment of our investment of $2,288,000 due to the realization of a previously unrealized loss related to the accumulated other comprehensive income related to the foreign currency translation adjustment.
Accrued restructuring
The following table summarizes the activity in our accrual for restructuring:
|
| | | | | | | | | | | | |
| (In thousands of dollars) | Termination benefits |
| Exit costs |
| Other charges |
| Total |
|
| Accrual at January 1, 2011 | $ | 487 |
| $ | 125 |
| $ | — |
| $ | 612 |
|
| Provision in 2011 | 2,995 |
| 577 |
| — |
| 3,572 |
|
| Payments in 2011 | (943 | ) | (316 | ) | — |
| (1,259 | ) |
| Accrual at December 31, 2011 | 2,539 |
| 386 |
| — |
| 2,925 |
|
| Provision in 2012 | 5,373 |
| 651 |
| 1,687 |
| 7,711 |
|
| Payments in 2012 | (4,339 | ) | (931 | ) | (1,687 | ) | (6,957 | ) |
| Accrual at December 31, 2012 | $ | 3,573 |
| $ | 106 |
| $ | — |
| $ | 3,679 |
|
During 2013, we expect to pay substantially all of the termination benefits and the majority of the exit costs accrued as of December 31, 2012.
16. Income taxes
Income (loss) before income taxes was taxed in the following jurisdictions:
|
| | | | | | | | | |
| | Years ended December 31, | |
| (In thousands of dollars) | 2012 |
| 2011 |
| 2010 |
|
| Domestic | $ | 46,078 |
| $ | 45,053 |
| $ | (24,957 | ) |
| Foreign | 24,078 |
| 45,091 |
| 64,485 |
|
| | $ | 70,156 |
| $ | 90,144 |
| $ | 39,528 |
|
The following is a summary of the components of the provision for income tax (benefit) expense:
|
| | | | | | | | | |
| | Years ended December 31, | |
| (In thousands of dollars) | 2012 |
| 2011 |
| 2010 |
|
| Current: | |
| |
| |
|
| Federal | $ | 5,637 |
| $ | 1,798 |
| $ | (125 | ) |
| State and local | 1,078 |
| 804 |
| 515 |
|
| Foreign | 11,023 |
| 14,230 |
| 19,690 |
|
| Deferred: | |
| |
| |
|
| Federal | (70,643 | ) | (1,527 | ) | (1,311 | ) |
| State and local | (13,076 | ) | (179 | ) | (155 | ) |
| Foreign | (5,248 | ) | (313 | ) | (277 | ) |
| Income tax (benefit) expense | $ | (71,229 | ) | $ | 14,813 |
| $ | 18,337 |
|
For the year ended December 31, 2012, the U.S. federal and state deferred tax expense relates to the utilization of net operating loss carryforwards and a release of the valuation allowance. For the years ended December 31, 2011, and 2010, the U.S. federal and state deferred tax expense relates to goodwill amortization for tax purposes creating tax loss carryforwards to which a full valuation allowance has been recorded.
A reconciliation of income taxes at the United States federal statutory rate to the effective income tax rate follows:
|
| | | | | | |
| | Years ended December 31, | |
| | 2012 |
| 2011 |
| 2010 |
|
| Federal statutory income tax rate | 35.0 | % | 35.0 | % | 35.0 | % |
| State and local income taxes, net of Federal tax benefit, if applicable | (0.2 | ) | 0.6 |
| 0.9 |
|
| Permanent items and other | 9.3 |
| 2.2 |
| 8.6 |
|
| Foreign operations | 2.4 |
| 2.4 |
| (12.7 | ) |
| Goodwill | — |
| 0.7 |
| 4.2 |
|
| Intraperiod tax allocation from other comprehensive income | — |
| — |
| (7.9 | ) |
| Valuation allowance changes affecting the provision | (148.0 | ) | (24.5 | ) | 18.3 |
|
| Effective income tax rate | (101.5 | )% | 16.4 | % | 46.4 | % |
The following table summarizes the total provision for income taxes by component:
|
| | | | | | | | | |
| | Years ended December 31, | |
| (In thousands of dollars) | 2012 |
| 2011 |
| 2010 |
|
| Income tax expense | $ | (71,229 | ) | $ | 14,813 |
| $ | 18,337 |
|
| Allocated to other comprehensive income: |
|
|
|
| |
|
| Financial instruments | 4,331 |
| (2,044 | ) | 5,276 |
|
| Pensions | (599 | ) | — |
| (1,996 | ) |
The following is a summary of the significant components of our deferred income tax assets and liabilities.
|
| | | | | | |
| | As of December 31, | |
| (In thousands of dollars) | 2012 |
| 2011 |
|
| Deferred tax assets: | |
| |
|
| Restructuring charges | $ | 245 |
| $ | 565 |
|
| Employee benefits | 14,394 |
| 8,705 |
|
| Inventories | 2,042 |
| 2,045 |
|
| Warranty | 9,714 |
| 10,975 |
|
| Alternative minimum tax and other credits | 17,118 |
| 10,412 |
|
| Net operating loss carryforwards | 65,039 |
| 80,240 |
|
| Customer contracts & other intangibles | 388 |
| 914 |
|
| Rebates, stock, discounts and returns | 4,814 |
| 6,697 |
|
| Unrealized gain/loss on financial instruments | 1,382 |
| 4,900 |
|
| Other | 8,453 |
| 10,296 |
|
| Total deferred tax assets | 123,589 |
| 135,749 |
|
| Valuation allowance | (16,044 | ) | (112,277 | ) |
| Deferred tax assets, net of valuation allowance | 107,545 |
| 23,472 |
|
| Deferred tax liabilities: | |
| |
|
| Depreciation | (2,088 | ) | (5,705 | ) |
| Goodwill and other intangibles | (10,936 | ) | (16,014 | ) |
| Trade names | (18,846 | ) | (18,846 | ) |
| Other | (10,375 | ) | (2,807 | ) |
| Total deferred tax liabilities | (42,245 | ) | (43,372 | ) |
| Net deferred tax asset (liability) | $ | 65,300 |
| $ | (19,900 | ) |
At December 31, 2012, we had unused U.S. federal net operating loss carryforwards of approximately $127,016,000 that expire during 2023 through 2030. Pursuant to Internal Revenue Code Section 382, we are limited to approximately $10,555,000 use in any one year of the pre-bankruptcy net operating loss carryforward and credit equivalents in our federal income tax return. We also had unused U.S. alternative minimum tax credit
carryforwards of $3,312,000 that may be carried forward indefinitely. In addition, we had research and development credit carry forwards for federal and state purposes of $13,277,000 that will expire during 2017 through 2030.
At December 31, 2012, and 2011, we had unused foreign loss carryforwards totaling $54,576,000 and $59,029,000, respectively. Foreign net operating loss carryforwards totaling $1,763,000 will expire during 2013, foreign net operating loss carryforwards totaling $8,669,000 will expire during 2013 through 2021, and foreign net operating loss carryforwards totaling $44,144,000 have no expiration.
We review the likelihood that it will realize the benefit of its deferred tax assets and, therefore, the need for valuation allowances on a quarterly basis, or more frequently if events indicate that a review is required. In determining the requirement for a valuation allowance, the historical and projected financial results of the legal entity or consolidated group recording the net deferred tax asset is considered, along with all other available positive and negative evidence. The factors considered by management in its determination of the probability of the realization of the deferred tax assets include but are not limited to: recent adjusted historical financial results, historical taxable income, projected future taxable income, the expected timing of the reversals of existing temporary differences and tax planning strategies. If, based upon the weight of available evidence, it is more likely than not the deferred tax assets will not be realized, a valuation allowance is recorded.
Concluding that a valuation allowance is not required is difficult when there is significant negative evidence which is objective and verifiable, such as cumulative losses in recent years. We utilize a rolling twelve quarters of pre-tax book results adjusted for significant permanent book to tax differences as a measure of cumulative results in recent years. In the U.S. and certain foreign jurisdictions, our analysis indicates that we have cumulative three year historical losses on this basis. This is considered significant negative evidence which is difficult to overcome. However, the three year loss position is not solely determinative and, accordingly, management considers all other available positive and negative evidence in its analysis.
There is no corresponding income tax benefit recognized with respect to losses incurred and no corresponding income tax expense recognized with respect to earnings generated in jurisdictions with a valuation allowance. This causes variability in the our effective tax rate. We intend to maintain the valuation allowances until it is more likely than not that the net deferred tax assets will be realized. If operating results improve or deteriorate on a sustained basis, the our conclusions regarding the need for a valuation allowance could change, resulting in either the reversal or initial recognition of a valuation allowance in the future, which could have a significant impact on income tax expense in the period recognized and subsequent periods.
As part of the review in determining the need for a valuation allowance, we assessed the potential release of existing valuation allowances. Based upon this assessment during the third quarter of 2012, the valuation allowance previously recorded against the net deferred tax assets in the United States has been reversed resulting in an income tax benefit of $(84,705,000) during the third quarter of 2012. As of December 31, 2012, the Company has retained a valuation allowance of approximately $5,598,000 on certain United States deferred tax assets. If a release of the U.S. valuation allowance occurs, it will have a significant impact on net income in the period in which it occurs. This valuation allowance is recorded against a capital loss and certain tax credits where the ability to use or realize is less than likely.
During 2012, the Company concluded that certain foreign locations no longer needed a valuation allowance and has recorded the release of $(4,708,000) of valuation allowance which was recognized in income tax benefit.
Income tax payments, net of refunds including state taxes, were $13,019,000, $17,778,000, and $16,072,000 for the years ended December 31, 2012, 2011, and 2010, respectively.
FASB ASC Topic 740 clarifies the accounting for uncertainty in income taxes recognized in companies' financial statements. As a result, we apply a more-likely-than-not recognition threshold for all tax uncertainties. It only allows the recognition of those tax benefits that have a greater than 50% likelihood of being sustained upon examination by the taxing authorities.
A reconciliation of the beginning and ending amount of unrecognized tax benefits is as follows:
|
| | | | | | | | | |
| (In thousands of dollars) | 2012 |
| 2011 |
| 2010 |
|
| Balance at January 1, | $ | 4,592 |
| $ | 2,806 |
| $ | 1,425 |
|
| Additions based on tax positions related to the current year | 2,697 |
| 672 |
| 934 |
|
| Additions for tax positions of prior years | 1,875 |
| 1,561 |
| 447 |
|
| Reductions for tax positions of prior years | — |
| (447 | ) | — |
|
| Settlements | — |
| — |
| — |
|
| Balance at December 31, | $ | 9,164 |
| $ | 4,592 |
| $ | 2,806 |
|
At December 31, 2012, and 2011, we have total unrecognized tax benefits of $10,350,000 and $5,380,000, respectively, that have been recorded as liabilities, and we are uncertain as to if or when such amounts may be settled. We recognized interest and penalties accrued related to unrecognized tax benefits in income tax expense. As of December 31, 2012, and 2011, we accrued approximately $1,186,000 and $788,000, respectively, for the payment of interest and penalties. During the years ended December 31, 2012, 2011, and 2010, we expensed $398,000, $79,000, and $534,000, respectively, for penalties and interest. During the next twelve months, $328,000 of unrecognized tax benefits will reverse due to expiration of the statute of limitations.
United States income taxes have not been provided on accumulated but undistributed earnings of approximately $152,227,000 of our non-U.S. subsidiaries as these earnings are considered to be indefinitely reinvested and, accordingly, no provision for U.S. federal or state income taxes or foreign withholding taxes has been made. Upon distribution of those earnings, the Company would be subject to U.S. income taxes (subject to a reduction for foreign tax credits) and withholding taxes payable to the various foreign countries. Determination of the unrecognized deferred tax liability related to these undistributed earnings is not practicable because of the complexities of its hypothetical calculation.
We operate in multiple jurisdictions throughout the world. We are no longer subject to U.S. federal tax examinations for years before 2008 or state and local for years before 2006, with limited exceptions. For federal purposes, the tax attributes carried forward could be adjusted through the examination process and are subject to examination 3 years from the date of utilization. Furthermore, we are no longer subject to income tax examinations in major foreign tax jurisdictions for years prior to 2005, with limited exceptions.
17. Employee benefit plans
Agreements with GM
In connection with the sale by GM of its former Delco Remy operations, we agreed with GM to allocate the financial responsibility for employee postretirement health care and life insurance on a pro rata basis between us and them. The allocation is primarily determined upon years of service with us and aggregate years of service with GM. Effective August 1, 1994, the Company established hourly and salaried postretirement health care and life insurance plans (which were assumed by us when we emerged from bankruptcy on December 6, 2007), under which GM would reimburse us for their proportionate share of the costs we incurred under the plans. In July 2009, and in connection with GM bankruptcy proceedings, we entered into an agreement with new GM to terminate GM's reimbursement to us for GM's proportionate share of retiree health claims for our eligible hourly retirees who receive or who would receive retiree healthcare under the Remy retiree healthcare plans.
Pension and Postretirement Health Care and Life Insurance Plans
Our subsidiary, Remy Inc., had defined benefit pension plans that covered certain salaried and hourly U.S. employees. The plan covering salaried employees provided benefits that were based upon years of service and final estimated average compensation. Benefits for hourly employees are based on stated amounts for each year of service. Our funding policy is to contribute amounts to provide the plans with sufficient assets to meet future benefit payment requirements consistent with actuarial determinations of the funding requirements of federal laws. Plan assets are primarily invested in mutual funds, which invest in both debt and equity instruments. In the second quarter of 2006, we notified the U.S. salaried employees and the U.S. Internal Revenue Service (“IRS”) that we had adopted an amendment to our U.S. salaried pension plan which froze the future accrual of benefits under the salaried pension plan for all eligible participants as of June 30, 2006, and provides that no new participants will be added to the plan after June 30, 2006. The plan covering hourly employees has no active employees and no current service costs.
We offer a supplemental executive retirement pension plan to selected former and current executive officers of our company. The plan offers retirement benefits ranging from 30% to 50% of the participant's average salary for five consecutive years prior to receiving benefits. As of December 31, 2012, there were five participants in the plan of which only one is an active employee.
Remy Automotive UK Ltd., a United Kingdom subsidiary, has a defined benefit pension plan. This plan covers a limited number of employees who were part of an acquisition in 1998. In addition, some of our international subsidiaries have other postretirement benefit plans although most participants are covered by government sponsored and administered programs.
We maintained certain U.S. salaried and hourly benefit plans that provided postretirement health care and life insurance to retirees and eligible dependents. The benefits were payable for life, although we retain the right to modify or terminate the plans. The salaried postretirement plan had cost sharing features such as deductibles and co-payments. Salaried employees who were not GM employees prior to 1992 are not eligible for the above described postretirement benefits. It is our policy to fund these benefits as claims are incurred.
Remy postretirement benefit plans
In connection with old GM's rejection of the cost-sharing arrangement of the postretirement benefit provision as part of its bankruptcy proceedings, we entered into an agreement with new GM for its portion of the postretirement cost sharing arrangement.
On September 30, 2009, Remy decided to terminate the Remy postretirement healthcare benefits under the salaried and hourly postretirement plans effective December 31, 2009. In connection with the termination of these plans, we established a Voluntary Retiree Reimbursement Account Program (“VRRAP”) effective January 1, 2010. Under the VRRAP plan, participants are credited a defined lifetime capped benefit amount to cover qualifying medical expenses. The new GM agreement and plan amendment resulted in a net decrease of the benefit obligation of $2,570,000 and an increase in accumulated other comprehensive income of $10,170,000 to the Remy postretirement benefit plans in 2009. In November 2011, we entered into a settlement agreement with certain retirees and established a Retirement Reimbursement Account Program. The Retiree Reimbursement Account Program ("RRAP") is a defined lifetime capped benefit and works the same as the VRRAP plan.
The changes in benefit obligations and plan assets, components of expense and assumptions for the postretirement healthcare and life insurance plans are as follows:
|
| | | | | | | | | |
| | Postretirement healthcare and life insurance plans | |
| | Years ended December 31, | |
| (In thousands of dollars) | 2012 |
| 2011 |
| 2010 |
|
| Change in benefit obligations | |
| |
| |
|
| Benefit obligation at beginning of period | $ | 2,897 |
| $ | 2,286 |
| |
| Service cost | — |
| — |
| |
| Interest cost | 97 |
| 99 |
| |
| Amendments | — |
| 805 |
| |
| Actuarial loss | 22 |
| 68 |
| |
| Benefits paid | (334 | ) | (361 | ) | |
| Benefit obligation at end of period | $ | 2,682 |
| $ | 2,897 |
| |
| | | | |
| Change in plan assets |
|
|
|
| |
| Fair value of plan assets at beginning of period | $ | — |
| $ | — |
| |
| Employer contributions | 334 |
| 361 |
| |
| Benefits paid | (334 | ) | (361 | ) | |
| Fair value of plan assets at end of period | $ | — |
| $ | — |
| |
| Funded status | $ | (2,682 | ) | $ | (2,897 | ) | |
| | | | |
| Amounts recognized in statement of financial position consist of: | | |
| |
|
| Current liabilities | $ | (713 | ) | $ | (979 | ) | |
| Noncurrent liabilities | (1,969 | ) | (1,918 | ) | |
| Net amount recognized | $ | (2,682 | ) | $ | (2,897 | ) | |
| | | | |
|
Amounts recognized in accumulated other comprehensive income consist of: | |
| |
| |
|
| Net actuarial loss | $ | 5,647 |
| $ | 5,133 |
| |
| Prior service credit | (5,448 | ) | (7,122 | ) | |
| Accumulated other comprehensive loss (income) | $ | 199 |
| $ | (1,989 | ) | |
| | | | |
Components of net periodic benefit cost and other amounts recognized in other comprehensive income | | |
| |
|
| Net Periodic Benefit Cost | | |
| |
|
| Service cost | $ | — |
| $ | — |
| $ | — |
|
| Interest cost | 97 |
| 99 |
| 121 |
|
| Amortization of prior service cost | (1,674 | ) | (7,928 | ) | (7,928 | ) |
| Recognized net actuarial loss | (492 | ) | 5,129 |
| 5,096 |
|
| Settlement gain | — |
| — |
| — |
|
| Net periodic cost (benefit) | $ | (2,069 | ) | $ | (2,700 | ) | $ | (2,711 | ) |
| | | | |
| Other changes in plan assets and benefit obligations recognized in other comprehensive income | | |
| |
|
| Net actuarial loss | $ | 22 |
| $ | 68 |
| $ | 3 |
|
| Prior service credit | — |
| 805 |
| — |
|
| Amortization of prior service cost | 1,674 |
| 7,928 |
| 7,928 |
|
| Recognized net actuarial (loss) gain | 492 |
| (5,129 | ) | (5,096 | ) |
| Total recognized in other comprehensive loss | 2,188 |
| 3,672 |
| 2,835 |
|
| Total recognized in net (benefit) cost and OCI | $ | 119 |
| $ | 972 |
| $ | 124 |
|
| | | |
| Weighted-average assumptions | |
| |
| |
|
| U.S. assumptions: | |
| |
| |
|
| Discount rate for benefit obligation | 3.85 | % | 4.28 | % | 5.41 | % |
| Discount rate for net periodic benefit cost | 4.28 | % | 5.41 | % | 5.87 | % |
| Rate of compensation increase | — | % | — | % | — | % |
The changes in benefit obligations and plan assets, components of expense and assumptions for the pension plans are as follows: |
| | | | | | | | | |
| | Pension benefits | |
| | Years ended December 31, | |
| (In thousands of dollars) | 2012 |
| 2011 |
| 2010 |
|
| Change in benefit obligations | |
| |
| |
|
| Benefit obligation at beginning of period | $ | 73,182 |
| $ | 63,277 |
| |
| Service cost | 291 |
| 263 |
| |
| Interest cost | 3,143 |
| 3,342 |
| |
| Amendments | — |
| — |
| |
| Actuarial loss | 5,692 |
| 8,865 |
| |
| Benefits paid | (2,831 | ) | (2,565 | ) | |
| Benefit obligation at end of period | $ | 79,477 |
| $ | 73,182 |
| |
| Change in plan assets |
|
|
|
| |
| Fair value of plan assets at beginning of period | $ | 41,765 |
| $ | 41,924 |
| |
| Actual return on plan assets | 5,650 |
| (251 | ) | |
| Employer contributions | 2,765 |
| 2,657 |
| |
| Benefits paid | (2,831 | ) | (2,565 | ) | |
| Fair value of plan assets at end of period | $ | 47,349 |
| $ | 41,765 |
| |
| Funded status | $ | (32,128 | ) | $ | (31,417 | ) | |
| Amounts recognized in statement of financial position consist of: |
|
|
|
| |
| Noncurrent assets | — |
| — |
| |
| Current liabilities | (366 | ) | (357 | ) | |
| Noncurrent liabilities | (31,762 | ) | (31,060 | ) | |
| Net amount recognized | $ | (32,128 | ) | $ | (31,417 | ) | |
| Amounts recognized in accumulated other comprehensive income consist of: |
|
|
|
| |
| Net actuarial loss (gain) | $ | 28,379 |
| $ | 27,146 |
| |
| Prior service cost | — |
| — |
| |
| Accumulated other comprehensive loss (income) | $ | 28,379 |
| $ | 27,146 |
| |
| Information for pension plans with an accumulated benefit obligation in excess of plan assets |
| Projected benefit obligation | $ | 79,477 |
| $ | 73,182 |
| |
| Accumulated benefit obligation | 79,064 |
| 72,825 |
| |
| Fair value of plan assets | 47,349 |
| 41,765 |
| |
| Components of net periodic benefit cost and other amounts recognized in other comprehensive income |
| Net Periodic Benefit Cost | |
| |
| |
|
| Service cost | $ | 291 |
| $ | 263 |
| $ | 247 |
|
| Interest cost | 3,143 |
| 3,342 |
| 3,305 |
|
| Expected return on plan assets | (2,622 | ) | (2,690 | ) | (2,501 | ) |
| Amortization of prior service cost | — |
| — |
| — |
|
| Recognized net actuarial loss (gain) | 1,287 |
| 479 |
| 447 |
|
| Net periodic pension cost (benefit) | $ | 2,099 |
| $ | 1,394 |
| $ | 1,498 |
|
| Other changes in plan assets and benefit obligations recognized in other comprehensive income |
| Net actuarial loss (gain) | $ | 2,520 |
| $ | 11,807 |
| $ | 3,649 |
|
| Prior service cost | — |
| — |
| — |
|
| Amortization of prior service cost | — |
| — |
| — |
|
| Recognized net actuarial (loss) gain | (1,287 | ) | (479 | ) | (447 | ) |
| Total recognized in other comprehensive loss (income) | 1,233 |
| 11,328 |
| 3,202 |
|
| Total recognized in net (benefit) cost and OCI | $ | 3,332 |
| $ | 12,722 |
| $ | 4,700 |
|
| Weighted-average assumptions | |
| |
| |
|
| U.S. assumptions: | |
| |
| |
|
| Discount rate for benefit obligation | 3.85 | % | 4.28 | % | 5.41 | % |
| Discount rate for net periodic benefit cost | 4.28 | % | 5.41 | % | 5.87 | % |
| Rate of compensation increase | 5.00 | % | 5.00 | % | 5.00 | % |
| Expected return on plan assets | 6.50 | % | 6.50 | % | 6.50 | % |
| U.K. assumptions: |
|
|
|
| |
|
| Discount rate for benefit obligation | 4.10 | % | 4.70 | % | 5.40 | % |
| Discount rate for net periodic cost | 4.70 | % | 5.40 | % | 5.70 | % |
| Rate of compensation increase | 3.10 | % | 3.35 | % | 3.45 | % |
| Expected return on plan assets | 4.99 | % | 5.18 | % | 6.20 | % |
Amounts in accumulated other comprehensive income (loss) expected to be recognized as components of net periodic benefit cost over the next fiscal year:
|
| | | | | | |
| (In thousands of dollars) | Pension |
| Postretirement healthcare |
|
| Amortization of actuarial losses | $ | 1,357 |
| $ | 67 |
|
| Amortization of prior service cost | — |
| — |
|
| Total | $ | 1,357 |
| $ | 67 |
|
The projected benefit obligations for U.K. pension plans based on the actuarial present value of the vested benefits to which the employee is currently entitled but based on the employee’s expected date of separation of retirement included above are $12,557,000, and $10,979,000 as of December 31, 2012, and 2011, respectively. The fair value of the plan assets for U.K. pension plans included above are $9,450,000, and $8,460,000 as of December 31, 2012, and 2011, respectively.
The discount rate assumptions for our U.S. pension plans and postretirement plans are based on a hypothetical yield curve and associated spot rate curve to discount the plan's projected cash flows. The yield curve utilized is the Citigroup Pension Discount Curve. Once the present value of projected benefit payments is calculated, the suggested discount rate is equal to the level rate that results in the same present value.
To develop the expected long-term rate of return on assets assumption, we considered the historical returns and future expectations for returns for each asset class, as well as the target asset allocation of the present portfolio. This resulted in the selection of the 6.5% for long-term rate of return on asset assumption for U.S. plans and 4.99% for U.K. plans.
Our investment strategies with respect to U.S. pension assets are as follows:
The assets are managed in compliance with provisions of the Employee Retirement Income Security Act.
The assets are to be invested with expectations of achieving real growth with respect to inflation, the belief that the U.S. capital markets will remain viable, maintaining a level of liquidity to meet timely payment of benefits to participants and minimizing risk and achieving growth through prudent diversification of assets among investment categories.
The 2013 target plan asset allocation is:
|
| | | |
| | Target allocation |
| Equity Investments | 50% | - | 70% |
| Fixed Income Investments | 30% | - | 50% |
| Cash and Short Term Investments | 0% | - | 10% |
The asset allocations were:
|
| | | | | | | | | | |
| | As of December 31, | |
| (In thousands of dollars) | 2012 | | 2011 | |
| Asset Allocation for Plan Assets | | | | |
| Interest-bearing cash | $ | 2,418 |
| 5.1 | % | $ | 2,136 |
| 5.1 | % |
| Bond Mutual Funds | 16,630 |
| 35.1 | % | 13,687 |
| 32.8 | % |
| Equity Mutual Funds | 28,301 |
| 59.8 | % | 25,942 |
| 62.1 | % |
| Total plan assets | $ | 47,349 |
| 100 | % | $ | 41,765 |
| 100 | % |
The assumptions used in deriving our postretirement costs and the sensitivity analysis thereon are:
|
| | | | |
| | As of December 31, | |
| | 2012 |
| 2011 |
|
| Assumed Health Care Cost Trend Rates | | |
| Health care cost trend rate assumed for next year | 9 | % | 9 | % |
| Rate to which the cost trend is expected to decline | 5 | % | 5 | % |
| Year that the rate reaches the ultimate trend rate | 2016 |
| 2015 |
|
Sensitivity analysis
An increase or decrease of one percentage point in the assumed health care trends would have the following approximate effects for the year ended December 31, 2012 (in thousands of dollars):
|
| | | | | | |
| | 1% Increase |
| 1% Decrease |
|
| Effect on total of service and interest cost components of net periodic postretirement health care benefit cost | $ | — |
| $ | — |
|
Effect on the health care component of the accumulated postretirement benefit obligation | $ | 5 |
| $ | (5 | ) |
Payments to pension and postretirement plans
We contributed $2,765,000 to our pension plans in 2012 and $2,657,000 in 2011.
In 2013, we plan to contribute approximately $1,748,000 to our U.S. pension plans and nothing to our U.K. pension plans. The benefits of the postretirement health care plan are funded on a pay-as-you go basis and are funded on a cash basis as benefits are paid.
The following reflects the estimated future benefit payments to be paid from the plans:
|
| | | | | | |
| (In thousands of dollars) | Pension |
| Postretirement healthcare |
|
| 2013 | $ | 2,686 |
| $ | 713 |
|
| 2014 | 2,720 |
| 436 |
|
| 2015 | 2,797 |
| 163 |
|
| 2016 | 2,813 |
| 128 |
|
| 2017 | 2,722 |
| 112 |
|
| Years 2018-2022 | 15,437 |
| 291 |
|
Defined contribution plans
We sponsor two voluntary savings plans for U.S. employees. One plan is for eligible salaried employees and the other plan is for hourly employees covered by certain labor agreements. These plans allow participants to make contributions pursuant to section 401(k) of the Internal Revenue Code. The salaried plan has Company matching contribution provisions, while the hourly plan does not. Charges were $1,640,000, $1,442,000, and $1,207,000 for the years ended December 31, 2012, 2011, and 2010, respectively.
18. Stock-based compensation
In December 6, 2007, our executive officers received restricted stock awards of 524,737 common shares at no cost to them. An additional award of 108,335 common shares was made on April 30, 2008, to certain other key employees. Both of the awards vest at 12% on each of the first three years' anniversaries of the grant date, and 32% each on the fourth and fifth anniversaries, based upon continuation of employment. In February and November 2008, our board of directors received restricted stock grants of 160,000 common shares that vest 50% upon the first and second anniversaries. Additionally, there is a change of control provision in the aforementioned awards. As a nonpublic company prior to December 2012, there was not an active viable market for our common stock;
accordingly, we used a calculated fair value of $3.00, $8.00, $11.55, and $11.55 on a per share basis to determine the value of the awards related to the November 2008 grant, the April 2008 grant, the February 2008, and December 2007, grants, respectively. Our calculation assumed a risk-free interest rate of 3.0%, volatility of 39.1%, and that no dividends would be paid.
On January 4, 2011, executive officers and other key employees received restricted stock awards of 744,089 common shares. The executive officers and other key employees' awards are vested 50% time based and 50% performance based. The time based shares are equally vested over a three year period. One-third of the performance based shares will be available to vest in each of the calendar years 2011, 2012, and 2013, based on a target Adjusted EBITDA, for each of the years. Adjusted EBITDA is defined as earnings before interest, income taxes, depreciation and amortization, restructuring expenses and certain items such as noncash compensation expense, loss on extinguishment of debt, intangible asset impairment charges, and reorganization items. Our board of directors received restricted stock awards of 340,455 common shares. One-half of the restricted stock shares granted to the board of directors vest at each anniversary of the grant date. As a nonpublic company prior to December 2012, there was not an active viable market for our common stock; accordingly, we used a calculated value of $11.00. We based this valuation primarily on the $11.00 per share price offered in the January 2011 rights offering. Since the shares sold in this rights offering were not freely tradable at issuance, the offering price includes a discount for lack of marketability, and we determined that this price approximates fair value as of the grant date.
On February 24, 2012, executive officers and other key employees received restricted stock awards of 462,002 common shares. The executive officers and other key employees' awards are vested 50% time based and 50% performance based. The time based shares are equally vested over a three year period. One-third of the performance based shares will be available to vest for each of the calendar years 2012, 2013, and 2014 based on a target Adjusted EBITDA for each of the years. Our board of directors received restricted stock awards of 45,713 common shares. One-half of the restricted stock shares granted to the board of directors vest at each anniversary of the grant date. As a nonpublic company prior to December 2012, there was not an active viable market for our common stock; accordingly, we used a calculated value of $17.50. We based this valuation primarily on the average closing price of our shares over a 90 day period prior to the grant.
On April 9, 2012, additional restricted stock awards of 28,571 common shares were granted as part of the 2012 executive officer and other key employees' awards with the same terms as the February 24, 2012 grant.
On February 21, 2013, executive officers and other key employees received restricted stock awards of 220,338 common shares. The executive officers and other key employees’ awards are vested 50% time based and 50% performance based. The time based shares are equally vested over a three year period. One-third of the performance based shares will be available to vest for each of the calendar years 2013, 2014 and 2015 based on a target operating income for each of the years. Additionally, executive officers and other key employees were granted 230,389 stock option awards which vest equally over a three year period with a term of seven years and exercise price of $18.50. Our board of directors received restricted stock awards of 32,164 common shares and stock option awards of 33,618 common shares. One-half of the restricted stock shares and stock options granted to the board of directors vest at each anniversary of the grant date. Stock options granted to directors have a seven year term and are based on an exercise price of $18.50.
Noncash compensation expense related to the awards was recognized for the years ended December 31, as follows (in thousands of dollars):
|
| | | | | | | | | |
| | 2012 |
| 2011 |
| 2010 |
|
| Stock-based compensation | $ | 7,261 |
| $ | 6,884 |
| $ | 1,196 |
|
A summary of the status of our nonvested restricted stock awards as of December 31, 2012, and changes during the year ended December 31, 2012, is presented below:
|
| | | | | |
| Nonvested units | Restricted stock awards |
| Weighted- average grant-date fair value |
|
| Nonvested at January 1, 2012 | 1,212,587 |
| $ | 10.97 |
|
| Granted | 536,286 |
| 17.50 |
|
| Vested | (621,787 | ) | 11.10 |
|
| Forfeited | (2,134 | ) | 8.00 |
|
| Nonvested at December 31, 2012 | 1,124,952 |
| $ | 14.08 |
|
As of December 31, 2012, there was $4,778,054 of total unrecognized compensation cost related to nonvested share-based compensation arrangements granted under the plan. Such cost is expected to be recognized over a weighted-average period of approximately 2 years.
If factors change and we employ different assumptions, stock-based compensation expense may differ significantly from what we have recorded in the past. If there are any modifications or cancellations of the underlying unvested securities, we may be required to accelerate, increase or cancel any remaining unearned stock-based compensation expense. Future stock-based compensation expense and unearned stock-based compensation will increase to the extent that we grant additional equity awards to employees or we assume unvested equity awards in connection with acquisitions.
19. Lease commitments
We occupy space and use certain equipment under operating lease arrangements. Rent expense, calculated on a straight-line basis, totaled $5,599,000, $6,858,000, and $5,832,000 for the years ended December 31, 2012, 2011, and 2010, respectively. Rental commitments at December 31, 2012, for long-term non-cancellable operating leases consummated as of December 31, 2012 (not reflected as accrued restructuring) are as follows:
|
| | | |
| (In thousands of dollars) | |
|
| 2013 | $ | 5,320 |
|
| 2014 | 3,643 |
|
| 2015 | 2,743 |
|
| 2016 | 2,568 |
|
| 2017 | 1,604 |
|
| Thereafter | 1,037 |
|
20. Business segment and geographical information
We are a leading global vehicular parts designer, manufacturer, remanufacturer, marketer and distributor. Products we manufacture include starters, alternators, and hybrid electric transmission motors which are principally sold or distributed to OEMs for both original equipment manufacture and aftermarket operations, as well as to warehouse distributors and retail automotive parts chains. We manage our business and operate in a single reportable business segment.
We are a multi-national corporation with operations in many countries, including the U.S., Canada, Mexico, Brazil, China, Hungary, South Korea, the United Kingdom, Belgium and Tunisia. As a result, our financial results could be significantly affected by factors such as changes in foreign currency exchange rates or weak economic conditions in the foreign markets in which we distribute our products. Our operating results are exposed to changes in exchange rates between the U.S. dollar and non-U.S. currencies. Exposure to variability in foreign currency exchange rates is managed primarily through the use of natural hedges, whereby funding obligations and assets are both denominated in the local currency, and through selective currency hedges. From time to time, we enter into exchange agreements to manage our exposure arising from fluctuating exchange rates related to specific transactions. Sales are attributed to geographic locations based on the point of sale.
Information is as follows:
|
| | | | | | | | | |
| | Years ended December 31, | |
| (In thousands of dollars) | 2012 |
| 2011 |
| 2010 |
|
| Net sales to external customers: | |
| |
| |
|
| United States | $ | 753,420 |
| $ | 756,824 |
| $ | 667,198 |
|
| Europe | 103,303 |
| 115,901 |
| 117,245 |
|
| Other Americas | 56,300 |
| 90,636 |
| 119,829 |
|
| Asia Pacific | 220,524 |
| 231,592 |
| 199,527 |
|
| Total net sales | $ | 1,133,547 |
| $ | 1,194,953 |
| $ | 1,103,799 |
|
|
| | | | | | |
| | As of December 31, | |
| (In thousands of dollars) | 2012 |
| 2011 |
|
| Long-lived assets: | |
| |
|
| United States | $ | 464,826 |
| $ | 461,440 |
|
| Europe | 28,324 |
| 32,541 |
|
| Other Americas | 37,908 |
| 43,281 |
|
| Asia Pacific | 26,600 |
| 25,581 |
|
| Total long-lived assets | $ | 557,658 |
| $ | 562,843 |
|
21. Other commitments and contingencies
We are party to various legal actions and administrative proceedings and subject to various claims arising in the ordinary course of business, including those relating to commercial transactions, product liability, safety, health, taxes, environmental and other matters. We review these matters on an ongoing basis and follow the provisions of Financial Accounting Standards Codification Topic 450, Contingencies, when making accrual and disclosure decisions. For legal proceedings where it has been determined that a loss is both probable and reasonably estimable, a liability based on known facts and which represents our best estimate has been recorded. We believe that the ultimate liability, if any, in excess of amounts already provided for in the financial statements on the disposition of these matters and the matters discussed below would not have a material adverse effect on our financial position.
Remy, Inc. vs. Tecnomatic S.p.A.
On September 12, 2008, Remy International, Inc. filed suit against Tecnomatic in the U.S. District Court, Southern District of Indiana, Indianapolis Division (Civil Action No.: 1:08-CV-1227-SEB-JMS), titled Remy, Inc. vs. Tecnomatic S.p.A., for breach of contract, among other claims, with respect to a machine Tecnomatic manufactured for us to build stators. On December 9, 2008, Tecnomatic filed a counterclaim in the amount of $111,000.
Tecnomatic filed a lawsuit on March 9, 2011 in U.S. District Court, N. D. of Illinois, against Remy International, Inc., its Mexican subsidiaries and two other entities alleging breach of confidentiality agreement, misrepresentation and misappropriation of technology and requests damages of $110,000,000. We believe this action is without merit and an attempt to push us to settle the prior case. The Illinois Court granted our motion to transfer the case to U.S. District Court, Southern District of Indiana, Indianapolis Division, and the two pending actions were merged by the Indiana Court. The new trial date has not yet been determined. Due to the early stage of this case, it is not possible to make a meaningful estimate of the amount or range of loss to the Company, if any, that could result from this case at this time. As such, we have no amounts accrued as of December 31, 2012 for this case. We intend to vigorously defend this case.
22. Supplemental cash flow information
Supplemental cash flow information is as follows:
|
| | | | | | | | | |
| | Years ended December 31, | |
| (In thousands of dollars) | 2012 |
| 2011 |
| 2010 |
|
| Cash paid for interest | $ | 26,987 |
| $ | 29,753 |
| $ | 72,710 |
|
| Cash paid for income taxes, net of refunds received | 13,019 |
| 17,778 |
| 16,072 |
|
During the year ended December 31, 2009, we entered into certain customer agreements which extinguished certain customer obligations of approximately $23,038,000 and resulted in a deferred gain of approximately $8,152,000. The gain is being deferred and recognized over the anticipated sales of the contract through December 2013. The amount recognized as a reduction of cost of goods sold during the years ended December 31, 2012, 2011, and 2010 was $1,671,000, $1,465,000 and $1,553,000, respectively.
As a result of entering into new customer agreements, we recorded customer contract intangibles of $13,623,000, during the year ended December 31, 2011, by incurring customer obligations of $13,623,000. These obligations are paid monthly and quarterly over the life of the agreements.
23. Quarterly financial information (unaudited)
(In thousands of dollars, except per share information)
|
| | | | | | | | | | | | | | | |
| | Quarter ended | | |
| | March 31,
2012 |
| June 30,
2012 |
| September 30,
2012 |
| December 31,
2012 |
| Total year
2012 |
|
| Net sales | $ | 293,061 |
| $ | 294,819 |
| $ | 277,401 |
| $ | 268,266 |
| $ | 1,133,547 |
|
| Gross profit | 62,036 |
| 61,494 |
| 54,809 |
| 59,365 |
| 237,704 |
|
| Restructuring and other charges | 1,698 |
| 1,892 |
| 5,374 |
| 1,307 |
| 10,271 |
|
| Net income | 9,524 |
| 17,964 |
| 97,359 |
| 16,538 |
| 141,385 |
|
| Net income attributable to common stockholders | 8,711 |
| 17,441 |
| 96,532 |
| 15,927 |
| 138,611 |
|
| Basic earnings per share | $ | 0.29 |
| $ | 0.57 |
| $ | 3.15 |
| $ | 0.52 |
| $ | 4.53 |
|
| Diluted earnings per share | $ | 0.28 |
| $ | 0.56 |
| $ | 3.11 |
| $ | 0.51 |
| $ | 4.47 |
|
|
| | | | | | | | | | | | | | | |
| | Quarter ended | | |
| | March 31,
2011 |
| June 30,
2011 |
| September 30,
2011 |
| December 31,
2011 |
| Total year
2011 |
|
| Net sales | $ | 306,402 |
| $ | 303,510 |
| $ | 300,363 |
| $ | 284,678 |
| $ | 1,194,953 |
|
| Gross profit | 75,360 |
| 78,035 |
| 56,661 |
| 59,845 |
| 269,901 |
|
| Restructuring and other charges | 263 |
| 318 |
| 783 |
| 2,208 |
| 3,572 |
|
| Net income | 29,062 |
| 31,804 |
| 1,844 |
| 12,621 |
| 75,331 |
|
| Net income attributable to common stockholders | 18,381 |
| 30,716 |
| 1,197 |
| 11,906 |
| 62,200 |
|
| Basic earnings per share | $ | 0.70 |
| $ | 1.02 |
| $ | 0.04 |
| $ | 0.40 |
| $ | 2.14 |
|
| Diluted earning per share | $ | 0.68 |
| $ | 0.99 |
| $ | 0.04 |
| $ | 0.39 |
| $ | 2.10 |
|
During the third quarter of 2012, we reached the conclusion that the net deferred tax asset in the United States is more likely than not to be utilized. As such, the valuation allowance previously recorded against the net deferred tax assets in the United States has been reversed resulting in an income tax benefit of $(84,705,000) during the third quarter of 2012.
In the third quarter of 2012, we recorded fixed asset impairment charges of $2,279,000 in Restructuring and other charges related to the anticipated closure of our facilities in Matehuala, Mexico and Mezokovesd, Hungary.
In the third quarter of 2011, we fully impaired our defined-life intangible trade name by $5,600,000, and recorded the loss in the consolidated statement of operations in intangible asset impairment charges. The impairment was the result of a change in revenue being generated by the products sold under our trade name to products sold under our customer's private label brand.
During the first quarter of 2011, eligible stockholders exercised rights for 19,723,786 shares of common stock for $216,961,000, consisting of cash proceeds of approximately $123,426,000, and the cancellation of 48,004 shares of preferred stock having an aggregate liquidation preference and accrued dividends of approximately $93,535,000. Subsequent to the January 2011 rights offering, we had 31,467,367 shares of common stock issued. We utilized the proceeds from the January 2011 rights offering to redeem our remaining outstanding Series A and Series B preferred shares resulting in a loss on extinguishment of our preferred shares of $(7,572,000) related to the premium on liquidation preference at redemption $5,872,000 and $1,700,000 related to the “Backstop Fees."
24. Subsequent Event
On January 31, 2013, the Company and John H. Weber, Chief Executive Officer and President of the Company, have entered into a Transition, Noncompetition and Release Agreement. Pursuant to the terms of the agreement, effective February 28, 2013, Mr. Weber shall be entitled to a lump sum cash payment of $7,000,000.
Item 9. Changes in and Disagreements with Accountants on Accounting and Financial Disclosures
None.
Item 9A. Controls and Procedures
Disclosure Controls and Procedures
Management, with the participation of the Chief Executive Officer and Chief Financial Officer, has evaluated the effectiveness of the design and operation of the Company's disclosure controls and procedures as defined in Exchange Act Rule 13a-15(e) as of the end of the period covered by this report. Based on that evaluation, the Chief Executive Officer and Chief Financial Officer have concluded that these disclosure controls and procedures are effective.
Changes in Internal Controls
There have not been any changes in internal control over financial reporting during the quarter ended December 31, 2012 that have materially affected, or are reasonably likely to materially affect, our internal control over financial reporting.
Item 9B. Other Information
None.
Part III
Items 10-14.
Within 120 days after the close of our fiscal year, we intend to file with the Securities and Exchange Commission a definitive proxy statement pursuant to Regulation 14A of the Securities Exchange Act of 1934 as amended, which will include the matters required by these items.
Part IV
Item 15. Exhibits and Financial Statement Schedules
(a) Financial Statements. The following is a list of the Consolidated Financial Statements of Remy International, Inc. included in Item 8 of Part II:
(b) Financial Statement Schedule.
SCHEDULE II
Valuation and qualifying accounts for
the years ended December 31, 2012, 2011 and 2010
|
| | | | | | | | | | | | | |
| | Balance at Beginning of Period |
| Charged to Costs and Expenses |
| Charged (Credited) to Other Accounts |
| Deductions |
| Balance at End of Period |
|
| | (Dollars in thousands) | |
| Year ended December 31, 2012 | | | | | |
| Allowance for doubtful accounts | $ | 1,612 |
| $ | 814 |
| (9)(c) |
| (486)(a) |
| $ | 1,931 |
|
| Allowance for excess and obsolete inventory | 6,708 |
| 5,115 |
| 86(c) |
| (6,327)(d) |
| 5,582 |
|
| Deferred tax asset valuation allowance | 112,277 |
| (103,805 | ) | 7,572 |
| — |
| 16,044 |
|
| Year ended December 31, 2011 | | | | | |
| Allowance for doubtful accounts | $ | 2,364 |
| $ | 77 |
| $ (11)(c) |
| $ (818)(a) |
| $ | 1,612 |
|
| Allowance for excess and obsolete inventory | 8,054 |
| 4,611 |
| (74)(c) |
| (5,883)(d) |
| 6,708 |
|
| Deferred tax asset valuation allowance | 133,824 |
| (29,521 | ) | 7,974(b) |
| — |
| 112,277 |
|
| Year ended December 31, 2010 | |
| |
| |
| |
| |
|
| Allowance for doubtful accounts | $ | 2,927 |
| $ | 1,086 |
| $ 4(c) |
| $ (1,653)(a) |
| $ | 2,364 |
|
| Allowance for excess and obsolete inventory | 8,880 |
| 6,131 |
| (105)(c) |
| (6,852)(d) |
| 8,054 |
|
| Deferred tax asset valuation allowance | 126,521 |
| 8,413 |
| (1,110)(b) |
| — |
| 133,824 |
|
(a) Uncollectible accounts written off
| |
| (b) | Amounts related to changes in valuation allowance for deferred tax assets related to other comprehensive income |
| |
| (c) | Other is impact of foreign currency translation |
| |
| (d) | Deductions represent write-offs due to sales or scrap of inventory under reserve |
(c) Exhibits Index
|
| | | | | | |
| | | Incorporated by reference | |
Exhibit Number | Description | Form | Exhibit | Filing Date | Filed Herewith |
| 3.1 |
| Amended and Restated Certificate of Incorporation as currently in effect
| S-8 | EX-3.1 | 2/14/2014 | |
| 3.2 |
| Amended and Restated Bylaws
| S-8 | EX-3.2 | 2/14/2014 | |
| 4.1 |
| Specimen common stock certificate | S-1/A | EX-4.1 | 10/18/2012 | |
| 4.2a |
| Registration Rights Agreement, dated December 6, 2007, among Remy International, Inc. and the Stockholders named therein | S-1 | EX-4.2 | 3/25/2011 | |
| 4.2b |
| 2010 letter agreement relating to Registration Rights Agreement, dated December 6, 2007, between Remy International, Inc. and Ore Hill Hub Fund Ltd | S-1/A | EX-4.2.(B) | 10/18/2012 | |
| 10.1 |
| Term B Loan Credit Agreement, dated as of December 17, 2010, among Remy International, Inc., Bank of America, N.A., Merrill Lynch, Pierce, Fenner & Smith, Incorporated, UBS Securities LLC, Barclays Bank plc, and Wells Fargo Securities, LLC | S-1 | EX-10.1 | 3/25/2011 | |
|
| | | | | | |
| 10.2 |
| Credit Agreement, dated as of December 17, 2010, among Remy International, Inc., Western Reman Industrial, Inc., Power Investments, Inc., Remy Electric Motors, L.L.C., Reman Holdings, L.L.C., Remy India Holdings, Inc., Remy Technologies, L.L.C., Remy Korea Holdings, L.L.C., Remy Inc., Remy International Holdings, Inc., Remy Power Products, LLC, Wells Fargo Capital Finance, LLC, Bank of America, N.A. and Merrill Lynch, Pierce, Fenner & Smith, Inc. | S-1 | EX-10.2 | 3/25/2011 | |
| 10.3 |
| Assistance Agreement (DE-EE0002023) between Remy Inc. and the U.S. Department of Energy / NETL dated December 17, 2009 (as amended April 8, 2010, April 20, 2010, August 18, 2010 and February 8, 2011) | S-1 | EX-10.3 | 3/25/2011 | |
| 10.4 |
| Trademark License Agreement, dated as of July 31, 1994, among DRA Inc., DR International, Inc., and General Motors Corporation | S-1/A | EX-10.4 | 5/25/2011 | |
| 10.5 |
| Agreement to Resolve Objection to Cure Notice, dated October 29, 2009, between General Motors company and Remy Inc. | S-1/A | EX-10.5 | 5/25/2011 | |
| 10.6 |
| Form of Indemnification Agreement | S-1/A | EX-10.6 | 5/25/2011 | |
| 10.7 |
| Description of Directors’ Compensation | S-1/A | EX-10.7 | 5/25/2011 | |
| 10.8 |
| Form of Restricted Stock Award Agreement used for grants in 2007 and 2008 | S-1/A | EX-10.8 | 5/25/2011 | |
| 10.9 |
| Remy International, Inc. 2010 Long-Term Incentive Cash Bonus Plan | S-1/A | EX-10.9 | 5/25/2011 | |
| 10.10 |
| Form of Remy International, Inc. 2010 Annual Incentive Bonus Plan | S-1/A | EX-10.10 | 5/25/2011 | |
| 10.11 |
| Form of Remy International, Inc. 2011 Annual Incentive Bonus Plan | S-1/A | EX-10.11 | 5/25/2011 | |
| 10.12 |
| Remy International, Inc. Annual Incentive Bonus Plan | S-1/A | EX-10.12 | 5/25/2011 | |
| 10.13 |
| Remy International, Inc. Deferred Compensation Plan, effective December 30, 2008 | S-1/A | EX-10.13 | 5/25/2011 | |
| 10.14 |
| Remy International, Inc. Supplemental Executive Retirement Plan, effective January 1, 2009 | S-1/A | EX-10.14 | 5/25/2011 | |
| 10.15 |
| Amended and Restated Employment Agreement, effective as of August 1, 2010, by and between Remy International, Inc. and John H. Weber | S-1/A | EX-10.15 | 5/25/2011 | |
| 10.16 |
| Amended and Restated Employment Agreement, effective as of August 1, 2010, by and between Remy International, Inc. and Fred Knechtel | S-1/A | EX-10.16 | 5/25/2011 | |
| 10.17 |
| Amended and Restated Employment Agreement, effective as of August 1, 2010, by and between Remy International, Inc. and John J. Pittas | S-1/A | EX-10.17 | 5/25/2011 | |
| 10.18 |
| Employment Agreement - Shawn Pallagi | 8-K | EX-10.1 | 1/7/2013 | |
| 10.19 |
| Second Amended and Restated Employment Agreement, effective as of August 1, 2010, by and between Remy International, Inc. and Gerald T. Mills | S-1/A | EX-10.19 | 5/25/2011 | |
| 10.20 |
| Employment Agreement, effective as of April 9, 2012, by and between Remy International, Inc. and Mark McFeely. | S-1/A | EX-10.20 | 9/21/2012 | |
| 10.21 |
| Remy International, Inc. Omnibus Incentive Plan | S-1/A | EX-10.21 | 5/25/2011 | |
| 10.22 |
| Form of Notice of Restricted Stock Grant for Directors and Restricted Stock Award Agreement under the Remy International, Inc. Omnibus Incentive Plan | S-1/A | EX-10.22 | 5/25/2011 | |
| 10.23 |
| Form of Notice of Restricted Stock Grant for Employees and Restricted Stock Award Agreement under the Remy International, Inc. Omnibus Incentive Plan | S-1/A | EX-10.23 | 5/25/2011 | |
| 10.24 |
| Accommodation Agreement, dated as of July 30, 2007, between Remy Inc. and General Motors Corporation | S-1/A | EX-10.24 | 3/8/2012 | |
| 10.25 |
| Amendment to Second Amended and Restated Employment Agreement, effective as of January 10, 2012, by and between Remy International, Inc. and John J. Pittas | S-1/A | EX-10.25 | 9/21/2012 | |
| 10.26 |
| Employee Stock Purchase Plan of Remy International, Inc., dated as of September 11, 2012 | S-1/A | EX-10.26 | 9/21/2012 | |
| 21.1 |
| Subsidiaries of the registrant | | | | X |
| 23.1 |
| Consent of Ernst & Young LLP, independent registered public accounting firm | | | | X |
|
| | | | | | |
| 31.1 |
| Certification of Chief Executive Officer pursuant to Section 302 of the Sarbanes-Oxley Act of 2002 | | | | X |
| 31.2 |
| Certification of Chief Financial Officer pursuant to Section 302 of the Sarbanes-Oxley Act of 2002 | | | | X |
| 32.1 |
| Certification by Chief Executive Officer of Periodic Financial Reports pursuant to Section 906 of the Sarbanes-Oxley Act of 2002, 18 U.S.C. Section 1350 | | | | X |
| 32.2 |
| Certification by Chief Financial Officer of Periodic Financial Reports pursuant to Section 906 of the Sarbanes-Oxley Act of 2002, 18 U.S.C. Section 1350 | | | | X |
| 101.INS* |
| XBRL Instance Document | | | | X |
| 101.SCH* |
| XBRL Taxonomy Extension Schema Document | | | | X |
| 101.CAL* |
| XBRL Taxonomy Extension Calculation Linkbase Document | | | | X |
| 101.LAB* |
| XBRL Taxonomy Extension Label Linkbase Document | | | | X |
| 101.PRE* |
| XBRL Taxonomy Extension Presentation Linkbase Document | | | | X |
| 101.DEF* |
| XBRL Taxonomy Extension Definition Linkbase Document | | | | X |
|
| |
| * | Pursuant to Rule 406T of Regulation S-T, these interactive data files are deemed not filed or part of a registration statement or prospectus for purposes of Sections 11 or 12 of the Securities Act of 1933, as amended, are deemed not filed for purposes of Section 18 of the Securities Exchange Act of 1934, as amended, and otherwise are not subject to liability under those sections. |
Signatures
Pursuant to the requirements of Section 13 or 15(d) of the Securities Exchange Act of 1934, the registrant has duly caused this report to be signed on its behalf by the undersigned, thereunto duly authorized.
|
| | |
| REMY INTERNATIONAL, INC. |
| By: | /S/ JOHN H. WEBER |
| | John H. Weber |
| | Chief Executive Officer |
Pursuant to the requirements of the Securities Exchange Act of 1934, this report has been signed below by the following persons on behalf of the registrant and in the capacities and on the dates indicated.
|
| | |
| Signature | Title | Date |
| | | |
/S/ JOHN H. WEBER John H. Weber | Chief Executive Officer and Director (principal executive officer) | February 26, 2013 |
/S/ FRED KNECHTEL Fred Knechtel | Senior Vice President and Chief Financial Officer (principal financial and accounting officer) | February 26, 2013 |
/S/ William P. Foley, II William P. Foley, II | Director | February 26, 2013 |
/S/ Alan L. Stinson Alan L. Stinson | Director | February 26, 2013 |
/S/ Brent B. Bickett Brent B. Bickett | Director | February 26, 2013 |
/S/ Lawrence F. Hagenbuch Lawrence F. Hagenbuch | Director | February 26, 2013 |
/S/ George P. Scanlon George P. Scanlon | Director | February 26, 2013 |
/S/ Norman Stout Norman Stout | Director | February 26, 2013 |
/S/ Douglas K. Ammerman Douglas K. Ammerman | Director | February 26, 2013 |