Family of Fine Beverages 4-7/April/2005
Forward Looking Statements
This presentation contains forward-looking statements within the meaning of the Private Securities Litigation Reform Act of 1995. Forward-looking statements involve known and unknown risks and uncertainties that may cause the actual results, performance or achievements of the Company to be materially different from any future results, performance or achievements expressed or implied by forward-looking statements. Investors are cautioned that forward-looking statements are not guarantees of future performance and that undue reliance should not be placed on such statements. The Company undertakes no obligation to publicly update or revise any forward-looking statements or to make any other forward-looking statements, whether as a result of new information, future events or otherwise, unless required to do so by the securities laws. Investors are referred to the full discussion of risks and uncertainties associated with forward-looking statements included in the Company’s Form 10-K for the fiscal year ended December 31, 2004, and other periodic reports filed with the Securities and Exchange Commission.
2
VISION / MISSION
VISION
To be a leader in the beverage manufacturing and distribution industry, by providing our customers with products of high value while maintaining integrity and family tradition.
MISSION
To attain long term growth through the production and distribution (in the local and export markets) of high quality beverages for the consumer, guided by our commitment to company values.
3
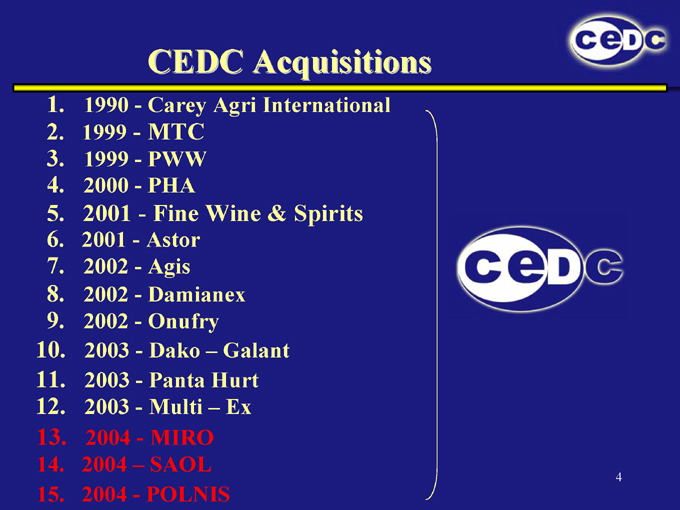
CEDC Acquisitions
1. 1990 - Carey Agri International
2. 1999 - MTC
3. 1999 - PWW
4. 2000 - PHA
5. 2001 - Fine Wine & Spirits
6. 2001 - Astor
7. 2002 - Agis
8. 2002 - Damianex
9. 2002 - Onufry
10. 2003 - Dako – Galant
11. 2003 - Panta Hurt
12. 2003 - Multi – Ex
13. 2004 - MIRO
14. 2004 – SAOL
15. 2004 - POLNIS
4
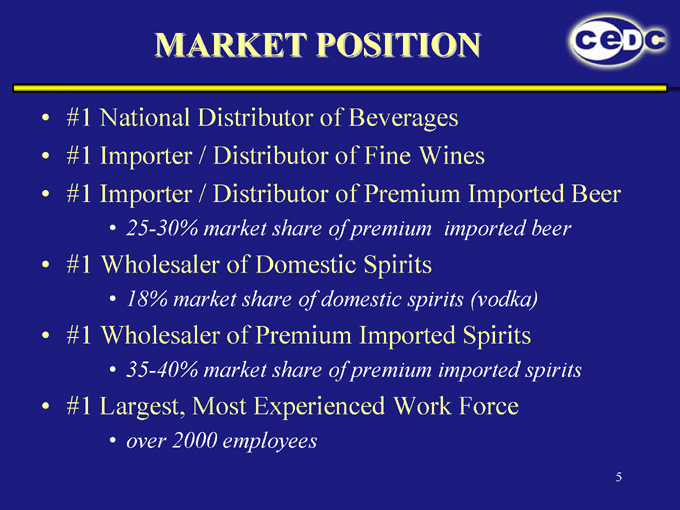
MARKET POSITION
#1 National Distributor of Beverages #1 Importer / Distributor of Fine Wines
#1 Importer / Distributor of Premium Imported Beer
25-30% market share of premium imported beer
#1 Wholesaler of Domestic Spirits
18% market share of domestic spirits (vodka)
#1 Wholesaler of Premium Imported Spirits
35-40% market share of premium imported spirits
#1 Largest, Most Experienced Work Force over 2000 employees
5
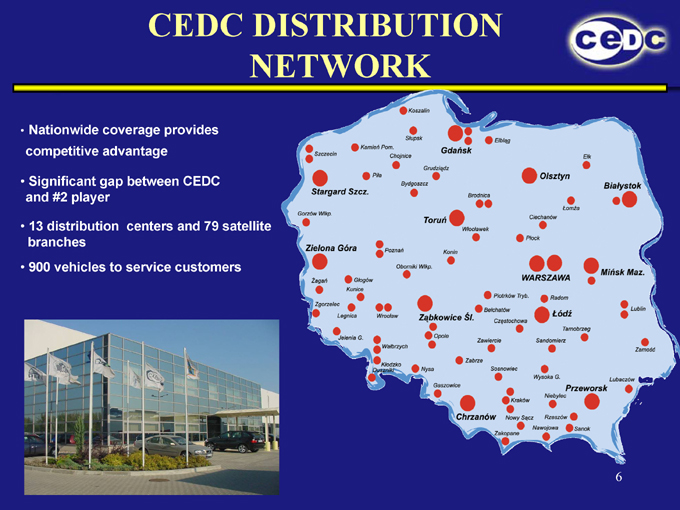
CEDC DISTRIBUTION
NETWORK
Nationwide coverage provides competitive advantage
Significant gap between CEDC and #2 player
13 distribution centers and 79 satellite branches
900 vehicles to service customers
Koszalin
Szczecin
Slupsk
Kamien Pom.
Chojnice
Gdansk
Elblag
Elk
Stargard Szcz.
Piła
Grudziadz
Bydgoszcz
Brodnica
Olsztyn
Białystok
Gorzów Wlkp.
Torun
Włocławek
Ciechanów
Łomza
Płock
Zielona Góra
Poznan
Konin
Zagan
Glogow
Oborniki Wlkp.
WARSZAWA
Minsk Maz.
Kunice
Zgorzelec
Legnica
Wroclaw
Zabkowice SI.
Piotrkow Tryb.
Belchatow
Czestochowa
Radom
Lodz
Lublin
Jelenia G.
Walbrzych
Opole
Zawiercie
Tarnobrzeg
Sandomierz
Zamosc
Klodzko
Duszniki
Nysa
Gaszowice
Zabrze
Sosnowiec
Krakow
Wysoka G.
Przeworsk
Niebylec
Lubaczow
Chrzanow
Nowy sacz
Rzeszow
Zakopane
Nawojowa
Sanok
6
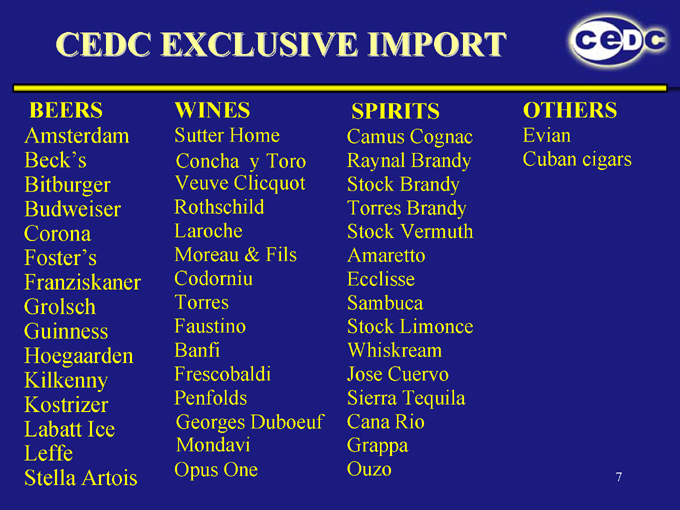
CEDC EXCLUSIVE IMPORT
BEERS
Amsterdam Beck’s Bitburger Budweiser Corona Foster’s Franziskaner Grolsch Guinness Hoegaarden Kilkenny Kostrizer Labatt Ice Leffe Stella Artois
WINES
Sutter Home Concha y Toro Veuve Clicquot Rothschild Laroche Moreau & Fils Codorniu Torres Faustino Banfi Frescobaldi Penfolds Georges Duboeuf Mondavi Opus One
SPIRITS
Camus Cognac
Raynal Brandy
Stock Brandy
Torres Brandy
Stock Vermuth
Amaretto
Ecclisse
Sambuca
Stock Limonce
Whiskream
Jose Cuervo
Sierra Tequila
Cana Rio
Grappa
Ouzo
OTHERS
Evian Cuban cigars
7
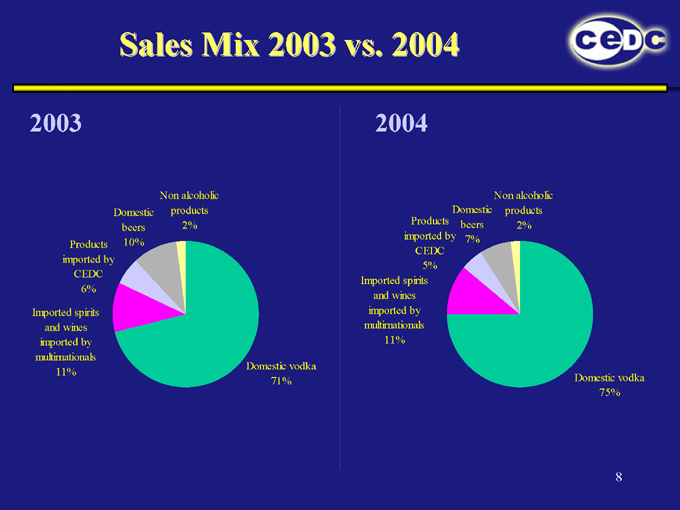
Sales Mix 2003 vs. 2004
2003
Non alcoholic products 2%
Domestic beers 10%
Products imported by CEDC
6%
Imported spirits and wines imported by multirnationals 11%
Domestic vodka 71%
2004
Non alcoholic products 2%
Domestic beers 7%
Products imported by CEDC
5%
Imported spirits and wines imported by multirnationals 11%
Domestic vodka 75%
8
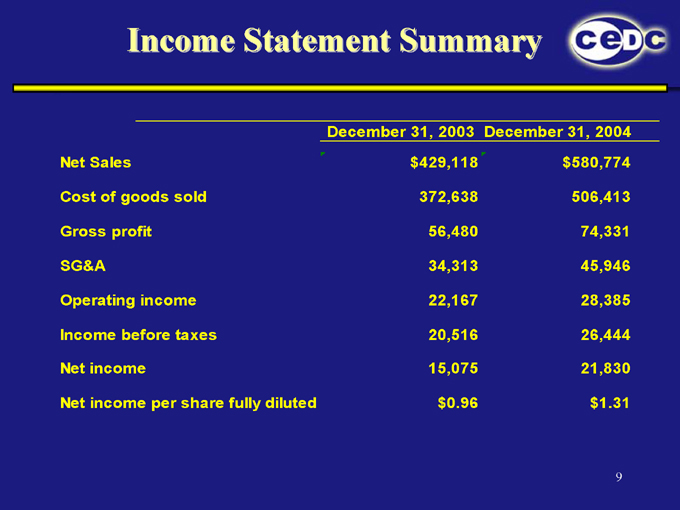
Income Statement Summary
December 31, 2003 December 31, 2004
Net Sales $429,118 $580,774
Cost of goods sold 372,638 506,413
Gross profit 56,480 74,331
SG&A 34,313 45,946
Operating income 22,167 28,385
Income before taxes 20,516 26,444
Net income 15,075 21,830
Net income per share fully diluted $0.96 $1.31
9
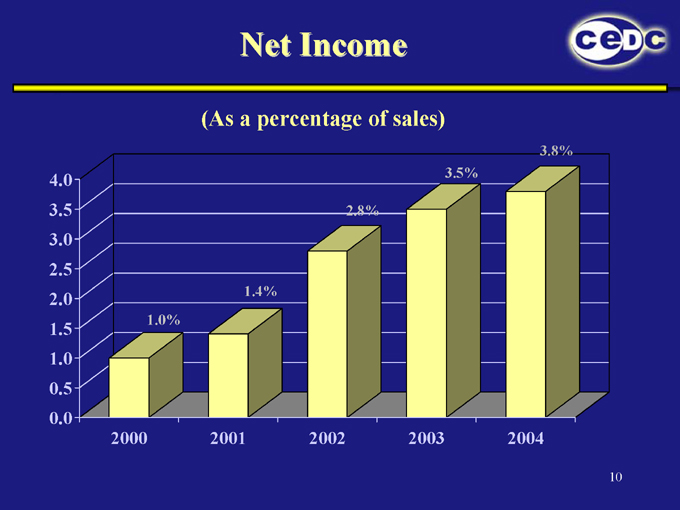
Net Income
(As a percentage of sales)
4.0
3.5
3.0
2.5
2.0
1.5
1.0
0.5
0.0
2000 2001 2002 2003 2004
3.8%
3.5%
2.8%
1.4% 1.0%
10
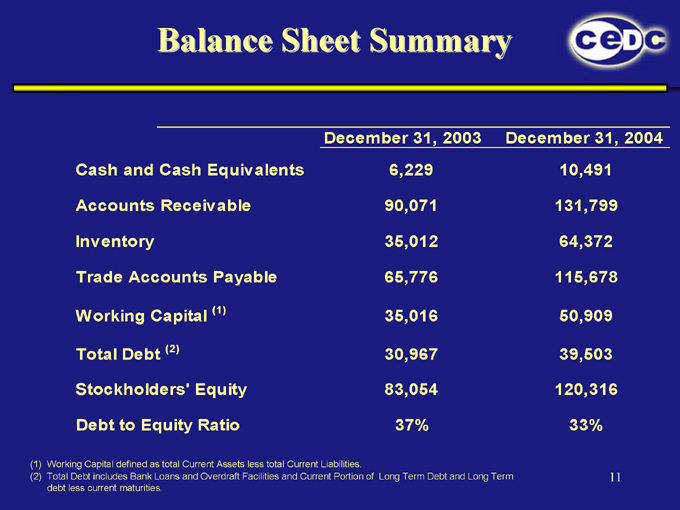
Balance Sheet Summary
December 31, 2003 December 31, 2004
Cash and Cash Equivalents 6,229 10,491
Accounts Receivable 90,071 131,799
Inventory 35,012 64,372
Trade Accounts Payable 65,776 115,678
Working Capital (1) 35,016 50,909
Total Debt (2) 30,967 39,503
Stockholders’ Equity 83,054 120,316
Debt to Equity Ratio 37% 33%
(1) Working Capital defined as total Current Assets less total Current Liabilities.
(2) Total Debt includes Bank Loans and Overdraft Facilities and Current Portion of Long Term Debt and Long Term debt less current maturities.
11
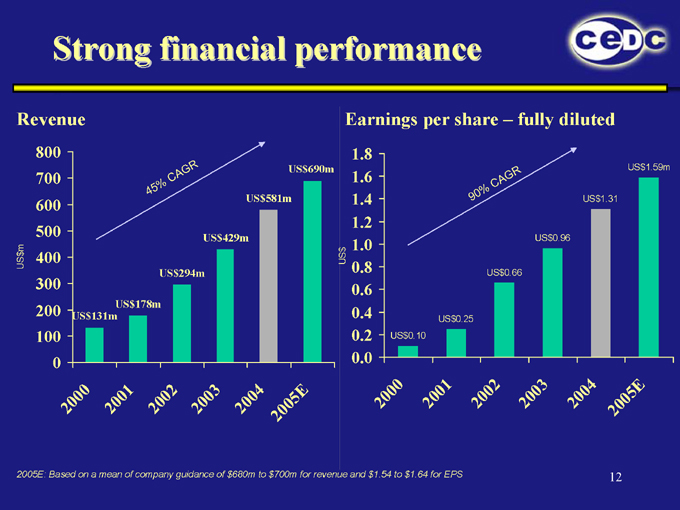
Strong financial performance
Revenue
US$m
800 700 600 500 400 300 200 100 0
45% CAGR
US$178m US$131m
US$429m
US$294m
US$690m
US$581m
2000
2001
2002
2003
2004
2005E
Earnings per share – fully diluted
US$
1.8
1.6
1.4
1.2
1.0
0.8
0.6
0.4
0.2
0.0
90% CAGR
US$0.25 US$0.10
US$0.96
US$0.66
US$1.59m
US$1.31
2000
2001
2002
2003
2004
2005E
2005E: Based on a mean of company guidance of $680m to $700m for revenue and $1.54 to $1.64 for EPS
12
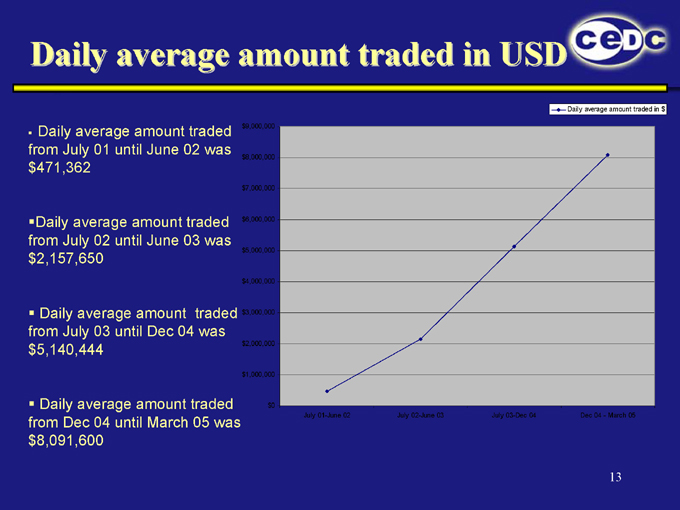
Daily average amount traded in USD
Daily average amount traded in $
Daily average amount traded from July 01 until June 02 was $471,362
Daily average amount traded from July 02 until June 03 was $2,157,650
Daily average amount traded from July 03 until Dec 04 was $5,140,444
Daily average amount traded from Dec 04 until March 05 was $8,091,600 $9,000,000 $8,000,000 $7,000,000 $6,000,000 $5,000,000
$4,000,000
$3,000,000
$2,000,000
$1,000,000
$0
July 01-June 02 July 02-June 03 July 03-Dec 04 Dec 04—March 05
13
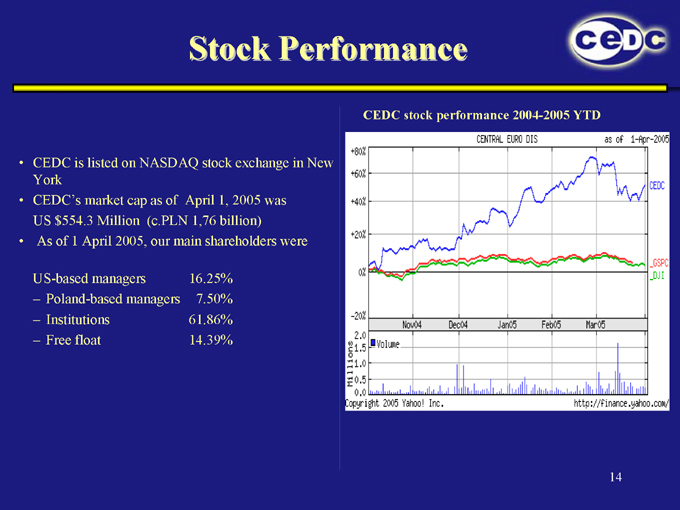
Stock Performance
CEDC is listed on NASDAQ stock exchange in New York CEDC’s market cap as of April 1, 2005 was US $554.3 Million (c.PLN 1,76 billion) As of 1 April 2005, our main shareholders were
US-based managers 16.25%
– Poland-based managers 7.50%
– Institutions 61.86%
– Free float 14.39%
CEDC stock performance 2004-2005 YTD
+80%
CENTRAL EURO DIS
as of 1-Apr-2005
+60%
+4O%
+20%
0%
CEDC
_GSPC
_DJI
-20%
millions
2.0 1.0 0.5 1.5
0.0
Nov04 Dec04 Jan05 Feb05 Mar05
http://finance.yahoo.com/
Volume
Copyright 2005 Yahoo! Inc.
14
2005 Investment Plan
Investment in state-owned and privately-owned distilleries in Poland
Leverage existing distribution infrastructure, i.e. Brand ownership Develop new brands through distribution platform Develop export opportunities Control our destiny
Acquire production that is accretive to first year annualized earnings
Finance through a combination of debt/equity (primarily debt)
Continue investment in distribution to increase market share $80-$100 million in net sales on annualized basis
Finance through own funds
15
Three Year Plan
To be the market leader in distribution and production of alcoholic beverages through continued acquisition of distribution companies and acquisition of leading production assets/brands in Poland
Continue consolidation of Branch Infrastructure
Continue development of software platform
Achieve and maintain 20% annual growth of high margin import portfolio
16
Family of Fine Beverages