 1 CEDC Central European Distribution Corporation CEDC Investor Presentation Exhibit 99.1 |
 2 Forward Looking Statements This presentation contains forward-looking statements within the meaning of the Private Securities Litigation Reform Act of 1995. These statements include, without limitation, predictions and guidance relating to CEDC’s future financial and operating performance, brand and product category diversity, market share and customer demand for CEDC’s products. Forward-looking statements involve known and unknown risks and uncertainties that may cause the actual results, performance or achievements of CEDC to be materially different from any future results, performance or achievements, expressed or implied, by forward-looking statements. Investors are cautioned that forward-looking statements are not guarantees of future performance and that undue reliance should not be placed on such statements. CEDC undertakes no obligation to publicly update or revise any forward-looking statements or to make any other forward- looking statements, whether as a result of new information, future events or otherwise unless required to do so by the securities laws. Investors are referred to the full discussion of risks and uncertainties included in CEDC’s Form 10-K for the fiscal year ended December 31, 2006, and in other periodic reports filed by CEDC with the Securities and Exchange Commission. |
 3 Who is CEDC? • Central Europe’s largest spirits company and one of the world’s largest vodka producers • Originally founded in 1990 • Poland’s leading importer and the largest distributor of alcoholic beverages • Operates largest nationwide next-day alcoholic beverage delivery service with 16 distribution centers and 76 satellite branches located throughout Poland • International expansion started in 2006 with the purchase of Bols Hungary • NASDAQ listed since 1998, market capitalisation of approximately US$1.1bn • Warsaw Stock Exchange listed since December 2006 • Large free float (approximately 75%) and trading volumes ( US $8m daily) |
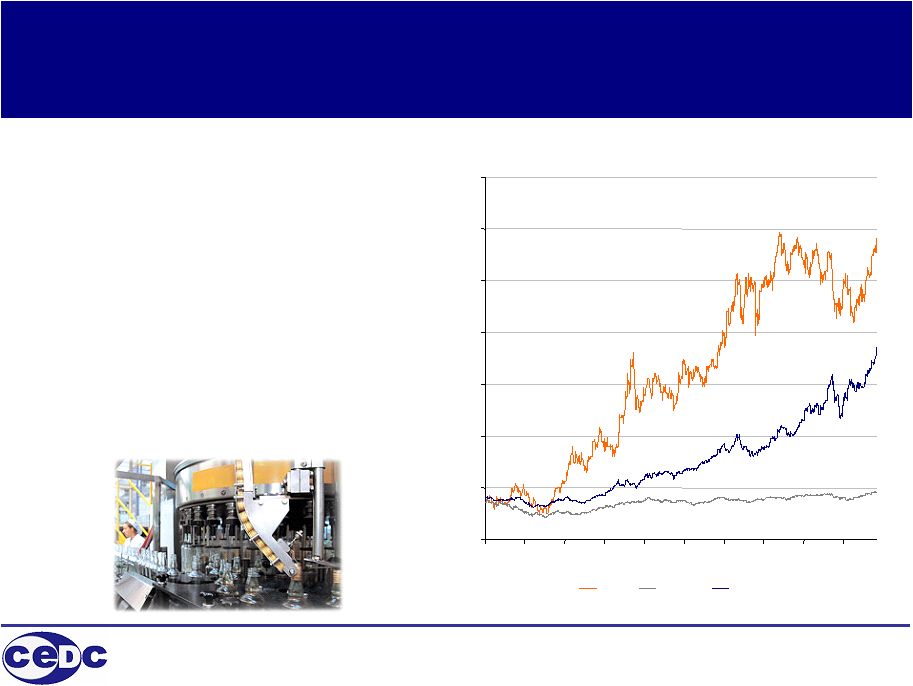 4 Who is CEDC? (cont’d) • Distributes over 700 brands of alcoholic beverages - Polish vodka - imported spirits - imported wines - Polish and imported beers • Over 3,200 employees - 700 in production - 2,500 in distribution in Poland - 55 in distribution in Hungary • Net Sales CAGR of 36% over the last five years • Earning per shares (EPS) CAGR of 80% over the last five years • Operating cash flow per share of US$1.98 for the twelve months ending December 31, 2006 CEDC stock performance 2002-2006 0 5 10 15 20 25 30 35 Jan-02 Jul-02 Jan-03 Jul-03 Jan-04 Jul-04 Jan-05 Jul-05 Jan-06 Jul-06 CEDC Nasdaq WIG (US$) |
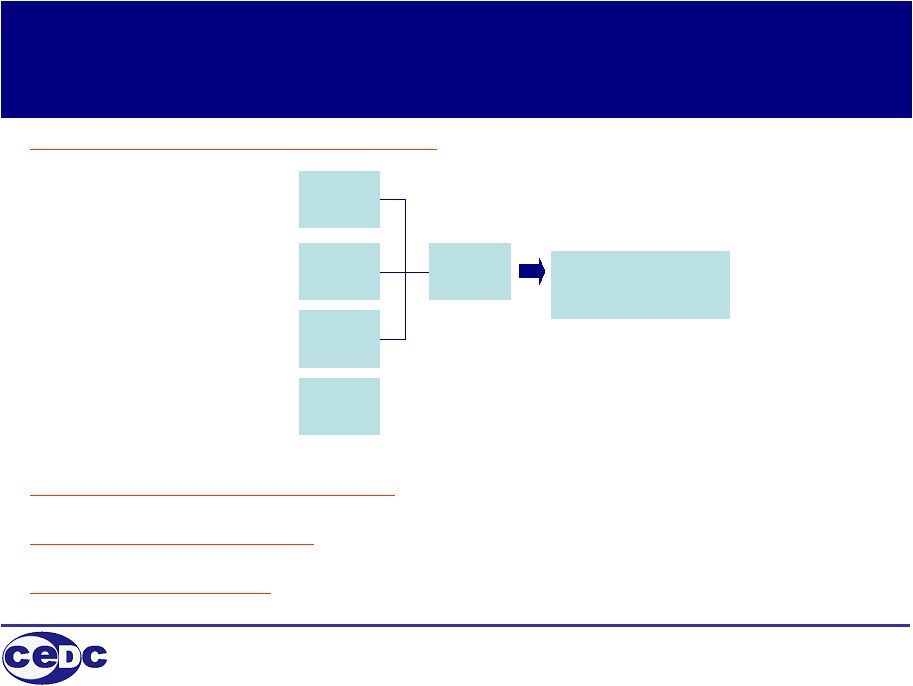
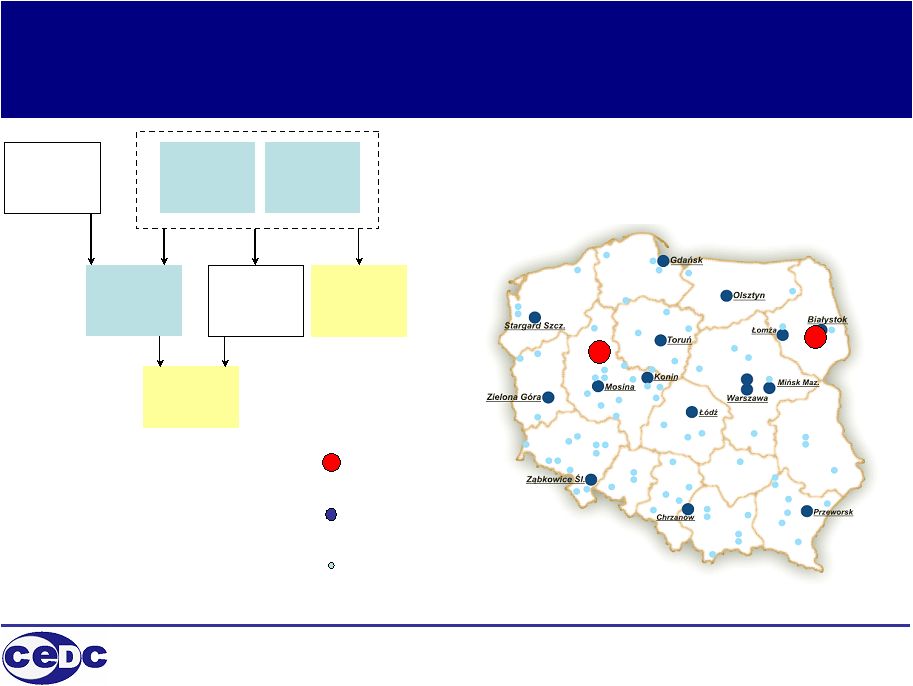 5 Our business model in Poland CEDC- owned brands Exclusive import brands Our sales and distribution network 3 rd Party Wholesalers Retail outlets 3 rd party suppliers Key Accounts Distilleries Distribution centers Satellite branches |
 6 Direct distribution gives us a competitive edge Challenges to overcome • Poor road infrastructure • No print and media advertising allowed for spirits • Fragmented retail • New restrictive laws for expansion of large retail outlets CEDC has the largest and most effective sales and distribution platform in alcoholic beverages with national footprint serving over 40,000 outlets direct through 700 sales people Solution – win battle at the point of sale • Retail shelf - merchandising - price point • Bar • Restaurant • Club |
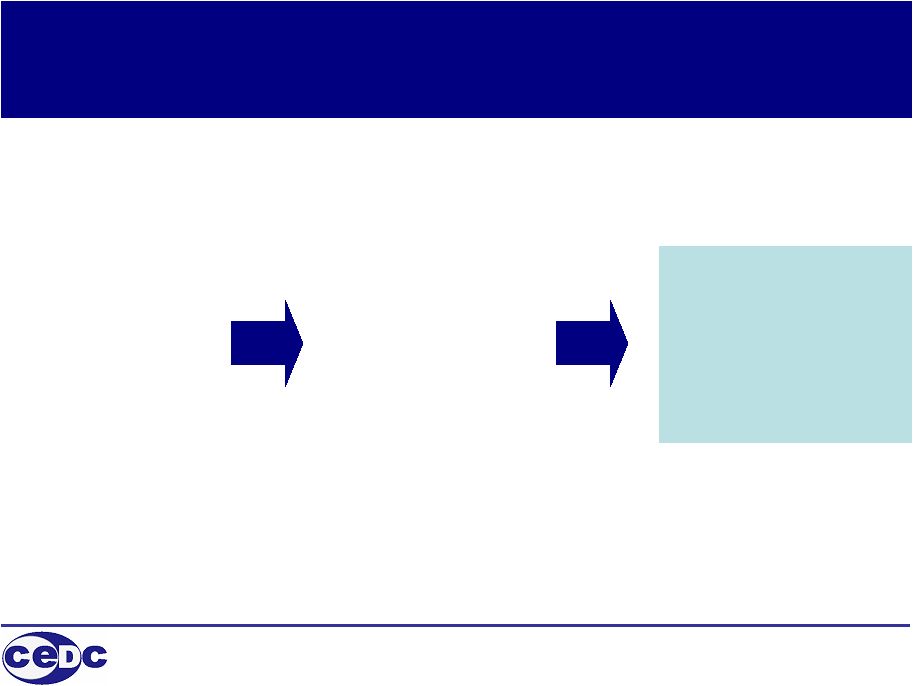
 7 Growth with Margin Expansion • Expand sales of higher margin products - CEDC brands - exclusive import brands - Exports • Target opportunities outside Poland • Reduce costs of goods sold • Reduce operating costs CEDC Owned Brands CEDC Agency Brands CEDC Export Brands 3rd Party Distribution Develop sales growth of higher margin products Higher margin products |
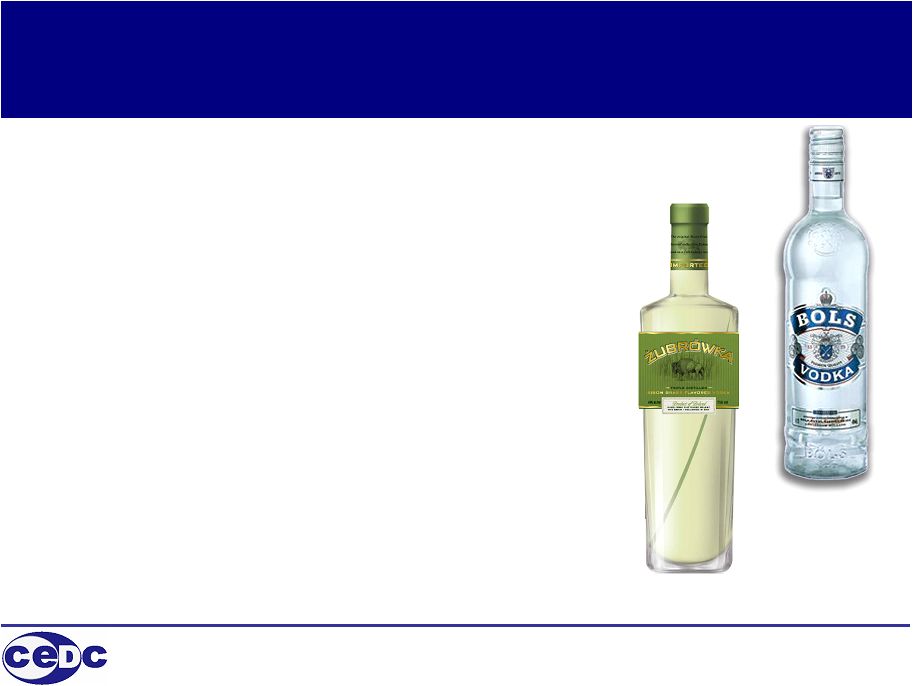
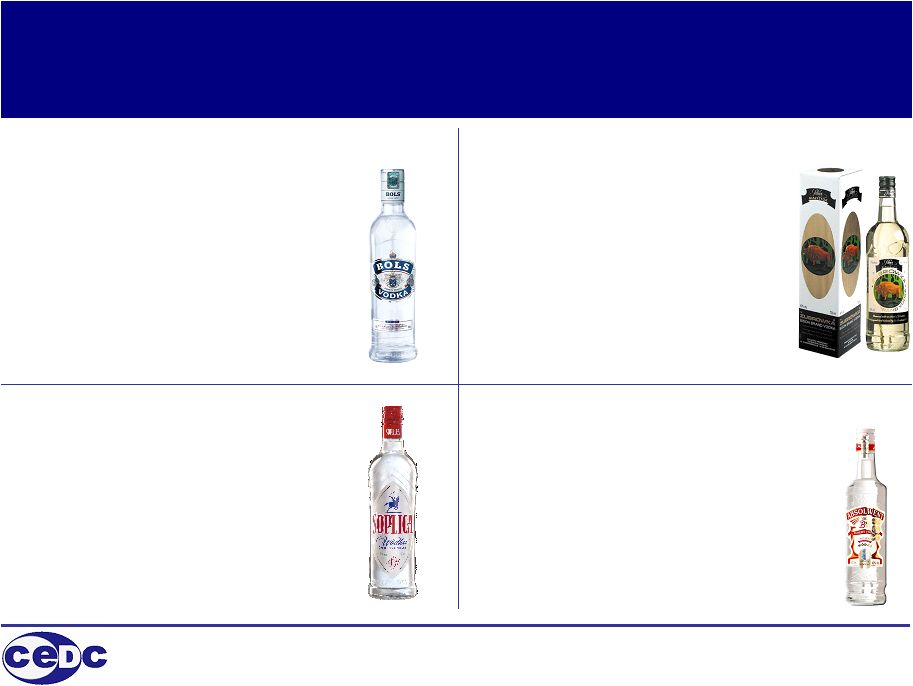 8 Our top brands Bols Vodka • #1 Premium Vodka in Poland and Hungary by value • Sales of more than 1.5 million cases Zubrówka • Leading brand for export • Strongly connected with tradition and Polish culture • Considered one of the top icons of Poland • Approaching 1 million cases sold in 2006 • Pricing upside opportunities • New domestic and export package to be launched in 2007 Soplica • One of the oldest vodka brands in Poland • Associated with Polish nobility and heritage • Currently starting export to other markets • Over 1 million cases sold in 2006 Absolwent • One of the top 10 selling vodka brands in the world • High quality at a reasonable price • Brand has continued to outperform the category • Positioned in the mainstream • Over 4 million cases sold in 2006 Most profitable brand in Poland Fastest growing brand (*) (*) excluding economy segment #1 Brand Equity in Poland #1 Vodka in Poland for last 7 years |
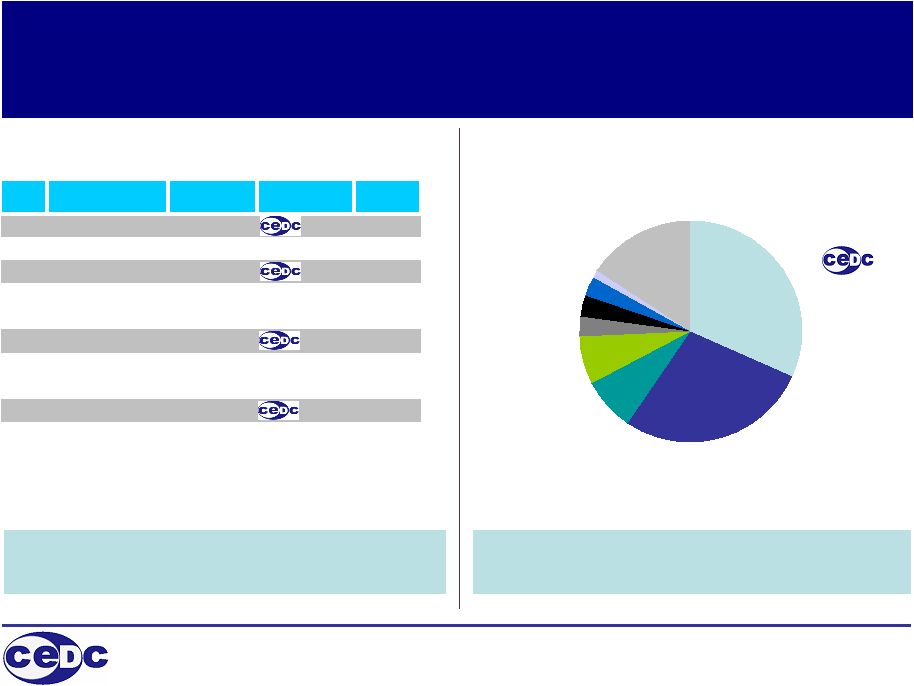 9 Accelerate growth of our own brands Market shares for key brands by value Vodka producers market share by value Leverage market position for further market share gains 94% of spirits sold in Poland are vodka Other 1% Brown Forman 3% Pernod 3% Diageo 3% 32% State owned 15% Vin & Spirit 7% Polmos Lublin 10% Sobieski 27% Rank Brand Segment Producer Value Share 1 Absolwent Mainstream 14.5% 2 Starogardzka Econony Sobieski 9.1% 3 Bols Premium 6.0% 4 Gorzka Zoladkowa Mainstream Polmos Lublin 5.7% 5 Sobieski Premium Sobieski 5.3% 6 Soplica Mainstream 4.6% 7 Luksusowa Mainstream Vin & Spirit 4.0% 8 Krakowska Econony Sobieski 3.5% 9 Zubrowka Mainstream 3.4% 10 Smirnoff Mainstream Diageo 2.8% |
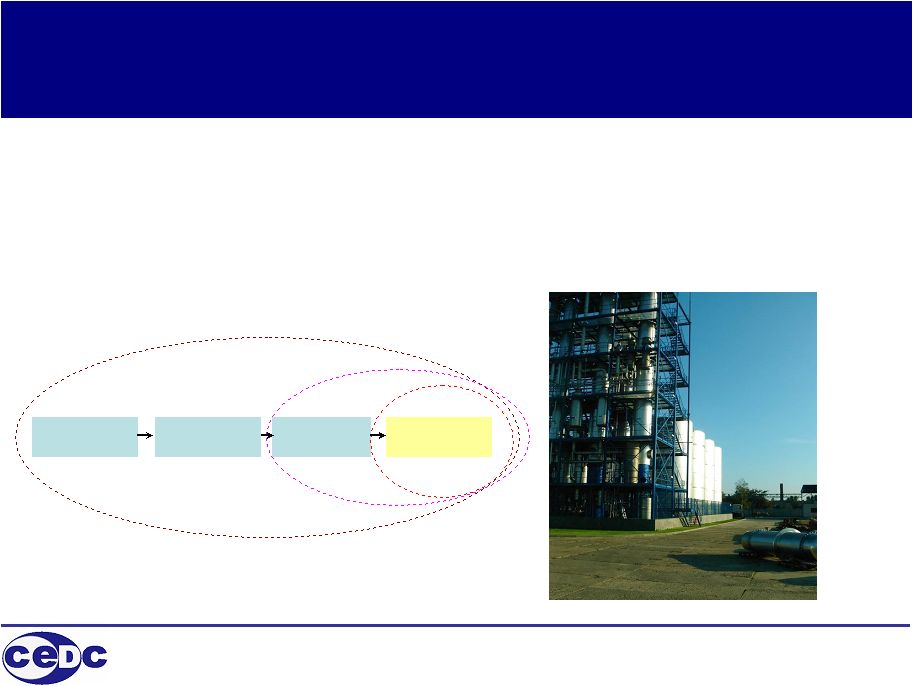 10 Reduce costs of goods sold Leverage purchasing power to reduce cost of raw materials • Largest spirit purchaser in Poland • Purchase over 120 million each of bottles, caps and labels per year • Build rectified spirit plant by mid 2007 at our two production sites • Backward integrate into distillation and potentially storage/production of grain Grain Rectified Spirit Vodka Currently Mid 2007 2008-2009 Raw spirit |
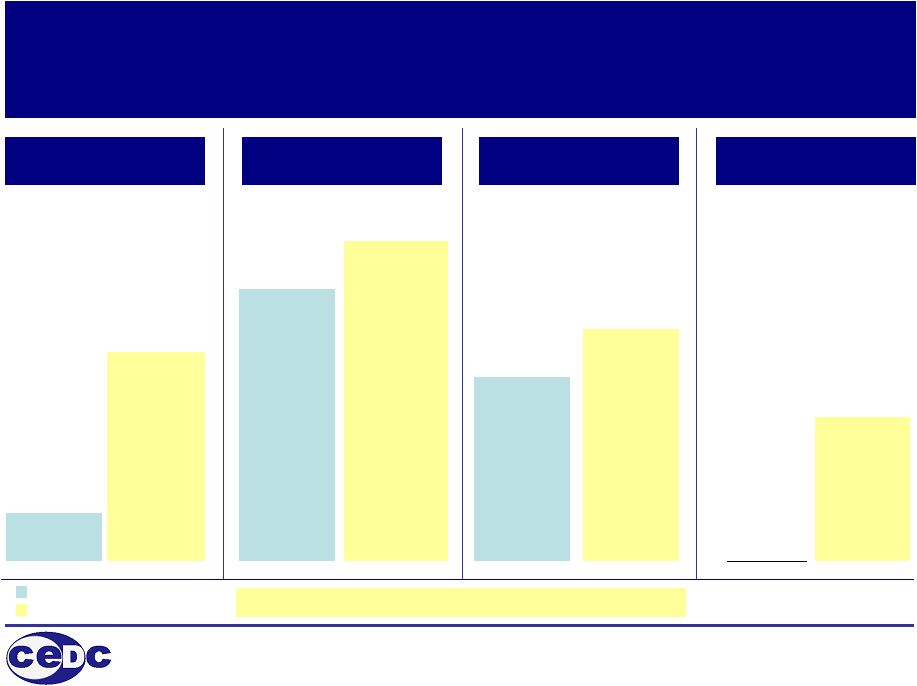 11 Growth strategies Super Premium – 5% of vodka market Premium – 21% of vodka market Mainstream – 41% of vodka market Economy – 33% of vodka market Boss Czysta Slaska Niagara 5% of category 35% of category by 2009 Abslowent Soplica Zubrowka 55% of category Growth of existing brands Brand acquisition Planned launch of new flavored vodka to compete with Zoladkowa Gorzka 65% of category by 2009 Bols Palace 36% of category 50% of category by 2009 30% of category by 2009 Total growth of market share from 32% today to 50% in 2009 Rectification and distillation to bring down COGS Aggressive expansion Existing brand growth Brand acquisitions Existing brand growth New brand launch planned in fall of 2007 Fastest growing category in Poland (+25%) Current market share Target 2009 market share |
 12 Reduce key operating overhead expenses • Combine purchasing power to reduce key SG&A costs - bank services - phone - fuel - administrative services • Continue to consolidate satellite branches - as road infrastructure improves, opportunities to reduce number of branches arise • Consolidate back office in 2008 - centralization of key back office areas such as A/R, A/P, accounting |
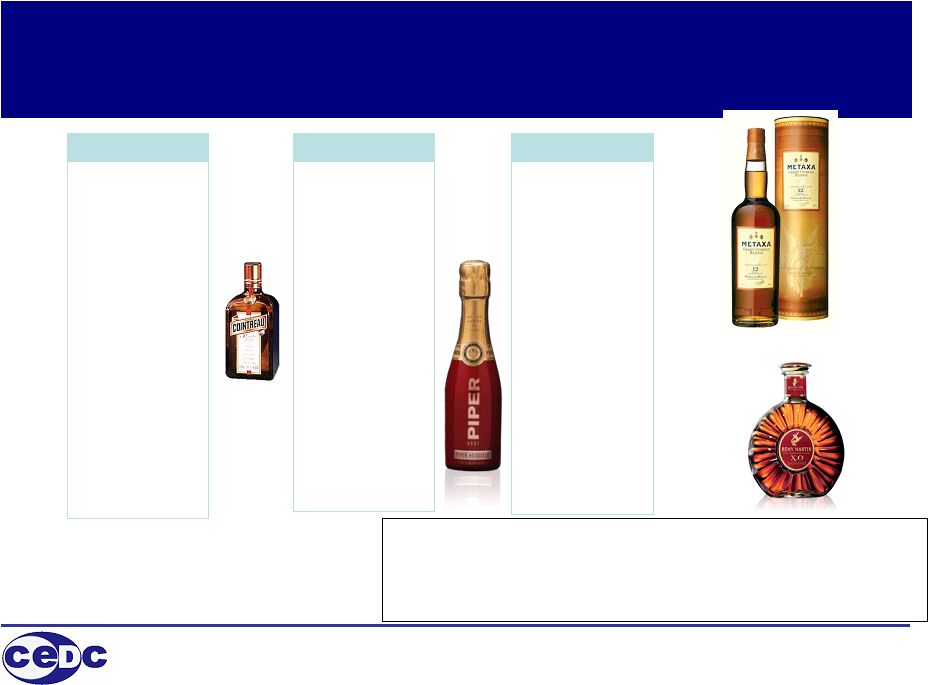 13 Expand higher margin import portfolio CEDC exclusive import portfolio Metaxa (1) Rémy Martin cognac Passoa Liqueur St. Rémy brandy Cointreau Liqueur Bols Liqueurs (1) Grant’s whisky Jim Beam bourbon (1) Jaegermeister bitter Camus Cognac Raynal Sierra (1) Teacher’s Sauza C&C (2) Disaronno Amaretto Spirits Notes: (1) Hold a leading position in their respective sectors (2) In Hungary only Above represents only partial selection of products imported by CEDC Amsterdam Bitburger Budweiser Corona Foster’s Franziskaner Grolsch Guinness Kilkenny Evian E&J Gallo wines (1) Sutter Home (1) Rosemount Rothschild Laroche Moreau & Fils Codorniu Torres Banfi Frescobaldi Penfolds Concha y Toro (1) Georges Duboeuf Piper Heidsieck Beers/Water Wines January 2007 – CEDC begins exclusive import of Campari portfolio into Poland: Campari, Cinzano, Old Smuggler Glen Grant, Skyy Vodka, Gran Cinzano and Cinzano Asti |
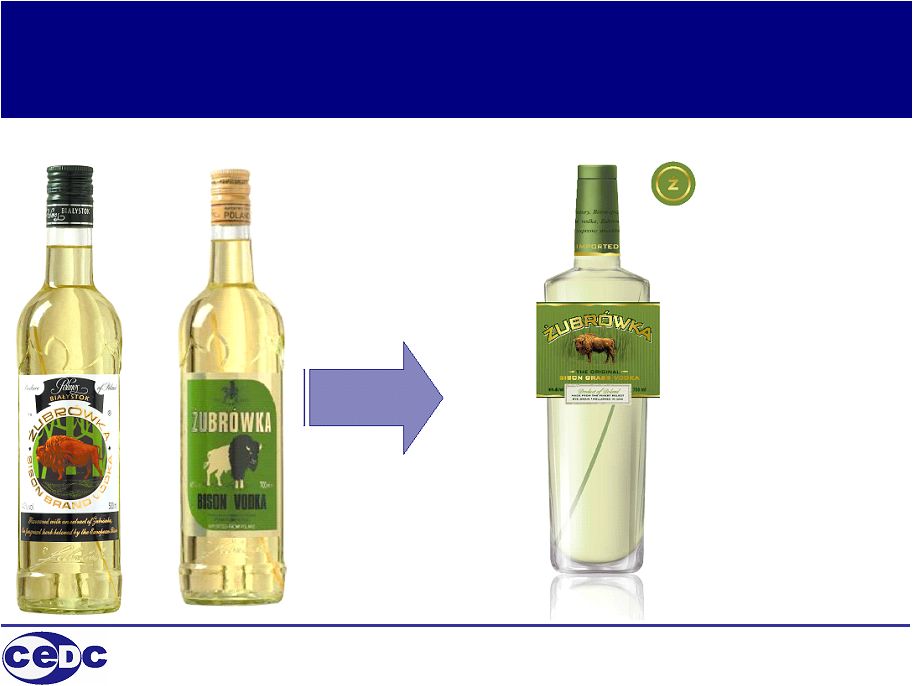 14 Expand higher margin export sales New export package developed to support development of Zubrowka as a premium product in export markets |
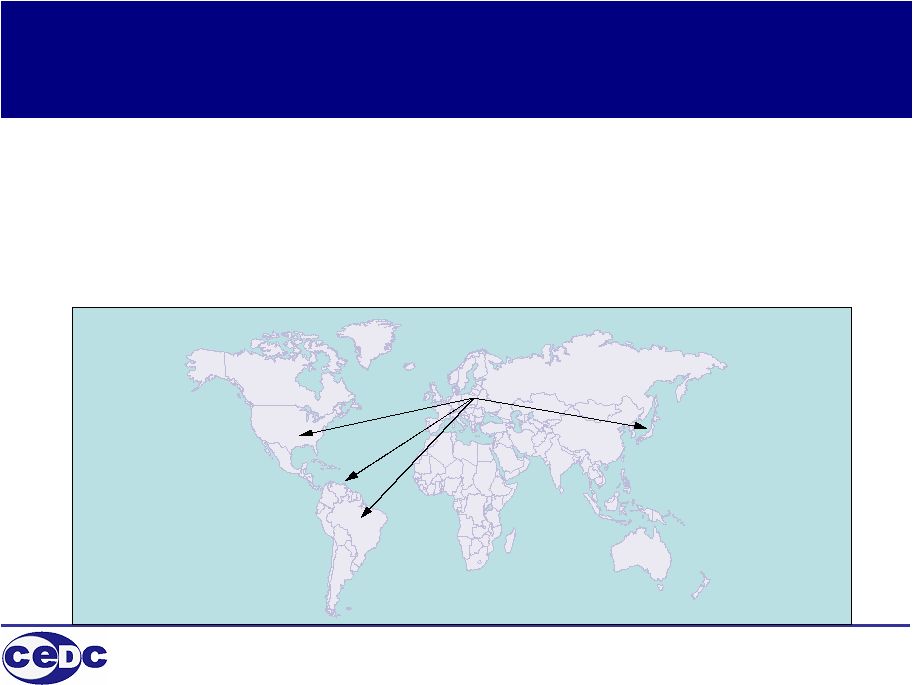 15 Expand higher margin export sales • Vodka represents the fastest growing category world wide • Grow Zubrowka exports to reach 750,000 cases within five years • Expand export sales of other brands to 200,000 cases within five years • Expand geographical reach of Zubrowka from current small base of countries |
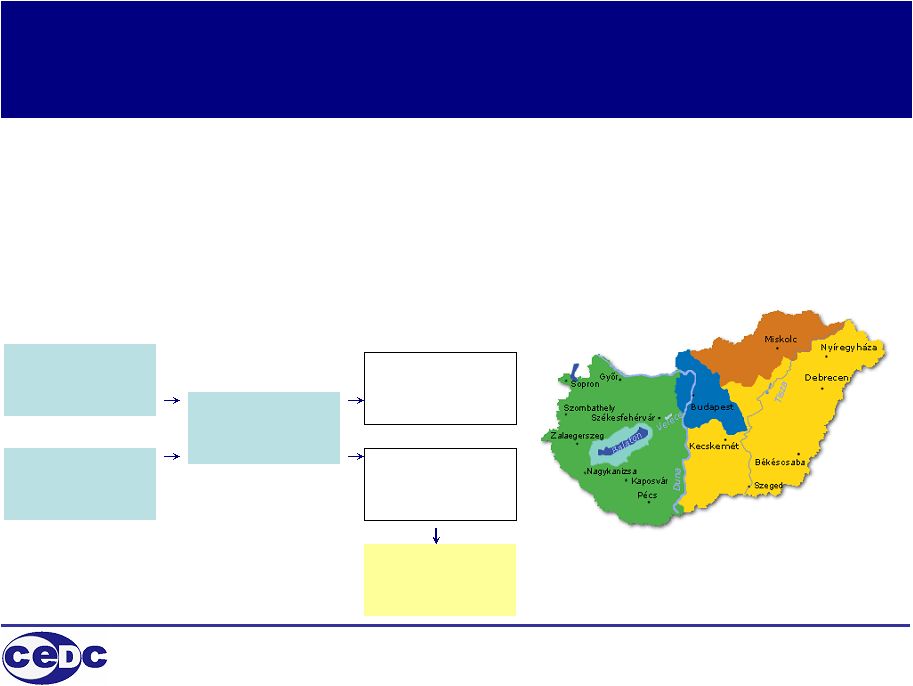 16 Bols Hungary – First step in International Expansion • With headquarters in Budapest our 100% owned subsidiary Bols Hungary is a leading importer and distributor of alcoholic beverages in Hungary • Owner of the number one vodka brand in Hungary – Royal Vodka - and number one premium vodka brand – Bols (both produced at our Bols Poland distillery) • Hungary is the 4 th largest market in the world for Jagermeister which is sold through Bols Hungary on an exclusive basis • Sales and Marketing team of 36 people CEDC brands produced in Poland Exclusive import brands for Hungary Bols Hungary Wholesalers Retail Key Accounts |
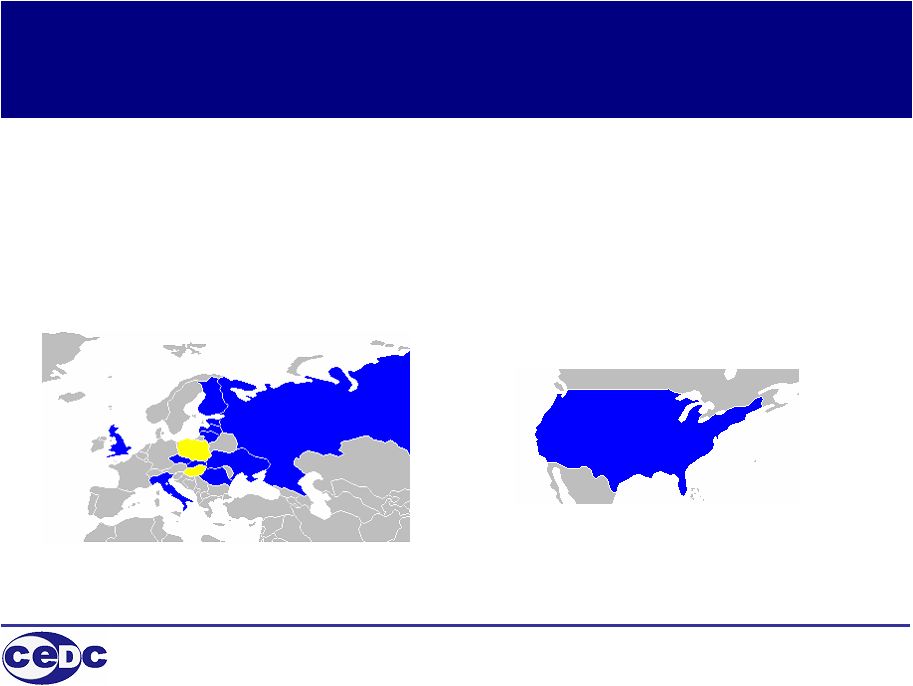 17 Target opportunities outside of Poland Roll out CEDC model to other countries in the region Look for opportunities in fast growing spirit markets like the US and the UK • Target companies with similar business model as CEDC • Leverage our know how and business relations to utilize in other markets |
 18 CEDC has delivered strong financial performance Notes: (1) Presented on a comparable basis excluding impact of FX on the senior secured notes and other one-off transactions. (2) Adjusted for Minority Interest For a reconciliation of EBITDA to earnings reported under United States Generally Accepted Accounting Principles (“GAAP”), please see the section “Unaudited Reconciliation of Non-GAAP Measures” at the end of this presentation 12 months (US$000's) 2003 2004 2005 2006 Guidance 2007 Net sales 429,118 580,744 749,415 944,108 1,050 – 1,100 Margin 56,480 74,331 122,047 198,387 Margin (%) 13% 13% 16% 21% Operating profit 22,167 28,385 51,642 91,582 Operating profit (%) 5% 5% 7% 10% EPS (1) 0.64 0.87 1.09 1.28 1.50 – 1.66 EBITDA (2) 24,235 31,992 55,909 101,440 Cash 6,229 10,491 60,745 159,362 Total assets 187,470 291,704 1,084,472 1,326,033 Total debt 30,441 37,396 394,322 418,098 Total equity 83,054 120,316 374,942 520,973 Operating cashflow (8,252) 8,861 34,081 71,691 |
 19 2007 Guidance • 2007 EPS of $1.50 to $1.66 per fully diluted share. • Revenue projection of $1.05 billion to $1.10 billion, an increase of approximately 15% as compared to 2006 • Organic sales growth of 12% (organic growth of 7% excluding forecasted currency impact) • Continued double digit growth of imports and exports • 7% volume growth of our of core vodka brands • Launch of new flavored vodka in 2007 • Growth of new import brands (Campari/Cinzano) • Expansion of gross margins to 21.5%, including net costs of approximately $4 million ($0.10 per fully diluted share), resulting from increased spirit prices and savings on new rectification facilities. • Increase in the percentage ownership of Polmos Bialystok and related financing costs. • Reduction in SG&A as a percentage of sales by approximately 0.25%. • Continued strong cash flow generation with improved liquidity ratios |
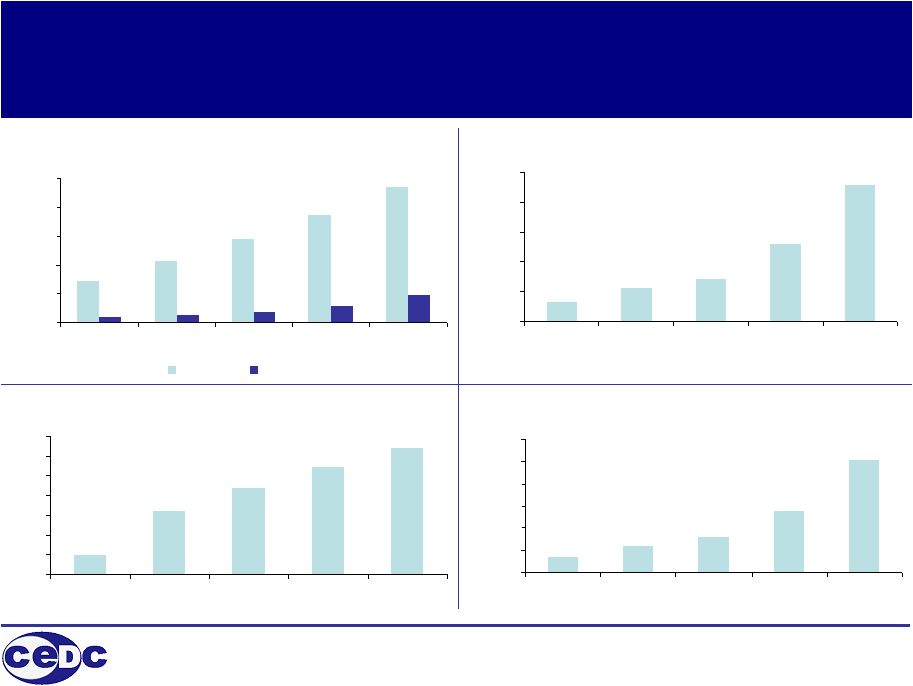 20 Selected ratios 0.0 200.0 400.0 600.0 800.0 1,000.0 2002 2003 2004 2005 2006 Net sales Margin 0 20,000 40,000 60,000 80,000 100,000 2002 2003 2004 2005 2006 0.00 0.20 0.40 0.60 0.80 1.00 1.20 1.40 2002 2003 2004 2005 2006 0 20,000 40,000 60,000 80,000 100,000 120,000 2002 2003 2004 2005 2006 Net sales and gross margin (US$000’s) Operating profit (US$000’s) EPS on a comparable basis (US$) EBITDA (US$000’s) |
 21 Summary GROWTH in emerging markets will continue to fuel increasing consumer demand for BRANDS CEDC is well positioned to EXPAND and GROW with these trends |
 22 UNAUDITED RECONCILIATION OF NON-GAAP MEASURES CEDC has disclosed in this presentation the non-GAAP measure EBITDA, adjusted for minority interest, on a historical basis. CEDC’s management believes that the non-GAAP reporting giving effect to the adjustments shown in the attached reconciliation provides meaningful information and an alternative presentation useful to investors' understanding of CEDC’s core operating results and trends. EBITDA, adjusted for minority interest represents GAAP earnings excluding interest, taxes, depreciation and amortization and other financial income and expenses, and adjusted for minority interest. EBITDA, adjusted for minority interest is presented because management believes it provides additional information with respect to the performance of CEDC. CEDC’s calculation of this measure may not be the same as similarly named measures presented by other companies. This measure is not presented as an alternative to net income computed in accordance with GAAP as a performance measure, and you should not place undue reliance on such measures. - 2003 2004 2005 2006 GAAP net income/(loss) 15,075 $ 21,830 $ 20,268 $ 55,450 $ Income tax 5,441 4,614 5,346 13,986 Net interest expense 1,500 2,115 15,828 31,750 Net other financial expense/(income) 92 19 7,678 (17,212) Depreciation and amortization 2,127 3,414 4,529 8,739 Minority interest - 2,261 8,727 EBITDA, adjusted for minority interest 24,235 $ 31,992 $ 55,910 $ 101,440 $ Change in working capital and accruals (26,744) (17,369) 6,357 9,975 Financing charges (1,592) (2,134) (23,506) (31,750) Non cash expenses 592 758 1,380 3,807 Tax adjustment (4,743) (4,386) (6,060) (11,781) Net cash provided by Operating Activities (8,252) $ 8,861 $ 34,081 $ 71,691 $ Twelve Months Ended Dec 31, |