Exhibit 99.1
Exhibit 99.1
CEDc Central European Distribution Corporation
CEDC Investor Presentation October 2007
1
Forward Looking Statements
This presentation contains forward-looking statements within the meaning of the Private Securities Litigation Reform Act of 1995. Forward-looking statements involve known and unknown risks and uncertainties, including, without limitation, economic and vodka consumption trends in Poland or other markets CEDC serves, risks arising from exchange rate and interest rate movements, CEDC’s ability to make and integrate acquisitions and CEDC’s ability to implement its business plan, that may cause the actual results, performance or achievements of CEDC to be materially different from any future results, performance or achievements, expressed or implied, by forward-looking statements. Forward looking statements are based on Managements current expectations and assessments of market and other conditions. Investors are cautioned that forward-looking statements are not guarantees of future performance and that undue reliance should not be placed on such statements. CEDC undertakes no obligation to publicly update or revise any forward-looking statements or to make any other forward-looking statements, whether as a result of new information, future events or otherwise unless required to do so by the securities laws. Investors are referred to the full discussion of risks and uncertainties included in CEDC’s Form 10-K and prospectus for the fiscal year ended December 31, 2006, and in other periodic and current reports filed by CEDC with the Securities and Exchange Commission.
2
Current Business Overview
Ongoing, strong economic trends in Poland continue to drive the premiumization of the wine and spirits market
Imported spirit market has grown year to date over 20% in 2007
Polish vodka market is up 7% in value year to date
2007 CEDC business objectives continue to be executed leading to a strong base for 2008
Strong organic growth of core business (17% organic sales growth in Q2 2007)
Successful launch of new flavored vodka brand — Zlota Gorzka
Numerous packaging changes driving positive volume development
Zubrowka new export packaging starting to roll out
Rectification project near completion
Expanding business operations to Russia
3
CEDC Core Brands in Poland
Our four core brands (Bols, Zubrowka, Soplica and Absolwent) delivering double digit growth year to date 2007
Bols Vodka up 20% after price adjustment in February 2007
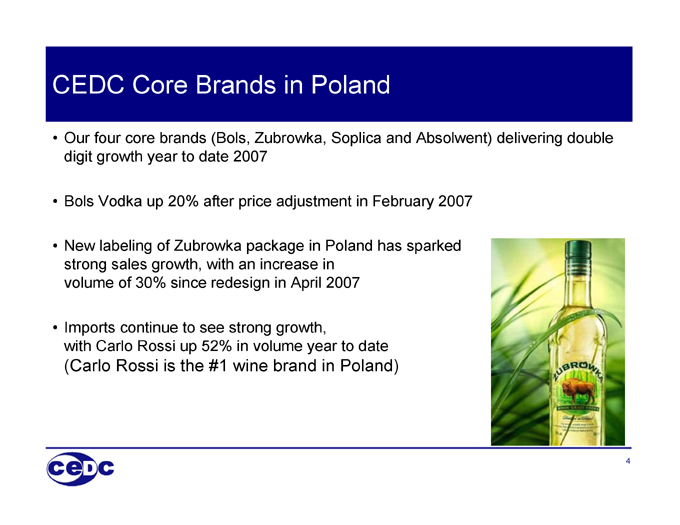
New labeling of Zubrowka package in Poland has sparked strong sales growth, with an increase in volume of 30% since redesign in April 2007
Imports continue to see strong growth, with Carlo Rossi up 52% in volume year to date (Carlo Rossi is the #1 wine brand in Poland)
4
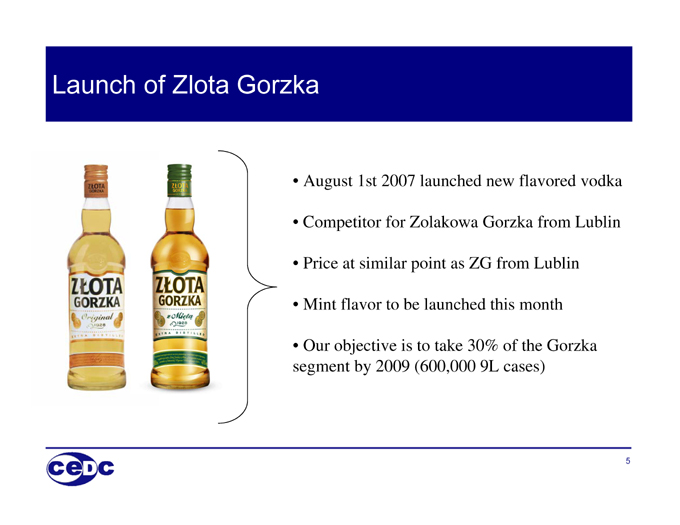
Launch of Zlota Gorzka
August 1st 2007 launched new flavored vodka
Competitor for Zolakowa Gorzka from Lublin
Price at similar point as ZG from Lublin
Mint flavor to be launched this month
Our objective is to take 30% of the Gorzka segment by 2009 (600,000 9L cases)
5
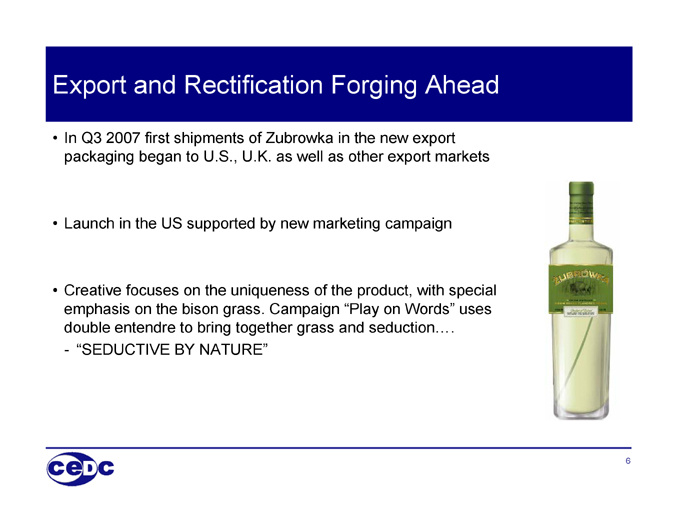
Export and Rectification Forging Ahead
In Q3 2007 first shipments of Zubrowka in the new export packaging began to U.S., U.K. as well as other export markets
Launch in the US supported by new marketing campaign
Creative focuses on the uniqueness of the product, with special emphasis on the bison grass. Campaign “Play on Words” uses double entendre to bring together grass and seduction….
- “SEDUCTIVE BY NATURE”
6
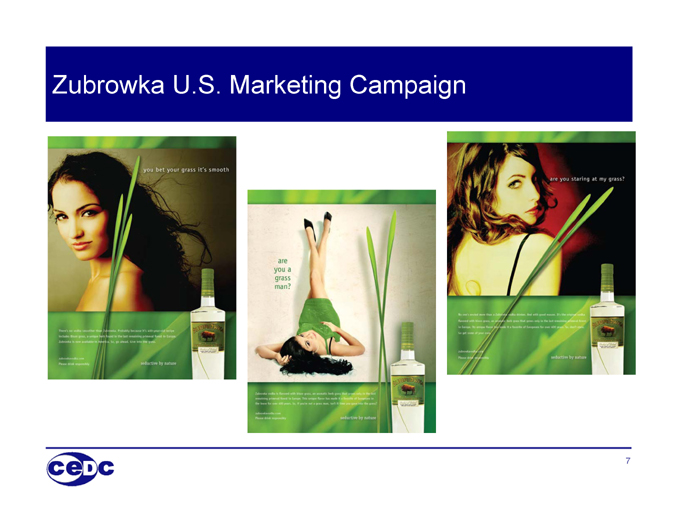
Zubrowka U.S. Marketing Campaign
7
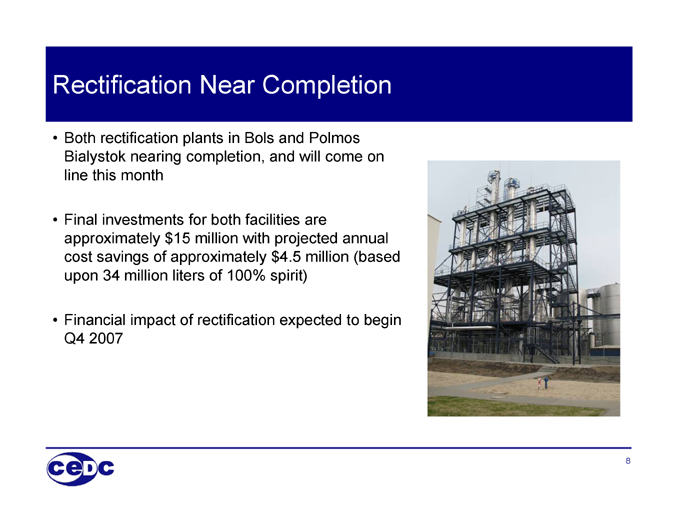
Rectification Near Completion
Both rectification plants in Bols and Polmos Bialystok nearing completion, and will come on line this month
Final investments for both facilities are approximately $15 million with projected annual cost savings of approximately $4.5 million (based upon 34 million liters of 100% spirit)
Financial impact of rectification expected to begin Q4 2007
8
Other Polish Acquisition Opportunities
V&S process provides an acquisition opportunity for CEDC in Poland to acquire Polmos Zielona Gora, a leading local producer
CEDC will be taking an active role in the process to bid for this business. The process is expected to close Q1-Q2 2008
Polmos Zielona Gora, owned by V&S, has a market share of approximately 7% in Poland through the Polska and Luksusowa brands
Luksusowa brand is a potato vodka which will provide a complimentary product to our grain based vodka portfolio
Combined portfolio would leave CEDC with an approximate 37% market share, which is below the typical Polish anti trust limits
Still looking at other wholesalers that would fill distribution gaps
Evaluating niche brands that are still State owned in Poland that would provide a good fit with our portfolio
9
Russian and Ukrainian Expansion Strategy
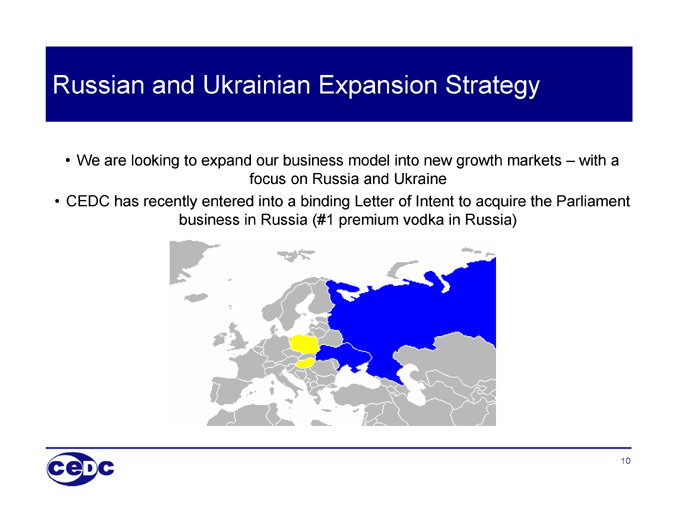
We are looking to expand our business model into new growth markets — with a focus on Russia and Ukraine
CEDC has recently entered into a binding Letter of Intent to acquire the Parliament business in Russia (#1 premium vodka in Russia)
10
Russia and Ukraine — The Time is Right
Take leading role in the consolidation of a fragmented spirit market
Acquire leading brands with a national sales platform
Target import brands to add to local portfolio
Premiumization trends taking place in the region
Cost and sales synergies through expansion
Strong economic growth in the region
Leverage our regional know how to execute acquisitions
11
Russian Market
Russia is the largest vodka market in the world and the 2nd largest alcohol market in the world
Rapidly growing economy (GDP growth of 8.2% YTD 2007) which in turn is driving consumer spending for premium branded products (both imported and domestic)
Russian market is very fragmented with no producer having over a 7% market share
The Russian Government is focused on reducing “grey zone” vodka with tighter controls over spirit production and distribution - -> expected that legalized spirits will grow from 50%-60% of current market share to 75%-80% by 2011
Source: Renaissance Capital Report, August 2007
12
Russian Market
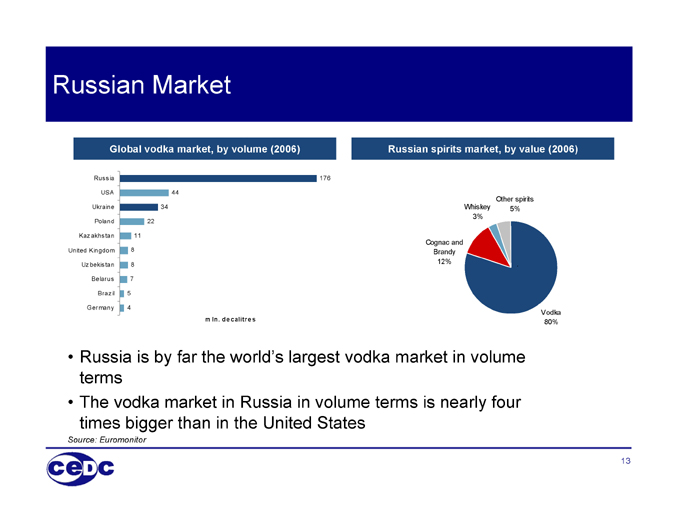
Global vodka market, by volume (2006)
Russian spirits market, by value (2006)
Russia is by far the world’s largest vodka market in volume terms
The vodka market in Russia in volume terms is nearly four times bigger than in the United States
Source: Euromonitor
Russia 176
USA 44
Ukraine 34
Poland 22
Kazakhstan 11
United Kingdom 8
Uzbekistan 8
Belarus 7
Brazil 5
Germany 4
m ln. de calitre s
Other spirits 5%
Whiskey 3%
Cognac and Brandy 12%
Vodka 80%
13
Russian Market
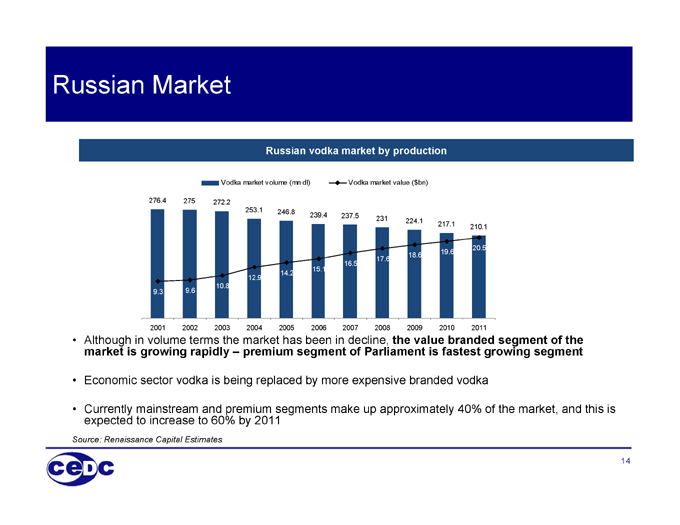
Russian vodka market by production
Vodka market volume (mn dl)
Vodka market value ($bn)
276.4 275 272.2 253.1 246.8 239.4 237.5 231 224.1 217.1 210.1
19.6 17.6 16.5 15.1 14.2 12.9 10.8 9.3 9.6 18.6 20.5
2001 2002 2003 2004 2005 2006 2007 2008 2009 2010 2011
Although in volume terms the market has been in decline, the value branded segment of the market is growing rapidly — premium segment of Parliament is fastest growing segment
Economic sector vodka is being replaced by more expensive branded vodka
Currently mainstream and premium segments make up approximately 40% of the market, and this is expected to increase to 60% by 2011
Source: Renaissance Capital Estimates
14
Russian Market
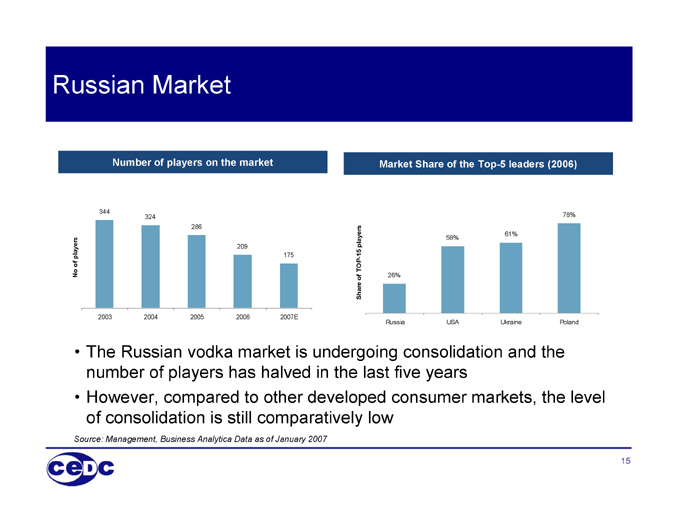
Number of players on the market
344
324
286
209
175
No of players
2003 2004 2005 2006 2007E
Share of TOP-15 players
78%
61%
58%
26%
Russia USA Ukraine Poland
Market Share of the Top-5 leaders (2006)
The Russian vodka market is undergoing consolidation and the number of players has halved in the last five years
However, compared to other developed consumer markets, the level of consolidation is still comparatively low
Source: Management, Business Analytica Data as of January 2007
15
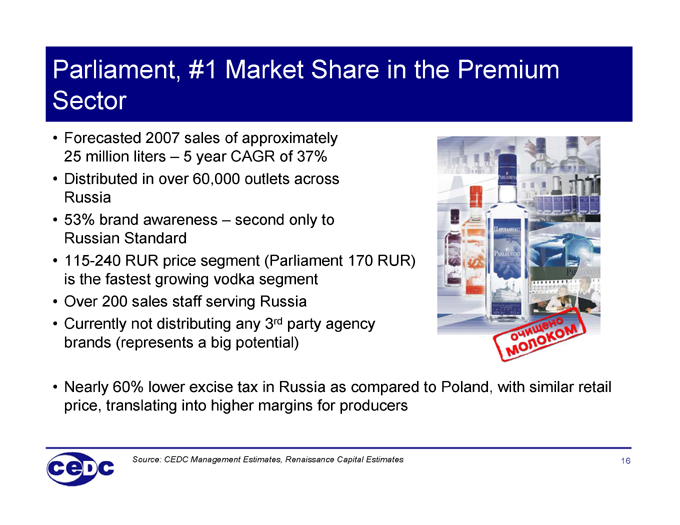
Parliament, #1 Market Share in the Premium Sector
Forecasted 2007 sales of approximately 25 million liters — 5 year CAGR of 37%
Distributed in over 60,000 outlets across Russia
53% brand awareness — second only to Russian Standard
115-240 RUR price segment (Parliament 170 RUR) is the fastest growing vodka segment
Over 200 sales staff serving Russia
Currently not distributing any 3rd party agency brands (represents a big potential)
Nearly 60% lower excise tax in Russia as compared to Poland, with similar retail price, translating into higher margins for producers
Source: CEDC Management Estimates, Renaissance Capital Estimates
16
Parliament
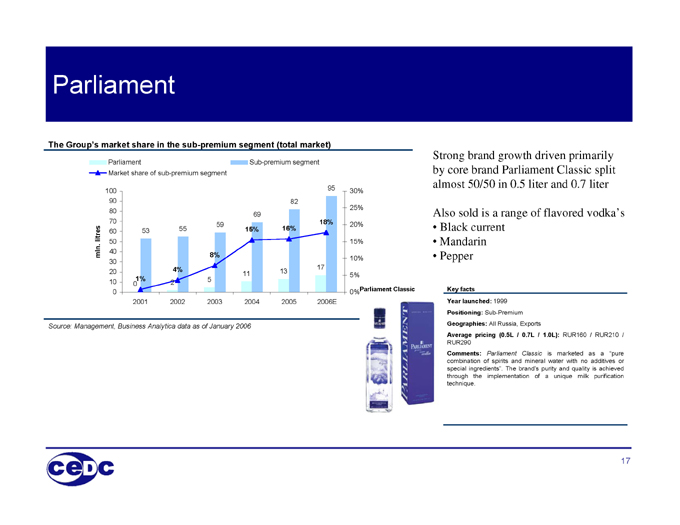
The Group’s market share in the sub-premium segment (total market)
mln. litres
100 90 80 70 60 50 40 30 20 10 0
2001 2002 2003 2004 2005 2006E
95 82 69 59 55 53 17 13 11
5 0 2
18% 16% 15% 8% 4% 1%
30% 25% 20% 15% 10% 5%
0% Parliament Classic
Parliament Market share of sub-premium segment
Sub-premium segment
Strong brand growth driven primarily by core brand Parliament Classic split almost 50/50 in 0.5 liter and 0.7 liter
Also sold is a range of flavored vodka’s
Black current
Mandarin
Pepper
Key facts
Year launched: 1999
Positioning: Sub-Premium Geographies: All Russia, Exports
Average pricing (0.5L / 0.7L / 1.0L): RUR160 / RUR210 / RUR290 Comments: Parliament Classic is marketed as a “pure combination of spirits and mineral water with no additives or special ingredients”. The brand’s purity and quality is achieved through the implementation of a unique milk purification technique.
17
Ukrainian Market
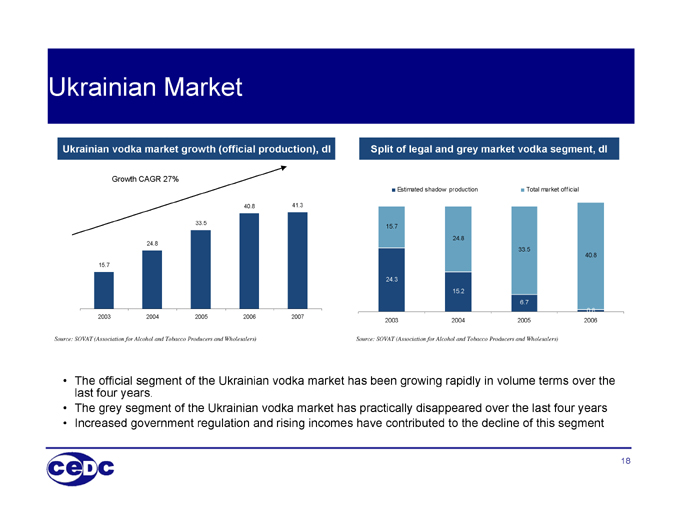
Ukrainian vodka market growth (official production), dl
Growth CAGR 27%
40.8
41.3
33.5
24.8
15.7
2003 2004 2005 2006 2007
Source: SOVAT (Association for Alcohol and Tobacco Producers and Wholesalers)
Estimated shadow production Total market official
15.7
24.8
33.5
40.8
24.3
15.2
6.7
0.8
2003 2004 2005 2006
Split of legal and grey market vodka segment, dl
Source: SOVAT (Association for Alcohol and Tobacco Producers and Wholesalers)
The official segment of the Ukrainian vodka market has been growing rapidly in volume terms over the last four years.
The grey segment of the Ukrainian vodka market has practically disappeared over the last four years
Increased government regulation and rising incomes have contributed to the decline of this segment
18
Ukrainian Market
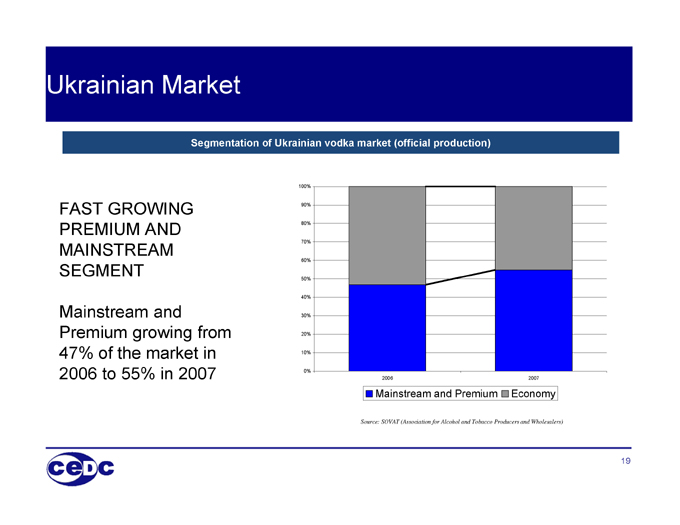
Segmentation of Ukrainian vodka market (official production)
FAST GROWING PREMIUM AND MAINSTREAM SEGMENT
Mainstream and Premium growing from 47% of the market in 2006 to 55% in 2007
100% 90% 80% 70% 60% 50% 40% 30% 20% 10% 0%
2006 2007
Mainstream and Premium Economy
Source: SOVAT (Association for Alcohol and Tobacco producers and wholesalers)
19
Ukrainian Market
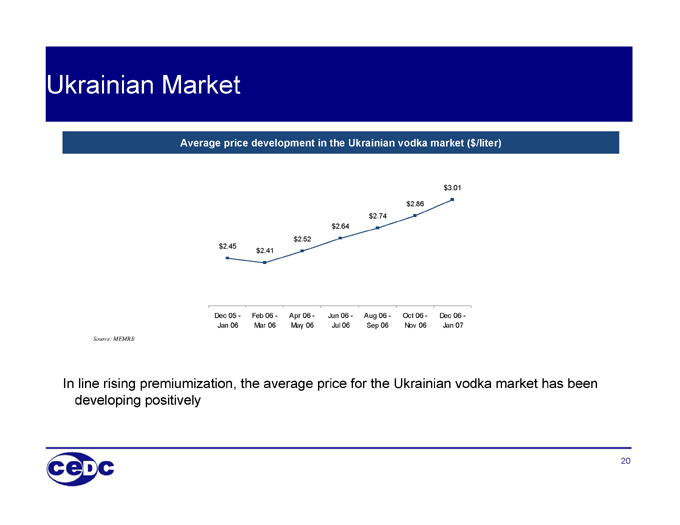
Average price development in the Ukrainian vodka market ($/liter)
$3.01 $2.86 $2.74 $2.64 $2.52 $2.45 $2.41
Source: MEMRB
Dec 05 - Jan 06
Feb 06 - Mar 06
Apr 06 - May 06
Jun 06 - Jul 06
Aug 06 - Sep 06
Oct 06 - Nov 06
Dec 06 - Jan 07
In line rising premiumization, the average price for the Ukrainian vodka market has been developing positively
20
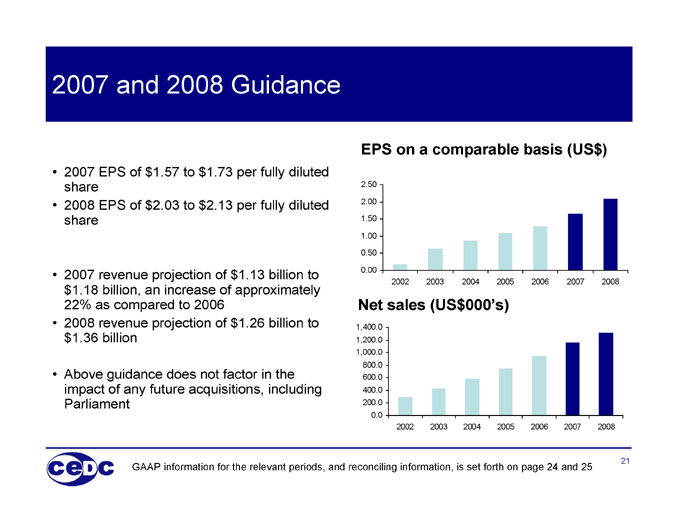
2007 and 2008 Guidance
2007 EPS of $1.57 to $1.73 per fully diluted share
2008 EPS of $2.03 to $2.13 per fully diluted share
2007 revenue projection of $1.13 billion to $1.18 billion, an increase of approximately 22% as compared to 2006
2008 revenue projection of $1.26 billion to $1.36 billion
Above guidance does not factor in the impact of any future acquisitions, including Parliament
EPS on a comparable basis (US$)
2.50 2.00 1.50 1.00 0.50 0.00
2002 2003 2004 2005 2006 2007 2008
Net sales (US$000’s)
1,400.0 1,200.0 1,000.0 800.0 600.0 400.0 200.0 0.0
2002 2003 2004 2005 2006 2007 2008
GAAP information for the relevant periods, and reconciling information, is set forth on page 24 and 25
21
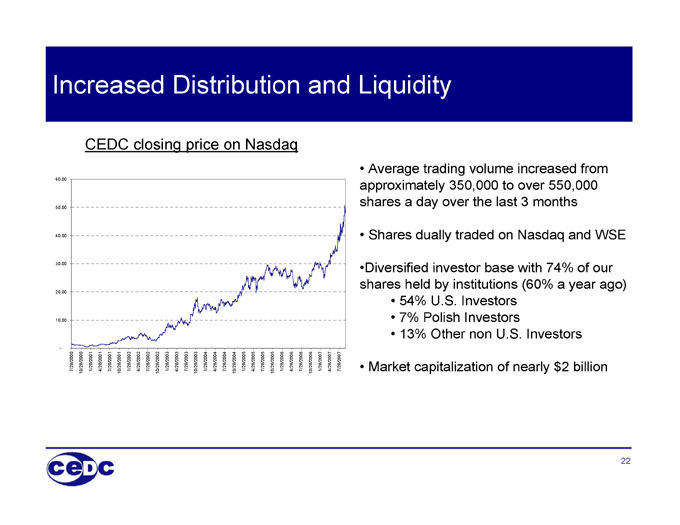
Increased Distribution and Liquidity
CEDC closing price on Nasdaq
60.00 50.00 40.00 30.00 20.00 10.00
7/28/2000 10/28/2000 1/28/2001 4/28/2001 7/28/2001 10/28/2001 1/28/2002 4/28/2002 7/28/2002 10/28/2002 1/28/2003 4/28/2003 7/28/2003 10/28/2003 1/28/2004 4/28/2004 7/28/2004 10/28/2004 1/28/2005 4/28/2005 7/28/2005 10/28/2005 1/28/2006 4/28/2006 7/28/2006 10/28/2006 1/28/2007 4/28/2007 7/28/2007
Average trading volume increased from approximately 350,000 to over 550,000 shares a day over the last 3 months
Shares dually traded on Nasdaq and WSE
Diversified investor base with 74% of our shares held by institutions (60% a year ago)
54% U.S. Investors
7% Polish Investors
13% Other non U.S. Investors
Market capitalization of nearly $2 billion
22
Summary
GROWTH in emerging markets will continue to fuel increasing consumer demand for BRANDS
CEDC is well positioned to EXPAND and GROW with these trends
23

UNAUDITED RECONCILIATION OF NON-GAAP MEASURES
CEDC has reported net income and diluted net income per share in accordance with GAAP and on a non-GAAP basis, referred to in this docment as comparable non-GAAP net income. CEDC’s management believes that the non-GAAP reporting giving effect to the adjustments shown in the attached reconciliation provides meaningful information and an alternative presentation useful to investors’ understanding of CEDC’s core operating results and trends. CEDC discusses results on a comparable basis in order to give investors better insight into underlying business trends from continuing operations. CEDC’s calculation of this measure may not be the same as similarly named measures presented by other companies. This measure is not presented as an alternative to net income computed in accordance with GAAP as a performance measure, and you should not place undue reliance on such measures. Our full year guidance is forward-looking information. See “Forward Looking Statements” at the beginning of this presentation.
12 Months Ended December 31, 2005 2006
GAAP net income/(loss) 20,268 55,450
A. Foreign exchange impact and hedge revaluation 6,832 (11,810)
B. Pre-acquisition financing costs 3,907 -
C. Other acquisition costs 317 423
D. Impact of Polmos Lublin acquistion costs write-off 469
E. Impact of expensing stock options 1,548
Range for Comparable non-GAAP Fully Diluted Earnings per 31,324 46,080
Comparable net income per share of common stock, basic 1.11 1.29
Comparable net income per share of common stock, diluted 1.09 1.28
GAAP net income per share of common stock, basic 0.72 1.55
GAAP net income per share of common stock, diluted 0.70 1.53
Share base for fully diluted earnings per share calculation 28,820 36,137
Note: for periods prior to 2005 there is no difference between GAAP and comparable non-GAAP net income in this presentation
A) Represents the net after tax impact of the foreign currency revaluation related to our Senior Secured Notes and mark to market revaluation of financing related hedges. CEDC closed a EURO 325 million Senior Secured Notes offering on July 25, 2005 in order to fund the acquisitions of Polmos Bialystok and Bols.
B) Due to various delays in receiving final approval from the Polish Anti-Monopoly office, the acquisitions were not completed until August 17, 2005, in the case of Bols, and October 12, 2005, in the case of Polmos Bialystok. These amounts represent the proportional share of interest accrued (net of interest earned in escrow) on our senior secured noted prior to completion of the acquisitions. In addition, the CEDC incurred additional debt to support the deposit payment made to the State Treasury as part of the Polmos Bialystok acquisition. The costs relating to this additional financing are also represented in this calculation.
C) Represents other miscellaneous costs incurred in 2005, directly related to the acquisitions of Bols and Polmos Bialystok and 2006 costs related to the tender for additional shares of Polmos Bialystok.
D) Represents cost incurred with the potential acquisition of Polmos Lublin which was not completed and has since been acquired by another company.
E) On January 1, 2006, the Company adopted SFAS 123(R) and began to expense stock options. This amount represents the net after tax impact of the expensing of stock options.
24
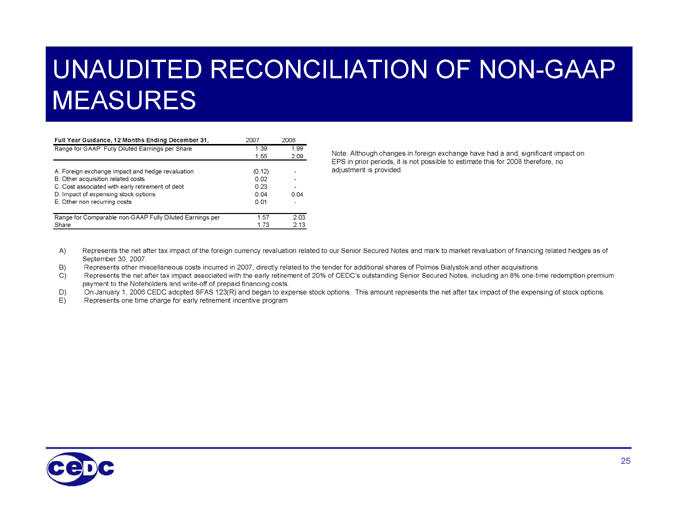
UNAUDITED RECONCILIATION OF NON-GAAP MEASURES
Full Year Guidance, 12 Months Ending December 31, 2007 2008
Range for GAAP Fully Diluted Earnings per Share 1.39 1.99
1.55 2.09
A. Foreign exchange impact and hedge revaluation (0.12) -
B. Other acquisition related costs 0.02 -
C. Cost associated with early retirement of debt 0.23 -
D. Impact of expensing stock options 0.04 0.04
E. Other non recurring costs 0.01 -
Range for Comparable non-GAAP Fully Diluted Earnings per 1.57 2.03
Share 1.73 2.13
Note: Although changes in foreign exchange have had a and, significant impact on EPS in prior periods, it is not possible to estimate this for 2008 therefore, no adjustment is provided.
A) Represents the net after tax impact of the foreign currency revaluation related to our Senior Secured Notes and mark to market revaluation of financing related hedges as of September 30, 2007.
B) Represents other miscellaneous costs incurred in 2007, directly related to the tender for additional shares of Polmos Bialystok and other acquisitions.
C) Represents the net after tax impact associated with the early retirement of 20% of CEDC’s outstanding Senior Secured Notes, including an 8% one-time redemption premium payment to the Noteholders and write-off of prepaid financing costs.
D) On January 1, 2006 CEDC adopted SFAS 123(R) and began to expense stock options. This amount represents the net after tax impact of the expensing of stock options. E) Represents one time charge for early retirement incentive program