(a) The Registrant, as of the end of the period covered by this report, has adopted a code of ethics that applies to the Registrant’s principal executive officer, principal financial officer, principal accounting officer or controller, or persons performing similar functions, regardless of whether these individuals are employed by the Registrant or a third party. A copy of this code of ethics is attached hereto as Exhibit (a).
(b) Not used.
(c) There were no amendments, during the period covered by this report, to a provision of the code of ethics that applies to the Registrant’s principal executive officer, principal financial officer, principal accounting officer or controller, or persons performing similar functions, regardless of whether these individuals are employed by the Registrant or a third party, and that relates to any element of the code of ethics description.
(d) The Registrant has not granted any waivers, including an implicit waiver, from a provision of the code of ethics that applies to the Registrant’s principal executive officer, principal financial officer, principal accounting officer or controller, or persons performing similar functions, regardless of whether these individuals are employed by the Registrant or a third party, that relates to one or more of the items set forth in paragraph (b) of this item’s instructions.
(e) Not applicable.
(f) See attached Exhibit (a).
| Item 3. | Audit Committee Financial Expert |
(a)(1) The Registrant’s Board of Trustees has determined that the Registrant has at least one audit committee financial expert serving on its audit committee.
(a)(2) Mr. Matthew C. Flavin is the audit committee financial expert. Mr. Flavin is “independent” under the applicable rules. Prior to Mr. Flavin, Mr. Joseph T. Willett served as the audit committee financial expert. Mr. Willett retired from the Board of Trustees of The Marsico Investment Fund effective January 2, 2024. Mr. Willett was “independent” under the applicable rules.
| Item 4. | Principal Accountant Fees and Services |
In each of the fiscal years ended September 30, 2024 and September 30, 2023, the aggregate Audit Fees billed (or to be billed) by PricewaterhouseCoopers LLP (PwC) for professional services rendered for the audits of the financial statements, or services that are normally provided in connection with statutory and regulatory filings or engagements as well as reimbursable expenses are listed below.
(a) Audit Fees.
| 2024 | | 2023 |
| $220,000 | | $209,140 |
(b) Audit-Related Fees.
In each of the fiscal years ended September 30, 2024 and September 30, 2023, the aggregate Audit-Related Fees billed (or to be billed) by PwC for services rendered for assurance and related services to each fund that are reasonably related to the performance of the audit or review of each fund's financial statements, but not reported as Audit Fees, are shown in the table below.
(c) Tax Fees.
In each of the fiscal years ended September 30, 2024 and September 30, 2023 the aggregate Tax Fees billed (or to be billed) by PwC for professional services rendered for tax compliance, tax advice, and tax planning are shown in the table below.
All of these fees were approved by the Trust’s Audit Committee as required pursuant to paragraph (c)(7)(ii) of Rule 2-01 of Regulation S-X.
Fees included in the Tax Fees category comprise all services performed by professional staff in the independent registered public accounting firm's tax division except those services related to the audit. Typically, this category would include fees for tax compliance, tax planning, and tax advice. Tax compliance, tax advice, and tax planning services include preparation of original and amended tax returns, claims for refund and tax payment-planning services, assistance with tax audits and appeals, tax advice related to mergers and acquisitions and requests for rulings or technical advice from taxing authorities.
(d) All Other Fees.
In each of the fiscal years ended September 30, 2024 and September 30, 2023 the aggregate Other Fees billed (or to be billed) by PwC for all other non-audit services rendered are shown in the table below.
(e)(1) Audit Committee Pre-Approval Policies and Procedures:
Pursuant to the Trust’s Audit Committee Charter and Policies and Procedures (collectively, the “Procedures”), the Audit Committee has adopted pre-approval policies and procedures to govern the pre-approval of (i) all audit services and permissible non-audit services to be provided to the Trust by its independent accountant, and (ii) all permissible non-audit services to be provided by such independent accountant to the Trust’s investment adviser and to any entity controlling, controlled by or under common control with the investment adviser that provides on-going services to the Trust (collectively, any “Service Affiliates”) if the engagement directly relates to the Trust’s operations and financial reporting.
In accordance with the Procedures, the Committee is responsible for the engagement of the independent accountant to certify the Trust’s financial statements for each fiscal year. With respect to the pre-approval of non-audit services provided to the Trust and its Service Affiliates, the Procedures provide that the Committee may pre-approve such services on a project-by-project basis as they arise. The Procedures also permit the Committee to delegate authority to the Audit Committee Chairman (the “Designated Member”) to pre-approve any proposed non-audit services that have not been previously approved by the Committee, subject to certain conditions. Any action by the Designated Member in approving a requested non-audit service shall be presented to the Audit Committee not later than at its next scheduled meeting. If the Designated Member does not approve the independent auditor’s provision of a requested non-audit service, the matter may be presented to the full Committee for its consideration and action.
(e)(2) Services approved pursuant to paragraph (c)(7)(i)(C) of Rule 2-01 of Regulation S-X:
100% of these fees were approved by the Trust’s Audit Committee as required pursuant to paragraph (c)(7)(ii) of Rule 2-01 of Regulation S-X.
(f) According to PwC for the fiscal year ended September 30, 2024, the percentage of hours spent on the audit of the Marsico Funds’ financial statements for the most recent fiscal year that were attributed to work performed by persons who are not full-time, permanent employees of PwC is as follows:
| | | 2024 |
| PwC work performed by persons who are not full-time: | | 0% |
(g) In each of the fiscal years ended September 30, 2024 and September 30, 2023, the aggregate fees billed (or to be billed) by PwC relating to non-audit services that were rendered to the Trust, to its investment adviser, and to any entity controlling, controlled by, or under common control with the investment adviser and that provides ongoing services to the Trust are shown in the table below.
Non-audit services originally proposed and reported for 2023 were $2,000. The non-audit services were related to an accounting guidance software license utilized and historically paid for by the investment adviser. Subsequent to reporting, PwC determined the software license would be provided without charge for US based clients utilizing US accounting guidance.
(h) Not applicable.
(i) Not applicable.
(j) Not applicable.
| Item 5. | Audit Committee of Listed Registrants |
Not applicable.
(a) The schedule of investments in securities of unaffiliated issuers is included as part of the financial statements filed under Item 7 of this Form N-CSR.
(b) Not applicable.

1
MARSICO FOCUS FUND
SCHEDULE OF INVESTMENTS
As of September 30, 2024
| | | Number of Shares | | | Value | | | Percent of Net Assets | |
| COMMON STOCKS | | | | | | | | | | | | |
| Aerospace & Defense | | | | | | | | | | | | |
| General Electric Co. DBA GE Aerospace | | | 239,644 | | | $ | 45,192,066 | | | | 4.37 | % |
| | | | | | | | | | | | | |
| Application Software | | | | | | | | | | | | |
| Synopsys, Inc.* | | | 64,479 | | | | 32,651,521 | | | | 3.16 | |
| | | | | | | | | | | | | |
| Automobile Manufacturers | | | | | | | | | | | | |
| Tesla, Inc.* | | | 134,270 | | | | 35,129,060 | | | | 3.40 | |
| | | | | | | | | | | | | |
| Broadline Retail | | | | | | | | | | | | |
| Amazon.com, Inc.* | | | 322,395 | | | | 60,071,860 | | | | 5.82 | |
| | | | | | | | | | | | | |
| Consumer Staples Merchandise Retail | | | | | | | | | | | | |
| Costco Wholesale Corp. | | | 43,148 | | | | 38,251,565 | | | | 3.70 | |
| | | | | | | | | | | | | |
| Diversified Banks | | | | | | | | | | | | |
| JPMorgan Chase & Company | | | 142,294 | | | | 30,004,113 | | | | 2.90 | |
| | | | | | | | | | | | | |
| Homebuilding | | | | | | | | | | | | |
| Toll Brothers, Inc. | | | 237,954 | | | | 36,761,514 | | | | 3.56 | |
| | | | | | | | | | | | | |
| Interactive Media & Services | | | | | | | | | | | | |
| Alphabet, Inc. - Cl. A | | | 212,664 | | | | 35,270,324 | | | | 3.41 | |
| Meta Platforms, Inc. - Cl. A | | | 175,738 | | | | 100,599,461 | | | | 9.74 | |
| | | | | | | | 135,869,785 | | | | 13.15 | |
| Managed Health Care | | | | | | | | | | | | |
| UnitedHealth Group, Inc. | | | 60,157 | | | | 35,172,595 | | | | 3.41 | |
| | | | | | | | | | | | | |
| Movies & Entertainment | | | | | | | | | | | | |
| Netflix, Inc.* | | | 47,108 | | | | 33,412,291 | | | | 3.23 | |
| | | | | | | | | | | | | |
| Pharmaceuticals | | | | | | | | | | | | |
| Eli Lilly & Company | | | 58,135 | | | | 51,504,122 | | | | 4.99 | |
| | | | | | | | | | | | | |
| Restaurants | | | | | | | | | | | | |
| Chipotle Mexican Grill, Inc.* | | | 756,600 | | | | 43,595,292 | | | | 4.22 | |
| | | | | | | | | | | | | |
| Semiconductor Materials & Equipment | | | | | | | | | | | | |
| ASML Holding N.V. - NY Reg. Shs. | | | 41,861 | | | | 34,880,678 | | | | 3.38 | |
| | | | | | | | | | | | | |
| Semiconductors | | | | | | | | | | | | |
| NVIDIA Corp. | | | 664,235 | | | | 80,664,698 | | | | 7.81 | |
| Taiwan Semiconductor Manufacturing Co., Ltd. Spon. ADR | | | 225,916 | | | | 39,234,832 | | | | 3.80 | |
| | | | | | | | 119,899,530 | | | | 11.61 | |
| Specialty Chemicals | | | | | | | | | | | | |
| The Sherwin-Williams Company | | | 102,810 | | | | 39,239,493 | | | | 3.80 | |
| | | | | | | | | | | | | |
| Systems Software | | | | | | | | | | | | |
| Microsoft Corp. | | | 243,678 | | | | 104,854,643 | | | | 10.15 | |
| ServiceNow, Inc.* | | | 22,656 | | | | 20,263,300 | | | | 1.96 | |
| | | | | | | | 125,117,943 | | | | 12.11 | |
| Technology Hardware, Storage & Peripherals | | | | | | | | | | | | |
| Apple, Inc. | | | 441,998 | | | | 102,985,534 | | | | 9.97 | |
| | | | | | | | | | | | | |
| Transaction & Payment Processing Services | | | | | | | | | | | | |
| Visa, Inc. - Cl. A | | | 119,111 | | | | 32,749,569 | | | | 3.17 | |
| | | | | | | | | | | | | |
| TOTAL COMMON STOCKS | | | | | | | | | | | | |
| (Cost $455,973,090) | | | | | | | 1,032,488,531 | | | | 99.95 | |
| | | | | | | | | | | | | |
| SHORT-TERM INVESTMENTS | | | | | | | | | | | | |
| State Street Institutional Treasury Money Market Fund - Premier Class, 4.97%# | | | 4,133,752 | | | | 4,133,752 | | | | 0.40 | |
| | | | | | | | | | | | | |
| TOTAL SHORT-TERM INVESTMENTS | | | | | | | | | | | | |
| (Cost $4,133,752) | | | | | | | 4,133,752 | | | | 0.40 | |
| | | | | | | | | | | | | |
| TOTAL INVESTMENTS | | | | | | | | | | | | |
| (Cost $460,106,842) | | | | | | | 1,036,622,283 | | | | 100.35 | |
| | | | | | | | | | | | | |
| Liabilities, Less Cash and Other Assets | | | | | | | (3,572,028 | ) | | | (0.35 | ) |
| | | | | | | | | | | | | |
| NET ASSETS | | | | | | $ | 1,033,050,255 | | | | 100.00 | % |
2
SUMMARY OF FAIR VALUE MEASUREMENTS
As of September 30, 2024, all investments disclosed in the preceding Schedule of Investments were classified as Level 1.
For more information on investment valuation and valuation inputs, refer to Note 2(a) in the Notes to Financial Statements.
* Non-income producing.
# Rate shown is the 7-day yield as of September 30, 2024.
See notes to financial statements.
3
MARSICO GROWTH FUND
SCHEDULE OF INVESTMENTS
As of September 30, 2024
| | | Number
of
Shares | | | Value | | | Percent
of Net
Assets | |
| COMMON STOCKS | | | | | | | | | | | | |
| Aerospace & Defense | | | | | | | | | | | | |
| General Electric Co. DBA GE Aerospace | | | 50,151 | | | $ | 9,457,476 | | | | 2.06 | % |
| HEICO Corp. | | | 57,225 | | | | 14,963,193 | | | | 3.26 | |
| | | | | | | | 24,420,669 | | | | 5.32 | |
| Application Software | | | | | | | | | | | | |
| SAP S.E. Spon. ADR | | | 50,944 | | | | 11,671,271 | | | | 2.54 | |
| Synopsys, Inc.* | | | 28,039 | | | | 14,198,669 | | | | 3.09 | |
| | | | | | | | 25,869,940 | | | | 5.63 | |
| Automobile Manufacturers | | | | | | | | | | | | |
| Tesla, Inc.* | | | 47,174 | | | | 12,342,134 | | | | 2.69 | |
| | | | | | | | | | | | | |
| Automotive Retail | | | | | | | | | | | | |
| O’Reilly Automotive, Inc.* | | | 6,293 | | | | 7,247,019 | | | | 1.58 | |
| | | | | | | | | | | | | |
| Broadline Retail | | | | | | | | | | | | |
| Amazon.com, Inc.* | | | 122,099 | | | | 22,750,707 | | | | 4.95 | |
| | | | | | | | | | | | | |
| Consumer Finance | | | | | | | | | | | | |
| American Express Company | | | 17,855 | | | | 4,842,276 | | | | 1.05 | |
| | | | | | | | | | | | | |
| Consumer Staples Merchandise Retail | | | | | | | | | | | | |
| Costco Wholesale Corp. | | | 17,860 | | | | 15,833,247 | | | | 3.45 | |
| | | | | | | | | | | | | |
| Diversified Support Services | | | | | | | | | | | | |
| Cintas Corp. | | | 11,268 | | | | 2,319,856 | | | | 0.50 | |
| | | | | | | | | | | | | |
| Electronic Components | | | | | | | | | | | | |
| Amphenol Corp. - Cl. A | | | 72,372 | | | | 4,715,759 | | | | 1.03 | |
| | | | | | | | | | | | | |
| Financial Exchanges & Data | | | | | | | | | | | | |
| S&P Global, Inc. | | | 21,501 | | | | 11,107,847 | | | | 2.42 | |
| | | | | | | | | | | | | |
| Heavy Electrical Equipment | | | | | | | | | | | | |
| GE Vernova, Inc.* | | | 12,704 | | | | 3,239,266 | | | | 0.71 | |
| | | | | | | | | | | | | |
| Homebuilding | | | | | | | | | | | | |
| Toll Brothers, Inc. | | | 69,848 | | | | 10,790,817 | | | | 2.35 | |
| | | | | | | | | | | | | |
| Insurance Brokers | | | | | | | | | | | | |
| Arthur J. Gallagher & Company | | | 8,701 | | | | 2,448,200 | | | | 0.53 | |
| | | | | | | | | | | | | |
| Interactive Media & Services | | | | | | | | | | | | |
| Alphabet, Inc. - Cl. A | | | 87,739 | | | | 14,551,513 | | | | 3.17 | |
| Meta Platforms, Inc. - Cl. A | | | 61,641 | | | | 35,285,774 | | | | 7.68 | |
| | | | | | | | 49,837,287 | | | | 10.85 | |
| Life Sciences Tools & Services | | | | | | | | | | | | |
| Danaher Corp. | | | 21,392 | | | | 5,947,404 | | | | 1.29 | |
| | | | | | | | | | | | | |
| Managed Health Care | | | | | | | | | | | | |
| UnitedHealth Group, Inc. | | | 19,262 | | | | 11,262,106 | | | | 2.45 | |
| | | | | | | | | | | | | |
| Movies & Entertainment | | | | | | | | | | | | |
| Netflix, Inc.* | | | 13,997 | | | | 9,927,652 | | | | 2.16 | |
| Spotify Technology S.A.* | | | 21,472 | | | | 7,913,076 | | | | 1.72 | |
| | | | | | | | 17,840,728 | | | | 3.88 | |
| Pharmaceuticals | | | | | | | | | | | | |
| Eli Lilly & Company | | | 5,433 | | | | 4,813,312 | | | | 1.05 | |
| | | | | | | | | | | | | |
| Restaurants | | | | | | | | | | | | |
| Chipotle Mexican Grill, Inc.* | | | 327,950 | | | | 18,896,479 | | | | 4.11 | |
| | | | | | | | | | | | | |
| Semiconductor Materials & Equipment | | | | | | | | | | | | |
| ASML Holding N.V. - NY Reg. Shs. | | | 9,999 | | | | 8,331,667 | | | | 1.81 | |
| | | | | | | | | | | | | |
| Semiconductors | | | | | | | | | | | | |
| Broadcom, Inc. | | | 83,584 | | | | 14,418,240 | | | | 3.14 | |
| NVIDIA Corp. | | | 183,777 | | | | 22,317,879 | | | | 4.86 | |
| Taiwan Semiconductor Manufacturing Co., Ltd. Spon. ADR | | | 110,275 | | | | 19,151,459 | | | | 4.17 | |
| | | | | | | | 55,887,578 | | | | 12.17 | |
| Specialty Chemicals | | | | | | | | | | | | |
| The Sherwin-Williams Company | | | 40,768 | | | | 15,559,922 | | | | 3.39 | |
| | | | | | | | | | | | | |
| Systems Software | | | | | | | | | | | | |
| Microsoft Corp. | | | 92,295 | | | | 39,714,539 | | | | 8.65 | |
| ServiceNow, Inc.* | | | 22,101 | | | | 19,766,913 | | | | 4.30 | |
| | | | | | | | 59,481,452 | | | | 12.95 | |
| Technology Hardware, Storage & Peripherals | | | | | | | | | | | | |
| Apple, Inc. | | | 154,525 | | | | 36,004,325 | | | | 7.84 | |
| | | | | | | | | | | | | |
| Trading Companies & Distributors | | | | | | | | | | | | |
| United Rentals, Inc. | | | 10,280 | | | | 8,324,024 | | | | 1.81 | |
| Watsco, Inc. | | | 4,569 | | | | 2,247,400 | | | | 0.49 | |
| | | | | | | | 10,571,424 | | | | 2.30 | |
| Transaction & Payment Processing Services | | | | | | | | | | | | |
| Mastercard, Inc. - Cl. A | | | 24,838 | | | | 12,265,004 | | | | 2.67 | |
| Visa, Inc. - Cl. A | | | 16,751 | | | | 4,605,688 | | | | 1.00 | |
| | | | | | | | 16,870,692 | | | | 3.67 | |
| TOTAL COMMON STOCKS | | | | | | | | | | | | |
| (Cost $246,047,252) | | | | | | | 459,232,113 | | | | 99.97 | |
| | | | | | | | | | | | | |
| SHORT-TERM INVESTMENTS | | | | | | | | | | | | |
| State Street Institutional Treasury Money Market Fund - Premier Class, 4.97%# | | | 2,612,218 | | | | 2,612,218 | | | | 0.57 | |
| | | | | | | | | | | | | |
| TOTAL SHORT-TERM INVESTMENTS | | | | | | | | | | | | |
| (Cost $2,612,218) | | | | | | | 2,612,218 | | | | 0.57 | |
| | | | | | | | | | | | | |
| TOTAL INVESTMENTS | | | | | | | | | | | | |
| (Cost $248,659,470) | | | | | | | 461,844,331 | | | | 100.54 | |
| | | | | | | | | | | | | |
| Liabilities, Less Cash and Other Assets | | | | | | | (2,481,399 | ) | | | (0.54 | ) |
| | | | | | | | | | | | | |
| NET ASSETS | | | | | | $ | 459,362,932 | | | | 100.00 | % |
4
SUMMARY OF FAIR VALUE MEASUREMENTS
As of September 30, 2024, all investments disclosed in the preceding Schedule of Investments were classified as Level 1.
For more information on investment valuation and valuation inputs, refer to Note 2(a) in the Notes to Financial Statements.
| | * | Non-income producing. |
| # | Rate shown is the 7-day yield as of September 30, 2024. |
| | | |
| | | See notes to financial statements. |
5
MARSICO MIDCAP GROWTH FOCUS FUND
SCHEDULE OF INVESTMENTS
As of September 30, 2024
| | | Number
of
Shares/
Warrants | | | Value | | | Percent
of Net
Assets | |
| COMMON STOCKS | | | | | | | | | |
| Aerospace & Defense | | | | | | | | | |
| AeroVironment, Inc.* | | | 7,617 | | | $ | 1,527,208 | | | | 0.48 | % |
| HEICO Corp. | | | 48,506 | | | | 12,683,349 | | | | 3.98 | |
| Rolls-Royce Holdings PLC* | | | 1,326,176 | | | | 9,347,421 | | | | 2.93 | |
| | | | | | | | 23,557,978 | | | | 7.39 | |
| Application Software | | | | | | | | | | | | |
| AppLovin Corp. - Cl. A* | | | 68,656 | | | | 8,963,041 | | | | 2.81 | |
| Constellation Software, Inc. | | | 5,185 | | | | 16,868,646 | | | | 5.29 | |
| Palantir Technologies, Inc. - Cl. A* | | | 255,047 | | | | 9,487,748 | | | | 2.98 | |
| Synopsys, Inc.* | | | 32,816 | | | | 16,617,694 | | | | 5.21 | |
| Tyler Technologies, Inc.* | | | 1,677 | | | | 978,899 | | | | 0.31 | |
| | | | | | | | 52,916,028 | | | | 16.60 | |
| Asset Management & Custody Banks | | | | | | | | | | | | |
| KKR & Co., Inc. | | | 86,657 | | | | 11,315,671 | | | | 3.55 | |
| | | | | | | | | | | | | |
| Automotive Retail | | | | | | | | | | | | |
| O’Reilly Automotive, Inc.* | | | 9,076 | | | | 10,451,922 | | | | 3.28 | |
| | | | | | | | | | | | | |
| Diversified Support Services | | | | | | | | | | | | |
| Cintas Corp. | | | 79,932 | | | | 16,456,400 | | | | 5.16 | |
| | | | | | | | | | | | | |
| Electrical Components & Equipment | | | | | | | | | | | | |
| AMETEK, Inc. | | | 48,635 | | | | 8,351,116 | | | | 2.62 | |
| Vertiv Holdings Company - Cl. A | | | 100,154 | �� | | | 9,964,321 | | | | 3.13 | |
| | | | | | | | 18,315,437 | | | | 5.75 | |
| Electronic Components | | | | | | | | | | | | |
| Amphenol Corp. - Cl. A | | | 159,678 | | | | 10,404,619 | | | | 3.27 | |
| | | | | | | | | | | | | |
| Environmental & Facilities Services | | | | | | | | | | | | |
| Waste Connections, Inc. | | | 4,091 | | | | 731,553 | | | | 0.23 | |
| | | | | | | | | | | | | |
| Financial Exchanges & Data | | | | | | | | | | | | |
| MSCI, Inc. | | | 10,594 | | | | 6,175,560 | | | | 1.94 | |
| | | | | | | | | | | | | |
| Heavy Electrical Equipment | | | | | | | | | | | | |
| GE Vernova, Inc.* | | | 48,396 | | | | 12,340,012 | | | | 3.87 | |
| | | | | | | | | | | | | |
| Homebuilding | | | | | | | | | | | | |
| Lennar Corp. - Cl. A | | | 39,008 | | | | 7,313,220 | | | | 2.30 | |
| NVR, Inc.* | | | 1,287 | | | | 12,627,787 | | | | 3.96 | |
| PulteGroup, Inc. | | | 42,228 | | | | 6,060,985 | | | | 1.90 | |
| Toll Brothers, Inc. | | | 60,095 | | | | 9,284,076 | | | | 2.91 | |
| | | | | | | | 35,286,068 | | | | 11.07 | |
| Insurance Brokers | | | | | | | | | | | | |
| Arthur J. Gallagher & Company | | | 10,246 | | | | 2,882,917 | | | | 0.90 | |
| | | | | | | | | | | | | |
| Leisure Products | | | | | | | | | | | | |
| Acushnet Holdings Corp. | | | 100,319 | | | | 6,395,336 | | | | 2.01 | |
| | | | | | | | | | | | | |
| Movies & Entertainment | | | | | | | | | | | | |
| Spotify Technology S.A.* | | | 51,343 | | | | 18,921,436 | | | | 5.94 | |
| | | | | | | | | | | | | |
| Real Estate Services | | | | | | | | | |
| CBRE Group, Inc. - Cl. A* | | | 78,825 | | | | 9,812,136 | | | | 3.08 | |
| | | | | | | | | | | | | |
| Restaurants | | | | | | | | | | | | |
| Chipotle Mexican Grill, Inc.* | | | 329,100 | | | | 18,962,742 | | | | 5.95 | |
| Sweetgreen, Inc. - Cl. A* | | | 145,823 | | | | 5,169,425 | | | | 1.62 | |
| | | | | | | | 24,132,167 | | | | 7.57 | |
| Semiconductor Materials & Equipment | | | | | | | | | | | | |
| KLA Corp. | | | 21,400 | | | | 16,572,374 | | | | 5.20 | |
| | | | | | | | | | | | | |
| Semiconductors | | | | | | | | | | | | |
| Marvell Technology, Inc. | | | 101,435 | | | | 7,315,492 | | | | 2.29 | |
| Microchip Technology, Inc. | | | 109,468 | | | | 8,789,186 | | | | 2.76 | |
| | | | | | | | 16,104,678 | | | | 5.05 | |
| Systems Software | | | | | | | | | | | | |
| CrowdStrike Holdings, Inc. - Cl. A* | | | 17,508 | | | | 4,910,469 | | | | 1.54 | |
| | | | | | | | | | | | | |
| Trading Companies & Distributors | | | | | | | | | | | | |
| United Rentals, Inc. | | | 9,690 | | | | 7,846,284 | | | | 2.46 | |
| Watsco, Inc. | | | 14,415 | | | | 7,090,450 | | | | 2.23 | |
| | | | | | | | 14,936,734 | | | | 4.69 | |
| | | | | | | | | | | | | |
| TOTAL COMMON STOCKS | | | | | | | | | | | | |
| (Cost $168,473,973) | | | | | | | 312,619,495 | | | | 98.09 | |
| | | | | | | | | | | | | |
| WARRANTS | | | | | | | | | | | | |
| Application Software | | | | | | | | | | | | |
| Constellation Software, Inc. | | | | | | | | | | | | |
| Warrants, Strike Price: Pending, | | | | | | | | | | | | |
| Expiration Date: March 31, 2040*@^ | | | 5,185 | | | | 0 | | | | 0.00 | |
| | | | | | | | | | | | | |
| TOTAL WARRANTS | | | | | | | | | | | | |
| (Cost $0) | | | | | | | 0 | | | | 0.00 | |
| | | | | | | | | | | | | |
| SHORT-TERM INVESTMENTS | | | | | | | | | | | | |
| State Street Institutional Treasury Money Market Fund - Premier Class, 4.97%# | | | 7,424,133 | | | | 7,424,133 | | | | 2.33 | |
| | | | | | | | | | | | | |
| TOTAL SHORT-TERM INVESTMENTS | | | | | | | | | | | | |
| (Cost $7,424,133) | | | | | | | 7,424,133 | | | | 2.33 | |
| | | | | | | | | | | | | |
| TOTAL INVESTMENTS | | | | | | | | | | | | |
| (Cost $175,898,106) | | | | | | | 320,043,628 | | | | 100.42 | |
| | | | | | | | | | | | | |
| Liabilities, Less Cash and Other Assets | | | | | | | (1,329,855 | ) | | | (0.42 | ) |
| | | | | | | | | | | | | |
| NET ASSETS | | | | | | $ | 318,713,773 | | | | 100.00 | % |
6
SUMMARY OF FAIR VALUE MEASUREMENTS
The following is a summary of the fair values of the Fund’s investments according to the valuation inputs utilized as of September 30, 2024.
Fund Investment by
Major Security Type | | Level 1 -
Quoted Prices | | | Level 2 -
Other Significant
Observable Inputs | | | Level 3 -
Significant
Unobservable Inputs | | | Total | |
| Assets | | | | | | | | | | | | | | | | |
| Common Stocks | | $ | 312,619,495 | | | $ | — | | | $ | — | | | $ | 312,619,495 | |
| Warrants | | | | | | | | | | | | | | | | |
| Information Technology | | | — | | | | — | | | | — | ** | | | — | |
| Short-term Investments | | | 7,424,133 | | | | — | | | | — | | | | 7,424,133 | |
| | | $ | 320,043,628 | | | $ | — | | | $ | — | | | $ | 320,043,628 | |
** Constellation Software, Inc. warrants represent the only Level 3 security held by the Fund.
For more information on investment valuation and valuation inputs, refer to Note 2(a) in the Notes to Financial Statements.
| * | Non-income producing. |
| @ | Security valued at fair value using significant unobservable inputs as determined in good faith by Marsico Capital Management, LLC (the “Adviser”), as the Fund’s Board of Trustees’ valuation designee. As of September 30, 2024, the total value of Level 3 securities was $0, which represents 0.00% of the Fund’s net assets. |
| ^ | As of September 30, 2024, certain information for the security, such as the strike price, is pending announcement by the issuer. |
| # | Rate shown is the 7-day yield as of September 30, 2024. |
| | | |
| | | See notes to financial statements. |
7
MARSICO INTERNATIONAL OPPORTUNITIES FUND
SCHEDULE OF INVESTMENTS
As of September 30, 2024
| | | Number
of
Shares/
Warrants | | | Value | | | Percent
of Net
Assets | |
| COMMON STOCKS | | | | | | | | | | | | |
| Aerospace & Defense | | | | | | | | | | | | |
| Airbus S.E. | | | 9,033 | | | $ | 1,319,427 | | | | 2.34 | % |
| General Electric Co. DBA GE Aerospace | | | 9,337 | | | | 1,760,772 | | | | 3.12 | |
| Rolls-Royce Holdings PLC* | | | 442,549 | | | | 3,119,263 | | | | 5.53 | |
| Safran S.A. | | | 8,140 | | | | 1,912,785 | | | | 3.39 | |
| | | | | | | | 8,112,247 | | | | 14.38 | |
| Apparel, Accessories & Luxury Goods | | | | | | | | | | | | |
| Hermes International | | | 741 | | | | 1,819,605 | | | | 3.23 | |
| | | | | | | | | | | | | |
| Application Software | | | | | | | | | | | | |
| Constellation Software, Inc. | | | 438 | | | | 1,424,969 | | | | 2.53 | |
| SAP S.E. | | | 13,737 | | | | 3,125,549 | | | | 5.54 | |
| Synopsys, Inc.* | | | 1,587 | | | | 803,641 | | | | 1.42 | |
| | | | | | | | 5,354,159 | | | | 9.49 | |
| Automobile Manufacturers | | | | | | | | | | | | |
| Ferrari N.V. | | | 3,733 | | | | 1,754,921 | | | | 3.11 | |
| | | | | | | | | | | | | |
| Broadline Retail | | | | | | | | | | | | |
| Amazon.com, Inc.* | | | 7,723 | | | | 1,439,026 | | | | 2.55 | |
| | | | | | | | | | | | | |
| Health Care Supplies | | | | | | | | | | | | |
| EssilorLuxottica S.A. | | | 3,352 | | | | 793,269 | | | | 1.41 | |
| | | | | | | | | | | | | |
| Homebuilding | | | | | | | | | | | | |
| Toll Brothers, Inc. | | | 7,465 | | | | 1,153,268 | | | | 2.04 | |
| | | | | | | | | | | | | |
| Industrial Gases | | | | | | | | | | | | |
| Air Liquide S.A. | | | 6,308 | | | | 1,216,588 | | | | 2.16 | |
| Linde PLC | | | 1,692 | | | | 806,847 | | | | 1.43 | |
| | | | | | | | 2,023,435 | | | | 3.59 | |
| Integrated Oil & Gas | | | | | | | | | | | | |
| TotalEnergies S.E. | | | 26,457 | | | | 1,722,860 | | | | 3.05 | |
| | | | | | | | | | | | | |
| Interactive Media & Services | | | | | | | | | | | | |
| Meta Platforms, Inc. - Cl. A | | | 4,344 | | | | 2,486,679 | | | | 4.41 | |
| | | | | | | | | | | | | |
| Internet Services & Infrastructure | | | | | | | | | | | | |
| Shopify, Inc. - Cl. A* | | | 21,248 | | | | 1,702,815 | | | | 3.02 | |
| | | | | | | | | | | | | |
| Movies & Entertainment | | | | | | | | | | | | |
| Netflix, Inc.* | | | 2,036 | | | | 1,444,074 | | | | 2.56 | |
| Spotify Technology S.A.* | | | 8,100 | | | | 2,985,093 | | | | 5.29 | |
| | | | | | | | 4,429,167 | | | | 7.85 | |
| Pharmaceuticals | | | | | | | | | | | | |
| Eli Lilly & Company | | | 2,364 | | | | 2,094,362 | | | | 3.71 | |
| Novo Nordisk A/S - Cl. B | | | 20,592 | | | | 2,419,423 | | | | 4.29 | |
| | | | | | | | 4,513,785 | | | | 8.00 | |
| Real Estate Services | | | | | | | | | | | | |
| FirstService Corp. | | | 3,400 | | | | 621,224 | | | | 1.10 | |
| | | | | | | | | | | | | |
| Restaurants | | | | | | | | | | | | |
| Chipotle Mexican Grill, Inc.* | | | 19,400 | | | | 1,117,828 | | | | 1.98 | |
| | | | | | | | | | | | | |
| Semiconductor Materials & Equipment | | | | | | | | | | | | |
| ASML Holding N.V. | | | 2,897 | | | | 2,404,406 | | | | 4.26 | |
| Tokyo Electron Ltd. | | | 8,500 | | | | 1,495,669 | | | | 2.65 | |
| | | | | | | | 3,900,075 | | | | 6.91 | |
| Semiconductors | | | | | | | | | | | | |
| ARM Holdings PLC ADR* | | | 12,139 | | | | 1,735,998 | | | | 3.08 | |
| NVIDIA Corp. | | | 21,690 | | | | 2,634,034 | | | | 4.67 | |
| Taiwan Semiconductor Manufacturing Co., Ltd. Spon. ADR | | | 19,266 | | | | 3,345,926 | | | | 5.93 | |
| | | | | | | | 7,715,958 | | | | 13.68 | |
| Soft Drinks & Non-alcoholic Beverages | | | | | | | | | | | | |
| Coca-Cola Europacific Partners PLC | | | 18,288 | | | | 1,440,180 | | | | 2.55 | |
| | | | | | | | | | | | | |
| Systems Software | | | | | | | | | | | | |
| Microsoft Corp. | | | 3,458 | | | | 1,487,977 | | | | 2.64 | |
| | | | | | | | | | | | | |
| Technology Hardware, Storage & Peripherals | | | | | | | | | | | | |
| Apple, Inc. | | | 8,722 | | | | 2,032,226 | | | | 3.60 | |
| | | | | | | | | | | | | |
| TOTAL COMMON STOCKS | | | | | | | | | | | | |
| (Cost $34,738,643) | | | | | | | 55,620,704 | | | | 98.59 | |
| | | | | | | | | | | | | |
| WARRANTS | | | | | | | | | | | | |
| Application Software | | | | | | | | | | | | |
| Constellation Software, Inc. Warrants, Strike Price: Pending, Expiration Date: March 31, 2040*@^ | | | 306 | | | | 0 | | | | 0.00 | |
| | | | | | | | | | | | | |
| TOTAL WARRANTS | | | | | | | | | | | | |
| (Cost $0) | | | | | | | 0 | | | | 0.00 | |
| | | | | | | | | | | | | |
| SHORT-TERM INVESTMENTS | | | | | | | | | | | | |
| State Street Institutional Treasury Money Market Fund - Premier Class, 4.97%# | | | 871,638 | | | | 871,638 | | | | 1.54 | |
| | | | | | | | | | | | | |
| TOTAL SHORT-TERM INVESTMENTS | | | | | | | | | | | | |
| (Cost $871,638) | | | | | | | 871,638 | | | | 1.54 | |
| | | | | | | | | | | | | |
| TOTAL INVESTMENTS | | | | | | | | | | | | |
| (Cost $35,610,281) | | | | | | | 56,492,342 | | | | 100.13 | |
| | | | | | | | | | | | | |
| Liabilities, Less Cash and Other Assets | | | | | | | (74,876 | ) | | | (0.13 | ) |
| | | | | | | | | | | | | |
| NET ASSETS | | | | | | $ | 56,417,466 | | | | 100.00 | % |
8
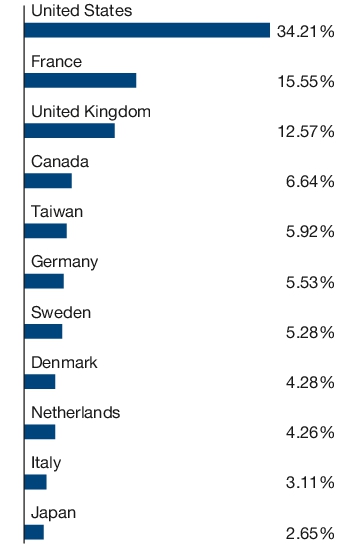
| SUMMARY OF INVESTMENTS BY COUNTRY | | | |
| | | | |
| Country | | Market Value | | | Percent of
Investment
Securities | |
| Canada | | $ | 3,749,008 | | | | 6.64 | % |
| Denmark | | | 2,419,423 | | | | 4.28 | |
| France | | | 8,784,534 | | | | 15.55 | |
| Germany | | | 3,125,549 | | | | 5.53 | |
| Italy | | | 1,754,921 | | | | 3.11 | |
| Japan | | | 1,495,669 | | | | 2.65 | |
| Netherlands | | | 2,404,406 | | | | 4.26 | |
| Sweden | | | 2,985,093 | | | | 5.28 | |
| Taiwan | | | 3,345,926 | | | | 5.92 | |
| United Kingdom | | | 7,102,288 | | | | 12.57 | |
| United States(1) | | | 19,325,525 | | | | 34.21 | |
| | | $ | 56,492,342 | | | | 100.00 | % |
| (1) | Includes short-term securities. |
SUMMARY OF FAIR VALUE MEASUREMENTS
The following is a summary of the fair values of the Fund’s investments according to the valuation inputs utilized as of September 30, 2024.
Fund Investment by
Major Security Type | | Level 1 -
Quoted Prices | | | Level 2 -
Other Significant
Observable Inputs | | | Level 3 -
Significant
Unobservable Inputs | | | Total | |
| Assets | | | | | | | | | | | | | | | | |
| Common Stocks | | $ | 55,620,704 | | | $ | — | | | $ | — | | | $ | 55,620,704 | |
| Warrants | | | | | | | | | | | | | | | | |
| Information Technology | | | — | | | | — | | | | — | ** | | | — | |
| Short-term Investments | | | 871,638 | | | | — | | | | — | | | | 871,638 | |
| | | $ | 56,492,342 | | | $ | — | | | $ | — | | | $ | 56,492,342 | |
| ** | Constellation Software, Inc. warrants represent the only Level 3 security held by the Fund. |
For more information on investment valuation and valuation inputs, refer to Note 2(a) in the Notes to Financial Statements.
| @ | Security valued at fair value using significant unobservable inputs as determined in good faith by the Adviser, as the Fund’s Board of Trustees’ valuation designee. As of September 30, 2024, the total value of Level 3 securities was $0, which represents 0.00% of the Fund’s net assets. |
| ^ | As of September 30, 2024, certain information for the security, such as the strike price, is pending announcement by the issuer. |
| # | Rate shown is the 7-day yield as of September 30, 2024. |
See notes to financial statements.
9
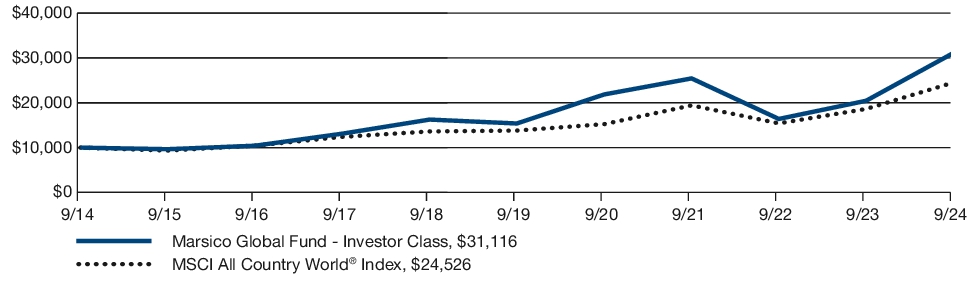
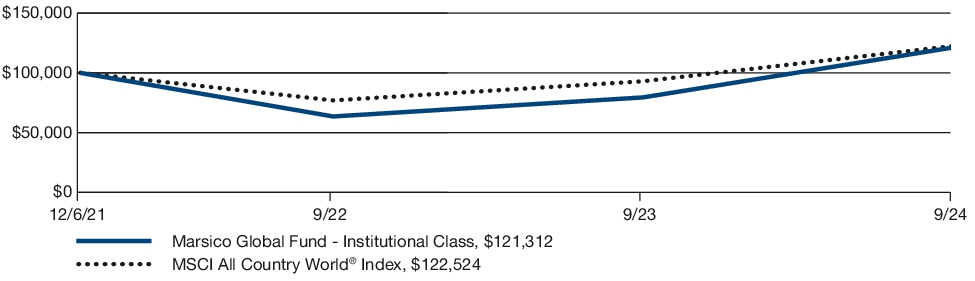
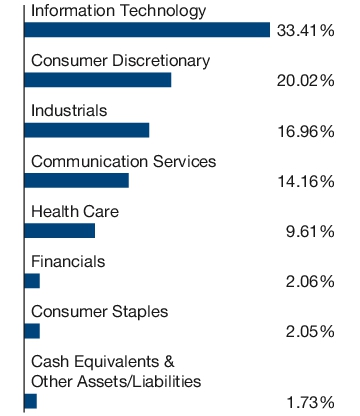
MARSICO GLOBAL FUND
SCHEDULE OF INVESTMENTS
As of September 30, 2024
| | | Number
of
Shares | | | Value | | | Percent
of Net
Assets | |
| COMMON STOCKS | | | | | | | | | | | | |
| Aerospace & Defense | | | | | | | | | | | | |
| Airbus S.E. | | | 58,354 | | | $ | 8,523,621 | | | | 2.36 | % |
| General Electric Co. DBA GE Aerospace | | | 76,954 | | | | 14,511,985 | | | | 4.02 | |
| Rolls-Royce Holdings PLC* | | | 2,114,160 | | | | 14,901,449 | | | | 4.13 | |
| Safran S.A. | | | 40,461 | | | | 9,507,762 | | | | 2.64 | |
| | | | | | | | 47,444,817 | | | | 13.15 | |
| Apparel, Accessories & Luxury Goods | | | | | | | | | | | | |
| Hermes International | | | 5,825 | | | | 14,303,914 | | | | 3.96 | |
| | | | | | | | | | | | | |
| Application Software | | | | | | | | | | | | |
| SAP S.E. Spon. ADR | | | 54,394 | | | | 12,461,665 | | | | 3.45 | |
| Synopsys, Inc.* | | | 14,289 | | | | 7,235,807 | | | | 2.01 | |
| | | | | | | | 19,697,472 | | | | 5.46 | |
| Automobile Manufacturers | | | | | | | | | | | | |
| Ferrari N.V. | | | 26,043 | | | | 12,243,075 | | | | 3.39 | |
| Tesla, Inc.* | | | 31,556 | | | | 8,255,996 | | | | 2.29 | |
| | | | | | | | 20,499,071 | | | | 5.68 | |
| Automotive Retail | | | | | | | | | | | | |
| O’Reilly Automotive, Inc.* | | | 5,638 | | | | 6,492,721 | | | | 1.80 | |
| | | | | | | | | | | | | |
| Broadline Retail | | | | | | | | | | | | |
| Amazon.com, Inc.* | | | 62,761 | | | | 11,694,257 | | | | 3.24 | |
| | | | | | | | | | | | | |
| Consumer Staples Merchandise Retail | | | | | | | | | | | | |
| Costco Wholesale Corp. | | | 8,334 | | | | 7,388,258 | | | | 2.05 | |
| | | | | | | | | | | | | |
| Diversified Banks | | | | | | | | | | | | |
| JPMorgan Chase & Company | | | 35,162 | | | | 7,414,259 | | | | 2.06 | |
| | | | | | | | | | | | | |
| Heavy Electrical Equipment | | | | | | | | | | | | |
| GE Vernova, Inc.* | | | 53,915 | | | | 13,747,247 | | | | 3.81 | |
| | | | | | | | | | | | | |
| Homebuilding | | | | | | | | | | | | |
| Toll Brothers, Inc. | | | 65,505 | | | | 10,119,867 | | | | 2.81 | |
| | | | | | | | | | | | | |
| Interactive Media & Services | | | | | | | | | | | | |
| Alphabet, Inc. - Cl. A | | | 36,527 | | | | 6,058,003 | | | | 1.68 | |
| Meta Platforms, Inc. - Cl. A | | | 33,816 | | | | 19,357,631 | | | | 5.36 | |
| | | | | | | | 25,415,634 | | | | 7.04 | |
| Managed Health Care | | | | | | | | | | | | |
| UnitedHealth Group, Inc. | | | 16,831 | | | | 9,840,749 | | | | 2.73 | |
| | | | | | | | | | | | | |
| Movies & Entertainment | | | | | | | | | | | | |
| Netflix, Inc.* | | | 16,875 | | | | 11,968,931 | | | | 3.32 | |
| Spotify Technology S.A.* | | | 37,190 | | | | 13,705,631 | | | | 3.80 | |
| | | | | | | | 25,674,562 | | | | 7.12 | |
| Pharmaceuticals | | | | | | | | | | | | |
| Eli Lilly & Company | | | 14,804 | | | | 13,115,456 | | | | 3.63 | |
| Novo Nordisk A/S - Cl. B | | | 99,735 | | | | 11,718,198 | | | | 3.25 | |
| | | | | | | | 24,833,654 | | | | 6.88 | |
| Restaurants | | | | | | | | | | | | |
| Chipotle Mexican Grill, Inc.* | | | 158,350 | | | | 9,124,127 | | | | 2.53 | |
| | | | | | | | | | | | | |
| Semiconductor Materials & Equipment | | | | | | | | | | | | |
| ASML Holding N.V. - NY Reg. Shs. | | | 16,255 | | | | 13,544,479 | | | | 3.75 | |
| | | | | | | | | | | | | |
| Semiconductors | | | | | | | | | | | | |
| ARM Holdings PLC ADR* | | | 97,303 | | | | 13,915,302 | | | | 3.86 | |
| NVIDIA Corp. | | | 148,139 | | | | 17,990,000 | | | | 4.99 | |
| Taiwan Semiconductor Manufacturing Co., Ltd. Spon. ADR | | | 100,423 | | | | 17,440,463 | | | | 4.83 | |
| | | | | | | | 49,345,765 | | | | 13.68 | |
| Systems Software | | | | | | | | | | | | |
| Microsoft Corp. | | | 43,507 | | | | 18,721,062 | | | | 5.19 | |
| | | | | | | | | | | | | |
| Technology Hardware, Storage & Peripherals | | | | | | | | | | | | |
| Apple, Inc. | | | 82,573 | | | | 19,239,509 | | | | 5.33 | |
| | | | | | | | | | | | | |
| TOTAL COMMON STOCKS | | | | | | | | | | | | |
| (Cost $215,597,750) | | | | | | | 354,541,424 | | | | 98.27 | |
| | | | | | | | | | | | | |
| SHORT-TERM INVESTMENTS | | | | | | | | | | | | |
| State Street Institutional Treasury Money Market Fund - Premier Class, 4.97%# | | | 6,637,820 | | | | 6,637,820 | | | | 1.84 | |
| | | | | | | | | | | | | |
| TOTAL SHORT-TERM INVESTMENTS | | | | | | | | | | | | |
| (Cost $6,637,820) | | | | | | | 6,637,820 | | | | 1.84 | |
| | | | | | | | | | | | | |
| TOTAL INVESTMENTS | | | | | | | | | | | | |
| (Cost $222,235,570) | | | | | | | 361,179,244 | | | | 100.11 | |
| | | | | | | | | | | | | |
| Liabilities, Less Cash and Other Assets | | | | | | | (388,351 | ) | | | (0.11 | ) |
| | | | | | | | | | | | | |
| NET ASSETS | | | | | | $ | 360,790,893 | | | | 100.00 | % |
10
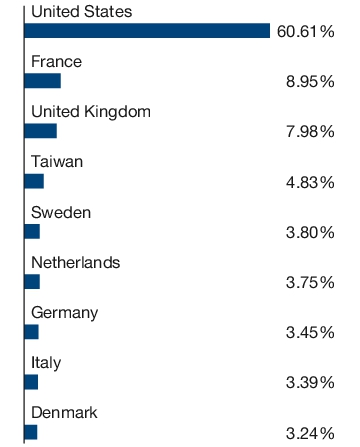
SUMMARY OF INVESTMENTS BY COUNTRY
| Country | | Market Value | | | Percent of Investment Securities | |
| Denmark | | $ | 11,718,198 | | | | 3.24 | % |
| France | | | 32,335,297 | | | | 8.95 | |
| Germany | | | 12,461,665 | | | | 3.45 | |
| Italy | | | 12,243,075 | | | | 3.39 | |
| Netherlands | | | 13,544,479 | | | | 3.75 | |
| Sweden | | | 13,705,631 | | | | 3.80 | |
| Taiwan | | | 17,440,463 | | | | 4.83 | |
| United Kingdom | | | 28,816,751 | | | | 7.98 | |
| United States(1) | | | 218,913,685 | | | | 60.61 | |
| | | $ | 361,179,244 | | | | 100.00 | % |
| (1) | Includes short-term securities. |
SUMMARY OF FAIR VALUE MEASUREMENTS
As of September 30, 2024, all investments disclosed in the preceding Schedule of Investments were classified as Level 1.
For more information on investment valuation and valuation inputs, refer to Note 2(a) in the Notes to Financial Statements.
| * | Non-income producing. |
| # | Rate shown is the 7-day yield as of September 30, 2024. |
| | |
| | See notes to financial statements. |
11
STATEMENTS OF ASSETS AND LIABILITIES
September 30, 2024
| | | | | | | |
| | | | | | | |
| | | MARSICO | | | MARSICO | |
| (Amounts in thousands) | | FOCUS FUND | | | GROWTH FUND | |
| | | | | | | |
| ASSETS | | | | | | |
| Investments, at value (cost $460,107, $248,659, $175,898, $35,610, and $222,236, respectively) | | $ | 1,036,622 | | | $ | 461,844 | |
| Receivable for capital stock sold | | | 109 | | | | 56 | |
| Dividends receivable | | | 204 | | | | 108 | |
| Prepaid expenses and other assets | | | 3,707 | | | | 1,584 | |
| Total Assets | | | 1,040,642 | | | | 463,592 | |
| | | | | | | | | |
| LIABILITIES | | | | | | | | |
| Payable for capital stock redeemed | | | 235 | | | | 162 | |
| Payable to investment adviser | | | 598 | | | | 285 | |
| Accrued trustees’ fees | | | 3,652 | | | | 1,543 | |
| Accrued distribution fee | | | 2,696 | | | | 2,029 | |
| Accrued professional fees | | | 178 | | | | 77 | |
| Accrued transfer agent fees and expenses | | | 106 | | | | 51 | |
| Accrued custody and fund accounting fees | | | 50 | | | | 33 | |
| Accrued expenses and other liabilities | | | 77 | | | | 49 | |
| Total Liabilities | | | 7,592 | | | | 4,229 | |
| | | | | | | | | |
| NET ASSETS | | $ | 1,033,050 | | | $ | 459,363 | |
| | | | | | | | | |
| NET ASSETS CONSIST OF | | | | | | | | |
| Paid-in-capital | | $ | 407,130 | | | $ | 212,625 | |
| Total distributable earnings | | | 625,920 | | | | 246,738 | |
| NET ASSETS | | $ | 1,033,050 | | | $ | 459,363 | |
| | | | | | | | | |
| | | | | | | | | |
| NET ASSET VALUE INFORMATION BY CLASS | | | | | | | | |
| | | | | | | | | |
| INVESTOR CLASS: | | | | | | | | |
| Net Assets | | $ | 849,445 | | | $ | 410,945 | |
| Shares Outstanding, $0.001 par value (Unlimited shares authorized) | | | 28,693 | | | | 15,455 | |
| NET ASSET VALUE, REDEMPTION PRICE, AND OFFERING PRICE PER SHARE (NET ASSETS/SHARES OUTSTANDING)* | | $ | 29.60 | | | $ | 26.59 | |
| | | | | | | | | |
| INSTITUTIONAL CLASS: | | | | | | | | |
| Net Assets | | $ | 183,605 | | | $ | 48,418 | |
| Shares Outstanding, $0.001 par value (Unlimited shares authorized) | | | 6,152 | | | | 1,808 | |
| NET ASSET VALUE, REDEMPTION PRICE, AND OFFERING PRICE PER SHARE (NET ASSETS/SHARES OUTSTANDING)* | | $ | 29.85 | | | $ | 26.78 | |
| * | Not in thousands, based on unrounded net assets and shares outstanding. |
| | |
| | See notes to financial statements. |
12
| | MARSICO MIDCAP GROWTH FOCUS FUND | | | | MARSICO INTERNATIONAL OPPORTUNITIES FUND | | | | MARSICO GLOBAL FUND | |
| | | | | | | | | | | |
| | | | | | | | | | | |
| $ | 320,044 | | | $ | 56,492 | | | $ | 361,179 | |
| | 52 | | | | 14 | | | | 5 | |
| | 61 | | | | 197 | | | | 227 | |
| | 1,359 | | | | 237 | | | | 935 | |
| | 321,516 | | | | 56,940 | | | | 362,346 | |
| | | | | | | | | | | |
| | | | | | | | | | | |
| | 402 | | | | 8 | | | | 38 | |
| | 198 | | | | 25 | | | | 231 | |
| | 1,335 | | | | 213 | | | | 912 | |
| | 690 | | | | 205 | | | | 193 | |
| | 55 | | | | 15 | | | | 53 | |
| | 40 | | | | 12 | | | | 44 | |
| | 32 | | | | 23 | | | | 35 | |
| | 50 | | | | 22 | | | | 49 | |
| | 2,802 | | | | 523 | | | | 1,555 | |
| | | | | | | | | | | |
| $ | 318,714 | | | $ | 56,417 | | | $ | 360,791 | |
| | | | | | | | | | | |
| | | | | | | | | | | |
| $ | 159,370 | | | $ | 34,702 | | | $ | 219,266 | |
| | 159,344 | | | | 21,715 | | | | 141,525 | |
| $ | 318,714 | | | $ | 56,417 | | | $ | 360,791 | |
| | | | | | | | | | | |
| | | | | | | | | | | |
| | | | | | | | | | | |
| | | | | | | | | | | |
| | | | | | | | | | | |
| $ | 284,394 | | | $ | 51,229 | | | $ | 190,745 | |
| | 5,899 | | | | 2,068 | | | | 7,571 | |
| | | | | | | | | | | |
| $ | 48.21 | | | $ | 24.78 | | | $ | 25.19 | |
| | | | | | | | | | | |
| | | | | | | | | | | |
| $ | 34,320 | | | $ | 5,188 | | | $ | 170,046 | |
| | 707 | | | | 208 | | | | 6,687 | |
| | | | | | | | | | | |
| $ | 48.55 | | | $ | 24.91 | | | $ | 25.43 | |
13
STATEMENTS OF OPERATIONS
FOR THE YEAR ENDED September 30, 2024
| | | | | | | |
| | | | | | | |
| (Amounts in thousands) | | MARSICO FOCUS FUND | | | MARSICO GROWTH FUND | |
| | | | | | | |
| INVESTMENT INCOME | | | | | | | | |
| Dividends (net of $146, $51, $3, $54, and $144, respectively, of non-reclaimable foreign withholding taxes) | | $ | 6,379 | | | $ | 2,822 | |
| Total Investment Income | | | 6,379 | | | | 2,822 | |
| | | | | | | | | |
| EXPENSES | | | | | | | | |
| Investment advisory fees | | | 6,570 | | | | 3,045 | |
| Distribution fees: | | | | | | | | |
| Investor Class | | | 1,866 | | | | 876 | |
| Transfer agent fees and expenses: | | | | | | | | |
| Investor Class | | | 687 | | | | 342 | |
| Institutional Class | | | 108 | | | | 32 | |
| Trustees’ fees and expenses | | | 544 | (1) | | | 193 | (1) |
| Professional fees | | | 426 | | | | 187 | |
| Recoupment of previously waived expenses (Note 3) | | | 204 | | | | 42 | |
| Fund administration fees: | | | | | | | | |
| Investor Class | | | 152 | | | | 125 | |
| Institutional Class | | | 34 | | | | 18 | |
| Custody and fund accounting fees | | | 143 | | | | 97 | |
| Reporting, printing, and postage expenses | | | 106 | | | | 56 | |
| Federal and state registration fees | | | 53 | | | | 49 | |
| Other expenses | | | 164 | | | | 77 | |
| Total Expenses | | | 11,057 | | | | 5,139 | |
| Less waiver of expenses (Note 3) and expenses paid indirectly (Note 2(b)) | | | — | | | | — | |
| Net Expenses | | | 11,057 | | | | 5,139 | |
| | | | | | | | | |
| NET INVESTMENT LOSS | | | (4,678 | ) | | | (2,317 | ) |
| | | | | | | | | |
| REALIZED AND UNREALIZED GAIN (LOSS) | | | | | | | | |
| Net realized gain on investments | | | 61,826 | | | | 40,265 | |
| Net realized gain (loss) on foreign currency transactions | | | — | | | | — | |
| Change in unrealized appreciation on investments, foreign currency translations, and non-interested trustees’ deferred compensation | | | 295,398 | | | | 114,904 | |
| | | | | | | | | |
| Net Gain on Investments | | | 357,224 | | | | 155,169 | |
| | | | | | | | | |
| NET INCREASE IN NET ASSETS RESULTING FROM OPERATIONS | | $ | 352,546 | | | $ | 152,852 | |
| (1) | Amounts include Trustees’ fees and expenses and the mark to market unrealized appreciation during the period for shares held in the Non-Interested Trustees’ Deferred Fee Plan, as more fully described in Note 2(g) in the Notes to Financial Statements. |
| | | | | | | |
| | | Trustees’ Fees and Expenses* | | | Unrealized Appreciation* | |
| Focus Fund | | $ | 207,559 | | | $ | 336,094 | |
| Growth Fund | | | 91,017 | | | | 102,156 | |
| Midcap Growth Focus Fund | | | 63,355 | | | | 69,986 | |
| International Opportunities Fund | | | 10,231 | | | | 11,336 | |
| Global Fund | | | 51,176 | | | | 64,237 | |
| * | Not in thousands. |
| | |
| | See notes to financial statements. |
14
| | MARSICO MIDCAP GROWTH FOCUS FUND | | | | MARSICO INTERNATIONAL OPPORTUNITIES FUND | | | | MARSICO GLOBAL FUND | |
| | | | | | | | | | | |
| | | | | | | | | | | |
| $ | 1,622 | | | $ | 479 | | | $ | 2,014 | |
| | 1,622 | | | | 479 | | | | 2,014 | |
| | | | | | | | | | | |
| | | | | | | | | | | |
| | 2,175 | | | | 370 | | | | 1,995 | |
| | | | | | | | | | | |
| | 617 | | | | 106 | | | | 423 | |
| | | | | | | | | | | |
| | 307 | | | | 69 | | | | 237 | |
| | 31 | | | | 12 | | | | 92 | |
| | 133 | (1) | | | 22 | (1) | | | 115 | (1) |
| | 131 | | | | 30 | | | | 114 | |
| | — | | | | — | | | | 66 | |
| | | | | | | | | | | |
| | 115 | | | | 47 | | | | 104 | |
| | 16 | | | | 8 | | | | 50 | |
| | 94 | | | | 71 | | | | 102 | |
| | 47 | | | | 22 | | | | 43 | |
| | 36 | | | | 31 | | | | 35 | |
| | 68 | | | | 15 | | | | 52 | |
| | 3,770 | | | | 803 | | | | 3,428 | |
| | — | | | | (119 | ) | | | — | |
| | 3,770 | | | | 684 | | | | 3,428 | |
| | | | | | | | | | | |
| | (2,148 | ) | | | (205 | ) | | | (1,414 | ) |
| | | | | | | | | | | |
| | | | | | | | | | | |
| | 19,303 | | | | 2,725 | | | | 5,989 | |
| | 7 | | | | (785 | ) | | | 331 | |
| | | | | | | | | | | |
| | 82,321 | | | | 15,552 | | | | 85,208 | |
| | | | | | | | | | | |
| | 101,631 | | | | 17,492 | | | | 91,528 | |
| | | | | | | | | | | |
| $ | 99,483 | | | $ | 17,287 | | | $ | 90,114 | |
15
STATEMENTS OF CHANGES IN NET ASSETS
| | | | | | | |
| | | MARSICO
FOCUS FUND | | | MARSICO
GROWTH FUND | |
| | | | | | | |
| (Amounts in thousands) | | Year Ended 9/30/24 | | | Year Ended 9/30/23 | | | Year Ended 9/30/24 | | | Year Ended 9/30/23 | |
| | | | | | | | | | | | | | | | | |
| OPERATIONS: | | | | | | | | | | | | | | | | |
| Net investment income (loss) | | $ | (4,678 | ) | | $ | (3,899 | ) | | $ | (2,317 | ) | | $ | (1,650 | ) |
| Net realized gain on investments | | | 61,826 | | | | 15,227 | | | | 40,265 | | | | 9,528 | |
| Net realized gain (loss) on foreign currency transactions | | | — | | | | — | | | | — | | | | (333 | ) |
| Change in unrealized appreciation on investments, foreign currency translations, and non-interested trustees’ deferred compensation | | | 295,398 | | | | 135,018 | | | | 114,904 | | | | 54,959 | |
| Increase from payment by service provider | | | — | | | | — | | | | — | | | | — | |
| | | | | | | | | | | | | | | | | |
| Net increase in net assets resulting from operations | | | 352,546 | | | | 146,346 | | | | 152,852 | | | | 62,504 | |
| | | | | | | | | | | | | | | | | |
| DISTRIBUTIONS: | | | | | | | | | | | | | | | | |
| Investor Class | | | (13,561 | ) | | | (73,616 | ) | | | (5,168 | ) | | | — | |
| Institutional Class | | | (2,475 | ) | | | (10,950 | ) | | | (567 | ) | | | — | |
| | | | | | | | | | | | | | | | | |
| Total distributions | | | (16,036 | ) | | | (84,566 | ) | | | (5,735 | ) | | | — | |
| | | | | | | | | | | | | | | | | |
| CAPITAL SHARE TRANSACTIONS: | | | | | | | | | | | | | | | | |
| Investor Class: | | | | | | | | | | | | | | | | |
| Proceeds from sales of shares | | | 134,007 | | | | 20,304 | | | | 68,731 | | | | 19,901 | |
| Proceeds from reinvestment of distributions | | | 13,132 | | | | 70,749 | | | | 4,984 | | | | — | |
| Redemption of shares | | | (145,878 | ) | | | (74,241 | ) | | | (55,745 | ) | | | (38,686 | ) |
| | | | | | | | | | | | | | | | | |
| Net increase (decrease) from Investor Class capital share transactions | | | 1,261 | | | | 16,812 | | | | 17,970 | | | | (18,785 | ) |
| | | | | | | | | | | | | | | | | |
| Institutional Class: | | | | | | | | | | | | | | | | |
| Proceeds from sales of shares | | | 56,080 | | | | 26,512 | | | | 10,841 | | | | 4,348 | |
| Proceeds from reinvestment of distributions | | | 2,332 | | | | 9,085 | | | | 529 | | | | — | |
| Redemption of shares | | | (34,009 | ) | | | (29,195 | ) | | | (4,707 | ) | | | (4,844 | ) |
| | | | | | | | | | | | | | | | | |
| Net increase (decrease) from Institutional Class capital share transactions | | | 24,403 | | | | 6,402 | | | | 6,663 | | | | (496 | ) |
| | | | | | | | | | | | | | | | | |
| TOTAL INCREASE IN NET ASSETS | | | 362,174 | | | | 84,994 | | | | 171,750 | | | | 43,223 | |
| | | | | | | | | | | | | | | | | |
| NET ASSETS: | | | | | | | | | | | | | | | | |
| Beginning of Period | | | 670,876 | | | | 585,882 | | | | 287,613 | | | | 244,390 | |
| | | | | | | | | | | | | | | | | |
| End of Period | | $ | 1,033,050 | | | $ | 670,876 | | | $ | 459,363 | | | $ | 287,613 | |
| | | | | | | | | | | | | | | | | |
| TRANSACTIONS IN SHARES: | | | | | | | | | | | | | | | | |
| Investor Class: | | | | | | | | | | | | | | | | |
| Shares sold | | | 5,097 | | | | 946 | | | | 3,173 | | | | 1,119 | |
| Shares issued in reinvestment of distributions | | | 600 | | | | 4,466 | | | | 247 | | | | — | |
| Shares redeemed | | | (5,555 | ) | | | (4,052 | ) | | | (2,455 | ) | | | (2,493 | ) |
| | | | | | | | | | | | | | | | | |
| Net increase (decrease) from Investor Class share transactions | | | 142 | | | | 1,360 | | | | 965 | | | | (1,374 | ) |
| | | | | | | | | | | | | | | | | |
| Institutional Class: | | | | | | | | | | | | | | | | |
| Shares sold | | | 2,095 | | | | 1,579 | | | | 479 | | | | 256 | |
| Shares issued in reinvestment of distributions | | | 106 | | | | 572 | | | | 26 | | | | — | |
| Shares redeemed | | | (1,252 | ) | | | (1,570 | ) | | | (202 | ) | | | (280 | ) |
| | | | | | | | | | | | | | | | | |
| Net increase (decrease) from Institutional Class share transactions | | | 949 | | | | 581 | | | | 303 | | | | (24 | ) |
| (1) | Shares issued in reinvestment of distributions were less than one thousand shares. |
| | |
| | See notes to financial statements. |
16
MARSICO MIDCAP GROWTH FOCUS FUND | | | MARSICO INTERNATIONAL OPPORTUNITIES FUND | | | MARSICO
GLOBAL FUND | |
| | | | | | | | |
Year Ended 9/30/24 | | | Year Ended 9/30/23 | | | Year Ended 9/30/24 | | | Year Ended 9/30/23 | | | Year Ended 9/30/24 | | | Year Ended 9/30/23 | |
| | | | | | | | | | | | | | | | | |
| | | | | | | | | | | | | | | | | | | | | | | |
| $ | (2,148 | ) | | $ | (1,252 | ) | | $ | (205 | ) | | $ | 175 | | | $ | (1,414 | ) | | $ | (700 | ) |
| | 19,303 | | | | 6,093 | | | | 2,725 | | | | 2,472 | | | | 5,989 | | | | 6,149 | |
| | 7 | | | | (275 | ) | | | (785 | ) | | | (389 | ) | | | 331 | | | | 613 | |
| | | | | | | | | | | | | | | | | | | | | | | |
| | 82,321 | | | | 26,987 | | | | 15,552 | | | | 4,968 | | | | 85,208 | | | | 29,211 | |
| | — | | | | 6 | | | | — | | | | — | | | | — | | | | — | |
| | | | | | | | | | | | | | | | | | | | | | | |
| | 99,483 | | | | 31,559 | | | | 17,287 | | | | 7,226 | | | | 90,114 | | | | 35,273 | |
| | | | | | | | | | | | | | | | | | | | | | | |
| | | | | | | | | | | | | | | | | | | | | | | |
| | (2,897 | ) | | | — | | | | (140 | ) | | | (58 | ) | | | (3,007 | ) | | | (5,698 | ) |
| | (302 | ) | | | — | | | | (18 | ) | | | (3 | ) | | | (437 | ) | | | (627 | ) |
| | | | | | | | | | | | | | | | | | | | | | | |
| | (3,199 | ) | | | — | | | | (158 | ) | | | (61 | ) | | | (3,444 | ) | | | (6,325 | ) |
| | | | | | | | | | | | | | | | | | | | | | | |
| | | | | | | | | | | | | | | | | | | | | | | |
| | | | | | | | | | | | | | | | | | | | | | | |
| | 7,999 | | | | 9,562 | | | | 9,416 | | | | 2,288 | | | | 13,858 | | | | 2,526 | |
| | 2,817 | | | | — | | | | 133 | | | | 56 | | | | 2,902 | | | | 5,522 | |
| | (33,224 | ) | | | (22,183 | ) | | | (8,407 | ) | | | (4,890 | ) | | | (34,029 | ) | | | (28,894 | ) |
| | | | | | | | | | | | | | | | | | | | | | | |
| | (22,408 | ) | | | (12,621 | ) | | | 1,142 | | | | (2,546 | ) | | | (17,269 | ) | | | (20,846 | ) |
| | | | | | | | | | | | | | | | | | | | | | | |
| | | | | | | | | | | | | | | | | | | | | | | |
| | 12,256 | | | | 19,035 | | | | 1,587 | | | | 350 | | | | 150,558 | | | | 10,641 | |
| | 300 | | | | — | | | | 18 | | | | 2 | | | | 434 | | | | 341 | |
| | (2,652 | ) | | | (23,644 | ) | | | (303 | ) | | | (2,995 | ) | | | (19,875 | ) | | | (9,523 | ) |
| | | | | | | | | | | | | | | | | | | | | | | |
| | 9,904 | | | | (4,609 | ) | | | 1,302 | | | | (2,643 | ) | | | 131,117 | | | | 1,459 | |
| | | | | | | | | | | | | | | | | | | | | | | |
| | 83,780 | | | | 14,329 | | | | 19,573 | | | | 1,976 | | | | 200,518 | | | | 9,561 | |
| | | | | | | | | | | | | | | | | | | | | | | |
| | | | | | | | | | | | | | | | | | | | | | | |
| | 234,934 | | | | 220,605 | | | | 36,844 | | | | 34,868 | | | | 160,273 | | | | 150,712 | |
| | | | | | | | | | | | | | | | | | | | | | | |
| $ | 318,714 | | | $ | 234,934 | | | $ | 56,417 | | | $ | 36,844 | | | $ | 360,791 | | | $ | 160,273 | |
| | | | | | | | | | | | | | | | | | | | | | | |
| | | | | | | | | | | | | | | | | | | | | | | |
| | | | | | | | | | | | | | | | | | | | | | | |
| | 182 | | | | 274 | | | | 408 | | | | 128 | | | | 602 | | | | 152 | |
| | 74 | | | | — | | | | 7 | | | | 4 | | | | 156 | | | | 386 | |
| | (845 | ) | | | (661 | ) | | | (394 | ) | | | (289 | ) | | | (1,640 | ) | | | (1,843 | ) |
| | | | | | | | | | | | | | | | | | | | | | | |
| | (589 | ) | | | (387 | ) | | | 21 | | | | (157 | ) | | | (882 | ) | | | (1,305 | ) |
| | | | | | | | | | | | | | | | | | | | | | | |
| | | | | | | | | | | | | | | | | | | | | | | |
| | 317 | | | | 574 | | | | 71 | | | | 21 | | | | 6,490 | | | | 706 | |
| | 8 | | | | — | | | | 1 | | | | — | (1) | | | 23 | | | | 24 | |
| | (61 | ) | | | (704 | ) | | | (16 | ) | | | (184 | ) | | | (861 | ) | | | (610 | ) |
| | | | | | | | | | | | | | | | | | | | | | | |
| | 264 | | | | (130 | ) | | | 56 | | | | (163 | ) | | | 5,652 | | | | 120 | |
17
FINANCIAL HIGHLIGHTS
For a Fund Share Outstanding Throughout the Period
| | | MARSICO
FOCUS FUND | |
| | | Year | | | Year | | | Year | | | Year | | | Year | |
| | | Ended | | | Ended | | | Ended | | | Ended | | | Ended | |
| Investor Class: | | 9/30/24 | | | 9/30/23 | | | 9/30/22 | | | 9/30/21 | | | 9/30/20 | |
| | | | | | | | | | | | | | | | |
| Net Asset Value, Beginning of Period | | $ | 19.86 | | | $ | 18.41 | | | $ | 28.84 | | | $ | 25.92 | | | $ | 18.59 | |
| | | | | | | | | | | | | | | | | | | | | |
| Income from Investment Operations: | | | | | | | | | | | | | | | | | | | | |
| Net investment loss | | | (0.15 | ) | | | (0.11 | ) | | | (0.09 | ) | | | (0.22 | ) | | | (0.10 | ) |
| Net realized and unrealized gains (losses) on investments | | | 10.37 | | | | 4.37 | | | | (7.13 | ) | | | 5.74 | | | | 8.92 | |
| Total from investment operations | | | 10.22 | | | | 4.26 | | | | (7.22 | ) | | | 5.52 | | | | 8.82 | |
| | | | | | | | | | | | | | | | | | | | | |
| Distributions & Other: | | | | | | | | | | | | | | | | | | | | |
| Net realized gains | | | (0.48 | ) | | | (2.81 | ) | | | (3.21 | ) | | | (2.60 | ) | | | (1.49 | ) |
| Total distributions and other | | | (0.48 | ) | | | (2.81 | ) | | | (3.21 | ) | | | (2.60 | ) | | | (1.49 | ) |
| | | | | | | | | | | | | | | | | | | | | |
| Net Asset Value, End of Period | | $ | 29.60 | | | $ | 19.86 | | | $ | 18.41 | | | $ | 28.84 | | | $ | 25.92 | |
| | | | | | | | | | | | | | | | | | | | | |
| Total Return | | | 52.32 | % | | | 27.04 | % | | | (28.30 | )% | | | 22.52 | % | | | 50.71 | % |
| | | | | | | | | | | | | | | | | | | | | |
| Supplemental Data and Ratios: | | | | | | | | | | | | | | | | | | | | |
| Net assets, end of period (000s) | | $ | 849,445 | | | $ | 567,000 | | | $ | 500,599 | | | $ | 895,641 | | | $ | 806,181 | |
| Ratio of net expenses (before expenses paid indirectly) to average net assets(6) | | | 1.28 | % | | | 1.45 | % | | | 1.02 | % | | | 1.26 | % | | | 1.24 | % |
| Ratio of net investment loss to average net assets(7) | | | (0.57 | )% | | | (0.66 | )% | | | (0.25 | )% | | | (0.79 | )% | | | (0.53 | )% |
| Ratio of total expenses to average net assets(8) | | | 1.28 | % | | | 1.50 | % | | | 1.02 | % | | | 1.26 | % | | | 1.24 | % |
| Ratio of net investment loss (before waivers, and expenses paid indirectly) to average net assets(9) | | | (0.57 | )% | | | (0.71 | )% | | | (0.25 | )% | | | (0.79 | )% | | | (0.53 | )% |
| Portfolio turnover rate | | | 47 | % | | | 76 | % | | | 102 | % | | | 28 | % | | | 45 | % |
| | | | | | | | | | | | | | | | | | | | | |
| | | | | | | | | | | | | | | | | | | | | |
| Institutional Class: | | Year
Ended
9/30/24 | | | Year
Ended
9/30/23 | | | Period
Ended
9/30/22(1) | | | | | | | | | |
| | | | | | | | | | | | | | | | | | |
| Net Asset Value, Beginning of Period | | $ | 19.96 | | | $ | 18.45 | | | $ | 26.98 | | | | | | | | | |
| | | | | | | | | | | | | | | | | | | | | |
| Income from Investment Operations: | | | | | | | | | | | | | | | | | | | | |
| Net investment income (loss) | | | (0.08 | ) | | | (0.08 | ) | | | 0.04 | | | | | | | | | |
| Net realized and unrealized gains (losses) on investments | | | 10.45 | | | | 4.40 | | | | (8.57 | ) | | | | | | | | |
| Total from investment operations | | | 10.37 | | | | 4.32 | | | | (8.53 | ) | | | | | | | | |
| | | | | | | | | | | | | | | | | | | | | |
| Distributions & Other: | | | | | | | | | | | | | | | | | | | | |
| Net realized gains | | | (0.48 | ) | | | (2.81 | ) | | | — | (4) | | | | | | | | |
| Increase from payment by service provider | | | — | | | | — | | | | — | | | | | | | | | |
| Total distributions and other | | | (0.48 | ) | | | (2.81 | ) | | | — | | | | | | | | | |
| | | | | | | | | | | | | | | | | | | | | |
| Net Asset Value, End of Period | | $ | 29.85 | | | $ | 19.96 | | | $ | 18.45 | | | | | | | | | |
| | | | | | | | | | | | | | | | | | | | | |
| Total Return | | | 52.82 | % | | | 27.34 | % | | | (31.62 | )%(2) | | | | | | | | |
| | | | | | | | | | | | | | | | | | | | | |
| Supplemental Data and Ratios: | | | | | | | | | | | | | | | | | | | | |
| Net assets, end of period (000s) | | $ | 183,605 | | | $ | 103,876 | | | $ | 85,283 | | | | | | | | | |
| Ratio of net expenses (before expenses paid indirectly) to average net assets(6) | | | 1.00 | % | | | 1.20 | % | | | 0.65 | %(3) | | | | | | | | |
| Ratio of net investment income (loss) to average net assets(7) | | | (0.30 | )% | | | (0.41 | )% | | | 0.24 | %(3) | | | | | | | | |
| Ratio of total expenses to average net assets(8) | | | 1.00 | % | | | 1.23 | % | | | 0.65 | %(3) | | | | | | | | |
| Ratio of net investment income (loss) (before waivers, and expenses paid indirectly) to average net assets(9) | | | (0.30 | )% | | | (0.44 | )% | | | 0.24 | %(3) | | | | | | | | |
| Portfolio turnover rate | | | 47 | % | | | 76 | % | | | 102 | %(2) | | | | | | | | |
| (1) | Institutional Class shares commenced operations on December 6, 2021. |
| (4) | Distributions occurred prior to the commencement of operations of the Institutional Class shares. |
| (5) | The Fund’s transfer agent reimbursed the Institutional Class $6 (in thousands) for losses incurred. The reimbursement increased the total return by 0.03%. |
| (6) | Ratio of expenses to average net assets, less waivers and before expenses paid indirectly. |
| (7) | Ratio of net investment income (loss) to average net assets, net of waivers and expenses paid indirectly. |
| (8) | Ratio of expenses to average net assets, before waivers and expenses paid indirectly. |
| (9) | Ratio of net investment income (loss) to average net assets, before waivers and expenses paid indirectly. See notes to financial statements. |
18
MARSICO
GROWTH FUND | | | MARSICO
MIDCAP GROWTH FOCUS FUND | |
| Year | | | Year | | | Year | | | Year | | | Year | | | Year | | | Year | | | Year | | | Year | | | Year | |
| Ended | | | Ended | | | Ended | | | Ended | | | Ended | | | Ended | | | Ended | | | Ended | | | Ended | | | Ended | |
| 9/30/24 | | | 9/30/23 | | | 9/30/22 | | | 9/30/21 | | | 9/30/20 | | | 9/30/24 | | | 9/30/23 | | | 9/30/22 | | | 9/30/21 | | | 9/30/20 | |
| | | | | | | | | | | | | | | | | | | | | | | | | | | | | |
| $ | 17.97 | | | $ | 14.05 | | | $ | 29.78 | | | $ | 25.66 | | | $ | 18.75 | | | $ | 33.89 | | | $ | 29.61 | | | $ | 52.48 | | | $ | 39.52 | | | $ | 33.70 | |
| | | | | | | | | | | | | | | | | | | | | | | | | | | | | | | | | | | | | | | |
| | | | | | | | | | | | | | | | | | | | | | | | | | | | | | | | | | | | | | | |
| | (0.13 | ) | | | (0.13 | ) | | | (0.15 | ) | | | (0.35 | ) | | | (0.14 | ) | | | (0.37 | ) | | | (0.21 | ) | | | (0.44 | ) | | | (0.47 | ) | | | (0.39 | ) |
| | 9.11 | | | | 4.05 | | | | (7.25 | ) | | | 6.85 | | | | 8.92 | | | | 15.16 | | | | 4.49 | | | | (15.83 | ) | | | 14.77 | | | | 7.30 | |
| | 8.98 | | | | 3.92 | | | | (7.40 | ) | | | 6.50 | | | | 8.78 | | | | 14.79 | | | | 4.28 | | | | (16.27 | ) | | | 14.30 | | | | 6.91 | |
| | | | | | | | | | | | | | | | | | | | | | | | | | | | | | | | | | | | | | | |
| | | | | | | | | | | | | | | | | | | | | | | | | | | | | | | | | | | | | | | |
| | (0.36 | ) | | | — | | | | (8.33 | ) | | | (2.38 | ) | | | (1.87 | ) | | | (0.47 | ) | | | — | | | | (6.60 | ) | | | (1.34 | ) | | | (1.09 | ) |
| | (0.36 | ) | | | — | | | | (8.33 | ) | | | (2.38 | ) | | | (1.87 | ) | | | (0.47 | ) | | | — | | | | (6.60 | ) | | | (1.34 | ) | | | (1.09 | ) |
| | | | | | | | | | | | | | | | | | | | | | | | | | | | | | | | | | | | | | | |
| $ | 26.59 | | | $ | 17.97 | | | $ | 14.05 | | | $ | 29.78 | | | $ | 25.66 | | | $ | 48.21 | | | $ | 33.89 | | | $ | 29.61 | | | $ | 52.48 | | | $ | 39.52 | |
| | | | | | | | | | | | | | | | | | | | | | | | | | | | | | | | | | | | | | | |
| | 50.61 | % | | | 27.90 | % | | | (34.81 | )% | | | 26.51 | % | | | 51.11 | % | | | 44.01 | % | | | 14.45 | % | | | (35.52 | )% | | | 36.56 | % | | | 21.15 | % |
| | | | | | | | | | | | | | | | | | | | | | | | | | | | | | | | | | | | | | | |
| | | | | | | | | | | | | | | | | | | | | | | | | | | | | | | | | | | | | | | |
| $ | 410,945 | | | $ | 260,436 | | | $ | 222,871 | | | $ | 423,855 | | | $ | 410,592 | | | $ | 284,394 | | | $ | 219,855 | | | $ | 203,593 | | | $ | 379,039 | | | $ | 291,976 | |
| | | | | | | | | | | | | | | | | | | | | | | | | | | | | | | | | | | | | | | |
| | 1.34 | % | | | 1.45 | % | | | 1.19 | % | | | 1.37 | % | | | 1.45 | % | | | 1.40 | % | | | 1.44 | % | | | 1.34 | % | | | 1.33 | % | | | 1.40 | % |
| | (0.62 | )% | | | (0.65 | )% | | | (0.84 | )% | | | (1.07 | )% | | | (0.85 | )% | | | (0.81 | )% | | | (0.54 | )% | | | (1.05 | )% | | | (0.91 | )% | | | (0.96 | )% |
| | 1.34 | % | | | 1.48 | % | | | 1.19 | % | | | 1.37 | % | | | 1.50 | % | | | 1.40 | % | | | 1.45 | % | | | 1.34 | % | | | 1.33 | % | | | 1.40 | % |
| | | | | | | | | | | | | | | | | | | | | | | | | | | | | | | | | | | | | | | |
| | (0.62 | )% | | | (0.68 | )% | | | (0.84 | )% | | | (1.07 | )% | | | (0.90 | )% | | | (0.81 | )% | | | (0.55 | )% | | | (1.05 | )% | | | (0.91 | )% | | | (0.96 | )% |
| | 62 | % | | | 89 | % | | | 117 | % | | | 58 | % | | | 77 | % | | | 50 | % | | | 56 | % | | | 55 | % | | | 20 | % | | | 38 | % |
| | | | | | | | | | | | | | | | | | | | | | | | | | | | | | | | | | | | | | | |
| | | | | | | | | | | | | | | | | | | | | | | | | | | | | | | | | | | | | | | |
Year
Ended
9/30/24 | | | Year
Ended
9/30/23 | | | Period
Ended
9/30/22(1) | | | | | | | | | | | Year
Ended
9/30/24 | | | Year
Ended
9/30/23 | | | Period
Ended
9/30/22(1) | | | | | | | | | |
| | | | | | | | | | | | | | | | | | | | | | | | | | | | | | | | | |
| $ | 18.06 | | | $ | 14.08 | | | $ | 21.57 | | | | | | | | | | | $ | 34.04 | | | $ | 29.68 | | | $ | 44.83 | | | | | | | | | |
| | | | | | | | | | | | | | | | | | | | | | | | | | | | | | | | | | | | | | | |
| | | | | | | | | | | | | | | | | | | | | | | | | | | | | | | | | | | | | | | |
| | (0.09 | ) | | | (0.07 | ) | | | (0.07 | ) | | | | | | | | | | | (0.25 | ) | | | (0.17 | ) | | | (0.22 | ) | | | | | | | | |
| | 9.17 | | | | 4.05 | | | | (7.42 | ) | | | | | | | | | | | 15.23 | | | | 4.52 | | | | (14.93 | ) | | | | | | | | |
| | 9.08 | | | | 3.98 | | | | (7.49 | ) | | | | | | | | | | | 14.98 | | | | 4.35 | | | | (15.15 | ) | | | | | | | | |
| | | | | | | | | | | | | | | | | | | | | | | | | | | | | | | | | | | | | | | |
| | | | | | | | | | | | | | | | | | | | | | | | | | | | | | | | | | | | | | | |
| | (0.36 | ) | | | — | | | | — | (4) | | | | | | | | | | | (0.47 | ) | | | — | | | | — | (4) | | | | | | | | |
| | — | | | | — | | | | — | | | | | | | | | | | | — | | | | 0.01 | | | | — | | | | | | | | | |
| | (0.36 | ) | | | — | | | | — | | | | | | | | | | | | (0.47 | ) | | | 0.01 | | | | — | | | | | | | | | |
| | | | | | | | | | | | | | | | | | | | | | | | | | | | | | | | | | | | | | | |
| $ | 26.78 | | | $ | 18.06 | | | $ | 14.08 | | | | | | | | | | | $ | 48.55 | | | $ | 34.04 | | | $ | 29.68 | | | | | | | | | |
| | | | | | | | | | | | | | | | | | | | | | | | | | | | | | | | | | | | | | | |
| | 50.91 | % | | | 28.27 | % | | | (34.72 | )%(2) | | | | | | | | | | | 44.38 | % | | | 14.69 | %(5) | | | (33.79 | )%(2) | | | | | | | | |
| | | | | | | | | | | | | | | | | | | | | | | | | | | | | | | | | | | | | | | |
| | | | | | | | | | | | | | | | | | | | | | | | | | | | | | | | | | | | | | | |
| $ | 48,418 | | | $ | 27,177 | | | $ | 21,519 | | | | | | | | | | | $ | 34,320 | | | $ | 15,079 | | | $ | 17,012 | | | | | | | | | |
| | | | | | | | | | | | | | | | | | | | | | | | | | | | | | | | | | | | | | | |
| | 1.10 | % | | | 1.20 | % | | | 0.92 | %(3) | | | | | | | | | | | 1.16 | % | | | 1.20 | % | | | 1.11 | %(3) | | | | | | | | |
| | (0.37 | )% | | | (0.40 | )% | | | (0.51 | )%(3) | | | | | | | | | | | (0.57 | )% | | | (0.32 | )% | | | (0.75 | )%(3) | | | | | | | | |
| | 1.10 | % | | | 1.24 | % | | | 0.92 | %(3) | | | | | | | | | | | 1.16 | % | | | 1.21 | % | | | 1.11 | %(3) | | | | | | | | |
| | | | | | | | | | | | | | | | | | | | | | | | | | | | | | | | | | | | | | | |
| | (0.37 | )% | | | (0.44 | )% | | | (0.51 | )%(3) | | | | | | | | | | | (0.57 | )% | | | (0.33 | )% | | | (0.75 | )%(3) | | | | | | | | |
| | 62 | % | | | 89 | % | | | 117 | %(2) | | | | | | | | | | | 50 | % | | | 56 | % | | | 55 | %(2) | | | | | | | | |
19
FINANCIAL HIGHLIGHTS
For a Fund Share Outstanding Throughout the Period
| | | MARSICO
INTERNATIONAL OPPORTUNITIES FUND | |
| Investor Class: | | Year
Ended
9/30/24 | | | Year
Ended
9/30/23 | | | Year
Ended
9/30/22 | | | Year
Ended
9/30/21 | | | Year
Ended
9/30/20 | |
| | | | | | | | | | | | | | | | |
| Net Asset Value, Beginning of Period | | $ | 16.75 | | | $ | 13.84 | | | $ | 23.79 | | | $ | 20.57 | | | $ | 18.47 | |
| | | | | | | | | | | | | | | | | | | | | |
| Income from Investment Operations: | | | | | | | | | | | | | | | | | | | | |
| Net investment income (loss) | | | (0.09 | ) | | | 0.06 | | | | (0.01 | ) | | | (0.04 | ) | | | 0.04 | |
| Net realized and unrealized gains (losses) on investments | | | 8.19 | | | | 2.88 | | | | (7.14 | ) | | | 3.81 | | | | 2.87 | |
| Total from investment operations | | | 8.10 | | | | 2.94 | | | | (7.15 | ) | | | 3.77 | | | | 2.91 | |
| | | | | | | | | | | | | | | | | | | | | |
| Distributions & Other: | | | | | | | | | | | | | | | | | | | | |
| Net investment income | | | (0.07 | ) | | | (0.03 | ) | | | — | | | | — | | | | (0.07 | ) |
| Net realized gains | | | — | | | | — | | | | (2.80 | ) | | | (0.55 | ) | | | (0.74 | ) |
| Total distributions and other | | | (0.07 | ) | | | (0.03 | ) | | | (2.80 | ) | | | (0.55 | ) | | | (0.81 | ) |
| | | | | | | | | | | | | | | | | | | | | |
| Net Asset Value, End of Period | | $ | 24.78 | | | $ | 16.75 | | | $ | 13.84 | | | $ | 23.79 | | | $ | 20.57 | |
| | | | | | | | | | | | | | | | | | | | | |
| Total Return | | | 48.51 | % | | | 21.23 | % | | | (34.08 | )% | | | 18.48 | % | | | 16.14 | % |
| | | | | | | | | | | | | | | | | | | | | |
| Supplemental Data and Ratios: | | | | | | | | | | | | | | | | | | | | |
| Net assets, end of period (000s) | | $ | 51,229 | | | $ | 34,278 | | | $ | 30,503 | | | $ | 60,274 | | | $ | 55,024 | |
| Ratio of net expenses (before expenses paid indirectly) to average net assets(6) | | | 1.50 | % | | | 1.50 | % | | | 1.50 | % | | | 1.50 | % | | | 1.50 | % |
| Ratio of net investment income (loss) to average net assets(7) | | | (0.46 | )% | | | 0.44 | % | | | 0.07 | % | | | (0.11 | )% | | | 0.28 | % |
| Ratio of total expenses to average net assets(8) | | | 1.74 | % | | | 1.86 | % | | | 1.71 | % | | | 1.68 | % | | | 1.81 | % |
| Ratio of net investment income (loss) (before waivers, and expenses paid indirectly) to average net assets(9) | | | (0.70 | )% | | | 0.08 | % | | | (0.14 | )% | | | (0.29 | )% | | | (0.03 | )% |
| Portfolio turnover rate | | | 45 | % | | | 52 | % | | | 18 | % | | | 50 | % | | | 60 | % |
| | | | | | | | | | | | | | | | | | | | | |
| | | | | | | | | | | | | | | | | | | | | |
| Institutional Class: | | Year
Ended
9/30/24 | | | Year
Ended
9/30/23 | | | Period
Ended
9/30/22(1) | | | | | | | | | |
| | | | | | | | | | | | | | | | | |
| Net Asset Value, Beginning of Period | | $ | 16.83 | | | $ | 13.86 | | | $ | 20.20 | | | | | | | | | |
| | | | | | | | | | | | | | | | | | | | | |
| Income from Investment Operations: | | | | | | | | | | | | | | | | | | | | |
| Net investment income (loss) | | | (0.05 | ) | | | 0.13 | | | | 0.03 | | | | | | | | | |
| Net realized and unrealized gains (losses) on investments | | | 8.24 | | | | 2.85 | | | | (6.37 | ) | | | | | | | | |
| Total from investment operations | | | 8.19 | | | | 2.98 | | | | (6.34 | ) | | | | | | | | |
| | | | | | | | | | | | | | | | | | | | | |
| Distributions & Other: | | | | | | | | | | | | | | | | | | | | |
| Net investment income | | | (0.11 | ) | | | (0.01 | ) | | | — | | | | | | | | | |
| Net realized gains | | | — | | | | — | | | | — | (5) | | | | | | | | |
| Total distributions and other | | | (0.11 | ) | | | (0.01 | ) | | | — | | | | | | | | | |
| | | | | | | | | | | | | | | | | | | | | |
| Net Asset Value, End of Period | | $ | 24.91 | | | $ | 16.83 | | | $ | 13.86 | | | | | | | | | |
| | | | | | | | | | | | | | | | | | | | | |
| Total Return | | | 48.92 | % | | | 21.54 | % | | | (31.39 | )%(2) | | | | | | | | |
| | | | | | | | | | | | | | | | | | | | | |
| Supplemental Data and Ratios: | | | | | | | | | | | | | | | | | | | | |
| Net assets, end of period (000s) | | $ | 5,188 | | | $ | 2,566 | | | $ | 4,365 | | | | | | | | | |
| Ratio of net expenses (before expenses paid indirectly) to average net assets(6) | | | 1.25 | % | | | 1.25 | % | | | 1.25 | %(3) | | | | | | | | |
| Ratio of net investment income (loss) to average net assets(7) | | | (0.21 | )% | | | 0.53 | % | | | 0.31 | %(3) | | | | | | | | |
| Ratio of total expenses to average net assets(8) | | | 1.76 | % | | | 1.98 | % | | | 1.81 | %(3) | | | | | | | | |
| Ratio of net investment loss (before waivers, and expenses paid indirectly) to average net assets(9) | | | (0.72 | )% | | | (0.20 | )% | | | (0.25 | )%(3) | | | | | | | | |
| Portfolio turnover rate | | | 45 | % | | | 52 | % | | | 18 | %(2) | | | | | | | | |
| (1) | Institutional Class shares commenced operations on December 6, 2021. |
| (5) | Distributions occurred prior to the commencement of operations of the Institutional Class shares. |
| (6) | Ratio of expenses to average net assets, less waivers and before expenses paid indirectly. |
| (7) | Ratio of net investment income (loss) to average net assets, net of waivers and expenses paid indirectly. |
| (8) | Ratio of expenses to average net assets, before waivers and expenses paid indirectly. |
| (9) | Ratio of net investment income (loss) to average net assets, before waivers and expenses paid indirectly. See notes to financial statements. |
20
MARSICO
GLOBAL FUND | |
Year
Ended
9/30/24 | | | Year
Ended
9/30/23 | | | Year
Ended
9/30/22 | | | Year
Ended
9/30/21 | | | Year
Ended
9/30/20 | |
| | | | | | | | | | | | | | |
| $ | 16.88 | | | $ | 14.12 | | | $ | 25.93 | | | $ | 22.83 | | | $ | 16.06 | |
| | | | | | | | | | | | | | | | | | | |
| | | | | | | | | | | | | | | | | | | |
| | (0.19 | ) | | | (0.12 | ) | | | (0.17 | ) | | | (0.28 | ) | | | (0.19 | ) |
| | 8.87 | | | | 3.50 | | | | (7.58 | ) | | | 3.97 | | | | 6.96 | |
| | 8.68 | | | | 3.38 | | | | (7.75 | ) | | | 3.69 | | | | 6.77 | |
| | | | | | | | | | | | | | | | | | | |
| | | | | | | | | | | | | | | | | | | |
| | — | | | | — | | | | — | | | | — | | | | — | |
| | (0.37 | ) | | | (0.62 | ) | | | (4.06 | ) | | | (0.59 | ) | | | — | |
| | (0.37 | ) | | | (0.62 | ) | | | (4.06 | ) | | | (0.59 | ) | | | — | |
| | | | | | | | | | | | | | | | | | | |
| $ | 25.19 | | | $ | 16.88 | | | $ | 14.12 | | | $ | 25.93 | | | $ | 22.83 | |
| | | | | | | | | | | | | | | | | | | |
| | 52.21 | % | | | 24.72 | % | | | (35.55 | )% | | | 16.33 | % | | | 42.15 | % |
| | | | | | | | | | | | | | | | | | | |
| | | | | | | | | | | | | | | | | | | |
| $ | 190,745 | | | $ | 142,683 | | | $ | 137,752 | | | $ | 309,493 | | | $ | 285,033 | |
| | | | | | | | | | | | | | | | | | | |
| | 1.48 | % | | | 1.50 | % | | | 1.45 | % | | | 1.45 | % | | | 1.45 | % |
| | (0.66 | )% | | | (0.46 | )% | | | (0.56 | )% | | | (1.03 | )% | | | (0.84 | )% |
| | 1.48 | % | | | 1.55 | % | | | 1.45 | % | | | 1.45 | % | | | 1.73 | % |
| | | | | | | | | | | | | | | | | | | |
| | (0.66 | )% | | | (0.51 | )% | | | (0.56 | )% | | | (1.03 | )% | | | (1.12 | )% |
| | 44 | % | | | 82 | % | | | 100 | % | | | 65 | % | | | 51 | % |
| | | | | | | | | | | | | | | | | | | |
| | | | | | | | | | | | | | | | | | | |
| | Year
Ended
9/30/24 | | | | Year
Ended
9/30/23 | | | | Period
Ended
9/30/22(1) | | | | | | | | | |
| | | | | | | | | | | | | | | | | | | |
| $ | 16.99 | | | $ | 14.17 | | | $ | 22.30 | | | | | | | | | |
| | | | | | | | | | | | | | | | | | | |
| | | | | | | | | | | | | | | | | | | |
| | (0.14 | ) | | | (0.05 | ) | | | — | (4) | | | | | | | | |
| | 8.95 | | | | 3.49 | | | | (8.13 | ) | | | | | | | | |
| | 8.81 | | | | 3.44 | | | | (8.13 | ) | | | | | | | | |
| | | | | | | | | | | | | | | | | | | |
| | | | | | | | | | | | | | | | | | | |
| | — | | | | — | | | | — | | | | | | | | | |
| | (0.37 | ) | | | (0.62 | ) | | | — | (5) | | | | | | | | |
| | (0.37 | ) | | | (0.62 | ) | | | — | | | | | | | | | |
| | | | | | | | | | | | | | | | | | | |
| $ | 25.43 | | | $ | 16.99 | | | $ | 14.17 | | | | | | | | | |
| | | | | | | | | | | | | | | | | | | |
| | 52.65 | % | | | 25.07 | % | | | (36.46 | )%(2) | | | | | | | | |
| | | | | | | | | | | | | | | | | | | |
| | | | | | | | | | | | | | | | | | | |
| $ | 170,046 | | | $ | 17,590 | | | $ | 12,960 | | | | | | | | | |
| | | | | | | | | | | | | | | | | | | |
| | 1.15 | % | | | 1.25 | % | | | 1.06 | %(3) | | | | | | | | |
| | (0.37 | )% | | | (0.23 | )% | | | (0.02 | )%(3) | | | | | | | | |
| | 1.15 | % | | | 1.29 | % | | | 1.06 | %(3) | | | | | | | | |
| | | | | | | | | | | | | | | | | | | |
| | (0.37 | )% | | | (0.27 | )% | | | (0.02 | )%(3) | | | | | | | | |
| | 44 | % | | | 82 | % | | | 100 | %(2) | | | | | | | | |
21
| NOTES TO FINANCIAL STATEMENTS |
NOTES TO FINANCIAL STATEMENTS September 30, 2024
The Marsico Investment Fund (the “Trust”) was organized on October 1, 1997, as a Delaware statutory trust and is registered under the Investment Company Act of 1940, as amended (the “1940 Act”), as an open-end management investment company. The Focus Fund, Growth Fund, Midcap Growth Focus Fund, International Opportunities Fund, and Global Fund (collectively, the “Funds” and each, a “Fund”) are separate investment portfolios of the Trust. The Focus Fund is a non-diversified fund and the Growth Fund, Midcap Growth Focus Fund, International Opportunities Fund, and Global Fund are diversified funds. The Focus Fund and Growth Fund commenced operations on December 31, 1997, the Midcap Growth Focus Fund commenced operations on February 1, 2000, the International Opportunities Fund commenced operations on June 30, 2000, and the Global Fund commenced operations on June 29, 2007. Prior to September 1, 2021, the Midcap Growth Focus Fund was known as the 21ST Century Fund.
On November 17, 2021, the Funds’ Board of Trustees (the “Board”) approved a Multi-Class Plan (“Multi-Class Plan”) pursuant to Rule 18f-3 under the 1940 Act (i) to divide the shares of each Fund into two classes, (ii) to authorize and designate a new Institutional Class of shares for each of the Funds and (iii) to redesignate the existing shares of each of the Funds as Investor Class shares. Effective December 6, 2021, the Institutional Class shares for each of the Funds commenced operations and the existing shares of each of the Funds were redesignated as Investor Class shares. Shares of each class of the Funds represent an equal pro rata interest in such Fund and generally have identical voting, distribution, liquidation and other rights/privileges except that each class shall (a) have a different designation; (b) bear any class expenses; (c) have exclusive voting rights on any matter submitted to shareholders that relates solely to its administration or distribution arrangement; (d) have separate voting rights on any matter submitted to shareholders in which the interests of one class differ from the interests of any other class; and (e) have different shareholder investment minimum requirements.
Trustees and officers of the Trust and employees of Marsico Capital Management, LLC (the “Adviser”) own approximately 14%, 23%, 20%, 52%, and 8% of the outstanding Institutional Class shares of the Focus Fund, Growth Fund, Midcap Growth Focus Fund, International Opportunities Fund, and Global Fund, respectively, as of September 30, 2024. Percentage ownership of each Fund is significant as the Institutional Class of shares for each Fund were initially funded by conversions of Investor Class shares in certain accounts attributed to Trustees and executive officers of the Trust.
| 2. | Significant Accounting Policies |
The Funds qualify as investment companies under Accounting Standards Update No. 2013-08, Accounting Standard Codification Topic 946, “Financial Services — Investment Companies” (“ASC 946”). Certain prior year amounts have been conformed to current year presentation. The following is a summary of significant accounting policies consistently followed by the Funds in the preparation of their financial statements. These policies are in conformity with Generally Accepted Accounting Principles (“GAAP”) in the United States of America for investment companies and follow the accounting guidance provided in ASC 946. The presentation of financial statements in conformity with GAAP requires management to make estimates and assumptions that affect the reported amounts and disclosures of assets and liabilities at the date of the financial statements and the reported amounts and disclosures of income and expenses during the reporting period. Actual results could differ from those estimates.
| | (a) | Investment Valuation — A security traded on a recognized stock exchange is generally valued at the last sale price prior to the closing of the principal exchange on which the security is traded. Securities traded on NASDAQ generally will be valued at the NASDAQ Official Closing Price. If no sale price is reported on the valuation date, the most current bid price will generally be used, with the exception of short option positions which will generally utilize the most current ask price. Other securities for which over-the-counter market quotations are readily available are generally valued at the last sale price. Debt securities that will mature in more than 60 days are generally valued at their bid prices furnished by a pricing service. Debt securities that will mature in 60 days or less are valued at amortized cost, if it approximates market value. Any securities for which market quotations are not readily available are valued at their fair value as determined, in accordance with the Funds’ policies and procedures, in good faith by the Adviser, subject to the Board’s general supervision of the Adviser as the Board’s valuation designee (as defined in Rule 2a-5 under the 1940 Act). The Funds’ policies and procedures, including those wherein the Adviser has been approved as the Board’s valuation designee, have been duly approved by the Board. When a security has been “fair valued,” consideration is given to facts and circumstances relevant to the particular situation, including a review of the various factors set forth in the Funds’ policies and procedures. The Funds may use pricing services to assist in determining market value. The Adviser, as the Board’s valuation designee, has proposed and the Board has approved the use of a pricing service to assist the Funds in valuing certain equity securities listed or traded on foreign security exchanges in the Funds’ portfolios in certain circumstances where there is a significant change in the value of related US-traded securities, as represented by, for example, the S&P 500 Index. |
| | | |
| | | “Fair Value Measurements and Disclosures” (the “Fair Value Statement”) defines fair value, establishes a framework for measuring fair value in GAAP, and expands disclosures about fair value measurements. Under the Fair Value Statement, various inputs are used in determining the value of the Funds’ investments. |
22
| NOTES TO FINANCIAL STATEMENTS |
These inputs are summarized into three broad levels and described below:
| ● | Level 1 — unadjusted quoted prices in active markets for identical investments |
| ● | Level 2 — other significant observable inputs (including quoted prices for similar investments, interest rates, and evaluated quotations obtained from pricing services) |
| ● | Level 3 — significant unobservable inputs (including the Funds’ assumptions that market participants would use in determining the fair value of investments) |
The inputs or methodology used for valuing investments are not an indication of the risk associated with investing in those investments. Changes in valuation techniques may result in transfers between the levels during the reporting period. As of September 30, 2024, the fair values of each Fund’s investments according to the valuation inputs utilized are reflected in the “Summary of Fair Value Measurements” on the Fund’s Schedule of Investments. The Funds did not hold a significant amount of Level 3 securities as of September 30, 2024.
| (b) | Expenses — The Funds are charged for those expenses that are directly attributable to each Fund, such as advisory and custodial fees. Expenses that are not directly attributable to a Fund are typically allocated among the Funds in proportion to their respective net assets and are in some cases allocated based on other factors. Each class of shares bears a portion of their respective Fund expenses, which are allocated daily to each class of shares in proportion to their respective net assets of the Fund. Expenses directly attributable to a specific class of shares, such as distribution fees for the Investor Class, are charged directly to that class of shares. The Funds’ expenses may be reduced by advisory fee waivers, brokerage credits and uninvested cash balances earning interest or credits. Such credits are included in “Less waiver of expenses and expenses paid indirectly” on the Statements of Operations. |
Brokerage commissions may be paid to certain brokers which reduce transfer agent fees and expenses. For the year ended September 30, 2024, the Funds received no such brokerage commission credits. The Funds received earnings credits on certain cash account balances which reduced transfer agent fees and expenses by less than $1 (in thousands) for each of the Focus Fund, Growth Fund, Midcap Growth Focus Fund, International Opportunities Fund, and Global Fund for the year ended September 30, 2024. Brokerage commission credits and earnings credits (if any) are included in “Less waiver of expenses and expenses paid indirectly” on the Statements of Operations.
| (c) | Federal Income Taxes — Each Fund intends to comply with the requirements of the Internal Revenue Code of 1986, as amended (the “Internal Revenue Code”), necessary to continue to qualify as a regulated investment company and to make the requisite distributions of income to its shareholders which will be sufficient to relieve it from all or substantially all federal and state income taxes. Certain Funds may utilize earnings and profits on redemption of shares as part of the dividends paid deduction. |
| (d) | Distributions to Shareholders — Dividends from net investment income and net realized capital gains, if any, will be declared and paid at least annually. Distributions to shareholders are recorded on the ex-dividend date. Each Fund may periodically make reclassifications among certain of its capital accounts as a result of the timing and characterization of certain income and capital gains distributions determined in accordance with federal tax regulations, which may differ from GAAP. These reclassifications are due to differing treatment for items such as foreign currency transactions and net investment losses. |
The Funds at times may invest in real estate investment trusts (“REITs”). REITs generally pay dividends to their investors based upon cash available from their operations and this amount may differ significantly from the REITs’ actual earnings and profits (“E&P”) determined for income tax purposes. It is common for these dividends to exceed the REITs’ taxable E&P, resulting in the excess portion of such dividends eventually being designated as a return of capital. Determination of the tax character of dividends made by REITs is typically performed by the REIT several months subsequent to the payment of the dividend. Therefore, due to timing issues, the Funds may be in a position of being required to calculate and pay required distribution amounts to their shareholders based on the best information available from the REITs, which may be prior to the final determination of the REITs’ taxable E&P, and it is possible that a portion of the Funds’ distribution amounts could include a return of capital to shareholders for federal income tax purposes.
| (e) | Foreign Currency Translation — The accounting records of the Funds are maintained in US dollars. For valuation purposes, values of securities denominated in foreign currencies are translated into US dollars at 4:00 p.m. Eastern Time. Amounts related to the purchase and sale of foreign securities and investment income are translated at the rates of exchange prevailing on the respective dates of such transactions. |
Reported realized gains and losses on foreign currency transactions arise from sales of portfolio securities, forward foreign currency contracts, currency gains or losses realized between the trade and settlement dates on securities transactions, and the difference between the amounts of dividends, interest, and foreign withholding taxes recorded on the Funds’ books and the US dollar equivalent of the amounts actually received or paid.
23
| NOTES TO FINANCIAL STATEMENTS |
NOTES TO FINANCIAL STATEMENTS September 30, 2024 (continued)
The Funds do not isolate that portion of the results of operations resulting from changes in foreign exchange rates on investments from the fluctuations arising from changes in market prices of securities held at the end of the reporting period. Net unrealized appreciation or depreciation on investments and foreign currency translations arises from changes in the value of assets and liabilities, including investments in securities at the end of the reporting period, resulting from changes in the exchange rates and changes in market prices of securities held.
Transactions in foreign-denominated assets may involve greater risks than domestic transactions, including currency risk, political and economic risk, regulatory risk and market risk.
| (f) | Derivative Instruments — “Disclosure about Derivative Instruments and Hedging Activities” (the “Derivatives Statement”) requires enhanced disclosures about the Funds’ derivative and hedging activities, including how such activities are accounted for and their effects on the Funds’ financial position, performance and cash flows. |
The Funds are not intended as vehicles for investing substantially in derivative instruments, and may hold derivative instruments only infrequently. The Funds enter into derivative instruments in order to increase exposure to certain investments, asset classes, or markets, or for hedging purposes to hedge against adverse movements in securities prices, currency rates or interest rates. The Funds can hold various types of derivative instruments such as futures contracts and options on securities, financial indexes, and foreign currencies, options on futures, forward foreign currency contracts, interest rate swaps, credit default swaps, and swap-related products. The use of derivative instruments may involve risks such as the possibility of illiquid markets or imperfect correlation between the value of the derivative instruments and the underlying securities, or that the counterparty will fail to perform its obligations. There were no outstanding derivative instruments held by the Funds as of September 30, 2024, nor did the Funds utilize derivative instruments during the year ended September 30, 2024.
| (g) | Non-Interested Trustees’ Deferred Fee Plan — Effective February 1, 2000, the Board adopted the Marsico Investment Fund Deferred Fee Plan (the “Deferred Fee Plan”), amended and restated as of December 30, 2005, which allows the Trustees who are not “interested persons” of the Funds, as defined in the 1940 Act (“non-interested Trustees”), to defer the receipt of all or a portion of their compensation received from the Funds and may be invested as directed by each non-interested Trustee. The Deferred Fee Plan was further amended and restated as of November 10, 2020 to allow for any deferred fees credited to accounts established on behalf of the non-interested Trustees to be invested into the Funds and other investment options allowed under the Deferred Fee Plan, such as a non-affiliated US government money market fund, among other clarifying changes. The amounts credited to these accounts increase or decrease in accordance with the performance of the investments selected by the non-interested Trustees. The market value of the deferred account balances as of September 30, 2024 is shown on the Statements of Assets and Liabilities as part of an asset account, “Prepaid expenses and other assets,” and a liability account, “Accrued trustees’ fees.” Additionally, the fluctuation of the account balances due to the performance of the investments is recorded by the Funds as unrealized appreciation (depreciation), which is shown as part of “Total distributable earnings” on the Statements of Assets and Liabilities, and as compensation expense, which is shown as part of the expense account “Trustees’ fees and expenses” on the Statements of Operations. Fees earned and deferred by the non-interested Trustees for the year ended September 30, 2024 are also included in “Trustees’ fees and expenses” on the Statements of Operations. Amounts contributed to the Deferred Fee Plan will be deferred until distributed in accordance with the Deferred Fee Plan. Unrealized appreciation (depreciation) of the investments held in the Deferred Fee Plan is subject to the Funds’ expense reimbursement agreement with the Adviser. |
| (h) | Other — Investment transactions are accounted for on a trade date basis. Each Fund determines the gain or loss realized from the investment transactions by comparing the original cost of the security lot sold with the net sale proceeds. Dividend income is recognized on the ex-dividend date. Certain dividends from foreign securities are recorded when the Funds are informed of the dividend if such information is obtained subsequent to the ex-dividend date. Interest income, if any, is recognized on an accrual basis and includes amortization of premiums and accretion of discounts. Income, as well as gains and losses, both realized and unrealized, are allocated daily to each class of shares in proportion to their respective net assets of each Fund. |
During the year ended September 30, 2024, the Funds’ fund accountant reimbursed the Funds, including interest, for a historical billing processing issue. The fund accountant reimbursed (in thousands) less than $1 to the Focus Fund and Growth Fund, respectively, and $1, $34, and $9 to the Midcap Growth Focus Fund, International Opportunities Fund, and Global Fund, respectively. These amounts are included in “Paid-in-capital” on the Statements of Assets and Liabilities and “Capital Share Transactions” on the Statements of Changes in Net Assets for each of the Funds. The reimbursements did not have a significant effect on the total return for the respective share classes of each of the Funds.
During the year ended September 30, 2023, the Funds’ transfer agent reimbursed the Midcap Growth Focus Fund Institutional Class $6 (in thousands) for a processing issue. The amount is reflected under the caption “Increase from payment by service provider” on the Fund’s Statement of Changes in Net Assets. The impact of the reimbursement to the total return and per share information for the Midcap Growth Focus Fund Institutional Class is reflected on the Financial Highlights for the share class.
24
| NOTES TO FINANCIAL STATEMENTS |
| (i) | Indemnifications — In the normal course of business, the Funds enter into contracts that contain provisions indemnifying other parties against specified potential liabilities. Each Fund’s maximum exposure under these arrangements is unknown as this would involve future claims that may be made against the Fund that have not yet occurred. However, based on experience, the Funds expect the risk of loss in connection with these potential indemnification obligations to be remote. There can be no assurance that material liabilities related to such obligations will not arise in the future, which may adversely impact a Fund. |
| 3. | Investment Advisory Agreement and Transactions with Affiliates |
Each Fund has an agreement with the Adviser to furnish investment advisory services to the Funds. Each Fund calculates and accrues the investment advisory fee daily based on the following rates (expressed as annual rates) and pays the Adviser monthly:
| Annual Rate of Average Daily Net Assets | Asset Threshold |
| 0.80% | First $250 million |
| 0.75% | Next $250 million |
| 0.70% | Next $250 million |
| 0.65% | In excess of $750 million |
The Adviser has entered into a written expense limitation and fee waiver agreement under which it has agreed (i) to limit the total expenses of the Investor Class of each Fund (excluding taxes, interest, acquired fund fees and expenses, litigation, extraordinary expenses, and brokerage and other transaction expenses relating to the purchase or sale of portfolio investments) to an annual rate of 1.50% of the average net assets attributable to Investor Class shares of the International Opportunities Fund and Global Fund, and 1.45% of the average net assets attributable to Investor Class shares of the Focus Fund, Growth Fund and Midcap Growth Focus Fund, and (ii) to limit the total expenses of the Institutional Class of each Fund (excluding taxes, interest, acquired fund fees and expenses, litigation, extraordinary expenses, and brokerage and other transaction expenses relating to the purchase or sale of portfolio investments) to an annual rate of 1.25% of the average net assets attributable to Institutional Class shares of the International Opportunities Fund and Global Fund, and 1.20% of the average net assets attributable to Institutional Class shares of the Focus Fund, Growth Fund and Midcap Growth Focus Fund, until January 31, 2025. This expense limitation and fee waiver agreement may be terminated by the Adviser at any time after January 31, 2025, upon 15 days prior notice to the Fund and its administrator. Amounts waived/reimbursed by the Adviser in accordance with this agreement are included in “Less waiver of expenses and expenses paid indirectly” on the Statements of Operations.
The Adviser may recoup from a Fund (or share class as applicable) any fees previously waived and/or expenses previously reimbursed by the Adviser with respect to that Fund or share class, as applicable, including any applicable waivers which may apply to a specific share class, pursuant to this agreement (including waivers or reimbursements under previous expense limitations), if (1) such recoupment by the Adviser does not cause the Fund’s share class, at the time of recoupment, to exceed the lesser of (a) the expense limitation in effect at the time the relevant amount was waived and/or reimbursed, or (b) the expense limitation in effect at the time of the proposed recoupment, (2) the recoupment is made within three years after the fiscal year end date as of which the amount to be waived or reimbursed was determined and the waiver or reimbursement occurred, and (3) the Adviser has not agreed to forego recoupment. In accordance with the Funds’ Multi-Class Plan, amounts eligible for recoupment from periods prior to the addition of the Institutional Class will continue to be eligible for recoupment from the Investor Class. Amounts received by the Adviser for previously waived or reimbursed expenses are included in “Recoupment of previously waived expenses” on the Statements of Operations.
During the year ended September 30, 2024, the Adviser waived or reimbursed amounts or received reimbursements for previously waived or reimbursed expenses from the respective share class of each of the applicable Funds as follows:
| (Amounts in thousands) | | Fees Waived/Reimbursed by the Adviser | | | Recoupment of Previously Waived or Reimbursed Expenses | |
| Focus Fund | | | | | | | | |
| Investor Class | | $ | — | | | $ | 183 | |
| Institutional Class | | $ | — | | | $ | 21 | |
| Growth Fund | | | | | | | | |
| Investor Class | | $ | — | | | $ | 35 | |
| Institutional Class | | $ | — | | | $ | 7 | |
| International Opportunities Fund | | | | | | | | |
| Investor Class | | $ | 100 | | | $ | — | |
| Institutional Class | | $ | 19 | | | $ | — | |
| Global Fund | | | | | | | | |
| Investor Class | | $ | — | | | $ | 60 | |
| Institutional Class | | $ | — | | | $ | 6 | |
25
| NOTES TO FINANCIAL STATEMENTS |
NOTES TO FINANCIAL STATEMENTS September 30, 2024 (continued)
As of September 30, 2024, recoupment amounts (in thousands) that may potentially be made to the Adviser are as follows:
| | | International
Opportunities Fund | |
| Year of Expiration | | Investor Class | | | Institutional Class | |
| 2025 | | $ | 96 | | | $ | 18 | |
| 2026 | | | 126 | | | | 23 | |
| 2027 | | | 100 | | | | 19 | |
| | | $ | 322 | | | $ | 60 | |
During the year ended September 30, 2023, the Adviser voluntarily reimbursed legal fees of (in thousands) $74, $31, $30, $5, and $20 to the Focus Fund, Growth Fund, Midcap Growth Focus Fund, International Opportunities Fund, and Global Fund, respectively. These amounts are not subject to recoupment by the Adviser.
Certain officers of the Trust are also officers of the Adviser. The Funds pay a portion of the Chief Compliance Officer’s total compensation costs which is shown as part of the expense account “Professional fees” on the Statements of Operations. No other officers of the Trust received compensation from the Funds during the year ended September 30, 2024.
| 4. | Distribution and Service Plan |
The Funds have adopted a Distribution and Service Plan pursuant to Rule 12b-1 under the 1940 Act, and effective November 17, 2021, the Board approved a Third Amended and Restated Distribution and Service Plan (as amended, the “Plan”). The Plan authorizes payments by the Funds in connection with the distribution of their Investor Class shares at an annual rate, as determined from time to time by the Board, of up to 0.25% of a Fund’s average daily net assets attributable to Investor Class shares. Institutional Class shares of the Funds are not subject to a 12b-1 fee. The Plan clarifies that while the maximum 12b-1 Fee rate remains limited to 0.25% per annum of each Fund’s average daily net assets attributable to Investor Class shares, one or more Funds may be charged a lower rate from time to time upon approval by the Board, and the rate may vary by Fund. Each Fund currently accrues 12b-1 Fees for its Investor Class shares at a rate of 0.25% per annum of the average daily net assets attributable to Investor Class shares of the Fund until such time as the Board authorizes a different rate. The Plan also clarifies that previously accrued amounts of the 12b-1 Fee for each Fund may be used by that Fund to pay any current or previously accrued expenses of the Fund authorized by the Plan, including non-distribution expenses, authorized by the Plan.
Payments may be made by the Funds under the Plan for the purpose of financing any activity primarily intended to result in the sales of Investor Class shares of the Funds, as determined by the Board, as well as for account maintenance and personal services to Investor Class shareholders and any other non-distribution-related services. The Adviser may, out of its own resources (which may include legitimate profits from providing advisory services to the Funds or other clients) and, at its sole discretion, make certain payments on behalf of the Funds or the Plan for expenses incurred by a Fund for distribution of Fund shares and related services or for administrative or other expenses incurred by the Fund.
| 5. | Investment Transactions |
The aggregate purchases and sales of securities, excluding short-term investments, for the Funds for the year ended September 30, 2024, were as follows:
| (Amounts in thousands) | | Focus Fund | | | Growth
Fund | | | Midcap
Growth Focus
Fund | | | International
Opportunities
Fund | | | Global
Fund | |
| Purchases | | $ | 440,216 | | | $ | 262,623 | | | $ | 134,719 | | | $ | 23,064 | | | $ | 212,600 | |
| Sales | | $ | 401,056 | | | $ | 232,885 | | | $ | 153,614 | | | $ | 20,121 | | | $ | 106,098 | |
There were no purchases or sales of US government securities, excluding short-term investments.
| 6. | Market Developments, Events, and Risks |
Global economies and financial markets increasingly are interconnected, and conditions and events in one country, region or financial market may adversely impact markets, issuers, or economies in different countries, regions or financial markets. These risks may be magnified if certain events or developments adversely affect the safety or health of individuals around the world or interrupt the global supply chain. In these and other circumstances, such risks might affect companies and investments worldwide. As a result, local, regional or global events such as war, acts of terrorism, the spread of infectious illness or other public health issues, inflation, volatile interest rates, recessions or other events could have a significant negative impact on global economic and market conditions. Such events could adversely affect the operational and financial performance of the issuers of securities in which the Funds invest, and such uncertainty may in turn continue to impact the value of the Funds’ investments.
26
| NOTES TO FINANCIAL STATEMENTS |
| 7. | Federal Income Tax Information |
“Accounting for Uncertainty in Income Taxes” (the “Income Tax Statement”) requires an evaluation of tax positions taken (or expected to be taken) in the course of preparing a Fund’s tax returns to determine whether these positions meet a “more-likely-than-not” standard that, based on the technical merits, have a more than fifty percent likelihood of being sustained by a taxing authority upon examination. A tax position that meets the “more-likely-than-not” recognition threshold is measured to determine the amount of benefit to recognize in the financial statements. The Funds recognize interest and penalties, if any, related to unrecognized tax benefits as income tax expense in the Statements of Operations.
The Income Tax Statement requires management of the Funds to analyze all open tax years, consisting of fiscal years 2021-2024 as defined by Internal Revenue Service (“IRS”) statute of limitations for all major jurisdictions, including federal tax authorities and certain state tax authorities. As of and during the year ended September 30, 2024, the Funds did not have any liabilities for any unrecognized tax benefits. The Funds have no examinations in progress and are not aware of any tax positions for which it is reasonably possible that the total amounts of unrecognized tax benefits will significantly change in the next twelve months.
At September 30, 2024, gross unrealized appreciation and depreciation of investments, based on cost for federal income tax purposes, were as follows:
| (Amounts in thousands) | | Focus
Fund | | | Growth
Fund | | | Midcap
Growth Focus
Fund | | | International
Opportunities
Fund | | | Global
Fund | |
| Cost of Investments | | $ | 461,262 | | | $ | 249,792 | | | $ | 175,899 | | | $ | 35,618 | | | $ | 222,246 | |
| Gross Unrealized Appreciation | | $ | 575,417 | | | $ | 212,100 | | | $ | 144,183 | | | $ | 20,904 | | | $ | 140,527 | |
| Gross Unrealized Depreciation | | | (57 | ) | | | (48 | ) | | | (38 | ) | | | (30 | ) | | | (1,594 | ) |
| Net Unrealized Appreciation on Investments | | $ | 575,360 | | | $ | 212,052 | | | $ | 144,145 | | | $ | 20,874 | | | $ | 138,933 | |
The difference between cost amounts for financial statement and federal income tax purposes is due primarily to wash sale loss deferrals.
During the year ended September 30, 2024, the International Opportunities Fund utilized capital loss carryforwards of $675 (in thousands).
As of September 30, 2024, the Focus Fund, Growth Fund, Midcap Growth Focus Fund, International Opportunities Fund, and Global Fund, respectively, had (in thousands) $4,442, $0, $0, $85, and $1,144 of qualified late-year losses, which are deferred until fiscal year 2025 for tax purposes. Net late-year losses that are deferred are deemed to arise on the first day of the Fund’s next taxable year.
As of September 30, 2024, the components of accumulated earnings on a tax basis were as follows:
| (Amounts in thousands) | | Focus
Fund | | | Growth
Fund | | | Midcap
Growth Focus
Fund | | | International
Opportunities
Fund | | | Global
Fund | |
| Undistributed Ordinary Income | | $ | — | | | $ | 6,848 | | | $ | 819 | | | $ | — | | | $ | — | |
| Undistributed Trustees’ Deferred Compensation | | | (5,353 | ) | | | (2,118 | ) | | | (994 | ) | | | (323 | ) | | | (2,365 | ) |
| Undistributed Long-Term Capital Gains | | | 60,187 | | | | 29,885 | | | | 15,312 | | | | 1,235 | | | | 6,057 | |
| Tax Accumulated Earnings | | | 54,834 | | | | 34,615 | | | | 15,137 | | | | 912 | | | | 3,692 | |
| Accumulated Capital and Other Losses | | | (4,442 | ) | | | — | | | | — | | | | (85 | ) | | | (1,144 | ) |
| Net Unrealized Appreciation on Investments | | | 575,360 | | | | 212,052 | | | | 144,145 | | | | 20,874 | | | | 138,933 | |
| Net Unrealized Appreciation on Foreign Currency Translations | | | — | | | | — | | | | — | | | | 4 | | | | 2 | |
| Trustees’ Deferred Compensation Mark-to-Market | | | 168 | | | | 71 | | | | 62 | | | | 10 | | | | 42 | |
| Total Accumulated Earnings | | $ | 625,920 | | | $ | 246,738 | | | $ | 159,344 | | | $ | 21,715 | | | $ | 141,525 | |
27
| NOTES TO FINANCIAL STATEMENTS |
NOTES TO FINANCIAL STATEMENTS September 30, 2024 (continued)
The tax character of distributions paid during the fiscal years ended September 30, 2024 and 2023 was as follows:
| | | 2024 | | 2023 | |
| (Amounts in thousands) | | Ordinary Income | | Long-Term Capital Gains | | Ordinary Income | | Long-Term Capital Gains | |
| Focus Fund | | $ | — | | $ | 16,036 | | $ | — | | $ | 84,566 | |
| Growth Fund | | | — | | | 5,735 | | | — | | | — | |
| Midcap Growth Focus Fund | | | — | | | 3,199 | | | — | | | — | |
| International Opportunities Fund | | | 158 | | | — | | | 61 | | | — | |
| Global Fund | | | — | | | 3,444 | | | — | | | 6,325 | |
The tax character of dividends paid may differ from that shown in the Financial Highlights due to short-term gains being treated as ordinary income for tax purposes.
Management of the Adviser has determined that there were no material subsequent events that would require disclosure in the Funds’ financial statements.
28
| REPORT OF INDEPENDENT REGISTERED PUBLIC ACCOUNTING FIRM |
REPORT OF INDEPENDENT REGISTERED PUBLIC ACCOUNTING FIRM
To the Board of Trustees of The Marsico Investment Fund and Shareholders of Marsico Focus Fund, Marsico Growth Fund, Marsico Midcap Growth Focus Fund, Marsico International Opportunities Fund, and Marsico Global Fund
Opinions on the Financial Statements
We have audited the accompanying statements of assets and liabilities, including the schedules of investments, of Marsico Focus Fund, Marsico Growth Fund, Marsico Midcap Growth Focus Fund, Marsico International Opportunities Fund, and Marsico Global Fund (constituting The Marsico Investment Fund, hereafter collectively referred to as the “Funds”) as of September 30, 2024, the related statements of operations for the year ended September 30, 2024, the statements of changes in net assets for each of the two years in the period ended September 30, 2024, including the related notes, and the financial highlights for each of the periods indicated therein (collectively referred to as the “financial statements”). In our opinion, the financial statements present fairly, in all material respects, the financial position of each of the Funds as of September 30, 2024, the results of each of their operations for the year then ended, the changes in each of their net assets for each of the two years in the period ended September 30, 2024 and each of the financial highlights for each of the periods indicated therein in conformity with accounting principles generally accepted in the United States of America.
Basis for Opinions
These financial statements are the responsibility of the Funds’ management. Our responsibility is to express an opinion on the Funds’ financial statements based on our audits. We are a public accounting firm registered with the Public Company Accounting Oversight Board (United States) (PCAOB) and are required to be independent with respect to the Funds in accordance with the U.S. federal securities laws and the applicable rules and regulations of the Securities and Exchange Commission and the PCAOB.
We conducted our audits of these financial statements in accordance with the standards of the PCAOB. Those standards require that we plan and perform the audit to obtain reasonable assurance about whether the financial statements are free of material misstatement, whether due to error or fraud.
Our audits included performing procedures to assess the risks of material misstatement of the financial statements, whether due to error or fraud, and performing procedures that respond to those risks. Such procedures included examining, on a test basis, evidence regarding the amounts and disclosures in the financial statements. Our audits also included evaluating the accounting principles used and significant estimates made by management, as well as evaluating the overall presentation of the financial statements. Our procedures included confirmation of securities owned as of September 30, 2024 by correspondence with the custodian. We believe that our audits provide a reasonable basis for our opinions.

Denver, Colorado
November 20, 2024
We have served as the auditor of one or more investment companies in The Marsico Investment Fund since 1997.
29
OTHER TAX INFORMATION (Unaudited)
Corporate Dividends Received Deduction
For the fiscal year ended September 30, 2024, 0%, 0%, 0%, 0%, and 0% of the dividends paid from net investment income qualified for the dividends received deduction available to corporate shareholders of the Focus Fund, Growth Fund, Midcap Growth Focus Fund, International Opportunities Fund, and Global Fund, respectively.
Qualified Dividend Income
Pursuant to Section 854 of the Internal Revenue Code, the Focus Fund, Growth Fund, Midcap Growth Focus Fund, International Opportunities Fund, and Global Fund designated income dividends (in thousands) of $0, $0, $0, $134, and $0, respectively, as qualified dividend income paid during the fiscal year ended September 30, 2024.
Foreign Taxes Paid
Pursuant to the foreign tax credit election under Section 853 of the Internal Revenue Code, the International Opportunities Fund designated (in thousands) $396 of income derived from foreign sources and $32 of foreign taxes paid, for the year ended September 30, 2024.
Of the ordinary income (including short-term capital gain) distributions made during the year ended September 30, 2024, the proportionate share of income derived from foreign sources and foreign taxes paid attributable to one share of stock are:
| | Foreign Source Income | Foreign Taxes Paid |
| International Opportunities Fund | $0.1739 | $0.0139 |
Long Term Capital Gains Designation
For the fiscal year ended September 30, 2024, the Focus Fund, Growth Fund, Midcap Growth Focus Fund, International Opportunities Fund, and Global Fund designated (in thousands) $16,036, $5,735, $3,199, $0, and $3,444, respectively, as a 20% rate gain distribution for the purpose of the dividends paid deduction. For income tax purposes, the Funds may utilize earnings and profits distributed to shareholders on the redemption of shares as part of the dividends paid deduction.
30
ADDITIONAL INFORMATION (Unaudited)
Item 8. Changes in and Disagreements with Accountants for Open-End Management Investment Companies.
Not applicable.
Item 9. Proxy Disclosures for Open-End Management Investment Companies.
A special meeting of shareholders of the Trust was held on August 28, 2024, for the purpose of electing each of the existing Trustees (“Nominees”) to continue to serve on the Board. At the meeting, holders of 34,997,973 shares were represented, constituting a quorum. Each of the Nominees was elected and the results of the vote were as follows:
| Nominee | | For | | | Withheld | |
| Thomas F. Marsico | | | 34,065,837 | | | | 932,136 | |
| Matthew C. Flavin | | | 33,981,263 | | | | 1,016,710 | |
| Shoshana L. Gillers | | | 34,077,212 | | | | 920,761 | |
| Jay S. Goodgold | | | 34,007,747 | | | | 990,226 | |
| Michael D. Rierson | | | 34,014,155 | | | | 983,818 | |
Item 10. Remuneration Paid to Directors, Officers, and Others of Open-End Management Investment Companies.
The remuneration paid to directors, officers and others are included as part of the Financial Statements. Please refer to the Statements of Operations in the Financial Statements under Item 7 above.
Item 11. Statement Regarding Basis for Approval of Investment Advisory Contract.
Not applicable. The Board did not approve any new investment advisory contracts or investment advisory contract renewals during the most recent fiscal half year.
31
NOTES
32