UNITED STATES
SECURITIES AND EXCHANGE COMMISSION
Washington, D.C. 20549
FORM N-CSR
CERTIFIED SHAREHOLDER REPORT OF REGISTERED MANAGEMENT INVESTMENT COMPANIES
Investment Company Act file number 811-08397
| The Marsico Investment Fund |
| (Exact name of Registrant as specified in charter) |
| |
1200 17th Street, Suite 1600 |
| Denver, Colorado 80202 |
| (Address of principal executive offices) (Zip code) |
| |
| Christopher J. Marsico |
| The Marsico Investment Fund |
1200 17th Street, Suite 1600 |
| Denver, Colorado 80202 |
| (Name and address of agent for service) |
Copies to:
Sander M. Bieber, Esq.
Dechert LLP
1775 I Street, N.W.
Washington, D.C. 20006
Registrant's telephone number, including area code: (303) 454-5600
Date of fiscal year end: September 30
Date of reporting period: March 31, 2011
| Item 1. | Reports to Stockholders |
SEMI-ANNUAL REPORT
MARCH 31, 2011
DEAR SHAREHOLDER:
Enclosed is your semi-annual report for The Marsico Investment Fund, encompassing the six-month fiscal period from October 1, 2010 to March 31, 2011.
The purpose of this report is to provide a retrospective for the Marsico Funds’ six-month investment results by discussing what we believe were the main areas that impacted performance – including the macroeconomic environment, sector and industry positioning, and individual stock selection – as compared to the Funds’ performance benchmark indexes. For updated information regarding the market environment and the Funds’ overall investment postures and performance, please refer to the Funds’ most recent monthly fact sheets and quarterly investment updates, which are available under the name of each Fund on the Funds’ website at www.marsicofunds.com.
NOTE REGARDING THE NEW MARSICO EMERGING MARKETS FUND
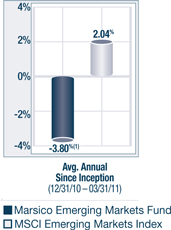
The Marsico Emerging Markets Fund (ticker: MERGX) is a new mutual fund portfolio that was added to the Marsico Funds family on December 31, 2010. The Emerging Markets Fund has three co-managers: Munish Malhotra, CFA, Joshua Rubin, and Charles Wilson of Marsico Capital Management, the investment adviser to the Fund. The performance of the Emerging Markets Fund during the three-month period ended March 31, 2011 and other matters are discussed later in this Semi-Annual Report. Please see the Marsico Funds’ Prospectus dated February 1, 2011 for more information about the Emerging Markets Fund.
| KEY FUND STATISTICS | 2 |
| MARKET ENVIRONMENT | 5 |
| | |
| MARSICO FOCUS FUND |
| Investment Review | 8 |
| Fund Overview | 11 |
| Schedule of Investments | 12 |
| | |
| MARSICO GROWTH FUND |
| Investment Review | 8 |
| Fund Overview | 13 |
| Schedule of Investments | 14 |
| | |
MARSICO 21st CENTURY FUND |
| Investment Review | 16 |
| Fund Overview | 18 |
| Schedule of Investments | 19 |
| | |
| MARSICO INTERNATIONAL OPPORTUNITIES FUND |
| Investment Review | 20 |
| Fund Overview | 22 |
| Schedule of Investments | 23 |
| | |
| MARSICO FLEXIBLE CAPITAL FUND |
| Investment Review | 25 |
| Fund Overview | 27 |
| Schedule of Investments | 28 |
| | |
| MARSICO GLOBAL FUND |
| Investment Review | 30 |
| Fund Overview | 32 |
| Schedule of Investments | 33 |
| | |
| MARSICO EMERGING MARKETS FUND |
| Investment Review | 35 |
| Fund Overview | 37 |
| Schedule of Investments | 38 |
| | |
| FINANCIAL STATEMENTS | 40 |
| NOTES TO FINANCIAL STATEMENTS | 50 |
| EXPENSE EXAMPLE | 59 |
CONSIDERATION OF INVESTMENT ADVISORY AGREEMENTS | 60 |
| OTHER INFORMATION | 63 |
| KEY FUND STATISTICS (UNAUDITED) |
| | | | | Marsico |
| Marsico | | Marsico | | 21st Century |
| Focus Fund | | Growth Fund | | Fund |
| MFOCX | | MGRIX | | MXXIX |
| | | | | |
| For additional disclosures, please see page 11. | | For additional disclosures, please see page 13. | | For additional disclosures, please see page 18. |
| | | | | |
PERFORMANCE COMPARISON(1) | | PERFORMANCE COMPARISON(1) | | PERFORMANCE COMPARISON(1) |
| | | | | |
| | | | |
| | | | | |
TOTAL ANNUAL OPERATING EXPENSES* 1.34% | | TOTAL ANNUAL OPERATING EXPENSES* 1.34% | | TOTAL ANNUAL OPERATING EXPENSES* 1.38% |
| | | | | |
SECTOR ALLOCATION(2) | | SECTOR ALLOCATION(2) | | SECTOR ALLOCATION(2) |
| | | | | |
| | | | |
| | | | | |
| TOP FIVE HOLDINGS | | TOP FIVE HOLDINGS | | TOP FIVE HOLDINGS |
| | | | | |
| APPLE, INC. | 8.35% | | APPLE, INC. | 5.49% | | THE WALT DISNEY COMPANY | 5.33% |
| BAIDU, INC. SPON. ADR | 5.79% | | BAIDU, INC. SPON. ADR | 4.58% | | WELLS FARGO & COMPANY | 5.20% |
| ORACLE CORPORATION | 5.52% | | ORACLE CORPORATION | 4.17% | | WILLIAMS-SONOMA, INC. | 5.14% |
| EATON CORPORATION | 5.34% | | THE DOW CHEMICAL COMPANY | 3.83% | | THE PNC FINANCIAL SERVICES GROUP, INC. | 5.00% |
| MONSANTO COMPANY | 4.58% | | PRICELINE.COM, INC. | 3.72% | | INTUITIVE SURGICAL, INC. | 4.06% |
For additional disclosures about the Marsico Funds, please see page 4. The performance data quoted here represent past performance, and past performance is not a guarantee of future results. Investment return and principal value of an investment will fluctuate so that an investor’s shares, when redeemed, may be worth more or less than their original cost.
| KEY FUND STATISTICS (UNAUDITED) |
| Marsico | | | | |
| International | | Marsico | | Marsico |
| Opportunities Fund | | | | Global Fund |
| MIOFX | | MFCFX | | MGLBX |
| | | | | |
| For additional disclosures, please see page 22. | | For additional disclosures, please see page 27. | | For additional disclosures, please see page 32. |
| | | | | |
PERFORMANCE COMPARISON(1) | | PERFORMANCE COMPARISON(1) | | PERFORMANCE COMPARISON(1) |
| | | | | |
| | | | |
| | | | | |
TOTAL ANNUAL OPERATING EXPENSES* 1.54% | | TOTAL ANNUAL OPERATING EXPENSES* 1.49% | | TOTAL ANNUAL OPERATING EXPENSES* 1.56% |
| | | | | |
SECTOR ALLOCATION(2) | | SECTOR ALLOCATION(2) | | SECTOR ALLOCATION(2) |
| | | | | |
| | | | |
| | | | | |
| TOP FIVE HOLDINGS | | TOP FIVE HOLDINGS | | TOP FIVE HOLDINGS |
| | | | | |
| OGX PETRÓLEO E GÁS PARTICIPAÇÕES S.A. | 5.02% | | SENSATA TECHNOLOGIES HOLDING N.V. | 6.28% | | WELLS FARGO & COMPANY | 5.14% |
| BASF S.E. | 3.39% | | TARGA RESOURCES CORPORATION | 3.60% | | INDUSTRIA DE DISENO TEXTILE S.A. (INDITEX) | 4.82% |
| LI & FUNG LTD. | 3.20% | | LI & FUNG LTD. | 3.35% | | COMPAGNIE FINANCIÈRE RICHEMONT SA | 4.24% |
| SWATCH GROUP AG | 3.14% | | THE TJX COMPANIES, INC. | 3.20% | | THE PNC FINANCIAL SERVICES GROUP, INC. | 4.22% |
| SCHNEIDER ELECTRIC S.A. | 2.78% | | ORACLE CORPORATION | 3.18% | | OGX PETRÓLEO E GÁS PARTICIPAÇÕES S.A. | 3.76% |
Current performance may be lower or higher than the performance information quoted. To obtain performance information current to the most recent month-end, please call 888-860-8686 or visit www.marsicofunds.com. A redemption fee may be imposed on redemptions or exchanges of Fund shares held for 30 days or less.
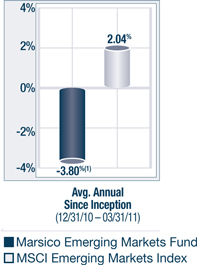
| KEY FUND STATISTICS (UNAUDITED) |
Marsico
Emerging
Markets Fund
MERGX
For additional disclosures, please see page 37.
PERFORMANCE COMPARISON(1)
TOTAL ANNUAL OPERATING EXPENSES* 3.36%
NET EXPENSE*† 1.75%
| | |
| OGX PETRÓLEO E GÁS PARTICIPAÇÕES S.A. | 7.41% |
| BR MALLS PARTICIPACOES S.A. | 5.08% |
| ODONTOPREV S.A. | 3.19% |
| PT BANK RAKYAT INDONESIA PERSERO TBK | 3.16% |
| ICICI BANK LTD. SPON. ADR | 3.09% |
ADDITIONAL DISCLOSURES ABOUT THE MARSICO FUNDS
| * | The Total Annual Operating Expenses and Net Expenses are reflective of the information disclosed in the Funds’ Prospectus dated February 1, 2011. The information may differ from the expense ratios disclosed in this report. |
| † | Marsico Capital Management, LLC (the “Adviser”) has entered into a written expense limitation agreement under which it has agreed to limit the total expenses (excluding interest, taxes, acquired fund fees and expenses, litigation, brokerage and extraordinary expenses) to an annual rate of 1.75% of the Emerging Markets Fund’s average net assets until January 31, 2012. This fee waiver may be terminated at any time after January 31, 2012. The Adviser may recoup any waived amount from a Fund pursuant to this arrangement if such reimbursement does not cause the Fund to exceed existing expense limitations and the reimbursement is made within three years after the year in which the Adviser incurred the expense. |
| (1) | The performance data quoted here represent past performance, and past performance is not a guarantee of future results. Investment return and principal value of an investment will fluctuate so that an investor’s shares, when redeemed, may be worth more or less than their original cost. Current performance may be lower or higher than the performance information quoted. To obtain performance information current to the most recent month-end, please call 888-860-8686 or visit www.marsicofunds.com. A redemption fee may be imposed on redemptions or exchanges of Fund shares held for 30 days or less. |
The performance included in the chart does not reflect the deduction of taxes on Fund distributions or the redemption of Fund shares.
All indices are unmanaged and investors cannot invest directly in an index.
The performance returns for the 21st Century Fund (for the period prior to March 31, 2004), the International Opportunities Fund (for the period prior to September 30, 2004), the Flexible Capital Fund (for the period prior to February 1, 2011), the Global Fund (for the period prior to January 1, 2009 and from April through May 2009), and the Emerging Markets Fund (for the periods ended March 31, 2011) reflect a fee waiver in effect; in the absence of such a waiver, the returns would be reduced. The performance returns for the 21st Century Fund (for the period beginning April 2004 through January 2005), the International Opportunities Fund (for the period beginning October 2004 through December 2005) and the Global Fund (for the one-month period June 2009) would have been higher but for the reimbursement of fees waived previously.
| (2) | Sector weightings represent the percentage of the respective Fund’s investments (excluding cash equivalents) in certain general sectors. These sectors may include more than one industry. The Fund’s portfolio composition is subject to change at any time. |
MARKET ENVIRONMENT: OCTOBER 2010 – MARCH 2011 (UNAUDITED)
Broad equity market indices posted strong returns for the six-month period ended March 31, 2011. US and international equities demonstrated considerable fortitude during the period, undeterred by a number of headwinds and “black swan” events – including the tragic earthquake and tsunami in Japan, geopolitical unrest in the Middle East and North Africa, higher oil prices, global inflationary pressures, record-high food costs, a still-struggling US housing market, rekindled worries about the financial health of some Eurozone countries, central bank tightenings in many countries, and federal budget controversy in Washington.
Equities shook off these issues and were bolstered by a generally sanguine outlook for the global economy, highlighted by still-robust levels of growth in developing economies and increasing signs that the glide path for the US economy continued to improve. However, that positive view was challenged as a result of the potential for a sustained increase in oil prices to dampen that growth.
US equity markets were bolstered by a variety of factors, chief among them additional signs of a resilient economy and a recovery that appeared to be both broadening out and gaining momentum. That positive perspective seemed to be anchored by indications of healing in the labor markets, increased bank lending activity, a constructive outlook for corporate earnings and evidence that massive cash positions on corporate balance sheets were starting to be deployed into productive activities such as dividend increases, share buybacks, accretive acquisitions and capital spending projects. Investors in general seemed to be more favorably disposed to equities; net inflows into equity mutual funds turned positive for the first time in several years. At period-end, both the S&P 500 Index and Russell 1000 Index had rallied more than 100% off their March 2009 “lows.”
International equities posted more muted gains than their US counterparts. Although a global growth recovery seemed on balance to be gaining further traction, international markets faced renewed concerns regarding the Eurozone’s financial stability, nascent signs of higher inflation in some countries (especially those whose inflation indexes are significantly influenced by food prices), and fiscal and monetary policy tightening measures undertaken – or being contemplated – in China, India and Brazil. Rapidly-escalating geopolitical developments in the Middle East and North Africa, the disastrous earthquake and tsunami in Japan, and fears of a major nuclear crisis there, were further areas of concern.
As depicted in the table below, US markets, led by small and medium-capitalization equities, posted strong returns, while international markets experienced more muted gains:
| | Universe of | Six-Month |
Index Name(1) | Equities Represented | Total Return |
| US | | |
| | | |
| S&P 500 | US large-capitalization equities | +17.31% |
| | | |
| Russell 3000 | US publicly-traded equities of all sizes | +18.71% |
| | | |
| Russell 2000 | US small-capitalization equities | +25.48% |
| | | |
| Russell Mid-Cap | US medium-capitalization equities | +21.70% |
| | | |
| INTERNATIONAL | | |
| | | |
| MSCI EAFE (US$) | Equities in developed international equity markets, including Japan, Western Europe, and Australasia | +10.20% |
| | | |
MSCI Emerging Markets (US$) | Equities in developing international equity markets, including China, India, Eastern Europe, and Latin America | +9.53% |
| | | |
| MSCI ACWI (US$) | Equities in the global developed and emerging markets | +13.54% |
US LARGE-CAPITALIZATION EQUITIES
US large-cap stocks posted strong returns for the six-month period ended March 31, 2011. Stock price appreciation was broad-based; all of the ten S&P 500 Index economic sectors, as defined under the Global Industry Classification Standard (“GICS”)(2), posted positive returns. Energy (+42%), Materials (+24%), Industrials (+22%) and Consumer Discretionary (+18%) were the strongest-performing sectors. Financials (+15%), Information Technology (+14%) and Telecommunication Services (+13%) also registered double-digit gains. Health Care (+9%), Consumer Staples (+9%) and Utilities (+4%) were the laggards.
All industry groups had positive performance, though the results ranged widely. Pharmaceuticals, Biotechnology & Life Sciences (+4%) and Household & Personal Products (+5%) were among the weakest-performing industry groups. Automobiles & Components (+29%) and Media (+27%) were among the strongest-performing industry groups.
US ALL-CAPITALIZATION EQUITIES
Performance of the broad US equity market, as measured by the Russell 3000 Index which encompasses publicly-traded companies of all sizes, was strong for the six-month period. Similar to the S&P 500 Index, sector- and industry-level performance was positive across the board within the Russell 3000 Index. Energy (+43%), Materials (+26%) and Industrials (+24%) were the best-performing sectors of the Russell 3000 Index. Utilities and Consumer Staples sectors, however, posted gains of just +6% and +10%, respectively.
At an industry group-level within the Russell 3000 Index, Automobiles & Components soared +31%. Capital Goods and Media each rose +26%. Household & Personal Products was the weakest-performing industry group, with a return of +5%.
The mid-capitalization and small-capitalization areas of the US equity market were comparatively stronger than large-capitalization equities. Smaller-capitalization equities sometimes outperform large-capitalization equities as investors’ risk appetite increases.
INTERNATIONAL EQUITIES
Developed market international equities posted solid gains for the six-month period ended March 31, 2011.
The MSCI EAFE Index posted positive performance across the ten GICS sectors. Energy (+22%) and Materials (+20%) were the strongest-performing sectors of the Index. Industrials (+17%), Telecommunication Services (+11%) and Information Technology (+10%) also experienced double-digit gains. Utilities (+3%) and Consumer Staples (+4%) were the weakest-performing sectors. All other sectors posted returns ranging from +5% to +9%.
Many GICS industry groups in the MSCI EAFE Index experienced positive returns. The most significant gains included: Semiconductors & Semiconductor Equipment (+33%), Capital Goods (+21%), Insurance (+14%) and Automobiles & Components (+13%). Several industries posted negative results, including Retailing (-4%), Food & Staples Retailing (-1%), Commercial Services & Supplies (-1%) and Pharmaceuticals & Biotechnology and Life Sciences (-0.1%).
All of the MSCI EAFE Index’s country-level constituents posted positive returns for the period. Norway (+19%), Austria (+18%) and Germany (+18%) were the strongest country-level performers. Belgium and Israel were the weakest-performing countries; each registered returns of just +2%. Japan and the United Kingdom, which together comprise approximately 39% of the MSCI EAFE Index, posted returns of +7% and +10%, respectively.
Emerging markets, meanwhile, slightly trailed their developed-market counterparts. As noted above, the MSCI Emerging Markets Index posted a six-month return of +9.53%. Emerging market performance was weaker on fears of inflationary factors, slower growth in China and unrest in the Middle East.
Overall, US-based investors in international equities benefitted from a currency lift during the six-month period, as the US dollar weakened as compared to certain foreign currencies including the euro, the Australian dollar and Canadian dollar, thereby effectively increasing returns from foreign securities as expressed in US dollars.
THE MARSICO INVESTMENT TEAM
| (1) | All indices are unmanaged and investors cannot invest directly in an index. |
| (2) | The Global Industry Classification Standard (“GICS”) was developed by and is the exclusive property and service mark of MSCI Inc. (“MSCI”) and Standard & Poor’s (“S&P”) and is licensed for use by Marsico Capital Management, LLC (“MCM”). Neither MSCI, S&P, nor MCM or any third party involved in compiling GICS makes any express or implied warranties or representations with respect to such standard or classification (or the results from use thereof), and all such parties hereby expressly disclaim all warranties of originality, accuracy, completeness, merchantability and fitness for a particular purpose with respect to any such standard or classification. MSCI, S&P, MCM, and any of their affiliates or third parties involved in compiling GICS shall not have any liability for any direct, indirect, special, punitive, consequential or any other damages (including lost profits) even if notified of the possibility of such damages. |
INVESTMENT REVIEW BY TOM MARSICO, DOUG RAO AND CORALIE WITTER (UNAUDITED)
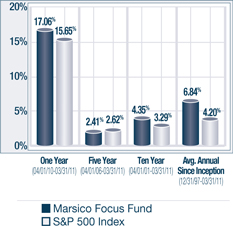
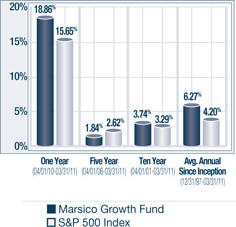
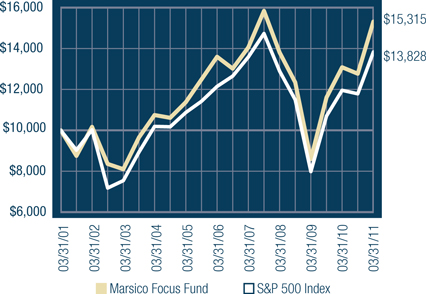
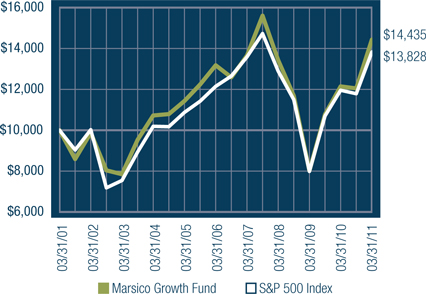
The Marsico Focus Fund and the Marsico Growth Fund outperformed their primary benchmark index for the six-month fiscal period ended March 31, 2011. The Marsico Focus Fund generated a total return of +19.95% and the Marsico Growth Fund posted a return of +19.83%. For comparative purposes, the S&P 500 Index – which we consider to be the Funds’ primary benchmark index – had a total return of +17.31% for the period ended March 31, 2011. Please see the Funds’ Overviews for more detailed information about each Fund’s longer-term performance for various periods ended March 31, 2011.
The performance data for the Funds quoted here represent past performance, and past performance is not a guarantee of future results. Investment return and principal value of an investment will fluctuate so that an investor’s shares, when redeemed, may be worth more or less than their original cost. Current performance may be lower or higher than the performance information quoted. To obtain performance information current to the most recent month-end, please call 888-860-8686 or visit www.marsicofunds.com.(1)
This review highlights Fund performance over a six-month fiscal period. Shareholders should keep in mind that the Funds are intended for long-term investors who hold their shares for substantially longer periods of time. You should also keep in mind that our views on all investments discussed in this report are subject to change at any time. References to specific securities, industries, and sectors discussed in this report are not recommendations to buy or sell such securities or related investments, and the Funds may not necessarily hold these securities or investments today. Please see the accompanying Schedules of Investments for the percentage of each Fund’s portfolio represented by the securities mentioned in this report as of the end of the reporting period.
The Focus Fund is non-diversified and may hold fewer securities than a diversified fund. Holding fewer securities increases the risk that the value of the Fund could go down because of the poor performance of a single investment. Stocks and markets in which the Focus Fund and the Growth Fund invest may experience periods of turbulence and instability, and the general risk that domestic and global economies and stock markets may go through periods of decline and cyclical change.
The Focus Fund and the Growth Fund often invest in similar growth companies. Their performance may differ at times, however, because of a variety of factors. Among other factors, the Focus Fund is a non-diversified mutual fund that may invest in a more concentrated portfolio and may hold the securities of fewer issuers than the Growth Fund. As a result, the Focus Fund may hold some securities that are different from those held by the Growth Fund, and may be more exposed to individual stock volatility than the Growth Fund or other mutual funds that invest in a larger number of securities.
FOCUS FUND
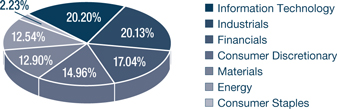
The Marsico Focus Fund outperformed the S&P 500 Index for the six-month fiscal period ended March 31, 2011. The Fund’s performance was positively impacted by stock selection in the Information Technology, Materials and Industrials sectors. Sector positioning also aided performance within the Materials and Industrials sectors.
Information Technology positions were led by Baidu, Inc. Spon. ADR, a China-based website search engine, which posted a return of +35%. Other strong-performing holdings included Apple, Inc., maker of the iPhone and iPad (+23%), and enterprise software company Oracle Corporation (+25%).
The Fund benefitted from stock selection and allocations in the Materials and Industrials sectors. Materials and Industrials were strong-performing sectors for the period and the Fund benefitted from having a substantial portion of its net assets invested in the sectors. Stock selection in the sectors was also strong. The Dow Chemical Company, a leading manufacturer of chemicals, polymers, and agricultural products, gained +39%, while agricultural material company Monsanto Company soared +52%. Leading Industrials positions included railroad operator Union Pacific Corporation (+21%) and power management company Eaton Corporation (+36%).
Certain of the Fund’s Consumer Discretionary holdings posted strong returns, including casino/resort company Wynn Resorts Ltd. (+58%) and online travel reservations retailer priceline.com, Inc. (+46%).
Finally, the Fund benefitted from having few investments in the Consumer Staples, Health Care and Utilities sectors, which were the weakest-performing sectors of the S&P 500 Index.
There were several areas of weakness for the Focus Fund during the semi-annual period. Early in the reporting period, the Fund had few investments in the Energy sector. Energy was the strongest-performing sector of the S&P 500 Index, soaring nearly 42%. While the Fund’s energy-related holdings posted a return that was in-line with the Index sector return, the Fund was penalized versus the benchmark index by not having a higher percentage of its net assets invested in the sector. The Fund’s performance was further impaired by stock selection in the Financials sector. The Fund’s position in Citigroup, Inc. (-4%) and India-based ICICI Bank Ltd. Spon. ADR (-6% prior to being sold) detracted from performance results. Other positions having a material drag on performance included Intuitive Surgical, Inc., a manufacturer of robotic systems for assisting in minimally invasive surgeries, and athletic apparel company Nike, Inc. – Cl.B. Both Intuitive Surgical and Nike posted negative returns and were sold from the Fund.
During the period, the Fund reduced its exposure to the Consumer Discretionary and Health Care sectors, while increasing its exposure to the Energy sector.
GROWTH FUND
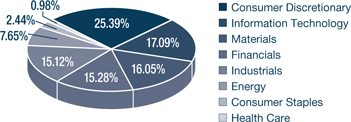
The Marsico Growth Fund shared several of the Focus Fund’s performance attributes for the six-month fiscal period ended March 31, 2011. Like the Focus Fund, certain of the Growth Fund’s Information Technology positions posted strong gains, most notably Baidu, Inc. Spon. ADR (+34%), Apple, Inc. (+23%) and Oracle Corporation (+25%).
Also similar to the Focus Fund, the Growth Fund benefitted from stock selection and allocation to the Materials sector. Monsanto Company (+53%), The Dow Chemical Company (+38%) and specialty materials company PPG Industries, Inc. (+33%) each registered strong stock price gains.
The Fund did well to underweight Health Care, Utilities and Consumer Staples stocks, which were the weakest performers within the index. Among these weak performing sectors however, was another positive contributor, one of the Fund’s largest Consumer Staples holdings, The Estee Lauder Companies, Inc. – Cl. A, a leader in skin care and cosmetics products, which posted a return of +54%.
The Growth Fund had significantly less exposure than the S&P 500 Index to energy-related investments. The Fund lost some ground by not investing more in the Energy sector, as it was the strongest performing sector of the Index with a return of nearly +42%.
Performance in the Consumer Discretionary sector was held back by investments in athletic apparel company Nike, Inc. – Cl. B (-5%) and restaurant operator McDonald’s Corporation (+3%). The Fund trimmed its investments in Nike and McDonald’s during the period.
While stock selection in the Information Technology sector was generally strong, two of the Fund’s technology positions posted disappointing returns. Enterprise network companies F5 Networks, Inc. and Cisco Systems, Inc. each posted double-digit declines during the periods they were held by the Fund. The Fund sold its position in Cisco Systems during the period and maintained a small investment in F5 Networks as of March 31, 2011.
The Fund increased its exposure to the Financials and Energy sectors during the period, while trimming exposure to the Consumer Discretionary sector. During the period, the Fund reduced its Health Care and Telecommunication Services positions.
Fiscal Period-End Investment Posture
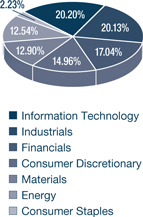
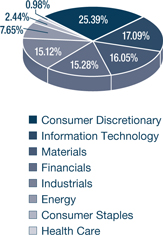
As of March 31, 2011, the Focus Fund’s and the Growth Fund’s primary sector allocations included Information Technology, Industrials, Financials, Materials and Consumer Discretionary. The Funds had no significant exposure to the Utilities, Telecommunication Services, or Health Care sectors.
In closing, we are pleased to note that, as previously communicated to shareholders in 2010, Coralie Witter, CFA was promoted to serve as co-portfolio manager for the Focus Fund and the Growth Fund effective November 1, 2010. Coralie is a senior analyst who joined Marsico Capital Management in June 2004. Like all Marsico Capital Management analysts, Coralie covers a wide array of sectors and industry groups, with an emphasis on global consumer-related companies, transportation and global logistics companies, and aerospace. She has over 15 years of experience in the financial services industry, most of which has involved equity research. Prior to joining Marsico Capital Management, Coralie spent six years with Goldman, Sachs & Co., where she was a Vice President in Equity Research, the lead analyst responsible for the restaurant industry, and covered various internet companies for several years. Coralie graduated from the University of Colorado in 1994 with a Bachelor’s degree in International Affairs. She was awarded the designation of Chartered Financial Analyst (“CFA”) in 1998.
Sincerely,
THOMAS F. MARSICO
A. DOUGLAS RAO
CORALIE T. WITTER, CFA
PORTFOLIO MANAGERS
| (1) | Total returns are based on net change in net asset value assuming reinvestment of distributions. A redemption fee of 2% may be imposed on redemptions or exchanges of Fund shares owned for 30 days or less. Please see the Prospectus for more information. |
March 31, 2011 (Unaudited)
The Focus Fund invests primarily in the common stocks of large companies, normally a core position of 20–30 common stocks that are selected for their long-term growth potential.
| TOTAL ANNUAL OPERATING EXPENSES* | 1.34% | NET ASSETS | $1,235,893,693 | NET ASSET VALUE PER SHARE | $18.94 |
GROWTH OF $10,000(1) | PERFORMANCE COMPARISON |
| | |
| |
| | |
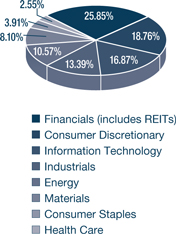
SECTOR ALLOCATION(2) | TOP FIVE HOLDINGS |
| | |
| | APPLE, INC. | 8.35% |
| | BAIDU, INC. SPON. ADR | 5.79% |
| | ORACLE CORPORATION | 5.52% |
| | EATON CORPORATION | 5.34% |
| | MONSANTO COMPANY | 4.58% |
| | | | |
| * | The Total Annual Operating Expenses are reflective of the information disclosed in the Funds’ Prospectus dated February 1, 2011 and may differ from the expense ratio disclosed in this report. |
The performance data quoted here represent past performance, and past performance is not a guarantee of future results. Investment return and principal value of an investment will fluctuate so that an investor’s shares, when redeemed, may be worth more or less than their original cost. Current performance may be lower or higher than the performance information quoted. To obtain performance information current to the most recent monthend, please call 888-860-8686 or visit www.marsicofunds.com. A redemption fee may be imposed on redemptions or exchanges of Fund shares held for 30 days or less.
The performance included in the chart and graph does not reflect the deduction of taxes on Fund distributions or the redemption of Fund shares.
All indices are unmanaged and investors cannot invest directly in an index.
| This chart assumes an initial investment of $10,000 made on March 31, 2001. Total returns are based on net change in NAV, assuming reinvestment of distributions. |
| Sector weightings represent the percentage of the Fund’s investments (excluding cash equivalents) in certain general sectors. These sectors may include more than one industry. The Fund’s portfolio composition is subject to change at any time. |
MARSICO FOCUS FUND
SCHEDULE OF INVESTMENTS
March 31, 2011 (Unaudited)
| | | Number | | | | | | Percent | |
| | | of | | | | | | of Net | |
| | | Shares | | | Value | | | Assets | |
| COMMON STOCKS | | | | | | | | | |
| Aerospace & Defense | | | | | | | | | |
| General Dynamics Corporation | | | 240,540 | | | $ | 18,415,742 | | | | 1.49 | % |
| Goodrich Corporation | | | 390,607 | | | | 33,408,617 | | | | 2.70 | |
| Precision Castparts Corp. | | | 165,016 | | | | 24,287,055 | | | | 1.97 | |
| | | | | | | | 76,111,414 | | | | 6.16 | |
| Casinos & Gaming | | | | | | | | | | | | |
| Wynn Resorts Ltd. | | | 355,562 | | | | 45,245,264 | | | | 3.66 | |
| | | | | | | | | | | | | |
| Computer Hardware | | | | | | | | | | | | |
| Apple, Inc.* | | | 296,096 | | | | 103,174,651 | | | | 8.35 | |
| | | | | | | | | | | | | |
| Construction & Farm | | | | | | | | | | | | |
| Machinery & Heavy Trucks | | | | | | | | | | | | |
| Cummins, Inc. | | | 408,216 | | | | 44,748,638 | | | | 3.62 | |
| | | | | | | | | | | | | |
| Consumer Finance | | | | | | | | | | | | |
| American Express Company | | | 474,788 | | | | 21,460,418 | | | | 1.74 | |
| | | | | | | | | | | | | |
| Diversified Banks | | | | | | | | | | | | |
| U.S. Bancorp | | | 1,875,727 | | | | 49,575,465 | | | | 4.01 | |
| Wells Fargo & Company | | | 1,347,006 | | | | 42,700,090 | | | | 3.46 | |
| | | | | | | | 92,275,555 | | | | 7.47 | |
| Diversified Chemicals | | | | | | | | | | | | |
| The Dow Chemical Company | | | 1,133,109 | | | | 42,774,865 | | | | 3.46 | |
| | | | | | | | | | | | | |
| Diversified Metals & Mining | | | | | | | | | | | | |
| Freeport-McMoRan | | | | | | | | | | | | |
| Copper & Gold, Inc. | | | 1,004,929 | | | | 55,823,806 | | | | 4.52 | |
| | | | | | | | | | | | | |
| Fertilizers & Agricultural Chemicals | | | | | | | | | | | | |
| Monsanto Company | | | 783,185 | | | | 56,592,948 | | | | 4.58 | |
| | | | | | | | | | | | | |
| Industrial Machinery | | | | | | | | | | | | |
| Eaton Corporation | | | 1,190,370 | | | | 65,994,113 | | | | 5.34 | |
| | | | | | | | | | | | | |
| Internet Retail | | | | | | | | | | | | |
| Amazon.com, Inc.* | | | 233,493 | | | | 42,059,094 | | | | 3.40 | |
| priceline.com, Inc.* | | | 103,895 | | | | 52,616,584 | | | | 4.26 | |
| | | | | | | | 94,675,678 | | | | 7.66 | |
| Internet Software & Services | | | | | | | | | | | | |
| Baidu, Inc. Spon. ADR* | | | 519,394 | | | | 71,577,687 | | | | 5.79 | |
| | | | | | | | | | | | | |
| Investment Banking & Brokerage | | | | | | | | | | | | |
| The Goldman Sachs Group, Inc. | | | 302,583 | | | | 47,950,328 | | | | 3.88 | |
| | | | | | | | | | | | | |
| Oil & Gas Equipment & Services | | | | | | | | | | | | |
| Halliburton Company | | | 1,050,339 | | | | 52,348,896 | | | | 4.23 | |
| | | | | | | | | | | | | |
| Oil & Gas Exploration & Production | | | | | | | | | | | | |
| Anadarko Petroleum Corporation | | | 513,319 | | | | 42,051,092 | | | | 3.40 | |
| EOG Resources, Inc. | | | 318,366 | | | | 37,729,555 | | | | 3.05 | |
| | | | | | | | 79,780,647 | | | | 6.45 | |
| Oil & Gas Storage & Transportation | | | | | | | | | | | | |
| Kinder Morgan, Inc.* | | | 629,103 | | | | 18,646,613 | | | | 1.51 | |
| | | | | | | | | | | | | |
| Other Diversified Financial Services | | | | | | | | | | | | |
| Citigroup, Inc.* | | | 9,800,013 | | | | 43,316,057 | | | | 3.50 | |
| | | | | | | | | | | | | |
| Packaged Foods & Meats | | | | | | | | | | | | |
| Mead Johnson Nutrition Company | | | 462,812 | | | | 26,810,699 | | | | 2.17 | |
| | | | | | | | | | | | | |
| Railroads | | | | | | | | | | | | |
| Union Pacific Corporation | | | 561,800 | | | | 55,241,794 | | | | 4.47 | |
| | | | | | | | | | | | | |
| Restaurants | | | | | | | | | | | | |
| Chipotle Mexican Grill, Inc.* | | | 23,454 | | | | 6,388,166 | | | | 0.52 | |
| Starbucks Corporation | | | 910,585 | | | | 33,646,116 | | | | 2.72 | |
| | | | | | | | 40,034,282 | | | | 3.24 | |
| Systems Software | | | | | | | | | | | | |
| Oracle Corporation | | | 2,044,115 | | | | 68,212,117 | | | | 5.52 | |
| | | | | | | | | | | | | |
| TOTAL COMMON STOCKS | | | | | | | | | | | | |
| (Cost $833,120,039) | | | | | | | 1,202,796,470 | | | | 97.32 | |
| | | | | | | | | | | | | |
| SHORT-TERM INVESTMENTS | | | | | | | | | | | | |
| State Street Institutional | | | | | | | | | | | | |
| U.S. Government Money Market | | | | | | | | | | | | |
| Fund, 0.037% | | | 46,188,397 | | | | 46,188,397 | | | | 3.74 | |
| | | | | | | | | | | | | |
| TOTAL SHORT-TERM INVESTMENTS | | | | | | | | | | | | |
| (Cost $46,188,397) | | | | | | | 46,188,397 | | | | 3.74 | |
| | | | | | | | | | | | | |
| TOTAL INVESTMENTS | | | | | | | | | | | | |
| (Cost $879,308,436) | | | | | | | 1,248,984,867 | | | | 101.06 | |
| | | | | | | | | | | | | |
| Liabilities, Less Cash and Other Assets | | | | | | | (13,091,174 | ) | | | (1.06 | ) |
| | | | | | | | | | | | | |
| NET ASSETS | | | | | | $ | 1,235,893,693 | | | | 100.00 | % |
See notes to financial statements.
March 31, 2011 (Unaudited)
The Growth Fund invests primarily in the common stocks of large companies that are selected for their long-term growth potential. The Growth Fund will normally hold a core position of between 35 and 50 common stocks.
| TOTAL ANNUAL OPERATING EXPENSES* | 1.34% | NET ASSETS | $871,928,520 | NET ASSET VALUE PER SHARE | $20.41 |
GROWTH OF $10,000(1) | PERFORMANCE COMPARISON |
| | |
| |
| | |
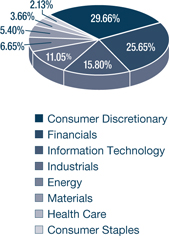
SECTOR ALLOCATION(2) | TOP FIVE HOLDINGS |
| | |
| | APPLE, INC. | 5.49% |
| | BAIDU, INC. SPON. ADR | 4.58% |
| | ORACLE CORPORATION | 4.17% |
| | | 3.83% |
| | | 3.72% |
| | | | |
| * | The Total Annual Operating Expenses are reflective of the information disclosed in the Funds’ Prospectus dated February 1, 2011 and may differ from the expense ratio disclosed in this report. |
The performance data quoted here represent past performance, and past performance is not a guarantee of future results. Investment return and principal value of an investment will fluctuate so that an investor’s shares, when redeemed, may be worth more or less than their original cost. Current performance may be lower or higher than the performance information quoted. To obtain performance information current to the most recent monthend, please call 888-860-8686 or visit www.marsicofunds.com. A redemption fee may be imposed on redemptions or exchanges of Fund shares held for 30 days or less.
The performance included in the chart and graph does not reflect the deduction of taxes on Fund distributions or the redemption of Fund shares.
All indices are unmanaged and investors cannot invest directly in an index.
(1) | This chart assumes an initial investment of $10,000 made on March 31, 2001. Total returns are based on net change in NAV, assuming reinvestment of distributions. |
(2) | Sector weightings represent the percentage of the Fund’s investments (excluding cash equivalents) in certain general sectors. These sectors may include more than one industry. The Fund’s portfolio composition is subject to change at any time. |
MARSICO GROWTH FUND
SCHEDULE OF INVESTMENTS
March 31, 2011 (Unaudited)
| | | Number | | | | | | Percent | |
| | | of | | | | | | of Net | |
| | | Shares | | | Value | | | Assets | |
| COMMON STOCKS | | | | | | | | | |
| | | | | | | | | | |
| Aerospace & Defense | | | | | | | | | |
| General Dynamics Corporation | | | 229,726 | | | $ | 17,587,823 | | | | 2.02 | % |
| Precision Castparts Corp. | | | 130,067 | | | | 19,143,261 | | | | 2.19 | |
| | | | | | | | 36,731,084 | | | | 4.21 | |
| Apparel Retail | | | | | | | | | | | | |
| The TJX Companies, Inc. | | | 422,235 | | | | 20,997,747 | | | | 2.41 | |
| | | | | | | | | | | | | |
| Apparel, Accessories & Luxury Goods | | | | | | | | | | | | |
| Compagnie Financière | | | | | | �� | | | | | | |
| Richemont SA ADR | | | 3,177,189 | | | | 18,300,609 | | | | 2.10 | |
| | | | | | | | | | | | | |
| Application Software | | | | | | | | | | | | |
| salesforce.com, inc.* | | | 67,797 | | | | 9,056,323 | | | | 1.04 | |
| | | | | | | | | | | | | |
| Casinos & Gaming | | | | | | | | | | | | |
| Wynn Resorts Ltd. | | | 170,517 | | | | 21,698,288 | | | | 2.49 | |
| | | | | | | | | | | | | |
| Communications Equipment | | | | | | | | | | | | |
| Acme Packet, Inc.* | | | 73,677 | | | | 5,228,120 | | | | 0.60 | |
| F5 Networks, Inc.* | | | 76,880 | | | | 7,885,582 | | | | 0.90 | |
| | | | | | | | 13,113,702 | | | | 1.50 | |
| Computer Hardware | | | | | | | | | | | | |
| Apple, Inc.* | | | 137,254 | | | | 47,826,156 | | | | 5.49 | |
| | | | | | | | | | | | | |
| Construction & Farm | | | | | | | | | | | | |
| Machinery & Heavy Trucks | | | | | | | | | | | | |
| Cummins, Inc. | | | 100,148 | | | | 10,978,224 | | | | 1.26 | |
| | | | | | | | | | | | | |
| Distributors | | | | | | | | | | | | |
| Li & Fung Ltd. | | | 1,018,000 | | | | 5,208,734 | | | | 0.60 | |
| | | | | | | | | | | | | |
| Diversified Banks | | | | | | | | | | | | |
| U.S. Bancorp | | | 1,104,944 | | | | 29,203,670 | | | | 3.35 | |
| Wells Fargo & Company | | | 663,939 | | | | 21,046,866 | | | | 2.41 | |
| | | | | | | | 50,250,536 | | | | 5.76 | |
| Diversified Chemicals | | | | | | | | | | | | |
| PPG Industries, Inc. | | | 259,511 | | | | 24,708,042 | | | | 2.83 | |
| The Dow Chemical Company | | | 883,341 | | | | 33,346,123 | | | | 3.83 | |
| | | | | | | | 58,054,165 | | | | 6.66 | |
| Diversified Metals & Mining | | | | | | | | | | | | |
| BHP Billiton PLC ADR | | | 91,543 | | | | 7,286,823 | | | | 0.84 | |
| Freeport-McMoRan Copper & Gold, Inc. | | | 273,940 | | | | 15,217,367 | | | | 1.74 | |
| | �� | | | | | | 22,504,190 | | | | 2.58 | |
| Electrical Components & Equipment | | | | | | | | | | | | |
| Rockwell Automation, Inc. | | | 105,819 | | | | 10,015,768 | | | | 1.15 | |
| | | | | | | | | | | | | |
| Fertilizers & Agricultural Chemicals | | | | | | | | | | | | |
| Monsanto Company | | | 376,463 | | | | 27,203,216 | | | | 3.12 | |
| | | | | | | | | | | | | |
| Footwear | | | | | | | | | | | | |
| NIKE, Inc. - Cl. B | | | 282,423 | | | | 21,379,421 | | | | 2.45 | |
| | | | | | | | | | | | | |
| Industrial Gases | | | | | | | | | | | | |
| Praxair, Inc. | | | 316,952 | | | | 32,202,323 | | | | 3.69 | |
| | | | | | | | | | | | | |
| Industrial Machinery | | | | | | | | | | | | |
| Danaher Corporation | | | 312,984 | | | | 16,243,870 | | | | 1.86 | |
| Eaton Corporation | | | 319,178 | | | | 17,695,228 | | | | 2.03 | |
| | | | | | | | 33,939,098 | | | | 3.89 | |
| Integrated Oil & Gas | | | | | | | | | | | | |
| Occidental Petroleum Corporation | | | 63,194 | | | | 6,603,141 | | | | 0.76 | |
| | | | | | | | | | | | | |
| Internet Retail | | | | | | | | | | | | |
| Amazon.com, Inc.* | | | 156,772 | | | | 28,239,341 | | | | 3.24 | |
| priceline.com, Inc.* | | | 64,103 | | | | 32,464,323 | | | | 3.72 | |
| | | | | | | | 60,703,664 | | | | 6.96 | |
| Internet Software & Services | | | | | | | | | | | | |
| Baidu, Inc. Spon. ADR* | | | 289,775 | | | | 39,933,893 | | | | 4.58 | |
| Youku.com, Inc. Spon. ADR* | | | 58,912 | | | | 2,798,909 | | | | 0.32 | |
| | | | | | | | 42,732,802 | | | | 4.90 | |
| Investment Banking & Brokerage | | | | | | | | | | | | |
| The Goldman Sachs Group, Inc. | | | 170,807 | | | | 27,067,785 | | | | 3.10 | |
| | | | | | | | | | | | | |
| Life Sciences Tools & Services | | | | | | | | | | | | |
| Agilent Technologies, Inc.* | | | 190,868 | | | | 8,547,069 | | | | 0.98 | |
| | | | | | | | | | | | | |
| Movies & Entertainment | | | | | | | | | | | | |
| Time Warner, Inc. | | | 463,172 | | | | 16,535,241 | | | | 1.90 | |
| | | | | | | | | | | | | |
| Oil & Gas Equipment & Services | | | | | | | | | | | | |
| Halliburton Company | | | 458,377 | | | | 22,845,510 | | | | 2.62 | |
| | | | | | | | | | | | | |
| Oil & Gas Exploration & Production | | | | | | | | | | | | |
| Anadarko Petroleum Corporation | | | 218,837 | | | | 17,927,127 | | | | 2.06 | |
| Continental Resources, Inc.* | | | 93,526 | | | | 6,684,303 | | | | 0.77 | |
| EOG Resources, Inc. | | | 107,029 | | | | 12,684,007 | | | | 1.45 | |
| | | | | | | | 37,295,437 | | | | 4.28 | |
| Other Diversified Financial Services | | | | | | | | | | | | |
| Citigroup, Inc.* | | | 6,079,500 | | | | 26,871,390 | | | | 3.08 | |
| | | | | | | | | | | | | |
| Packaged Foods & Meats | | | | | | | | | | | | |
| Mead Johnson Nutrition Company | | | 138,080 | | | | 7,998,975 | | | | 0.92 | |
| | | | | | | | | | | | | |
| Personal Products | | | | | | | | | | | | |
| The Estee Lauder Companies, Inc. - Cl. A | | | 138,012 | | | | 13,298,836 | | | | 1.53 | |
| | | | | | | | | | | | | |
| Railroads | | | | | | | | | | | | |
| Union Pacific Corporation | | | 275,006 | | | | 27,041,340 | | | | 3.10 | |
| | | | | | | | | | | | | |
| Regional Banks | | | | | | | | | | | | |
| The PNC Financial Services Group, Inc. | | | 312,019 | | | | 19,654,077 | | | | 2.25 | |
| | | | | | | | | | | | | |
| Restaurants | | | | | | | | | | | | |
| McDonald’s Corporation | | | 195,058 | | | | 14,841,963 | | | | 1.70 | |
| Starbucks Corporation | | | 439,737 | | | | 16,248,282 | | | | 1.86 | |
| YUM! Brands, Inc. | | | 201,315 | | | | 10,343,565 | | | | 1.19 | |
| | | | | | | | 41,433,810 | | | | 4.75 | |
| Specialty Stores | | | | | | | | | | | | |
| Tiffany & Co. | | | 247,628 | | | | 15,214,264 | | | | 1.74 | |
| | | | | | | | | | | | | |
| Systems Software | | | | | | | | | | | | |
| Oracle Corporation | | | 1,089,244 | | | | 36,348,072 | | | | 4.17 | |
| | | | | | | | | | | | | |
| TOTAL COMMON STOCKS | | | | | | | | | | | | |
| (Cost $570,306,525) | | | | | | | 849,650,997 | | | | 97.44 | |
| | | | | | | | | | | | | |
| PREFERRED STOCKS | | | | | | | | | | | | |
| Diversified Banks | | | | | | | | | | | | |
| Wells Fargo & Company, | | | | | | | | | | | | |
| Series J Pref., 8.000% | | | 337,000 | | | | 9,462,960 | | | | 1.09 | |
| | | | | | | | | | | | | |
| TOTAL PREFERRED STOCKS | | | | | | | | | | | | |
| (Cost $5,954,707) | | | | | | | 9,462,960 | | | | 1.09 | |
See notes to financial statements.
| | | Number | | | | | | Percent | |
| | | of | | | | | | of Net | |
| | | Shares/Units | | | Value | | | Assets | |
| UNITS | | | | | | | | | |
| | | | | | | | | | |
| Marine Ports & Services | | | | | | | | | |
| Hutchison Port Holdings | | | | | | | | | |
| Trust - Cl. U* | | | 13,289,000 | | | $ | 13,156,110 | | | | 1.51 | % |
| | | | | | | | | | | | | |
| TOTAL UNITS | | | | | | | | | | | | |
| (Cost $13,388,070) | | | | | | | 13,156,110 | | | | 1.51 | |
| | | | | | | | | | | | | |
| SHORT-TERM INVESTMENTS | | | | | | | | | | | | |
| State Street Institutional | | | | | | | | | | | | |
| Treasury Money Market Fund, | | | | | | | | | | | | |
| 0.004% | | | 344,308 | | | | 344,308 | | | | 0.04 | |
| | | | | | | | | | | | | |
| TOTAL SHORT-TERM INVESTMENTS | | | | | | | | | | | | |
| (Cost $344,308) | | | | | | | 344,308 | | | | 0.04 | |
| | | | | | | | | | | | | |
| TOTAL INVESTMENTS | | | | | | | | | | | | |
| (Cost $589,993,610) | | | | | | | 872,614,375 | | | | 100.08 | |
| | | | | | | | | | | | | |
| Liabilities, Less Cash and Other Assets | | | | | | | (685,855 | ) | | | (0.08 | ) |
| | | | | | | | | | | | | |
| NET ASSETS | | | | | | $ | 871,928,520 | | | | 100.00 | % |
See notes to financial statements.
INVESTMENT REVIEW BY CORY GILCHRIST (UNAUDITED)
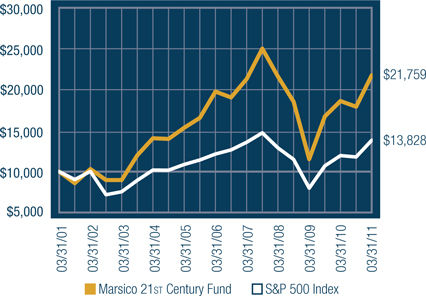
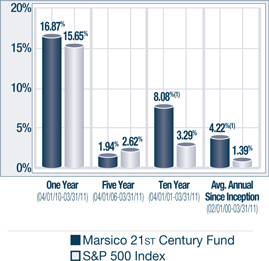
The Marsico 21st Century Fund posted a return of +21.41% for the six-month fiscal period ended March 31, 2011. The Fund substantially outpaced the S&P 500 Index, which we consider to be the Fund’s primary benchmark index and which had a total return of +17.31% over the same time period. For comparative purposes, the Russell 3000 Index, a proxy for the performance of all publicly-traded US equity securities including smaller capitalization companies (which may be a useful representation of the Fund’s ability to invest across the entire market capitalization spectrum), had a total return of +18.71%. Please see the Fund Overview for more detailed information about the Fund’s longer-term performance for various time periods ended March 31, 2011.
The performance data for the Fund quoted here represent past performance, and past performance is not a guarantee of future results. Investment return and principal value of an investment will fluctuate so that an investor’s shares, when redeemed, may be worth more or less than their original cost. Current performance may be lower or higher than the performance information quoted. To obtain performance information current to the most recent month-end, please call 888-860-8686 or visit www.marsicofunds.com.(1)
This review highlights Fund performance over a six-month fiscal period. Shareholders should keep in mind that the Fund is intended for long-term investors who hold their shares for substantially longer periods of time. You should also keep in mind that our views on all investments discussed in this report are subject to change at any time. References to specific securities, industries, and sectors discussed in this report are not recommendations to buy or sell such securities or related investments, and the Fund may not necessarily hold these securities or investments today. Please see the accompanying Schedule of Investments for the percentage of the Fund’s portfolio represented by the securities mentioned in this report as of the end of the reporting period.
Stocks and markets in which the Fund invests may experience periods of turbulence and instability, and the general risk that domestic and global economies and stock markets may go through periods of decline and cyclical change.
The Fund’s six-month performance was primarily aided by stock selection in particular sectors. Information Technology, Industrials, Materials and Consumer Discretionary positions contributed most significantly to the Fund’s performance relative to the S&P 500 Index.
Apple, Inc., maker of the iPhone and iPad, posted a return of +23%. As one of the Fund’s largest individual holdings, Apple had a significant positive effect on performance. Several software and services holdings also performed well. Data integration company Informatica Corporation, online restaurant reservations company OpenTable, Inc., and engineering software provider ANSYS, Inc. each posted returns of over +25%.
In Industrials, shares of Netherlands-based global industrial technology firm Sensata Technologies Holding N.V. soared +76%, while railroad services company CSX Corporation and industrial conglomerate Honeywell International, Inc. rose +43% and +37%, respectively. One of the Fund’s few Materials holdings, Monsanto Company, gained +52% due in part to improved global seeds and related seed-traits products.
Consumer Discretionary holdings also bolstered performance against the Index. An overweight in this strong-performing sector generated positive results, and stock selection also helped return. Resort operators Wynn Resorts Ltd. (+58%) and Vail Resorts, Inc. (+29%) had strong price appreciation during the period. Retailer Williams-Sonoma, Inc. (+29%) and The Walt Disney Company (+32%) were other leading holdings in the sector.
Finally, the Fund benefitted from having few investments in the Consumer Staples, Health Care and Utilities sectors, which were the weakest-performing sectors of the S&P 500 Index.
Energy was a significant area of weakness for the Fund. The Energy sector was the strongest performer within the S&P 500 Index during the time frame. The Fund had less exposure than the Index to Energy, which hurt results. In addition, the Fund’s position in Brazil-based oil and natural gas exploration company OGX Petróleo e Gás Participações S.A. slid -7%.
For some time, the Fund has held a significant percentage of its net assets in the Financials sector, with an emphasis on banking-related companies. The Fund’s positions in the Banks industry focus on what we believe to be the strongest companies with the best balance sheets, liquidity and capital levels. We believe these franchises are positioned to gain market share and grow earnings and dividends. During the six-month period, however, stock selection in the Banks industry detracted from results relative to the benchmark index. First Horizon National Corporation, a core holding of the Fund, eked out a return of just +0.1% and was a significant drag on performance. Regional bank First Midwest Bancorp, Inc. a smaller holding in the Fund, posted a double-digit decline prior to being sold.
Auto manufacturer General Motors Company slid -8% and was one of the largest individual detractors from performance during the period.
During the period, the Fund modestly increased its exposure to the Energy and Information Technology sectors while paring its exposure to the Financials sector. Also during the period, the Fund sold its sole Telecommunication Services holding.
Fiscal Period-End Investment Posture
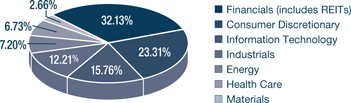
As of March 31, 2011, the Fund’s primary economic sector allocations were in the Financials, Consumer Discretionary, Information Technology, and Industrials sectors. As of period-end, the Fund had no investments in the Utilities, Telecommunication Services and Consumer Staples sectors.
Sincerely,
CORYDON J. GILCHRIST, CFA
PORTFOLIO MANAGER
| Total returns are based on net change in net asset value assuming reinvestment of distributions. For the period prior to March 31, 2004, the performance returns for the 21st Century Fund reflect a fee waiver in effect; in the absence of such a waiver, the returns would have been reduced. For the period beginning April 2004 through January 2005, performance returns for the 21st Century Fund would have been higher but for the reimbursement of fees waived previously. A redemption fee of 2% may be imposed on redemptions or exchanges of Fund shares owned for 30 days or less. Please see the Prospectus for more information. |
21st CENTURY FUND OVERVIEW |
March 31, 2011 (Unaudited)
The 21st Century Fund invests primarily in common stocks that are selected for their long-term growth potential. The Fund may invest in companies of any size, and will normally hold a core position of between 35 and 50 common stocks.
| TOTAL ANNUAL OPERATING EXPENSES* | 1.38% | NET ASSETS | $799,696,546 | NET ASSET VALUE PER SHARE | $15.03 |
| | |
GROWTH OF $10,000(1)(2) | PERFORMANCE COMPARISON |
| | |
| |
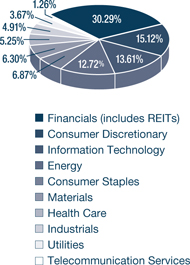
SECTOR ALLOCATION(3) | TOP FIVE HOLDINGS |
| | 5.33% |
| 5.20% |
| 5.14% |
THE PNC FINANCIAL SERVICES GROUP, INC. | 5.00% |
| 4.06% |
| * | The Total Annual Operating Expenses are reflective of the information disclosed in the Funds’ Prospectus dated February 1, 2011 and may differ from the expense ratio disclosed in this report. |
The performance data quoted here represent past performance, and past performance is not a guarantee of future results. Investment return and principal value of an investment will fluctuate so that an investor’s shares, when redeemed, may be worth more or less than their original cost. Current performance may be lower or higher than the performance information quoted. To obtain performance information current to the most recent month-end, please call 888-860-8686 or visit www.marsicofunds.com. A redemption fee may be imposed on redemptions or exchanges of Fund shares held for 30 days or less.
The performance included in the chart and graph does not reflect the deduction of taxes on Fund distributions or the redemption of Fund shares.
All indices are unmanaged and investors cannot invest directly in an index.
| The performance returns for the 21st Century Fund (for the period prior to March 31, 2004) reflect a fee waiver in effect; in the absence of such a waiver, the returns would be reduced. For the period beginning April 2004 through January 2005, performance returns for the 21st Century Fund would be higher but for the reimbursement of fees waived previously. |
| This chart assumes an initial investment of $10,000 made on March 31, 2001. Total returns are based on net change in NAV, assuming reinvestment of distributions. |
| Sector weightings represent the percentage of the Fund’s investments (excluding cash equivalents) in certain general sectors. These sectors may include more than one industry. The Fund’s portfolio composition is subject to change at any time. |
MARSICO 21st CENTURY FUND
SCHEDULE OF INVESTMENTS
March 31, 2011 (Unaudited)
| | | Number | | | | | | Percent | |
| | | of | | | | | | of Net | |
| | | Shares | | | Value | | | Assets | |
| COMMON STOCKS | | | | | | | | | |
| | | | | | | | | | |
| Aerospace & Defense | | | | | | | | | |
| Honeywell International, Inc. | | | 491,445 | | | $ | 29,344,181 | | | | 3.67 | % |
| Precision Castparts Corp. | | | 175,945 | | | | 25,895,585 | | | | 3.24 | |
| | | | | | | | 55,239,766 | | | | 6.91 | |
| Apparel Retail | | | | | | | | | | | | |
| rue21, inc.* | | | 224,992 | | | | 6,479,770 | | | | 0.81 | |
| | | | | | | | | | | | | |
| Application Software | | | | | | | | | | | | |
| ANSYS, Inc.* | | | 295,024 | | | | 15,987,351 | | | | 2.00 | |
| Informatica Corporation* | | | 383,720 | | | | 20,041,696 | | | | 2.51 | |
| salesforce.com, inc.* | | | 92,299 | | | | 12,329,300 | | | | 1.54 | |
| | | | | | | | 48,358,347 | | | | 6.05 | |
| Asset Management & Custody Banks | | | | | | | | | | | | |
| State Street Corporation | | | 440,737 | | | | 19,806,721 | | | | 2.48 | |
| | | | | | | | | | | | | |
| Automobile Manufacturers | | | | | | | | | | | | |
| General Motors Company* | | | 921,934 | | | | 28,607,612 | | | | 3.58 | |
| | | | | | | | | | | | | |
| Casinos & Gaming | | | | | | | | | | | | |
| Wynn Resorts Ltd. | | | 111,416 | | | | 14,177,686 | | | | 1.77 | |
| | | | | | | | | | | | | |
| Communications Equipment | | | | | | | | | | | | |
| Acme Packet, Inc.* | | | 114,693 | | | | 8,138,615 | | | | 1.02 | |
| | | | | | | | | | | | | |
| Computer Hardware | | | | | | | | | | | | |
| Apple, Inc.* | | | 69,310 | | | | 24,151,069 | | | | 3.02 | |
| | | | | | | | | | | | | |
| Diversified Banks | | | | | | | | | | | | |
| Wells Fargo & Company | | | 1,311,303 | | | | 41,568,305 | | | | 5.20 | |
| | | | | | | | | | | | | |
| Electrical Components & Equipment | | | | | | | | | | | | |
| Sensata Technologies Holding N.V.* | | | 600,669 | | | | 20,861,234 | | | | 2.61 | |
| | | | | | | | | | | | | |
| Fertilizers & Agricultural Chemicals | | | | | | | | | | | | |
| Monsanto Company | | | 276,399 | | | | 19,972,592 | | | | 2.50 | |
| | | | | | | | | | | | | |
| Health Care Equipment | | | | | | | | | | | | |
| Intuitive Surgical, Inc.* | | | 97,455 | | | | 32,497,344 | | | | 4.06 | |
| | | | | | | | | | | | | |
| Health Care Technology | | | | | | | | | | | | |
| Allscripts Healthcare Solutions, Inc.* | | | 748,160 | | | | 15,703,878 | | | | 1.96 | |
| | | | | | | | | | | | | |
| Homefurnishing Retail | | | | | | | | | | | | |
| Williams-Sonoma, Inc. | | | 1,014,830 | | | | 41,100,615 | | | | 5.14 | |
| | | | | | | | | | | | | |
| Internet Retail | | | | | | | | | | | | |
| Amazon.com, Inc.* | | | 94,274 | | | | 16,981,576 | | | | 2.12 | |
| | | | | | | | | | | | | |
| Internet Software & Services | | | | | | | | | | | | |
| OpenTable, Inc.* | | | 120,165 | | | | 12,779,548 | | | | 1.60 | |
| | | | | | | | | | | | | |
| Investment Banking & Brokerage | | | | | | | | | | | | |
| Jefferies Group, Inc. | | | 504,417 | | | | 12,580,160 | | | | 1.57 | |
| | | | | | | | | | | | | |
| Leisure Facilities | | | | | | | | | | | | |
| Vail Resorts, Inc.* | | | 214,122 | | | | 10,440,589 | | | | 1.31 | |
| | | | | | | | | | | | | |
| Life Sciences Tools & Services | | | | | | | | | | | | |
| Pacific Biosciences of California, Inc.* | | | 166,819 | | | | 2,343,807 | | | | 0.29 | |
| | | | | | | | | | | | | |
| Movies & Entertainment | | | | | | | | | | | | |
| The Walt Disney Company | | | 988,515 | | | | 42,595,111 | | | | 5.33 | |
| | | | | | | | | | | | | |
| Oil & Gas Exploration & Production | | | | | | | | | | | | |
| OGX Petróleo e Gás Participações S.A.* | | | 1,975,700 | | | | 23,778,829 | | | | 2.98 | |
| Ultra Petroleum Corp.* | | | 485,686 | | | | 23,920,035 | | | | 2.99 | |
| | | | | | | | 47,698,864 | | | | 5.97 | |
| Oil & Gas Refining & Marketing | | | | | | | | | | | | |
| Amyris, Inc.* | | | 135,508 | | | | 3,867,398 | | | | 0.48 | |
| Gevo, Inc.* | | | 129,305 | | | | 2,547,309 | | | | 0.32 | |
| | | | | | | | 6,414,707 | | | | 0.80 | |
| Railroads | | | | | | | | | | | | |
| CSX Corporation | | | 198,919 | | | | 15,635,033 | | | | 1.96 | |
| | | | | | | | | | | | | |
| Real Estate Operating Companies | | | | | | | | | | | | |
| BR Malls Participacoes S.A. | | | 818,312 | | | | 8,520,690 | | | | 1.07 | |
| | | | | | | | | | | | | |
| Real Estate Services | | | | | | | | | | | | |
| Jones Lang LaSalle, Inc. | | | 238,959 | | | | 23,833,771 | | | | 2.98 | |
| | | | | | | | | | | | | |
| Regional Banks | | | | | | | | | | | | |
| City National Corporation | | | 158,925 | | | | 9,066,671 | | | | 1.13 | |
| Columbia Banking System, Inc. | | | 311,911 | | | | 5,979,334 | | | | 0.75 | |
| First Horizon National Corporation | | | 2,430,158 | | | | 27,242,071 | | | | 3.41 | |
| Fulton Financial Corporation | | | 795,553 | | | | 8,838,594 | | | | 1.10 | |
| Glacier Bancorp, Inc. | | | 398,029 | | | | 5,990,337 | | | | 0.75 | |
| Park Sterling Bank, Inc.* | | | 419,993 | | | | 2,036,966 | | | | 0.25 | |
| The PNC Financial Services Group, Inc. | | | 634,380 | | | | 39,959,596 | | | | 5.00 | |
| | | | | | | | 99,113,569 | | | | 12.39 | |
| Restaurants | | | | | | | | | | | | |
| Chipotle Mexican Grill, Inc.* | | | 13,422 | | | | 3,655,750 | | | | 0.46 | |
| Wendy’s/Arby’s Group, Inc. - Cl. A | | | 2,220,464 | | | | 11,168,934 | | | | 1.39 | |
| | | | | | | | 14,824,684 | | | | 1.85 | |
| Retail REITs | | | | | | | | | | | | |
| Colony Financial, Inc. | | | 247,497 | | | | 4,660,368 | | | | 0.58 | |
| | | | | | | | | | | | | |
| Systems Software | | | | | | | | | | | | |
| Oracle Corporation | | | 748,743 | | | | 24,985,554 | | | | 3.12 | |
| | | | | | | | | | | | | |
| Thrifts & Mortgage Finance | | | | | | | | | | | | |
| First Niagara Financial Group, Inc. | | | 2,309,800 | | | | 31,367,084 | | | | 3.92 | |
| | | | | | | | | | | | | |
| TOTAL COMMON STOCKS | | | | | | | | | | | | |
| (Cost $563,805,027) | | | | | | | 751,438,669 | | | | 93.97 | |
| | | | | | | | | | | | | |
| SHORT-TERM INVESTMENTS | | | | | | | | | | | | |
| State Street Institutional Treasury | | | | | | | | | | | | |
| Money Market Fund, 0.004% | | | 52,248,758 | | | | 52,248,758 | | | | 6.53 | |
| | | | | | | | | | | | | |
| TOTAL SHORT-TERM INVESTMENTS | | | | | | | | | | | | |
| (Cost $52,248,758) | | | | | | | 52,248,758 | | | | 6.53 | |
| | | | | | | | | | | | | |
| TOTAL INVESTMENTS | | | | | | | | | | | | |
| (Cost $616,053,785) | | | | | | | 803,687,427 | | | | 100.50 | |
| | | | | | | | | | | | | |
| Liabilities, Less Cash and Other Assets | | | | | | | (3,990,881 | ) | | | (0.50 | ) |
| | | | | | | | | | | | | |
| NET ASSETS | | | | | | $ | 799,696,546 | | | | 100.00 | % |
See notes to financial statements.
| INTERNATIONAL OPPORTUNITIES FUND |
INVESTMENT REVIEW BY JIM GENDELMAN AND MUNISH MALHOTRA (UNAUDITED)
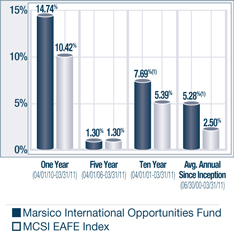
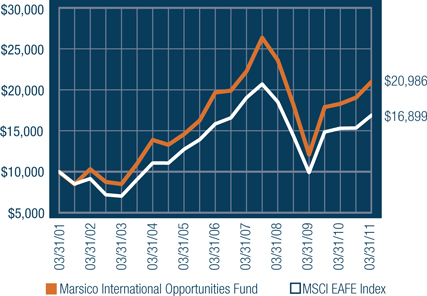
The Marsico International Opportunities Fund posted a total return of (US$) +10.18% for the six-month fiscal period ended March 31, 2011. The Fund’s return was in-line with the MSCI EAFE Index, which we consider to be the Fund’s primary benchmark index and which had a total return of (US$) +10.20%. Please see the Fund Overview for more detailed information about the Fund’s longer-term performance for various time periods ended March 31, 2011.
The performance data for the Fund quoted here represent past performance, and past performance is not a guarantee of future results. Investment return and principal value of an investment will fluctuate so that an investor’s shares, when redeemed, may be worth more or less than their original cost. Current performance may be lower or higher than the performance information quoted. To obtain performance information current to the most recent month-end, please call 888-860-8686 or visit www.marsicofunds.com.(1)
This review highlights Fund performance over a six-month fiscal period. Shareholders should keep in mind that the Fund is intended for long-term investors who hold their shares for substantially longer periods of time. You should also keep in mind that our views on all investments discussed in this report are subject to change at any time. References to specific securities, industries, and sectors discussed in this report are not recommendations to buy or sell such securities or related investments, and the Fund may not necessarily hold these securities or investments today. Please see the accompanying Schedule of Investments for the percentage of the Fund’s portfolio represented by the securities mentioned in this report as of the end of the reporting period.
Foreign investments present additional risks due to currency fluctuations, economic and political factors, lower liquidity, differences in securities regulations and accounting standards, possible changes in taxation, limited public information and other factors.
Stock selection in the Industrials, Information Technology and Materials sectors contributed positively to the Fund’s performance. Strong Industrials performers included Japanese construction equipment company Komatsu Ltd. (+48%), French electrical distribution and equipment firm Schneider Electric S.A. (+35%) and Netherlands-based global industrial technology firm Sensata Technologies Holding N.V. (+43%). Several of the Fund’s Chinese Internet technology companies posted sizeable gains, including SINA Corporation (+55%) and Baidu, Inc. Spon. ADR (+35%). United Kingdom-based semiconductor company ARM Holdings PLC soared +53%. Materials positions were led by German chemical company BASF S.E. (+38%) and German integrated materials and technology group ThyssenKrupp AG (+27%).
The Utilities sector was the weakest-performing sector of the MSCI EAFE Index and the Fund benefitted by abstaining from investments in the sector. Additionally, the Fund’s performance was aided by a specific holding in the Health Care sector. Novo Nordisk A/S - Cl. B, based in Denmark, posted a return of +28%. The company recorded solid results from robust sales of its diabetes treatment products.
There were several areas of weakness during the period. Stock selection in the Energy sector was disappointing. OGX Petróleo e Gás Participações S.A., the Fund’s largest individual holding as of period-end, declined -7%. The Fund continued to maintain its position in OGX due to its impressive oil and natural gas reserves off the coast of Brazil. First production is scheduled to begin later in 2011, which may be an important catalyst for the stock.
Several of the Fund’s Financials positions struggled. Japanese real estate position Sumitomo Realty & Development Co., Ltd. and Singapore real estate company CapitaLand Ltd. skidded -17% and -12%, respectively. The Fund sold its position in CapitaLand during the period. Also during the period, the Fund initiated an investment in Citigroup, Inc. (-8%) due to the company’s growing presence in emerging markets and its efforts to capture market share with affluent consumers.
Individual holdings having a material adverse impact on performance included Hong Kong-based manufacturer, exporter and distributor of retail goods Li & Fung Ltd. (-9%), and United Kingdom-headquartered enterprise technology company Autonomy Corporation PLC (-20% prior to being sold).
| INTERNATIONAL OPPORTUNITIES FUND |
Active currency management is not a central facet of the Fund’s investment process, but fluctuations in major world currencies can affect performance. During this six-month period, US-based investors in international equities benefitted from a currency lift overall as the US dollar weakened as compared to certain foreign currencies including the euro and the Australian dollar, effectively increasing returns from foreign securities as expressed in US dollars. On a narrower dimension, the Fund had no exposure to companies that trade in the Australian dollar, which appreciated substantially compared to the US dollar and many other major world currencies. This positioning detracted from the Fund’s returns relative to its benchmark index, as the MSCI EAFE Index had more than a 9% allocation to Australian equities during the period.
The International Opportunities Fund has tended to have a relatively high portfolio turnover level because of its investment style. Although the Fund may hold core positions for some time, it may change its portfolio composition quickly to take advantage of new opportunities, or to address issues affecting particular holdings.
Fiscal Period-End Investment Posture
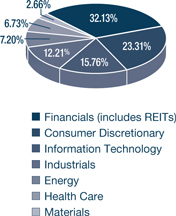
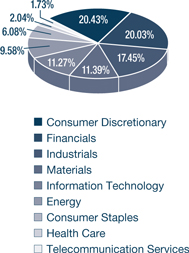
As of March 31, 2011, the Fund’s primary economic sector allocations included Consumer Discretionary, Financials, Industrials, Materials, and Information Technology. The Fund had no exposure to the Utilities sector.
In terms of country allocations, the Fund’s most significant weightings at period-end were Japan, the United Kingdom, China/Hong Kong, Germany, France and Brazil, although exposure to the United Kingdom and Japan represented underweighted postures relative to the benchmark index. With respect to Japan, the Fund increased its allocation to Japanese stocks in the aftermath of the earthquake, based on our view that the nuclear crisis would be contained and that the market was over-reacting to the potential negative impact the earthquake and nuclear problem would have on economic activity levels in Japan. Most of the Fund’s purchase activity was associated with adding to existing holdings, consisting predominantly of Industrials (including capital goods) and Consumer Discretionary (primarily retailing and auto manufacturing) companies.
The Fund held several positions domiciled in emerging markets including Brazil, China, India and Argentina. Such emerging markets exposure represented approximately 16% of the Fund’s net assets as of March 31, 2011. Country-level weightings generally should be considered a residual of the Fund’s stock selection process rather than a major, proactive facet of its investment strategy.
In closing, we are pleased to note that, as previously communicated to shareholders in 2010, Munish Malhotra was promoted to serve as co-portfolio manager for the International Opportunities Fund effective November 1, 2010. Munish has over 10 years of experience as a securities analyst. Prior to joining Marsico Capital in 2003, he served as an international equities analyst at Driehaus Capital Management in Chicago. Munish was awarded the designation of Chartered Financial Analyst (“CFA”) in 2006. He holds a Bachelor’s degree in Economics from Loyola University of Chicago.
Sincerely,
JAMES G. GENDELMAN
MUNISH MALHOTRA
PORTFOLIO MANAGERS
| (1) | Total returns are based on net change in net asset value assuming reinvestment of distributions. For the period prior to September 30, 2004, the performance returns for the International Opportunities Fund reflect a fee waiver in effect; in the absence of such a waiver, the returns would have been reduced. For the period beginning October 2004 through December 2005, performance returns for the International Opportunities Fund would have been higher but for the reimbursement of fees waived previously. A redemption fee of 2% may be imposed on redemptions or exchanges of Fund shares owned for 30 days or less. Please see the Prospectus for more information. |
| INTERNATIONAL OPPORTUNITIES FUND OVERVIEW |
March 31, 2011 (Unaudited)
The International Opportunities Fund invests primarily in common stocks of foreign companies that are selected for their long-term growth potential. The Fund may invest in companies of any size throughout the world. It normally invests in the securities of issuers that are economically tied to one or more foreign countries, and expects to be invested in various issuers or securities that together have ties to at least four different foreign countries. Some issuers or securities in the Fund’s portfolio may be based in or economically tied to the United States. The Fund may hold an unlimited number of common stocks.
| TOTAL ANNUAL OPERATING EXPENSES* | 1.54% | NET ASSETS | $238,360,845 | NET ASSET VALUE PER SHARE | $13.59 |
| | |
GROWTH OF $10,000(1)(2) | PERFORMANCE COMPARISON |
| | |
| |
SECTOR ALLOCATION(3) | | TOP FIVE HOLDINGS |
| | | |
| | OGX PETRÓLEO E GÁS PARTICIPAÇÕES S.A. | 5.02% |
| | BASF S.E. | 3.39% |
| | LI & FUNG LTD. | 3.20% |
| | SWATCH GROUP AG | 3.14% |
| | SCHNEIDER ELECTRIC S.A. | 2.78% |
| * | The Total Annual Operating Expenses are reflective of the information disclosed in the Funds’ Prospectus dated February 1, 2011 and may differ from the expense ratio disclosed in this report. |
The performance data quoted here represent past performance, and past performance is not a guarantee of future results. Investment return and principal value of an investment will fluctuate so that an investor’s shares, when redeemed, may be worth more or less than their original cost. Current performance may be lower or higher than the performance information quoted. To obtain performance information current to the most recent month-end, please call 888-860-8686 or visit www.marsicofunds.com. A redemption fee may be imposed on redemptions or exchanges of Fund shares held for 30 days or less.
The performance included in the chart and graph does not reflect the deduction of taxes on Fund distributions or the redemption of Fund shares.
All indices are unmanaged and investors cannot invest directly in an index.
| The performance returns for the International Opportunities Fund (for the period prior to September 30, 2004) reflect a fee waiver in effect; in the absence of such a waiver, the returns would be reduced. For the period beginning October 2004 through December 2005, performance returns for the International Opportunities Fund would be higher but for the reimbursement of fees waived previously. |
| This chart assumes an initial investment of $10,000 made on March 31, 2001. Total returns are based on net change in NAV, assuming reinvestment of distributions. |
| Sector weightings represent the percentage of the Fund’s investments (excluding cash equivalents) in certain general sectors. These sectors may include more than one industry. The Fund’s portfolio composition is subject to change at any time. |
The MSCI EAFE Index tracks the stocks of about 1,000 companies in Europe, Australasia, and the Far East (EAFE).
MARSICO INTERNATIONAL OPPORTUNITIES FUND
SCHEDULE OF INVESTMENTS
March 31, 2011 (Unaudited)
| | | Number | | | | | | Percent | |
| | | of | | | | | | of Net | |
| | | Shares | | | Value | | | Assets | |
| COMMON STOCKS | | | | | | | | | |
| | | | | | | | | | |
| Advertising | | | | | | | | | |
| Publicis Groupe S.A. | | | 64,090 | | | $ | 3,594,530 | | | | 1.51 | % |
| | | | | | | | | | | | | |
| Aerospace & Defense | | | | | | | | | | | | |
| Rolls-Royce Group PLC* | | | 268,481 | | | | 2,666,014 | | | | 1.12 | |
| | | | | | | | | | | | | |
| Apparel Retail | | | | | | | | | | | | |
| Industria de Diseno Textile S.A. (Inditex) | | | 76,993 | | | | 6,178,059 | | | | 2.59 | |
| | | | | | | | | | | | | |
| Apparel, Accessories & Luxury Goods | | | | | | | | | | | | |
| Adidas A.G. | | | 37,923 | | | | 2,389,210 | | | | 1.00 | |
| Pandora A/S* | | | 47,028 | | | | 2,400,026 | | | | 1.01 | |
| Swatch Group AG | | | 16,951 | | | | 7,494,612 | | | | 3.14 | |
| | | | | | | | 12,283,848 | | | | 5.15 | |
| Asset Management & Custody Banks | | | | | | | | | | | | |
| Julius Baer Group Ltd. | | | 81,087 | | | | 3,518,920 | | | | 1.48 | |
| | | | | | | | | | | | | |
| Automobile Manufacturers | | | | | | | | | | | | |
| Honda Motor Co., Ltd. | | | 161,000 | | | | 6,048,630 | | | | 2.54 | |
| | | | | | | | | | | | | |
| Brewers | | | | | | | | | | | | |
| Anheuser-Busch InBev N.V. | | | 42,460 | | | | 2,418,706 | | | | 1.02 | |
| | | | | | | | | | | | | |
| Building Products | | | | | | | | | | | | |
| Daikin Industries, Ltd. | | | 43,973 | | | | 1,316,864 | | | | 0.55 | |
| | | | | | | | | | | | | |
| Computer & Electronics Retail | | | | | | | | | | | | |
| Yamada-Denki Co., Ltd. | | | 43,500 | | | | 2,933,818 | | | | 1.23 | |
| | | | | | | | | | | | | |
| Computer Hardware | | | | | | | | | | | | |
| TOSHIBA Corporation | | | 715,000 | | | | 3,498,497 | | | | 1.47 | |
| | | | | | | | | | | | | |
| Construction & Farm | | | | | | | | | | | | |
| Machinery & Heavy Trucks | | | | | | | | | | | | |
| Komatsu Ltd. | | | 176,300 | | | | 5,987,587 | | | | 2.51 | |
| | | | | | | | | | | | | |
| Distillers & Vintners | | | | | | | | | | | | |
| Pernod-Ricard S.A. | | | 26,698 | | | | 2,493,418 | | | | 1.05 | |
| | | | | | | | | | | | | |
| Distributors | | | | | | | | | | | | |
| Li & Fung Ltd. | | | 1,492,000 | | | | 7,634,019 | | | | 3.20 | |
| | | | | | | | | | | | | |
| Diversified Banks | | | | | | | | | | | | |
| Banco Bilbao Vizcaya Argentaria S.A. | | | 207,037 | | | | 2,511,906 | | | | 1.05 | |
| Barclays PLC | | | 1,330,173 | | | | 5,922,535 | | | | 2.49 | |
| BNP Paribas | | | 45,806 | | | | 3,350,327 | | | | 1.41 | |
| ICICI Bank Ltd. Spon. ADR | | | 110,601 | | | | 5,511,248 | | | | 2.31 | |
| Standard Chartered PLC | | | 156,269 | | | | 4,053,602 | | | | 1.70 | |
| | | | | | | | 21,349,618 | | | | 8.96 | |
| Diversified Chemicals | | | | | | | | | | | | |
| BASF S.E. | | | 93,519 | | | | 8,088,616 | | | | 3.39 | |
| | | | | | | | | | | | | |
| Diversified Metals & Mining | | | | | | | | | | | | |
| Teck Resources Ltd. - CI. B | | | 50,825 | | | | 2,694,066 | | | | 1.13 | |
| Xstrata PLC | | | 156,200 | | | | 3,650,891 | | | | 1.53 | |
| | | | | | | | 6,344,957 | | | | 2.66 | |
| Diversified Real Estate Activities | | | | | | | | | | | | |
| Hang Lung Properties Ltd. | | | 799,000 | | | | 3,487,289 | | | | 1.47 | |
| Sumitomo Realty & Development Co., Ltd. | | | 185,000 | | | | 3,700,889 | | | | 1.55 | |
| | | | | | | | 7,188,178 | | | | 3.02 | |
| Electrical Components & Equipment | | | | | | | | | | | | |
| Schneider Electric S.A. | | | 38,841 | | | | 6,638,481 | | | | 2.78 | |
| Sensata Technologies Holding N.V.* | | | 119,081 | | | | 4,135,683 | | | | 1.74 | |
| | | | | | | | 10,774,164 | | | | 4.52 | |
| Food Retail | | | | | | | | | | | | |
| FamilyMart Co., Ltd. | | | 82,100 | | | | 3,084,425 | | | | 1.29 | |
| Tesco PLC | | | 573,042 | | | | 3,502,432 | | | | 1.47 | |
| | | | | | | | 6,586,857 | | | | 2.76 | |
| Hotels, Resorts & Cruise Lines | | | | | | | | | | | | |
| Accor S.A. | | | 79,779 | | | | 3,584,655 | | | | 1.50 | |
| | | | | | | | | | | | | |
| Industrial Conglomerates | | | | | | | | | | | | |
| Siemens A.G. | | | 36,206 | | | | 4,962,299 | | | | 2.08 | |
| | | | | | | | | | | | | |
| Industrial Machinery | | | | | | | | | | | | |
| FANUC Corporation | | | 24,700 | | | | 3,738,555 | | | | 1.57 | |
| | | | | | | | | | | | | |
| Internet Retail | | | | | | | | | | | | |
| DeNA Co., Ltd. | | | 87,000 | | | | 3,143,003 | | | | 1.32 | |
| | | | | | | | | | | | | |
| Internet Software & Services | | | | | | | | | | | | |
| Baidu, Inc. Spon. ADR* | | | 18,872 | | | | 2,600,750 | | | | 1.09 | |
| MercadoLibre, Inc. | | | 40,482 | | | | 3,304,546 | | | | 1.39 | |
| SINA Corporation* | | | 23,295 | | | | 2,493,497 | | | | 1.05 | |
| Youku.com, Inc. Spon. ADR* | | | 31,233 | | | | 1,483,880 | | | | 0.62 | |
| | | | | | | | 9,882,673 | | | | 4.15 | |
| Multi-Sector Holdings | | | | | | | | | | | | |
| Criteria CaixaCorp S.A. | | | 340,815 | | | | 2,403,905 | | | | 1.01 | |
| | | | | | | | | | | | | |
| Office Electronics | | | | | | | | | | | | |
| Canon, Inc. | | | 82,700 | | | | 3,599,110 | | | | 1.51 | |
| | | | | | | | | | | | | |
| Oil & Gas Exploration & Production | | | | | | | | | | | | |
| CNOOC Ltd. | | | 1,110,800 | | | | 2,804,650 | | | | 1.18 | |
| OGX Petróleo e Gás Participações S.A.* | | | 994,700 | | | | 11,971,859 | | | | 5.02 | |
| Pacific Rubiales Energy Corp. | | | 131,287 | | | | 3,642,723 | | | | 1.53 | |
| Tullow Oil PLC | | | 158,238 | | | | 3,675,680 | | | | 1.54 | |
| | | | | | | | 22,094,912 | | | | 9.27 | |
| Other Diversified Financial Services | | | | | | | | | | | | |
| Citigroup, Inc.* | | | 1,381,222 | | | | 6,105,001 | | | | 2.56 | |
| | | | | | | | | | | | | |
| Packaged Foods & Meats | | | | | | | | | | | | |
| Nestlé S.A. | | | 43,867 | | | | 2,514,532 | | | | 1.06 | |
| | | | | | | | | | | | | |
| Pharmaceuticals | | | | | | | | | | | | |
| Novo Nordisk A/S - CI. B | | | 37,519 | | | | 4,713,765 | | | | 1.98 | |
| | | | | | | | | | | | | |
| Railroads | | | | | | | | | | | | |
| Canadian National Railway Company | | | 81,113 | | | | 6,105,376 | | | | 2.56 | |
| | | | | | | | | | | | | |
| Real Estate Operating Companies | | | | | | | | | | | | |
| BR Malls Participacoes S.A. | | | 517,700 | | | | 5,390,561 | | | | 2.26 | |
| | | | | | | | | | | | | |
| Semiconductor Equipment | | | | | | | | | | | | |
| ASML Holding N.V.* | | | 141,185 | | | | 6,222,715 | | | | 2.61 | |
| | | | | | | | | | | | | |
| Semiconductors | | | | | | | | | | | | |
| ARM Holdings PLC | | | 302,292 | | | | 2,788,385 | | | | 1.17 | |
| | | | | | | | | | | | | |
| Specialized Finance | | | | | | | | | | | | |
| Hong Kong Exchanges and Clearing Ltd. | | | 11,500 | | | | 249,410 | | | | 0.10 | |
| | | | | | | | | | | | | |
| Specialty Chemicals | | | | | | | | | | | | |
| LyondellBasell Industries N.V. - CI. A* | | | 115,620 | | | | 4,572,771 | | | | 1.92 | |
| Novozymes A/S - CI. B | | | 15,710 | | | | 2,405,232 | | | | 1.01 | |
| | | | | | | | 6,978,003 | | | | 2.93 | |
See notes to financial statements.
MARSICO INTERNATIONAL OPPORTUNITIES FUND
SCHEDULE OF INVESTMENTS (continued)
March 31, 2011 (Unaudited)
| | | Number | | | | | | Percent | |
| | | of | | | | | | of Net | |
| | | Shares/Units | | | Value | | | Assets | |
COMMON STOCKS (continued) | | | | | | | | | |
| | | | | | | | | | |
| Steel | | | | | | | | | |
| ThyssenKrupp AG | | | 119,086 | | | $ | 4,865,599 | | | | 2.04 | % |
| | | | | | | | | | | | | |
| Trading Companies & Distributors | | | | | | | | | | | | |
| Marubeni Corporation | | | 653,000 | | | | 4,702,416 | | | | 1.97 | |
| | | | | | | | | | | | | |
| Wireless Telecommunication Services | | | | | | | | | | | | |
| Millicom International Cellular S.A. | | | 41,383 | | | | 3,979,803 | | | | 1.67 | |
| | | | | | | | | | | | | |
| TOTAL COMMON STOCKS | | | | | | | | | | | | |
| (Cost $172,764,531) | | | | | | | 228,929,978 | | | | 96.05 | |
| | | | | | | | | | | | | |
| UNITS | | | | | | | | | | | | |
| | | | | | | | | | | | | |
| Education Services | | | | | | | | | | | | |
| Anhanguera Educacional | | | | | | | | | | | | |
| Participacoes S.A. | | | 70,300 | | | | 1,721,492 | | | | 0.72 | |
| | | | | | | | | | | | | |
| TOTAL UNITS | | | | | | | | | | | | |
| (Cost $1,243,416) | | | | | | | 1,721,492 | | | | 0.72 | |
| | | | | | | | | | | | | |
| SHORT-TERM INVESTMENTS | | | | | | | | | | | | |
| State Street Institutional | | | | | | | | | | | | |
| Treasury Money Market | | | | | | | | | | | | |
| Fund, 0.004% | | | 5,516,943 | | | | 5,516,943 | | | | 2.31 | |
| | | | | | | | | | | | | |
| TOTAL SHORT-TERM INVESTMENTS | | | | | | | | | | | | |
| (Cost $5,516,943) | | | | | | | 5,516,943 | | | | 2.31 | |
| | | | | | | | | | | | | |
| TOTAL INVESTMENTS | | | | | | | | | | | | |
| (Cost $179,524,890) | | | | | | | 236,168,413 | | | | 99.08 | |
| | | | | | | | | | | | | |
| Cash and Other Assets, Less Liabilities | | | | | | | 2,192,432 | | | | 0.92 | |
| | | | | | | | | | | | | |
| NET ASSETS | | | | | | $ | 238,360,845 | | | | 100.00 | % |
SUMMARY OF INVESTMENTS BY COUNTRY
| | | | | | Percent of | |
| | | | | | Investment | |
| Country | | Market Value | | | Securities | |
| Argentina | | $ | 3,304,546 | | | | 1.40 | % |
| Belgium | | | 2,418,706 | | | | 1.02 | |
| Brazil | | | 19,083,912 | | | | 8.08 | |
| Canada | | | 12,442,165 | | | | 5.27 | |
| China/Hong Kong | | | 20,753,495 | | | | 8.79 | |
| Denmark | | | 9,519,023 | | | | 4.03 | |
| France | | | 19,661,411 | | | | 8.33 | |
| Germany | | | 20,305,724 | | | | 8.60 | |
| India | | | 5,511,248 | | | | 2.33 | |
| Japan | | | 41,753,794 | | | | 17.68 | |
| Luxembourg | | | 3,979,803 | | | | 1.69 | |
| Netherlands | | | 14,931,169 | | | | 6.32 | |
| Spain | | | 11,093,870 | | | | 4.70 | |
| Switzerland | | | 17,178,955 | | | | 7.27 | |
| United Kingdom | | | 22,608,648 | | | | 9.57 | |
United States(1) | | | 11,621,944 | | | | 4.92 | |
| | | $ | 236,168,413 | | | | 100.00 | % |
| (1) | Includes short-term securities. |
See notes to financial statements.
INVESTMENT REVIEW BY DOUG RAO (UNAUDITED)
The Marsico Flexible Capital Fund posted a total return of +21.32% for the six-month fiscal period ended March 31, 2011. That result significantly surpassed the S&P 500 Index, which we consider to be the Fund’s primary benchmark index and which had a total return of +17.31%. Please see the Fund Overview for more detailed information about the Fund’s performance for various time periods ended March 31, 2011.
The performance data for the Fund quoted here represent past performance, and past performance is not a guarantee of future results. Investment return and principal value of an investment will fluctuate so that an investor’s shares, when redeemed, may be worth more or less than their original cost. Current performance may be lower or higher than the performance information quoted. To obtain performance information current to the most recent month-end, please call 888-860-8686 or visit www.marsicofunds.com.(1)
This review highlights Fund performance over a six-month fiscal period. Shareholders should keep in mind that the Fund is intended for long-term investors who hold their shares for substantially longer periods of time. You should also keep in mind that our views on all investments discussed in this report are subject to change at any time. References to specific securities, industries, and sectors discussed in this report are not recommendations to buy or sell such securities or related investments, and the Fund may not necessarily hold these securities or investments today. Please see the accompanying Schedule of Investments for the percentage of the Fund’s portfolio represented by the securities mentioned in this report as of the end of the reporting period.
Stocks and markets in which the Fund invests may experience periods of turbulence and instability, and the general risk that domestic and global economies and stock markets may go through periods of decline and cyclical change.
The Fund’s performance during the six-month fiscal period ended March 31, 2011 benefitted primarily from strong stock selection in the Information Technology, Industrials, Health Care and Materials sectors.
The Fund’s Information Technology holdings posted a collective return of +64%, while the S&P 500 Index Information Technology sector returned +14%. Three of the Fund’s China-based software and services holdings had a positive impact on the Fund’s performance. Online video hosting service company Youku.com, Inc. Spon. ADR (purchased by the Fund at its initial public offering) soared +237%. Internet service company ChinaCache International Holdings Ltd. ADR and online search company Baidu, Inc. Spon. ADR gained +94% and +33%, respectively. The Fund sold ChinaCache during the period.
Industrials positions were led by Netherlands-based global industrial technology firm Sensata Technologies Holding N.V. (+80%) and power management company Eaton Corporation (+21% prior to being sold).
Additional areas of strength for the Fund included stock selection in the Health Care and Materials sectors. Odontoprev S.A., Brazil’s largest provider of dental-care plans, posted a return of +43%. Materials positions were led by agricultural materials company Monsanto Company (+52%) and Freeport-McMoRan Copper & Gold, Inc. (+32%).
The Fund also was helped by having a limited number of investments in the Consumer Staples, Health Care and Utilities sectors, as these were the weakest-performing sectors of the benchmark index.
There were a few areas of weakness for the Fund. The Fund’s cash position was elevated during portions of the reporting period. Cash and cash equivalents averaged nearly 10% of the Fund’s net assets during the six-month period. The Fund’s elevated cash had a dampening effect on performance results during a time of generally stronger US equity returns. The Fund’s cash, including pending purchases and sales, was reduced to approximately 6.6% of the Fund’s net assets as of March 31, 2011.
Throughout the period, the Fund had a significant portion of its net assets invested in the Financials sector as compared to the S&P 500 Index. This positioning hurt Fund performance because the Financials sector underperformed the overall return of the benchmark index. Stock selection also detracted from relative results. The Fund’s Financials holdings posted a collective return of +9% and trailed the S&P 500 Index Financials sector return of +15%. Bank position First Horizon National Corporation (-10%) and Hong Kong-listed property developer Hang Lung Properties Ltd. (-17%) each posted double-digit negative returns prior to being sold from the Fund.
Energy was another area of weakness. The Energy sector was the strongest performer within the S&P 500 Index during the time frame. The Fund had less exposure than the Index to Energy, which hurt results. In addition, the Fund’s position in Brazil-based oil and natural gas exploration company OGX Petróleo e Gás Participações S.A. declined -9%.
Certain individual holdings posted disappointing returns and had a material, negative impact on performance results. Li & Fung Ltd., a Hong Kong-headquartered manufacturer, exporter, and distributor of retail goods declined -11%. Indian online travel agency MakeMyTrip Ltd. skidded -37% and was sold.
During the period, the Fund increased its allocations to the Information Technology, Industrials, and Financials sectors. Exposure to the Consumer Discretionary, Health Care, and Telecommunication Services sectors was reduced.
The Flexible Capital Fund has tended to have a relatively high portfolio turnover level. This is attributable, in part, to the Fund’s investment style. Although the Fund may hold core positions for some time, it may change its portfolio composition quickly to take advantage of new opportunities, preserve capital or to address issues affecting particular holdings.
Fiscal Period-End Investment Posture
As of March 31, 2011, the Fund’s primary economic sector allocations included Financials, Consumer Discretionary, Information Technology, and Industrials. At period-end, the Fund had no exposure to the Utilities and Telecommunication Services sectors.
Sincerely,
A. DOUGLAS RAO
PORTFOLIO MANAGER
| (1) | Total returns are based on net change in net asset value assuming reinvestment of distributions. For the period prior to February 1, 2011, the performance returns for the Flexible Capital Fund reflect a fee waiver in effect; in the absence of such a waiver, the returns would have been reduced. A redemption fee of 2% may be imposed on redemptions or exchanges of Fund shares owned for 30 days or less. Please see the Prospectus for more information. |
| FLEXIBLE CAPITAL FUND OVERVIEW |
March 31, 2011 (Unaudited)
The Flexible Capital Fund invests primarily in equity securities and other investments that are selected primarily for their long-term growth potential. The Fund may invest in issuers of any size throughout the world, and will normally hold a core position of between 20 and 50 securities or other investments.
| TOTAL ANNUAL OPERATING EXPENSES* | 1.49% | NET ASSETS | $627,639,540 | NET ASSET VALUE PER SHARE | $14.39 |
GROWTH OF $10,000(1)(2) | PERFORMANCE COMPARISON |
| | |
| |
| | |
SECTOR ALLOCATION(3) | TOP FIVE HOLDINGS |
| | | |
| SENSATA TECHNOLOGIES HOLDING N.V. | 6.28% |
| TARGA RESOURCES CORPORATION | 3.60% |
| LI & FUNG LTD. | 3.35% |
| THE TJX COMPANIES, INC. | 3.20% |
| ORACLE CORPORATION | 3.18% |
| | | |
| * | The Total Annual Operating Expenses are reflective of the information disclosed in the Funds’ Prospectus dated February 1, 2011 and may differ from the expense ratio disclosed in this report. |
The performance data quoted here represent past performance, and past performance is not a guarantee of future results. Investment return and principal value of an investment will fluctuate so that an investor’s shares, when redeemed, may be worth more or less than their original cost. Current performance may be lower or higher than the performance information quoted. To obtain performance information current to the most recent month-end, please call 888-860-8686 or visit www.marsicofunds.com. A redemption fee may be imposed on redemptions or exchanges of Fund shares owned for 30 days or less.
The performance included in the chart and graph does not reflect the deduction of taxes on Fund distributions or the redemption of Fund shares.
All indices are unmanaged and investors cannot invest directly in an index.
| (1) | The performance returns for the Flexible Capital Fund (for the period prior to February 1, 2011) reflect a fee waiver in effect; in the absence of such a waiver, the returns would be reduced. |
| (2) | This chart assumes an initial investment of $10,000 made on December 29, 2006 (inception). Total returns are based on change in NAV, assuming reinvestment of distributions. |
| (3) | Sector weightings represent the percentage of the Fund’s investments (excluding cash equivalents) in certain general sectors. These sectors may include more than one industry. The Fund’s portfolio composition is subject to change at any time. |
MARSICO FLEXIBLE CAPITAL FUND
SCHEDULE OF INVESTMENTS
March 31, 2011 (Unaudited)
| | | Number | | | | | | Percent | |
| | | of | | | | | | of Net | |
| | | Shares | | | Value | | | Assets | |
| COMMON STOCKS | | | | | | | | | |
| | | | | | | | | | |
| Apparel Retail | | | | | | | | | |
| The TJX Companies, Inc. | | | 403,467 | | | $ | 20,064,414 | | | | 3.20 | % |
| | | | | | | | | | | | | |
| Auto Parts & Equipment | | | | | | | | | | | | |
| BorgWarner, Inc.* | | | 157,953 | | | | 12,587,274 | | | | 2.01 | |
| | | | | | | | | | | | | |
| Automotive Retail | | | | | | | | | | | | |
| AutoZone, Inc.* | | | 21,880 | | | | 5,985,493 | | | | 0.95 | |
| | | | | | | | | | | | | |
| Broadcasting | | | | | | | | | | | | |
| Discovery Communications, Inc. - Cl. A* | | | 474,733 | | | | 18,941,847 | | | | 3.02 | |
| | | | | | | | | | | | | |
| Communications Equipment | | | | | | | | | | | | |
| Acme Packet, Inc.* | | | 158,567 | | | | 11,251,914 | | | | 1.79 | |
| | | | | | | | | | | | | |
| Computer Hardware | | | | | | | | | | | | |
| Apple, Inc.* | | | 44,249 | | | | 15,418,564 | | | | 2.45 | |
| TOSHIBA Corporation | | | 3,487,000 | | | | 17,061,902 | | | | 2.72 | |
| | | | | | | | 32,480,466 | | | | 5.17 | |
| Construction & Farm | | | | | | | | | | | | |
| Machinery & Heavy Trucks | | | | | | | | | | | | |
| Joy Global, Inc. | | | 97,688 | | | | 9,652,551 | | | | 1.54 | |
| | | | | | | | | | | | | |
| Department Stores | | | | | | | | | | | | |
| Kohl’s Corporation | | | 212,695 | | | | 11,281,343 | | | | 1.80 | |
| | | | | | | | | | | | | |
| Distributors | | | | | | | | | | | | |
| Li & Fung Ltd. | | | 4,106,000 | | | | 21,008,903 | | | | 3.35 | |
| | | | | | | | | | | | | |
| Diversified Banks | | | | | | | | | | | | |
U.S. Bancorp† | | | 658,628 | | | | 17,407,538 | | | | 2.77 | |
| | | | | | | | | | | | | |
| Diversified Chemicals | | | | | | | | | | | | |
| BASF S.E. | | | 151,839 | | | | 13,132,810 | | | | 2.09 | |
| PPG Industries, Inc. | | | 143,959 | | | | 13,706,337 | | | | 2.19 | |
| | | | | | | | 26,839,147 | | | | 4.28 | |
| Diversified Metals & Mining | | | | | | | | | | | | |
| Freeport-McMoRan Copper & Gold, Inc. | | | 153,237 | | | | 8,512,315 | | | | 1.36 | |
| | | | | | | | | | | | | |
| Electrical Components & Equipment | | | | | | | | | | | | |
| Sensata Technologies Holding N.V.* | | | 1,135,446 | | | | 39,434,039 | | | | 6.28 | |
| | | | | | | | | | | | | |
| Fertilizers & Agricultural Chemicals | | | | | | | | | | | | |
| Monsanto Company | | | 166,191 | | | | 12,008,962 | | | | 1.91 | |
| | | | | | | | | | | | | |
| Footwear | | | | | | | | | | | | |
| Peak Sport Products Co., Ltd. | | | 1,086,000 | | | | 745,542 | | | | 0.12 | |
| | | | | | | | | | | | | |
| Industrial Machinery | | | | | | | | | | | | |
| FANUC Corporation | | | 68,700 | | | | 10,398,329 | | | | 1.66 | |
| | | | | | | | | | | | | |
| Internet Software & Services | | | | | | | | | | | | |
| Baidu, Inc. Spon. ADR* | | | 96,756 | | | | 13,333,944 | | | | 2.13 | |
| Cornerstone OnDemand, Inc.* | | | 255,516 | | | | 4,658,057 | | | | 0.74 | |
| Youku.com, Inc. Spon. ADR* | | | 256,234 | | | | 12,173,677 | | | | 1.94 | |
| | | | | | | | 30,165,678 | | | | 4.81 | |
| Investment Banking & Brokerage | | | | | | | | | | | | |
| KBW, Inc. | | | 308,959 | | | | 8,091,636 | | | | 1.29 | |
| The Goldman Sachs Group, Inc. | | | 64,128 | | | | 10,162,364 | | | | 1.62 | |
| | | | | | | | 18,254,000 | | | | 2.91 | |
| Managed Health Care | | | | | | | | | | | | |
| Odontoprev S.A. | | | 512,200 | | | | 8,370,132 | | | | 1.33 | |
| | | | | | | | | | | | | |
| Mortgage REITs | | | | | | | | | | | | |
| PennyMac Mortgage Investment Trust | | | 750,764 | | | | 13,806,550 | | | | 2.20 | |
| | | | | | | | | | | | | |
| Oil & Gas Equipment & Services | | | | | | | | | | | | |
| National Oilwell Varco, Inc. | | | 116,443 | | | | 9,230,437 | | | | 1.47 | |
| | | | | | | | | | | | | |
| Oil & Gas Exploration & Production | | | | | | | | | | | | |
| OGX Petróleo e Gás Participações S.A.* | | | 1,418,500 | | | | 17,072,566 | | | | 2.72 | |
| Pacific Rubiales Energy Corp. | | | 260,558 | | | | 7,229,510 | | | | 1.15 | |
| | | | | | | | 24,302,076 | | | | 3.87 | |
| Oil & Gas Refining & Marketing | | | | | | | | | | | | |
| Amyris, Inc.* | | | 91,653 | | | | 2,615,777 | | | | 0.41 | |
| Gevo, Inc.* | | | 155,542 | | | | 3,064,177 | | | | 0.49 | |
| | | | | | | | 5,679,954 | | | | 0.90 | |
| Oil & Gas Storage & Transportation | | | | | | | | | | | | |
| Targa Resources Corporation | | | 623,054 | | | | 22,579,477 | | | | 3.60 | |
| | | | | | | | | | | | | |
| Packaged Foods & Meats | | | | | | | | | | | | |
| Green Mountain Coffee Roasters, Inc.* | | | 190,788 | | | | 12,326,813 | | | | 1.97 | |
| Mead Johnson Nutrition Company | | | 181,227 | | | | 10,498,480 | | | | 1.67 | |
| | | | | | | | 22,825,293 | | | | 3.64 | |
| Property & Casualty Insurance | | | | | | | | | | | | |
| The Travelers Companies, Inc. | | | 293,887 | | | | 17,480,399 | | | | 2.78 | |
| | | | | | | | | | | | | |
| Regional Banks | | | | | | | | | | | | |
| The PNC Financial Services Group, Inc. | | | 187,724 | | | | 11,824,735 | | | | 1.88 | |
| | | | | | | | | | | | | |
| Semiconductors | | | | | | | | | | | | |
| Mellanox Technologies Ltd.* | | | 186,239 | | | | 4,698,810 | | | | 0.75 | |
| | | | | | | | | | | | | |
| Specialized Consumer Services | | | | | | | | | | | | |
| Sotheby’s | | | 148,685 | | | | 7,820,831 | | | | 1.25 | |
| | | | | | | | | | | | | |
| Systems Software | | | | | | | | | | | | |
| Oracle Corporation | | | 598,707 | | | | 19,978,853 | | | | 3.18 | |
| | | | | | | | | | | | | |
| Thrifts & Mortgage Finance | | | | | | | | | | | | |
| First Niagara Financial Group, Inc. | | | 1,110,391 | | | | 15,079,110 | | | | 2.40 | |
| | | | | | | | | | | | | |
| TOTAL COMMON STOCKS | | | | | | | | | | | | |
| (Cost $441,043,768) | | | | | | | 490,696,412 | | | | 78.18 | |
| | | | | | | | | | | | | |
| CONVERTIBLE PREFERRED STOCKS | | | | | | | | | | | | |
| Other Diversified Financial Services | | | | | | | | | | | | |
| Citigroup, Inc., | | | | | | | | | | | | |
| Tangible Dividend Enhanced | | | | | | | | | | | | |
| Common Stock, 7.500%, 12/15/12 | | | 117,942 | | | | 14,919,663 | | | | 2.38 | |
| | | | | | | | | | | | | |
| TOTAL CONVERTIBLE PREFERRED STOCKS | | | | | | | | | | | | |
| (Cost $15,707,392) | | | | | | | 14,919,663 | | | | 2.38 | |
| † | A portion of the security is designated as collateral for certain open derivative instruments. |
See notes to financial statements.
| | | Number | | | | | | Percent | |
| | | of Shares/ | | | | | | of Net | |
| | | Par Value/Units | | | Value | | | Assets | |
| CORPORATE BONDS | | | | | | | | | |
| | | | | | | | | | |
| Health Care Facilities | | | | | | | | | |
| HCA, Inc., 9.250%, 11/15/16 | | | 3,385,000 | | | $ | 3,643,107 | | | | 0.58 | % |
| HCA, Inc., 9.625%, 11/15/16 | | | 2,658,000 | | | | 2,863,995 | | | | 0.46 | |
| | | | | | | | 6,507,102 | | | | 1.04 | |
| Other Diversified Financial Services | | | | | | | | | | | | |
| Bank of America Corporation, | | | | | | | | | | | | |
| 8.125%, 12/29/49 | | | 4,092,000 | | | | 4,400,414 | | | | 0.70 | |
| | | | | | | | | | | | | |
| Real Estate Services | | | | | | | | | | | | |
| CB Richard Ellis Services, Inc., | | | | | | | | | | | | |
| 11.625%, 6/15/17 | | | 5,613,000 | | | | 6,623,340 | | | | 1.05 | |
| | | | | | | | | | | | | |
| TOTAL CORPORATE BONDS | | | | | | | | | | | | |
| (Cost $17,249,757) | | | | | | | 17,530,856 | | | | 2.79 | |
| | | | | | | | | | | | | |
| PREFERRED STOCKS | | | | | | | | | | | | |
| | | | | | | | | | | | | |
| Consumer Finance | | | | | | | | | | | | |
| Ally Financial, Inc., 8.500% | | | 597,525 | | | | 14,860,447 | | | | 2.37 | |
| | | | | | | | | | | | | |
| Other Diversified Financial Services | | | | | | | | | | | | |
| Countrywide Capital V, | | | | | | | | | | | | |
| Capital Securities, 7.000% | | | 657,639 | | | | 16,447,551 | | | | 2.62 | |
| | | | | | | | | | | | | |
| TOTAL PREFERRED STOCKS | | | | | | | | | | | | |
| (Cost $30,285,691) | | | | | | | 31,307,998 | | | | 4.99 | |
| | | | | | | | | | | | | |
| UNITS | | | | | | | | | | | | |
| | | | | | | | | | | | | |
| Education Services | | | | | | | | | | | | |
| Anhanguera Educacional | | | | | | | | | | | | |
| Participacoes S.A. | | | 458,300 | | | | 11,222,757 | | | | 1.79 | |
| | | | | | | | | | | | | |
| Marine Ports & Services | | | | | | | | | | | | |
| Hutchison Port Holdings | | | | | | | | | | | | |
| Trust - Cl. U* | | | 18,940,000 | | | | 18,750,600 | | | | 2.99 | |
| | | | | | | | | | | | | |
| TOTAL UNITS | | | | | | | | | | | | |
| (Cost $27,848,594) | | | | | | | 29,973,357 | | | | 4.78 | |
| | | | | | | | | | | | | |
| SHORT-TERM INVESTMENTS | | | | | | | | | | | | |
| State Street Institutional | | | | | | | | | | | | |
| Treasury Money Market Fund, | | | | | | | | | | | | |
| 0.004% | | | 51,111,761 | | | | 51,111,761 | | | | 8.14 | |
| | | | | | | | | | | | | |
| TOTAL SHORT-TERM INVESTMENTS | | | | | | | | | | | | |
| (Cost $51,111,761) | | | | | | | 51,111,761 | | | | 8.14 | |
| | | | | | | | | | | | | |
| TOTAL INVESTMENTS | | | | | | | | | | | | |
| (Cost $583,246,963) | | | | | | | 635,540,047 | | | | 101.26 | |
| | | | | | | | | | | | | |
| Liabilities, Less Cash and Other Assets | | | | | | | (7,900,507 | ) | | | (1.26 | ) |
| | | | | | | | | | | | | |
| NET ASSETS | | | | | | $ | 627,639,540 | | | | 100.00 | % |
| | | Number | | | | | | Percent | |
| | | of | | | | | | of Net | |
| | | Contracts | | | Value | | | Assets | |
| SECURITIES SOLD SHORT | | | | | | | | | |
| | | | | | | | | | |
| Written Call Options | | | | | | | | | |
| U.S. Bancorp, Exercise Price: $30.00, | | | | | | | | | |
| Expiration Date: April 2011* | | | 2,149 | | | $ | (2,149 | ) | | | (0.00 | )% |
| | | | | | | | | | | | | |
| TOTAL WRITTEN CALL OPTIONS | | | | | | | | | | | | |
| (Premium Received $38,681) | | | | | | | (2,149 | ) | | | (0.00 | ) |
| | | | | | | | | | | | | |
| TOTAL SECURITIES SOLD SHORT | | | | | | | | | | | | |
| (Premium Received $38,681) | | | | | | $ | (2,149 | ) | | | (0.00 | )% |
SUMMARY OF INVESTMENTS BY COUNTRY
| | | | | | Percent of | |
| | | | | | Investment | |
| Country | | Market Value | | | Securities | |
| Brazil | | $ | 36,665,455 | | | | 5.77 | % |
| Canada | | | 7,229,510 | | | | 1.14 | |
| China/Hong Kong | | | 47,262,066 | | | | 7.44 | |
| Germany | | | 13,132,810 | | | | 2.07 | |
| Israel | | | 4,698,810 | | | | 0.74 | |
| Japan | | | 27,460,231 | | | | 4.32 | |
| Netherlands | | | 39,434,039 | | | | 6.20 | |
| Singapore | | | 18,750,600 | | | | 2.95 | |
United States(1) | | | 440,906,526 | | | | 69.37 | |
| | | $ | 635,540,047 | | | | 100.00 | % |
| (1) | Includes short-term securities. |
See notes to financial statements.
INVESTMENT REVIEW BY CORY GILCHRIST, TOM MARSICO AND JIM GENDELMAN (UNAUDITED)
The Marsico Global Fund posted a total return of +17.02% for the six-month fiscal period ended March 31, 2011. The Fund’s return surpassed that of the MSCI All Country World Index (“MSCI ACWI Index”), which we consider to be the Fund’s primary benchmark index and which had a total return of +13.54%. The MSCI ACWI Index measures equity market performance in the global developed and emerging markets. Please see the Fund Overview for more detailed information about the Fund’s performance for various time periods ended March 31, 2011.
The performance data for the Fund quoted here represent past performance, and past performance is not a guarantee of future results. Investment return and principal value of an investment will fluctuate so that an investor’s shares, when redeemed, may be worth more or less than their original cost. Current performance may be lower or higher than the performance information quoted. To obtain performance information current to the most recent month-end, please call 888-860-8686 or visit www.marsicofunds.com.(1)
This review highlights Fund performance over a six-month fiscal period. Shareholders should keep in mind that the Fund is intended for long-term investors who hold their shares for substantially longer periods of time. You should also keep in mind that our views on all investments discussed in this report are subject to change at any time. References to specific securities, industries, and sectors discussed in this report are not recommendations to buy or sell such securities or related investments, and the Fund may not necessarily hold these securities or investments today. Please see the accompanying Schedule of Investments for the percentage of the Fund’s portfolio represented by the securities mentioned in this report as of the end of the reporting period.
Foreign investments present additional risks due to currency fluctuations, economic and political factors, lower liquidity, differences in securities regulations and accounting standards, possible changes in taxation, limited public information and other factors.
The Global Fund’s strong performance results for the six-month period ended March 31, 2011 were largely attributable to stock selection in several sectors. The Fund’s Information Technology, Financials and Materials positions were material positive contributors to performance.
Within the Information Technology sector, Youku.com, Inc. Spon. ADR was purchased at its initial public offering (“IPO”) and rose more +143% before it was sold by the Fund. Apple, Inc. (+23%), maker of the iPad and iPod, and restaurant reservations software company OpenTable, Inc. (+56%) were also leading technology holdings.
Stock selection in the Financials and Materials sectors also aided performance. Banks Wells Fargo & Company (+27%) and The PNC Financial Services Group, Inc. (+20%) posted solid gains. BR Malls Participacoes S.A. (+25%), a Brazilian shopping mall management company, and Swiss diversified financials company Julius Baer Group Ltd. (+19%) were other leading holdings. In Materials, standout performers included agricultural materials company Monsanto Company (+52%) and Australian mining company BHP Billiton PLC (+20% prior to being sold).
Netherlands-based global industrial technology company Sensata Technologies Holding N.V. (+77%) and health care surgical systems manufacturer Intuitive Surgical, Inc. (+18%) each had a material positive impact on performance.
Several of the Fund’s Consumer Discretionary positions provided returns well in excess of the MSCI ACWI Index. In particular, hotel/casino resort operator Wynn Macau Ltd. (+69%), Canada-headquartered athletic apparel company lululemon athletica, inc. (+99%) and Swiss luxury goods provider Compagnie Financière Richemont SA (+20%) were strong performers. Our stock selection within the sector was not always as precisely on target, however. Li & Fung Ltd., a Hong Kong-headquartered manufacturer, exporter, and distributor of retail goods declined -9%. Auto manufacturer General Motors Company slid -8%. Finally, Spanish fashion clothing manufacturer Industria de Diseno Textile S.A. (Inditex) (+2%) also hampered performance.
The main areas of weakness for the Fund’s performance over the past six months were stock selection in and an underweighted posture in the Energy sector. The Fund’s performance was penalized by having an underweighted allocation to the strong-performing sector. One of the Fund’s Energy holdings, OGX Petróleo e Gás Participações S.A. (-7%), was a material detractor from performance.
Certain Financials positions also struggled, most notably IFM Investments Ltd. ADR (-37% prior to being sold), Hang Lung Properties Ltd. (-9%) and First Midwest Bancorp, Inc. (-17% prior to being sold).
Active currency management is not a central facet of the Fund’s investment process, but fluctuations in major world currencies can affect performance. During this six-month period, US-based investors in international equities benefitted from a currency lift overall as the US dollar weakened as compared to certain foreign currencies including the euro, the Australian dollar and Canadian dollar, effectively increasing returns from foreign securities as expressed in US dollars. On a narrower dimension, the Fund had little exposure to companies that trade in the Canadian dollar and Australian dollar, which appreciated substantially compared to the US dollar and many other major world currencies. This positioning detracted modestly from the Fund’s returns relative to its benchmark index.
The Global Fund has tended to have a fairly high portfolio turnover level. This is mainly attributable to the Fund’s investment style. Although the Fund may hold core positions for some time, it may change its portfolio composition quickly to take advantage of new opportunities, or to address issues affecting particular holdings.
Fiscal Period-End Investment Posture
As of March 31, 2011, the Fund’s primary economic sector allocations included Consumer Discretionary, Financials, Information Technology and Industrials. The Fund had no investments in Utilities and Telecommunication Services sectors.
The Fund’s most significant country allocations were the US, Switzerland, Brazil and China/Hong Kong. The Fund held several positions domiciled in emerging markets totaling approximately 17% of net assets including Brazil, Argentina, India and China.
Sincerely,
CORYDON J. GILCHRIST, CFA
THOMAS F. MARSICO
JAMES G. GENDELMAN
PORTFOLIO MANAGERS
| (1) | Total returns are based on net change in net asset value assuming reinvestment of distributions. For the period prior to January 1, 2009 and from April through May 2009, the performance returns for the Global Fund reflect a fee waiver in effect; in the absence of such a waiver, the returns would have been reduced. For the one-month period June 2009, performance returns for the Global Fund would have been higher but for the reimbursement of fees waived previously. A redemption fee of 2% may be imposed on redemptions or exchanges of Fund shares owned for 30 days or less. Please see the Prospectus for more information. |
March 31, 2011 (Unaudited)
The Global Fund invests primarily in common stocks that are selected for their long-term growth potential. The Fund invests in the securities of companies of any size that are economically tied to any countries or markets throughout the world, including the securities of companies economically tied to emerging markets. Under normal market conditions, the Fund will invest significantly (generally, at least 40% of its net assets) in the securities of issuers organized or located outside the U.S. or doing business outside the U.S. (unless market conditions are not deemed favorable by the Adviser, in which case the Fund generally will invest at least 30% of its assets in such foreign securities). The Fund will invest its assets in various regions and countries, including the U.S., that encompass not less than three different countries overall. The Fund may hold an unlimited number of common stocks.
| TOTAL ANNUAL OPERATING EXPENSES* | 1.56% | NET ASSETS | $135,132,589 | NET ASSET VALUE PER SHARE | $11.49 |
GROWTH OF $10,000(1)(2) | PERFORMANCE COMPARISON |
| | |
| |
| | |
SECTOR ALLOCATION(3) | TOP FIVE HOLDINGS |
| | | |
| WELLS FARGO & COMPANY | 5.14% |
| INDUSTRIA DE DISENO TEXTILE S.A. (INDITEX) | 4.82% |
| COMPAGNIE FINANCIÈRE RICHEMONT SA | 4.24% |
| THE PNC FINANCIAL SERVICES GROUP, INC. | 4.22% |
| OGX PETRÓLEO E GÁS PARTICIPAÇÕES S.A. | 3.76% |
| | | |
| * | The Total Annual Operating Expenses are reflective of the information disclosed in the Funds’ Prospectus dated February 1, 2011 and may differ from the expense ratio disclosed in this report. |
The performance data quoted here represent past performance, and past performance is not a guarantee of future results. Investment return and principal value of an investment will fluctuate so that an investor’s shares, when redeemed, may be worth more or less than their original cost. Current performance may be lower or higher than the performance information quoted. To obtain performance information current to the most recent month-end, please call 888-860-8686 or visit www.marsicofunds.com. A redemption fee may be imposed on redemptions or exchanges of Fund shares held for 30 days or less.
The performance included in the chart and graph does not reflect the deduction of taxes on Fund distributions or the redemption of Fund shares.
All indices are unmanaged and investors cannot invest directly in an index.
| The performance returns for the Global Fund (for the period prior to January 1, 2009 and from April through May 2009) reflect a fee waiver in effect; in absence of such a waiver, the returns would be reduced. For the one-month period June 2009, performance returns for the Global Fund would have been higher but for reimbursement of fees waived previously. |
| This chart assumes an initial investment of $10,000 made on June 29, 2007 (inception). Total returns are based on change in NAV, assuming reinvestment of distributions. |
| Sector weightings represent the percentage of the Fund’s investments (excluding cash equivalents) in certain general sectors. These sectors may include more than one industry. The Fund’s portfolio composition is subject to change at any time. |
The MSCI ACWI (All Country World Index) Index is a free float-adjusted market capitalization index that is designed to measure equity market performance in the global developed and emerging markets.
MARSICO GLOBAL FUND
SCHEDULE OF INVESTMENTS
March 31, 2011 (Unaudited)
| | | Number | | | | | | Percent | |
| | | of | | | | | | of Net | |
| | | Shares/Units | | | Value | | | Assets | |
| COMMON STOCKS | | | | | | | | | |
| | | | | | | | | | |
| Aerospace & Defense | | | | | | | | | |
| Precision Castparts Corp. | | | 23,578 | | | $ | 3,470,210 | | | | 2.57 | % |
| | | | | | | | | | | | | |
| Apparel Retail | | | | | | | | | | | | |
| Industria de Diseno Textile S.A. (Inditex) | | | 81,219 | | | | 6,517,161 | | | | 4.82 | |
| rue21, inc.* | | | 37,951 | | | | 1,092,989 | | | | 0.81 | |
| | | | | | | | 7,610,150 | | | | 5.63 | |
| Apparel, Accessories & Luxury Goods | | | | | | | | | | | | |
| Compagnie Financière Richemont SA | | | 99,071 | | | | 5,722,065 | | | | 4.24 | |
| lululemon athletica, inc.* | | | 13,546 | | | | 1,206,271 | | | | 0.89 | |
| | | | | | | | 6,928,336 | | | | 5.13 | |
| Application Software | | | | | | | | | | | | |
| ANSYS, Inc.* | | | 38,716 | | | | 2,098,020 | | | | 1.55 | |
| AutoNavi Holdings Ltd. ADR* | | | 19,500 | | | | 345,345 | | | | 0.26 | |
| Informatica Corporation* | | | 42,132 | | | | 2,200,554 | | | | 1.63 | |
| salesforce.com, inc.* | | | 12,872 | | | | 1,719,442 | | | | 1.27 | |
| | | | | | | | 6,363,361 | | | | 4.71 | |
| Asset Management & Custody Banks | | | | | | | | | | | | |
| Julius Baer Group Ltd. | | | 89,139 | | | | 3,868,351 | | | | 2.86 | |
| State Street Corporation | | | 62,011 | | | | 2,786,774 | | | | 2.06 | |
| | | | | | | | 6,655,125 | | | | 4.92 | |
| Automobile Manufacturers | | | | | | | | | | | | |
| Bayerische Motoren Werke AG | | | 36,173 | | | | 3,011,781 | | | | 2.23 | |
| General Motors Company* | | | 120,945 | | | | 3,752,923 | | | | 2.78 | |
| | | | | | | | 6,764,704 | | | | 5.01 | |
| Casinos & Gaming | | | | | | | | | | | | |
| Wynn Macau Ltd. | | | 1,607,475 | | | | 4,494,743 | | | | 3.33 | |
| | | | | | | | | | | | | |
| Communications Equipment | | | | | | | | | | | | |
| Acme Packet, Inc.* | | | 15,308 | | | | 1,086,256 | | | | 0.80 | |
| | | | | | | | | | | | | |
| Computer Hardware | | | | | | | | | | | | |
| Apple, Inc.* | | | 10,492 | | | | 3,655,937 | | | | 2.70 | |
| TOSHIBA Corporation | | | 519,000 | | | | 2,539,469 | | | | 1.88 | |
| | | | | | | | 6,195,406 | | | | 4.58 | |
| Distributors | | | | | | | | | | | | |
| Li & Fung Ltd. | | | 782,000 | | | | 4,001,208 | | | | 2.96 | |
| | | | | | | | | | | | | |
| Diversified Banks | | | | | | | | | | | | |
| Barclays PLC | | | 805,994 | | | | 3,588,652 | | | | 2.66 | |
| ICICI Bank Ltd. Spon. ADR | | | 21,445 | | | | 1,068,604 | | | | 0.79 | |
| Wells Fargo & Company | | | 219,153 | | | | 6,947,150 | | | | 5.14 | |
| | | | | | | | 11,604,406 | | | | 8.59 | |
| Diversified Real Estate Activities | | | | | | | | | | | | |
| BR Properties S.A. | | | 123,000 | | | | 1,292,041 | | | | 0.96 | |
| Hang Lung Properties Ltd. | | | 336,000 | | | | 1,466,494 | | | | 1.08 | |
| | | | | | | | 2,758,535 | | | | 2.04 | |
| Electrical Components & Equipment | | | | | | | | | | | | |
| Sensata Technologies Holding N.V.* | | | 105,049 | | | | 3,648,352 | | | | 2.70 | |
| | | | | | | | | | | | | |
| Fertilizers & Agricultural Chemicals | | | | | | | | | | | | |
| Monsanto Company | | | 50,235 | | | | 3,629,981 | | | | 2.69 | |
| | | | | | | | | | | | | |
| Health Care Equipment | | | | | | | | | | | | |
| Intuitive Surgical, Inc.* | | | 14,323 | | | | 4,776,148 | | | | 3.53 | |
| Internet Retail | | | | | | | | | |
| Amazon.com, Inc.* | | | 11,638 | | | | 2,096,353 | | | | 1.55 | |
| MakeMyTrip Ltd.* | | | 11,221 | | | | 328,887 | | | | 0.24 | |
| | | | | | | | 2,425,240 | | | | 1.79 | |
| Internet Software & Services | | | | | | | | | | | | |
| MercadoLibre, Inc. | | | 43,452 | | | | 3,546,987 | | | | 2.63 | |
| OpenTable, Inc.* | | | 9,831 | | | | 1,045,527 | | | | 0.77 | |
| | | | | | | | 4,592,514 | | | | 3.40 | |
| Marine | | | | | | | | | | | | |
| Kuehne + Nagel International AG | | | 23,169 | | | | 3,241,390 | | | | 2.40 | |
| | | | | | | | | | | | | |
| Marine Ports & Services | | | | | | | | | | | | |
| LLX Logistica S.A.* | | | 483,200 | | | | 1,488,682 | | | | 1.10 | |
| | | | | | | | | | | | | |
| Movies & Entertainment | | | | | | | | | | | | |
| The Walt Disney Company | | | 100,640 | | | | 4,336,578 | | | | 3.21 | |
| | | | | | | | | | | | | |
| Oil & Gas Exploration & Production | | | | | | | | | | | | |
| OGX Petróleo e Gás Participações S.A.* | | | 422,400 | | | | 5,083,858 | | | | 3.76 | |
| Ultra Petroleum Corp.* | | | 61,458 | | | | 3,026,806 | | | | 2.24 | |
| | | | | | | | 8,110,664 | | | | 6.00 | |
| Oil & Gas Refining & Marketing | | | | | | | | | | | | |
| Amyris, Inc.* | | | 20,553 | | | | 586,583 | | | | 0.43 | |
| | | | | | | | | | | | | |
| Other Diversified Financial Services | | | | | | | | | | | | |
| Citigroup, Inc.* | | | 655,322 | | | | 2,896,523 | | | | 2.14 | |
| | | | | | | | | | | | | |
| Packaged Foods & Meats | | | | | | | | | | | | |
| Nestlé S.A. | | | 48,636 | | | | 2,787,899 | | | | 2.06 | |
| | | | | | | | | | | | | |
| Real Estate Operating Companies | | | | | | | | | | | | |
| BR Malls Participacoes S.A. | | | 375,700 | | | | 3,911,984 | | | | 2.90 | |
| | | | | | | | | | | | | |
| Regional Banks | | | | | | | | | | | | |
| The PNC Financial Services Group, Inc. | | | 90,427 | | | | 5,695,997 | | | | 4.22 | |
| | | | | | | | | | | | | |
| Restaurants | | | | | | | | | | | | |
| Chipotle Mexican Grill, Inc.* | | | 2,290 | | | | 623,727 | | | | 0.46 | |
| | | | | | | | | | | | | |
| Specialty Chemicals | | | | | | | | | | | | |
| Novozymes A/S - Cl. B | | | 22,424 | | | | 3,433,158 | | | | 2.54 | |
| | | | | | | | | | | | | |
| Systems Software | | | | | | | | | | | | |
| Oracle Corporation | | | 72,314 | | | | 2,413,118 | | | | 1.79 | |
| | | | | | | | | | | | | |
| TOTAL COMMON STOCKS | | | | | | | | | | | | |
| (Cost $92,116,193) | | | | | | | 126,530,978 | | | | 93.63 | |
| | | | | | | | | | | | | |
| UNITS | | | | | | | | | | | | |
| | | | | | | | | | | | | |
| Education Services | | | | | | | | | | | | |
| Anhanguera Educacional | | | | | | | | | | | | |
| Participacoes S.A. | | | 64,800 | | | | 1,586,809 | | | | 1.18 | |
| | | | | | | | | | | | | |
| Marine Ports & Services | | | | | | | | | | | | |
| Hutchison Port Holdings Trust - Cl. U* | | | 2,623,000 | | | | 2,596,770 | | | | 1.92 | |
| | | | | | | | | | | | | |
| TOTAL UNITS | | | | | | | | | | | | |
| (Cost $3,822,445) | | | | | | | 4,183,579 | | | | 3.10 | |
See notes to financial statements.
MARSICO GLOBAL FUND
SCHEDULE OF INVESTMENTS (continued)
March 31, 2011 (Unaudited)
| | | Number | | | | | | Percent | |
| | | of | | | | | | of Net | |
| | | Shares | | | Value | | | Assets | |
| SHORT-TERM INVESTMENTS | | | | | | | | | |
| State Street Institutional | | | | | | | | | |
| Treasury Money Market | | | | | | | | | |
| Fund, 0.004% | | | 5,485,447 | | | $ | 5,485,447 | | | | 4.06 | % |
| | | | | | | | | | | | | |
| TOTAL SHORT-TERM INVESTMENTS | | | | | | | | | | | | |
| (Cost $5,485,447) | | | | | | | 5,485,447 | | | | 4.06 | |
| | | | | | | | | | | | | |
| TOTAL INVESTMENTS | | | | | | | | | | | | |
| (Cost $101,424,085) | | | | | | | 136,200,004 | | | | 100.79 | |
| | | | | | | | | | | | | |
| Liabilities, Less Cash and Other Assets | | | | | | | (1,067,415 | ) | | | (0.79 | ) |
| | | | | | | | | | | | | |
| NET ASSETS | | | | | | $ | 135,132,589 | | | | 100.00 | % |
SUMMARY OF INVESTMENTS BY COUNTRY
| | | | | | Percent of | |
| | | | | | Investment | |
| Country | | Market Value | | | Securities | |
| Argentina | | $ | 3,546,987 | | | | 2.60 | % |
| Brazil | | | 13,363,374 | | | | 9.81 | |
| Canada | | | 1,206,271 | | | | 0.89 | |
| China/Hong Kong | | | 10,307,790 | | | | 7.57 | |
| Denmark | | | 3,433,158 | | | | 2.52 | |
| Germany | | | 3,011,781 | | | | 2.21 | |
| India | | | 1,397,491 | | | | 1.03 | |
| Japan | | | 2,539,469 | | | | 1.86 | |
| Netherlands | | | 3,648,352 | | | | 2.68 | |
| Singapore | | | 2,596,770 | | | | 1.91 | |
| Spain | | | 6,517,161 | | | | 4.79 | |
| Switzerland | | | 15,619,705 | | | | 11.47 | |
| United Kingdom | | | 3,588,652 | | | | 2.63 | |
United States(1) | | | 65,423,043 | | | | 48.03 | |
| | | $ | 136,200,004 | | | | 100.00 | % |
| (1) | Includes short-term securities. |
See notes to financial statements.
INVESTMENT REVIEW BY MUNISH MALHOTRA, JOSH RUBIN AND CHARLIE WILSON (UNAUDITED)
The Emerging Markets Fund commenced operations on December 31, 2010, in the middle of the six-month reporting period ended March 31, 2011. As a reminder, the Fund seeks long-term growth of capital by investing primarily in issuers economically tied to emerging markets that are selected for their long-term growth potential.
The Fund posted a total return of (US$) -3.80% for the period from December 31, 2010 (inception) through March 31, 2011. For comparative purposes over the same period, the MSCI Emerging Markets Index, which we consider to be the Fund’s primary benchmark index, had a total return of (US$) +2.04%. The MSCI Emerging Markets Index measures equity market performance of emerging markets. Please see the Fund Overview for more detailed information about the Fund’s performance for the three-month period ended March 31, 2011.
The performance data for the Fund quoted here represent past performance, and past performance is not a guarantee of future results. Investment return and principal value of an investment will fluctuate so that an investor’s shares, when redeemed, may be worth more or less than their original cost. Current performance may be lower or higher than the performance information quoted. To obtain performance information current to the most recent month-end, please call 888-860-8686 or visit www.marsicofunds.com.(1)
This review highlights Fund performance over a three-month period. Shareholders should keep in mind that the Fund is intended for long-term investors who hold their shares for substantially longer periods of time. You should also keep in mind that our views on all investments discussed in this report are subject to change at any time. References to specific securities, industries, and sectors discussed in this report are not recommendations to buy or sell such securities or related investments, and the Fund may not necessarily hold these securities or investments today. Please see the accompanying Schedule of Investments for the percentage of the Fund’s portfolio represented by the securities mentioned in this report as of the end of the reporting period.
Foreign investments present additional risks due to currency fluctuations, economic and political factors, lower liquidity, differences in securities regulations and accounting standards, possible changes in taxation, limited public information and other factors. These risks may be greater in less-developed emerging markets.
The first calendar quarter of 2011 was challenging for emerging markets. Unrest in the Middle East, concerns regarding emerging markets inflation and its effect on global growth prospects, and tightening measures from certain emerging market government entities (such as China and Brazil) weighed on these markets. The MSCI Emerging Markets Index experienced a negative return in the month of January followed by positive performance for the months of February and March 2011.
We believe that emerging markets offer compelling investment opportunities for long-term growth of capital. In late January, however, political unrest in the Middle East and North Africa raised concerns for us regarding the potential ripple effects of political instability in the region. In an effort to preserve capital, the Fund sold many of its equity positions and assumed a temporary defensive position by raising the percentage of its net assets in cash and cash equivalents. On average, the Fund held approximately 38% of its net assets in cash and cash equivalents during the three-month period. We gradually began to redeploy the Fund’s cash position into equities as evidence mounted that political unrest remained relatively contained in nature and that powerful demand trends from emerging markets would persist. As of March 31, 2011, the Fund’s cash, including pending purchases and sales, represented approximately 20% of the Fund’s net assets.
The Fund’s elevated cash position hurt performance on two levels. The Fund did not fully participate in the positive equity returns experienced by the benchmark index during the months of February and March. The US dollar generally weakened as compared to many emerging market currencies; therefore, the Fund’s US dollar cash positions also incurred a negative currency effect.
The Fund’s performance was also hurt by stock selection and allocation to the Energy sector. Energy was, by far, the strongest-performing sector of the benchmark index with a return of +12%. The Fund was therefore hurt by having few investments in the sector. Stock selection within the sector was also disappointing. The Fund’s Energy holdings, South American exploration and production company Pacific Rubiales Energy Corp. and Brazil-based OGX Petróleo e Gás Participações S.A. slid -20% and -10%, respectively.
Other individual positions that had a material, adverse impact on performance included Chilean copper producer Antofagasta PLC (-18%), South Africa-headquartered media company Naspers Ltd. – Cl. N (-8% prior to being sold) and Chinese personal products company Hengan International Group Co., Ltd. (-15%).
The primary area of strength for the Fund was stock selection in the Information Technology sector. The Fund’s technology holdings posted a collective return of +19%. Chinese Internet technology companies SINA Corporation (+38%) and Tencent Holdings Ltd. (+19% prior to being sold) performed well. Argentina-based e-commerce company MercadoLibre, Inc. gained +16%. Petronas Chemicals Group Bhd, a leading petrochemicals producer in Southeast Asia, gained +18% and was among the Fund’s strongest performing individual positions.
The Emerging Markets Fund may tend to have a relatively high portfolio turnover level because of its investment style. Although the Fund may hold core positions for some time, it may change its portfolio composition quickly to take advantage of new opportunities, or to address issues affecting particular holdings.
Fiscal Period-End Investment Posture
As of period-end, the Fund emphasized investments in companies that are able to grow their business in an inflationary environment (such as commodities and companies offering automation/productivity solutions) and companies that we believe will be able to pass through higher prices due to their strong brand and/or pricing power.
The Fund’s most significant sector allocations at period-end included Financials, Consumer Discretionary, Information Technology and Energy. The Fund’s largest country weights were Brazil and China/Hong Kong. As of March 31, 2011, the Fund’s cash position (held primarily in US dollars) represented approximately 20% of the Fund’s net assets. We anticipate that the Fund’s cash positions will decrease as we identify new investment opportunities and add selectively to existing holdings.
Sincerely,
MUNISH MALHOTRA, CFA
JOSHUA N. RUBIN
CHARLES K. WILSON
PORTFOLIO MANAGERS
| (1) | Total returns are based on net change in net asset value assuming reinvestment of distributions. The performance returns for the Emerging Markets Fund reflect a fee waiver in effect; in the absence of such a waiver, the returns would have been reduced. A redemption fee of 2% may be imposed on redemptions or exchanges of Fund shares owned for 30 days or less. Please see the Prospectus for more information. |
| EMERGING MARKETS FUND OVERVIEW |
March 31, 2011 (Unaudited)
The Emerging Markets Fund seeks long-term growth of capital through a diversified portfolio. The Fund invests primarily (no less than 80% of net assets) in common stocks and other securities of issuers economically tied to emerging markets. The Fund may invest in the securities of an unlimited number of issuers of any size around the world.
| TOTAL ANNUAL OPERATING EXPENSES* | 3.36% | | | | |
NET EXPENSES*† | 1.75% | NET ASSETS | $10,294,620 | NET ASSET VALUE PER SHARE | $9.62 |
GROWTH OF $10,000(1)(2) | | PERFORMANCE COMPARISON |
| | | |
| | |
| | | |
SECTOR ALLOCATION(3) | | TOP FIVE HOLDINGS |
| | | |
| | OGX PETRÓLEO E GÁS PARTICIPAÇÕES S.A. | 7.41% |
| | BR MALLS PARTICIPACOES S.A. | 5.08% |
| | ODONTOPREV S.A. | 3.19% |
| | PT BANK RAKYAT INDONESIA PERSERO TBK | 3.16% |
| | ICICI BANK LTD. SPON. ADR | 3.09% |
| * | The Total Annual Operating Expenses and Net Expenses are reflective of the information disclosed in the Funds’ Prospectus dated February 1, 2011 and may differ from the expense ratios disclosed in this report. |
| † | The Adviser has entered into a written expense limitation agreement under which it has agreed to limit the total expenses of the Fund (excluding interest, taxes, acquired fund fees and expenses, litigation, brokerage and extraordinary expenses) to an annual rate of 1.75% of the Emerging Markets Fund’s average net assets until January 31, 2012. This fee waiver may be terminated at any time after January 31, 2012. The Adviser may recoup any waived amount from the Fund pursuant to this arrangement if such reimbursement does not cause the Fund to exceed existing expense limitations and the reimbursement is made within three years after the year in which the Adviser incurred the expense. |
The performance data quoted here represent past performance, and past performance is not a guarantee of future results. Investment return and principal value of an investment will fluctuate so that an investor’s shares, when redeemed, may be worth more or less than their original cost. Current performance may be lower or higher than the performance information quoted. To obtain performance information current to the most recent month-end, please call 888-860-8686 or visit www.marsicofunds.com. A redemption fee may be imposed on redemptions or exchanges of Fund shares held for 30 days or less.
The performance included in the chart and graph does not reflect the deduction of taxes on Fund distributions or the redemption of Fund shares.
All indices are unmanaged and investors cannot invest directly in an index.
| The performance returns for the Emerging Markets Fund reflect a fee waiver in effect; in absence of such a waiver, the returns would be reduced. |
| This chart assumes an initial investment of $10,000 made on December 31, 2010 (inception). Total returns are based on change in NAV, assuming reinvestment of distributions. |
| Sector weightings represent the percentage of the Fund’s investments (excluding cash equivalents) in certain general sectors. These sectors may include more than one industry. The Fund’s portfolio composition is subject to change at any time. |
The MSCI Emerging Markets Index is a free float-adjusted market capitalization index that is designed to measure equity market performance in the global emerging markets.
MARSICO EMERGING MARKETS FUND
SCHEDULE OF INVESTMENTS
March 31, 2011 (Unaudited)
| | | Number | | | | | | Percent | |
| | | of | | | | | | of Net | |
| | | Shares/Units | | | Value | | | Assets | |
| COMMON STOCKS | | | | | | | | | |
| | | | | | | | | | |
| Agricultural Products | | | | | | | | | |
| Asian Citrus Holdings Ltd. | | | 251,000 | | | $ | 277,507 | | | | 2.69 | % |
| | | | | | | | | | | | | |
| Brewers | | | | | | | | | | | | |
| Companhia de Bebidas das | | | | | | | | | | | | |
| Americas - AmBev Preferred ADR | | | 3,391 | | | | 95,999 | | | | 0.93 | |
| | | | | | | | | | | | | |
| Casinos & Gaming | | | | | | | | | | | | |
| Genting Malaysia Bhd | | | 85,800 | | | | 104,249 | | | | 1.01 | |
| Wynn Macau Ltd. | | | 9,200 | | | | 25,665 | | | | 0.25 | |
| | | | | | | | 129,914 | | | | 1.26 | |
| Commodity Chemicals | | | | | | | | | | | | |
| Petronas Chemicals Group Bhd* | | | 112,800 | | | | 269,640 | | | | 2.62 | |
| | | | | | | | | | | | | |
| Construction Materials | | | | | | | | | | | | |
| PT Indocement Tunggal Prakarsa Tbk | | | 57,500 | | | | 107,967 | | | | 1.05 | |
| | | | | | | | | | | | | |
| Distributors | | | | | | | | | | | | |
| Li & Fung Ltd. | | | 58,000 | | | | 296,765 | | | | 2.88 | |
| | | | | | | | | | | | | |
| Diversified Banks | | | | | | | | | | | | |
| Bank of China Ltd. - Cl. H | | | 181,000 | | | | 100,755 | | | | 0.98 | |
| Credicorp Ltd. | | | 1,779 | | | | 186,670 | | | | 1.81 | |
| Erste Group Bank AG | | | 1,905 | | | | 96,125 | | | | 0.94 | |
| ICICI Bank Ltd. Spon. ADR | | | 6,383 | | | | 318,065 | | | | 3.09 | |
| Industrial and Commercial | | | | | | | | | | | | |
| Bank of China Ltd. - Cl. H | | | 124,000 | | | | 102,981 | | | | 1.00 | |
| PT Bank Rakyat Indonesia Persero Tbk | | | 493,000 | | | | 325,553 | | | | 3.16 | |
| | | | | | | | 1,130,149 | | | | 10.98 | |
| Diversified Metals & Mining | | | | | | | | | | | | |
| Antofagasta PLC | | | 4,184 | | | | 91,350 | | | | 0.89 | |
| Ivanhoe Mines Ltd.* | | | 1,467 | | | | 40,284 | | | | 0.39 | |
| | | | | | | | 131,634 | | | | 1.28 | |
| Diversified Real Estate Activities | | | | | | | | | | | | |
| Hang Lung Properties Ltd. | | | 68,000 | | | | 296,791 | | | | 2.88 | |
| | | | | | | | | | | | | |
| Diversified Support Services | | | | | | | | | | | | |
| Multiplus S.A. | | | 16,900 | | | | 299,980 | | | | 2.91 | |
| | | | | | | | | | | | | |
| Electric Utilities | | | | | | | | | | | | |
| Light S.A. | | | 17,200 | | | | 297,088 | | | | 2.89 | |
| | | | | | | | | | | | | |
| Electronic Equipment & Instruments | | | | | | | | | | | | |
| HollySys Automation Technologies Ltd.* | | | 7,678 | | | | 102,117 | | | | 0.99 | |
| | | | | | | | | | | | | |
| Hotels, Resorts & Cruise Lines | | | | | | | | | | | | |
| Home Inns & Hotels Management, Inc. ADR* | | | 2,475 | | | | 97,936 | | | | 0.95 | |
| Shangri-La Asia Ltd. | | | 112,833 | | | | 288,372 | | | | 2.80 | |
| | | | | | | | 386,308 | | | | 3.75 | |
| Internet Retail | | | | | | | | | | | | |
| MakeMyTrip Ltd.* | | | 3,621 | | | | 106,132 | | | | 1.03 | |
| | | | | | | | | | | | | |
| Internet Software & Services | | | | | | | | | | | | |
| Baidu, Inc. Spon. ADR* | | | 789 | | | | 108,732 | | | | 1.05 | |
| MercadoLibre, Inc. | | | 2,508 | | | | 204,728 | | | | 1.99 | |
| SINA Corporation* | | | 2,720 | | | | 291,149 | | | | 2.83 | |
| Youku.com, Inc. Spon. ADR* | | | 2,161 | | | | 102,669 | | | | 1.00 | |
| | | | | | | | 707,278 | | | | 6.87 | |
| Managed Health Care | | | | | | | | | | | | |
| Odontoprev S.A. | | | 20,100 | | | | 328,465 | | | | 3.19 | |
| | | | | | | | | | | | | |
| Office REITs | | | | | | | | | | | | |
| Ascendas India Trust | | | 259,000 | | | | 196,228 | | | | 1.91 | |
| | | | | | | | | | | | | |
| Oil & Gas Exploration & Production | | | | | | | | | | | | |
| OGX Petróleo e Gás Participações S.A.* | | | 63,350 | | | | 762,458 | | | | 7.41 | |
| Pacific Rubiales Energy Corp. | | | 9,611 | | | | 266,670 | | | | 2.59 | |
| | | | | | | | 1,029,128 | | | | 10.00 | |
| Personal Products | | | | | | | | | | | | |
| Hengan International Group Co., Ltd. | | | 24,500 | | | | 181,894 | | | | 1.77 | |
| | | | | | | | | | | | | |
| Pharmaceuticals | | | | | | | | | | | | |
| Genomma Lab Internacional | | | | | | | | | | | | |
| S.A.B. de C.V. - Cl. B* | | | 42,500 | | | | 96,116 | | | | 0.93 | |
| | | | | | | | | | | | | |
| Real Estate Operating Companies | | | | | | | | | | | | |
| BR Malls Participacoes S.A. | | | 50,200 | | | | 522,708 | | | | 5.08 | |
| | | | | | | | | | | | | |
| Specialized Finance | | | | | | | | | | | | |
| BM&FBovespa S.A. | | | 41,800 | | | | 303,390 | | | | 2.95 | |
| | | | | | | | | | | | | |
| Systems Software | | | | | | | | | | | | |
| Totvs S.A. | | | 15,165 | | | | 291,197 | | | | 2.83 | |
| | | | | | | | | | | | | |
| Wireless Telecommunication Services | | | | | | | | | | | | |
| Philippine Long Distance | | | | | | | | | | | | |
| Telephone Company Spon. ADR | | | 1,905 | | | | 101,917 | | | | 0.99 | |
| | | | | | | | | | | | | |
| TOTAL COMMON STOCKS | | | | | | | | | | | | |
| (Cost $7,311,647) | | | | | | | 7,686,312 | | | | 74.66 | |
| | | | | | | | | | | | | |
| UNITS | | | | | | | | | | | | |
| Education Services | | | | | | | | | | | | |
| Anhanguera Educacional | | | | | | | | | | | | |
| Participacoes S.A. | | | 12,400 | | | | 303,649 | | | | 2.95 | |
| | | | | | | | | | | | | |
| Marine Ports & Services | | | | | | | | | | | | |
| Hutchison Port Holdings Trust - Cl. U* | | | 98,000 | | | | 97,020 | | | | 0.94 | |
| | | | | | | | | | | | | |
| TOTAL UNITS | | | | | | | | | | | | |
| (Cost $382,392) | | | | | | | 400,669 | | | | 3.89 | |
| | | | | | | | | | | | | |
| SHORT-TERM INVESTMENTS | | | | | | | | | | | | |
| State Street Institutional | | | | | | | | | | | | |
| Treasury Money Market | | | | | | | | | | | | |
| Fund, 0.004% | | | 2,058,455 | | | | 2,058,455 | | | | 20.00 | |
| | | | | | | | | | | | | |
| TOTAL SHORT-TERM INVESTMENTS | | | | | | | | | | | | |
| (Cost $2,058,455) | | | | | | | 2,058,455 | | | | 20.00 | |
| | | | | | | | | | | | | |
| TOTAL INVESTMENTS | | | | | | | | | | | | |
| (Cost $9,752,494) | | | | | | | 10,145,436 | | | | 98.55 | |
| | | | | | | | | | | | | |
| Cash and Other Assets, Less Liabilities | | | | | | | 149,184 | | | | 1.45 | |
| | | | | | | | | | | | | |
| NET ASSETS | | | | | | $ | 10,294,620 | | | | 100.00 | % |
See notes to financial statements.
SUMMARY OF INVESTMENTS BY COUNTRY
| | | | | | Percent of | |
| | | | | | Investment | |
| Country | | Market Value | | | Securities | |
| Argentina | | $ | 204,728 | | | | 2.02 | % |
| Austria | | | 96,125 | | | | 0.95 | |
| Brazil | | | 3,204,934 | | | | 31.59 | |
| Canada | | | 306,954 | | | | 3.03 | |
| China/Hong Kong | | | 2,273,333 | | | | 22.41 | |
| India | | | 620,425 | | | | 6.11 | |
| Indonesia | | | 433,520 | | | | 4.27 | |
| Malaysia | | | 373,889 | | | | 3.68 | |
| Mexico | | | 96,116 | | | | 0.95 | |
| Peru | | | 186,670 | | | | 1.84 | |
| Philippines | | | 101,917 | | | | 1.00 | |
| Singapore | | | 97,020 | | | | 0.96 | |
| United Kingdom | | | 91,350 | | | | 0.90 | |
United States(1) | | | 2,058,455 | | | | 20.29 | |
| | | $ | 10,145,436 | | | | 100.00 | % |
| (1) | Includes short-term securities. |
See notes to financial statements.
STATEMENTS OF ASSETS AND LIABILITIES
March 31, 2011 (Unaudited)
| | | MARSICO | | | MARSICO | |
| | | FOCUS FUND | | | GROWTH FUND | |
| | | | | | | |
| (Amounts in thousands) | | | | | | |
| | | | | | | |
| ASSETS | | | | | | |
| Investments, at value (cost $879,308, $589,994, $616,054, $179,525, $583,247, $101,424, and $9,752, respectively) | | $ | 1,248,985 | | | $ | 872,614 | |
| Cash | | | — | | | | — | |
| Foreign currency (cost $0, $0, $0, $217, $0, $31, and, $0, respectively) | | | — | | | | — | |
| Receivable for investments sold | | | 16,586 | | | | 2,148 | |
| Receivable for capital stock sold | | | 891 | | | | 408 | |
| Interest and dividends receivable | | | 1,172 | | | | 645 | |
| Due from adviser | | | — | | | | — | |
| Prepaid expenses and other assets | | | 709 | | | | 407 | |
| Total Assets | | | 1,268,343 | | | | 876,222 | |
| | | | | | | | | |
| LIABILITIES | | | | | | | | |
| Payable for investments purchased | | | 26,092 | | | | 1,281 | |
| Written options outstanding (premiums received $0, $0, $0, $0, $39, $0, and $0, respectively) | | | — | | | | — | |
| Payable for capital stock redeemed | | | 3,282 | | | | 939 | |
| Accrued investment advisory fee | | | 907 | | | | 638 | |
| Accrued transfer agent fees and expenses | | | 206 | | | | 133 | |
| Accrued trustees’ fees | | | 691 | | | | 390 | |
| Accrued printing expenses | | | 202 | | | | 138 | |
| Accrued distribution fee | | | 940 | | | | 700 | |
| Accrued expenses and other liabilities | | | 129 | | | | 74 | |
| Total Liabilities | | | 32,449 | | | | 4,293 | |
| | | | | | | | | |
| NET ASSETS | | $ | 1,235,894 | | | $ | 871,929 | |
| NET ASSETS CONSIST OF | | | | | | | | |
| Paid-in-capital | | $ | 968,778 | | | $ | 724,669 | |
| Accumulated net investment loss | | | (732 | ) | | | (471 | ) |
| Accumulated net realized gain (loss) on investments, written option contracts and foreign currency transactions | | | (101,944 | ) | | | (134,960 | ) |
| Net unrealized appreciation on investments, written option contracts and foreign currency translations | | | 369,792 | | | | 282,691 | |
| NET ASSETS | | $ | 1,235,894 | | | $ | 871,929 | |
| | | | | | | | | |
| SHARES OUTSTANDING, $0.001 par value | | | | | | | | |
| (Unlimited shares authorized) | | | 65,236 | | | | 42,715 | |
| | | | | | | | | |
| NET ASSET VALUE, REDEMPTION PRICE, AND OFFERING PRICE PER SHARE | | | | | | | | |
| (NET ASSETS/SHARES OUTSTANDING)* | | $ | 18.94 | | | $ | 20.41 | |
| * | Not in thousands, based on unrounded net assets and shares outstanding. |
See notes to financial statements.
| | | | MARSICO | | | | | | | | | | |
| | | | INTERNATIONAL | | | MARSICO | | | | | | MARSICO | |
| MARSICO | | | OPPORTUNITIES | | | FLEXIBLE | | | MARSICO | | | EMERGING | |
21st CENTURY FUND | | | FUND | | | CAPITAL FUND | | | GLOBAL FUND | | | MARKETS FUND | |
| | | | | | | | | | | | | | |
| | | | | | | | | | | | | | |
| | | | | | | | | | | | | | |
| | | | | | | | | | | | | | |
| $ | 803,687 | | | $ | 236,168 | | | $ | 635,540 | | | $ | 136,200 | | | $ | 10,145 | |
| | — | | | | 35 | | | | — | | | | — | | | | — | |
| | — | | | | 217 | | | | — | | | | 30 | | | | — | |
| | 1,552 | | | | 3,641 | | | | — | | | | 53 | | | | 244 | |
| | 171 | | | | 42 | | | | 2,093 | | | | 68 | | | | — | |
| | 191 | | | | 789 | | | | 794 | | | | 98 | | | | 4 | |
| | — | | | | — | | | | — | | | | — | | | | 22 | |
| | 502 | | | | 371 | | | | 659 | | | | 372 | | | | 113 | |
| | 806,103 | | | | 241,263 | | | | 639,086 | | | | 136,821 | | | | 10,528 | |
| | | | | | | | | | | | | | | | | | | |
| | | | | | | | | | | | | | | | | | | |
| | 3,445 | | | | 1,430 | | | | 9,788 | | | | 1,044 | | | | 192 | |
| | — | | | | — | | | | 2 | | | | — | | | | — | |
| | 1,174 | | | | 542 | | | | 302 | | | | 26 | | | | — | |
| | 573 | | | | 206 | | | | 428 | | | | 95 | | | | — | |
| | 120 | | | | 79 | | | | 79 | | | | 23 | | | | 3 | |
| | 486 | | | | 357 | | | | 594 | | | | 360 | | | | 28 | |
| | 107 | | | | 46 | | | | 17 | | | | 19 | | | | — | |
| | 407 | | | | 166 | | | | 220 | | | | 95 | | | | 1 | |
| | 94 | | | | 76 | | | | 16 | | | | 26 | | | | 9 | |
| | 6,406 | | | | 2,902 | | | | 11,446 | | | | 1,688 | | | | 233 | |
| | | | | | | | | | | | | | | | | | | |
| $ | 799,697 | | | $ | 238,361 | | | $ | 627,640 | | | $ | 135,133 | | | $ | 10,295 | |
| | | | | | | | | | | | | | | | | | | |
| $ | 1,240,561 | | | $ | 339,587 | | | $ | 553,954 | | | $ | 118,507 | | | $ | 10,661 | |
| | (1,988 | ) | | | (6,923 | ) | | | (1,186 | ) | | | (2,451 | ) | | | (32 | ) |
| | (626,597 | ) | | | (150,973 | ) | | | 22,351 | | | | (15,797 | ) | | | (727 | ) |
| | 187,721 | | | | 56,670 | | | | 52,521 | | | | 34,874 | | | | 393 | |
| $ | 799,697 | | | $ | 238,361 | | | $ | 627,640 | | | $ | 135,133 | | | $ | 10,295 | |
| | | | | | | | | | | | | | | | | | | |
| | | | | | | | | | | | | | | | | | | |
| | 53,221 | | | | 17,543 | | | | 43,612 | | | | 11,759 | | | | 1,070 | |
| | | | | | | | | | | | | | | | | | | |
| | | | | | | | | | | | | | | | | | | |
| $ | 15.03 | | | $ | 13.59 | | | $ | 14.39 | | | $ | 11.49 | | | $ | 9.62 | |
STATEMENTS OF OPERATIONS
FOR THE SIX-MONTHS ENDED March 31, 2011 (Unaudited)
| | | MARSICO | | | MARSICO | |
| (Amounts in thousands) | | FOCUS FUND | | | GROWTH FUND | |
| | | | | | | |
| INVESTMENT INCOME | | | | | | |
| Dividends (net of $0, $0, $0, $175, $19, $15, and $0, respectively, of non-reclaimable foreign withholding taxes) | | $ | 9,377 | | | $ | 6,686 | |
| Interest | | | 11 | | | | 2 | |
| Total Investment Income | | | 9,388 | | | | 6,688 | |
| | | | | | | | | |
| EXPENSES | | | | | | | | |
| Investment advisory fees | | | 5,596 | | | | 4,119 | |
| Distribution fees | | | 1,646 | | | | 1,211 | |
| Transfer agent fees and expenses | | | 872 | | | | 568 | |
| Printing and postage expenses | | | 205 | | | | 149 | |
| Trustees’ fees and expenses | | | 202 | (2) | | | 123 | (2) |
| Custody and fund accounting fees | | | 120 | | | | 96 | |
| Fund administration fees | | | 107 | | | | 98 | |
| Professional fees | | | 107 | | | | 81 | |
| Miscellaneous | | | 89 | | | | 49 | |
| Federal and state registration fees | | | 30 | | | | 21 | |
| Total Expenses | | | 8,974 | | | | 6,515 | |
| Less waiver of expenses and expenses paid indirectly | | | (1 | ) | | | (1 | ) |
| Net Expenses | | | 8,973 | | | | 6,514 | |
| | | | | | | | | |
| NET INVESTMENT INCOME (LOSS) | | | 415 | | | | 174 | |
| | | | | | | | | |
| REALIZED AND UNREALIZED GAIN/LOSS | | | | | | | | |
| Net realized gain (loss) on investments | | | 191,711 | | | | 107,896 | |
| Net realized gain on written option contracts | | | — | | | | — | |
| Net realized gain (loss) on foreign currency transactions | | | — | | | | — | |
| Change in unrealized appreciation/depreciation on investments, written options and foreign currency translations | | | 48,596 | | | | 63,623 | |
| | | | | | | | | |
| Net Gain (Loss) on Investments | | | 240,307 | | | | 171,519 | |
| | | | | | | | | |
NET INCREASE (DECREASE) IN NET ASSETS RESULTING FROM OPERATIONS | | $ | 240,722 | | | $ | 171,693 | |
| (1) | The Marsico Emerging Markets Fund commenced operations on December 31, 2010. |
| (2) | Amounts include trustees’ fees and expenses and the mark to market unrealized appreciation during the period for shares held in the Trustees’ Deferred Plan, as more fully described in Note 2(g) in the Notes to Financial Statements. |
| | | Trustees’ | | | | |
| | | Fees and | | | Unrealized | |
| | | Expenses* | | | Appreciation* | |
| Focus Fund | | $ | 77,937 | | | $ | 123,780 | |
| Growth Fund | | | 58,450 | | | | 64,518 | |
21st Century Fund | | | 47,319 | | | | 87,562 | |
| International Opportunities Fund | | | 22,191 | | | | 27,239 | |
| Flexible Capital Fund | | | 16,440 | | | | 95,746 | |
| Global Fund | | | 7,925 | | | | 47,391 | |
| Emerging Markets Fund | | | 365 | | | | 26 | |
See notes to financial statements.
| | | | MARSICO | | | | | | | | | | |
| | | | INTERNATIONAL | | | MARSICO | | | | | | MARSICO | |
| MARSICO | | | OPPORTUNITIES | | | FLEXIBLE | | | MARSICO | | | EMERGING | |
21st CENTURY FUND | | | FUND | | | CAPITAL FUND | | | GLOBAL FUND | | | MARKETS FUND(1) | |
| | | | | | | | | | | | | | |
| | | | | | | | | | | | | | |
| $ | 3,893 | | | $ | 1,635 | | | $ | 2,274 | | | $ | 520 | | | $ | 9 | |
| | 4 | | | | 1 | | | | 524 | | | | 1 | | | | — | |
| | 3,897 | | | | 1,636 | | | | 2,798 | | | | 521 | | | | 9 | |
| | | | | | | | | | | | | | | | | | | |
| | | | | | | | | | | | | | | | | | | |
| | 3,354 | | | | 1,471 | | | | 1,631 | | | | 551 | | | | 23 | |
| | 987 | | | | 433 | | | | 480 | | | | 162 | | | | 6 | |
| | 588 | | | | 312 | | | | 277 | | | | 80 | | | | 6 | |
| | 124 | | | | 58 | | | | 48 | | | | 21 | | | | 2 | |
| | 135 | (2) | | | 49 | (2) | | | 112 | (2) | | | 55 | (2) | | | — | (2) |
| | 93 | | | | 252 | | | | 80 | | | | 67 | | | | 26 | |
| | 93 | | | | 85 | | | | 74 | | | | 56 | | | | 13 | |
| | 65 | | | | 31 | | | | 23 | | | | 11 | | | | 23 | |
| | 35 | | | | 22 | | | | 5 | | | | 7 | | | | 3 | |
| | 16 | | | | 12 | | | | 26 | | | | 8 | | | | 6 | |
| | 5,490 | | | | 2,725 | | | | 2,756 | | | | 1,018 | | | | 108 | |
| | — | | | | — | | | | (636 | ) | | | — | | | | (67 | ) |
| | 5,490 | | | | 2,725 | | | | 2,120 | | | | 1,018 | | | | 41 | |
| | | | | | | | | | | | | | | | | | | |
| | (1,593 | ) | | | (1,089 | ) | | | 678 | | | | (497 | ) | | | (32 | ) |
| | | | | | | | | | | | | | | | | | | |
| | | | | | | | | | | | | | | | | | | |
| | 81,014 | | | | 43,856 | | | | 24,018 | | | | 10,142 | | | | (561 | ) |
| | — | | | | — | | | | 40 | | | | — | | | | — | |
| | (278 | ) | | | 8,159 | | | | 90 | | | | 609 | | | | (166 | ) |
| | 72,203 | | | | (18,663 | ) | | | 36,070 | | | | 9,967 | | | | 393 | |
| | | | | | | | | | | | | | | | | | | |
| | 152,939 | | | | 33,352 | | | | 60,218 | | | | 20,718 | | | | (334 | ) |
| | | | | | | | | | | | | | | | | | | |
| $ | 151,346 | | | $ | 32,263 | | | $ | 60,896 | | | $ | 20,221 | | | $ | (366 | ) |
STATEMENTS OF CHANGES IN NET ASSETS
| | | MARSICO | | | MARSICO | | | MARSICO 21st | |
| | | FOCUS FUND | | | GROWTH FUND | | | CENTURY FUND | |
| | | | | | | | | | | | | | | | | | | |
| | | Six-Months | | | | | | Six-Months | | | | | | Six-Months | | | | |
| | | Ended 3/31/11 | | | Year Ended | | | Ended 3/31/11 | | | Year Ended | | | Ended 3/31/11 | | | Year Ended | |
| (Amounts in thousands) | | (Unaudited) | | | 9/30/10 | | | (Unaudited) | | | 9/30/10 | | | (Unaudited) | | | 9/30/10 | |
| | | | | | | | | | | | | | | | | | | |
| OPERATIONS: | | | | | | | | | | | | | | | | | | |
| Net investment income (loss) | | $ | 415 | | | $ | (1,087 | ) | | $ | 174 | | | $ | 398 | | | $ | (1,593 | ) | | $ | (5,076 | ) |
| Net realized gain (loss) on investments | | | 191,711 | | | | 266,464 | | | | 107,896 | | | | 150,487 | | | | 81,014 | | | | 186,490 | |
| Net realized gain on written option contracts | | | — | | | | — | | | | — | | | | — | | | | — | | | | — | |
| Net realized gain (loss) on foreign currency transactions | | | — | | | | (34 | ) | | | — | | | | (1 | ) | | | (278 | ) | | | 3,484 | |
| Change in unrealized appreciation/depreciation on investments, written options and foreign currency translations | | | 48,596 | | | | (91,316 | ) | | | 63,623 | | | | (31,263 | ) | | | 72,203 | | | | (123,379 | ) |
| | | | | | | | | | | | | | | | | | | | | | | | | |
| Net increase (decrease) in net assets resulting from operations | | | 240,722 | | | | 174,027 | | | | 171,693 | | | | 119,621 | | | | 151,346 | | | | 61,519 | |
| | | | | | | | | | | | | | | | | | | | | | | | | |
| DISTRIBUTIONS: | | | | | | | | | | | | | | | | | | | | | | | | |
| Net investment income | | | — | | | | (3,909 | ) | | | (473 | ) | | | (5,169 | ) | | | — | | | | — | |
| Net realized gains | | | — | | | | — | | | | — | | | | — | | | | — | | | | — | |
| | | | | | | | | | | | | | | | | | | | | | | | | |
| Total distributions | | | — | | | | (3,909 | ) | | | (473 | ) | | | (5,169 | ) | | | — | | | | — | |
| | | | | | | | | | | | | | | | | | | | | | | | | |
| CAPITAL SHARE TRANSACTIONS: | | | | | | | | | | | | | | | | | | | | | | | | |
| Proceeds from sale of shares | | | 101,552 | | | | 406,466 | | | | 134,225 | | | | 147,976 | | | | 48,801 | | | | 78,025 | |
| Proceeds from reinvestment of distributions | | | — | | | | 3,863 | | | | 459 | | | | 5,054 | | | | — | | | | — | |
| Redemption fees | | | 17 | | | | 12 | | | | 32 | | | | 91 | | | | 3 | | | | 10 | |
| Redemption of shares | | | (558,274 | ) | | | (1,129,623 | ) | | | (317,060 | ) | | | (577,751 | ) | | | (157,891 | ) | | | (303,792 | ) |
| | | | | | | | | | | | | | | | | | | | | | | | | |
| Net increase (decrease) from capital share transactions | | | (456,705 | ) | | | (719,282 | ) | | | (182,344 | ) | | | (424,630 | ) | | | (109,087 | ) | | | (225,757 | ) |
| | | | | | | | | | | | | | | | | | | | | | | | | |
| TOTAL INCREASE (DECREASE) IN NET ASSETS | | | (215,983 | ) | | | (549,164 | ) | | | (11,124 | ) | | | (310,178 | ) | | | 42,259 | | | | (164,238 | ) |
| | | | | | | | | | | | | | | | | | | | | | | | | |
| NET ASSETS: | | | | | | | | | | | | | | | | | | | | | | | | |
| Beginning of Period | | | 1,451,877 | | | | 2,001,041 | | | | 883,053 | | | | 1,193,231 | | | | 757,438 | | | | 921,676 | |
| | | | | | | | | | | | | | | | | | | | | | | | | |
| End of Period | | $ | 1,235,894 | | | $ | 1,451,877 | | | $ | 871,929 | | | $ | 883,053 | | | $ | 799,697 | | | $ | 757,438 | |
| | | | | | | | | | | | | | | | | | | | | | | | | |
| Undistributed net investment income (accumulated net investment loss) | | $ | (732 | ) | | $ | (1,147 | ) | | $ | (471 | ) | | $ | (172 | ) | | $ | (1,988 | ) | | $ | (395 | ) |
| | | | | | | | | | | | | | | | | | | | | | | | | |
| TRANSACTIONS IN SHARES: | | | | | | | | | | | | | | | | | | | | | | | | |
| Shares sold | | | 5,675 | | | | 26,472 | | | | 7,109 | | | | 9,009 | | | | 3,398 | | | | 6,323 | |
| Shares issued in reinvestment of distributions | | | — | | | | 257 | | | | 24 | | | | 317 | | | | — | | | | — | |
| Shares redeemed | | | (32,391 | ) | | | (73,945 | ) | | | (16,244 | ) | | | (35,384 | ) | | | (11,365 | ) | | | (24,890 | ) |
| | | | | | | | | | | | | | | | | | | | | | | | | |
| NET INCREASE (DECREASE) | | | (26,716 | ) | | | (47,216 | ) | | | (9,111 | ) | | | (26,058 | ) | | | (7,967 | ) | | | (18,567 | ) |
| * | Commencement of operations. |
See notes to financial statements.
| | | | | | | | | | | |
| | | | | | | | | | MARSICO | |
| MARSICO | | | MARSICO | | | | | | EMERGING | |
| INTERNATIONAL | | | FLEXIBLE | | | MARSICO | | | MARKETS | |
| OPPORTUNITIES FUND | | | CAPITAL FUND | | | GLOBAL FUND | | | FUND | |
| | | | | | | | | | | | | | | | | | | | |
| Six-Months | | | | | | Six-Months | | | | | | Six-Months | | | | | | 12/31/10* to | |
| Ended 3/31/11 | | | Year Ended | | | Ended 3/31/11 | | | Year Ended | | | Ended 3/31/11 | | | Year Ended | | | 3/31/11 | |
| (Unaudited) | | | 9/30/10 | | | (Unaudited) | | | 9/30/10 | | | (Unaudited) | | | 9/30/10 | | | (Unaudited) | |
| | | | | | | | | | | | | | | | | | | | |
| | | | | | | | | | | | | | | | | | | | |
| $ | (1,089 | ) | | $ | 1,291 | | | $ | 678 | | | $ | 727 | | | $ | (497 | ) | | $ | (627 | ) | | $ | (32 | ) |
| | 43,856 | | | | 31,713 | | | | 24,018 | | | | 4,987 | | | | 10,142 | | | | 21,046 | | | | (561 | ) |
| | — | | | | — | | | | 40 | | | | — | | | | — | | | | — | | | | — | |
| | 8,159 | | | | 1,978 | | | | 90 | | | | (180 | ) | | | 609 | | | | 5 | | | | (166 | ) |
| | | | | | | | | | | | | | | | | | | | | | | | | | | |
| | (18,663 | ) | | | (10,812 | ) | | | 36,070 | | | | 10,612 | | | | 9,967 | | | | (3,921 | ) | | | 393 | |
| | | | | | | | | | | | | | | | | | | | | | | | | | | |
| | 32,263 | | | | 24,170 | | | | 60,896 | | | | 16,146 | | | | 20,221 | | | | 16,503 | | | | (366 | ) |
| | | | | | | | | | | | | | | | | | | | | | | | | | | |
| | | | | | | | | | | | | | | | | | | | | | | | | | | |
| | (6,560 | ) | | | (2,073 | ) | | | (2,289 | ) | | | (1,302 | ) | | | (1,099 | ) | | | (721 | ) | | | — | |
| | — | | | | — | | | | (677 | ) | | | — | | | | — | | | | — | | | | — | |
| | | | | | | | | | | | | | | | | | | | | | | | | | | |
| | (6,560 | ) | | | (2,073 | ) | | | (2,966 | ) | | | (1,302 | ) | | | (1,099 | ) | | | (721 | ) | | | — | |
| | | | | | | | | | | | | | | | | | | | | | | | | | | |
| | | | | | | | | | | | | | | | | | | | | | | | | | | |
| | 44,610 | | | | 84,957 | | | | 503,002 | | | | 96,849 | | | | 26,214 | | | | 26,530 | | | | 10,762 | |
| | 6,365 | | | | 2,034 | | | | 2,776 | | | | 1,293 | | | | 1,044 | | | | 718 | | | | — | |
| | 14 | | | | 34 | | | | 57 | | | | 10 | | | | 2 | | | | 5 | | | | — | |
| | (197,347 | ) | | | (201,032 | ) | | | (68,470 | ) | | | (11,982 | ) | | | (27,350 | ) | | | (36,083 | ) | | | (101 | ) |
| | | | | | | | | | | | | | | | | | | | | | | | | | | |
| | (146,358 | ) | | | (114,007 | ) | | | 437,365 | | | | 86,170 | | | | (90 | ) | | | (8,830 | ) | | | 10,661 | |
| | | | | | | | | | | | | | | | | | | | | | | | | | | |
| | (120,655 | ) | | | (91,910 | ) | | | 495,295 | | | | 101,014 | | | | 19,032 | | | | 6,952 | | | | 10,295 | |
| | | | | | | | | | | | | | | | | | | | | | | | | | | |
| | | | | | | | | | | | | | | | | | | | | | | | | | | |
| | 359,016 | | | | 450,926 | | | | 132,345 | | | | 31,331 | | | | 116,101 | | | | 109,149 | | | | — | |
| | | | | | | | | | | | | | | | | | | | | | | | | | | |
| $ | 238,361 | | | $ | 359,016 | | | $ | 627,640 | | | $ | 132,345 | | | $ | 135,133 | | | $ | 116,101 | | | $ | 10,295 | |
| | | | | | | | | | | | | | | | | | | | | | | | | | | |
| $ | (6,923 | ) | | $ | 726 | | | $ | (1,186 | ) | | $ | 425 | | | $ | (2,451 | ) | | $ | (855 | ) | | $ | (32 | ) |
| | | | | | | | | | | | | | | | | | | | | | | | | | | |
| | | | | | | | | | | | | | | | | | | | | | | | | | | |
| | 3,379 | | | | 7,276 | | | | 37,302 | | | | 8,807 | | | | 2,404 | | | | 2,935 | | | | 1,081 | |
| | 488 | | | | 174 | | | | 207 | | | | 131 | | | | 96 | | | | 82 | | | | — | |
| | (14,896 | ) | | | (16,887 | ) | | | (4,951 | ) | | | (1,129 | ) | | | (2,469 | ) | | | (3,997 | ) | | | (11 | ) |
| | | | | | | | | | | | | | | | | | | | | | | | | | | |
| | (11,029 | ) | | | (9,437 | ) | | | 32,558 | | | | 7,809 | | | | 31 | | | | (980 | ) | | | 1,070 | |
| | | MARSICO | |
| | | FOCUS FUND | |
| | | Six-Months | | | | | | | | | | | | | | | | |
| | | Ended | | | Year | | | Year | | | Year | | | Year | | | Year | |
| For a Fund Share Outstanding | | 3/31/11 | | | Ended | | | Ended | | | Ended | | | Ended | | | Ended | |
| Throughout the Period | | (Unaudited) | | | 9/30/10 | | | 9/30/09 | | | 9/30/08 | | | 9/30/07 | | | 9/30/06 | |
| | | | | | | | | | | | | | | | | | | |
| Net Asset Value, Beginning of Period | | $ | 15.79 | | | $ | 14.38 | | | $ | 15.43 | | | $ | 21.75 | | | $ | 18.19 | | | $ | 17.45 | |
| | | | | | | | | | | | | | | | | | | | | | | | | |
| Income from Investment Operations: | | | | | | | | | | | | | | | | | | | | | | | | |
| Net investment income (loss) | | | — | (1) | | | (0.01 | ) | | | 0.04 | | | | 0.08 | | | | (0.04 | ) | | | (0.02 | ) |
| Net realized and unrealized gains (losses) on investments | | | 3.15 | | | | 1.45 | | | | (0.99 | ) | | | (4.60 | ) | | | 4.09 | | | | 0.76 | |
| | | | | | | | | | | | | | | | | | | | | | | | | |
| Total from investment operations | | | 3.15 | | | | 1.44 | | | | (0.95 | ) | | | (4.52 | ) | | | 4.05 | | | | 0.74 | |
| | | | | | | | | | | | | | | | | | | | | | | | | |
| Distributions & Other: | | | | | | | | | | | | | | | | | | | | | | | | |
| Net investment income | | | — | | | | (0.03 | ) | | | (0.09 | ) | | | — | | | | (0.02 | ) | | | — | |
| Tax return of capital | | | — | | | | — | | | | — | | | | — | | | | — | | | | — | |
| Net realized gains | | | — | | | | — | | | | (0.01 | ) | | | (1.80 | ) | | | (0.47 | ) | | | — | |
| Redemption fees [See Note 2(h)] | | | — | (1) | | | — | (1) | | | — | (1) | | | — | (1) | | | — | (1) | | | — | (1) |
| | | | | | | | | | | | | | | | | | | | | | | | | |
| Total distributions and other | | | — | | | | (0.03 | ) | | | (0.10 | ) | | | (1.80 | ) | | | (0.49 | ) | | | — | |
| | | | | | | | | | | | | | | | | | | | | | | | | |
| Net Asset Value, End of Period | | $ | 18.94 | | | $ | 15.79 | | | $ | 14.38 | | | $ | 15.43 | | | $ | 21.75 | | | $ | 18.19 | |
| | | | | | | | | | | | | | | | | | | | | | | | | |
| Total Return | | | 19.95 | %(2) | | | 10.02 | % | | | (5.98 | )% | | | (22.69 | )% | | | 22.65 | % | | | 4.24 | % |
| | | | | | | | | | | | | | | | | | | | | | | | | |
| Supplemental Data and Ratios: | | | | | | | | | | | | | | | | | | | | | | | | |
| | | | | | | | | | | | | | | | | | | | | | | | | |
| Net assets, end of Period (000s) | | $ | 1,235,894 | | | $ | 1,451,877 | | | $ | 2,001,041 | | | $ | 3,430,813 | | | $ | 5,051,662 | | | $ | 4,616,455 | |
| | | | | | | | | | | | | | | | | | | | | | | | | |
| Ratio of expenses to average net assets, less waivers and before expenses paid indirectly, plus reimbursements of previously waived expenses | | | 1.36 | %(3) | | | 1.33 | % | | | 1.31 | % | | | 1.21 | % | | | 1.23 | % | | | 1.24 | % |
| | | | | | | | | | | | | | | | | | | | | | | | | |
| Ratio of net investment income (loss) to average net assets, net of waivers, reimbursements of previously waived expenses and expenses paid indirectly | | | 0.06 | %(3) | | | (0.06 | )% | | | 0.27 | % | | | 0.41 | % | | | (0.20 | )% | | | (0.13 | )% |
| | | | | | | | | | | | | | | | | | | | | | | | | |
| Ratio of expenses to average net assets, before waivers, reimbursements of previously waived expenses and expenses paid indirectly | | | 1.36 | %(3) | | | 1.33 | % | | | 1.31 | % | | | 1.21 | % | | | 1.23 | % | | | 1.24 | % |
| | | | | | | | | | | | | | | | | | | | | | | | | |
| Ratio of net investment income (loss) to average net assets, before waivers, reimbursements of previously waived expenses and expenses paid indirectly | | | 0.06 | %(3) | | | (0.06 | )% | | | 0.27 | % | | | 0.41 | % | | | (0.21 | )% | | | (0.15 | )% |
| | | | | | | | | | | | | | | | | | | | | | | | | |
| Portfolio turnover rate | | | 36 | %(2) | | | 85 | % | | | 90 | % | | | 78 | % | | | 69 | % | | | 80 | % |
| (4) | Portfolio turnover is greater than most funds due to the investment style of the Fund. |
See notes to financial statements.
| | | | | | | | MARSICO | | | | | | | | | | | | | | | MARSICO | | | | |
| | | | | | | | GROWTH FUND | | | | | | | | | | | | | | | 21st CENTURY FUND | | | | |
| | Six-Months | | | | | | | | | | | | | | | | | | Six-Months | | | | | | | | | | | | | | | | |
| | Ended | | | Year | | | Year | | | Year | | | Year | | | Year | | | Ended | | | Year | | | Year | | | Year | | | Year | | | Year | |
| | 3/31/11 | | | Ended | | | Ended | | | Ended | | | Ended | | | Ended | | | 3/31/11 | | | Ended | | | Ended | | | Ended | | | Ended | | | Ended | |
| | (Unaudited) | | | 9/30/10 | | | 9/30/09 | | | 9/30/08 | | | 9/30/07 | | | 9/30/06 | | | (Unaudited) | | | 9/30/10 | | | 9/30/09 | | | 9/30/08 | | | 9/30/07 | | | 9/30/06 | |
| | | | | | | | | | | | | | | | | | | | | | | | | | | | | | | | | | | | |
| | $ | 17.04 | | | $ | 15.32 | | | $ | 16.73 | | | $ | 23.07 | | | $ | 18.61 | | | $ | 18.09 | | | $ | 12.38 | | | $ | 11.56 | | | $ | 12.86 | | | $ | 18.07 | | | $ | 13.89 | | | $ | 12.07 | |
| | | | | | | | | | | | | | | | | | | | | | | | | | | | | | | | | | | | | | | | | | | | | | | | |
| | | | | | | | | | | | | | | | | | | | | | | | | | | | | | | | | | | | | | | | | | | | | | | | |
| | | — | (1) | | | 0.01 | | | | 0.07 | | | | 0.07 | | | | (0.05 | ) | | | (0.04 | ) | | | (0.03 | ) | | | (0.08 | ) | | | — | (1) | | | 0.01 | | | | 0.05 | | | | 0.02 | |
| | | 3.38 | | | | 1.78 | | | | (1.38 | ) | | | (5.69 | ) | | | 4.51 | | | | 0.56 | | | | 2.68 | | | | 0.90 | | | | (1.27 | ) | | | (4.48 | ) | | | 4.26 | | | | 1.80 | |
| | | | | | | | | | | | | | | | | | | | | | | | | | | | | | | | | | | | | | | | | | | | | | | | |
| | | 3.38 | | | | 1.79 | | | | (1.31 | ) | | | (5.62 | ) | | | 4.46 | | | | 0.52 | | | | 2.65 | | | | 0.82 | | | | (1.27 | ) | | | (4.47 | ) | | | 4.31 | | | | 1.82 | |
| | | | | | | | | | | | | | | | | | | | | | | | | | | | | | | | | | | | | | | | | | | | | | | | |
| | | | | | | | | | | | | | | | | | | | | | | | | | | | | | | | | | | | | | | | | | | | | | | | |
| | | (0.01 | ) | | | (0.07 | ) | | | (0.09 | ) | | | — | | | | — | | | | — | | | | — | | | | — | | | | (0.01 | ) | | | — | | | | (0.13 | ) | | | — | (1) |
| | | — | | | | — | | | | — | | | | — | | | | — | | | | — | | | | — | | | | — | | | | (0.02 | ) | | | — | | | | — | | | | — | |
| | | — | | | | — | | | | (0.01 | ) | | | (0.72 | ) | | | — | | | | — | | | | — | | | | — | | | | — | | | | (0.74 | ) | | | — | (1) | | | — | |
| | | — | (1) | | | — | (1) | | | — | (1) | | | — | (1) | | | — | (1) | | | — | (1) | | | — | (1) | | | — | (1) | | | — | (1) | | | — | (1) | | | — | (1) | | | — | (1) |
| | | | | | | | | | | | | | | | | | | | | | | | | | | | | | | | | | | | | | | | | | | | | | | | |
| | | (0.01 | ) | | | (0.07 | ) | | | (0.10 | ) | | | (0.72 | ) | | | — | | | | — | | | | — | | | | — | | | | (0.03 | ) | | | (0.74 | ) | | | (0.13 | ) | | | — | |
| | | | | | | | | | | | | | | | | | | | | | | | | | | | | | | | | | | | | | | | | | | | | | | | |
| | $ | 20.41 | | | $ | 17.04 | | | $ | 15.32 | | | $ | 16.73 | | | $ | 23.07 | | | $ | 18.61 | | | $ | 15.03 | | | $ | 12.38 | | | $ | 11.56 | | | $ | 12.86 | | | $ | 18.07 | | | $ | 13.89 | |
| | | | | | | | | | | | | | | | | | | | | | | | | | | | | | | | | | | | | | | | | | | | | | | | |
| | | 19.83 | %(2) | | | 11.75 | % | | | (7.74 | )% | | | (25.14 | )% | | | 23.97 | % | | | 2.87 | % | | | 21.41 | %(2) | | | 7.09 | % | | | (9.79 | )% | | | (25.83 | )% | | | 31.25 | % | | | 15.10 | % |
| | | | | | | | | | | | | | | | | | | | | | | | | | | | | | | | | | | | | | | | | | | | | | | | |
| | | | | | | | | | | | | | | | | | | | | | | | | | | | | | | | | | | | | | | | | | | | | | | | |
| | | | | | | | | | | | | | | | | | | | | | | | | | | | | | | | | | | | | | | | | | | | | | | | |
| | $ | 871,929 | | | $ | 883,053 | | | $ | 1,193,231 | | | $ | 2,097,571 | | | $ | 3,087,904 | | | $ | 2,550,641 | | | $ | 799,697 | | | $ | 757,438 | | | $ | 921,676 | | | $ | 1,853,435 | | | $ | 2,467,126 | | | $ | 871,459 | |
| | | | | | | | | | | | | | | | | | | | | | | | | | | | | | | | | | | | | | | | | | | | | | | | |
| | | 1.34 | %(3) | | | 1.33 | % | | | 1.30 | % | | | 1.24 | % | | | 1.24 | % | | | 1.26 | % | | | 1.39 | %(3) | | | 1.37 | % | | | 1.37 | % | | | 1.29 | % | | | 1.31 | % | | | 1.33 | % |
| | | | | | | | | | | | | | | | | | | | | | | | | | | | | | | | | | | | | | | | | | | | | | | | |
| | | 0.04 | %(3) | | | 0.04 | % | | | 0.42 | % | | | 0.33 | % | | | (0.25 | )% | | | (0.26 | )% | | | (0.42 | )%(3) | | | (0.60 | )% | | | 0.06 | % | | | 0.07 | % | | | 0.43 | % | | | 0.20 | % |
| | | | | | | | | | | | | | | | | | | | | | | | | | | | | | | | | | | | | | | | | | | | | | | | |
| | | 1.34 | %(3) | | | 1.33 | % | | | 1.30 | % | | | 1.24 | % | | | 1.24 | % | | | 1.26 | % | | | 1.39 | %(3) | | | 1.37 | % | | | 1.37 | % | | | 1.29 | % | | | 1.31 | % | | | 1.33 | % |
| | | | | | | | | | | | | | | | | | | | | | | | | | | | | | | | | | | | | | | | | | | | | | | | |
| | | 0.04 | %(3) | | | 0.04 | % | | | 0.41 | % | | | 0.33 | % | | | (0.25 | )% | | | (0.27 | )% | | | (0.42 | )%(3) | | | (0.60 | )% | | | 0.06 | % | | | 0.07 | % | | | 0.43 | % | | | 0.20 | % |
| | | | | | | | | | | | | | | | | | | | | | | | | | | | | | | | | | | | | | | | | | | | | | | | |
| | | 34 | %(2) | | | 67 | % | | | 77 | % | | | 72 | % | | | 53 | % | | | 59 | % | | | 33 | %(2)(4) | | | 100 | %(4) | | | 135 | %(4) | | | 143 | %(4) | | | 105 | %(4) | | | 136 | %(4) |
FINANCIAL HIGHLIGHTS
| | | MARSICO | |
| | | INTERNATIONAL OPPORTUNITIES FUND | |
| | | Six-Months | | | | | | | | | | | | | | | | |
| | | Ended | | | Year | | | Year | | | Year | | | Year | | | Year | |
| For a Fund Share Outstanding | | 3/31/11 | | | Ended | | | Ended | | | Ended | | | Ended | | | Ended | |
| Throughout the Period | | (Unaudited) | | | 9/30/10 | | | 9/30/09 | | | 9/30/08 | | | 9/30/07 | | | 9/30/06 | |
| | | | | | | | | | | | | | | | | | | |
| Net Asset Value, Beginning of Period | | $ | 12.57 | | | $ | 11.86 | | | $ | 12.27 | | | $ | 20.10 | | | $ | 15.81 | | | $ | 13.00 | |
| | | | | | | | | | | | | | | | | | | | | | | | | |
| Income from Investment Operations: | | | | | | | | | | | | | | | | | | | | | | | | |
| Net investment income (loss) | | | (0.17 | ) | | | 0.04 | | | | 0.06 | | | | 0.16 | | | | 0.16 | | | | 0.04 | |
| Net realized and unrealized gains (losses) on investments | | | 1.44 | | | | 0.72 | | | | (0.33 | ) | | | (5.66 | ) | | | 4.81 | | | | 2.87 | |
| | | | | | | | | | | | | | | | | | | | | | | | | |
| Total from investment operations | | | 1.27 | | | | 0.76 | | | | (0.27 | ) | | | (5.50 | ) | | | 4.97 | | | | 2.91 | |
| | | | | | | | | | | | | | | | | | | | | | | | | |
| Distributions & Other: | | | | | | | | | | | | | | | | | | | | | | | | |
| Net investment income | | | (0.25 | ) | | | (0.05 | ) | | | (0.14 | ) | | | (0.18 | ) | | | (0.03 | ) | | | (0.10 | ) |
| Net realized gains | | | — | | | | — | | | | — | | | | (2.15 | ) | | | (0.65 | ) | | | — | |
| Redemption fees [See Note 2(h)] | | | — | (1) | | | — | (1) | | | — | (1) | | | — | (1) | | | — | (1) | | | — | (1) |
| | | | | | | | | | | | | | | | | | | | | | | | | |
| Total distributions and other | | | (0.25 | ) | | | (0.05 | ) | | | (0.14 | ) | | | (2.33 | ) | | | (0.68 | ) | | | (0.10 | ) |
| | | | | | | | | | | | | | | | | | | | | | | | | |
| Net Asset Value, End of Period | | $ | 13.59 | | | $ | 12.57 | | | $ | 11.86 | | | $ | 12.27 | | | $ | 20.10 | | | $ | 15.81 | |
| | | | | | | | | | | | | | | | | | | | | | | | | |
| Total Return | | | 10.18 | %(2) | | | 6.48 | % | �� | | (1.68 | )% | | | (30.95 | )% | | | 32.42 | % | | | 22.46 | % |
| | | | | | | | | | | | | | | | | | | | | | | | | |
| Supplemental Data and Ratios: | | | | | | | | | | | | | | | | | | | | | | | | |
| | | | | | | | | | | | | | | | | | | | | | | | | |
| Net assets, end of Period (000s) | | $ | 238,361 | | | $ | 359,016 | | | $ | 450,926 | | | $ | 597,603 | | | $ | 822,073 | | | $ | 571,684 | |
| | | | | | | | | | | | | | | | | | | | | | | | | |
| Ratio of expenses to average net assets, less waivers and before expenses paid indirectly, plus reimbursements of previously waived expenses | | | 1.57 | %(3) | | | 1.52 | % | | | 1.48 | % | | | 1.35 | % | | | 1.37 | % | | | 1.44 | % |
| | | | | | | | | | | | | | | | | | | | | | | | | |
| Ratio of net investment income (loss) to average net assets, net of waivers, reimbursements of previously waived expenses and expenses paid indirectly | | | (0.63 | )%(3) | | | 0.31 | % | | | 0.54 | % | | | 1.00 | % | | | 0.92 | % | | | 0.33 | % |
| | | | | | | | | | | | | | | | | | | | | | | | | |
| Ratio of expenses to average net assets, before waivers, reimbursements of previously waived expenses and expenses paid indirectly | | | 1.57 | %(3) | | | 1.52 | % | | | 1.48 | % | | | 1.35 | % | | | 1.37 | % | | | 1.41 | % |
| | | | | | | | | | | | | | | | | | | | | | | | | |
| Ratio of net investment income (loss) to average net assets, before waivers, reimbursements of previously waived expenses and expenses paid indirectly | | | (0.63 | )%(3) | | | 0.31 | % | | | 0.54 | % | | | 1.00 | % | | | 0.92 | % | | | 0.36 | % |
| | | | | | | | | | | | | | | | | | | | | | | | | |
| Portfolio turnover rate | | | 52 | %(2)(4) | | | 134 | %(4) | | | 108 | %(4) | | | 115 | %(4) | | | 125 | %(4) | | | 101 | %(4) |
| * | Commencement of operations. |
| (4) | Portfolio turnover is greater than most funds due to the investment style of the Fund. |
See notes to financial statements.
| | | | �� | | | | | | | | | | | | | | | | | | | | | | | | | | | | MARSICO | |
| | | | | | | | MARSICO | | | | | | | | | | | | | | | MARSICO | | | | | | | | | EMERGING | |
| | | | | FLEXIBLE CAPITAL FUND | | | | | | | | | GLOBAL FUND | | | | | | MARKETS FUND | |
| | Six-Months | | | | | | | | | | | | | | | Six-Months | | | | | | | | | | | | | | | | |
| | Ended | | | Year | | | Year | | | Year | | | 12/29/06* | | | Ended | | | Year | | | Year | | | Year | | | 6/29/07* | | | 12/31/10* | |
| | 3/31/11 | | | Ended | | | Ended | | | Ended | | | to | | | 3/31/11 | | | Ended | | | Ended | | | Ended | | | to | | | to 3/31/11 | |
| | (Unaudited) | | | 9/30/10 | | | 9/30/09 | | | 9/30/08 | | | 9/30/07 | | | (Unaudited) | | | 9/30/10 | | | 9/30/09 | | | 9/30/08 | | | 9/30/07 | | | (Unaudited) | |
| | | | | | | | | | | | | | | | | | | | | | | | | | | | | | | | | | | | | | | | | | | | |
| | $ | 11.97 | | | $ | 9.65 | | | $ | 8.74 | | | $ | 11.32 | | | $ | 10.00 | | | $ | 9.90 | | | $ | 8.59 | | | $ | 8.87 | | | $ | 11.46 | | | $ | 10.00 | | | $ | 10.00 | |
| | | | | | | | | | | | | | | | | | | | | | | | | | | | | | | | | | | | | | | | | | | | |
| | | | | | | | | | | | | | | | | | | | | | | | | | | | | | | | | | | | | | | | | | | | |
| | | 0.03 | | | | 0.27 | | | | 0.06 | | | | 0.14 | | | | 0.22 | | | | (0.05 | ) | | | (0.05 | ) | | | 0.04 | | | | 0.08 | | | | 0.02 | | | | (0.03 | ) |
| | | 2.51 | | | | 2.42 | | | | 0.93 | | | | (1.93 | ) | | | 1.10 | | | | 1.73 | | | | 1.42 | | | | (0.24 | ) | | | (2.46 | ) | | | 1.44 | | | | (0.35 | ) |
| | | | | | | | | | | | | | | | | | | | | | | | | | | | | | | | | | | | | | | | | | | | |
| | | 2.54 | | | | 2.69 | | | | 0.99 | | | | (1.79 | ) | | | 1.32 | | | | 1.68 | | | | 1.37 | | | | (0.20 | ) | | | (2.38 | ) | | | 1.46 | | | | (0.38 | ) |
| | | | | | | | | | | | | | | | | | | | | | | | | | | | | | | | | | | | | | | | | | | | |
| | | | | | | | | | | | | | | | | | | | | | | | | | | | | | | | | | | | | | | | | | | | |
| | | (0.09 | ) | | | (0.37 | ) | | | (0.08 | ) | | | (0.35 | ) | | | — | | | | (0.09 | ) | | | (0.06 | ) | | | (0.08 | ) | | | (0.05 | ) | | | — | | | | — | |
| | | (0.03 | ) | | | — | | | | — | | | | (0.44 | ) | | | — | | | | — | | | | — | | | | — | | | | (0.17 | ) | | | — | | | | — | |
| | | — | (1) | | | — | (1) | | | — | (1) | | | — | (1) | | | — | (1) | | | — | (1) | | | — | (1) | | | — | (1) | | | 0.01 | | | | — | (1) | | | — | (1) |
| | | | | | | | | | | | | | | | | | | | | | | | | | | | | | | | | | | | | | | | | | | | |
| | | (0.12 | ) | | | (0.37 | ) | | | (0.08 | ) | | | (0.79 | ) | | | — | | | | (0.09 | ) | | | (0.06 | ) | | | (0.08 | ) | | | (0.21 | ) | | | — | | | | — | |
| | | | | | | | | | | | | | | | | | | | | | | | | | | | | | | | | | | | | | | | | | | | |
| | $ | 14.39 | | | $ | 11.97 | | | $ | 9.65 | | | $ | 8.74 | | | $ | 11.32 | | | $ | 11.49 | | | $ | 9.90 | | | $ | 8.59 | | | $ | 8.87 | | | $ | 11.46 | | | $ | 9.62 | |
| | | | | | | | | | | | | | | | | | | | | | | | | | | | | | | | | | | | | | | | | | | | |
| | | 21.32 | %(2) | | | 28.68 | % | | | 11.68 | % | | | (17.10 | )% | | | 13.20 | %(2) | | | 17.02 | %(2) | | | 16.01 | % | | | (1.93 | )% | | | (21.13 | )% | | | 14.60 | %(2) | | | (3.80 | )%(2) |
| | | | | | | | | | | | | | | | | | | | | | | | | | | | | | | | | | | | | | | | | | | | |
| | | | | | | | | | | | | | | | | | | | | | | | | | | | | | | | | | | | | | | | | | | | |
| | | | | | | | | | | | | | | | | | | | | | | | | | | | | | | | | | | | | | | | | | | | |
| | $ | 627,640 | | | $ | 132,345 | | | $ | 31,331 | | | $ | 14,461 | | | $ | 24,741 | | | $ | 135,133 | | | $ | 116,101 | | | $ | 109,149 | | | $ | 82,543 | | | $ | 31,477 | | | $ | 10,295 | |
| | | | | | | | | | | | | | | | | | | | | | | | | | | | | | | | | | | | | | | | | | | | |
| | | 1.11 | %(3) | | | 0.75 | % | | | 0.75 | % | | | 0.75 | % | | | 1.22 | %(3) | | | 1.57 | %(3) | | | 1.54 | % | | | 1.40 | % | | | 0.75 | % | | | 0.75 | %(3) | | | 1.75 | %(3) |
| | | | | | | | | | | | | | | | | | | | | | | | | | | | | | | | | | | | | | | | | | | | |
| | | 0.35 | %(3) | | | 1.33 | % | | | 1.44 | % | | | 1.15 | % | | | 2.62 | %(3) | | | (0.77 | )%(3) | | | (0.57 | )% | | | 0.52 | % | | | 0.88 | % | | | 1.06 | %(3) | | | (1.37 | )%(3) |
| | | | | | | | | | | | | | | | | | | | | | | | | | | | | | | | | | | | | | | | | | | | |
| | | 1.44 | %(3) | | | 1.73 | % | | | 2.84 | % | | | 1.71 | % | | | 2.47 | %(3) | | | 1.57 | %(3) | | | 1.54 | % | | | 1.58 | % | | | 1.49 | % | | | 4.48 | %(3) | | | 4.62 | %(3) |
| | | | | | | | | | | | | | | | | | | | | | | | | | | | | | | | | | | | | | | | | | | | |
| | | 0.02 | %(3) | | | 0.35 | % | | | (0.65 | )% | | | 0.19 | % | | | 1.37 | %(3) | | | (0.77 | )%(3) | | | (0.57 | )% | | | 0.34 | % | | | 0.14 | % | | | (2.67 | )%(3) | | | (4.24 | )%(3) |
| | | | | | | | | | | | | | | | | | | | | | | | | | | | | | | | | | | | | | | | | | | | |
| | | 66 | %(2)(4) | | | 146 | %(4) | | | 259 | %(4) | | | 207 | %(4) | | | 237 | %(2)(4) | | | 37 | %(2)(4) | | | 125 | %(4) | | | 185 | %(4) | | | 201 | %(4) | | | 56 | %(2)(4) | | | 198 | %(2)(4) |
| NOTES TO FINANCIAL STATEMENTS |
NOTES TO FINANCIAL STATEMENTS March 31, 2011 (Unaudited)
The Marsico Investment Fund (the “Trust”) was organized on October 1, 1997, as a Delaware Statutory Trust and is registered under the Investment Company Act of 1940 (the “1940 Act”) as an open-end management investment company. The Focus Fund, Growth Fund, 21st Century Fund, International Opportunities Fund, Flexible Capital Fund, Global Fund, and Emerging Markets Fund (collectively, the “Funds”) are separate investment portfolios of the Trust. The Focus Fund is a non-diversified fund and the Growth Fund, the 21st Century Fund, the International Opportunities Fund, the Flexible Capital Fund, the Global Fund, and the Emerging Markets Fund are diversified funds. The Focus and Growth Funds commenced operations on December 31, 1997, the 21st Century Fund commenced operations on February 1, 2000, the International Opportunities Fund commenced operations on June 30, 2000, the Flexible Capital Fund commenced operations on December 29, 2006, the Global Fund commenced operations on June 29, 2007, and the Emerging Markets Fund commenced operations on December 31, 2010. Affiliates of Marsico Capital Management, LLC (the “Adviser”) hold approximately 5% and 91% of the Flexible Capital Fund’s and Emerging Markets Fund’s outstanding shares, respectively, as of March 31, 2011.
| 2. | Significant Accounting Policies |
The following is a summary of significant accounting policies consistently followed by the Funds in the preparation of their financial statements. These policies are in conformity with Generally Accepted Accounting Principles (“GAAP”) for investment companies. The presentation of financial statements in conformity with GAAP requires management to make estimates and assumptions that affect the reported amounts of assets and liabilities at the date of the financial statements and the reported amounts of income and expenses during the reporting period. Actual results could differ from those estimates.
| | (a) | Investment Valuation—A security traded on a recognized stock exchange is valued at the last sale price prior to the closing of the principal exchange on which the security is traded. Securities traded on NASDAQ generally will be valued at the NASDAQ Official Closing Price. If no sale price is reported on the valuation date, the most current bid price will generally be used. Other securities for which over-the-counter market quotations are readily available are generally valued at the last sale price. Debt securities that will mature in more than 60 days are generally valued at their bid prices furnished by a pricing service approved by the Funds’ Board of Trustees and subject to review and determination of the appropriate price by the Adviser. Debt securities that will mature in 60 days or less are valued at amortized cost, if it approximates market value. Any securities for which market quotations are not readily available are valued at their fair value as determined in good faith by the Adviser in accordance with procedures established by, and under the general supervision of, the Funds’ Board of Trustees. The Funds may use pricing services to assist in determining market value. The Board of Trustees has authorized the use of a pricing service to assist the Funds in valuing certain equity securities listed or traded on foreign security exchanges in the Funds’ portfolios in certain circumstances where there is a significant change in the value of related U.S.- traded securities, as represented by, for example, the S&P 500 Index. |
“Fair Value Measurements and Disclosures” (the “Fair Value Statement”) defines fair value, establishes a framework for measuring fair value in GAAP, and expands disclosures about fair value measurements. Under the Fair Value Statement, various inputs are used in determining the value of the Funds’ investments.
These inputs are summarized into three broad levels and described below:
| | · | Level 1 – quoted prices in active markets for identical investments |
| | · | Level 2 – other significant observable inputs (including quoted prices for similar investments, interest rates, and evaluated quotations obtained from pricing services) |
| | · | Level 3 – significant unobservable inputs (including the Fund’s own assumptions in determining the fair value of investments). |
| NOTES TO FINANCIAL STATEMENTS |
The inputs or methodology used for valuing investments are not an indication of the risk associated with investing in those investments. Changes in valuation techniques may result in transfers between the levels during the reporting period. For each of the Funds, there were no significant transfers between each of the levels during the reporting period. The Funds recognize transfers between the levels as of the beginning and end of the reporting period. The following is a summary of the fair values of the Funds’ investments in each category and economic sector as of March 31, 2011:
| Fund Investments by | | | | | | | | | | | | |
| Major Security Type | | Level 1 | | | Level 2 | | | Level 3 | | | Total | |
| Marsico Focus Fund | | | | | | | | | | | | |
| Assets | | | | | | | | | | | | |
| Common Stocks | | | | | | | | | | | | |
| Consumer Discretionary | | $ | 179,955,224 | | | $ | — | | | $ | — | | | $ | 179,955,224 | |
| Consumer Staples | | | 26,810,699 | | | | — | | | | — | | | | 26,810,699 | |
| Energy | | | 150,776,156 | | | | — | | | | — | | | | 150,776,156 | |
| Financials | | | 205,002,358 | | | | — | | | | — | | | | 205,002,358 | |
| Industrials | | | 242,095,959 | | | | — | | | | — | | | | 242,095,959 | |
| Information Technology | | | 242,964,455 | | | | — | | | | — | | | | 242,964,455 | |
| Materials | | | 155,191,619 | | | | — | | | | — | | | | 155,191,619 | |
| Short-term Investments | | | 46,188,397 | | | | — | | | | — | | | | 46,188,397 | |
| | | | | | | | | | | | | | | $ | 1,248,984,867 | |
| Marsico Growth Fund | | | | | | | | | | | | | | | | |
| Assets | | | | | | | | | | | | | | | | |
| Common Stocks | | | | | | | | | | | | | | | | |
| Consumer Discretionary | | | 221,471,778 | | | | — | | | | — | | | | 221,471,778 | |
| Consumer Staples | | | 21,297,811 | | | | — | | | | — | | | | 21,297,811 | |
| Energy | | | 66,744,088 | | | | — | | | | — | | | | 66,744,088 | |
| Financials | | | 123,843,788 | | | | — | | | | — | | | | 123,843,788 | |
| Health Care | | | 8,547,069 | | | | — | | | | — | | | | 8,547,069 | |
| Industrials | | | 118,705,514 | | | | — | | | | — | | | | 118,705,514 | |
| Information Technology | | | 149,077,055 | | | | — | | | | — | | | | 149,077,055 | |
| Materials | | | 139,963,894 | | | | — | | | | — | | | | 139,963,894 | |
| Preferred Stocks | | | 9,462,960 | | | | — | | | | — | | | | 9,462,960 | |
| Units | | | 13,156,110 | | | | — | | | | — | | | | 13,156,110 | |
| Short-term Investments | | | 344,308 | | | | — | | | | — | | | | 344,308 | |
| | | | | | | | | | | | | | | $ | 872,614,375 | |
Marsico 21st Century Fund | | | | | | | | | | | | | | | | |
| Assets | | | | | | | | | | | | | | | | |
| Common Stocks | | | | | | | | | | | | | | | | |
| Consumer Discretionary | | | 175,207,643 | | | | — | | | | — | | | | 175,207,643 | |
| Energy | | | 54,113,571 | | | | — | | | | — | | | | 54,113,571 | |
| Financials | | | 241,450,668 | | | | — | | | | — | | | | 241,450,668 | |
| Health Care | | | 50,545,029 | | | | — | | | | — | | | | 50,545,029 | |
| Industrials | | | 91,736,033 | | | | — | | | | — | | | | 91,736,033 | |
| Information Technology | | | 118,413,133 | | | | — | | | | — | | | | 118,413,133 | |
| Materials | | | 19,972,592 | | | | — | | | | — | | | | 19,972,592 | |
| Short-term Investments | | | 52,248,758 | | | | — | | | | — | | | | 52,248,758 | |
| | | | | | | | | | | | | | | $ | 803,687,427 | |
| Marsico International Opportunities Fund | | | | | | | | | | | | | | | | |
| Assets | | | | | | | | | | | | | | | | |
| Common Stocks | | | | | | | | | | | | | | | | |
| Consumer Discretionary | | | 45,400,562 | | | | — | | | | — | | | | 45,400,562 | |
| Consumer Staples | | | 14,013,513 | | | | — | | | | — | | | | 14,013,513 | |
| Energy | | | 22,094,912 | | | | — | | | | — | | | | 22,094,912 | |
| Financials | | | 46,205,593 | | | | — | | | | — | | | | 46,205,593 | |
| Health Care | | | 4,713,765 | | | | — | | | | — | | | | 4,713,765 | |
| Industrials | | | 40,253,275 | | | | — | | | | — | | | | 40,253,275 | |
| Information Technology | | | 25,991,380 | | | | — | | | | — | | | | 25,991,380 | |
| Materials | | | 26,277,175 | | | | — | | | | — | | | | 26,277,175 | |
| Telecommunication Services | | | 3,979,803 | | | | — | | | | — | | | | 3,979,803 | |
| Units | | | 1,721,492 | | | | — | | | | — | | | | 1,721,492 | |
| Short-term Investments | | | 5,516,943 | | | | — | | | | — | | | | 5,516,943 | |
| | | | | | | | | | | | | | | $ | 236,168,413 | |
| NOTES TO FINANCIAL STATEMENTS |
NOTES TO FINANCIAL STATEMENTS March 31, 2011 (Unaudited) (continued)
| Fund Investments by | | | | | | | | | | | | |
| Major Security Type | | Level 1 | | | Level 2 | | | Level 3 | | | Total | |
| Marsico Flexible Capital Fund | | | | | | | | | | | | |
| Assets | | | | | | | | | | | | |
| Common Stocks | | | | | | | | | | | | |
| Consumer Discretionary | | $ | 98,435,647 | | | $ | — | | | $ | — | | | $ | 98,435,647 | |
| Consumer Staples | | | 22,825,293 | | | | — | | | | — | | | | 22,825,293 | |
| Energy | | | 61,791,944 | | | | — | | | | — | | | | 61,791,944 | |
| Financials | | | 93,852,332 | | | | — | | | | — | | | | 93,852,332 | |
| Health Care | | | 8,370,132 | | | | — | | | | — | | | | 8,370,132 | |
| Industrials | | | 59,484,919 | | | | — | | | | — | | | | 59,484,919 | |
| Information Technology | | | 98,575,721 | | | | — | | | | — | | | | 98,575,721 | |
| Materials | | | 47,360,424 | | | | — | | | | — | | | | 47,360,424 | |
| Convertible Preferred Stocks | | | 14,919,663 | | | | — | | | | — | | | | 14,919,663 | |
| Corporate Bonds | | | — | | | | 17,530,856 | | | | — | | | | 17,530,856 | |
| Preferred Stocks | | | 31,307,998 | | | | — | | | | — | | | | 31,307,998 | |
| Units | | | 29,973,357 | | | | — | | | | — | | | | 29,973,357 | |
| Short-term Investments | | | 51,111,761 | | | | — | | | | — | | | | 51,111,761 | |
| | | | | | | | | | | | | | | $ | 635,540,047 | |
| Liabilities | | | | | | | | | | | | | | | | |
| Written Call Options | | | (2,149 | ) | | | — | | | | — | | | | (2,149 | ) |
| | | | | | | | | | | | | | | $ | (2,149 | ) |
| | | | | | | | | | | | | | | | | |
| Marsico Global Fund | | | | | | | | | | | | | | | | |
| Assets | | | | | | | | | | | | | | | | |
| Common Stocks | | | | | | | | | | | | | | | | |
| Consumer Discretionary | | | 37,184,686 | | | | — | | | | — | | | | 37,184,686 | |
| Consumer Staples | | | 2,787,899 | | | | — | | | | — | | | | 2,787,899 | |
| Energy | | | 8,697,247 | | | | — | | | | — | | | | 8,697,247 | |
| Financials | | | 33,522,570 | | | | — | | | | — | | | | 33,522,570 | |
| Health Care | | | 4,776,148 | | | | — | | | | — | | | | 4,776,148 | |
| Industrials | | | 11,848,634 | | | | — | | | | — | | | | 11,848,634 | |
| Information Technology | | | 20,650,655 | | | | — | | | | — | | | | 20,650,655 | |
| Materials | | | 7,063,139 | | | | — | | | | — | | | | 7,063,139 | |
| Units | | | 4,183,579 | | | | — | | | | — | | | | 4,183,579 | |
| Short-term Investments | | | 5,485,447 | | | | — | | | | — | | | | 5,485,447 | |
| | | | | | | | | | | | | | | $ | 136,200,004 | |
| | | | | | | | | | | | | | | | | |
| Marsico Emerging Markets Fund | | | | | | | | | | | | | | | | |
| Assets | | | | | | | | | | | | | | | | |
| Common Stocks | | | | | | | | | | | | | | | | |
| Consumer Discretionary | | | 919,119 | | | | — | | | | — | | | | 919,119 | |
| Consumer Staples | | | 555,400 | | | | — | | | | — | | | | 555,400 | |
| Energy | | | 1,029,128 | | | | — | | | | — | | | | 1,029,128 | |
| Financials | | | 2,449,266 | | | | — | | | | — | | | | 2,449,266 | |
| Health Care | | | 424,581 | | | | — | | | | — | | | | 424,581 | |
| Industrials | | | 299,980 | | | | — | | | | — | | | | 299,980 | |
| Information Technology | | | 1,100,592 | | | | — | | | | — | | | | 1,100,592 | |
| Materials | | | 509,241 | | | | — | | | | — | | | | 509,241 | |
| Telecommunication Services | | | 101,917 | | | | — | | | | — | | | | 101,917 | |
| Utilities | | | 297,088 | | | | — | | | | — | | | | 297,088 | |
| Units | | | 400,669 | | | | — | | | | — | | | | 400,669 | |
| Short-term Investments | | | 2,058,455 | | | | — | | | | — | | | | 2,058,455 | |
| | | | | | | | | | | | | | | $ | 10,145,436 | |
| | (b) | Expenses—The Funds are charged for those expenses that are directly attributable to each Fund, such as advisory and custodial fees. Expenses that are not directly attributable to a Fund are typically allocated among the Funds in proportion to their respective net assets and in some cases allocated based on other factors. The Funds’ expenses may be reduced by voluntary advisory fee waivers, brokerage credits and uninvested cash balances earning interest or credits. Such credits are included in “Less waiver of expenses and expenses paid indirectly” on the Statements of Operations. |
| NOTES TO FINANCIAL STATEMENTS |
Brokerage commissions were paid to certain brokers which reduced certain transfer agent fees and expenses in the amount of $122 for the Growth Fund for the six-months ended March 31, 2011. The Funds also received earnings credits on certain cash account balances which reduced transfer agent fees and expenses in the amount of $611, $449, $366, $161, $178, $60 and $2 for the Focus Fund, Growth Fund, 21st Century Fund, International Opportunities Fund, Flexible Capital Fund, Global Fund and Emerging Markets Fund, respectively, for the six-months ended March 31, 2011. Brokerage commission credits and earnings credits are included in “Less waiver of expenses and expenses paid indirectly” on the Statements of Operations.
| | (c) | Federal Income Taxes—Each Fund intends to comply with the requirements of the Internal Revenue Code necessary to qualify as a regulated investment company and to make the requisite distributions of income to its shareholders which will be sufficient to relieve it from all or substantially all federal and state income taxes. Certain funds may utilize earnings and profits on redemption of shares as part of the dividends paid deduction. |
| | (d) | Distributions to Shareholders—Dividends from net investment income and net realized capital gains, if any, will be declared and paid at least annually. Distributions to shareholders are recorded on the ex-dividend date. Each Fund may periodically make reclassifications among certain of its capital accounts as a result of the timing and characterization of certain income and capital gains distributions determined in accordance with federal tax regulations, which may differ from GAAP. These reclassifications are due to differing treatment for items such as foreign currency transactions, net investment losses and investments in partnerships and REITs. |
| | (e) | Foreign Currency Translation—The accounting records of the Funds are maintained in U.S. dollars. Values of securities denominated in foreign currencies are translated into U.S. dollars at 4:00 p.m. ET. Amounts related to the purchase and sale of foreign securities and investment income are translated at the rates of exchange prevailing on the respective dates of such transactions. |
Reported realized gains on foreign currency transactions arise from sales of portfolio securities, forward currency contracts, currency gains or losses realized between the trade and settlement dates on securities transactions, the difference between the amounts of dividends, interest, and foreign withholding taxes recorded on the Funds’ books, and the U.S. dollar equivalent of the amounts actually received or paid.
The Funds do not isolate that portion of the results of operations resulting from changes in foreign exchange rates on investments from the fluctuations arising from changes in market prices of securities held at fiscal year-end. Net unrealized appreciation or depreciation on investments and foreign currency translations arise from changes in the value of assets and liabilities, including investments in securities at fiscal year-end, resulting from changes in the exchange rates and changes in market prices of securities held.
| | (f) | Derivative Instruments — “Disclosure about Derivative Instruments and Hedging Activities” (the “Derivatives Statement”) requires enhanced disclosures about the Funds’ derivative and hedging activities, including how such activities are accounted for and their effects on the Funds’ financial position, performance and cash flows. |
The Funds may enter into futures contracts and options on securities, financial indexes and foreign currencies, options on futures, forward contracts, interest rate swaps, credit default swaps and swap-related products. The Funds intend to use such derivative instruments primarily to hedge or protect from adverse movements in securities prices, currency rates or interest rates. The use of futures contracts and options may involve risks such as the possibility of illiquid markets or imperfect correlation between the value of the contracts and the underlying securities, or that the counterparty will fail to perform its obligations. The limited use of derivative instruments by the Funds during the six-months ended March 31, 2011 was related to purchased index and written equity exchange-traded options for the Flexible Capital Fund, which did not have a significant impact on the Fund’s performance during the reporting period. The number of option contracts held by the Flexible Capital Fund as of March 31, 2011 is included on the Schedule of Investments. The following tables provide information about the fair value and location of derivatives on the Statements of Assets and Liabilities and the effects on the Statements of Operations for the Flexible Capital Fund.
| NOTES TO FINANCIAL STATEMENTS |
NOTES TO FINANCIAL STATEMENTS March 31, 2011 (Unaudited) (continued)
The fair value of derivative instruments by primary risk category as of March 31, 2011 (amounts in thousands):
| | | Asset Derivatives | | Liability Derivatives | |
| Derivatives not | | Statements of | | | | | Statements of | | | |
| accounted for as | | Assets and Liabilities | | | | | Assets and Liabilities | | | |
| hedging instruments | | Location | | | Fair Value | | Location | | Fair Value | |
| Equity contracts | | N/A | | | — | | Written Options Outstanding | | $ 2 | |
| Total | | | | | $ — | | | | $ 2 | |
The effects of derivative instruments on the Statements of Operations for the period October 1, 2010 through March 31, 2011 (amounts in thousands):
| Derivatives not accounted for | | Amount of realized gain (loss) on derivatives | |
| as hedging instruments | | Purchased Options | | | Written Options | | | Total | |
| Equity/Index contracts | | $(776) | | | $40 | | | $(736) | |
| Total | | $(776) | | | $40 | | | $(736) | |
| Derivatives not accounted for | | Change in unrealized appreciation/depreciation on derivatives | |
| as hedging instruments | | Purchased Options | | | Written Options | | | Total | |
| Equity contracts | | $ — | | | $37 | | | $37 | |
| Total | | $ — | | | $37 | | | $37 | |
Options Contracts — The Funds may purchase and write (sell) put and call options on foreign and domestic stock indices, foreign currencies, and U.S. and foreign securities that are traded on a securities exchange or an over-the-counter market. These transactions are for hedging purposes or for the purpose of earning additional income. In addition, the Funds may enter into such transactions for cross-hedging purposes. There is minimal counterparty credit risk involved in entering into option contracts since they are exchange-traded instruments and the exchange’s clearinghouse, as counterparty to all exchange-traded options, guarantees the options against default.
The risk associated with purchasing an option is that the Fund pays a premium whether or not the option is exercised. Additionally, the Fund bears the risk of loss of premium and change in market value should the counterparty not perform under the contract. Put and call options purchased are accounted for in the same manner as portfolio securities. The cost of securities acquired through the exercise of call options is increased by premiums paid. The proceeds from securities sold through the exercise of put options are decreased by the premiums paid.
When the Fund writes an option, the premium received by the Fund is recorded as a liability and is subsequently adjusted to the current market value of the option written. Premiums received from writing options that expire are recorded by the Fund on the expiration date as realized gains from option transactions. The difference between the premium and the amount paid on effecting a closing purchase transaction, including brokerage commissions, is also treated as a realized gain, or if the premium is less than the amount paid for the closing purchase transaction, as a realized loss. If a call option is exercised, the premium is added to the proceeds from the sale of the underlying security or currency in determining whether the Fund has realized a gain or loss. If a put option is exercised, the premium reduces the cost basis of the security or currency purchased by the Fund. In writing an option, the Fund bears the market risk of an unfavorable change in the price of the security or currency underlying the written option. Exercise of an option written by the Fund could result in the Fund selling or buying a security or currency at a price different from the current market value.
| NOTES TO FINANCIAL STATEMENTS |
Transactions in written options for the six-months ended March 31, 2011 were as follows:
| | | Marsico Flexible Capital Fund | |
| | | Number of Contracts | | | Premium Amount | |
| Options outstanding at September 30, 2010 | | | — | | | $ | — | |
| Options written | | | 3,649 | | | | (79,060 | ) |
| Options closed | | | — | | | | — | |
| Options exercised | | | — | | | | — | |
| Options expired | | | 1,500 | | | | 40,379 | |
| Options outstanding at March 31, 2011 | | | 2,149 | | | $ | (38,681 | ) |
| | (g) | Trustees’ Deferred Fee Plan— Effective February 1, 2000, the Board of Trustees adopted the Marsico Investment Fund Deferred Fee Plan (the “Deferred Fee Plan”), amended and restated as of December 30, 2005, which allows the Trustees to defer the receipt of all or a portion of their compensation received from the Funds. Any deferred fees are credited to accounts established on behalf of the Trustees into the Funds as directed by each Trustee. The amounts credited to these accounts increase or decrease in accordance with the performance of the Funds selected by the Trustees. The market value of the deferred account balances as of March 31, 2011 is shown on the Statements of Assets and Liabilities as part of an asset account, “Prepaid expenses and other assets”, and a liability account, “Accrued trustees’ fees”. Additionally, the fluctuation of the account balances due to the Funds’ performance is recorded by the Funds as unrealized appreciation/(depreciation) which is shown as part of “Net unrealized appreciation on investments, written option contracts and foreign currency translations” on the Statements of Assets and Liabilities and as compensation expense which is shown as part of the expense account “Trustees’ fees and expenses” on the Statements of Operations. Fees earned and deferred by the Trustees for the six-months ended March 31, 2011 are also included in “Trustees’ fees and expenses” on the Statements of Operations. Amounts credited to the Deferred Fee Plan will be deferred until distributed in accordance with the Deferred Fee Plan. Unrealized appreciation/depreciation of Fund shares held in the Deferred Fee Plan is subject to the Funds’ expense reimbursement agreement with the Adviser. |
| | (h) | Redemption Fee—A 2.00% redemption fee is retained by the Funds to offset transaction costs and other expenses associated with short-term investing. The fee is imposed on certain redemptions or exchanges of shares held 30 days or less from their purchase date. Redemption fees are recorded by the Funds as a reduction of shares redeemed and as a credit to paid-in-capital. For the six-months ended March 31, 2011, the Focus Fund, Growth Fund, 21st Century Fund, International Opportunities Fund, Flexible Capital Fund, Global Fund, and Emerging Markets Fund received $17,015, $31,830, $2,912, $14,135, $56,568, $1,685, and $30, respectively, in redemption fees. |
| | (i) | Other—Investment transactions are accounted for on a trade date basis. Each Fund determines the gain or loss realized from the investment transactions by comparing the original cost of the security lot sold with the net sale proceeds. Dividend income is recognized on the ex-dividend date. Certain dividends from foreign securities will be recorded as soon as the Trust is informed of the dividend if such information is obtained subsequent to the ex-dividend date. Interest income is recognized on an accrual basis. |
| | (j) | Indemnifications—In the normal course of business, the Funds enter into contracts that contain provisions indemnifying other parties against specified potential liabilities. Each Fund’s maximum exposure under these arrangements is unknown as this would involve future claims that may be made against the Fund that have not yet occurred. However, based on experience, the Funds expect the risk of loss to be remote. |
| NOTES TO FINANCIAL STATEMENTS |
NOTES TO FINANCIAL STATEMENTS March 31, 2011 (Unaudited) (continued)
| 3. | Investment Advisory Agreement and Transactions With Affiliates |
Each Fund has an agreement with the Adviser to furnish investment advisory services to the Funds. Under the terms of these agreements, the Adviser is compensated for managing the Focus Fund and the Growth Fund at the rate of 0.85% per year of average daily net assets up to $3 billion in each Fund, and 0.75% per year of average daily net assets exceeding $3 billion in each Fund; and at a rate of 0.85% of the average daily net assets of the 21st Century Fund, the International Opportunities Fund, the Flexible Capital Fund, and the Global Fund; and at a rate of 1.00% of the average net assets of the Emerging Markets Fund. The Adviser has voluntarily agreed to limit the total expenses of each Fund (excluding interest, taxes, acquired fund fees and expenses, litigation, brokerage and extraordinary expenses) to an annual rate of 1.75% of the average net assets of the Emerging Markets Fund, 1.60% of the average net assets of the Focus Fund, the International Opportunities Fund, the Flexible Capital Fund and the Global Fund, and 1.50% of the average net assets of the Growth Fund and the 21st Century Fund until January 31, 2012. This expense limitation and fee waiver agreement is voluntary and may be terminated at any time after January 31, 2012. Prior to January 1, 2009, the Adviser’s voluntary expense limitation agreement relating to the Global Fund limited total expenses of the Global Fund (excluding interest, taxes, acquired fund fees and expenses, litigation, brokerage and extraordinary expenses) to an annual rate of 0.75% of the Global Fund’s average net assets. Prior to February 1, 2011, the Adviser’s voluntary expense limitation agreement relating to the Flexible Capital Fund limited total expenses of the Flexible Capital Fund (excluding interest, taxes, acquired fund fees and expenses, litigation, brokerage and extraordinary expenses) to an annual rate of 0.75% of the Flexible Capital Fund’s average net assets.
The Adviser is entitled to reimbursement from a Fund of any fees waived pursuant to this arrangement if such reimbursements do not cause a Fund to exceed current expense limitations and the reimbursement is made within three years after the year in which the Adviser incurred the expense. As of March 31, 2011, the fees waived or expenses reimbursed related to the Flexible Capital Fund’s expense limitation of 0.75% of average net assets totaled $1,654,078. The Adviser has elected not to seek recoupment of this amount. As of March 31, 2011, reimbursements that may potentially be made by the Emerging Markets Fund to the Adviser are $66,666, which expire in 2014.
Certain officers of the Trust are also officers of the Adviser. The Funds pay a portion of the Chief Compliance Officer’s total compensation costs which is shown as part of the expense account “Professional fees” on the Statements of Operations. No other officers of the Trust received compensation from the Funds.
| 4. | Service and Distribution Plan |
The Funds have adopted a Service and Distribution Plan (the “Plan”) pursuant to Rule 12b-1 under the 1940 Act. The Plan authorizes payments by the Funds in connection with the distribution of their shares at an annual rate, as determined from time to time by the Board of Trustees, of up to 0.25% of a Fund’s average daily net assets. The Adviser may, out of its own resources and at its sole discretion, make certain payments on behalf of the Plan for expenses incurred by a Fund for distribution of Fund shares and related services.
| 5. | Investment Transactions |
The aggregate purchases and sales of securities, excluding short-term investments, for the Funds for the six-months ended March 31, 2011, were as follows:
| | | | | | | | | 21st | | | International | | | Flexible | | | | | | Emerging | |
| | | Focus | | | Growth | | | Century | | | Opportunities | | | Capital | | | Global | | | Markets | |
| (Amounts in thousands) | | Fund | | | Fund | | | Fund | | | Fund | | | Fund | | | Fund | | | Fund | |
| Purchases | | $462,498 | | | $316,470 | | | $251,274 | | | $172,269 | | | $627,951 | | | $46,435 | | | $17,222 | |
| Sales | | $923,906 | | | $487,506 | | | $391,745 | | | $323,354 | | | $228,566 | | | $47,621 | | | $8,913 | |
There were no purchases or sales of U.S. government securities, excluding short-term investments.
| NOTES TO FINANCIAL STATEMENTS |
| 6. | Federal Income Tax Information |
Accounting for Uncertainty in Income Taxes (the “Income Tax Statement”) requires an evaluation of tax positions taken (or expected to be taken) in the course of preparing a Fund’s tax returns to determine whether these positions meet a “more-likely-than-not” standard that, based on the technical merits, have a more than fifty percent likelihood of being sustained by a taxing authority upon examination. A tax position that meets the “more-likely-than-not” recognition threshold is measured to determine the amount of benefit to recognize in the financial statements. The Funds recognize interest and penalties, if any, related to unrecognized tax benefits as income tax expense in the Statements of Operations.
The Income Tax Statement requires management of the Funds to analyze all open tax years, fiscal years 2007-2010 as defined by IRS statute of limitations for all major jurisdictions, including federal tax authorities and certain state tax authorities. As of and during the six-months ended March 31, 2011, the Funds did not have a liability for any unrecognized tax benefits. The Funds have no examinations in progress and are not aware of any tax positions for which it is reasonably possible that the total amounts of unrecognized tax benefits will significantly change in the next twelve months.
At March 31, 2011 gross unrealized appreciation and depreciation of investments and options written, based on cost for federal income tax purposes were as follows:
| | | | | | | | | 21st | | | International | | | Flexible | | | | | | Emerging | |
| | | Focus | | | Growth | | | Century | | | Opportunities | | | Capital | | | Global | | | Markets | |
| (Amounts in thousands) | | Fund | | | Fund | | | Fund | | | Fund | | | Fund | | | Fund | | | Fund | |
| | | | | | | | | | | | | | | | | | | | | | |
| Cost of Investments | | $ | 914,149 | | | $ | 604,335 | | | $ | 644,417 | | | $ | 183,940 | | | $ | 583,729 | | | $ | 104,314 | | | $ | 9,948 | |
| Gross Unrealized Appreciation | | $ | 344,198 | | | $ | 272,984 | | | $ | 172,860 | | | $ | 54,652 | | | $ | 53,560 | | | $ | 32,703 | | | $ | 261 | |
| Gross Unrealized Depreciation | | | (9,362 | ) | | | (4,705 | ) | | | (13,590 | ) | | | (2,424 | ) | | | (1,712 | ) | | | (817 | ) | | | (64 | ) |
| Net Unrealized Appreciation | | | | | | | | | | | | | | | | | | | | | | | | | | | | |
| (Depreciation) on investments | | $ | 334,836 | | | $ | 268,279 | | | $ | 159,270 | | | $ | 52,228 | | | $ | 51,848 | | | $ | 31,886 | | | $ | 197 | |
| Proceeds from options written | | $ | — | | | $ | — | | | $ | — | | | $ | — | | | $ | (39 | ) | | $ | — | | | $ | — | |
The difference between cost amounts for financial statement and federal income tax purposes is due primarily to wash sale loss deferrals and passive foreign investment companies (“PFICs”).
The International Opportunities Fund, Flexible Capital Fund and Global Fund had realized currency losses (in thousands) from transactions between November 1, 2009 and September 30, 2010 of $245, $3 and $56, respectively. Each Fund has elected to treat post-October currency losses as arising in the next fiscal year.
At September 30, 2010, the Funds had accumulated capital loss carryforwards (in thousands) as follows:
| | | | | | | | | | | | International | | | Flexible | | | | |
| | | Focus | | | Growth | | | 21st Century | | | Opportunities | | | Capital | | | Global | |
| (Amounts in thousands) | | Fund | | | Fund | | | Fund | | | Fund | | | Fund | | | Fund | |
| For losses expiring September 30, | | | | | | | | | | | | | | | | | | |
| 2017 | | $ | 92,393 | | | $ | 228,750 | | | $ | 287,847 | | | $ | 99,570 | | | $ | 595 | | | $ | 17,393 | |
| 2018 | | $ | 163,867 | | | $ | — | | | $ | 390,579 | | | $ | 93,557 | | | $ | — | | | $ | 6,440 | |
To the extent that a fund may realize future net capital gains, those gains will be offset by any of its unused capital loss carryforward. Future capital loss carryover utilization in any given year may be subject to Internal Revenue Code limitations.
Under the recently enacted Regulated Investment Company Modernization Act of 2010 (the “Act”), the Funds will be permitted to carryforward capital losses incurred in taxable years beginning after December 22, 2010 for an unlimited period. However, any losses incurred during those future taxable years will be required to be utilized prior to the losses incurred in pre-enactment taxable years. As a result of this ordering rule, pre-enactment capital loss carryforwards may be more likely to expire unused. Additionally, post-enactment capital losses that are carried forward will retain their character as either short-term or long-term capital losses rather than being considered all short-term as under previous law.
The Growth Fund and Flexible Capital Fund utilized (in thousands) $21,269 and $2,715, respectively, of its capital loss carryforwards, during the year ended September 30, 2010.
| NOTES TO FINANCIAL STATEMENTS |
NOTES TO FINANCIAL STATEMENTS March 31, 2011 (Unaudited) (continued)
As of September 30, 2010, the components of accumulated earnings (deficit) on a tax basis were as follows:
| | | | | | | | | 21st | | | International | | | Flexible | | | | |
| | | Focus | | | Growth | | | Century | | | Opportunities | | | Capital | | | Global | |
| (Amounts in thousands) | | Fund | | | Fund | | | Fund | | | Fund | | | Fund | | | Fund | |
| Undistributed ordinary income | | $ | — | | | $ | 472 | | | $ | 37 | | | $ | 6,588 | | | $ | 1,489 | | | $ | 1,098 | |
| Undistributed Trustee’s deferred compensation | | | (1,147 | ) | | | (644 | ) | | | (382 | ) | | | (189 | ) | | | (105 | ) | | | (70 | ) |
| Undistributed long-term capital gains | | | — | | | | — | | | | — | | | | — | | | | — | | | | — | |
| Tax accumulated earnings (deficit) | | | (1,147 | ) | | | (172 | ) | | | (345 | ) | | | 6,399 | | | | 1,384 | | | | 1,028 | |
| Accumulated Capital and Other Losses | | | (256,260 | ) | | | (228,750 | ) | | | (678,426 | ) | | | (193,372 | ) | | | (598 | ) | | | (23,889 | ) |
Unrealized appreciation (depreciation) on investments and on foreign currency translations | | | 283,777 | | | | 204,938 | | | | 86,544 | | | | 60,042 | | | | 14,869 | | | | 20,311 | |
| Trustees deferred compensation mark to market | | | 24 | | | | 24 | | | | 17 | | | | 2 | | | | 100 | | | | 54 | |
| Total accumulated earnings (deficit) | | $ | 26,394 | | | $ | (23,960 | ) | | $ | (592,210 | ) | | $ | (126,929 | ) | | $ | 15,755 | | | $ | (2,496 | ) |
Undistributed ordinary income (deficit) consists of net investment income and timing differences related to post-October currency losses, partnerships and PFICs.
The tax character of distributions paid during the fiscal years ended September 30, 2010 and 2009 were as follows:
| (Amounts in thousands) | | 2010 | | | 2009 | |
| | | Ordinary | | | Tax Return | | | Long-Term | | | Ordinary | | | Tax Return | | | Long-Term | |
| Fund | | Income | | | of Capital | | | Capital Gains | | | Income | | | of Capital | | | Capital Gains | |
| Focus Fund | | $ | 3,909 | | | $ | — | | | $ | — | | | $ | 20,688 | | | $ | — | | | $ | 373 | |
| Growth Fund | | | 5,169 | | | | — | | | | — | | | | 9,933 | | | | — | | | | — | |
21st Century Fund | | | — | | | | — | | | | — | | | | 2,148 | | | | 2,082 | | | | — | |
| International Opportunities Fund | | | 2,073 | | | | — | | | | — | | | | 6,419 | | | | — | | | | — | |
| Flexible Capital Fund | | | 1,302 | | | | — | | | | — | | | | 116 | | | | — | | | | — | |
| Global Fund | | | 721 | | | | — | | | | — | | | | 734 | | | | — | | | | — | |
The tax character of dividends paid may differ from that shown in the Statements of Changes in Net Assets due to short-term gains being treated as ordinary income for tax purposes.
Management of the Adviser has determined that there were no material events that would require disclosure in the Funds’ financial statements.
EXPENSE EXAMPLE For the six months ended March 31, 2011 (Unaudited)
As a shareholder of the Marsico Funds (the “Funds”), you incur two types of costs: (1) transaction costs, including redemption fees on certain redemptions; and (2) ongoing costs, including management fees, distribution (12b-1) fees, and other Fund expenses. This Example is intended to help you understand your ongoing costs (in dollars) of investing in the Funds and to compare these costs with the ongoing costs of investing in other mutual funds.
The Example is based on an investment of $1,000 invested at the beginning of the period and held for the entire period from October 1, 2010 to March 31, 2011 (the “period”).
Actual Expenses
The first line of the table below provides information about actual account values and actual expenses. You may use the information in this line, together with the amount you invested, to estimate the expenses you paid over the period. Simply divide your account value by $1,000 (for example, an $8,600 account value divided by $1,000 equals 8.6), then multiply the result by the number in the first line under the heading entitled “Expenses paid for the six-month period ended March 31, 2011” to estimate the expenses you paid on your account during the period.
Hypothetical Example for Comparison Purposes
The second line of the table below provides information about hypothetical account values and hypothetical expenses based on the Funds’ actual expense ratios and an assumed rate of return of 5% per year before expenses, which is not the actual return of any of the Funds. The hypothetical account values and expenses may not be used to estimate the actual ending account balance or expenses you paid for the period. You may use this information to compare the ongoing costs of investing in the Funds and other funds. To do so, compare this 5% hypothetical example with the 5% hypothetical examples that appear in the shareholder reports of other funds.
Please note that the expenses shown in the table are meant to highlight your ongoing costs only and do not reflect any transactional costs, such as redemption fees. Therefore, the second line of the table is useful in comparing the ongoing costs only, and will not help you determine the relative total costs of owning different funds. In addition, if these transactional costs were included, your costs could have been higher.
| Expenses Paid During the Period | Beginning | | Ending | | Expenses paid for the |
| | account value | | account value | | six-month period ended |
| | October 1, 2010 | | March 31, 2011 | | March 31, 2011(1)(2) |
| FOCUS FUND | | | | | |
| Actual Example | $ 1,000.00 | | $ 1,199.50 | | $ 7.47 |
| Hypothetical Example, assuming a 5% return before expenses | $ 1,000.00 | | $ 1,018.20 | | $ 6.86 |
| | | | | | |
| GROWTH FUND | | | | | |
| Actual Example | $ 1,000.00 | | $ 1,198.30 | | $ 7.37 |
| Hypothetical Example, assuming a 5% return before expenses | $ 1,000.00 | | $ 1,018.30 | | $ 6.76 |
| | | | | | |
21st CENTURY FUND | | | | | |
| Actual Example | $ 1,000.00 | | $ 1,214.10 | | $ 7.68 |
| Hypothetical Example, assuming a 5% return before expenses | $ 1,000.00 | | $ 1,018.06 | | $ 7.00 |
| | | | | | |
| INTERNATIONAL OPPORTUNITIES FUND | | | | | |
| Actual Example | $ 1,000.00 | | $ 1,101.80 | | $ 8.25 |
| Hypothetical Example, assuming a 5% return before expenses | $ 1,000.00 | | $ 1,017.15 | | $ 7.92 |
| | | | | | |
| FLEXIBLE CAPITAL FUND | | | | | |
| Actual Example | $ 1,000.00 | | $ 1,213.20 | | $ 6.10 |
| Hypothetical Example, assuming a 5% return before expenses | $ 1,000.00 | | $1,019.49 | | $ 5.56 |
| | | | | | |
| GLOBAL FUND | | | | | |
| Actual Example | $ 1,000.00 | | $ 1,170.20 | | $ 8.50 |
| Hypothetical Example, assuming a 5% return before expenses | $ 1,000.00 | | $ 1,017.17 | | $ 7.90 |
| | | | | | |
| EMERGING MARKETS FUND | | | | | |
| Actual Example | $ 1,000.00 | | $ 962.00 | | $ 4.28 |
| Hypothetical Example, assuming a 5% return before expenses | $ 1,000.00 | | $ 1,020.64 | | $ 4.41 |
| (1) | Expenses are equal to the Funds’ annualized expense ratios (1.363% for the Focus Fund, 1.344% for the Growth Fund, 1.391% for the 21st Century Fund, 1.574% for the International Opportunities Fund, 1.105% for the Flexible Capital Fund, and 1.571% for the Global Fund), multiplied by the average account value over the period, multiplied by 182/365 (to reflect the six-month period). |
| (2) | Expenses are equal to the Emerging Markets Fund’s annualized expense ratio of 1.750% multiplied by the average account value from commencement of operations to March 31, 2011, multiplied by 91/365 (to reflect the period from commencement of operations to March 31, 2011). |
| CONSIDERATION OF INVESTMENT ADVISORY AGREEMENTS |
CONSIDERATION OF INVESTMENT ADVISORY AGREEMENTS (Unaudited)
At a meeting of the Board of Trustees of the Trust held on November 10, 2010 the Trustees, by a unanimous vote (including a separate vote of those Trustees who are not “interested persons” (as the term is defined in the 1940 Act) (the “Independent Trustees”)), approved the renewal of the Investment Advisory and Management Agreements (the “Agreements”) for the Focus Fund, Growth Fund, 21st Century Fund, International Opportunities Fund, Flexible Capital Fund and Global Fund. Also at the meeting of the Board of Trustees of the Trust held on November 10, 2010 the Independent Trustees approved by a unanimous vote, the initial Investment Advisory Agreement for the Emerging Markets Fund. In advance of the meeting, the Independent Trustees requested and received extensive materials from the Adviser to assist them in considering the renewal of the Agreements for the Focus Fund, Growth Fund, 21st Century Fund, International Opportunities Fund, Flexible Capital Fund and Global Fund and the initial approval of the agreement for the Emerging Markets Fund. The materials provided by the Adviser contained information with respect to the factors noted below, including detailed comparative information relating to the performance, advisory fees and other expenses of the Funds, other funds sub-advised by the Adviser and non-fund advisory accounts of the Adviser. The materials also included comparisons of the Funds with other funds and non-fund accounts of similar size and investment objectives in terms of performance, fees and other expenses, as well as the performance of each Fund versus its benchmark. In addition, the Adviser provided information regarding its overall expenses and profitability, as well as estimates of its costs and profitability relating to managing the Funds.
In addition to the materials prepared specifically for contract review analysis, on an ongoing basis the Trustees receive information and reports from the Adviser and other service providers to the Funds on investment performance as well as operational, compliance and other matters.
The Trustees engaged in a detailed discussion of the materials with management of the Adviser. The Independent Trustees then met separately with independent counsel to the Independent Trustees for a full review of the materials. Following this session, the full Board reconvened and approved the continuation of the Agreements for the Focus Fund, Growth Fund, 21st Century Fund, International Opportunities Fund, Flexible Capital Fund and Global Fund, and approved the Investment Advisory Agreement for the Emerging Markets Fund.
Discussion of Factors Considered
In connection with the consideration of the Agreements, the Trustees, including the Independent Trustees, requested and received from the Adviser, and reviewed, a wide variety of information, including information about (1) the nature, extent, and quality of the services provided by the Adviser; (2) the investment performance of the Funds and the Adviser; (3) the costs of the services to be provided and profits realized by the Adviser and its affiliates from the relationship with the Funds; (4) the extent to which economies of scale may be realized as the Funds grow; and (5) whether fee levels reflect these economies of scale for the benefit of Fund investors; as well as other relevant considerations such as the management fees and expense ratios of each Fund; potential fall-out benefits to the Adviser from its relationship to each Fund; and other general information about the Adviser. For the Emerging Markets Fund, the Trustees took into account, among other things, the services provided to other Funds by the Adviser and estimates of cost and economies based on estimates of the size of the Fund. The following is a summary of the Board’s discussion and views regarding these factors.
| 1. | Nature, Extent, and Quality of Services. |
The Independent Trustees considered the nature, quality and extent of the services performed by the Adviser under the Investment Advisory Agreements (the “Agreements”) with the Adviser, including portfolio management, supervision of Fund operations and compliance and regulatory filings and disclosures to shareholders, general oversight of other service providers, coordination of Fund marketing initiatives, review of Fund legal issues, assisting the Trustees in that capacity and other services, each of which are expected to be completed for the Emerging Markets Fund as well as other Funds. The Independent Trustees concluded that the services are extensive in nature, that the Adviser effectively manages the outsourcing by the Funds to other service providers and that the Adviser consistently delivered a high level of service.
| 2. | Investment Performance of the Funds and Adviser. |
The Independent Trustees considered short-term and long-term investment performance for each existing Fund over various periods of time as compared to both relevant equity indices and the performance of such Fund’s Lipper, Inc. peer group universe. The peer group information may not be fully comparable as it is based on data from the peer funds’ most recent available fiscal year, which in some cases ended earlier than data periods considered for the Funds. The existing Funds’ information, in contrast, is current information fully reflecting current markets. The Independent Trustees also considered that the existing Funds are typically managed in a tax-efficient manner, which could also make peer group performance information not comparable to the existing Funds. The Independent Trustees also noted MCM’s continued investment in research, despite a reduction in fee revenue due to a decline in existing Fund assets. The Independent Trustees concluded that the Adviser was managing the Funds consistent with their long-term investment strategies. The Independent Trustees noted the recent improvement in the performance of the Focus and Growth Funds while recognizing the underperformance in relation to peers and its benchmark in past periods. For the 21st Century Fund, the Independent Trustees understood the sources of the underperformance over various periods and were satisfied that the Adviser was taking appropriate steps to address performance matters. The Independent Trustees also noted that the investment performance delivered by the Adviser to the existing Funds appeared to be consistent with the performance delivered for other clients of the Adviser. The Independent Trustees also noted that the recent promotions of Coralie Witter and Munish Malhotra to portfolio managers of the Focus and Growth Funds and International Fund, respectively, should provide additional depth and resources in managing these Funds. The Independent Trustees would continue at its regular meetings to monitor steps the Adviser is taking to address performance matters for certain Funds.
| CONSIDERATION OF INVESTMENT ADVISORY AGREEMENTS |
| 3. | Costs of Services and Profits Realized by the Adviser. |
(a) Costs of Services to Funds: Fees and Expenses. The Independent Trustees considered each Fund’s management fee rates and expense ratios, including the proposed management fee rate and projected expense ratio for the Emerging Markets Fund, relative to industry averages for such Fund’s benchmark category and the advisory fees charged by the Adviser to other sub-advised funds and non-fund clients, including information regarding expense limitation commitments from the Adviser, and the breakpoints for certain Funds’ advisory services. The Independent Trustees noted that the mix of services under the Agreements, and those expected to be provided for the Emerging Markets Fund, are much more extensive than those under the Adviser’s advisory agreements for sub-advised funds as well as non-fund clients. While the Independent Trustees noted that the investment advisory fees paid by the Funds are generally in the upper quartile of their peer groups, they were cognizant that it is difficult to know whether the services provided by advisers to peer funds are as extensive as those provided by MCM to the Funds. The Independent Trustees noted that the proposed management fee rate for the Emerging Markets Fund was appropriate given the additional travel and other research efforts necessary in managing the Emerging Markets Fund. The Independent Trustees noted the actions taken by MCM to reduce Fund expenses, including that MCM had waived fees and absorbed expenses from time to time, and that some of those expenditures were not expected to be recouped. The Independent Trustees concluded that the investment advisory fees are acceptable based upon the qualifications, experience, reputation, and performance of the Adviser and the low-to-moderate overall expense ratios of the Funds.
(b) Profitability and Costs of Services to Adviser. The Independent Trustees considered the Adviser’s overall profitability and costs and a pro forma estimate of the Adviser’s profitability and costs if the Funds constituted the Adviser’s only assets under management. The Independent Trustees took into consideration that MCM’s fee revenue from the Funds had declined as most Funds’ assets had declined, and that MCM had undertaken a debt restructuring that could in some circumstances potentially reduce its profitability over the short and intermediate term to facilitate debt repayment (while strengthening MCM’s overall financial position and profitability over the long term), but that MCM had not reduced services or investment personnel as a result. The Independent Trustees also considered whether the amount of profit is a fair entrepreneurial profit for the management of each Fund, and noted that the Adviser has substantially increased its resources devoted to Fund matters in response to regulatory requirements enacted during the last few years and Fund policies and procedures that were adopted or enhanced in late 2004 and thereafter. The Independent Trustees concluded that the Adviser’s profitability was at an acceptable level, particularly in light of the extent and quality of the services being provided to the Funds.
| 4. | Extent of Economies of Scale as Funds Grow. |
The Independent Trustees considered whether there have been economies of scale with respect to the management of each existing Fund and whether such Fund has appropriately benefited from any economies of scale. The Independent Trustees noted that economies of scale may develop for certain existing Funds as their assets increase and their Fund-level expenses decline as a percentage of assets, but that existing Fund-level economies of scale may not necessarily result in Adviser-level economies of scale. The written materials presented to the Independent Trustees indicate that the expenses incurred by the Adviser relating to management of the existing Funds have increased substantially in recent years as a percentage of management fees and that the asset levels of certain Funds had decreased over the past year. Given the decline in the assets in most of the existing Funds over the past year, the Independent Trustees agreed that it was possible that if trends changed and Fund assets began growing again beyond certain thresholds, Adviser-level expenses incurred in managing the existing Funds and the Emerging Markets Fund eventually could level off or decline as a percentage of management fees in the future.
| CONSIDERATION OF INVESTMENT ADVISORY AGREEMENTS |
| 5. | Whether Fee Levels Reflect Economies of Scale. |
The Independent Trustees also considered whether the management fee rate is reasonable in relation to the asset size of each Fund, including the Emerging Markets Fund, and any economies of scale that may exist. The Independent Trustees noted that, effective November 11, 2004, at the behest of the Independent Trustees, breakpoints had been introduced for the two larger Funds, the Focus Fund and the Growth Fund, for assets in excess of $3 billion in each Fund. Under the breakpoints, investment management fees are 0.85% per year of average daily net assets up to $3 billion in each of those two Funds, and 0.75% per year of average daily net assets exceeding $3 billion in each Fund. The Independent Trustees also noted that fee waivers adopted under which the Adviser voluntarily agreed to temporarily limit fund expenses including advisory fees for the Flexible Capital Fund to 0.75% on an annual basis until January 31, 2011, that thereafter the Adviser intended to limit fund expenses to 1.60% for the Flexible Capital Fund until at least January 31, 2012, and that the Adviser also intended to renew other voluntary fund expense limitations for other existing Funds until at least January 31, 2012, all subject to possible future recoupment of previously waived fees or other expenses under certain conditions. The Independent Trustees also noted the proposed fee waivers for the Emerging Markets Fund under which the Adviser voluntarily agreed to limit fund expenses including advisory fees for this Fund to 1.75% on an annual basis until at least January 31, 2012, subject to possible future recoupment of previously waived fees or other expenses under certain conditions. Given the decline in the assets of most of the existing Funds over the past year, the Independent Trustees did not consider there to have been economies of scale realized by the Adviser in managing the Funds. The Independent Trustees agreed to continue to monitor whether any additional breakpoints for any of the Funds, including the Emerging Markets Fund, may be appropriate in the future.
| 6. | Other Relevant Considerations. |
(a) Adviser Personnel and Methods. The Independent Trustees considered information about the financial condition of the Adviser, including information about MCM’s debt restructuring and its potential effects on MCM’s profitability, and the Adviser’s stated commitment to maintaining a high quality investment management operation, including in the areas of investment analysis, research, trading, compliance, and operations. They also considered the size, education and experience of the Adviser’s staff. There was also a review of the Adviser’s “top down” economic analysis with “bottom up” stock selection. This two-pronged approach considering both macro-economic factors, such as interest rates, inflation and the global competitive landscape, and seeking to identify individual companies with unique market presence and potential earnings growth that may not be recognized by the market at-large, was regarded by the Trustees as consistent with the Funds’ disclosure documents, including those of the Emerging Markets Fund, and, therefore, investor expectations. MCM’s corporate culture and investment team structure were further viewed as facilitating the recruitment, training and retention of portfolio managers and other research and management personnel.
(b) Other Benefits to the Adviser. The Independent Trustees also considered the character and amount of other incidental benefits received by the Adviser and its affiliates from its association with the Funds. The Independent Trustees concluded that potential “fall-out” benefits that the Adviser may receive, such as greater name recognition or increased ability to obtain research or brokerage services, appear to be reasonable, and may in some cases benefit the Funds.
Conclusions
In considering the Agreements, the Independent Trustees did not identify any factor as all-important or all-controlling and instead considered these factors collectively in light of each Fund’s surrounding circumstances. Based on this review, it was the judgment of the Independent Trustees that the existing Funds fees were reasonable, the extent and quality of services were acceptable and the Adviser’s steps to address performance issues for certain Funds was satisfactory. Therefore, re-approval of the Agreements was in the best interests of each Fund and its shareholders. In addition, the Independent Trustees concluded that shareholders of the proposed Emerging Markets Fund are expected to receive satisfactory services at reasonable fees and, therefore, approval of the Agreement relating to that Fund also was in the best interests of that Fund and its shareholders. As a part of their decision-making process, the Independent Trustees noted that the Adviser has managed the Funds since their inception, and the Independent Trustees believe that a long-term relationship with a capable, conscientious adviser is in the best interests of the Funds and their shareholders. The Independent Trustees considered, generally, that shareholders invested in an existing Fund knowing that the Adviser managed that Fund and knowing its investment management fee. As such, the Independent Trustees considered, in particular, whether the Adviser managed each existing Fund in accordance with its investment objectives and policies as disclosed to shareholders. The Independent Trustees concluded that each Fund was managed by the Adviser consistent with its investment objectives and policies. Additionally, as part of its deliberations, the Board also considered and relied upon the information about the Funds and MCM that had been provided to them throughout the year in connection with their regular Board meetings at which they engage in the ongoing oversight of the Funds and their operations.
Upon conclusion of their review and discussion, the Independent Trustees unanimously agreed the Agreements for each of the Funds were appropriate.
OTHER INFORMATION (Unaudited)
Proxy Voting Guidelines
The Funds exercise the voting rights associated with the securities held by the Funds under the proxy voting policy of the Funds. A description of those policies and procedures of the Funds and a record of the Funds’ proxy votes for the one-year period ended June 30, 2010 are available without charge, upon request, by calling 888-860-8686. It is also available on the Securities and Exchange Commission’s website at www.sec.gov.
Quarterly Filing of Portfolio Holdings
The Funds will file their complete schedule of investments with the SEC for the first and third quarters of each fiscal year on Form N-Q. The Funds’ Form N-Q will be available (i) on the SEC’s Website at www.sec.gov; (ii) at the SEC’s Public Reference Room; and (iii) by calling 800-SEC-0330.
Cost Basis Information
As of January 1, 2012, federal law requires that mutual fund companies must maintain and report a shareholder’s cost basis by tax lot, gain/loss information, and holding period of “covered” security sales to the Internal Revenue Service (“IRS”) on Form 1099. Covered securities, that are mutual fund shares, are shares acquired on or after January 1, 2012. A fund is not responsible for maintaining and reporting share information if such shares are not deemed “covered”.
The new tax regulations require that the Funds elect a default tax identification methodology in order to perform the required reporting. As a result, the Funds have chosen the first-in-first-out (“FIFO”) method as the default tax lot identification method for its shareholders. This is the method the Funds will use to determine which specific shares are deemed to be sold when a shareholder’s entire position is not sold in a single transaction and is the method in which “covered” share sales will be reported on a shareholder’s Form 1099.
However, at the time of purchase or upon the sale of “covered” shares, shareholders may choose a different tax lot identification method. Shareholders should consult a tax advisor with regard to their personal circumstances as the Funds and their service providers do not provide tax advice.
The Marsico Investment Fund
UMB Distribution Services, LLC, Distributor
P.O. Box 3210, Milwaukee, WI 53201-3210
www.marsicofunds.com · 888.860.8686
©2011 MARSICO CAPITAL MANAGEMENT, LLC
Not authorized for distribution unless preceded or accompanied by an effective Marsico Funds prospectus.
Not applicable to semi-annual reports.
| Item 3. | Audit Committee Financial Expert |
Not applicable to semi-annual reports.
| Item 4. | Principal Accountant Fees and Services |
Not applicable to semi-annual reports.
| Item 5. | Audit Committee of Listed Registrants |
Not applicable.
| Item 6. | Schedule of Investments |
The schedule of investments in securities of unaffiliated issuers is included as part of the report to shareholders filed under Item 1.
| Item 7. | Disclosure of Proxy Voting Policies and Procedures for Closed-End Management Investment Companies |
Not applicable.
| Item 8. | Portfolio Managers of Closed-End Management Investment Companies |
Not applicable.
| Item 9. | Purchases of Equity Securities by Closed-End Management Investment Company and Affiliated Purchasers |
Not applicable.
| Item 10. | Submission of Matters to a Vote of Security Holders |
Not applicable.
| Item 11. | Controls and Procedures. |
(a) The registrant's principal executive officer and principal financial officer have concluded that the registrant's disclosure controls and procedures (as defined in Rule 30a-3(c) under the Investment Company Act of 1940, as amended) are effective based on their evaluation of these disclosure controls and procedures within 90 days of the filing date of this report on Form N-CSR.
(b) There were no changes in the registrant's internal control over financial reporting (as defined in Rule 30a-3(d) under the Investment Company Act of 1940, as amended) that occurred during the second fiscal quarter of the period covered by this report that has materially affected, or is reasonably likely to materially affect, the registrant's internal control over financial reporting.
(a)(1) Code of Ethics
Not applicable to semi-annual reports.
(a)(2) Certification for each principal executive and principal financial officer of the registrant as required by Rule 30a-2(a) under the Act (17 CFR 270.30a-2(a)) – Filed as an attachment to this filing.
(a)(3) Any written solicitation to purchase securities under Rule 23c-1 under the Investment Company Act of 1940, as amended, that was sent or given during the period covered by the report by or on behalf of the registrant to 10 or more persons.
Not applicable.
(b) Certifications required by Rule 30a-2(b) under the Act (17 CFR 270.30a-2(b)), Rule 13a-14(b) or Rule 15d-14(b) under the Exchange Act (17 CFR 240.13a-14(b) or 240.15d-14(b)), and Section 1350 of Chapter 63 of Title 18 of the United States Code (18 U.S.C. 1350) – Filed as an attachment to this filing.
SIGNATURES
Pursuant to the requirements of the Securities Exchange Act of 1934 and the Investment Company Act of 1940, the registrant has duly caused this report to be signed on its behalf by the undersigned, thereunto duly authorized.
| The Marsico Investment Fund | |
| | | |
| By: | /s/ Christopher J. Marsico | |
| | Christopher J. Marsico, | |
| | Executive Vice President and Chief Operating Officer | |
| | | |
| Date: May 26, 2011 | |
Pursuant to the requirements of the Securities Exchange Act of 1934 and the Investment Company Act of 1940, this report has been signed below by the following persons on behalf of the registrant and in the capacities and on the dates indicated.
| By: | /s/ Christopher J. Marsico | |
| | Christopher J. Marsico, | |
| | Executive Vice President and Chief Operating Officer | |
| | | |
| Date: May 26, 2011 | |
| | | |
| | | |
| By: | /s/ Neil L. Gloude | |
| | Neil L. Gloude, | |
| | Vice President, Secretary and Treasurer | |
| | | |
| Date: May 26, 2011 | |