UNITED STATES
SECURITIES AND EXCHANGE COMMISSION
Washington, D.C. 20549
FORM N-CSR
CERTIFIED SHAREHOLDER REPORT OF REGISTERED MANAGEMENT INVESTMENT
COMPANIES
Investment Company Act file number 811-08397
| THE MARSICO INVESTMENT FUND |
| (Exact name of registrant as specified in charter) |
| 1200 17th Street, Suite 1600 |
| Denver, CO 80202 |
| (Address of principal executive offices) (Zip code) |
| Christopher J. Marsico |
| The Marsico Investment Fund |
| 1200 17th Street, Suite 1600 |
| Denver, CO 80202 |
| (Name and address of agent for service) |
| Copies to: |
| Sander M. Bieber, Esq. |
| Dechert LLP |
| 1775 I Street, N.W. |
| Washington, D.C. 20006 |
Registrant's telephone number, including area code: (303) 454-5600
Date of fiscal year end: September 30
Date of reporting period: September 30, 2007
Item 1 – Reports to Stockholders.
Opportunities are everywhere.
| |
Through our inspired approach to investing and commitment to our
|

|
| |
Enclosed is your annual report for The Marsico Investment Fund,
believe were the most salient areas that impacted performance – including the macroeconomic environment, sector and industry positioning, and individual stock selection – as compared to the Funds’ performance benchmark indexes. Certain sector or industry classifications used in the discussion and review portions of the annual report may be broader or narrower than those used in Key Fund Statistics, Fund Overviews, Schedules of Investments, or elsewhere in this report. For our updated commentary regarding the market environment and the Funds’ overall investment posture, please refer to the Funds’ most recent quarterly shareholder update, which is available on the Funds’ website at www.marsicofunds.com. |  |
2
|
 | |||||
| KEY FUND STATISTICS | 4 | ||||
| MARKET ENVIRONMENT | 7 | ||||
| MARSICO FOCUS FUND | |||||
| Investment Review | 9 | ||||
| Fund Overview | 12 | ||||
| Schedule of Investments | 13 | ||||
| Financial Statements | 14-16 | ||||
| MARSICO GROWTH FUND | |||||
| Investment Review | 9 | ||||
| Fund Overview | 17 | ||||
| Schedule of Investments | 18 | ||||
| Financial Statements | 20-22 | ||||
| MARSICO 21ST CENTURY FUND | |||||
| Investment Review | 23 | ||||
| Fund Overview | 25 | ||||
| Schedule of Investments | 26 | ||||
| Financial Statements | 28-30 | ||||
| MARSICO INTERNATIONAL OPPORTUNITIES FUND | |||||
| Investment Review | 31 | ||||
| Fund Overview | 33 | ||||
| Schedule of Investments | 34 | ||||
| Financial Statements | 37-39 | ||||
| MARSICO FLEXIBLE CAPITAL FUND | |||||
| Investment Review | 40 | ||||
| Fund Overview | 42 | ||||
| Schedule of Investments | 43 | ||||
| Financial Statements | 45-47 | ||||
| MARSICO GLOBAL FUND | |||||
| Investment Review | 48 | ||||
| Fund Overview | 50 | ||||
| Schedule of Investments | 51 | ||||
| Financial Statements | 53-55 | ||||
| NOTES TO FINANCIAL STATEMENTS | 56 | ||||
| REPORT OF INDEPENDENT REGISTERED | |||||
| PUBLIC ACCOUNTING FIRM | 65 | ||||
| EXPENSE EXAMPLE | 66 | ||||
| CONSIDERATION OF INVESTMENT | |||||
| ADVISORY AND MANAGEMENT AGREEMENTS | 68 | ||||
| OTHER INFORMATION | 74 | ||||
| TRUSTEE AND OFFICER INFORMATION | 75 |
3
|
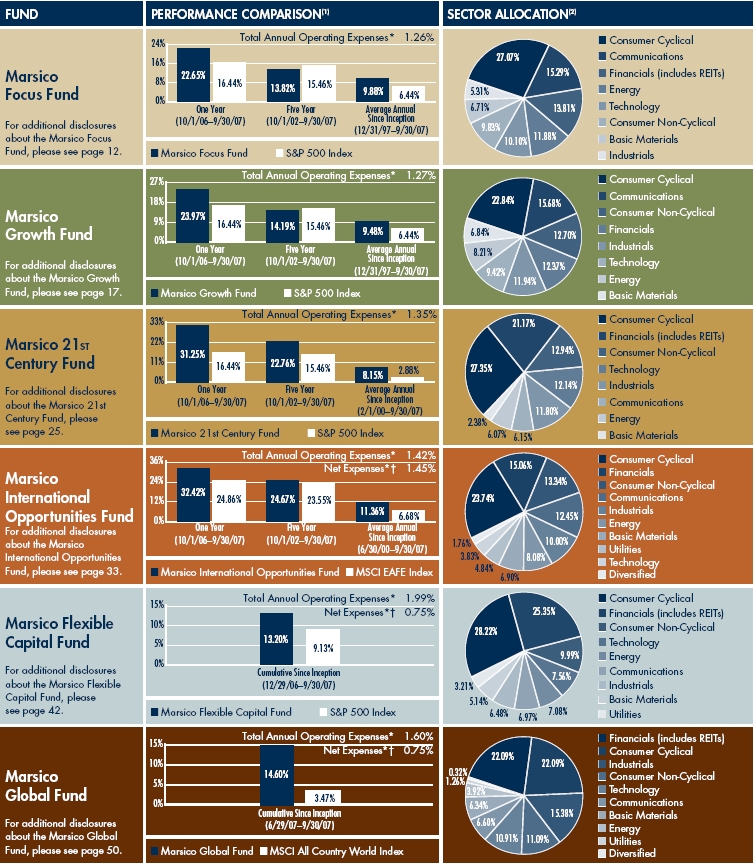
For additional disclosures about the Marsico Funds, please see page 6. The performance data quoted here represent past performance, and past performance is not a guarantee of future results. Investment return and principal value of an investment will fluctuate so that an investor’s shares, when redeemed, may be worth more or less than their original cost. |
4
|
Current performance may be lower or higher than the performance information quoted. To obtain performance information current to the most recent month-end, please call 888.860.8686 or visit www.marsicofunds.com. A redemption fee may be imposed on redemptions or exchanges of Fund shares held for 30 days or less. |
5
|
| * | The Total Annual Operating Expenses and Net Expenses are reflective of the information disclosed in the Funds’ June 29, 2007 Supplement to the Prospectus dated February 1, 2007 for the Focus Fund, Growth Fund, 21st Century Fund, International Opportunities Fund, and Flexible Capital Fund and the June 25, 2007 Prospectus for the Global Fund. The information may differ from the expense ratios disclosed in this report. | |
| † | The Adviser has entered into a written expense limitation agreement under which it has agreed to limit the total expenses of each Fund (excluding interest, taxes, acquired fund fees and expenses, litigation, brokerage and extraordinary expenses) to an annual rate of 1.60% of the International Opportunities Fund’s average net assets, and 0.75% of the Flexible Capital Fund’s and Global Fund’s average net assets until December 31, 2007. This fee waiver may be terminated at any time after December 31, 2007. Prior to June 1, 2007, the written expense limitation agreement relating to the Flexible Capital Fund limited total expenses of the Fund (excluding interest, taxes, acquired fund fees and expenses, litigation, brokerage and extraordinary expenses) to an annual rate of 1.60% of the Fund’s average net assets. The Adviser may recoup any waived amount from a Fund pursuant to this arrangement if such reimbursement does not cause the Fund to exceed existing expense limitations and the reimbursement is made within three years after the year in which the Adviser incurred the expense. Net Expenses for the International Opportunities Fund reflect a 0.03% recoupment of previously waived fees as discussed in the Fund’s Prospectus. | |
| (1) | The performance data quoted here represent past performance, and past performance is not a guarantee of future results. Investment return and principal value of an investment will fluctuate so that an investor’s shares, when redeemed, may be worth more or less than their original cost. Current performance may be lower or higher than the performance information quoted. To obtain performance information current to the most recent month-end, please call 888-860-8686 or visit www.marsicofunds.com. A redemption fee may be imposed on redemptions or exchanges of Fund shares held for 30 days or less. | |
| For the Flexible Capital Fund and the Global Fund, initial public offerings (“IPOs”) made a significant positive contribution to the Funds’ recent performance. There can be no assurance that similar contributions from IPOs will continue in the future. | ||
| The performance included in the table and graph does not reflect the deduction of taxes on Fund distributions or the redemption of Fund shares. | ||
| The performance returns for the 21st Century Fund (for the period prior to March 31, 2004), the International Opportunities Fund (for the period prior to September 30, 2004), the Flexible Capital Fund (for the period ended September 30, 2007), and the Global Fund (for the period ended September 30, 2007) reflect a fee waiver in effect; in the absence of such a waiver, the returns would be reduced. For the period beginning April 2004 through January 2005, performance returns for the 21st Century Fund would be higher but for the reimbursement of fees waived previously. For the period beginning October 2004 through December 2005, performance returns for the International Opportunities Fund would be higher but for the reimbursement of fees waived previously. | ||
| (2) | Sector weightings represent the percentage of the respective Fund’s investments (excluding cash equivalents) in certain general sectors. These sectors may include more than one industry. The Fund’s portfolio composition is subject to change at any time. | |
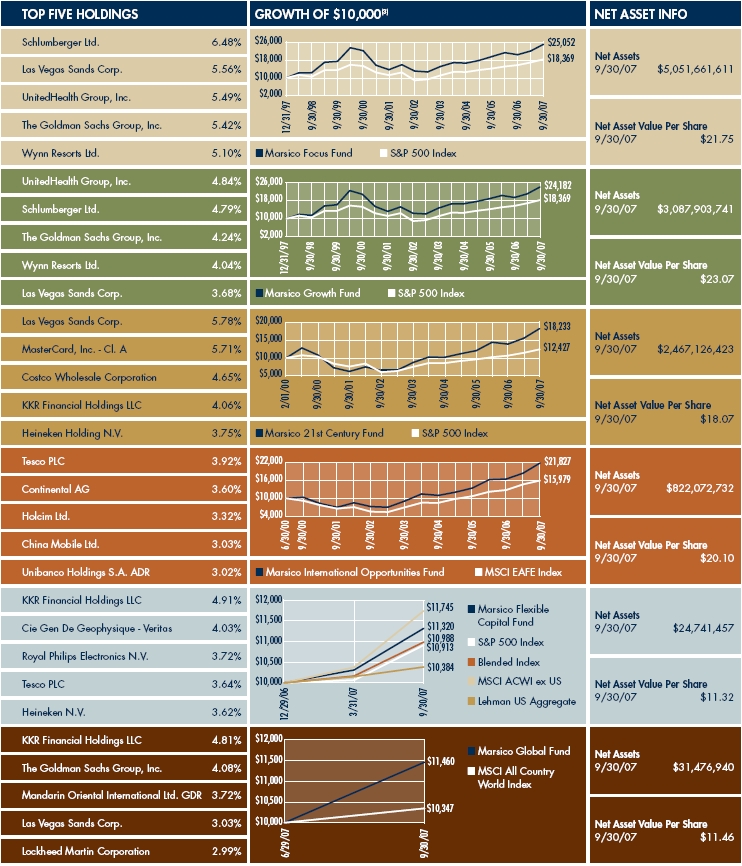
| (3) | This chart assumes an initial investment of $10,000 made on the inception date of each respective Fund. Total returns are based on net change in NAV, assuming reinvestment of distributions. | |
Inception dates are as follows: |
6
|
MARKET ENVIRONMENT: OCTOBER 2006 – SEPTEMBER 2007 (UNAUDITED)
In assessing the Funds’ performance over the one-year fiscal period ended September 30, 2007, it may be helpful, as a starting point, to review how broader equity markets fared during this time frame. Equities around the world posted robust gains, weathering a variety of challenges in the process. Following is a recap of global stock market performance using several well-known benchmark indexes:
| Index Name | Universe of | 12-Month | |||
| Equities Represented | Total Return | ||||
| US | |||||
| S&P 500 | US large | ||||
| capitalization equities | 16.44 | % | |||
| Russell 3000 | US publicly-traded | ||||
| equities of all sizes | 16.52 | % | |||
| Russell 2000 | US small | ||||
| capitalization equities | 12.34 | % | |||
| Russell Mid-Cap | US medium | ||||
| capitalization equities | 17.87 | % | |||
| INTERNATIONAL | |||||
| MSCI EAFE | Equities in developed | ||||
| (US$) | international equity markets, | ||||
| including Japan, Western | |||||
| Europe, and Australasia | 24.86 | % | |||
| MSCI Emerging | Equities in developing | ||||
| Markets (US$) | international equity markets, | ||||
| including China, India, | |||||
| Eastern Europe, and | |||||
| Latin America | 58.17 | % | |||
As shown above, US large and medium capitalization equities outperformed small capitalization equities during the fiscal year, which was a reversal of what transpired during the Funds’ previous fiscal year. International equities, particularly emerging market equities, once again were strong performers on a relative basis and surpassed US equity returns by a considerable margin.
Large capitalization equities, as measured by the S&P 500 Index, posted overall strong gains for the one-year fiscal period ended September 30, 2007 despite considerable intra-period volatility and periodic “headwinds.” Equities were faced with a number of seemingly contradictory data points about the strength and trajectory of the US economy, with concerns regarding inflationary pressures on the one hand and fears of a significant economic slowdown on the other. Higher oil prices, softening housing markets, and modest real wage increases dampened the outlook for consumer discretionary spending, which comprises a major portion of total US Gross Domestic Product (“GDP”). These concerns, which were exacerbated by problems in the mortgage finance area (particularly in the subprime lending market) and protracted housing industry weakness, were further heightened during the period, particularly in July, August, and September when the markets were confronted by rapidly-mounting credit concerns and a liquidity crisis. Stocks sold off sharply in July and August. The US financial system came under duress as the credit-worthiness and valuation of various credit products, particularly those involving securities backed by mortgage loans, came into question. During this time, financial institutions raised lending rates and liquidity was further reduced.
During much of the fiscal year, the Federal Open Market Committee (“FOMC”), the monetary policy-making arm of the Federal Reserve Bank, was preoccupied by inflationary concerns, and generally seemed inclined to favor a tighter approach to monetary policy as a means of damping inflation. Beginning in mid-August, however, the FOMC shifted course, and sought to calm the capital markets through open market operations (i.e., injecting liquidity into the financial system), reducing the discount rate (the interest rate charged to commercial banks and other depository institutions on loans they received from their regional Federal Reserve Bank’s lending facility), and ultimately by slashing the fed funds rate (the interest rate at which depository institutions lend balances at the Federal Reserve Bank to other depository institutions overnight) in mid-September. As the FOMC took action, equities staged a strong recovery.
7
|
MARKET ENVIRONMENT: OCTOBER 2006 – SEPTEMBER 2007 (UNAUDITED) (continued)
US LARGE CAPITALIZATION EQUITIES
US large-cap stocks moved higher during the one-year fiscal period ended September 30, 2007, successfully navigating a variety of challenges, as highlighted above. All 10 S&P 500 Index economic sectors, as defined under the Global Industry Classification Standards (“GICS”), were in positive territory, albeit with a wide degree of variation. Energy (+43%) and Materials (+36%) were the strongest performing sectors, while Financials and Consumer Discretionary sectors were “laggards” with returns of just 2% and 6%, respectively.
Large capitalization equities benefited as the market, particularly in the latter stages of the 12-month period, seemed to experience a shift in leadership that increasingly favored larger-sized, higher-quality, “franchise growth” companies.
US ALL CAPITALIZATION EQUITIES
The performance of the broad US equity market, as measured by the Russell 3000 Index, which encompasses companies of all sizes, was very solid and slightly outmatched the results of the large capitalization arena alone for the one-year period ended September 30, 2007. This performance of the broad market was primarily attributable to the strength in medium-capitalization companies, as depicted above. This mid cap area of the US equity market was buoyant throughout the entire reporting period, and may have benefited from record levels of merger and acquisition activity, particularly transactions initiated by private equity funds (which appeared to decline in frequency toward the end of the Funds’ fiscal year).
INTERNATIONAL EQUITIES
International equities posted very strong results during the one-year fiscal period ended September 30, 2007, surpassing their US equity counterparts by a wide margin. Part of the outperformance of this asset class was attributable to a generally weakening US dollar, which favored US-based investors in international equities. Emerging markets rose even higher, benefiting from rising commodity and natural resource prices and robust economic growth in many international markets. Currency fluctuations were pronounced throughout the fiscal year. The US dollar struggled during the fiscal year, particularly as compared to the Euro.
The MSCI EAFE Index’s largest country-level constituents had mixed results for the fiscal year period. The United Kingdom, France, Germany, and Australia performed well. Japan, however, had a more modest return of 7% for the period.
From a GICS economic sector perspective (using the MSCI EAFE Index as a reference point), performance strength was widespread. All 10 GICS sectors in the MSCI EAFE Index had gains, led by Materials (+57%), Telecommunication Services (+42%), and Industrials (+38%).
At an industry level, results were also strong. Every GICS industry group in the MSCI EAFE Index had a positive return. The top-performing areas included Food & Drug Retailing (+57%), Capital Goods (+45%), Technology Software & Services (+35%), and Automobiles & Components (+33%). The “laggards” were Semiconductors & Semiconductor Equipment and Pharmaceuticals, Biotechnology & Life Sciences, which managed relatively subdued gains of 3% and 4%, respectively.
THE MARSICO INVESTMENT TEAM
8
|
INVESTMENT REVIEW BY TOM MARSICO (UNAUDITED)
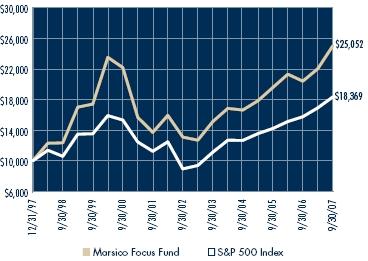
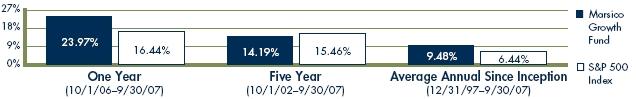
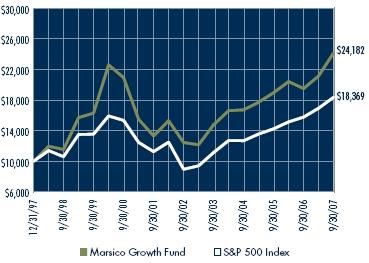
The Focus Fund and Growth Fund significantly outperformed their primary benchmark index for the one-year fiscal period ended September 30, 2007, generating total returns of 22.65% and 23.97%, respectively. For comparative purposes, the S&P 500 Index – which we consider to be the Funds’ primary benchmark index – had a total return of 16.44% for the period ended September 30, 2007. Please see the Funds’ Overviews for more detailed information about each Fund’s longer-term performance for various periods ended September 30, 2007.
The performance data for the Funds quoted here represent past performance, and past performance is not a guarantee of future results. Investment return and principal value of an investment will fluctuate so that an investor’s shares, when redeemed, may be worth more or less than their original cost. Current performance may be lower or higher than the performance information quoted. To obtain performance information current to the most recent month-end, please call 888-860-8686 or visit www.marsicofunds.com.(1)
This review highlights Fund performance over a single one-year fiscal period. Shareholders should keep in mind that the Funds are intended for long-term investors who hold their shares for substantially longer periods of time. You should also keep in mind that our views on all investments discussed in this report are subject to change at any time. References to specific securities, industries, and sectors discussed in this report are not recommendations to buy or sell such securities or related investments, and the Funds may not necessarily hold these securities or investments today. Please see the accompanying Schedule of Investments for the percentage of each Fund’s portfolio represented by the securities mentioned in this report.
As you know, the Focus Fund and Growth Fund often invest in similar growth companies. Their performance may differ at times, however, because of a variety of factors. Among other factors, the Focus Fund is a non-diversified mutual fund that may invest in a more concentrated portfolio and may hold the securities of fewer issuers than the Growth Fund. As a result, the Focus Fund may hold some securities that are different from those held by the Growth Fund, and may be more exposed to individual stock volatility than the Growth Fund or other mutual funds that invest in a larger number of securities.
FOCUS FUND
There were a number of factors that contributed to the Focus Fund’s strong performance for the fiscal year ended September 30, 2007 (as compared with the S&P 500 Index):
- Consumer Discretionary: Consumer Discretionary positions were an area of emphasis for the Focus Fund over the past one-year period, and the Fund benefited from stock selection within the sector. The Fund’s investments in the sector posted a collective gain of more than 41%, led by hotel/ casino operator holdings such as Wynn Resorts Ltd. (+147%), MGM MIRAGE (+128%), and Las Vegas Sands Corp. (+96%), which were among the Fund’s top-performing individual positions.
- Financials: The Fund’s holdings in the Financials sector had a collective gain of 14% during the reporting period, far surpassing the S&P 500 Index’s sector return of 2%, which represented its lowest sector-level return. The Fund benefited both from having an underweighted posture in the sector and from strong stock selection within the sector. Specifically, Industrial and Commercial Bank of China (+54%) and The Goldman Sachs Group, Inc. (+29%) were the Fund’s main sources of outperformance in the sector.
9
|
- Materials: The Fund increased its exposure to the Materials sector during the year. Agricultural products company Monsanto Company (+143%) and mining and production company Freeport- McMoRan Copper & Gold, Inc. (32%) aided performance results.
- Information Technology: Stock selection in the Information Technology sector was an additional area of strength for the Fund, led by Technology Hardware & Equipment holdings. Apple, Inc. (+53%) and Cisco Systems, Inc. (+44%) were the largest contributors to the Fund’s performance in this sector.
There were a few areas of weakness for the Focus Fund during the annual period. Stock selection in the Health Care and Industrials sectors detracted from performance, as did an underweighted posture in the Energy sector, which was the equity markets’ strongest performing sector. In Health Care, the main culprits were positions in biotechnology company Genentech, Inc. (-6%) and health care services company UnitedHealth Group, Inc. (-2%). Those disappointing returns materially impacted the Fund’s overall performance, and their impact was amplified due to the fact that UnitedHealth and Genentech were among the Fund’s largest individual positions during the reporting period. With regard to Industrials, the Fund’s positions posted a collective gain of 15%. While this performance was strong in an absolute sense, it trailed the S&P 500 Index’s Industrials sector return of 24%.
GROWTH FUND
The Growth Fund shared many of the Focus Fund’s performance characteristics for the one-year period ended September 30, 2007, plus several others. In particular, the Fund benefited from the following factors:
- Consumer Discretionary: Similar to the Focus Fund, the Growth Fund’s positions in the sector performed well, posting a return of 38% in aggregate. Hotel/casino operator holdings were the main contributors, including Wynn Resorts Ltd. (+147%), MGM MIRAGE (+126%), Las Vegas Sands Corp. (+96%), and Station Casinos, Inc. (+53%). Other individual holdings within the sector that performed well included restaurant operator Yum! Brands, Inc. (+32%) and Four Seasons Hotels, Inc. (+29% prior to being sold in connection with a buyout of the company by several investors).
- Financials: The Fund’s holdings in the Financials sector had a solid gain of 10% during the reporting period, exceeding the S&P 500 Index’s sector return of 2%. Stock selection was led by banking positions Industrial and Commercial Bank of China (+69%) and China Merchants Bank Co., Ltd. (+130%), and investment banking and asset management company The Goldman Sachs Group, Inc. (+29%). The Fund further benefited from having an underweighted posture in the sector which, as noted in the Market Environment section, was the weakest performing sector of the S&P 500 Index.
- Materials: Similar to the Focus Fund, the Growth Fund selectively increased its exposure to the Materials sector during the reporting period. Agricultural products company Monsanto Company (+84%), mining and production company Freeport-McMoRan Copper & Gold, Inc. (+47%), and industrial gas company Praxair, Inc. (+45%) aided performance results.
- Telecommunication Services: Wireless services providers China Mobile Ltd. (+109%) and Latin America-based America Movil S.A. de C.V. (+64%) were among the Fund’s strongest performing individual positions.
10
|
There were several areas of weakness for the Fund during the fiscal year. Stock selection in the Health Care and Industrials sectors materially detracted from performance. While the Fund’s Industrials holdings gained 17% in aggregate, the return significantly lagged the S&P 500 Index’s Industrials sector performance of 24%. In Health Care, biotechnology company Genentech, Inc. and health care services provider UnitedHealth Group, Inc. declined by -6% and -2%, respectively. The impact of those sub-par returns was exacerbated by the fact that these holdings were among the Fund’s largest positions during the reporting period. In addition, the Fund maintained an underweighted posture in the Energy sector during the period. This positioning hurt the Fund, as Energy was the strongest performing sector of the Fund’s benchmark S&P 500 Index. Fiscal Year-End Investment Posture As of September 30, 2007, the Focus Fund and Growth Fund’s primary sector allocations were in Consumer Discretionary, Information Technology, Financials, Energy, and Health Care. The Funds had few or no investments in Utilities.
Sincerely, THOMAS F. MARSICO |
| (1) | Total returns are based on net change in NAV assuming reinvestment of distributions. A redemption fee of 2% may be imposed on redemptions or exchanges of Fund shares owned for 30 days or less. Please see the Prospectus for more information. |
11
|
. |
FUND OVERVIEW September 30, 2007 (Unaudited) The Focus Fund invests primarily in the common stocks of large companies, normally a core position of 20–30 common stocks that are selected for their long-term growth potential. |
| PERFORMANCE COMPARISON |
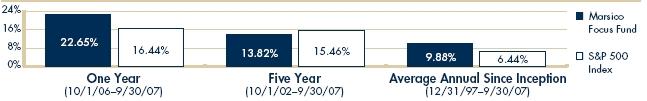 |
| TOTAL ANNUAL OPERATING EXPENSES* | 1.26 | % |
| NET ASSETS | ||
| 9/30/07 | $5,051,661,611 | |
| NET ASSET VALUE | ||
| Net Asset Value Per Share | $21.75 | |
| TOP FIVE HOLDINGS | ||
| Schlumberger Ltd. | 6.48 | % |
| Las Vegas Sands Corp. | 5.56 | |
| UnitedHealth Group, Inc. | 5.49 | |
| The Goldman Sachs | ||
| Group, Inc. | 5.42 | |
| Wynn Resorts Ltd. | 5.10 | |
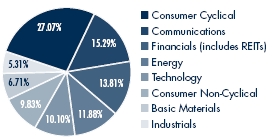
| SECTOR ALLOCATION(2) | ||
 | ||
| GROWTH OF $10,000(1) | ||
 | ||
| * | The Total Annual Operating Expenses are reflective of the information disclosed in the Funds’ June 29, 2007 Supplement to the Prospectus dated February 1, 2007 and may differ from the expense ratios disclosed in this report. | |
| The performance data quoted here represent past performance, and past performance is not a guarantee of future results. Investment return and principal value of an investment will fluctuate so that an investor’s shares, when redeemed, may be worth more or less than their original cost. Current performance may be lower or higher than the performance information quoted. To obtain performance information current to the most recent month-end, please call 888-860-8686 or visit www.marsicofunds.com. A redemption fee may be imposed on redemptions or exchanges of Fund shares held for 30 days or less. | ||
| The performance included in the table and graph does not reflect the deduction of taxes on Fund distributions or the redemption of Fund shares. | ||
| (1) | This chart assumes an initial investment of $10,000 made on December 31, 1997 (inception). Total returns are based on net change in NAV, assuming reinvestment of distributions. | |
| (2) | Sector weightings represent the percentage of the Fund’s investments (excluding cash equivalents) in certain general sectors. These sectors may include more than one industry. The Fund’s portfolio composition is subject to change at any time. | |
12
|
| SCHEDULE OF INVESTMENTS September 30, 2007 | ||||||
| Number | Percent | |||||
| of | of Net | |||||
| Shares | Value | Assets | ||||
| COMMON STOCKS | ||||||
| Aerospace/Defense | ||||||
| General Dynamics | ||||||
| Corporation | 1,219,401 | $103,002,802 | 2.04 | % | ||
| Lockheed Martin | ||||||
| Corporation | 1,462,672 | 158,685,285 | 3.14 | |||
| 261,688,087 | 5.18 | |||||
| Agricultural Chemicals | ||||||
| Monsanto Company | 2,105,840 | 180,554,722 | 3.57 | |||
| Automotive - Cars/Light Trucks | ||||||
| Toyota Motor | ||||||
| Corporation Spon. ADR | 1,241,499 | 145,081,573 | 2.87 | |||
| Cable TV | ||||||
| Comcast | ||||||
| Corporation – Cl. A* | 6,368,693 | 153,994,997 | 3.05 | |||
| Casino Hotels | ||||||
| Las Vegas Sands Corp.* | 2,103,704 | 280,676,188 | 5.56 | |||
| MGM MIRAGE* | 1,381,136 | 123,528,804 | 2.44 | |||
| Wynn Resorts Ltd. | 1,633,932 | 257,442,326 | 5.10 | |||
| 661,647,318 | 13.10 | |||||
| Commercial Banks - Non-U.S. | ||||||
| Industrial and Commercial | ||||||
| Bank of China – Cl. H | 320,466,100 | 223,844,160 | 4.43 | |||
| Computers | ||||||
| Apple, Inc.* | 1,571,953 | 241,357,664 | 4.78 | |||
| Hewlett-Packard Company | 2,069,677 | 103,049,218 | 2.04 | |||
| 344,406,882 | 6.82 | |||||
| Electronic Components - Semiconductors | ||||||
| Intel Corporation | 5,930,372 | 153,359,420 | 3.04 | |||
| Finance - Investment Banker/Broker | ||||||
| The Goldman | ||||||
| Sachs Group, Inc. | 1,263,467 | 273,843,838 | 5.42 | |||
| Industrial Gases | ||||||
| Air Products & Chemicals, Inc. | 404,797 | 39,572,955 | 0.78 | |||
| Medical - Biomedical/Genetic | ||||||
| Genentech, Inc.* | 2,657,961 | 207,374,117 | 4.10 | |||
| Medical - HMO | ||||||
| UnitedHealth Group, Inc. | 5,725,244 | 277,273,567 | 5.49 | |||
| Metal - Diversified | ||||||
| Freeport-McMoRan | ||||||
| Copper & Gold, Inc. | 1,053,182 | 110,468,260 | 2.19 | |||
| Networking Products | ||||||
| Cisco Systems, Inc.* | 7,240,626 | 239,737,127 | 4.74 | |||
| Oil - Field Services | ||||||
| Schlumberger Ltd. | 3,119,684 | 327,566,820 | 6.48 | |||
| Oil & Gas - Drilling | ||||||
| Transocean, Inc.* | 1,316,722 | 148,855,422 | 2.95 | |||
| Oil Companies - Integrated | ||||||
| Petroleo Brasileiro S.A. ADR | 1,446,017 | 109,174,283 | 2.16 | |||
| REITs - Warehouse/Industrial | ||||||
| ProLogis | 1,377,301 | 91,383,921 | 1.81 | |||
| Retail - Building Products | ||||||
| Lowe’s Companies, Inc. | 4,420,291 | 123,856,554 | 2.45 | |||
| Retail - Drug Stores | ||||||
| CVS/Caremark Corporation | 3,935,624 | 155,968,779 | 3.09 | |||
| Retail - Restaurants | ||||||
| McDonald’s Corporation | 4,553,865 | 248,049,026 | 4.91 | |||
| Super-Regional Banks - U.S. | ||||||
| Wells Fargo & Company | 2,579,050 | 91,865,761 | 1.82 | |||
| Telephone - Integrated | ||||||
| AT&T, Inc. | 4,738,483 | 200,485,216 | 3.97 | |||
| Web Portals/Internet Service Providers | ||||||
| Google, Inc. – Cl. A* | 281,145 | 159,485,124 | 3.16 | |||
| TOTAL COMMON STOCKS | ||||||
| (Cost $3,422,606,899) | 4,929,537,929 | 97.58 | ||||
| SHORT-TERM INVESTMENTS | ||||||
| SSgA U.S. Government Money | ||||||
| Market Fund, 4.68% | 35,536,127 | 35,536,127 | 0.70 | |||
| SSgA U.S. Treasury Money | ||||||
| Market Fund, 3.84% | 50,900,922 | 50,900,922 | 1.01 | |||
| United States Treasury | ||||||
| Bill, 3.55%, 1/3/08 | 12,828,000 | 12,701,221 | 0.25 | |||
| United States Treasury | ||||||
| Bill, 3.65%, 1/10/08 | 21,843,000 | 21,613,015 | 0.43 | |||
| United States Treasury | ||||||
| Bill, 3.75%, 1/31/08 | 8,971,000 | 8,855,014 | 0.17 | |||
| United States Treasury | ||||||
| Bill, 3.80%, 2/7/08 | 8,522,000 | 8,403,757 | 0.17 | |||
| TOTAL SHORT-TERM INVESTMENTS | ||||||
| (Cost $138,028,414) | 138,010,056 | 2.73 | ||||
| TOTAL INVESTMENTS | ||||||
| (Cost $3,560,635,313) | 5,067,547,985 | 100.31 | ||||
| Liabilities Less Cash and Other Assets | (15,886,374 | ) | (0.31 | ) | ||
| NET ASSETS | $5,051,661,611 | 100.00 | % | |||
| * | Non-income producing. | |
| See notes to financial statements. | ||
13
|
| STATEMENT OF ASSETS AND LIABILITIES | ||
| September 30, 2007 | ||
| (Amounts in thousands) | ||
| ASSETS | ||
| Investments, at value (cost $3,560,635) | $5,067,548 | |
| Receivable for investments sold | 12,584 | |
| Receivable for capital stock sold | 3,934 | |
| Interest and dividends receivable | 2,139 | |
| Prepaid expenses and other assets | 863 | |
| Total Assets | 5,087,068 | |
| LIABILITIES | ||
| Payable for investments purchased | 24,372 | |
| Payable for capital stock redeemed | 4,544 | |
| Accrued investment advisory fee | 3,145 | |
| Accrued distribution fee | 909 | |
| Accrued trustees’ fee | 754 | |
| Accrued expenses and other liabilities | 1,682 | |
| Total Liabilities | 35,406 | |
| NET ASSETS | $5,051,662 | |
| NET ASSETS CONSIST OF | ||
| Paid-in-capital | $3,238,121 | |
| Accumulated net investment loss | (940 | ) |
| Accumulated net realized gain on | ||
| investments and foreign currency transactions | 307,329 | |
| Net unrealized appreciation on investments | ||
| and foreign currency translations | 1,507,152 | |
| NET ASSETS | $5,051,662 | |
| SHARES OUTSTANDING, $0.001 par value | ||
| (Unlimited shares authorized) | 232,212 | |
| NET ASSET VALUE, REDEMPTION PRICE, | ||
| AND OFFERING PRICE PER SHARE | ||
| (NET ASSETS/SHARES OUTSTANDING)* | $21.75 | |
| STATEMENT OF OPERATIONS | ||
| FOR THE YEAR ENDED September 30, 2007 | ||
| (Amounts in thousands) | ||
| INVESTMENT INCOME | ||
| Interest | $9,505 | |
| Dividends (net of $670 of non-reclaimable | ||
| foreign withholding taxes) | 40,059 | |
| Total Investment Income | 49,564 | |
| EXPENSES | ||
| Investment advisory fees | 39,366 | |
| Distribution fees | 12,122 | |
| Transfer agent fees and expenses | 5,148 | |
| Printing and postage expenses | 926 | |
| Custody and fund accounting fees | 700 | |
| Fund administration fees | 390 | |
| Trustees’ fees and expenses | 294 | (1) |
| Miscellaneous | 222 | |
| Professional fees | 215 | |
| Federal and state registration fees | 139 | |
| Total Expenses | 59,522 | |
| Less expenses paid indirectly | (126 | ) |
| Net Expenses | 59,396 | |
| NET INVESTMENT LOSS | (9,832 | ) |
| REALIZED AND UNREALIZED GAIN | ||
| Net realized gain on investments | 370,444 | |
| Net realized gain on foreign | ||
| currency transactions | 52 | |
| Change in unrealized appreciation/ | ||
| depreciation on investments and | ||
| foreign currency translations | 622,469 | |
| Net Gain on Investments | 992,965 | |
| NET INCREASE IN NET ASSETS | ||
| RESULTING FROM OPERATIONS | $983,133 | |
| * | Not in thousands. | |
| (1) | Includes $160,991 for trustees fees and expenses and $133,378 for the unrealized appreciation related to the mark to market of the shares in the Deferred Fee Plan during the year ended September 30, 2007. | |
| See notes to financial statements. | ||
14
|
| STATEMENTS OF CHANGES IN NET ASSETS | |||||
| Year | Year | ||||
| Ended | Ended | ||||
| (Amounts in thousands) | 9/30/07 | 9/30/06 | |||
| OPERATIONS | |||||
| Net investment loss | $(9,832 | ) | $(5,610 | ) | |
| Net realized gain on investments | 370,444 | 241,639 | |||
| Net realized gain on foreign currency transactions | 52 | — | (1) | ||
| Change in unrealized appreciation/depreciation | |||||
| on investments and foreign currency translations | 622,469 | (83,235 | ) | ||
| Net increase in net assets resulting from operations | 983,133 | 152,794 | |||
| DISTRIBUTIONS | |||||
| Net investment income | (5,110 | ) | — | ||
| Net realized gains | (118,228 | ) | — | ||
| Total distributions | (123,338 | ) | — | ||
| CAPITAL SHARE TRANSACTIONS | |||||
| Proceeds from sale of shares | 1,232,491 | 1,548,292 | |||
| Proceeds from reinvestment of distributions | 120,538 | — | |||
| Redemption fees | 41 | 64 | |||
| Redemption of shares | (1,777,658 | ) | (824,886 | ) | |
| Net increase (decrease) from capital share transactions | (424,588 | ) | 723,470 | ||
| TOTAL INCREASE IN NET ASSETS | 435,207 | 876,264 | |||
| NET ASSETS | |||||
| Beginning of period | 4,616,455 | 3,740,191 | |||
| END OF PERIOD | $5,051,662 | $4,616,455 | |||
| Accumulated net investment loss | (940 | ) | (802 | ) | |
| TRANSACTIONS IN SHARES | |||||
| Shares sold | 62,930 | 85,019 | |||
| Shares issued in reinvestment of distributions | 6,311 | — | |||
| Shares redeemed | (90,816 | ) | (45,617 | ) | |
| NET INCREASE (DECREASE) | (21,575 | ) | 39,402 | ||
| (1) | Less than $1,000. | |
| See notes to financial statements. | ||
15
|
| FINANCIAL HIGHLIGHTS | ||||||||||||||
| Year | Year | Year | Year | Year | ||||||||||
| For a Fund Share Outstanding | Ended | Ended | Ended | Ended | Ended | |||||||||
| Throughout the Period. | 9/30/07 | 9/30/06 | 9/30/05 | 9/30/04 | 9/30/03 | |||||||||
| NET ASSET VALUE, BEGINNING OF PERIOD | $18.19 | $17.45 | $14.83 | $13.49 | $11.68 | |||||||||
| INCOME FROM INVESTMENT OPERATIONS | ||||||||||||||
| Net investment income (loss) | (0.04 | ) | (0.02 | ) | (0.03 | ) | (0.05 | ) | (0.03 | ) | ||||
| Net realized and unrealized gains on investments | 4.09 | 0.76 | 2.65 | 1.39 | 1.84 | |||||||||
| Total from investment operations | 4.05 | 0.74 | 2.62 | 1.34 | 1.81 | |||||||||
| DISTRIBUTIONS & OTHER | ||||||||||||||
| Net investment income | (0.02 | ) | — | — | — | — | ||||||||
| Net realized gains | (0.47 | ) | — | — | — | — | ||||||||
| Redemption fees [See Note 2(i)] | — | (1) | — | (1) | — | (1) | — | (1) | — | |||||
| Total distributions & other | (0.49 | ) | — | — | — | — | ||||||||
| NET ASSET VALUE, END OF PERIOD | $21.75 | $18.19 | $17.45 | $14.83 | $13.49 | |||||||||
| TOTAL RETURN | 22.65% | 4.24% | 17.67% | 9.93% | 15.50% | |||||||||
| SUPPLEMENTAL DATA AND RATIOS | ||||||||||||||
| Net assets, end of period (000s) | $5,051,662 | $4,616,455 | $3,740,191 | $2,895,322 | $2,282,113 | |||||||||
| Ratio of expenses to average net assets, | ||||||||||||||
| before expenses paid indirectly | 1.23% | 1.24% | 1.25% | 1.30% | 1.34% | |||||||||
| Ratio of net investment income (loss) to average net | ||||||||||||||
| assets, net of expenses paid indirectly | (0.20)% | (0.13)% | (0.18)% | (0.36)% | (0.54)% | |||||||||
| Ratio of net investment income (loss) to average net | ||||||||||||||
| assets, before expenses paid indirectly | (0.21)% | (0.15)% | (0.21)% | (0.40)% | (0.59)% | |||||||||
| Portfolio turnover rate | 69% | 80% | 84% | 84% | 90% | |||||||||
| (1) | Less than $0.01. | ||
See notes to financial statements. |
16
|
FUND OVERVIEW September 30, 2007 (Unaudited) The Growth Fund invests primarily in the common stocks of large companies that are selected for their long-term growth potential. The Growth Fund will normally hold a core position of between 35 and 50 common stocks. |
| PERFORMANCE COMPARISON |
 |
| TOTAL ANNUAL OPERATING EXPENSES* | 1.27 | % |
| NET ASSETS | ||
| 9/30/07 | $3,087,903,741 | |
| NET ASSET VALUE | ||
| Net Asset Value Per Share | $23.07 | |
| TOP FIVE HOLDINGS | ||
| UnitedHealth Group, Inc. | 4.84 | % |
| Schlumberger Ltd. | 4.79 | |
| The Goldman Sachs | ||
| Group, Inc. | 4.24 | |
| Wynn Resorts Ltd. | 4.04 | |
| Las Vegas Sands Corp. | 3.68 | |
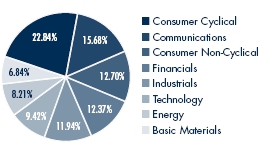
| SECTOR ALLOCATION(2) | ||
 | ||
| GROWTH OF $10,000(1) | ||
 | ||
| * | The Total Annual Operating Expenses are reflective of the information disclosed in the Funds’ June 29, 2007 Supplement to the Prospectus dated February 1, 2007 and may differ from the expense ratios disclosed in this report. | |
| The performance data quoted here represent past performance, and past performance is not a guarantee of future results. Investment return and principal value of an investment will fluctuate so that an investor’s shares, when redeemed, may be worth more or less than their original cost. Current performance may be lower or higher than the performance information quoted. To obtain performance information current to the most recent month-end, please call 888-860-8686 or visit www.marsicofunds.com. A redemption fee may be imposed on redemptions or exchanges of Fund shares owned for 30 days or less. | ||
| The performance included in the table and graph does not reflect the deduction of taxes on Fund distributions or the redemption of Fund shares. | ||
| (1) | This chart assumes an initial investment of $10,000 made on December 31, 1997 (inception). Total returns are based on net change in NAV, assuming reinvestment of distributions. | |
| (2) | Sector weightings represent the percentage of the Fund’s investments (excluding cash equivalents) in certain general sectors. These sectors may include more than one industry. The Fund’s portfolio composition is subject to change at any time. | |
17
|
| SCHEDULE OF INVESTMENTS September 30, 2007 | |||||||
| Number | Percent | ||||||
| of | of Net | ||||||
| Shares | Value | Assets | |||||
| COMMON STOCKS | |||||||
| Aerospace/Defense | |||||||
| The Boeing Company | 591,242 | $62,074,498 | 2.01 | % | |||
| General Dynamics | |||||||
| Corporation | 1,095,705 | 92,554,201 | 3.00 | ||||
| Lockheed Martin Corporation | 889,464 | 96,497,949 | 3.12 | ||||
| 251,126,648 | 8.13 | ||||||
| Agricultural Chemicals | |||||||
| Monsanto Company | 1,123,304 | 96,312,085 | 3.12 | ||||
| Automotive - Cars/Light Trucks | |||||||
| Toyota Motor | |||||||
| Corporation Spon. ADR | 627,826 | 73,367,746 | 2.38 | ||||
| Brewery | |||||||
| Heineken N.V. ADR | 1,648,573 | 53,743,480 | 1.74 | ||||
| Cable TV | |||||||
| Comcast Corporation - Cl. A* | 3,378,057 | 81,681,418 | 2.65 | ||||
| Casino Hotels | |||||||
| Las Vegas Sands Corp.* | 851,582 | 113,618,070 | 3.68 | ||||
| MGM MIRAGE* | 868,411 | 77,670,680 | 2.51 | ||||
| Station Casinos, Inc. | 162,963 | 14,256,003 | 0.46 | ||||
| Wynn Resorts Ltd. | 791,390 | 124,691,408 | 4.04 | ||||
| 330,236,161 | 10.69 | ||||||
| Cellular Telecommunications | |||||||
| America Movil S.A. | |||||||
| de C.V. ADR Ser. L | 941,379 | 60,248,256 | 1.95 | ||||
| China Mobile Ltd. | 4,495,500 | 73,557,838 | 2.38 | ||||
| 133,806,094 | 4.33 | ||||||
| Commercial Banks - Non-U.S. | |||||||
| China Merchants | |||||||
| Bank Co., Ltd. - Cl. H | 2,676,500 | 11,757,684 | 0.38 | ||||
| Industrial and Commercial | |||||||
| Bank of China - Cl. H | 115,923,000 | 80,971,705 | 2.62 | ||||
| 92,729,389 | 3.00 | ||||||
| Computers | |||||||
| Apple, Inc.* | 630,372 | 96,787,317 | 3.13 | ||||
| Hewlett-Packard Company | 827,869 | 41,219,598 | 1.34 | ||||
| 138,006,915 | 4.47 | ||||||
| Data Processing/Management | |||||||
| MasterCard, Inc. - Cl. A | 482,768 | 71,435,181 | 2.31 | ||||
| Electronic Components - Semiconductors | |||||||
| Intel Corporation | 2,758,718 | 71,340,447 | 2.31 | ||||
| Finance - Investment Banker/Broker | |||||||
| The Goldman Sachs | |||||||
| Group, Inc. | 604,724 | 131,067,880 | 4.24 | ||||
| Lehman Brothers | |||||||
| Holdings, Inc. | 918,150 | 56,677,399 | 1.84 | ||||
| Morgan Stanley | 123,911 | 7,806,393 | 0.25 | ||||
| 195,551,672 | 6.33 | ||||||
| Finance - Mortgage Loan/Banker | |||||||
| Fannie Mae | 399,060 | 24,266,839 | 0.79 | ||||
| Industrial Gases | |||||||
| Air Products & Chemicals, Inc. | 175,868 | 17,192,856 | 0.56 | ||||
| Praxair, Inc. | 648,988 | 54,359,235 | 1.76 | ||||
| 71,552,091 | 2.32 | ||||||
| Medical - Biomedical/Genetic | |||||||
| Genentech, Inc.* | 1,300,961 | 101,500,977 | 3.29 | ||||
| Medical - Drugs | |||||||
| Schering-Plough Corporation | 966,671 | 30,575,804 | 0.99 | ||||
| Medical - HMO | |||||||
| UnitedHealth Group, Inc. | 3,088,328 | 149,567,725 | 4.84 | ||||
| Metal - Diversified | |||||||
| Freeport-McMoRan | |||||||
| Copper & Gold, Inc. | 343,259 | 36,004,437 | 1.17 | ||||
| Networking Products | |||||||
| Cisco Systems, Inc.* | 2,632,204 | 87,152,274 | 2.82 | ||||
| Juniper Networks, Inc.* | 702,671 | 25,724,785 | 0.84 | ||||
| 112,877,059 | 3.66 | ||||||
| Oil - Field Services | |||||||
| Schlumberger Ltd. | 1,407,360 | 147,772,800 | 4.79 | ||||
| Oil & Gas - Drilling | |||||||
| Transocean, Inc.* | 356,491 | 40,301,308 | 1.30 | ||||
| Oil Companies - Exploration & Production | |||||||
| Devon Energy Corporation | 175,024 | 14,561,997 | 0.47 | ||||
| Oil Companies - Integrated | |||||||
| Petroleo Brasileiro S.A. ADR | 282,623 | 21,338,037 | 0.69 | ||||
| Oil Field Machinery & Equipment | |||||||
| Cameron International | |||||||
| Corporation* | 223,928 | 20,666,315 | 0.67 | ||||
| Retail - Building Products | |||||||
| Lowe’s Companies, Inc. | 2,237,315 | 62,689,566 | 2.03 | ||||
| * | Non-income producing. | |
| See notes to financial statements. | ||
18
|
SCHEDULE OF INVESTMENTS September 30, 2007 |
| Number | Percent | |||||
| of | of Net | |||||
| Shares | Value | Assets | ||||
| COMMON STOCKS continued | ||||||
| Retail - Drug Stores | ||||||
| CVS/Caremark Corporation | 1,118,162 | $44,312,760 | 1.44 | % | ||
| Retail - Restaurants | ||||||
| McDonald's Corporation | 1,970,746 | 107,346,535 | 3.48 | |||
| Yum! Brands, Inc. | 1,861,640 | 62,979,281 | 2.04 | |||
| 170,325,816 | 5.52 | |||||
| Super-Regional Banks - U.S. | ||||||
| Wells Fargo & Company | 1,581,680 | 56,339,442 | 1.82 | |||
| Telephone - Integrated | ||||||
| AT&T, Inc. | 2,016,520 | 85,318,961 | 2.76 | |||
| Therapeutics | ||||||
| Amylin Pharmaceuticals, Inc.* | 866,156 | 43,307,800 | 1.40 | |||
| Transportation - Rail | ||||||
| Union Pacific Corporation | 595,929 | 67,375,733 | 2.18 | |||
| Transportation - Services | ||||||
| FedEx Corporation | 357,081 | 37,404,235 | 1.21 | |||
| Web Portals/Internet Service Providers | ||||||
| Google, Inc. - Cl. A* | 94,626 | 53,678,491 | 1.74 | |||
| TOTAL COMMON STOCKS | ||||||
| (Cost $2,053,821,267) | 2,981,075,429 | 96.54 | ||||
| SHORT-TERM INVESTMENTS | ||||||
| SSgA Prime Money | ||||||
| Market Funds, 5.19% | 8,337,776 | 8,337,776 | 0.27 | |||
| SSgA U.S. Government Money | ||||||
| Market Fund, 4.68% | 31,062,630 | 31,062,630 | 1.01 | |||
| SSgA U.S. Treasury Money | ||||||
| Market Fund, 3.84% | 62,125,260 | 62,125,260 | 2.01 | |||
| TOTAL SHORT-TERM INVESTMENTS | ||||||
| (Cost $101,525,666) | 101,525,666 | 3.29 | ||||
| TOTAL INVESTMENTS | ||||||
| (Cost $2,155,346,933) | 3,082,601,095 | 99.83 | ||||
| Cash and Other Assets Less Liabilities | 5,302,646 | 0.17 | ||||
| NET ASSETS | $3,087,903,741 | 100.00 | % | |||
| * | Non-income producing. | |
| See notes to financial statements. |
19
|
STATEMENT OF ASSETS AND LIABILITIES |
September 30, 2007 |
| (Amounts in thousands) | ||
| ASSETS | ||
| Investments, at value (cost $2,155,347) | $3,082,601 | |
| Receivable for investments sold | 9,127 | |
| Receivable for capital stock sold | 6,942 | |
| Interest and dividends receivable | 1,161 | |
| Prepaid expenses and other assets | 463 | |
| Total Assets | 3,100,294 | |
| LIABILITIES | ||
| Payable for investments purchased | 2,878 | |
| Payable for capital stock redeemed | 5,525 | |
| Accrued investment advisory fee | 1,996 | |
| Accrued distribution fee | 747 | |
| Accrued trustees’ fees | 400 | |
| Accrued expenses and other liabilities | 844 | |
| Total Liabilities | 12,390 | |
| NET ASSETS | $3,087,904 | |
| NET ASSETS CONSIST OF | ||
| Paid-in-capital | $2,068,843 | |
| Accumulated net investment loss | (506 | ) |
| Accumulated net realized gain on investments and | ||
| foreign currency transactions | 92,187 | |
| Net unrealized appreciation on investments | ||
| and foreign currency translations | 927,380 | |
| NET ASSETS | $3,087,904 | |
| SHARES OUTSTANDING, $0.001 par value | ||
| (Unlimited shares authorized) | 133,861 | |
| NET ASSET VALUE, REDEMPTION PRICE, | ||
| AND OFFERING PRICE PER SHARE | ||
| (NET ASSETS/SHARES OUTSTANDING)* | $23.07 | |
STATEMENT OF OPERATIONS | ||
FOR THE YEAR ENDED September 30, 2007 | ||
| (Amounts in thousands) | ||
| INVESTMENT INCOME | ||
| Interest | $2,375 | |
| Dividends (net of $408 of non-reclaimable | ||
| foreign withholding taxes) | 25,395 | |
| Total Investment Income | 27,770 | |
| EXPENSES | ||
| Investment advisory fees | 23,825 | |
| Distribution fees | 7,008 | |
| Transfer agent fees and expenses | 2,326 | |
| Custody and fund accounting fees | 442 | |
| Printing and postage expenses | 420 | |
| Fund administration fees | 288 | |
| Trustees’ fees and expenses | 170 | (1) |
| Miscellaneous | 121 | |
| Professional fees | 119 | |
| Federal and state registration fees | 89 | |
| Total Expenses | 34,808 | |
| Less expenses paid indirectly | (47 | ) |
| Net Expenses | 34,761 | |
| NET INVESTMENT LOSS | (6,991 | ) |
| REALIZED AND UNREALIZED GAIN | ||
| Net realized gain on investments | 118,821 | |
| Net realized gain on foreign | ||
| currency transactions | 21 | |
| Change in unrealized appreciation/ | ||
| depreciation on investments and | ||
| foreign currency translations | 491,793 | |
| Net Gain on Investments | 610,635 | |
| NET INCREASE IN NET ASSETS | ||
| RESULTING FROM OPERATIONS | $603,644 | |
| * | Not in thousands. | |
| (1) | Includes $90,780 for trustees fees and expenses and $79,427 for the unrealized appreciation related to the mark to market of the shares in the Deferred Fee Plan during the year ended September 30, 2007. | |
See notes to financial statements. |
20
|
| STATEMENTS OF CHANGES IN NET ASSETS |
| Year | Year | |||||
| Ended | Ended | |||||
| (Amounts in thousands) | 9/30/07 | 9/30/06 | ||||
| OPERATIONS | ||||||
| Net investment loss | $(6,991 | ) | $(6,150 | ) | ||
| Net realized gain on investments | 118,821 | 93,450 | ||||
| Net realized gain on foreign currency transactions | 21 | — | (1) | |||
| Change in unrealized appreciation/depreciation | ||||||
| on investments and foreign currency translations | 491,793 | (30,092 | ) | |||
| Net increase in net assets resulting from operations | 603,644 | 57,208 | ||||
| CAPITAL SHARE TRANSACTIONS | ||||||
| Proceeds from sale of shares | 699,062 | 959,936 | ||||
| Redemption fees | 41 | 71 | ||||
| Redemption of shares | (765,484 | ) | (592,242 | ) | ||
| Net increase (decrease) from capital share transactions | (66,381 | ) | 367,765 | |||
| TOTAL INCREASE IN NET ASSETS | 537,263 | 424,973 | ||||
| NET ASSETS | ||||||
| Beginning of period | 2,550,641 | 2,125,668 | ||||
| END OF PERIOD | $3,087,904 | $2,550,641 | ||||
| Accumulated net investment loss | (506 | ) | (416 | ) | ||
| TRANSACTIONS IN SHARES | ||||||
| Shares sold | 33,881 | 51,358 | ||||
| Shares redeemed | (37,077 | ) | (31,795 | ) | ||
| NET INCREASE (DECREASE) | (3,196 | ) | 19,563 | |||
| (1) | Less than $1,000. | |
| See notes to financial statements. |
21
|
| FINANCIAL HIGHLIGHTS | |||||||||||||||
| Year | Year | Year | Year | Year | |||||||||||
| For a Fund Share Outstanding | Ended | Ended | Ended | Ended | Ended | ||||||||||
| Throughout the Period. | 9/30/07 | 9/30/06 | 9/30/05 | 9/30/04 | 9/30/03 | ||||||||||
| NET ASSET VALUE, BEGINNING OF PERIOD | $18.61 | $18.09 | $15.95 | $14.09 | $11.88 | ||||||||||
| INCOME FROM INVESTMENT OPERATIONS | |||||||||||||||
| Net investment loss | (0.05) | (0.04) | (0.02) | (0.04) | (0.07) | ||||||||||
| Net realized and unrealized gains on investments | 4.51 | 0.56 | 2.16 | 1.90 | 2.28 | ||||||||||
| Total from investment operations | 4.46 | 0.52 | 2.14 | 1.86 | 2.21 | ||||||||||
| DISTRIBUTIONS & OTHER | |||||||||||||||
| Net investment income | — | — | — | — | — | ||||||||||
| Net realized gains | — | — | — | — | — | ||||||||||
| Redemption fees [See Note 2(i)] | — | (1) | — | (1) | — | (1) | — | (1) | — | ||||||
| Total distributions & other | — | — | — | — | — | ||||||||||
| NET ASSET VALUE, END OF PERIOD | $23.07 | $18.61 | $18.09 | $15.95 | $14.09 | ||||||||||
| TOTAL RETURN | 23.97% | 2.87% | 13.42% | 13.20% | 18.60% | ||||||||||
| SUPPLEMENTAL DATA AND RATIOS | |||||||||||||||
| Net assets, end of period (000s) | $3,087,904 | $2,550,641 | $2,125,668 | $1,363,425 | $789,220 | ||||||||||
| Ratio of expenses to average net assets, | |||||||||||||||
| before expenses paid indirectly | 1.24% | 1.26% | 1.26% | 1.30% | 1.38% | ||||||||||
| Ratio of net investment income (loss) to average net | |||||||||||||||
| assets, net of expenses paid indirectly | (0.25)% | (0.26)% | (0.14)% | (0.34)% | (0.62)% | ||||||||||
| Ratio of net investment income (loss) to average net | |||||||||||||||
| assets, before expenses paid indirectly | (0.25)% | (0.27)% | (0.16)% | (0.38)% | (0.67)% | ||||||||||
| Portfolio turnover rate | 53% | 59% | 73% | 73% | 91% | ||||||||||
| (1) | Less than $0.01. | |
| See notes to financial statements. |
22
|
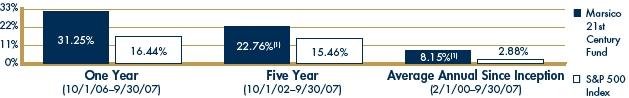
INVESTMENT REVIEW BY CORY GILCHRIST (UNAUDITED) The 21st Century Fund posted a strong return for the one-year fiscal period ended September 30, 2007. The Fund’s total return of 31.25% for the fiscal year substantially outperformed the S&P 500 Index, the Fund’s primary benchmark index, which had a total return of 16.44% for the same period. For comparative purposes, the Russell 3000 Index, a proxy for the performance of all publicly-traded US equity securities including smaller capitalization companies (which may be a useful representation of the Fund’s ability to invest across the entire market spectrum), had a total return of 16.52%. Please see the Fund Overview for more detailed information about the Fund’s longer-term performance for various time periods ended September 30, 2007. The performance data for the Fund quoted here represent past performance, and past performance is not a guarantee of future results. Investment return and principal value of an investment will fluctuate so that an investor’s shares, when redeemed, may be worth more or less than their original cost. Current performance may be lower or higher than the performance information quoted. To obtain performance information current to the most recent month-end, please call 888-860-8686 or visit www.marsicofunds.com.(1) This review highlights Fund performance over a single one-year fiscal period. Shareholders should keep in mind that the Funds are intended for long-term investors who hold their shares for substantially longer periods of time. You should also keep in mind that our views on all investments discussed in this report are subject to change at any time. References to specific securities, industries, and sectors discussed in this report are not recommendations to buy or sell such securities or related investments, and the Funds may not necessarily hold these securities or investments today. Please see the accompanying Schedule of Investments for the percentage of each Fund’s portfolio represented by the securities mentioned in this report. The following factors buoyed the Fund’s fiscal year performance results:
|
23
|
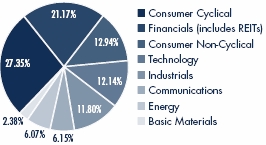
The main areas of weakness for the Fund’s performance over the one-year period were stock selection in the Health Care sector, underweighted positioning in the strong-performing Energy sector, and the Fund’s cash position. More specifically, health care services company UnitedHealth Group, Inc. declined 2% and biotechnology holdings Genentech, Inc. (-5%), and Genzyme Corp. (-11% prior to being sold) struggled. While our stock selection in the Energy sector was strong (as noted above), the Fund had less exposure to the Energy sector than its primary benchmark index. This positioning created an “opportunity” cost, as Energy was the strongest-performing sector of the US equity market for the reporting period. Additionally, the Fund had an average of nearly 7% in cash equivalent positions during the fiscal year. A more fully-invested posture would have helped the Fund’s performance, as equity returns were much better than returns on cash instruments. The 21st Century Fund has tended to have a relatively high portfolio turnover level because of its investment style. Although the Fund may hold core positions for some time, it may change its portfolio composition quickly to take advantage of new market opportunities, or to address issues affecting particular holdings. Fiscal Year-End Investment Posture As of September 30, 2007, the Fund’s primary economic sector allocations were in the following areas: Consumer Discretionary, Financials, Information Technology, and Consumer Staples. The Fund had no exposure to the Telecommunication Services and Utilities sectors. Cash equivalent holdings represented about 10% of Fund assets as of the end of the fiscal year. We anticipate that the Fund’s significant cash level will decline going forward as we add selectively to existing holdings and identify new investment opportunities. Sincerely, CORYDON J. GILCHRIST, CFA |
| (1) | Total returns are based on net change in NAV assuming reinvestment of distributions. For the period prior to March 31, 2004, the performance returns for the 21st Century Fund reflect a fee waiver in effect; in the absence of such a waiver, the returns would have been reduced. For the period beginning April 2004 through January 2005, performance returns for the Fund would have been higher but for the reimbursement of fees waived previously. A redemption fee of 2% may be imposed on redemptions or exchanges of Fund shares owned for 30 days or less. Please see the Prospectus for more information. |
24
|
FUND OVERVIEW September 30, 2007 (Unaudited) |
| The 21st Century Fund invests primarily in common stocks that are selected for their long-term growth potential. The Fund may invest in companies of any size, and will normally hold a core position of between 35 and 50 common stocks. |
| PERFORMANCE COMPARISON |
 |
| TOTAL ANNUAL OPERATING EXPENSES* | 1.35 | % |
| NET ASSETS | ||
| 9/30/07 | $2,467,126,423 | |
| NET ASSET VALUE | ||
| Net Asset Value Per Share | $18.07 | |
| TOP FIVE HOLDINGS | ||
| Las Vegas Sands Corp. | 5.78 | % |
| MasterCard, Inc. - Cl. A | 5.71 | |
| Costco Wholesale Corporation | 4.65 | |
| KKR Financial Holdings LLC | 4.06 | |
| Heineken Holding N.V. | 3.75 | |
| SECTOR ALLOCATION(3) | ||
 |
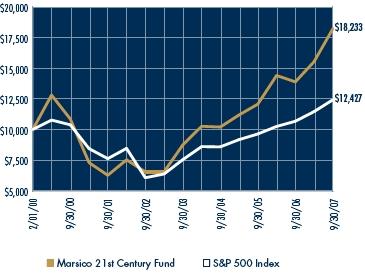
| GROWTH OF $10,000(1),(2) |
 |
| * | The Total Annual Operating Expenses are reflective of the information disclosed in the Funds’ June 29, 2007 Supplement to the Prospectus dated February 1, 2007 and may differ from the expense ratios disclosed in this report. |
| The performance data quoted here represent past performance, and past performance is not a guarantee of future results. Investment return and principal value of an investment will fluctuate so that an investor’s shares, when redeemed, may be worth more or less than their original cost. Current performance may be lower or higher than the performance information quoted. To obtain performance information current to the most recent month-end, please call 888-860-8686 or visit www.marsicofunds.com. A redemption fee may be imposed on redemptions or exchanges of Fund shares owned for 30 days or less. | ||
| The performance included in the table and graph does not reflect the deduction of taxes on Fund distributions or the redemption of Fund shares. | ||
| (1) | The performance returns for the 21st Century Fund (for the period prior to March 31, 2004) reflect a fee waiver in effect; in the absence of such a waiver, the returns would be reduced. For the period beginning April 2004 through January 2005, performance returns for the 21st Century Fund would be higher but for the reimbursement of fees waived previously. | |
| (2) | This chart assumes an initial investment of $10,000 made on February 1, 2000 (inception). Total returns are based on net change in NAV, assuming reinvestment of distributions. | |
| (3) | Sector weightings represent the percentage of the Fund’s investments (excluding cash equivalents) in certain general sectors. These sectors may include more than one industry. The Fund’s portfolio composition is subject to change at any time. | |
25
|
SCHEDULE OF INVESTMENTS September 30, 2007 |
| Number | Percent | ||||||
| of | of Net | ||||||
| Shares | Value | Assets | |||||
| COMMON STOCKS | |||||||
| Aerospace/Defense | |||||||
| Raytheon Company | 1,082,844 | $69,107,104 | 2.80 | % | |||
| Aerospace/Defense - Equipment | |||||||
| DRS Technologies, Inc. | 857,868 | 47,285,684 | 1.92 | ||||
| Agricultural Chemicals | |||||||
| Monsanto Company | 341,045 | 29,241,198 | 1.18 | ||||
| Brewery | |||||||
| Heineken Holding N.V. | 1,615,309 | 92,594,646 | 3.75 | ||||
| Building Products - Cement/Aggregates | |||||||
| Holcim Ltd. | 764,048 | 84,394,737 | 3.42 | ||||
| Cable TV | |||||||
| Comcast Corporation - Cl. A* | 2,017,285 | 48,777,951 | 1.98 | ||||
| Casino Hotels | |||||||
| Las Vegas Sands Corp.* | 1,068,676 | 142,582,752 | 5.78 | ||||
| MGM MIRAGE* | 767,157 | 68,614,522 | 2.78 | ||||
| Station Casinos, Inc. | 239,829 | 20,980,241 | 0.85 | ||||
| Wynn Resorts Ltd. | 433,421 | 68,289,813 | 2.77 | ||||
| 300,467,328 | 12.18 | ||||||
| Commercial Banks - Non-U.S. | |||||||
| Industrial and Commercial | |||||||
| Bank of China - Cl. H | 50,712,000 | 35,422,109 | 1.44 | ||||
| Computers | |||||||
| Apple, Inc.* | 518,751 | 79,649,029 | 3.23 | ||||
| Palm, Inc.* | 546,054 | 8,884,299 | 0.36 | ||||
| 88,533,328 | 3.59 | ||||||
| Data Processing/Management | |||||||
| MasterCard, Inc. - Cl. A | 951,666 | 140,818,018 | 5.71 | ||||
| E-Commerce/Products | |||||||
| Blue Nile, Inc.* | 90,347 | 8,503,460 | 0.34 | ||||
| Electronic Components - Semiconductors | |||||||
| NVIDIA Corporation* | 1,145,007 | 41,495,054 | 1.68 | ||||
| Engineering/R&D Services | |||||||
| AECOM Technology | |||||||
| Corporation* | 154,817 | 5,407,758 | 0.22 | ||||
| Engines - Internal Combustion | |||||||
| Cummins, Inc. | 151,569 | 19,384,159 | 0.79 | ||||
| Finance - Investment Banker/Broker | |||||||
| Duff & Phelps | |||||||
| Corporation - Cl. A* | 606,084 | 11,121,641 | 0.45 | ||||
| The Goldman | |||||||
| Sachs Group, Inc. | 426,802 | 92,505,066 | 3.75 | ||||
| Jefferies Group, Inc. | 1,398,539 | 38,921,340 | 1.58 | ||||
| 142,548,047 | 5.78 | ||||||
| Investment Management Companies | |||||||
| KKR Financial Holdings LLC | 5,950,777 | 100,270,592 | 4.06 | ||||
| Investment Management/Advisory Services | |||||||
| Oaktree Capital Management, | |||||||
| LLC - Cl. A 144a | 1,099,000 | 40,388,250 | 1.64 | ||||
| Medical - Biomedical/Genetic | |||||||
| Genentech, Inc.* | 749,070 | 58,442,441 | 2.37 | ||||
| Medical - HMO | |||||||
| UnitedHealth Group, Inc. | 1,303,129 | 63,110,537 | 2.56 | ||||
| Metal Processors & Fabricators | |||||||
| Precision Castparts Corp. | 161,986 | 23,970,688 | 0.97 | ||||
| Networking Products | |||||||
| Infinera Corporation* | 413,846 | 8,338,997 | 0.34 | ||||
| Non-Ferrous Metals | |||||||
| Grupo Mexico S.A. de C.V. | 3,319,130 | 23,822,088 | 0.97 | ||||
| Oil - Field Services | |||||||
| Schlumberger Ltd. | 544,637 | 57,186,885 | 2.32 | ||||
| Oil Companies - Integrated | |||||||
| Petroleo Brasileiro S.A. ADR | 412,427 | 31,138,239 | 1.26 | ||||
| Oil Field Machinery & Equipment | |||||||
| National Oilwell Varco, Inc.* | 325,160 | 46,985,620 | 1.90 | ||||
| Physician Practice Management | |||||||
| athenahealth, Inc.* | 192,402 | 6,524,352 | 0.26 | ||||
| Real Estate Operating/Development | |||||||
| Cyrela Brazil Realty S/A | 1,060,592 | 14,459,462 | 0.59 | ||||
| The St. Joe Company | 633,956 | 21,307,261 | 0.86 | ||||
| 35,766,723 | 1.45 | ||||||
| REITs - Mortgage | |||||||
| Redwood Trust, Inc. | 268,275 | 8,912,096 | 0.36 | ||||
| * | Non-income producing. | |
| See notes to financial statements. |
26
|
SCHEDULE OF INVESTMENTS September 30, 2007
| Number | Percent | |||||
| of | of Net | |||||
| Shares | Value | Assets | ||||
| COMMON STOCKS continued | ||||||
| REITs - Warehouse/Industrial | ||||||
| ProLogis | 428,733 | $28,446,435 | 1.15 | % | ||
| Resorts/Theme Parks | ||||||
| Vail Resorts, Inc.* | 834,560 | 51,984,742 | 2.11 | |||
| Retail - Apparel/Shoe | ||||||
| lululemon athletica, inc. ADR* | 261,344 | 10,984,288 | 0.44 | |||
| Retail - Discount | ||||||
| Costco Wholesale | ||||||
| Corporation | 1,868,720 | 114,683,346 | 4.65 | |||
| Retail - Major Department Store | ||||||
| Saks, Inc. | 3,507,971 | 60,161,703 | 2.44 | |||
| Retail - Restaurants | ||||||
| Chipotle Mexican Grill, Inc.* | 202,590 | 23,931,957 | 0.97 | |||
| McDonald’s Corporation | 879,430 | 47,902,552 | 1.94 | |||
| 71,834,509 | 2.91 | |||||
| Super-Regional Banks - U.S. | ||||||
| Wells Fargo & Company | 2,256,308 | 80,369,691 | 3.26 | |||
| Therapeutics | ||||||
| Amylin Pharmaceuticals, Inc.* | 1,356,697 | 67,834,850 | 2.75 | |||
| Transportation - Rail | ||||||
| All America Latina | ||||||
| Logistics Intermodal S/A | 958,829 | 13,652,721 | 0.55 | |||
| Web Portals/Internet Service Providers | ||||||
| Google, Inc. - Cl. A* | 126,258 | 71,622,376 | 2.90 | |||
| TOTAL COMMON STOCKS | ||||||
| (Cost $1,817,332,741) | 2,230,412,750 | 90.40 | ||||
| SHORT-TERM INVESTMENTS | |||||||
| SSgA Prime Money | |||||||
| Market Funds, 5.21% | 10,914,118 | 10,914,118 | 0.44 | ||||
| SSgA U.S. Government Money | |||||||
| Market Fund, 4.68% | 51,236,706 | 51,236,706 | 2.08 | ||||
| SSgA U.S. Treasury Money | |||||||
| Market Fund, 3.84% | 51,236,706 | 51,236,706 | 2.08 | ||||
| United States Treasury | |||||||
| Bill, 3.90%, 2/14/08 | 117,940,000 | 116,210,409 | 4.71 | ||||
| United States Treasury | |||||||
| Bill, 3.80%, 2/7/08 | 10,254,000 | 10,111,726 | 0.41 | ||||
| TOTAL SHORT-TERM INVESTMENTS | |||||||
| (Cost $239,704,255) | 239,709,665 | 9.72 | |||||
| TOTAL INVESTMENTS | |||||||
| (Cost $2,057,036,996) | 2,470,122,415 | 100.12 | |||||
| Liabilities Less Cash and Other Assets | (2,995,992 | ) | (0.12 | ) | |||
| NET ASSETS | $2,467,126,423 | 100.00 | % | ||||
| * | Non-income producing. | |
See notes to financial statements. |
27
|
STATEMENT OF ASSETS AND LIABILITIES
September 30, 2007
| (Amounts in thousands) | |||
| ASSETS | |||
| Investments, at value (cost $2,057,037) | $2,470,122 | ||
| Receivable for investments sold | 4,287 | ||
| Receivable for capital stock sold | 7,525 | ||
| Interest and dividends receivable | 2,058 | ||
| Prepaid expenses and other assets | 374 | ||
| Total Assets | 2,484,366 | ||
| LIABILITIES | |||
| Payable for investments purchased | 12,069 | ||
| Payable for capital stock redeemed | 1,414 | ||
| Accrued investment advisory fee | 1,557 | ||
| Accrued distribution fee | 1,133 | ||
| Accrued trustees’ fees | 326 | ||
| Accrued expenses and other liabilities | 741 | ||
| Total Liabilities | 17,240 | ||
| NET ASSETS | $2,467,126 | ||
| NET ASSETS CONSIST OF | |||
| Paid-in-capital | $1,960,321 | ||
| Accumulated net investment loss | (618 | ) | |
| Accumulated net realized gain on | |||
| investments and foreign currency transactions | 94,219 | ||
| Net unrealized appreciation on investments | |||
| and foreign currency translations | 413,204 | ||
| NET ASSETS | $2,467,126 | ||
| SHARES OUTSTANDING, $0.001 par value | |||
| (Unlimited shares authorized) | 136,501 | ||
| NET ASSET VALUE, REDEMPTION PRICE, | |||
| AND OFFERING PRICE PER SHARE | |||
| (NET ASSETS/SHARES OUTSTANDING)* | $18.07 | ||
| STATEMENT OF OPERATIONS | |||
| FOR THE YEAR ENDED September 30, 2007 | |||
| (Amounts in thousands) | |||
| INVESTMENT INCOME | |||
| Interest | $8,024 | ||
| Dividends (net of $611 of non-reclaimable | |||
| foreign withholding taxes) | 21,578 | ||
| Total Investment Income | 29,602 | ||
| EXPENSES | |||
| Investment advisory fees | 14,463 | ||
| Distribution fees | 4,254 | ||
| Transfer agent fees and expenses | 2,056 | ||
| Custody and fund accounting fees | 475 | ||
| Printing and postage expenses | 330 | ||
| Fund administration fees | 233 | ||
| Federal and state registration fees | 218 | ||
| Trustees’ fees and expenses | 124 | (1) | |
| Professional fees | 77 | ||
| Miscellaneous | 41 | ||
| Total Expenses | 22,271 | ||
| Less expenses paid indirectly | (6 | ) | |
| Net Expenses | 22,265 | ||
| NET INVESTMENT INCOME | 7,337 | ||
| REALIZED AND UNREALIZED GAIN | |||
| Net realized gain on investments | 98,375 | ||
| Net realized gain on foreign | |||
| currency transactions | 2,932 | ||
| Change in unrealized appreciation/ | |||
| depreciation on investments and | |||
| foreign currency translations | 331,390 | ||
| Net Gain on Investments | 423,697 | ||
| NET INCREASE IN NET ASSETS | |||
| RESULTING FROM OPERATIONS | $440,034 | ||
| * | Not in thousands. | |
| (1) | Includes $53,723 for trustees fees and expenses and $70,536 for the unrealized appreciation related to the mark to market of the shares in the Deferred Fee Plan during the year ended September 30, 2007. | |
| See notes to financial statements. |
28
|
STATEMENTS OF CHANGES IN NET ASSETS
| Year | Year | |||||||
| Ended | Ended | |||||||
| (Amounts in thousands) | 9/30/07 | 9/30/06 | ||||||
| OPERATIONS | ||||||||
| Net investment income | $7,337 | $1,131 | ||||||
| Net realized gain on investments | 98,375 | 32,726 | ||||||
| Net realized gain (loss) on foreign currency transactions | 2,932 | (215 | ) | |||||
| Change in unrealized appreciation/depreciation | ||||||||
| on investments and foreign currency translations | 331,390 | 26,623 | ||||||
| Net increase in net assets resulting from operations | 440,034 | 60,265 | ||||||
| DISTRIBUTIONS | ||||||||
| Net investment income | (10,724 | ) | (67 | ) | ||||
| Total distributions | (10,724 | ) | (67 | ) | ||||
| CAPITAL SHARE TRANSACTIONS | ||||||||
| Proceeds from sale of shares | 1,550,625 | 586,063 | ||||||
| Proceeds from reinvestment of distributions | 10,081 | 64 | ||||||
| Redemption fees | 121 | 138 | ||||||
| Redemption of shares | (394,470 | ) | (154,332 | ) | ||||
| Net increase from capital share transactions | 1,166,357 | 431,933 | ||||||
| TOTAL INCREASE IN NET ASSETS | 1,595,667 | 492,131 | ||||||
| NET ASSETS | ||||||||
| Beginning of period | 871,459 | 379,328 | ||||||
| END OF PERIOD | $2,467,126 | $871,459 | ||||||
| Accumulated net investment gain (loss) | (618 | ) | 352 | |||||
| TRANSACTIONS IN SHARES | ||||||||
| Shares sold | 97,600 | 42,721 | ||||||
| Shares issued in reinvestment of distributions | 663 | 5 | ||||||
| Shares redeemed | (24,492 | ) | (11,411 | ) | ||||
| NET INCREASE | 73,771 | 31,315 | ||||||
See notes to financial statements. | ||||||||
29
|
| FINANCIAL HIGHLIGHTS | |||||||||||||||
| Year | Year | Year | Year | Year | |||||||||||
| For a Fund Share Outstanding | Ended | Ended | Ended | Ended | Ended | ||||||||||
| Throughout the Period. | 9/30/07 | 9/30/06 | 9/30/05 | 9/30/04 | 9/30/03 | ||||||||||
| NET ASSET VALUE, BEGINNING OF PERIOD | $13.89 | $12.07 | $10.20 | $8.74 | $6.54 | ||||||||||
| INCOME FROM INVESTMENT OPERATIONS | |||||||||||||||
| Net investment income (loss) | 0.05 | 0.02 | (0.01 | ) | (0.04 | ) | (0.04 | ) | |||||||
| Net realized and unrealized gains on investments | 4.26 | 1.80 | 1.88 | 1.50 | 2.23 | ||||||||||
| Total from investment operations | 4.31 | 1.82 | 1.87 | 1.46 | 2.19 | ||||||||||
| DISTRIBUTIONS & OTHER | |||||||||||||||
| Net investment income | (0.13 | ) | — | — | — | — | |||||||||
| Increase from payment by service provider | — | — | — | — | 0.01 | ||||||||||
| Net realized gains | — | (1) | — | — | — | — | |||||||||
| Redemption fees [See Note 2(i)] | — | (1) | — | (1) | — | (1) | — | (1) | — | ||||||
| Total distributions & other | (0.13 | ) | — | — | — | 0.01 | |||||||||
| NET ASSET VALUE, END OF PERIOD | $18.07 | $13.89 | $12.07 | $10.20 | $8.74 | ||||||||||
| TOTAL RETURN | 31.25% | 15.10% | 18.33% | 16.70% | 33.64% | ||||||||||
| SUPPLEMENTAL DATA AND RATIOS | |||||||||||||||
| Net assets, end of period (000s) | $2,467,126 | $871,459 | $379,328 | $216,228 | $104,038 | ||||||||||
| Ratio of expenses to average net assets, less | |||||||||||||||
| waivers and before expenses paid indirectly, plus | |||||||||||||||
| reimbursements of previously waived expenses | 1.31% | 1.33% | 1.39% | 1.50% | 1.55% | (3) | |||||||||
| Ratio of net investment income (loss) to average net | |||||||||||||||
| assets, net of waivers, reimbursements of previously | |||||||||||||||
| waived expenses and expenses paid indirectly | 0.43% | 0.20% | (0.19)% | (0.48)% | (1.05)% | ||||||||||
| Ratio of expenses to average net assets, before | |||||||||||||||
| waivers, reimbursements of previously waived | |||||||||||||||
| expenses and expenses paid indirectly | 1.31% | 1.33% | 1.36% | 1.44% | 1.65% | ||||||||||
| Ratio of net investment income (loss) to average net | |||||||||||||||
| assets, before waivers, reimbursements of previously | |||||||||||||||
| waived expenses and expenses paid indirectly | 0.43% | 0.20% | (0.22)% | (0.42)% | (1.15)% | ||||||||||
| Portfolio turnover rate(2) | 105% | 136% | 175% | 191% | 236% | ||||||||||
| (1) | Less than $0.01. | |
| (2) | Portfolio turnover is greater than most funds due to the investment style of the Fund. | |
| (3) | See Note 3 for information regarding the voluntary fee waiver. | |
| See notes to financial statements. | ||
30
|
INVESTMENT REVIEW BY JIM GENDELMAN (UNAUDITED)
International equities held center stage once again during the one-year fiscal period ended September 30, 2007, once again outperforming their US equity counterparts by a considerable margin. I am pleased to report that the International Opportunities Fund posted a total return of (US$) 32.42% for the fiscal year, substantially outperforming the MSCI EAFE Index, the Fund’s primary benchmark index, which had a total return of (US$) 24.86% for the same period. Please see the Fund Overview for more detailed information about the Fund’s longer-term performance for various time periods ended September 30, 2007.
The performance data for the Fund quoted here represent past performance, and past performance is not a guarantee of future results. Investment return and principal value of an investment will fluctuate so that an investor’s shares, when redeemed, may be worth more or less than their original cost. Current performance may be lower or higher than the performance information quoted. To obtain performance information current to the most recent month-end, please call 888-860-8686 or visit www.marsicofunds.com.(1)
This review highlights Fund performance over a single one-year fiscal period. Shareholders should keep in mind that the Funds are intended for long-term investors who hold their shares for substantially longer periods of time. You should also keep in mind that our views on all investments discussed in this report are subject to change at any time. References to specific securities, industries, and sectors discussed in this report are not recommendations to buy or sell such securities or related investments, and the Funds may not necessarily hold these securities or investments today. Please see the accompanying Schedule of Investments for the percentage of each Fund’s portfolio represented by the securities mentioned in this report.
The primary areas contributing to the Fund’s outperformance as compared to the MSCI EAFE Index are summarized below:
- Financials: The Financials sector was among the weaker-performing areas of the benchmark index, and also was the index’s largest sector-level constituent, with an average weighting of 30% during the reporting period. The Fund benefited considerably by maintaining an underweighted position, on average, in the sector. The Fund’s stock selection in the sector also contributed positively to performance. Brazilian bank Unibanco-Uniao de Bancos Brasileiros S.A. gained 83%. India-headquartered ICICI Bank Ltd. (+72%) and Singapore-based real estate developer CapitaLand Ltd. (+74%) aided performance results.
- Energy: The Fund’s Energy positions rose 54% in aggregate, surpassing the MSCI EAFE Index sector return of 28%. CNOOC Ltd. (+ 94%) and Schlumberger Ltd. (+53%) were the Fund’s leading positions in the sector.
- Telecommunication Services: Two of the Fund’s most significant individual performance contributors were wireless telecommunication services companies China Mobile Ltd. (+100%) and Latin America provider America Movil S.A. de C.V. (+62%).
- Select Holdings: Certain individual positions posted strong gains, including Swiss specialty chemicals company Lonza Group AG (+58%), Australian biotechnology company CSL Ltd. (+136%), Canada-based mobile communication equipment company Research In Motion, Ltd. (+97%), Swiss power and automation technology company ABB Ltd. (+101%), and Hong Kong-based apparel retailer Esprit Holdings, Ltd. (+78%).
31
|
Although the Fund’s fiscal year performance was strong overall, there were a few factors that had a negative effect on investment results. Although active currency management is not a central facet of the Fund’s investment process, currency fluctuations may at times affect the Fund’s performance positively or negatively. For the one-year fiscal period, currency fluctuations had a material adverse effect on performance results. On average, the Fund had more exposure to securities economically tied to the US than did the MSCI EAFE Index during the fiscal year. This positioning presented a currency “cost” to the Fund, as the US dollar weakened in the quarter relative to many other world currencies such as the Euro. The Fund generally had less exposure to companies whose securities are priced in Euros and traded in countries that utilize the Euro; therefore, a smaller portion of the Fund, compared with its benchmark index, benefited from the Euro’s valuation increase.
Several of the Fund’s Japanese positions negatively impacted performance. Chugai Pharmaceutical Co., Ltd. (-27%), finance company Mitsui Trust Holdings, Inc. (-31%) and amusement game manufacturer Sega Sammy Holdings, Inc. (-30%) were among the Fund’s weakest-performing individual positions (Chugai Pharmaceutical and Sega Sammy Holdings were sold prior to September 30, 2007).
The International Opportunities Fund has tended to have a relatively high portfolio turnover level because of its investment style. Although the Fund may hold core positions for some time, it may change its portfolio composition quickly to take advantage of new market opportunities, or to address issues affecting particular holdings.
Fiscal Year-End Investment Posture
As of September 30, 2007, the Fund’s primary economic sector allocations included Consumer Discretionary, Financials, Materials, Industrials, and Consumer Staples. In terms of country allocations, the Fund’s most significant weightings at period-end were Switzerland, the United Kingdom, France, the United States, Japan, China/Hong Kong, Brazil, and Germany. As mentioned in previous shareholder updates, country-level weightings generally should be considered a residual of the Fund’s stock selection process rather than a major, proactive facet of its investment strategy.
Sincerely,
JAMES G. GENDELMAN
PORTFOLIO MANAGER
| (1) | Total returns are based on net change in NAV assuming reinvestment of distributions. For the period prior to September 30, 2004, the performance returns for the International Opportunities Fund reflect a fee waiver in effect; in the absence of such a waiver, the returns would have been reduced. For the period beginning October 2004 through December 2005, performance returns for the International Opportunities Fund would have been higher but for the reimbursement of fees waived previously. A redemption fee of 2% may be imposed on redemptions or exchanges of Fund shares owned for 30 days or less. Please see the Prospectus for more information. |
32
|
FUND OVERVIEW September 30, 2007 (Unaudited)
The International Opportunities Fund invests primarily in common stocks of foreign companies that are selected for their long-term growth potential. The Fund may invest in companies of any size throughout the world. It normally invests in the securities of issuers that are economically tied to one or more foreign countries, and expects to be invested in various issuers or securities that together have ties to at least four different foreign countries. Some issuers or securities in the Fund’s portfolio may be based in or economically tied to the United States. The Fund may hold an unlimited number of common stocks.
| PERFORMANCE COMPARISON |
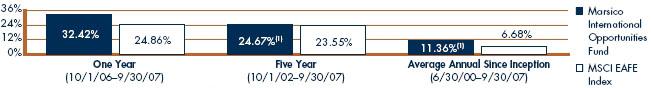 |
| TOTAL ANNUAL OPERATING EXPENSES* | 1.42 | % |
| NET EXPENSES*† | 1.45 | % |
| NET ASSETS | ||
| 9/30/07 | $822,072,732 | |
| NET ASSET VALUE | ||
| Net Asset Value Per Share | $20.10 | |
| TOP FIVE HOLDINGS | ||
| Tesco PLC | 3.92 | % |
| Continental AG | 3.60 | |
| Holcim Ltd. | 3.32 | |
| China Mobile Ltd. | 3.03 | |
| Unibanco Holdings S.A. ADR | 3.02 | |
| SECTOR ALLOCATION(3) |
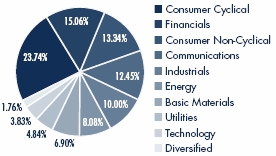
| GROWTH OF $10,000(1) (2) |
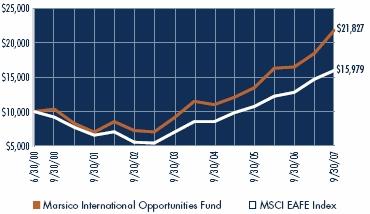
| * | The Total Annual Operating Expenses and Net Expenses are reflective of the information disclosed in the Funds’ June 29, 2007 Supplement to the Prospectus dated February 1, 2007 and may differ from the expense ratios disclosed in this report. | |
| † | The Adviser has entered into a written expense limitation agreement under which it has agreed to limit the total expenses of the Fund (excluding interest, taxes, acquired fund fees and expenses, litigation, brokerage and extraordinary expenses) to an annual rate of 1.60% of the International Opportunities Fund’s average net assets until December 31, 2007. This fee waiver may be terminated at any time after December 31, 2007. The Adviser may recoup any waived amount from a Fund pursuant to this arrangement if such reimbursement does not cause the Fund to exceed existing expense limitations and the reimbursement is made within three years after the year in which the Adviser incurred the expense. Net Expenses for the Fund reflect a 0.03% recoupment of previously waived fees as disclosed in the Funds’ Prospectus. | |
| The performance data quoted here represent past performance, and past performance is not a guarantee of future results. Investment return and principal value of an investment will fluctuate so that an investor’s shares, when redeemed, may be worth more or less than their original cost. Current performance may be lower or higher than the performance information quoted. To obtain performance information current to the most recent month-end, please call 888-860-8686 or visit www.marsicofunds.com. A redemption fee may be imposed on redemptions or exchanges of Fund shares owned for 30 days or less. | ||
| The performance included in the table and graph do not reflect the deduction of taxes on Fund distributions or the redemption of Fund shares. | ||
| (1) | The performance returns for the International Opportunities Fund (for the period prior to September 30, 2004) reflect a fee waiver in effect; in the absence of such a waiver, the returns would be reduced. For the period beginning October 2004 through December 2005, performance returns for the International Opportunities Fund would be higher but for the reimbursement of fees waived previously. | |
| (2) | This chart assumes an initial investment of $10,000 made on June 30, 2000 (inception). Total returns are based on net change in NAV, assuming reinvestment of distributions. | |
| (3) | Sector weightings represent the percentage of the Fund’s investments (excluding cash equivalents) in certain general sectors. These sectors may include more than one industry. The Fund’s portfolio composition is subject to change at any time. | |
| The Morgan Stanley Capital International (MSCI) EAFE Index tracks the stocks of about 1,000 companies in Europe, Australasia, and the Far East (EAFE). You cannot invest directly in an index. | ||
33
|
SCHEDULE OF INVESTMENTS September 30, 2007
| Number | Percent | ||||||
| of | of Net | ||||||
| Shares | Value | Assets | |||||
| COMMON STOCKS | |||||||
| Advertising Services | |||||||
| JC Decaux S.A. | 361,673 | $12,702,369 | 1.55 | % | |||
| Aerospace/Defense | |||||||
| MTU Aero Engines GmbH | 63,513 | 3,867,183 | 0.47 | ||||
| Agricultural Chemicals | |||||||
| Potash Corporation of | |||||||
| Saskatchewan, Inc. | 131,813 | 13,932,634 | 1.70 | ||||
| Apparel Manufacturers | |||||||
| Esprit Holdings, Ltd. | 667,500 | 10,604,302 | 1.29 | ||||
| Automotive - Cars/Light Trucks | |||||||
| DaimlerChrysler AG | 241,555 | 24,331,615 | 2.96 | ||||
| Toyota Motor Corporation | 120,400 | 7,106,708 | 0.86 | ||||
| 31,438,323 | 3.82 | ||||||
| Brewery | |||||||
| Heineken N.V. | 183,241 | 12,024,679 | 1.46 | ||||
| Broadcast Services/Programming | |||||||
| Grupo Frecuencia | |||||||
| Modulada Television, | |||||||
| S.A. de C.V. ADR | 632,404 | 15,285,205 | 1.86 | ||||
| Building - Residential/Commercial | |||||||
| Gafisa S.A. | 409,981 | 6,900,117 | 0.84 | ||||
| Building Products - Air & Heating | |||||||
| Daikin Industries, Ltd. | 174,673 | 8,409,365 | 1.02 | ||||
| Building Products - Cement/Aggregates | |||||||
| Holcim Ltd. | 246,937 | 27,276,013 | 3.32 | ||||
| Casino Hotels | |||||||
| Las Vegas Sands Corp.* | 136,102 | 18,158,729 | 2.21 | ||||
| Melco PBL Entertainment | |||||||
| (Macau) Ltd. ADR* | 574,109 | 9,472,798 | 1.15 | ||||
| 27,631,527 | 3.36 | ||||||
| Cellular Telecommunications | |||||||
| America Movil S.A. de | |||||||
| C.V. ADR Ser. L | 176,448 | 11,292,672 | 1.37 | ||||
| China Mobile Ltd. | 1,521,500 | 24,895,618 | 3.03 | ||||
| MTN Group Ltd. | 247,261 | 3,750,566 | 0.46 | ||||
| 39,938,856 | 4.86 | ||||||
| Chemicals - Diversified | |||||||
| Johnson Matthey PLC | 115,956 | 3,954,887 | 0.48 | ||||
| Chemicals - Specialty | |||||||
| Lonza Group AG | 134,211 | 14,640,152 | 1.78 | ||||
| Commercial Banks - Non-U.S. | |||||||
| Erste Bank der oesterreichischen | |||||||
| Sparkassen AG | 98,857 | 7,534,585 | 0.92 | ||||
| ICICI Bank Ltd. Spon. ADR | 226,869 | 11,960,534 | 1.45 | ||||
| Julius Baer Holdings Ltd. | 178,136 | 13,319,080 | 1.62 | ||||
| Mitsui Trust Holdings, Inc. | 1,031,000 | 8,042,276 | 0.98 | ||||
| Unibanco Holdings S.A. ADR | 188,466 | 24,792,702 | 3.02 | ||||
| 65,649,177 | 7.99 | ||||||
| Computer - Integrated Systems | |||||||
| Fujitsu Ltd. | 558,000 | 3,944,596 | 0.48 | ||||
| Computers | |||||||
| Research In Motion, Ltd. ADR* | 146,676 | 14,454,920 | 1.76 | ||||
| Diversified Operations | |||||||
| China Merchants Holdings | |||||||
| (International) Co., Ltd. | 1,506,000 | 9,376,358 | 1.14 | ||||
| GEA Group AG | 119,530 | 4,204,848 | 0.51 | ||||
| 13,581,206 | 1.65 | ||||||
| Electric - Integrated | |||||||
| Electricite de France | 158,954 | 16,806,869 | 2.04 | ||||
| Electronic Components - Miscellaneous | |||||||
| Hon Hai Percision | |||||||
| Industry Co., Ltd. | 550,000 | 4,145,856 | 0.50 | ||||
| Electronic Components - Semiconductors | |||||||
| Samsung Electronics Co., Ltd. | 17,680 | 11,107,955 | 1.35 | ||||
| Engineering/R&D Services | |||||||
| ABB Ltd. | 639,689 | 16,845,922 | 2.05 | ||||
| Finance - Credit Card | |||||||
| Redecard S/A* | 242,400 | 4,522,684 | 0.55 | ||||
| Finance - Investment Banker/Broker | |||||||
| Macquarie Bank, Ltd. | 151,499 | 11,346,115 | 1.38 | ||||
| Finance - Other Services | |||||||
| Man Group PLC | 1,069,530 | 12,111,999 | 1.47 | ||||
| Food - Miscellaneous/Diversified | |||||||
| Nestle S.A. | 37,283 | 16,748,129 | 2.04 | ||||
| * | Non-income producing. | |
| See notes to financial statements. | ||
34
|
SCHEDULE OF INVESTMENTS September 30, 2007
| Number | Percent | ||||||
| of | of Net | ||||||
| Shares | Value | Assets | |||||
| COMMON STOCKS continued | |||||||
| Food - Retail | |||||||
| Tesco PLC | 3,588,745 | $32,252,219 | 3.92 | % | |||
| Hotels & Motels | |||||||
| Accor S.A. | 163,682 | 14,531,627 | 1.77 | ||||
| Shangri-La Asia Ltd. | 2,969,003 | 10,006,352 | 1.22 | ||||
| 24,537,979 | 2.99 | ||||||
| Import/Export | |||||||
| Marubeni Corporation | 1,485,000 | 13,626,344 | 1.66 | ||||
| Investment Management Companies | |||||||
| Macquarie Infrastructure | |||||||
| Group | 1,432,833 | 3,966,844 | 0.48 | ||||
| Machinery - General Industrial | |||||||
| ALSTOM | 40,376 | 8,208,346 | 1.00 | ||||
| Medical - Biomedical/Genetic | |||||||
| CSL Ltd. | 113,352 | 10,792,545 | 1.31 | ||||
| Medical - Drugs | |||||||
| Actelion Ltd.* | 170,776 | 9,461,071 | 1.15 | ||||
| Roche Holdings AG | 65,049 | 11,794,582 | 1.44 | ||||
| 21,255,653 | 2.59 | ||||||
| Metal - Diversified | |||||||
| Rio Tinto PLC | 133,857 | 11,579,273 | 1.41 | ||||
| Oil - Field Services | |||||||
| Schlumberger Ltd. | 185,505 | 19,478,025 | 2.37 | ||||
| Oil Companies - Exploration & Production | |||||||
| CNOOC Ltd. | 7,402,800 | 12,455,685 | 1.52 | ||||
| Oil Companies - Integrated | |||||||
| Petroleo Brasileiro S.A. ADR | 289,833 | 21,882,391 | 2.66 | ||||
| Real Estate Operating/Development | |||||||
| CapitaLand Ltd. | 2,708,000 | 14,857,085 | 1.80 | ||||
| JHSF Participacoes S.A.* | 704,500 | 3,755,027 | 0.46 | ||||
| 18,612,112 | 2.26 | ||||||
| Retail - Consumer Electronics | |||||||
| Yamada Denki Company Ltd. | 82,500 | 8,166,326 | 0.99 | ||||
| Retail - Major Department Store | |||||||
| PPR SA | 64,222 | 12,082,715 | 1.47 | ||||
| Rubber - Tires | |||||||
| Continental AG | 214,281 | 29,632,620 | 3.60 | ||||
| Seismic Data Collection | |||||||
| Cie Gen De | |||||||
| Geophysique - Veritas | 26,060 | 8,515,271 | 1.04 | ||||
| Soap & Cleaning Preparations | |||||||
| Reckitt Benckiser PLC | 167,757 | 9,857,580 | 1.20 | ||||
| Steel - Producers | |||||||
| ArcelorMittal | 115,847 | 9,149,985 | 1.11 | ||||
| Telecom Services | |||||||
| Amdocs Ltd.* | 110,187 | 4,097,855 | 0.50 | ||||
| Television | |||||||
| British Sky Broadcasting | |||||||
| Group PLC | 1,693,041 | 24,074,513 | 2.93 | ||||
| Toys | |||||||
| Nintendo Co., Ltd. | 35,600 | 18,533,757 | 2.25 | ||||
| Transportation - Rail | |||||||
| All America Latina | |||||||
| Logistics Intermodal S/A | 310,666 | 4,423,558 | 0.54 | ||||
| Transportation - Services | |||||||
| Kuehne + Nagel | |||||||
| International AG* | 40,819 | 4,017,915 | 0.49 | ||||
| Water | |||||||
| Veolia Environment | 238,906 | 20,572,937 | 2.50 | ||||
| TOTAL COMMON STOCKS | |||||||
| (Cost $579,140,319) | 771,643,488 | 93.86 | |||||
| * | Non-income producing. | |
| See notes to financial statements. | ||
35
|
SCHEDULE OF INVESTMENTS September 30, 2007
| Number | Percent | |||||||
| of | of Net | |||||||
| Shares | Value | Assets | ||||||
| SHORT-TERM INVESTMENTS | ||||||||
| SSgA U.S. Government Money | ||||||||
| Market Fund, 4.68% | 7,357,681 | $7,357,681 | 0.90 | % | ||||
| SSgA U.S. Treasury Money | ||||||||
| Market Fund, 3.84% | 36,764,984 | 36,764,984 | 4.48 | |||||
| United States Treasury | ||||||||
| Bill, 3.25%, 11/1/07† | 745,000 | 742,915 | 0.09 | |||||
| United States Treasury | ||||||||
| Bill, 3.55%, 1/3/08 | 2,312,000 | 2,289,151 | 0.28 | |||||
| United States Treasury | ||||||||
| Bill, 3.65%, 1/10/08 | 3,936,000 | 3,894,556 | 0.47 | |||||
| United States Treasury | ||||||||
| Bill, 3.75%, 1/31/08 | 1,617,000 | 1,596,094 | 0.19 | |||||
| United States Treasury | ||||||||
| Bill, 3.80%, 2/7/08 | 1,536,000 | 1,514,688 | 0.18 | |||||
| TOTAL SHORT-TERM INVESTMENTS | ||||||||
| (Cost $54,163,378) | 54,160,069 | 6.59 | ||||||
| TOTAL INVESTMENTS | ||||||||
| (Cost $633,303,697) | 825,803,557 | 100.45 | ||||||
| Liabilities Less Cash and Other Assets | (3,730,825 | ) | (0.45 | ) | ||||
| NET ASSETS | $822,072,732 | 100.00 | % | |||||
| SUMMARY OF INVESTMENTS BY COUNTRY | |||||
| Percent of | |||||
| Investment | |||||
| Country | Market Value | Securities | |||
| Australia | $26,105,504 | 3.3 | % | ||
| Austria | 7,534,585 | 0.9 | |||
| Brazil | 66,276,479 | 8.0 | |||
| Canada | 28,387,554 | 3.4 | |||
| France | 93,420,134 | 11.3 | |||
| Germany | 62,036,266 | 7.5 | |||
| Hong Kong | 76,811,113 | 9.3 | |||
| India | 11,960,534 | 1.4 | |||
| Japan | 67,829,372 | 8.2 | |||
| Luxembourg | 9,149,985 | 1.1 | |||
| Mexico | 26,577,877 | 3.2 | |||
| Netherlands | 12,024,679 | 1.5 | |||
| Singapore | 14,857,085 | 1.8 | |||
| South Africa | 3,750,566 | 0.5 | |||
| South Korea | 11,107,954 | 1.3 | |||
| Switzerland | 114,102,866 | 13.8 | |||
| Taiwan | 4,145,856 | 0.5 | |||
| United Kingdom | 93,830,471 | 11.4 | |||
| United States(1) | 95,894,677 | 11.6 | |||
| Total | $825,803,557 | 100.0 | % | ||
| (1) | Includes short-term securities. | |
| † | Security valued at amortized cost. | |
| See notes to financial statements. | ||
36
|
| STATEMENT OF ASSETS AND LIABILITIES | ||
| September 30, 2007 | ||
| (Amounts in thousands) | ||
| ASSETS | ||
| Investments, at value (cost $633,304) | $825,804 | |
| Foreign currency (cost $308) | 310 | |
| Receivable for investments sold | 761 | |
| Receivable for capital stock sold | 1,001 | |
| Interest and dividends receivable | 1,177 | |
| Prepaid expenses and other assets | 274 | |
| Total Assets | 829,327 | |
| LIABILITIES | ||
| Payable for investments purchased | 5,488 | |
| Payable for capital stock redeemed | 346 | |
| Accrued investment advisory fee | 520 | |
| Accrued distribution fee | 348 | |
| Accrued trustees’ fees | 245 | |
| Accrued expenses and other liabilities | 307 | |
| Total Liabilities | 7,254 | |
| NET ASSETS | $822,073 | |
| NET ASSETS CONSIST OF | ||
| Paid-in-capital | $545,621 | |
| Accumulated net investment income | 5,703 | |
| Accumulated net realized gain on investments and | ||
| foreign currency transactions | 78,154 | |
| Net unrealized appreciation on investments | ||
| and foreign currency translations | 192,595 | |
| NET ASSETS | $822,073 | |
| SHARES OUTSTANDING, $0.001 par value | ||
| (Unlimited shares authorized) | 40,909 | |
| NET ASSET VALUE, REDEMPTION PRICE, | ||
| AND OFFERING PRICE PER SHARE | ||
| (NET ASSETS/SHARES OUTSTANDING)* | $20.10 | |
| STATEMENT OF OPERATIONS | |||
| FOR THE YEAR ENDED September 30, 2007 | |||
| (Amounts in thousands) | |||
| INVESTMENT INCOME | |||
| Interest | $1,414 | ||
| Dividends (net of $1,305 of non-reclaimable | |||
| foreign withholding taxes) | 14,604 | ||
| Miscellaneous Income | 2 | ||
| Total Investment Income | 16,020 | ||
| EXPENSES | |||
| Investment advisory fees | 5,954 | ||
| Distribution fees | 1,751 | ||
| Transfer agent fees and expenses | 755 | ||
| Custody and fund accounting fees | 593 | ||
| Fund administration fees | 205 | ||
| Printing and postage expenses | 157 | ||
| Trustees’ fees and expenses | 76 | (1) | |
| Federal and state registration fees | 45 | ||
| Professional fees | 31 | ||
| Miscellaneous | 24 | ||
| Total Expenses | 9,591 | ||
| Less expenses paid indirectly | (2 | ) | |
| Net Expenses | 9,589 | ||
| NET INVESTMENT INCOME | 6,431 | ||
| REALIZED AND UNREALIZED GAIN | |||
| Net realized gain on investments | 67,964 | ||
| Net realized gain on foreign | |||
| currency transactions | 15,833 | ||
| Change in unrealized appreciation/ | |||
| depreciation on investments and | |||
| foreign currency translations | 107,907 | ||
| Net Gain on Investments | 191,704 | ||
| NET INCREASE IN NET ASSETS | |||
| RESULTING FROM OPERATIONS | $198,135 | ||
| * | Not in thousands. | |
| (1) | Includes $23,765 for trustees fees and expenses and $52,459 for the unrealized appreciation related to the mark to market of the shares in the Deferred Fee Plan during the year ended September 30, 2007. | |
| See notes to financial statements. |
37
|
STATEMENTS OF CHANGES IN NET ASSETS
| Year | Year | ||||||
| Ended | Ended | ||||||
| (Amounts in thousands) | 9/30/07 | 9/30/06 | |||||
| OPERATIONS | |||||||
| Net investment income | $6,431 | $1,388 | |||||
| Net realized gain on investments | 67,964 | 22,905 | |||||
| Net realized gain (loss) on foreign currency transactions | 15,833 | (832 | ) | ||||
| Change in unrealized appreciation/depreciation | |||||||
| on investments and foreign currency translations | 107,907 | 43,922 | |||||
| Net increase in net assets resulting from operations | 198,135 | 67,383 | |||||
| DISTRIBUTIONS | |||||||
| Net investment income | (1,290 | ) | (2,078 | ) | |||
| Net realized gains | (24,442 | ) | — | ||||
| Total distributions | (25,732 | ) | (2,078 | ) | |||
| CAPITAL SHARE TRANSACTIONS | |||||||
| Proceeds from sale of shares | 261,388 | 349,169 | |||||
| Proceeds from reinvestment of distributions | 24,671 | 1,980 | |||||
| Redemption fees | 40 | 73 | |||||
| Redemption of shares | (208,113 | ) | (107,365 | ) | |||
| Net increase from capital share transactions | 77,986 | 243,857 | |||||
| TOTAL INCREASE IN NET ASSETS | 250,389 | 309,162 | |||||
| NET ASSETS | |||||||
| Beginning of period | 571,684 | 262,522 | |||||
| END OF PERIOD | $822,073 | $571,684 | |||||
| Accumulated net investment income | 5,703 | 891 | |||||
| TRANSACTIONS IN SHARES | |||||||
| Shares sold | 15,189 | 23,164 | |||||
| Shares issued in reinvestment of distributions | 1,495 | 141 | |||||
| Shares redeemed | (11,945 | ) | (7,322 | ) | |||
| NET INCREASE | 4,739 | 15,983 | |||||
See notes to financial statements.
38
|
| FINANCIAL HIGHLIGHTS | |||||||||||||||
| Year | Year | Year | Year | Year | |||||||||||
| For a Fund Share Outstanding | Ended | Ended | Ended | Ended | Ended | ||||||||||
| Throughout the Period. | 9/30/07 | 9/30/06 | 9/30/05 | 9/30/04 | 9/30/03 | ||||||||||
| NET ASSET VALUE, BEGINNING OF PERIOD | $15.81 | $13.00 | $10.63 | $8.80 | $7.00 | ||||||||||
| INCOME FROM INVESTMENT OPERATIONS | |||||||||||||||
| Net investment income (loss) | 0.16 | 0.04 | 0.12 | 0.04 | 0.02 | ||||||||||
| Net realized and unrealized gains on investments | 4.81 | 2.87 | 2.25 | 1.79 | 1.78 | ||||||||||
| Total from investment operations | 4.97 | 2.91 | 2.37 | 1.83 | 1.80 | ||||||||||
| DISTRIBUTIONS & OTHER | |||||||||||||||
| Net investment income | (0.03 | ) | (0.10 | ) | — | — | — | ||||||||
| Net realized gains | (0.65 | ) | — | — | — | — | |||||||||
| Redemption fees [See Note 2(i)] | — | (1) | — | (1) | — | (1) | — | (1) | — | ||||||
| Total distributions & other | (0.68 | ) | (0.10 | ) | — | — | — | ||||||||
| NET ASSET VALUE, END OF PERIOD | $20.10 | $15.81 | $13.00 | $10.63 | $8.80 | ||||||||||
| TOTAL RETURN | 32.42% | 22.46% | 22.30% | 20.80% | 25.71% | ||||||||||
| SUPPLEMENTAL DATA AND RATIOS | |||||||||||||||
| Net assets, end of period (000s) | $822,073 | $571,684 | $262,522 | $106,162 | $28,409 | ||||||||||
| Ratio of expenses to average net assets, less | |||||||||||||||
| waivers and before expenses paid indirectly, plus | |||||||||||||||
| reimbursements of previously waived expenses | 1.37% | 1.44% | 1.60% | 1.60% | 1.68% | (3) | |||||||||
| Ratio of net investment income (loss) to average net | |||||||||||||||
| assets, net of waivers, reimbursements of previously | |||||||||||||||
| waived expenses and expenses paid indirectly | 0.92% | 0.33% | 1.19% | 0.07% | 0.18% | ||||||||||
| Ratio of expenses to average net assets, before | |||||||||||||||
| waivers, reimbursements of previously waived | |||||||||||||||
| expenses and expenses paid indirectly | 1.37% | 1.41% | 1.49% | 1.68% | 2.31% | ||||||||||
| Ratio of net investment income (loss) to average net | |||||||||||||||
| assets, before waivers, reimbursements of previously | |||||||||||||||
| waived expenses and expenses paid indirectly | 0.92% | 0.36% | 1.30% | 0.00% | (0.45)% | ||||||||||
| Portfolio turnover rate(2) | 125% | 101% | 156% | 105% | 211% | ||||||||||
| (1) | Less than $0.01. | |
| (2) | Portfolio turnover is greater than most funds due to the investment style of the Fund. | |
| (3) | See Note 3 for information regarding the voluntary fee waiver. | |
See notes to financial statements. | ||
39
|
INVESTMENT REVIEW BY DOUG RAO (UNAUDITED)
The Flexible Capital Fund was launched on December 29, 2006. Cory Gilchrist served as Portfolio Manager of the Fund from inception to July 1, 2007. I took over the responsibilities of Portfolio Manager of the Fund on July 2, 2007. The Fund posted a return of 13.20% for the nine-month period ended September 30, 2007 and outperformed the S&P 500 Index, which we consider to be the Fund’s primary benchmark index, which had a total return of 9.13% over the same nine-month period. Please see the Fund Overview for more detailed information about the Fund’s performance for the period ended September 30, 2007.
Effective September 1, 2007, the Fund’s investment goal is to seek long-term growth of capital by investing primarily in equity securities and other investments selected primarily for their long-term growth potential, which may include, without limitation, companies that may be experiencing a significant positive transformation or favorable catalyst impacting their potential growth, may be underappreciated by other investors, or may be trading at compelling valuations in light of their growth potential.
Examples of these types of “life-cycle change” companies may include companies that are introducing a new product, have made a significant acquisition or divestiture, or have recently made changes to their management teams. As a result of the shift in the Fund’s investment goal, the Fund decreased its emphasis on current income, and broadened the strategy we may use in selecting companies for their long-term growth potential.
The performance data for the Fund quoted here represent past performance, and past performance is not a guarantee of future results. Investment return and principal value of an investment will fluctuate so that an investor’s shares, when redeemed, may be worth more or less than their original cost. Current performance may be lower or higher than the performance information quoted. To obtain performance information current to the most recent month-end, please call 888-860-8686 or visit www.marsicofunds.com.(1)
This review highlights Fund performance over a nine-month period. Shareholders should keep in mind that the Funds are intended for long-term investors who hold their shares for substantially longer periods of time. You should also keep in mind that our views on all investments discussed in this report are subject to change at any time. References to specific securities, industries, and sectors discussed in this report are not recommendations to buy or sell such securities or related investments, and the Funds may not necessarily hold these securities or investments today. Please see the accompanying Schedule of Investments for the percentage of each Fund’s portfolio represented by the securities mentioned in this report.
During the nine-month period ended September 30, 2007 while the Fund has been operational, which encompasses a limited period of time after the shift in the Fund’s investment goal noted above, the overall performance was positively impacted by stock selection in the following areas:
- Telecommunication Services: Two of the Fund’s holdings within this sector performed well.
Wireless provider China Mobile Ltd. posted a return of 53% and specialty communications company Crown Castle International Corp. rose 15% prior to being sold.
- Consumer Discretionary: Though the Fund’s performance in the sector was mixed overall, certain of the Fund’s consumer-related holdings performed well. Athletic apparel company lululemon athletica inc. (+119%), in particular, appreciated sharply after its initial public offering.
- Health Care: Health care services company athenahealth, Inc. gained 73% following its initial public offering, and was among the Fund’s strongest performing individual positions.
40
|
- Financials: The Fund’s Financials positions posted a collective return of 3% for the period. While this represented a modest positive return, the Fund’s result was significantly better than the benchmark index financial sector’s -5% decline for the nine-month period ended September 30, 2007. KKR Financial Holdings LLC posted returns of 17%, and real estate management company E-House (China) Holdings Ltd. gained 66% after its initial public offering, and these stocks were the main underlying sources of the Fund’s sector-level outperformance.
There were several factors that negatively affected the Fund’s performance results for the reporting period. The largest detractor to performance, as compared to the benchmark index, was the Fund’s sector positioning. On average, the Fund emphasized investments in the Financials and Consumer Discretionary sectors while having only modest exposure to the Energy sector. While the Fund’s stock selection within Consumer Discretionary and Financials sectors was strong overall, the Fund’s performance was penalized due to having significant exposure to these sectors, which were among the weakest-performing areas of the US equity markets during the nine-month period. Further, the Fund had relatively little exposure to Energy, which was the strongest performing sector of the benchmark index.
The Fund had an average of approximately 13% in cash equivalent positions during the nine-month period as it implemented and refined its investment strategy. A more fully-invested posture would have helped the Fund’s performance, as equity returns were much better than returns on cash instruments.
The Fund invests from time to time in initial public offerings (“IPOs”) of common stock or other equity or debt securities issued by a corporate issuer. Because the Fund is relatively new and its assets are relatively small, investments in IPOs could have a magnified impact on Fund performance, which could tend to diminish as the Fund’s assets grow. IPOs did make a significant positive contribution to the Fund’s performance during the nine-month period ended September 30, 2007. There can be no assurance that similar contributions from IPOs will continue in the future.
The Flexible Capital Fund over its short history has tended to have a relatively high portfolio turnover level. This is attributable to the Fund’s investment style, its change in its investment goal, and its relatively small base of assets under management. Although the Fund may hold core positions for some time, it may change its portfolio composition quickly to take advantage of new opportunities, or to address issues affecting particular holdings.
Fiscal Year-End Investment Posture
At the end of the fiscal year, the Fund’s primary economic sector allocations included Consumer Discretionary, Financials, Consumer Staples, and Information Technology. The Fund had little exposure to the Health Care and Industrials sectors.
Sincerely,
A. DOUGLAS RAO
PORTFOLIO MANAGER
| (1) | Total returns are based on net change in NAV assuming reinvestment of distributions. The performance returns for the Flexible Capital Fund reflect a fee waiver in effect; in the absence of such a waiver, the returns would have been reduced. A redemption fee of 2% may be imposed on redemptions or exchanges of Fund shares owned for 30 days or less. Please see the Prospectus for more information. |
41
|
FUND OVERVIEW September 30, 2007 (Unaudited)
The Flexible Capital Fund invests primarily in equity securities, and other investments that are selected primarily for their long-term growth potential. The Fund may invest in issuers of any size throughout the world, and will normally hold a core position of between 20 and 50 securities or other investments.
| PERFORMANCE COMPARISON |
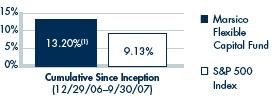
| TOTAL ANNUAL OPERATING EXPENSES* | 1.99 | % | |||
| NET EXPENSES*† | 0.75 | % | |||
| NET ASSETS | |||||
| 9/30/07 | $24,741,457 | ||||
| NET ASSET VALUE | |||||
| Net Asset Value Per Share | $11.32 | ||||
| TOP FIVE HOLDINGS | |||||
| KKR Financial Holdings LLC | 4.91 | % | |||
| Cie Gen de | |||||
| Geophysique - Veritas | 4.03 | ||||
| Royal Philips Electronics N.V. | 3.72 | ||||
| Tesco PLC | 3.64 | ||||
| Heineken N.V. | 3.62 | ||||
| SECTOR ALLOCATION(3) | |||||
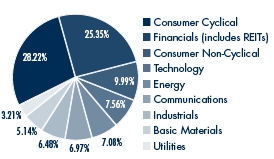
| GROWTH OF $10,000(1)(2) |
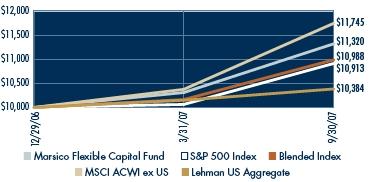
| The Blended Index is a hypothetical combination of unmanaged indices. This internally calculated index combines the total returns from the S&P 500 Index (50%), MSCI ACWI ex US (25%), and Lehman US Aggregate (25%). | ||
| The MSCI ACWI (All Country World Index) ex US Index is a free float-adjusted market capitalization index that is designed to measure equity performance in the global developed (excluding the US) and emerging markets. You cannot invest directly in an index. | ||
| The Lehman US Aggregate Index is composed of securities from Lehman Brothers Government/Corporate Bond Index, Mortgage-Backed Securities Index, and the Asset-Backed Securities Index. The index’s total return consists of price appreciation/depreciation plus income as a percentage of the original investment. Indexes are rebalanced monthly by market capitalization. You cannot invest directly in an index. | ||
| The Blended Index, MSCI ACWI ex US Index, and Lehman US Aggregate Index are no longer used as benchmarks of the Fund. This change occurred as a result of the change in investment objective as discussed in the July 27, 2007 Supplement to the Funds’ Prospectus dated February 1, 2007. | ||
| * | The Total Annual Operating Expenses and Net Expenses are reflective of the information disclosed in the Funds’ June 29, 2007 Supplement to the Prospectus dated February 1, 2007 and may differ from the expense ratios disclosed in this report. | |
| † | The Adviser has entered into a written expense limitation agreement under which it has agreed to limit the total expenses of the Fund (excluding interest, taxes, acquired fund fees and expenses, litigation, brokerage and extraordinary expenses) to an annual rate of 0.75% of the Flexible Capital Fund’s average net assets until December 31, 2007. This fee waiver may be terminated at any time after December 31, 2007. Prior to June 1, 2007, the written expense limitation agreement relating to the Flexible Capital Fund limited total expenses of the Fund (excluding interest, taxes, acquired fund fees and expenses, litigation, brokerage and extraordinary expenses) to an annual rate of 1.60% of the Fund’s average net assets. The Adviser may recoup any waived amount from a Fund pursuant to this arrangement if such reimbursement does not cause the Fund to exceed existing expense limitations and the reimbursement is made within three years after the year in which the Adviser incurred the expense. | |
| The performance data quoted here represent past performance, and past performance is not a guarantee of future results. Investment return and principal value of an investment will fluctuate so that an investor’s shares, when redeemed, may be worth more or less than their original cost. Current performance may be lower or higher than the performance information quoted. To obtain performance information current to the most recent month-end, please call 888-860-8686 or visit www.marsicofunds.com. A redemption fee may be imposed on redemptions or exchanges of Fund shares owned for 30 days or less. | ||
| Initial public offerings (“IPOs”) made a significant positive contribution to the Fund’s recent performance. There can be no assurance that similar contributions from IPOs will continue in the future. | ||
| The performance included in the table and graph does not reflect the deduction of taxes on Fund distributions or the redemption of Fund shares. | ||
| (1) | The performance returns for the Flexible Capital Fund reflect a fee waiver in effect; in the absence of such a waiver, the returns would be reduced. | |
| (2) | This chart assumes an initial investment of $10,000 made on December 29, 2006 (inception). Total returns are based on change in NAV, assuming reinvestment of distributions. | |
| (3) | Sector weightings represent the percentage of the Fund’s investments (excluding cash equivalents) in certain general sectors. These sectors may include more than one industry. The Fund’s portfolio composition is subject to change at any time. |
42
|
SCHEDULE OF INVESTMENTS September 30, 2007
| Number | Percent | |||||
| of | of Net | |||||
| Shares | Value | Assets | ||||
| COMMON STOCKS | ||||||
| Automotive - Cars/Light Trucks | ||||||
| DaimlerChrysler AG | 8,788 | $885,207 | 3.58 | % | ||
| Brewery | ||||||
| Heineken N.V. | 13,646 | 895,481 | 3.62 | |||
| Cellular Telecommunications | ||||||
| China Mobile Ltd. ADR | 8,511 | 698,242 | 2.82 | |||
| Commercial Banks - Non-U.S. | ||||||
| Julius Baer Holdings Ltd. | 7,180 | 536,843 | 2.17 | |||
| Unibanco Holdings S.A. ADR | 2,363 | 310,853 | 1.26 | |||
| 847,696 | 3.43 | |||||
| Computers | ||||||
| Dell, Inc.* | 17,013 | 469,559 | 1.90 | |||
| Palm, Inc.* | 16,007 | 260,434 | 1.05 | |||
| 729,993 | 2.95 | |||||
| Data Processing/Management | ||||||
| MasterCard, Inc. – Cl. A | 4,463 | 660,390 | 2.67 | |||
| Electric - Integrated | ||||||
| Exelon Corporation | 9,191 | 692,634 | 2.80 | |||
| Electronic Components - Miscellaneous | ||||||
| Royal Philips Electronics N.V. | 20,420 | 921,581 | 3.72 | |||
| Electronic Components - Semiconductors | ||||||
| Intel Corporation | 9,374 | 242,412 | 0.98 | |||
| Engineering/R&D Services | ||||||
| AECOM Technology | ||||||
| Corporation* | 13,702 | 478,611 | 1.93 | |||
| Finance - Credit Card | ||||||
| Redecard S/A* | 29,300 | 546,678 | 2.21 | |||
| Finance - Investment Banker/Broker | ||||||
| Duff & Phelps | ||||||
| Corporation – Cl. A* | 6,741 | 123,697 | 0.50 | |||
| E*Trade Financial | ||||||
| Corporation* | 20,301 | 265,131 | 1.07 | |||
| 388,828 | 1.57 | |||||
| Finance - Mortgage Loan/Banker | ||||||
| Fannie Mae | 14,427 | 877,306 | 3.55 | |||
| Food - Retail | ||||||
| Tesco PLC | 100,225 | 900,727 | 3.64 | |||
| Hotels & Motels | ||||||
| Mandarin Oriental | ||||||
| International Ltd. GDR | 177,000 | 398,250 | 1.61 | |||
| Investment Management Companies | ||||||
| KKR Financial Holdings LLC | 72,113 | 1,215,104 | 4.91 | |||
| Investment Management/Advisory Services | ||||||
| Oaktree Capital Management, | ||||||
| LLC – Cl. A 144a | 21,200 | 779,100 | 3.15 | |||
| Oil & Gas - Drilling | ||||||
| Diamond Offshore Drilling, Inc. | 4,689 | 531,217 | 2.15 | |||
| Physician Practice Management | ||||||
| athenahealth, Inc.* | 10,634 | 360,599 | 1.46 | |||
| Real Estate Management/Services | ||||||
| E-House (China) | ||||||
| Holdings Ltd. ADR* | 14,569 | 333,630 | 1.35 | |||
| REITs - Mortgage | ||||||
| Redwood Trust, Inc. | 3,423 | 113,712 | 0.46 | |||
| REITs - Warehouse/Industrial | ||||||
| ProLogis | 2,032 | 134,823 | 0.54 | |||
| Retail - Building Products | ||||||
| Lowe’s Companies, Inc. | 22,542 | 631,627 | 2.55 | |||
| Retail - Discount | ||||||
| Costco Wholesale Corporation | 8,098 | 496,974 | 2.01 | |||
| Retail - Drug Stores | ||||||
| CVS/Caremark Corporation | 19,016 | 753,604 | 3.05 | |||
| Retail - Major Department Store | ||||||
| Saks, Inc. | 24,716 | 423,879 | 1.71 | |||
| Retail - Restaurants | ||||||
| McDonald’s Corporation | 11,956 | 651,243 | 2.63 | |||
| Yum! Brands, Inc. | 21,573 | 729,816 | 2.95 | |||
| 1,381,059 | 5.58 | |||||
| Rubber - Tires | ||||||
| Continental AG | 3,601 | 497,977 | 2.01 | |||
| Savings and Loans/Thrifts | �� | |||||
| Meta Financial Group, Inc. | 5,973 | 238,024 | 0.96 | |||
| Seismic Data Collection | ||||||
| Cie Gen De Geophysique - Veritas | 3,053 | 997,587 | 4.03 | |||
| * | Non-income producing. | |
| See notes to financial statements. | ||
43
|
SCHEDULE OF INVESTMENTS September 30, 2007
| Number | Percent | |||||
| of | of Net | |||||
| Shares | Value | Assets | ||||
| COMMON STOCKS continued | ||||||
| Steel - Producers | ||||||
| ArcelorMittal ADR | 6,934 | $543,348 | 2.20 | % | ||
| Steel - Specialty | ||||||
| Allegheny Technologies, Inc. | 5,157 | 567,012 | 2.29 | |||
| Telephone - Integrated | ||||||
| AT&T, Inc. | 16,266 | 688,214 | 2.78 | |||
| Television | ||||||
| CBS Corporation – Cl. B | 3,767 | 118,661 | 0.48 | |||
| Toys | ||||||
| Nintendo Co., Ltd. | 1,200 | 624,733 | 2.53 | |||
| TOTAL COMMON STOCKS | ||||||
| (Cost $19,771,006) | 21,594,920 | 87.28 | ||||
| SHORT-TERM INVESTMENTS | ||||||
| SSgA Money Market | ||||||
| Fund, 5.00% | 1 | 1 | 0.00 | |||
| SSgA Prime Money | ||||||
| Market Funds, 5.19% | 1 | 1 | 0.00 | |||
| SSgA U.S. Government Money | ||||||
| Market Fund, 4.66% | 58,718 | 58,718 | 0.23 | |||
| SSgA U.S. Treasury Money | ||||||
| Market Fund, 3.84% | 1,110,511 | 1,110,511 | 4.49 | |||
| United States Treasury | ||||||
| Bill, 3.25%, 11/1/07† | 692,000 | 690,063 | 2.79 | |||
| United States Treasury | ||||||
| Bill, 3.55%, 1/3/08 | 271,000 | 268,322 | 1.08 | |||
| United States Treasury | ||||||
| Bill, 3.65%, 1/10/08 | 462,000 | 457,136 | 1.85 | |||
| United States Treasury | ||||||
| Bill, 3.75%, 1/31/08 | 190,000 | 187,543 | 0.76 | |||
| United States Treasury | ||||||
| Bill, 3.80%, 2/7/08 | 180,000 | 177,503 | 0.72 | |||
| TOTAL SHORT-TERM INVESTMENTS | ||||||
| (Cost $2,950,200) | 2,949,798 | 11.92 | ||||
| TOTAL INVESTMENTS | ||||||
| (Cost $22,721,206) | 24,544,718 | 99.20 | ||||
| Cash and Other Assets less Liabilities | 196,739 | 0.80 | ||||
| NET ASSETS | $24,741,457 | 100.00 | % | |||
| SUMMARY OF INVESTMENTS BY COUNTRY | ||||||
| Percent of | ||||||
| Investment | ||||||
| Country | Market Value | Securities | ||||
| Brazil | $857,531 | 3.5 | % | |||
| China | 333,630 | 1.3 | ||||
| France | 997,587 | 4.1 | ||||
| Germany | 1,383,184 | 5.6 | ||||
| Hong Kong | 1,096,492 | 4.5 | ||||
| Japan | 624,733 | 2.5 | ||||
| Luxembourg | 543,348 | 2.2 | ||||
| Netherlands | 1,817,062 | 7.4 | ||||
| Switzerland | 536,843 | 2.2 | ||||
| United Kingdom | 900,727 | 3.7 | ||||
| United States(1) | 15,453,581 | 63.0 | ||||
| Total | $24,544,718 | 100.0 | % | |||
| † | Security valued at amortized cost. | |
| (1) | Includes short-term securities. | |
| See notes to financial statements. |
44
|
| STATEMENT OF ASSETS AND LIABILITIES | ||
| September 30, 2007 | ||
| (Amounts in thousands) | ||
| ASSETS | ||
| Investments, at value (cost $22,721) | $24,545 | |
| Receivable for investments sold | 909 | |
| Receivable for capital stock sold | 1 | |
| Interest and dividends receivable | 22 | |
| Due from advisor | 113 | |
| Prepaid expenses and other assets | 130 | |
| Total Assets | 25,720 | |
| LIABILITIES | ||
| Payable for investments purchased | 801 | |
| Payable for capital stock redeemed | 2 | |
| Accrued distribution fee | 16 | |
| Accrued trustees’ fees | 119 | |
| Accrued expenses and other liabilities | 41 | |
| Total Liabilities | 979 | |
| NET ASSETS | $24,741 | |
| NET ASSETS CONSIST OF | ||
| Paid-in-capital | $22,209 | |
| Accumulated net investment income | 456 | |
| Accumulated net realized loss on | ||
| investments and foreign currency transactions | 243 | |
| Net unrealized appreciation on investments | ||
| and foreign currency translations | 1,833 | |
| NET ASSETS | $24,741 | |
| SHARES OUTSTANDING, $0.001 par value | ||
| (Unlimited shares authorized) | 2,185 | |
| NET ASSET VALUE, REDEMPTION PRICE, | ||
| AND OFFERING PRICE PER SHARE | ||
| (NET ASSETS/SHARES OUTSTANDING)* | $11.32 | |
| STATEMENT OF OPERATIONS | ||
| FOR THE PERIOD December 29, 2006(1) THROUGH September 30, 2007 | ||
| (Amounts in thousands) | ||
| INVESTMENT INCOME | ||
| Interest | $237 | |
| Dividends (net of $23 of non-reclaimable | ||
| foreign withholding taxes) | 458 | |
| Total Investment Income | 695 | |
| EXPENSES | ||
| Investment advisory fees | 154 | |
| Professional fees | 73 | |
| Custody and fund accounting fees | 61 | |
| Distribution fees | 45 | |
| Fund administration fees | 34 | |
| Transfer agent fees and expenses | 25 | |
| Federal and state registration fees | 24 | |
| Printing and postage expenses | 13 | |
| Trustees’ fees and expenses | 9 | (2) |
| Miscellaneous | 9 | |
| Total Expenses | 447 | |
| Less waiver of expenses and | ||
| expenses paid indirectly | (226 | ) |
| Net Expenses | 221 | |
| NET INVESTMENT INCOME | 474 | |
| REALIZED AND UNREALIZED GAIN | ||
| Net realized loss on investments | (125 | ) |
| Net realized gain on foreign | ||
| currency transactions | 337 | |
| Change in unrealized | ||
| appreciation/depreciation on | ||
| investments and foreign currency translations | 1,833 | |
| Net Gain on Investments | 2,045 | |
| NET INCREASE IN NET ASSETS | ||
| RESULTING FROM OPERATIONS | $2,519 | |
| * | Not in thousands. | |
| (1) | Commencement of operations. | |
| (2) | Includes $639 for trustees fees and expenses and $8,579 for the unrealized appreciation related to the mark to market of the shares in the Deferred Fee Plan during the year ended September 30, 2007. | |
| See notes to financial statements. |
45
|
| STATEMENTS OF CHANGES IN NET ASSETS | |||
| 12/29/06* | |||
| (Amounts in thousands) | to 9/30/07 | ||
| OPERATIONS | |||
| Net investment income | $474 | ||
| Net realized loss on investments | (125 | ) | |
| Net realized gain on foreign currency transactions | 337 | ||
| Change in unrealized appreciation/depreciation | |||
| on investments and foreign currency translations | 1,833 | ||
| Net increase in net assets resulting from operations | 2,519 | ||
| CAPITAL SHARE TRANSACTIONS | |||
| Proceeds from sale of shares | 32,595 | ||
| Redemption fees | 2 | ||
| Redemption of shares | (10,375 | ) | |
| Net increase from capital share transactions | 22,222 | ||
| TOTAL INCREASE IN NET ASSETS | 24,741 | ||
| NET ASSETS | |||
| Beginning of period | — | ||
| END OF PERIOD | $24,741 | ||
| Accumulated net investment income | 456 | ||
| TRANSACTIONS IN SHARES | |||
| Shares sold | 3,184 | ||
| Shares redeemed | (999 | ) | |
| NET INCREASE | 2,185 | ||
| * | Commencement of operations. | |
| See notes to financial statements. | ||
46
|
| FINANCIAL HIGHLIGHTS | ||
| For a Fund Share Outstanding | 12/29/06* | |
| Throughout the Period. | to 9/30/07 | |
| NET ASSET VALUE, BEGINNING OF PERIOD | $10.00 | |
| INCOME FROM INVESTMENT OPERATIONS | ||
| Net investment income | 0.22 | |
| Net realized and unrealized gains on investments | 1.10 | |
| Total from investment operations | 1.32 | |
| DISTRIBUTIONS & OTHER | ||
| Net investment income | — | |
| Net realized gains | — | |
| Redemption fees [See Note 2(i)] | — | (1) |
| Total distributions & other | — | |
| NET ASSET VALUE, END OF PERIOD | $11.32 | |
| TOTAL RETURN | 13.20% | (3) |
| SUPPLEMENTAL DATA AND RATIOS | ||
| Net assets, end of period (000s) | $24,741 | |
| Ratio of expenses to average net assets, | ||
| less waivers and before expenses paid indirectly | 1.22% | (2) |
| Ratio of net investment income (loss) to average net | ||
| assets, net of waivers, and expenses paid indirectly | 2.62% | (2) |
| Ratio of expenses to average net assets, | ||
| before waivers, and expenses paid indirectly | 2.47% | (2) |
| Ratio of net investment income (loss) to average net | ||
| assets, before waivers, and expenses paid indirectly | 1.37% | (2) |
| Portfolio turnover rate(4) | 237% | (3) |
| * | Commencement of operations. | |
| (1) | Less than $0.01. | |
| (2) | Annualized. | |
| (3) | Not annualized for the period December 29, 2006 to September 30, 2007. | |
| (4) | Portfolio turnover is greater than most funds due to the investment style of the Fund. | |
| See notes to financial statements. |
47
|
INVESTMENT REVIEW BY CORY GILCHRIST, TOM MARSICO AND JIM GENDELMAN (UNAUDITED)
We are pleased to provide performance results for the first three months of operations of the Global Fund, which officially debuted on June 29, 2007. As a reminder, the Fund seeks long-term growth of capital by investing primarily in the common stocks of US and foreign companies that are selected for their long-term growth potential.
The third calendar quarter of 2007 represented the Fund’s first full three-month period of operations. Despite a challenging market environment, the Fund was able to produce strong performance results. The Fund posted a total return of 14.60% for the period from June 29, 2007 through September 30, 2007. For comparative purposes over the same period, the MSCI All Country World Index (MSCI ACWI Index), which we consider to be the Fund’s primary benchmark index, had a total return of 3.47%. The MSCI ACWI Index measures equity market performance in the global developed and emerging markets. Please see the Fund Overview for more detailed information about the Fund’s performance for the three-month period ended September 30, 2007.
The performance data for the Fund quoted here represent past performance, and past performance is not a guarantee of future results. Investment return and principal value of an investment will fluctuate so that an investor’s shares, when redeemed, may be worth more or less than their original cost. Current performance may be lower or higher than the performance information quoted. To obtain performance information current to the most recent month-end, please call 888-860-8686 or visit www.marsicofunds.com.(1)
This review highlights Fund performance over a three-month period. Due to the brief period of time the Fund has been operational, the performance presented here may not be reflective of future results. Shareholders should keep in mind that the Funds are intended for long-term investors who hold their shares for substantially longer periods of time. You should also keep in mind that our views on all investments discussed in this report are subject to change at any time. References to specific securities, industries, and sectors discussed in this report are not recommendations to buy or sell such securities or related investments, and the Funds may not necessarily hold these securities or investments today. Please see the accompanying Schedule of Investments for the percentage of each Fund’s portfolio represented by the securities mentioned in this report.
During the third calendar quarter of 2007 while the Fund has been operational, the Fund’s performance benefited from stock selection in the Consumer Discretionary and Financials sectors. More specifically:
- Consumer Discretionary: Athletic apparel company lululemon athletica inc. soared 132% after its initial public offering, and was the Fund’s top performing individual position. The Fund’s hotel/casino operator holdings also performed well, led by a 77% gain in Las Vegas Sands Corp.
- Financials: Two of the Fund’s diversified financials holdings performed well within this sector: specialty finance company KKR Financial Holdings LLC (+21%) and stock and futures exchange company Hong Kong Exchanges and Clearing Ltd. (+86%). Industrial and Commercial Bank of China (+24%) and China-based real estate management company E-House (China) Holdings Ltd. (+49% following its initial public offering) also experienced strong gains.
Several other individual securities had a substantially positive effect on the Fund’s performance. These included athenahealth, Inc. (+73% after its initial public offering), wireless provider China Mobile Ltd. (+52%), and Canada-headquartered mobile device manufacturer Research In Motion, Ltd. (+40%).
Though the Fund’s performance results during the third calendar quarter of 2007 were strong overall, there were a few areas of weakness. The Fund’s Energy positions posted a return of +21% in aggregate, surpassing the +7% return of the MSCI ACWI Index Energy sector for the three-month period ended September 30, 2007. The Fund’s performance was
48
|
negatively impacted, however, by not having more exposure to the Energy sector, which was among the benchmark index’s top-performing areas. The MSCI ACWI Index had approximately 11% allocated, on average, in the Energy sector, while the Fund’s average weighting in the sector (as of September 30, 2007) was substantially lower.
The Fund’s Financials positions avoided much of the repercussions experienced during the credit and liquidity crisis that dominated the months of August and September. However, the Fund did hold a few financial services positions that declined sharply during the period. Credit ratings agency Moody’s Corp. had a price decline of -23% and was sold. India-headquartered ICICI Bank Ltd. and Brazil-headquartered Unibanco-Uniao de Bancos Brasileiros S.A. skidded - -22% and -15%, respectively. Neither position was held in the Fund as of September 30, 2007.
Certain other individual positions also struggled, most notably Brazilian transportation and logistics company All America Latina Logistica S.A. (-20% prior to being sold) and Hong Kong-headquartered hotel operator Mandarin Oriental International Ltd. (-16%).
On average, the Fund had more exposure to securities economically tied to the US than did the MSCI ACWI Index during the Fund’s initial three-month period of operations. This positioning presented a currency “cost” to the Fund, as the US dollar weakened in the quarter relative to many other world currencies such as the Euro. The Fund generally had less exposure to companies whose securities are priced in Euros and traded in countries that utilize the Euro; therefore a smaller portion of the Fund, compared with its benchmark index, benefited from the Euro’s valuation increase.
In addition, the Fund had an average cash position of approximately 18% as it implemented its investment strategy. This adversely impacted performance results, as cash instruments did not offer the same level of returns as equities during the three-month period.
The Fund invests from time to time in initial public offerings (“IPOs”) of common stock or other equity or debt securities issued by a corporate issuer. Because the Fund is relatively new and its assets are relatively small, investments in IPOs could have a magnified impact on Fund performance, which could tend to diminish as the Fund’s assets grow. IPOs did make a significant positive contribution to the Fund’s performance during the three-month period ended September 30, 2007. There can be no assurance that similar contributions from IPOs will continue in the future.
The Global Fund over its short history has tended to have a fairly high portfolio turnover level. This is attributable to the Fund’s investment style and its relatively small base of assets under management. Although the Fund may hold core positions for some time, it may change its portfolio composition quickly to take advantage of new opportunities, or to address issues affecting particular holdings.
Fiscal Year-End Investment Posture
As of September 30, 2007, the Fund’s primary economic sector allocations were in the following areas: Financials, Consumer Discretionary, Information Technology, Industrials, and Consumer Staples. The Fund’s most significant country allocations were the US, Switzerland, and China/Hong Kong.
Sincerely,
CORYDON J. GILCHRIST, CFA
THOMAS F. MARSICO
JAMES G. GENDELMAN
PORTFOLIO MANAGERS
| (1) | Total returns are based on net change in NAV assuming reinvestment of distributions. The performance returns for the Global Fund reflect a fee waiver in effect; in the absence of such a waiver, the returns would have been reduced. A redemption fee of 2% may be imposed on redemptions or exchanges of Fund shares owned for 30 days or less. Please see the Prospectus for more information. |
49
|
FUND OVERVIEW September 30, 2007 (Unaudited)
The Global Fund invests primarily in common stocks that are selected for their long-term growth potential. The Fund invests in the securities of companies of any size that are economically tied to any countries or markets throughout the world, including the securities of companies economically tied to emerging markets. Under normal market conditions, the Fund will invest significantly (generally, at least 40% of its net assets) in the securities of issuers organized or located outside the U.S. or doing business outside the U.S. (unless market conditions are not deemed favorable by the Adviser, in which case the Fund generally will invest at least 30% of its assets in such foreign securities). The Fund will invest its assets in various regions and countries, including the U.S., that encompass not less than three different countries overall. The Fund may hold an unlimited number of common stocks.
PERFORMANCE COMPARISON |
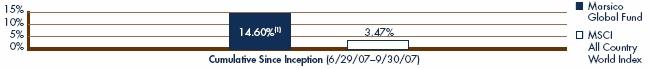 |
| TOTAL ANNUAL OPERATING EXPENSES* | 1.60 | % | ||
| NET EXPENSES*† | 0.75 | % | ||
| NET ASSETS | ||||
| 9/30/07 | $31,476,940 | |||
| NET ASSET VALUE | ||||
| Net Asset Value Per Share | $11.46 | |||
| TOP FIVE HOLDINGS | ||||
| KKR Financial Holdings LLC | 4.81 | % | ||
| The Goldman Sachs Group, Inc. | 4.08 | |||
| Mandarin Oriental | ||||
| International Ltd. GDR | 3.72 | |||
| Las Vegas Sands Corp. | 3.03 | |||
| Lockheed Martin Corporation | 2.99 | |||
| SECTOR ALLOCATION(3) | ||||
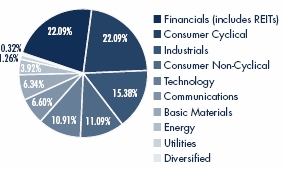 | ||||
| GROWTH OF $10,000(1)(2) | ||||
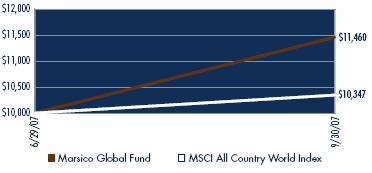 | ||||
| * | The Total Annual Operating Expenses and Net Expenses are reflective of the information disclosed in the Fund’s Prospectus dated June 25, 2007 and may differ from the expense ratios disclosed in this report. | |
| † | The Adviser has entered into a written expense limitation agreement under which it has agreed to limit the total expenses of the Fund (excluding interest, taxes, acquired fund fees and expenses, litigation, brokerage and extraordinary expenses) to an annual rate of 0.75% of the Global Fund’s average net assets until December 31, 2007. This fee waiver may be terminated at any time after December 31, 2007. The Adviser may recoup any waived amount from a Fund pursuant to this arrangement if such reimbursement does not cause the Fund to exceed existing expense limitations and the reimbursement is made within three years after the year in which the Adviser incurred the expense. | |
| The performance data quoted here represent past performance, and past performance is not a guarantee of future results. Investment return and principal value of an investment will fluctuate so that an investor’s shares, when redeemed, may be worth more or less than their original cost. Current performance may be lower or higher than the performance information quoted. To obtain performance information current to the most recent month-end, please call 888-860-8686 or visit www.marsicofunds.com. A redemption fee may be imposed on redemptions or exchanges of Fund shares held for 30 days or less. | ||
| Initial public offerings (“IPOs”) made a significant positive contribution to the Fund’s recent performance. There can be no assurance that similar contributions from IPOs will continue in the future. | ||
| The performance included in the table and graph does not reflect the deduction of taxes on Fund distributions or the redemption of Fund shares. | ||
| (1) | The performance returns for the Global Fund reflect a fee waiver in effect; in the absence of such a waiver, the returns would be reduced. | |
| (2) | This chart assumes an initial investment of $10,000 made on June 29, 2007 (inception). Total returns are based on change in NAV, assuming reinvestment of distributions. | |
| (3) | Sector weightings represent the percentage of the Fund’s equity investments in certain general sectors. These sectors may include more than one industry. The Fund’s portfolio composition is subject to change at any time. | |
| The MSCI ACWI (All Country World Index) Index is a free float-adjusted market capitalization index that is designed to measure equity market performance in the global developed and emerging markets. You cannot invest directly in an index. |
50
|
SCHEDULE OF INVESTMENTS September 30, 2007
| Number | Percent | |||||
| of | of Net | |||||
| Shares | Value | Assets | ||||
| COMMON STOCKS | ||||||
| Advertising Services | ||||||
| JC Decaux S.A. | 13,908 | $488,465 | 1.55 | % | ||
| Aerospace/Defense | ||||||
| Lockheed Martin Corporation | 8,657 | 939,198 | 2.99 | |||
| Raytheon Company | 12,248 | 781,667 | 2.48 | |||
| 1,720,865 | 5.47 | |||||
| Agricultural Chemicals | ||||||
| Monsanto Company | 3,405 | 291,945 | 0.93 | |||
| Agriculture Operations | ||||||
| BrasilAgro - Companhia Brasileira | ||||||
| de Propriedades Agricolas* | 400 | 269,504 | 0.86 | |||
| Airlines | ||||||
| Ryanair Holdings PLC ADR* | 8,114 | 336,812 | 1.07 | |||
| Brewery | ||||||
| Heineken Holding N.V. | 12,693 | 727,603 | 2.31 | |||
| Building Products - Cement/Aggregates | ||||||
| Holcim Ltd. | 8,411 | 929,057 | 2.95 | |||
| Casino Hotels | ||||||
| Las Vegas Sands Corp.* | 7,157 | 954,887 | 3.03 | |||
| MGM MIRAGE* | 9,527 | 852,095 | 2.71 | |||
| 1,806,982 | 5.74 | |||||
| Cellular Telecommunications | ||||||
| China Mobile Ltd. ADR | 8,524 | 699,309 | 2.22 | |||
| Chemicals - Specialty | ||||||
| Lonza Group AG | 4,217 | 460,003 | 1.46 | |||
| Commercial Banks - Non-U.S. | ||||||
| Industrial and Commercial | ||||||
| Bank of China – Cl. H | 716,000 | 500,123 | 1.59 | |||
| Julius Baer Holdings Ltd. | 12,166 | 909,642 | 2.89 | |||
| 1,409,765 | 4.48 | |||||
| Computers | ||||||
| Apple, Inc.* | 4,682 | 718,874 | 2.29 | |||
| Research In Motion, Ltd. ADR* | 7,160 | 705,618 | 2.24 | |||
| 1,424,492 | 4.53 | |||||
| Data Processing/Management | ||||||
| MasterCard, Inc. – Cl. A | 5,531 | 818,422 | 2.60 | |||
| Diversified Operations | ||||||
| China Merchants Holdings | ||||||
| (International) Co., Ltd. | 14,000 | 87,164 | 0.28 | |||
| Electronic Components - Semiconductors | ||||||
| NVIDIA Corporation* | 19,050 | 690,372 | 2.19 | |||
| Engineering/R&D Services | ||||||
| ABB Ltd. | 27,910 | 734,997 | 2.33 | |||
| AECOM Technology | ||||||
| Corporation* | 12,757 | 445,602 | 1.42 | |||
| 1,180,599 | 3.75 | |||||
| Finance - Investment Banker/Broker | ||||||
| Duff & Phelps | ||||||
| Corporation – Cl. A* | 8,426 | 154,617 | 0.49 | |||
| The Goldman | ||||||
| Sachs Group, Inc. | 5,919 | 1,282,884 | 4.08 | |||
| 1,437,501 | 4.57 | |||||
| Finance - Other Services | ||||||
| CME Group, Inc. | 1,056 | 620,242 | 1.97 | |||
| Hong Kong Exchanges | ||||||
| and Clearing Ltd. | 10,000 | 306,155 | 0.97 | |||
| 926,397 | 2.94 | |||||
| Food - Retail | ||||||
| Tesco PLC | 95,304 | 856,502 | 2.72 | |||
| Hotels & Motels | ||||||
| Mandarin Oriental | ||||||
| International Ltd. GDR | 521,000 | 1,172,250 | 3.72 | |||
| Industrial Gases | ||||||
| Praxair, Inc. | 6,672 | 558,847 | 1.78 | |||
| Investment Management Companies | ||||||
| KKR Financial Holdings LLC | 89,923 | 1,515,202 | 4.81 | |||
| Medical - Drugs | ||||||
| Actelion Ltd.* | 1,540 | 85,317 | 0.27 | |||
| Medical - HMO | ||||||
| UnitedHealth Group, Inc. | 12,835 | 621,599 | 1.97 | |||
| Non-Ferrous Metals | ||||||
| Grupo Mexico S.A. de C.V. | 55,057 | 395,156 | 1.26 | |||
| Oil - Field Services | ||||||
| Schlumberger Ltd. | 5,920 | 621,600 | 1.97 | |||
| Oil Companies - Integrated | ||||||
| Petroleo Brasileiro S.A. ADR | 5,727 | 432,388 | 1.37 | |||
| Physician Practice Management | ||||||
| athenahealth, Inc.* | 12,465 | 422,688 | 1.34 | |||
| * | Non-income producing. | |
| See notes to financial statements. | ||
51
|
SCHEDULE OF INVESTMENTS September 30, 2007
| Number | Percent | |||||
| of | of Net | |||||
| Shares | Value | Assets | ||||
| COMMON STOCKS continued | ||||||
| Real Estate Management/Services | ||||||
| E-House (China) | ||||||
| Holdings Ltd. ADR* | 12,859 | $294,471 | 0.94 | % | ||
| REITs - Warehouse/Industrial | ||||||
| ProLogis | 5,409 | 358,887 | 1.14 | |||
| Retail - Apparel/Shoe | ||||||
| lululemon athletica inc. ADR* | 8,949 | 376,126 | 1.20 | |||
| Retail - Discount | ||||||
| Costco Wholesale Corporation | 12,574 | 771,666 | 2.45 | |||
| Retail - Drug Stores | ||||||
| CVS/Caremark Corporation | 8,264 | 327,502 | 1.04 | |||
| Retail - Restaurants | ||||||
| McDonald’s Corporation | 14,398 | 784,259 | 2.49 | |||
| Toys | ||||||
| Nintendo Co., Ltd. | 700 | 364,428 | 1.16 | |||
| Transportation - Services | ||||||
| Kuehne + Nagel | ||||||
| International AG* | 3,107 | 305,830 | 0.97 | |||
| Water | ||||||
| Veolia Environment | 3,934 | 338,769 | 1.08 | |||
| Web Portals/Internet Service Providers | ||||||
| Google, Inc. – Cl. A* | 1,036 | 587,692 | 1.87 | |||
| TOTAL COMMON STOCKS | ||||||
| (Cost $23,812,402) | 26,896,436 | 85.45 | ||||
| SHORT-TERM INVESTMENTS | ||||||
| Federal Home Loan | ||||||
| Mortgage Discount | ||||||
| Notes, 4.00%, 10/1/07 | 2,700,000 | 2,700,000 | 8.58 | |||
| SSgA Prime Money | ||||||
| Market Funds, 5.19% | 1 | 1 | 0.00 | |||
| SSgA U.S. Government Money | ||||||
| Market Fund, 4.68% | 1,407,238 | 1,407,238 | 4.47 | |||
| SSgA U.S. Treasury Money | ||||||
| Market Fund, 3.84% | 1,443,001 | 1,443,001 | 4.58 | |||
| United States Treasury | ||||||
| Bill, 3.25%, 11/1/07† | 3,515,000 | 3,505,161 | 11.14 | |||
| TOTAL SHORT-TERM INVESTMENTS | ||||||
| (Cost $9,055,401) | 9,055,401 | 28.77 | ||||
| TOTAL INVESTMENTS | ||||||
| (Cost $32,867,803) | 35,951,837 | 114.22 | ||||
| Liabilities Less Cash and Other Assets | (4,474,897 | ) | (14.22 | ) | ||
| NET ASSETS | $31,476,940 | 100.00 | % | |||
| SUMMARY OF INVESTMENTS BY COUNTRY | ||||||
| Percent of | ||||||
| Investment | ||||||
| Country | Market Value | Securities | ||||
| Brazil | $701,892 | 2.0 | % | |||
| Canada | 1,081,744 | 3.0 | ||||
| China | 794,594 | 2.2 | ||||
| France | 827,234 | 2.3 | ||||
| Hong Kong | 2,264,878 | 6.3 | ||||
| Ireland | 336,812 | 0.9 | ||||
| Japan | 364,428 | 1.0 | ||||
| Mexico | 395,156 | 1.1 | ||||
| Netherlands | 727,603 | 2.0 | ||||
| Switzerland | 3,424,846 | 9.5 | ||||
| United Kingdom | 856,501 | 2.4 | ||||
| United States(1) | 24,176,149 | 67.3 | ||||
| Total | $35,951,837 | 100.0 | % | |||
| * | Non-income producing. | |
| † | Security valued at amortized cost. | |
| (1) | Includes short-term securities. | |
| See notes to financial statements. | ||
52
|
STATEMENT OF ASSETS AND LIABILITIES
September 30, 2007
| (Amounts in thousands) | ||
| ASSETS | ||
| Investments, at value (cost $32,868) | $35,952 | |
| Receivable for investments sold | 688 | |
| Receivable for capital stock sold | 185 | |
| Interest and dividends receivable | 23 | |
| Due from advisor | 95 | |
| Prepaid expenses and other assets | 11 | |
| Total Assets | 36,954 | |
| LIABILITIES | ||
| Payable for investments purchased | 5,394 | |
| Accrued distribution fee | 9 | |
| Accrued trustees’ fees | — | (2) |
| Accrued expenses and other liabilities | 74 | |
| Total Liabilities | 5,477 | |
| NET ASSETS | $31,477 | |
| NET ASSETS CONSIST OF | ||
| Paid-in-capital | $27,961 | |
| Accumulated net investment income | 132 | |
| Accumulated net realized loss on | ||
| investments and foreign currency transactions | 300 | |
| Net unrealized appreciation on investments | ||
| and foreign currency translations | 3,084 | |
| NET ASSETS | $31,477 | |
| SHARES OUTSTANDING, $0.001 par value | ||
| (Unlimited shares authorized) | 2,748 | |
| NET ASSET VALUE, REDEMPTION PRICE, | ||
| AND OFFERING PRICE PER SHARE | ||
| (NET ASSETS/SHARES OUTSTANDING)* | $11.46 | |
| STATEMENT OF OPERATIONS | ||
| FOR THE PERIOD June 29, 2007(1) THROUGH September 30, 2007 | ||
| (Amounts in thousands) | ||
| INVESTMENT INCOME | ||
| Interest | $50 | |
| Dividends (net of $1 of non-reclaimable | ||
| foreign withholding taxes) | 47 | |
| Total Investment Income | 97 | |
| EXPENSES | ||
| Professional fees | 57 | |
| Custody and fund accounting fees | 52 | |
| Investment advisory fees | 46 | |
| Printing and postage expenses | 31 | |
| Distribution fees | 14 | |
| Federal and state registration fees | 14 | |
| Fund administration fees | 13 | |
| Transfer agent fees and expenses | 11 | |
| Miscellaneous | 2 | |
| Trustees’ fees and expenses | — | (2) |
| Total Expenses | 240 | |
| Less waiver of expenses and | ||
| expenses paid indirectly | (200 | ) |
| Net Expenses | 40 | |
| NET INVESTMENT INCOME | 57 | |
| REALIZED AND UNREALIZED GAIN | ||
| Net realized gain on investments | 350 | |
| Net realized loss on foreign | ||
| currency transactions | (50 | ) |
| Change in unrealized appreciation/ | ||
| depreciation on investments and | ||
| foreign currency translations | 3,084 | |
| Net Gain on Investments | 3,384 | |
| NET INCREASE IN NET ASSETS | ||
| RESULTING FROM OPERATIONS | $3,441 | |
| * | Not in thousands, based on unrounded net assets and shares outstanding. | |
| (1) | Commencement of operations. | |
| (2) | Less than $1,000. | |
| See notes to financial statements. | ||
53
|
STATEMENTS OF CHANGES IN NET ASSETS
| 6/29/07* | ||
| (Amounts in thousands) | to 9/30/07 | |
| OPERATIONS | ||
| Net investment income | $57 | |
| Net realized gain on investments | 350 | |
| Net realized loss on foreign currency transactions | (50 | ) |
| Change in unrealized appreciation/depreciation | ||
| on investments and foreign currency translations | 3,084 | |
| Net increase in net assets resulting from operations | 3,441 | |
| CAPITAL SHARE TRANSACTIONS | ||
| Proceeds from sale of shares | 29,091 | |
| Redemption fees | 5 | |
| Redemption of shares | (1,060 | ) |
| Net increase from capital share transactions | 28,036 | |
| TOTAL INCREASE IN NET ASSETS | 31,477 | |
| NET ASSETS | ||
| Beginning of period | — | |
| END OF PERIOD | $31,477 | |
| Accumulated net investment income | 132 | |
| TRANSACTIONS IN SHARES | ||
| Shares sold | 2,851 | |
| Shares redeemed | (103 | ) |
| NET INCREASE | 2,748 | |
| * | Commencement of operations. | |
| See notes to financial statements. |
54
|
FINANCIAL HIGHLIGHTS
| For a Fund Share Outstanding | 6/29/07* | |
| Throughout the Period. | to 9/30/07 | |
| NET ASSET VALUE, BEGINNING OF PERIOD | $10.00 | |
| INCOME FROM INVESTMENT OPERATIONS | ||
| Net investment income | 0.02 | |
| Net realized and unrealized gains on investments | 1.44 | |
| Total from investment operations | 1.46 | |
| DISTRIBUTIONS & OTHER | ||
| Net investment income | — | |
| Net realized gains | — | |
| Redemption fees [See Note 2(i)] | — | (1) |
| Total distributions & other | — | |
| NET ASSET VALUE, END OF PERIOD | $11.46 | |
| TOTAL RETURN | 14 .60% | (3) |
| SUPPLEMENTAL DATA AND RATIOS | ||
| Net assets, end of period (000s) | $31,477 | |
| Ratio of expenses to average net assets, less | ||
| waivers and before expenses paid indirectly | 0.75% | (2) |
| Ratio of net investment income (loss) to average net | ||
| assets, net of waivers, and expenses paid indirectly | 1.06% | (2) |
| Ratio of expenses to average net assets, before | ||
| waivers, and expenses paid indirectly | 4.48% | (2) |
| Ratio of net investment income (loss) to average net | ||
| assets, before waivers, and expenses paid indirectly | (2.67)% | (2) |
| Portfolio turnover rate | 56% | (3) |
| * | Commencement of operations. | |
| (1) | Less than $0.01. | |
| (2) | Annualized. | |
| (3) | Not annualized for the period June 29, 2007 to September 30, 2007. | |
| See notes to financial statements. | ||
55
|
NOTES TO FINANCIAL STATEMENTS September 30, 2007
| 1. | Organization | ||||
| The Marsico Investment Fund (the “Trust”) was organized on October 1, 1997, as a Delaware Statutory Trust and is registered under the Investment Company Act of 1940 (the “1940 Act”) as an open-end management investment company. The Focus Fund, the Growth Fund, the 21st Century Fund, the International Opportunities Fund, the Flexible Capital Fund, and the Global Fund (collectively, the “Funds”) are separate investment portfolios of the Trust. The Focus Fund and the Flexible Capital Fund are non-diversified funds and the Growth Fund, the 21st Century Fund, the International Opportunities Fund, and the Global Fund are diversified funds. The Focus and Growth Funds commenced operations on December 31, 1997, the 21st Century Fund commenced operations on February 1, 2000, the International Opportunities Fund commenced operations on June 30, 2000, the Flexible Capital Fund commenced operations on December 29, 2006, and the Global Fund commenced operations on June 29, 2007. Affiliates of the Adviser hold approximately 42% of the Flexible Capital Fund and 18% of the Global Fund as of September 30, 2007. | |||||
| 2. | Significant Accounting Policies | ||||
| The following is a summary of significant accounting policies consistently followed by the Funds in the preparation of their financial statements. These policies are in conformity with generally accepted accounting principles (“GAAP”) for investment companies. The presentation of financial statements in conformity with GAAP requires management to make estimates and assumptions that affect the reported amounts of assets and liabilities at the date of the financial statements and the reported amounts of income and expenses during the reporting period. Actual results could differ from those estimates. Certain prior year information has been reformatted to conform to the current year presentation. | |||||
| (a) | Investment Valuation—A security traded on a recognized stock exchange is valued at the last sale price prior to the closing of the principal exchange on which the security is traded. Securities traded on NASDAQ generally will be valued at the NASDAQ Official Closing Price. If no sale is reported on the valuation date, the most current bid price will generally be used. All other securities for which over-the-counter market quotations are readily available are valued at the last sale price. Debt securities that will mature in more than 60 days are generally valued at their bid prices furnished by a pricing service. Debt securities that will mature in 60 days or less are valued at amortized cost, if it approximates market value. Any securities for which market quotations are not readily available are valued at their fair value as determined in good faith by the Adviser in accordance with procedures established by, and under the general supervision of, the Funds’ Board of Trustees. The Funds may use pricing services to assist in determining market value. The Board of Trustees has authorized the use of a pricing service to assist the Funds in valuing certain equity securities listed or traded on foreign security exchanges in the Funds’ portfolios in certain circumstances where there is a significant change in the value of related U.S.- traded securities, as represented by the S&P 500 Index. | ||||
| (b) | Expenses—The Funds are charged for those expenses that are directly attributable to each Fund, such as advisory and custodial fees. | ||||
56
|
NOTES TO FINANCIAL STATEMENTS September 30, 2007 (continued)
| Expenses that are not directly attributable to a Fund are typically allocated among the Funds in proportion to their respective net assets. The Funds’ expenses may be reduced by voluntary advisory fee waivers, brokerage credits and uninvested cash balances earning interest or credits. Such credits are included in Waiver of Expenses and Expenses Paid Indirectly in the Statement of Operations. | ||||
| Brokerage commissions were paid to unaffiliated brokers which reduced certain transfer agent fees and expenses in the amount of $111,547, $38,019 and $738 for the Focus Fund, Growth Fund, and 21st Century Fund, respectively, for the year ended September 30, 2007. Also, the Funds received credits on certain custody account balances which reduced certain transfer agent fees and expenses in the amount of $14,946, $8,640, $5,245, $2,159, $52 and $13 for the Focus Fund, Growth Fund, 21st Century Fund, International Opportunities Fund, Flexible Capital Fund, and Global Fund respectively, for the year ended September 30, 2007. Brokerage commission credits and custody account earnings credits are included in Expenses Paid Indirectly on the Statements of Operations. | ||||
| (c) | Federal Income Taxes—Each Fund currently and in the future intends to comply with the requirements of the Internal Revenue Code necessary to qualify as a regulated investment company and to make the requisite distributions of income to its shareholders which will be sufficient to relieve it from all or substantially all federal and state income and excise taxes. Certain Funds may utilize earnings and profits on redemption of shares as part of the dividends paid deduction. | |||
| (d) | Distributions to Shareholders—Dividends from net investment income and net realized capital gains, if any, will be declared and paid at least annually. Distributions to shareholders are recorded on the ex-dividend date. Each Fund may periodically make reclassifications among certain of its capital accounts as a result of the timing and characterization of certain income and capital gains determined in accordance with federal tax regulations, which may differ from GAAP. These reclassifications are due to differing treatment for items such as deferral of wash sales, foreign currency transactions, deferred trustees compensation, net operating losses and post-October capital losses. | |||
| (e) | Foreign Currency Translation—The accounting records of the Funds are maintained in U.S. dollars. Values of securities denominated in foreign currencies are translated into U.S. dollars at 4:00 p.m. ET. Amounts related to the purchase and sale of foreign securities and investment income are translated at the rates of exchange prevailing on the respective dates of such transactions. | |||
| Reported realized gains on foreign currency transactions arise from sales of portfolio securities, forward currency contracts, currency gains or losses realized between the trade and settlement dates on securities transactions, the difference between the amounts of dividends, interest, and foreign withholding taxes recorded on the Funds’ books, and the U.S. dollar equivalent of the amounts actually received or paid. | ||||
| The Funds do not isolate that portion of the results of operations resulting from changes in foreign exchange rates on investments from the fluctuations arising from changes |
57
|
NOTES TO FINANCIAL STATEMENTS September 30, 2007 (continued)
| in market prices of securities held at fiscal year-end. Net unrealized appreciation or depreciation on investments and foreign currency translations arise from changes in the value of assets and liabilities, including investments in securities at fiscal year-end, resulting from changes in the exchange rates and changes in market prices of securities held. | ||||
| (f) | Forward Currency Contracts and Futures Contracts—The Funds may enter into forward currency contracts to reduce their exposure to changes in foreign currency exchange rates on their foreign holdings and to lock in the U.S. dollar cost of firm purchase and sale commitments for securities denominated in foreign currencies. A forward currency contract is a commitment to purchase or sell a foreign currency at a future date at a negotiated forward rate. The gain or loss arising from the difference between the U.S. dollar cost of the original contract and the value of the foreign currency in U.S. dollars upon closing of such contract is included in net realized gain or loss from foreign currency transactions. | |||
| Forward currency contracts held by the Funds are fully collateralized by other securities. If held by the Funds, such collateral would be in the possession of the Funds’ custodian. The collateral would be evaluated daily to ensure its market value equals or exceeds the current market value of the corresponding forward currency contracts. | ||||
| Futures contracts are marked to market daily and the resultant variation margin is recorded as an unrealized gain or loss. When a contract is closed, a realized gain or loss is recorded equal to the difference between the opening and closing value of the contract. Generally, open forward and futures contracts are marked to market (i.e., treated as realized and subject to distribution) for federal income tax purposes at fiscal year-end. | ||||
| Foreign-denominated assets and forward currency contracts may involve more risks than domestic transactions, including currency risk, political and economic risk, regulatory risk and market risk. Risks may arise from the potential inability of a counterparty to meet the terms of a contract and from unanticipated movements in the value of foreign currencies relative to the U.S. dollar. | ||||
| The Funds may enter into “futures contracts” and “options” on securities, financial indexes, foreign currencies, forward contracts, interest rate swaps and swap-related products. The Funds intend to use such derivative instruments primarily to hedge or protect from adverse movements in securities prices, currency rates or interest rates. The use of futures contracts and options may involve risks such as the possibility of illiquid markets or imperfect correlation between the value of the contracts and the underlying securities, or that the counterparty will fail to perform its obligations. There were no outstanding futures, options, forward currency contracts, or swap-related products open as of September 30, 2007. | ||||
| (g) | Options Contracts—The Funds may purchase and write (sell) put and call options on foreign and domestic stock indices, foreign currencies and U.S. and foreign securities that are traded on U.S. and foreign securities exchanges and over-the-counter markets. These transactions are for hedging purposes or for the purpose of earning additional income. In addition, the Funds may enter into such transactions for cross-hedging purposes. |
58
|
NOTES TO FINANCIAL STATEMENTS September 30, 2007 (continued)
The risk associated with purchasing an option is that the Fund pays a premium whether or not the option is exercised. Additionally, the Fund bears the risk of loss of premium and change in market value should the counterparty not perform under the contract. Put and call options purchased are accounted for in the same manner as portfolio securities. The cost of securities acquired through the exercise of call options is increased by premiums paid. The proceeds from securities sold through the exercise of put options are decreased by the premiums paid. When the Fund writes an option, the premium received by the Fund is recorded as a liability and is subsequently adjusted to the current market value of the option written. Premiums received from writing options that expire are recorded by the Fund on the expiration date as realized gains from option transactions. The difference between the premium and the amount paid on effecting a closing purchase transaction, including brokerage commissions, is also treated as a realized gain, or if the premium is less than the amount paid for the closing purchase transaction, as a realized loss. If a call option is exercised, the premium is added to the proceeds from the sale of the underlying security or currency in determining whether the Fund has realized a gain or loss. If a put option is exercised, the premium reduces the cost basis of the security or currency purchased by the Fund. In writing an option, the Fund bears the market risk of an unfavorable change in the price of the security or currency underlying the written option. Exercise of an option written by the Fund could result in the Fund selling or buying a security or currency at a price different from the current market value. | |||
| (h) | Trustees’ Deferred Fee Plan— Effective February 1, 2000, the Board of Trustees adopted the Marsico Investment Fund Deferred Fee Plan (the “Deferred Fee Plan”), amended and restated as of December 30, 2005, which allows the Trustees to defer the receipt of all or a portion of their compensation received from the Funds. Any deferred fees are credited to accounts established on behalf of the Trustees into the Funds as directed by each Trustee. The amounts credited to these accounts increase or decrease in accordance with the performance of the Funds selected by the Trustees. The market value of the deferred account balances as of September 30, 2007 is shown on the Statement of Assets and Liabilities as part of an asset account, “Prepaid expenses and other assets,” and a liability account, “Accrued trustees’ fees.” Additionally, the fluctuation of the account balances due to the Funds performance is recorded by the Funds as unrealized appreciation/(depreciation) which is shown as part of “Net unrealized appreciation on investments and foreign currency translations” on the Statement of Assets and Liabilities and as compensation expense which is shown as part of the expense account “Trustees’ fees and expenses” on the Statement of Operations. Fees earned and deferred by the Trustees for the fiscal year ended September 30, 2007 are also included in “Trustees’ fees and expenses” on the Statement of Operations. Amounts credited to the Deferred Fee Plan will be deferred until distributed in accordance with the Deferred Fee Plan. | ||
| (i) | Redemption Fee—A 2.00% redemption fee is retained by the Funds to offset transaction costs and other expenses associated with short-term investing. The fee is imposed on | ||
59
|
NOTES TO FINANCIAL STATEMENTS September 30, 2007 (continued)
| certain redemptions or exchanges of shares held 30 days or less from their purchase date. Redemption fees are recorded by the Funds as a reduction of shares redeemed and as a credit to paid-in-capital. For the year ended September 30, 2007, the Focus Fund, Growth Fund, 21st Century Fund, International Opportunities Fund, Flexible Capital Fund and Global Fund received $41,275, $40,584, $121,433, $40,059, $1,664 and $4,941, respectively, in redemption fees. | |||
| (j) | Financial Accounting Standards Board Interpretation No. 48—In July 2006, the Financial Accounting Standards Board issued Interpretation No. 48, “Accounting for Uncertainty in Income Taxes - an Interpretation of FASB Statement No. 109” (the “Interpretation”). The Interpretation establishes for all entities, including pass-through entities such as the Funds, a minimum threshold for financial statement recognition of the benefit of positions taken in filing tax returns (including whether an entity is taxable in a particular jurisdiction), and requires certain expanded tax disclosures. The Focus Fund, Growth Fund, 21st Century Fund, and International Opportunities Fund adopted the Interpretation on October 1, 2007. The Flexible Capital Fund and Global Fund adopted the Interpretation at their respective commencement dates. Management has evaluated the application of the Interpretation to the Funds and has determined there is no material impact on the Funds’ financial statements. | ||
| (k) | Other—Investment transactions are accounted for on a trade date basis. Each Fund determines the gain or loss realized from the investment transactions by comparing the original cost of the security lot sold with the net sale proceeds. Dividend income is recognized on the ex-dividend date. Certain dividends from foreign securities will be recorded as soon as the Trust is informed of the dividend if such information is obtained subsequent to the ex-dividend date. Interest income is recognized on an accrual basis. During the year ended September 30, 2007, the transfer agent reimbursed $45,193 to the Growth Fund and the fund accounting agent reimbursed $2,128 to the International Opportunities Fund for losses due to processing errors. These reimbursements did not have an impact on the total return of the Funds. | ||
| (l) | Indemnifications—In the normal course of business, the Funds enter into contracts that contain provisions indemnifying other parties against specified potential liabilities. Each Fund’s maximum exposure under these arrangements is unknown as this would involve future claims that may be made against the Fund that have not yet occurred. However, based on experience, the Funds expect the risk of loss to be remote. | ||
| 3. | Investment Advisory Agreement and Transactions With Affiliates | ||
Each Fund has an agreement with Marsico Capital Management, LLC (the “Adviser”) to furnish investment advisory services to the Funds. Under the terms of these agreements, the Adviser is compensated for managing the Focus Fund and the Growth Fund at the rate of 0.85% per year of average daily net assets up to $3 billion in each Fund, and 0.75% per year of average daily net assets exceeding $3 billion in each Fund; and at a rate of 0.85% of the average daily net | |||
60
|
NOTES TO FINANCIAL STATEMENTS September 30, 2007 (continued)
assets of the 21st Century Fund, the International Opportunities Fund, the Flexible Capital Fund, and the Global Fund. The Adviser has voluntarily agreed to limit the total expenses of each Fund (excluding interest, taxes, acquired fund fees and expenses, litigation, brokerage and extraordinary expenses) to an annual rate of 1.60% of the Focus and International Opportunities Funds’ average net assets, 1.50% of the Growth and the 21st Century Funds’ average net assets, and 0.75% of the Flexible Capital and Global Funds’ average net assets until December 31, 2007. This fee waiver is voluntary and may be terminated at any time. Prior to June 1, 2007, the Adviser’s voluntary limitation agreement relating to the Flexible Capital Fund limited total expenses of the Flexible Capital Fund (excluding interest, taxes, acquired fund fees and expenses, litigation, brokerage and extraordinary expenses) to an annual rate of 1.60% of the Flexible Capital Fund’s average net assets. The voluntary waiver of expenses for the year ended September 30, 2003 excludes as an extraordinary item the unrealized appreciation of $30,090 and $17,937, respectively, for the 21st Century Fund and International Opportunities Fund related to the mark-to-market of the shares of the Deferred Fee Plan. As a result, the unrealized appreciation is retained by the Funds in accordance with the Deferred Fee Plan. For periods subsequent to September 30, 2003, unrealized appreciation/depreciation of Fund shares in the Deferred Fee Plan will be subject to the Funds’ expense reimbursement agreement with the Adviser. The Adviser is entitled to reimbursement from a Fund of any fees waived pursuant to this arrangement if such reimbursements do not cause a Fund to exceed existing expense limitations and the reimbursement is made within three years after the year in which the Adviser incurred the expense. As of September 30, 2007 reimbursements that may potentially be made by the Flexible Capital Fund and the Global Fund to the Adviser are $226,086 and $199,871, respectively, which expire in 2010. Banc of America Securities is an affiliate of the Adviser and may be designated as an introductory broker on certain Fund transactions. For the year ended September 30, 2007, none of the Funds paid brokerage commissions to Banc of America Securities. As explained in a proxy statement sent to shareholders of record as of July 26, 2007, the Funds have sought shareholder approval of new investment advisory and management agreements to address a pending change of control of the Adviser. Thomas F. Marsico, the founder and CEO of the Adviser, and a company controlled by him, have agreed to buy back ownership of the Adviser from Bank of America Corporation, which is expected to be completed by December 31, 2007. The Adviser has been a wholly-owned subsidiary of the Bank of America Corporation since 2001. The new investment advisory and management agreements are identical in all material respects to the agreements currently in place, and the change in control is not expected to change in any significant way the services provided to the Funds. | |||
| |||
| 4. | Service and Distribution Plan | ||
The Funds have adopted a Service and Distribution Plan (the “Plan”) pursuant to Rule 12b-1 under the 1940 Act. The Plan authorizes payments by the Funds in connection with the distribution of their shares at an annual rate, as determined from time to time by the Board of Trustees, of up to 0.25% of a Fund’s average daily net assets. | |||
61
|
NOTES TO FINANCIAL STATEMENTS September 30, 2007 (continued)
| 5. | Investment Transactions | ||
The aggregate purchases and sales of securities, excluding short-term investments, for the Funds for the period ended September 30, 2007, were as follows: | |||
| 21st | International | Flexible | |||||||||||
| Focus | Growth | Century | Opportunities | Capital | Global | ||||||||
| (Amounts in thousands) | Fund | Fund | Fund | Fund | Fund | Fund | |||||||
| Purchases | $3,191,918 | $1,441,909 | $2,626,271 | $873,264 | $71,876 | $35,855 | |||||||
| Sales | $3,484,444 | $1,492,344 | $1,636,270 | $844,571 | $52,336 | $12,342 | |||||||
There were no purchases or sales of U.S. government securities. | |||||||||||||
6. Federal Income Tax Information
At September 30, 2007, gross unrealized appreciation and depreciation of investments, based on cost for federal income tax purposes, were as follows: | |||||||||||||||||||
| 21st | International | Flexible | |||||||||||||||||
| Focus | Growth | Century | Opportunities | Capital | Global | ||||||||||||||
| (Amounts in thousands) | Fund | Fund | Fund | Fund | Fund | Fund | |||||||||||||
| Cost of investments | $3,575,496 | $2,157,249 | $2,067,326 | $636,000 | $23,062 | $32,999 | |||||||||||||
| Gross Unrealized | |||||||||||||||||||
| Appreciation | $1,493,114 | $926,016 | $439,335 | $198,509 | $1,898 | $3,013 | |||||||||||||
| Gross Unrealized | |||||||||||||||||||
| Depreciation | (1,062 | ) | (664 | ) | (36,539 | ) | (8,705 | ) | (415 | ) | (60 | ) | |||||||
| Net Unrealized | |||||||||||||||||||
| Appreciation | |||||||||||||||||||
| on investments | $1,492,052 | $925,352 | $402,796 | $189,804 | $1,483 | $2,953 | |||||||||||||
The difference between cost amounts for financial statement and federal income tax purposes is due primarily to wash sale loss deferrals and foreign currency transactions. | |||||||||||||||||||
The 21st Century, International Opportunities, and Flexible Capital Funds had realized currency losses (in thousands) from transactions between November 1, 2006 and September 30, 2007 of $355, $283 and $11, respectively. Post-October currency losses and capital losses are treated as arising in the Fund’s next fiscal year. The Growth and 21st Century Funds utilized (in thousands) $25,104 and $105, respectively, of its capital loss carryforwards during the year ended September 30, 2007. | |||||||||||||||||||
62
|
NOTES TO FINANCIAL STATEMENTS September 30, 2007 (continued)
As of September 30, 2007, the components of accumulated earnings (deficit) on a tax basis were as follows: |
| 21st | International | Flexible | ||||||||||||||||
| Focus | Growth | Century | Opportunities | Capital | Global | |||||||||||||
| (Amounts in thousands) | Fund | Fund | Fund | Fund | Fund | Fund | ||||||||||||
| Undistributed ordinary | ||||||||||||||||||
| income (deficit) | $(701 | ) | $(380 | ) | $81,169 | $35,805 | $1,046 | $563 | ||||||||||
| Undistributed long-term | ||||||||||||||||||
| capital gains | 322,190 | 94,089 | 23,195 | 51,126 | 14 | —- | ||||||||||||
| Tax accumulated earnings | 321,489 | 93,709 | 104,364 | 86,931 | 1,060 | 563 | ||||||||||||
| Accumulated Capital and | ||||||||||||||||||
| Other Losses | — | — | (355 | ) | (283 | ) | (11 | ) | — | |||||||||
| Unrealized appreciation | ||||||||||||||||||
| on investments | 1,492,052 | 925,352 | 402,796 | 189,804 | 1,483 | 2,953 | ||||||||||||
| Total accumulated earnings | $1,813,541 | $1,019,061 | $506,805 | $276,452 | $2,532 | $3,516 | ||||||||||||
Undistributed ordinary income (deficit) consists of net investment income, short-term capital gains and timing differences related to post-October currency losses and deferred Trustees’ compensation. The Focus, 21st Century, and International Opportunities Funds distributed to shareholders (in thousands) ordinary income of $5,110, $10,724 and $9,321, respectively, for the fiscal year ended September 30, 2007. The Focus and International Opportunities Funds distributed to shareholders (in thousands) long term capital gains of $118,229 and $16,411, respectively, for the fiscal year ended September 30, 2007. The 21st Century and International Opportunities Funds distributed to shareholders (in thousands) ordinary income of $67 and $2,078, respectively, for the fiscal year ended September 30, 2006. |
63
|
NOTES TO FINANCIAL STATEMENTS September 30, 2007 (continued)
New Accounting Pronouncement
In September 2006, the Financial Accounting Standards Board issued Statement of Financial Accounting Standards No. 157, “Fair Value Measurements.” The Statement defines fair value, establishes a framework for measuring fair value in generally accepted accounting principles (GAAP), and expands disclosures about fair value measurements. The Statement establishes a fair value hierarchy that distinguishes between (1) market participant assumptions developed based on market data obtained from sources independent of the reporting entity (observable inputs) and (2) the reporting entity’s own assumptions about market participant assumptions developed based on the best information available in the circumstances (unobservable inputs). The Statement is effective for financial statements issued for fiscal years beginning after November 15, 2007, and is to be applied prospectively as of the beginning of the fiscal year in which this Statement is initially applied. Management has recently begun to evaluate the application of the Statement to the Funds, and is not in a position at this time to evaluate the significance of its impact, if any, on the Funds’ financial statements.
Results of Shareholder Meeting (Unaudited)
A special meeting of shareholders of the Trust was held on October 12, 2007.
The sole matter voted on by the shareholders of record as of July 26, 2007 (the “Record Date”) was the approval of new Investment Advisory and Management Agreements for each of the Funds. The number of shares outstanding for each Fund as of the Record Date was 236,914,857 for the Focus Fund; 132,813,850 for the Growth Fund; 125,873,061 for the 21st Century Fund; 41,093,133 for the International Opportunities Fund; 2,341,162 for the Flexible Capital Fund; and 1,941,554 for the Global Fund.
With respect to the proposal to approve the new Investment Advisory and Management Agreement for the Flexible Capital Fund and the Global Fund, the results of the vote were as follows:
| FUND | FOR | AGAINST | ABSTAIN |
| Flexible Capital Fund | 1,676,699 | 8,813 | 13,452 |
| Global Fund | 1,142,749 | 5,129 | 26,745 |
With respect to the proposal to approve the new Investment Advisory and Management Agreement for the Focus Fund, Growth Fund, 21st Century Fund and International Opportunities Fund, an insufficient number of shareholders participated in the special meeting for action to be taken on the proposal. For the Focus Fund, Growth Fund, 21st Century Fund and International Opportunities Fund the meeting was adjourned in order to permit shareholders further time to respond to the solicitation of proxies.
64
|
REPORT OF INDEPENDENT REGISTERED PUBLIC ACCOUNTING FIRM
To the Board of Trustees and Shareholders of The Marsico Investment Fund
In our opinion, the accompanying statements of assets and liabilities, including the schedules of investments, and the related statements of operations and of changes in net assets and the financial highlights present fairly, in all material respects, the financial position of the Marsico Focus Fund, the Marsico Growth Fund, the Marsico 21st Century Fund, the Marsico International Opportunities Fund, the Marsico Flexible Capital Fund and the Marsico Global Fund (constituting The Marsico Investment Fund, hereafter referred to as the “Trust”) at September 30, 2007, the results of each of their operations for the period then ended, and the changes in each of their net assets and their financial highlights for each of the periods presented, in conformity with accounting principles generally accepted in the United States of America. These financial statements and financial highlights (hereafter referred to as “financial statements”) are the responsibility of the Trust’s management; our responsibility is to express an opinion on these financial statements based on our audits. We conducted our audits of these financial statements in accordance with the standards of the Public Company Accounting Oversight Board (United States). Those standards require that we plan and perform the audit to obtain reasonable assurance about whether the financial statements are free of material misstatement. An audit includes examining, on a test basis, evidence supporting the amounts and disclosures in the financial statements, assessing the accounting principles used and significant estimates made by management, and evaluating the overall financial statement presentation. We believe that our audits, which included confirmation of securities at September 30, 2007 by correspondence with the custodian and brokers and the application of alternative procedures where securities purchased had not been received, provide a reasonable basis for the opinion expressed above.

PricewaterhouseCoopers LLP
Denver, Colorado
November 5, 2007
65
|
EXPENSE EXAMPLE For the six months ended September 30, 2007 (Unaudited)
As a shareholder of the Marsico Funds (the “Funds”), you incur two types of costs: (1) transaction costs, including redemption fees on certain redemptions; and (2) ongoing costs, including management fees; distribution (12b-1) fees, and other Fund expenses. This Example is intended to help you understand your ongoing costs (in dollars) of investing in the Funds and to compare these costs with the ongoing costs of investing in other mutual funds.
The Example is based on an investment of $1,000 invested at the beginning of the period and held for the entire period from April 1, 2007 to September 30, 2007 (the “period”).
Actual Expenses
The first line of the table below provides information about actual account values and actual expenses. You may use the information in this line, together with the amount you invested, to estimate the expenses you paid over the period. Simply divide your account value by $1,000 (for example, an $8,600 account value divided by $1,000 equals 8.6), then multiply the result by the number in the first line under the heading entitled “Expenses Paid During the Period” to estimate the expenses you paid on your account during the period.
Hypothetical Example for Comparison Purposes
The second line of the table below provides information about hypothetical account values and hypothetical expenses based on the Funds’ actual expense ratios and an assumed rate of return of 5% per year before expenses, which is not the actual return of any of the Funds. The hypothetical account values and expenses may not be used to estimate the actual ending account balance or expenses you paid for the period. You may use this information to compare the ongoing costs of investing in the Funds and other funds. To do so, compare this 5% hypothetical example with the 5% hypothetical examples that appear in the shareholder reports of other funds.
Please note that the expenses shown in the table are meant to highlight your ongoing costs only and do not reflect any transactional costs, such as redemption fees. Therefore, the second line of the table is useful in comparing the ongoing costs only, and will not help you determine the relative total costs of owning different funds. In addition, if these transactional costs were included, your costs could have been higher.
Expenses Paid During the Period | |||
| FOCUS FUND | |||
| Beginning | Ending | Expenses paid for the | |
| account value | account value | six-month period ended | |
| April 1, 2007 | September 30, 2007 | September 30, 2007(1) | |
| Actual Example | $1,000.00 | $1,135.80 | $6.60 |
| Hypothetical Example, | |||
| assuming a 5% return before expenses | $1,000.00 | $1,018.82 | $6.24 |
| GROWTH FUND | |||
| Beginning | Ending | Expenses paid for the | |
| account value | account value | six-month period ended | |
| April 1, 2007 | September 30, 2007 | September 30, 2007(1) | |
| Actual Example | $1,000.00 | $1,143.20 | $6.68 |
| Hypothetical Example, | |||
| assuming a 5% return before expenses | $1,000.00 | $1,018.76 | $6.29 |
66
|
EXPENSE EXAMPLE For the six months ended September 30, 2007 (Unaudited) (continued)
Expenses Paid During the Period (continued)
| 21st CENTURY FUND | |||
| Beginning | Ending | Expenses paid for the | |
| account value | account value | six-month period ended | |
| April 1, 2007 | September 30, 2007 | September 30, 2007(1) | |
| Actual Example | $1,000.00 | $1,173.40 | $7.17 |
| Hypothetical Example, | |||
| assuming a 5% return before expenses | $1,000.00 | $1,018.40 | $6.66 |
| INTERNATIONAL OPPORTUNITIES FUND | |||
| Beginning | Ending | Expenses paid for the | |
| account value | account value | six-month period ended | |
| April 1, 2007 | September 30, 2007 | September 30, 2007(1) | |
| Actual Example | $1,000.00 | $1,183.70 | $7.58 |
| Hypothetical Example, | |||
| assuming a 5% return before expenses | $1,000.00 | $1,018.06 | $7.00 |
| FLEXIBLE CAPITAL FUND | |||
| Beginning | Ending | Expenses paid for the | |
| account value | account value | six-month period ended | |
| April 1, 2007 | September 30, 2007 | September 30, 2007(1) | |
| Actual Example | $1,000.00 | $1,098.00 | $5.64 |
| Hypothetical Example, | |||
| assuming a 5% return before expenses | $1,000.00 | $1,019.62 | $5.43 |
| GLOBAL FUND | |||
| Beginning | Ending | Expenses paid for the | |
| account value | account value | period June 29, 2007(2) – | |
| June 29, 2007(2) | September 30, 2007 | September 30, 2007(3) | |
| Actual Example | $1,000.00 | $1,146.00 | $2.07 |
| Hypothetical Example, | |||
| assuming a 5% return before expenses | $1,000.00 | $1,023.07 | $1.95 |
| (1) | Expenses are equal to the Funds’ annualized expense ratios (1.233% for the Focus Fund, 1.244% for the Growth Fund, 1.316% for the 21st Century Fund, 1.384% for the International Opportunities Fund, and 1.072% for the Flexible Capital Fund), multiplied by the average account value over the period, multiplied by 183/365 (to reflect the six month period). | |
| (2) | Commencement of operations. | |
| (3) | Expenses are equal to the Global Fund’s annualized expense ratio of 0.750% multiplied by the average account value from commencement of operations to September 30, 2007, multiplied by 94/365 (to reflect the period from commencement of operations to September 30, 2007). | |
67
|
CONSIDERATION OF INVESTMENT ADVISORY AND MANAGEMENT AGREEMENTS (Unaudited)
At a meeting of the Board of Trustees of the Trust on February 7, 2007, the Trustees, by a unanimous vote (including a separate vote of those Trustees who are not “interested persons” (as the term is defined in the 1940 Act (the “Independent Trustees”)) of the Trust, approved the initial Investment Advisory and Management Agreement for the Global Fund. The Independent Trustees reviewed with counsel the written and oral information that had been made available, including information about (1) the nature, extent, and quality of the services to be provided by the Adviser; (2) the historical investment performance of the other Funds and the Adviser; (3) the costs of the services to be provided and potential profits to be realized by the Adviser and its affiliates from the relationship with the Global Fund; (4) the extent to which economies of scale may be realized as the Global Fund grows; and (5) whether fee levels reflect these economies of scale for the benefit of Global Fund investors; as well as other relevant considerations such as the management fees and projected expense ratios of the Global Fund; potential fall-out benefits to the Adviser from its relationship to the Fund; and other general information about the Adviser.
Discussion of Factors Considered
The following is a summary of the Board’s discussion and views regarding the above factors:
| 1. | Nature, Extent, and Quality of Services. | ||
The Independent Trustees considered the nature, quality and extent of administrative and shareholder services to be performed by the Adviser, including portfolio management, supervision of Fund operations and compliance and regulatory filings and disclosures to shareholders, general oversight of other service providers, coordination of Fund marketing initiatives, review of Fund legal issues, assisting the Trustees in that capacity and other services. The Independent Trustees concluded that the services to be provided are extensive in nature, that the Adviser effectively manages the outsourcing to other service providers and that the Adviser has consistently delivered a high level of service for the other Funds in the Trust. | |||
| 2. | Investment Performance of the Funds and Adviser. | ||
| The Independent Trustees considered short-term and long-term investment performance for the other Funds over various periods of time as compared to both relevant equity indices and the performance of such Fund’s Lipper, Inc. peer group universe, and concluded that the Adviser was delivering satisfactory performance results consistent with the long-term investment strategies being pursued by the existing Funds. The Independent Trustees also noted that the strong investment performance delivered by the Adviser to the other Funds appeared to be consistent with the performance delivered for other clients of the Adviser. | |||
| 3. | Costs of Services and Profits Realized by the Adviser. | ||
| (a) | Costs of Services to the Global Fund: Fees and Expenses. | ||
| The Independent Trustees considered the Global Fund’s proposed management fee rate and projected expense ratio relative to industry averages for the Global Fund’s benchmark category and the advisory fees charged by the Adviser to other sub-advised funds and non-fund clients, including information regarding expense limitation commitments from the Adviser. The Independent Trustees noted that the mix of services under the Investment Advisory and Management Agreement are much more extensive than those under the Adviser’s advisory agreements for sub-advised funds as well as non-fund clients. | |||
| (b) | Profitability and Costs of Services to Adviser. | ||
| The Independent Trustees considered the Adviser’s overall profitability and costs and a pro-forma estimate of the Adviser’s profitability and costs as if the Global Fund constituted the Adviser’s only client. The Independent Trustees also considered whether the amount of profit is a fair entrepreneurial profit for the management of the Global Fund, and noted that the Adviser has substantially increased its resources devoted to Fund matters in response to regulatory | |||
68
|
requirements enacted during the last few years and Fund policies and procedures that were adopted or enhanced in late 2004 and thereafter. The Independent Trustees concluded that the Adviser’s profitability was at an acceptable level, particularly in light of the high quality of the services expected to be provided to the Global Fund. |
| 4. | Extent of Economies of Scale as Fund Grows. | |||
The Independent Trustees considered the extent of whether there are potential economies of scale with respect to the management of the Global Fund and whether the Fund would appropriately benefit from any economies of scale. The Independent Trustees agreed that it was possible that Adviser-level expenses to be incurred in managing the Global Fund eventually may level off or decline as a percentage of management fees at some point in the future. | ||||
| 5. | Whether Fee Levels Reflect Economies of Scale. | |||
The Independent Trustees also considered whether the proposed management fee rate is reasonable in relation to the pro-forma asset size of the Global Fund and any economies of scale that may initially exist. | ||||
| 6. | Other Relevant Considerations. | |||
| (a) | Adviser Personnel and Methods. | ||
| The Independent Trustees considered the size, education and experience of the Adviser’s staff. There was also a review of the Adviser’s “top down” economic analysis with “bottom up” stock selection. This two-pronged approach, considering both macro-economic factors, such as interest rates, inflation and the global competitive landscape, and seeking to identify individual companies with unique market presence and potential earnings growth that may not be recognized by the market at-large, was regarded by the Trustees as providing an overall risk-managed approach to effective stock selection. This overall strategy and corporate culture was further viewed as facilitating the recruitment, training and retention of portfolio managers and other research and management personnel, and the Trustees concluded that in each of these areas the Adviser was structured in such a way to support the high level of services expected to be provided to the Global Fund. | |||
| (b) | Other Benefits to the Adviser. | ||
| The Independent Trustees also considered the character and amount of other incidental benefits received by the Adviser and its affiliates from its association with the Global Fund. The Independent Trustees concluded that potential “fall-out” benefits that the Adviser may receive, such as greater name recognition or increased ability to obtain research or brokerage services, appear to be reasonable. | |||
Conclusions
In considering the Investment Advisory and Management Agreement, the Independent Trustees did not identify any factor as all-important or all-controlling and instead considered these factors collectively. Based on this review, it was the judgment of the Independent Trustees that shareholders had the potential to receive favorable absolute and relative performance at reasonable fees. As a part of their decision-making process, the Independent Trustees noted that they believe that a long-term relationship with a capable, conscientious adviser is in the best interests of the Global Fund. |
At a meeting of the Board of Trustees of the Trust on July 25, 2007, the Trustees, by a unanimous vote (including a separate vote of the Independent Trustees) approved new investment advisory and management agreements (the “New Investment Advisory and Management Agreements”) for the Focus Fund, Growth Fund, 21st Century Fund, International Opportunities Fund, Flexible Capital Fund, and Global Fund. The Board was asked to consider the approval of a new investment advisory and management agreement for each Fund because Thomas F. Marsico and a company controlled by Mr. Marsico had entered into a definitive agreement with Bank of America Corporation (“Bank of America”) to purchase 100% of Bank of America’s ownership interest in the Adviser (the “Transaction”). |
69
|
The closing of the Transaction would result in a change of control of the Adviser and the subsequent assignment (as that term is defined in the 1940 Act) and automatic termination of the then-current investment advisory and management agreement for each Fund. At the Board meeting, Thomas F. Marsico and Christopher J. Marsico described the Transaction to the Board and the rationale and benefits thereof. The Board was provided with information concerning the New Investment Advisory and Management Agreements and was informed of the standards it should apply in determining whether to approve the New Investment Advisory and Management Agreements. In advance of the meeting, the Independent Trustees requested and received materials from the Adviser to assist them in considering the New Investment Advisory and Management Agreements. The information provided by the Adviser to the Board included a review of the Transaction and a discussion of how the Transaction would affect the Adviser’s ability to perform its duties as set forth in the New Investment Advisory and Management Agreements. The Board was also provided information with respect to the factors noted below, including updates on information provided at the most recent annual contract review (conducted on November 8-9, 2006), for which comparative information relating to performance, advisory fees and other expenses of the Funds, other funds sub-advised by the Adviser and non-fund advisory accounts of the Adviser had been provided and considered. The information also included confirmation by the Adviser that previously provided comparisons of the Funds with other funds advised by the Adviser and non-fund accounts of similar size and investment objectives in terms of fees and other expenses had not materially changed and that the Adviser anticipated no material changes to any Fund’s expense or fee structure as a result of the Transaction. The Adviser also confirmed that key aspects of its financial status were not expected to change greatly in the initial years following the completion of the Transaction. Information was also provided confirming that the Transaction would not result in any material changes to the investment approach of any Fund and would not result in any change to the portfolio managers of the Funds or to any service provider to the Funds. The Adviser confirmed that it would use its best efforts not to place an “unfair burden” on the Funds (as that term is used in Section 15(f) of the 1940 Act) as a result of the Transaction.
In addition to the materials provided specifically for the analysis of the New Investment Advisory and Management Agreements, on an ongoing basis the Trustees receive information and reports from the Adviser and other service providers to the Funds on investment performance as well as operational, compliance and other matters. The Trustees engaged in a detailed discussion of the materials with representatives of the Adviser’s management team. The Independent Trustees then met separately with independent counsel for a full review of the materials.
Discussion of Factors Considered
In connection with the consideration of the New Investment Advisory and Management Agreements, the Trustees, including the Independent Trustees, requested and received from the Adviser, and reviewed, a wide variety of information as noted above. The following is a summary of the Board’s discussion and views regarding certain factors relevant to their consideration of the New Investment Advisory and Management Agreements:
| 1. | Nature, Extent and Quality of Services. |
The Independent Trustees considered information they believed necessary to assess the on-going ability of the Adviser to provide advisory services to the Funds following the closing of the Transaction as well as the ongoing nature and quality of services expected to be provided to the Funds. They considered the details of the anticipated ownership structure of the Adviser generally and information about how the Adviser’s management and operations would be structured following the Transaction including whether, and if so how, the Adviser’s new ownership structure might affect the Adviser’s performance of services under the New Investment Advisory and Management Agreements. The Independent Trustees considered the rationale presented concerning why Mr. Thomas F. Marsico and the management of the Adviser determined to enter into the Transaction, including the preference |
70
|
by the Adviser to ensure that it retained autonomy over all of its investment and operational decisions and how it would ensure that it controlled its further measured growth. The Independent Trustees considered the Adviser’s representations that being an autonomous investment advisory firm may have benefits in the current industry climate and may allow the Adviser enhanced flexibility to attract and retain qualified and talented personnel as the result of gaining the ability to offer employees equity interests in the company that owns the Adviser. The Board members noted that the portfolio management team is not expected to change as a result of the Transaction and that research analysts supporting them are generally expected to remain the same. Moreover, the Board was informed that the Adviser did not expect any significant changes in non-investment personnel as a result of the Transaction. With regard to the investment of Fund assets, the Adviser informed the Board members that, as a result of the Transaction, Bank of America would cease to be an affiliate of the Funds, which would permit the Funds greater flexibility to engage in brokerage or other transactions involving Bank of America or to invest in securities of Bank of America in appropriate circumstances. | |
| 2. | Investment Performance of the Funds and the Adviser. |
The Independent Trustees took note of their comprehensive review of the Funds’ short-term and long-term investment performance during the Board’s November 8-9, 2006 meeting, at which time the Board approved the continuance of the then-current investment advisory and management agreements for the Funds existing as of that date pursuant to the requirements of Section 15(c) of the 1940 Act. In this regard, the Independent Trustees had considered short-term and long-term investment performance for each such Fund over various periods of time as compared to both relevant equity indices and the performance of such Fund’s Lipper, Inc. peer group universe, and concluded that the Adviser was delivering satisfactory performance results consistent with the long-term investment strategies being pursued by the Funds. The Board members noted that, subsequently, they had received and discussed with management, at periodic intervals, information comparing the Funds’ performance against, among other things, their benchmarks. | |
| 3. | Costs of Services and Profits Realized by the Adviser. |
With regard to this factor, the Independent Trustees took note of their comprehensive review of the Adviser’s profitability during the Board’s November 8-9, 2006 meeting at which time the Board approved the continuance of the then-current investment advisory and management agreements for the Funds existing as of that date pursuant to the requirements of Section 15(c) of the 1940 Act. The Independent Trustees also reviewed information provided to them by the Adviser that described the anticipated effect the Transaction could have on the Adviser’s profitability. Among other factors, the Independent Trustees noted the Adviser’s historical operating margin and the Adviser’s statement that it anticipated that key aspects of the Adviser’s financial status are not expected to change greatly in the initial years after the Transaction. The Independent Trustees considered projections regarding the Adviser’s future profitability in determining whether to approve the New Investment Advisory and Management Agreements. The Board members were aware that it is not possible to predict with a high degree of certainty how the Adviser’s profitability might be affected by the Transaction, and they noted that this was a factor that would be evaluated on an annual basis. | |
| 4. | Extent of Economies of Scale as Funds Grow. |
With regard to this factor, the Independent Trustees took note of their comprehensive review of economies of scale during the Board’s November 8-9, 2006 meeting at which time the Board approved the continuance of the then-current investment advisory and management agreements for the Funds existing as of that date pursuant to the requirements of Section 15(c) of the 1940 Act. In this regard, the Independent Trustees considered whether there have been economies |
71
|
of scale with respect to the management of each such Fund that had commenced operations at that time and whether such Fund has appropriately benefited from any economies of scale. They noted that economies of scale may develop for certain Funds as their assets increase and their Fund-level expenses decline as a percentage of assets, but that Fund-level economies of scale may not necessarily result in Adviser-level economies of scale. The Independent Trustees agreed that it was possible that Adviser-level expenses incurred in managing the Funds eventually may level off or decline as a percentage of management fees, especially if the assets of certain Funds continue to grow beyond certain thresholds. The Transaction is not expected to materially affect economies of scale. | |
| 5. | Whether Fee Levels Reflect Economies of Scale. |
With regard to this factor, the Independent Trustees took note of their comprehensive review of the reflection of economies of scale on fee levels during the Board’s November 8-9, 2006 meeting at which time the Board approved the continuance of the then-current investment advisory and management agreements for the Funds existing as of that date pursuant to the requirements of Section 15(c) of the 1940 Act. In this regard, the Independent Trustees considered whether the management fee rate is reasonable in relation to the asset size of each such Fund and any economies of scale that may exist. The Board members noted that the fee rate set forth in each Fund’s New Investment Advisory and Management Agreement that would be payable by each Fund to the Adviser was not proposed to be changed from the fee rate set forth in each Fund’s then-current investment advisory and management agreement and that the Adviser had agreed not to seek to increase the contractual management fees for two years after the Transaction, although the Adviser could reduce or terminate voluntary fee waivers and recoup advisory fees and/or other expenses previously waived. The Independent Trustees noted that, effective November 11, 2004, at the behest of the Independent Trustees and the Adviser, breakpoints had been introduced for the two larger Funds, the Focus Fund and the Growth Fund, for assets in excess of $3 billion in each Fund. Under the breakpoints, investment management fees are 0.85% per year of average daily net assets up to and including $3 billion in each of those two Funds, and 0.75% per year of average daily net assets exceeding $3 billion in each Fund. In performing their analysis, the Independent Trustees also took note of the small level of assets in the two most recently introduced Funds (the Flexible Capital Fund and Global Fund), as well as the fee waivers adopted under which the Adviser voluntarily agreed to temporarily limit fund expenses including advisory fees for these two Funds to 0.75% on an annual basis until at least December 31, 2007, subject to possible future recoupment of previously waived fees or other expenses under certain conditions. The Independent Trustees agreed to continue to monitor whether any additional breakpoints for any of the Funds may be appropriate in the future. | |
| 6. | Other Relevant Considerations. |
The Independent Trustees took note of their comprehensive review of Adviser personnel and methods during the Board’s November 8-9, 2006 meeting at which time the Board approved the continuance of the then-current investment advisory and management agreements for the Funds existing as of that date pursuant to the requirements of Section 15(c) of the 1940 Act. The Independent Trustees considered the size, education and experience of the Adviser’s staff. The Independent Trustees also considered the character and amount of other incidental benefits received by the Adviser and its affiliates from its association with the Funds such as potential “fall-out” benefits that it may receive such as greater name recognition or increased ability to obtain research or brokerage services. The Independent Trustees also considered the Adviser’s general investment methodology, including its combining of “topdown” economic analysis with “bottom up” stock selection. This two-pronged approach, considering both macroeconomic factors, such as interest rates, inflation and the global competitive landscape, and seeking to identify individual companies with unique market |
72
|
presence and potential earnings growth that may not be recognized by the market at-large, was regarded by the Independent Trustees as providing an overall risk-managed approach to effective stock selection. This overall strategy and the Adviser’s corporate culture was further viewed by the Independent Trustees as facilitating the recruitment, training and retention of portfolio managers and other research and management personnel, and the Independent Trustees also concluded that in each of these areas the Adviser was structured in such a way to support the high level of services being provided to the Funds. The Independent Trustees also noted the appointment of A. Douglas Rao to manage the Flexible Capital Fund. The Independent Trustees considered representations from the Adviser that there are no significant changes to personnel and management style contemplated as part of the Transaction and the potential positive effect that the Transaction might have on the recruitment and retention of personnel. In the course of these discussions, the Adviser advised the Independent Trustees that it did not expect that the Transaction would have a material adverse effect on the operations of the Funds or their shareholders. The Adviser also noted that the Transaction does not contemplate any changes in the operations of the Funds. The Adviser pointed out that Thomas F. Marsico will continue to serve as Chief Executive Officer and Chief Investment Officer of the Adviser and as President and Chief Executive Officer of the Funds and that the Adviser will continue to provide the high quality of service it has provided in the past. The Adviser also noted that Mr. Marsico and the other current portfolio managers of the Funds will continue to manage the Funds. During the course of their deliberations, the Independent Trustees considered the information provided by the Adviser. The Board also considered a variety of other factors, including the effect that the Transaction may have on the Adviser and its ability to perform its duties under the New Investment Advisory and Management Agreements; the nature, quality and extent of the services historically furnished by the Adviser to the Funds; the investment record of the Adviser in managing the Funds; comparative data as to investment performance, advisory fees and other fees, including expense ratios and the impact that the Transaction may have on them; possible benefits to the Adviser from serving as the investment adviser to the Funds; the financial resources and obligations of the Adviser; and the continuance of appropriate incentives to assure that the Adviser will continue to furnish high quality services to the Funds. The Independent Trustees also considered that the Adviser has undertaken to pay the costs of preparing and distributing proxy materials to, and of holding the special meeting of, the Funds’ shareholders required under the 1940 Act to approve the New Investment Advisory and Management Agreements, as well as other fees and expenses in connection with the Transaction, including the fees and expenses of legal counsel to the Funds. The Adviser will share these costs with Bank of America and their respective affiliates. In considering the New Investment Advisory and Management Agreements, the Independent Trustees did not identify any factor as all-important or all-controlling and instead considered these factors collectively in light of each Fund’s surrounding circumstances. Based on this review, and in light of the terms of the Transaction, the Independent Trustees concluded that the terms of the New Investment Advisory and Management Agreements are fair and reasonable. In doing so, the Independent Trustees relied on statements by the Adviser representatives that the Transaction would cause no reduction in the quality of services provided to the Funds. Thus, the Trustees of the Funds, including the Independent Trustees voting separately, unanimously approved the New Investment Advisory and Management Agreements, subject to the requisite vote of the shareholders of each Fund required by the 1940 Act. |
73
|
OTHER INFORMATION (Unaudited)
Proxy Voting Guidelines
The Funds exercise the voting rights associated with the securities held by the Funds under the proxy voting policy of the Funds. A description of those policies and procedures of the Funds and a record of the Funds’ proxy votes for the one-year period ended June 30, 2007 are available without charge, upon request, by calling 888-860-8686. It is also available on the Securities and Exchange Commission’s Website at www.sec.gov.
Quarterly Filing of Portfolio Holdings
The Funds will file their complete schedule of investments with the SEC for the first and third quarters of each fiscal year on Form N-Q. The Funds’ Form N-Q will be available (i) on the SEC’s Website at www.sec.gov; (ii) at the SEC’s Public Reference Room; and (iii) by calling 800-SEC-0330.
Other Tax Information
Corporate Dividends Received DeductionFor the fiscal year ended September 30, 2007, 100%, 100% and 0% of dividends paid from net investment income, qualifies for the dividends received deduction available to corporate shareholders of the Marsico Focus, 21st Century, and International Opportunities Funds, respectively.
Qualified Dividend Income
Pursuant to Section 854 of the Internal Revenue Code of 1986, the Focus, 21st Century and International Opportunities Funds designate income dividends (in thousands) of $5,110, $10,724, and $6,986, respectively, as qualified dividend income paid during the fiscal year ended September 30, 2007.
Foreign Taxes Paid
Pursuant to the foreign tax credit election under Section 853 of the Internal Revenue Code of 1986, the International Opportunities Fund designates (in thousands) $15,909 of income derived from foreign sources and $1,305 of foreign taxes paid, for the year ended September 30, 2007.
Long Term Capital Gains Designation
Pursuant to IRC 852(b)(3) of the Internal Revenue Code the Focus and International Opportunities Funds hereby designate (in thousands) $123,338 and $16,411 respectively, as long-term capital gains distributed during the year ended September 30, 2007, or if subsequently determined to be different, the net capital gain of such year.
74
|
TRUSTEE AND OFFICER INFORMATION INDEPENDENT TRUSTEES
| Term of Office(1) | Number of Portfolios | |||||||||
| Position(s) Held | and Length of | Principal Occupation(s) | in Fund Complex | Other Directorships | ||||||
| Name, Address and Age | with the Trust | Time Served | During Past 5 Years | Overseen by Trustee | Held by Trustee | |||||
| Jay S. Goodgold 1200 17th Street Suite 1600 Denver, CO 80202 DOB: 1954 | Trustee | Since February 2006 | Private investor (July 2003 - present); Managing Director, Goldman, Sachs & Co. (August 1978 - June 2003). | 6 | None | |||||
| Elizabeth Hoffman 1200 17th Street Suite 1600 Denver, CO 80202 DOB: 1946 | Trustee | Since February 2006 | Executive Vice President and Provost, Iowa State University (January 2007 – present); President Emerita and Professor of Economics and Public Affairs, University of Colorado (August 2005 – December 2006); President, University of Colorado (September 2000 – July 2005). | 6 | None | |||||
| Walter A. Koelbel, Jr. 1200 17th Street Suite 1600 Denver, CO 80202 DOB: 1952 | Trustee | Since December 1997 | President, and other positions, Koelbel and Company (full service real estate, development, investment, and management company) (more than five years). | 6 | None | |||||
| Christopher E. Kubasik 1200 17th Street Suite 1600 Denver, CO 80202 DOB: 1961 | Trustee | Since February 2006 | Executive Vice President, Electronic Systems Business Area, Lockheed Martin Corp. (September 2007 – present); Chief Financial Officer, Lockheed Martin Corp. (February 2001 – September 2007). | 6 | None | |||||
| Michael D. Rierson 1200 17th Street Suite 1600 Denver, CO 80202 DOB: 1952 | Trustee | Since November 1998 | Vice President and Vice Chancellor for University Advancement at the University of Houston and UH System, respectively (November 2005 - present); President and Vice President, University of South Florida Foundation and University of South Florida (May 2001 - September 2005). | 6 | None | |||||
| Joseph T. Willett 1200 17th Street Suite 1600 Denver, CO 80202 DOB: 1951 | Trustee | Since November 2002 | Private investor (2002 - present); Chief Operating Officer, Merrill Lynch Europe (1998 - 2002). | 6 | None | |||||
| (1) | Each Trustee serves an indefinite term until the election of a successor. Each Officer serves an indefinite term, renewed annually, until the election of a successor. | |
| The Statement of Additional Information includes additional information about the Trustees and is available upon request, without charge, by calling 888-860-8686. | ||
75
|
TRUSTEE AND OFFICER INFORMATION INTERESTED TRUSTEES AND OFFICERS
| Term of Office(1) | Number of Portfolios | |||||||||
| Position(s) Held | and Length of | Principal Occupation(s) | in Fund Complex | Other Directorships | ||||||
| Name, Address and Age | with the Trust | Time Served | During Past 5 Years | Overseen by Trustee | Held by Trustee | |||||
| Thomas F. Marsico(2) 1200 17th Street Suite 1600 Denver, CO 80202 DOB: 1955 | Trustee, President and Chief Executive Officer | Since December 1997 | Chief Executive Officer, Marsico Capital Management, LLC (more than five years). | 6 | None | |||||
| Christopher J. Marsico(2) 1200 17th Street Suite 1600 Denver, CO 80202 DOB: 1961 | Trustee, Vice President and Treasurer | Trustee (since August 2007); Vice President and Treasurer (since September 2002) | President, Marsico Capital Management, LLC (June 2002 - present); Chief Operations Officer, Marsico Capital Management, LLC (September 1997 - June 2002). | 6 | None | |||||
| Mary L. Watson 1200 17th Street Suite 1600 Denver, CO 80202 DOB: 1959 | Vice President and Secretary | Since September 2002 | Executive Vice President and Chief Operations Officer, Marsico Capital Management, LLC (June 2002 - present); Vice President of Client Services, Marsico Capital Management, LLC (September 1997 - June 2002). | N/A | N/A | |||||
| David C. Price, CPA 1200 17th Street Suite 1600 Denver, CO 80202 DOB: 1969 | Chief Compliance Officer | Since August 2004 | Chief Compliance Officer, The Marsico Investment Fund, and Director of Compliance, Marsico Capital Management, LLC (August 2004 - present); Senior Compliance Officer, INVESCO Institutional, N.A. (October 2003 - July 2004); Assistant Vice President-Compliance, Berger Financial Group LLC and The Berger Funds (March 2001 - May 2003). | N/A | N/A | |||||
| Sander M. Bieber 1775 I Street, N.W. Washington, D.C. 20006 DOB: 1950 | Assistant Secretary | Since December 1997 | Partner, Dechert, LLP (law firm) (more than five years). | N/A | N/A | |||||
| (1) | Each Trustee serves an indefinite term until the election of a successor. Each Officer serves an indefinite term, renewed annually, until the election of a successor. | |
| (2) | Mr. Thomas Marsico and Mr. Christopher Marsico are considered Interested Trustees of the Trust because of their affiliation with Marsico Capital Management, LLC, the investment adviser to the Funds. Mr. Thomas Marsico and Mr. Christopher Marsico are brothers. | |
| The Statement of Additional Information includes additional information about the Trustees and is available upon request, without charge, by calling 888-860-8686. | ||
76

Item 2 - Code of Ethics.
(a) The Registrant, as of the end of the period covered by this report, has adopted a code of ethics that applies to the Registrant’s principal executive officer, principal financial officer, principal accounting officer or controller, or persons performing similar functions, regardless of whether these individuals are employed by the Registrant or a third party. A copy of this code of ethics is attached hereto as Exhibit (a).
(c) There have been no amendments, during the period covered by this report, to a provision of the code of ethics that applies to the Registrant’s principal executive officer, principal financial officer, principal accounting officer or controller, or persons performing similar functions, regardless of whether these individuals are employed by the Registrant or a third party, and that relates to any element of the code of ethics description.
(d) The Registrant has not granted any waivers, including an implicit waiver, from a provision of the code of ethics that applies to the Registrant’s principal executive officer, principal financial officer, principal accounting officer or controller, or persons performing similar functions, regardless of whether these individuals are employed by the Registrant or a third party, that relates to one or more of the items set forth in paragraph (b) of this item’s instructions.
(e) Not applicable.
(f) See attached Exhibit (a).
Item 3 - Audit Committee Financial Expert.
(a)(1) The Registrant’s Board of Trustees has determined that the Registrant has at least one audit committee financial expert serving on its audit committee.
(a)(2) Mr. Joseph T. Willett is the audit committee financial expert. Mr. Willett is “independent” under the applicable rules.
Item 4 - Principal Accountant Fees and Services.
In each of the fiscal years ended September 30, 2007 and September 30, 2006, the aggregate Audit Fees billed (or to be billed) by PricewaterhouseCoopers LLP (PwC) for professional services rendered for the audits of the financial statements, or services that are normally provided in connection with statutory and regulatory filings or engagements as well as reimbursable expenses are listed below.
(a) Audit Fees.
| 2007 | 2006 | |
| $127,000 | $102,900 |
(b) Audit-Related Fees. In each of the fiscal years ended September 30, 2007 and September 30, 2006, the aggregate Audit-Related Fees billed (or to be billed) by PwC for services rendered for assurance and related services to each fund that are reasonably related to the performance of the audit or review of the fund's financial statements, but not reported as Audit Fees, are shown in the table below.
| 2007 | 2006 | |
| $0 | $0 |
(c) Tax Fees. In each of the fiscal years ended September 30, 2007 and September 30, 2006 the aggregate Tax Fees billed (or to be billed) by PwC for professional services rendered for tax compliance, tax advice, and tax planning are shown in the table below.
| 2007 | 2006 | |
| $21,000 | $15,600 |
All of these fees were approved by the Trust’s Audit Committee as required pursuant to paragraph (c)(7)(ii) of Rule 2-01 of Regulation S-X.
Fees included in the Tax Fees category comprise all services performed by professional staff in the independent registered public accounting firm's tax division except those services related to the audit. Typically, this category would include fees for tax compliance, tax planning, and tax advice. Tax compliance, tax advice, and tax planning services include preparation of original and amended tax returns, claims for refund and tax payment-planning services, assistance with tax audits and appeals, tax advice related to mergers and acquisitions and requests for rulings or technical advice from taxing authorities.
(d) All Other Fees. In each of the fiscal years ended September 30, 2007 and September 30, 2006 the aggregate Other Fees billed (or to be billed) by PwC for all other non-audit services rendered are shown in the table below.
| 2007 | 2006 | |
| $0 | $0 |
(e) (1) Audit Committee Pre-Approval Policies and Procedures:
Pursuant to the Trust’s Audit Committee Charter and Policies and Procedures (collectively, the “Procedures”), the Audit Committee has adopted pre-approval policies and procedures to govern the pre-approval of (i) all audit services and permissible non-audit services to be provided to the Trust by its independent accountant, and (ii) all permissible non-audit services to be provided by such independent accountant to the Trust’s investment adviser and to any entity controlling, controlled by or under common control with the investment adviser that provides on-going services to the Trust (collectively, any “Service Affiliates”) if the engagement directly relates to the Trust’s operations and financial reporting.
In accordance with the Procedures, the Committee is responsible for the engagement of the independent accountant to certify the Trust’s financial statements for each fiscal year. With respect to the pre-approval of non-audit services provided to the Trust and its Service Affiliates, the Procedures provide that the Committee may pre-approve such services on a project-by-project basis as they arise. The Procedures also permit the Committee to delegate authority to the Audit Committee Chairman (the “Designated Member”) to pre-approve any proposed non-audit services that have not been previously approved by the Committee, subject to certain conditions. Any action by the Designated Member in approving a requested non-audit service shall be presented to the Audit Committee not later than at its next scheduled meeting. If the Designated Member does not approve the independent auditor’s provision of a requested non-audit service, the matter may be presented to the full Committee for its consideration and action.
(e)(2) Services approved pursuant to paragraph (c)(7)(i)(C) of Rule 2-01 of Regulation S-X:
100% of these fees were approved by the Trust’s Audit Committee as required pursuant to paragraph (c)(7)(ii) of Rule 2-01 of Regulation S-X.
(f) According to PwC for the fiscal year ended September 30, 2007, the percentage of hours spent on the audit the Marsico Funds’ financial statements for the most recent fiscal year that were attributed to work performed by persons who are not full-time, permanent employees of PwC is as follows:
| PwC | 2007 | |
| Work performed by persons | ||
| who are not full-time | 0% |
(g) In each of the fiscal years ended September 30, 2007 and September 30, 2006, the aggregate fees billed (or to be billed) by PwC relating to non-audit services that were rendered to the Trust, to its investment adviser, and to any entity controlling, controlled by, or under common control with the investment adviser and that provides ongoing services to the Trust are shown in the table below.
| 2007 | 2006 | |
| $20,000 | $42,000 |
(h) All non-audit services of the specified type (services that were provided by PwC to the investment adviser and to any entity controlling, controlled by, or under common control with the investment adviser and that provides ongoing services to the Trust) were pre-approved.
Item 5 - Audit Committee of Listed Registrants.
Not applicable.
Item 6 - Schedule of Investments.
The schedule of investments in securities of unaffiliated issuers is included as part of the report to shareholders filed under Item 1.
Item 7 - Disclosure of Proxy Voting Policies and Procedures for Closed-End Management Investment Companies.
Not applicable.
Item 8 – Portfolio Managers of Closed-End Management Investment Companies.
Not applicable.
Item 9 – Purchases of Equity Securities by Closed-End Management Investment Company and Affiliated Purchasers.
Not applicable.
Item 10 – Submission of Matters to a Vote of Security Holders.
Not applicable.
Item 11 - Controls and Procedures.
(a) The registrant's principal executive officer and principal financial officer have concluded that the registrant's disclosure controls and procedures (as defined in Rule 30a-3(c) under the Investment Company Act of 1940, as amended) are effective based on their evaluation of these disclosure controls and procedures within 90 days of the filing date of this report on Form N-CSR.
(b) There were no significant changes in the registrant's internal control over financial reporting (as defined in Rule 30a-3(d) under the Investment Company Act of 1940, as amended) that occurred during the second fiscal half-year covered by this report that has materially affected, or is reasonably likely to materially affect, the registrant’s internal control over financial reporting.
Item 12 – Exhibits.
(a)(1) Code of Ethics - Filed as an attachment to this filing (Exhibit (a)).
(a)(2) Certification for each principal executive and principal financial officer of the registrant as required by Rule 30a-2(a) under the Act (17 CFR 270.30a-2(a)) (Exhibits (b) and (c)).
(a)(3) Any written solicitation to purchase securities under Rule 23c-1 under the Investment Company Act of 1940, as amended, that was sent or given during the period covered by the report by or on behalf of the registrant to 10 or more persons.
Not applicable.
(b) Certifications required by Rule 30a-2(b) under the Act (17 CFR 270.30a-2(b)), Rule 13a-14(b) or Rule 15d-14(b) under the Exchange Act (17 CFR 240.13a-14(b) or 240.15d-14(b)), and Section 1350 of Chapter 63 of Title 18 of the United States Code (18 U.S.C. 1350) – Filed as an attachment to this filing (Exhibits (d) and (e)).
SIGNATURES
Pursuant to the requirements of the Securities Exchange Act of 1934 and the Investment Company Act of 1940, the registrant has duly caused this report to be signed on its behalf by the undersigned, thereunto duly authorized.
The Marsico Investment Fund
| By: | /s/ Thomas F. Marsico | ||
| Thomas F. Marsico | |||
| President | |||
| Date: | December 5, 2007 | ||
Pursuant to the requirements of the Securities Exchange Act of 1934 and the Investment Company Act of 1940, this report has been signed below by the following persons on behalf of the registrant and in the capacities and on the dates indicated.
| By: | /s/ Thomas F. Marsico | ||
| Thomas F. Marsico | |||
| President | |||
| Date: | December 5, 2007 | ||
| By: | /s/ Christopher J. Marsico | |
| Christopher J. Marsico | ||
| Vice President and Treasurer | ||
| Date: | December 5, 2007 | |