UNITED STATES
SECURITIES AND EXCHANGE COMMISSION
Washington, D.C. 20549
FORM N-CSR
CERTIFIED SHAREHOLDER REPORT OF REGISTERED MANAGEMENT INVESTMENT COMPANIES
Investment Company Act file number 811-08397
THE MARSICO INVESTMENT FUND
(Exact name of registrant as specified in charter)
1200 17th Street, Suite 1600
Denver, CO 80202
(Address of principal executive offices)(Zip code)
Christopher J. Marsico
The Marsico Investment Fund
1200 17th Street, Suite 1600
Denver, CO 80202
(Name and address of agent for service)
Copies to:
Sander M. Bieber, Esq.
Dechert LLP
1775 I Street, N.W.
Washington, D.C. 20006
Registrant's telephone number, including area code: (303) 454-5600
Date of fiscal year end: September 30
Date of reporting period: September 30, 2013
Item 1 – Reports to Stockholders.
ANNUAL REPORT SEPTEMBER 30, 2013  |
OCTOBER 2013 |
DEAR SHAREHOLDER: Enclosed is your annual report for the six portfolios of The Marsico Investment Fund (the “Marsico Funds” or the “Funds”), encompassing the one-year fiscal period from October 1, 2012 to September 30, 2013. The purpose of this report is to provide a review of the Marsico Funds’ one-year investment results by discussing what we believe were the main areas that impacted performance – including the macroeconomic environment, sector and industry positioning, and individual stock selection – as compared to the Funds’ performance benchmark indexes. For updated information regarding the market environment and the Funds’ overall investment postures and performance, please refer to the Funds’ most recent monthly fact sheets and quarterly investment updates, which are available under the name of each Fund on the Funds’ website at www.marsicofunds.com.(1) |
(1) The references included throughout the annual report to the Marsico Funds website (www.marsicofunds.com) do not incorporate the website’s contents into this report. |
TABLE OF CONTENTS |
| KEY FUND STATISTICS | 2 | ||
| MARKET ENVIRONMENT | 5 | ||
MARSICO FOCUS FUND | |||
| Investment Review | 6 | ||
| Fund Overview | 9 | ||
| Schedule of Investments | 10 | ||
MARSICO GROWTH FUND | |||
| Investment Review | 6 | ||
| Fund Overview | 11 | ||
| Schedule of Investments | 12 | ||
MARSICO 21st CENTURY FUND | |||
| Investment Review | 14 | ||
| Fund Overview | 16 | ||
| Schedule of Investments | 17 | ||
MARSICO INTERNATIONAL OPPORTUNITIES FUND | |||
| Investment Review | 19 | ||
| Fund Overview | 21 | ||
| Schedule of Investments | 22 | ||
MARSICO FLEXIBLE CAPITAL FUND | |||
| Investment Review | 24 | ||
| Fund Overview | 26 | ||
| Schedule of Investments | 27 | ||
MARSICO GLOBAL FUND | |||
| Investment Review | 29 | ||
| Fund Overview | 31 | ||
| Schedule of Investments | 32 | ||
| FINANCIAL STATEMENTS | 34 | ||
| NOTES TO FINANCIAL STATEMENTS | 44 | ||
| REPORT OF INDEPENDENT REGISTERED PUBLIC ACCOUNTING FIRM | 53 | ||
| EXPENSE EXAMPLE | 54 | ||
| OTHER INFORMATION | 55 | ||
| TRUSTEE AND OFFICER INFORMATION | 56 | ||
1
KEY FUND STATISTICS (UNAUDITED) |
Marsico Focus Fund | Marsico Growth Fund | Marsico 21st Century Fund |
| MFOCX | MGRIX | MXXIX |
| For additional disclosures, please see page 9. | For additional disclosures, please see page 11. | For additional disclosures, please see page 16. |
PERFORMANCE COMPARISON(1) | PERFORMANCE COMPARISON(1) | PERFORMANCE COMPARISON(1) |
 |  |  |
TOTAL ANNUAL OPERATING EXPENSES* 1.34% | TOTAL ANNUAL OPERATING EXPENSES* 1.35% | TOTAL ANNUAL OPERATING EXPENSES* 1.42% |
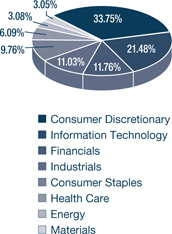
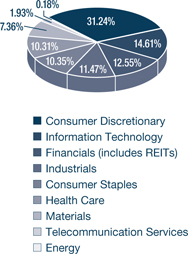
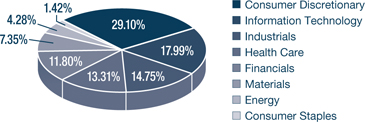
SECTOR ALLOCATION(2) | SECTOR ALLOCATION(2) | SECTOR ALLOCATION(2) |
 |  |  |
| TOP FIVE HOLDINGS | TOP FIVE HOLDINGS | TOP FIVE HOLDINGS |
| GOOGLE, INC. - CL. A | 6.55% | GILEAD SCIENCES, INC. | 5.02% | GILEAD SCIENCES, INC. | 4.66% |
| GILEAD SCIENCES, INC. | 6.25% | BIOGEN IDEC INC. | 4.12% | BIOGEN IDEC INC. | 3.97% |
| BIOGEN IDEC INC. | 5.98% | MONSANTO COMPANY | 4.08% | MONSANTO COMPANY | 3.91% |
| VISA, INC. - CL. A | 5.08% | GOOGLE, INC. - CL. A | 4.02% | MASTERCARD, INC. - CL. A | 3.15% |
| MONSANTO COMPANY | 5.07% | CITIGROUP, INC. | 3.74% | GOOGLE, INC. - CL. A | 3.10% |
For additional disclosures about the Marsico Funds, please see page 4. The performance data quoted here represent past performance, and past performance is not a guarantee of future results. Investment return and principal value of an investment will fluctuate so that an investor’s shares, when redeemed, may be worth more or less than their original cost.
2
KEY FUND STATISTICS (UNAUDITED) |
Marsico International Opportunities Fund | Marsico Flexible Capital Fund | Marsico Global Fund |
| MIOFX | MFCFX | MGLBX |
| For additional disclosures, please see page 21. | For additional disclosures, please see page 26. | For additional disclosures, please see page 31. |
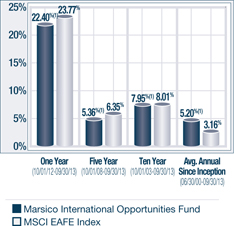
PERFORMANCE COMPARISON(1) | PERFORMANCE COMPARISON(1) | PERFORMANCE COMPARISON(1) |
 |  |  |
TOTAL ANNUAL OPERATING EXPENSES* 1.65% NET EXPENSES*† 1.60% | TOTAL ANNUAL OPERATING EXPENSES* 1.44% | TOTAL ANNUAL OPERATING EXPENSES* 1.71% NET EXPENSES*† 1.61% |
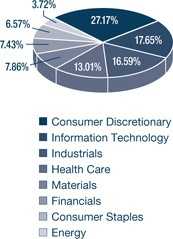
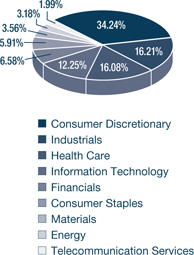
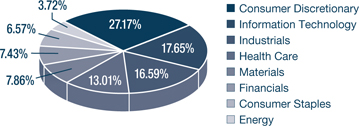
SECTOR ALLOCATION(2) | SECTOR ALLOCATION(2) | SECTOR ALLOCATION(2) |
 |  |  |
| TOP FIVE HOLDINGS | TOP FIVE HOLDINGS | TOP FIVE HOLDINGS |
| ASML HOLDING N.V. | 4.18% | MONSANTO COMPANY | 4.14% | ROLLS-ROYCE HOLDINGS PLC | 4.69% |
| ROCHE HOLDING AG | 4.17% | BIOGEN IDEC INC. | 3.88% | BIOGEN IDEC INC. | 4.42% |
| LIBERTY GLOBAL PLC - SERIES C | 4.06% | GOOGLE, INC. - CL. A | 3.81% | GILEAD SCIENCES, INC. | 3.95% |
| MASTERCARD, INC. - CL. A | 3.96% | LOWE'S COMPANIES, INC. | 3.77% | GOOGLE, INC. - CL. A | 3.79% |
| CANADIAN PACIFIC RAILWAY LTD. | 3.91% | CSX CORPORATION | 3.50% | LULULEMON ATHLETICA, INC. | 3.73% |
Current performance may be lower or higher than the performance information quoted. To obtain performance information current to the most recent month-end, please call 888-860-8686 or visit www.marsicofunds.com. A redemption fee may be imposed on redemptions or exchanges of Fund shares held for 30 days or less.
3
KEY FUND STATISTICS (UNAUDITED) |
ADDITIONAL DISCLOSURES ABOUT THE MARSICO FUNDS
| * | The Total Annual Operating Expenses and Net Expenses are reflective of the information disclosed in the Funds’ Prospectus dated February 1, 2013. The information may differ from the expense ratios disclosed in this report. |
| † | Marsico Capital Management, LLC (the “Adviser”) has entered into a written expense limitation and fee waiver agreement under which it has agreed to limit the total expenses of each of the International Opportunities Fund and the Global Fund (excluding interest, taxes, acquired fund fees and expenses, litigation, brokerage and extraordinary expenses) to an annual rate of 1.60% of each Fund’s average net assets until January 31, 2014. This expense limitation and fee waiver agreement may be terminated by the Adviser at any time after January 31, 2014, upon 15 days prior notice to the Fund and its administrator. The Adviser may recoup from a Fund fees previously waived or expenses previously reimbursed by the Adviser with respect to that Fund pursuant to this agreement (or a previous expense limitation agreement) if such reimbursement does not cause the Fund to exceed the expense limitation currently in effect and the reimbursement is made within three years after the year in which the Adviser waived the fee or reimbursed the expense. |
| (1) | The performance data quoted here represent past performance, and past performance is not a guarantee of future results. Investment return and principal value of an investment will fluctuate so that an investor’s shares, when redeemed, may be worth more or less than their original cost. Current performance may be lower or higher than the performance information quoted. To obtain performance information current to the most recent month-end, please call 888-860-8686 or visit www.marsicofunds.com. A redemption fee may be imposed on redemptions or exchanges of Fund shares held for 30 days or less. |
| The performance included in the chart does not reflect the deduction of taxes on Fund distributions or the redemption of Fund shares. |
| All indices are unmanaged and investors cannot invest directly in an index. |
The performance returns for the 21st Century Fund (for the period prior to March 31, 2004), the International Opportunities Fund (for the period prior to September 30, 2004 and from October 2011 through September 2013), the Flexible Capital Fund (for the period prior to February 1, 2011), and the Global Fund (for the period prior to January 1, 2009, from April 2009 through May 2009 and from January 2012 through September 2013) reflect a fee waiver in effect; in the absence of such a waiver, the returns would be reduced. The performance returns for the 21st Century Fund (for the period from April 2004 through January 2005), the International Opportunities Fund (for the period from October 2004 through December 2005), and the Global Fund (for the one-month period June 2009) would have been higher but for the reimbursement of fees waived previously. |
| (2) | Sector weightings represent the percentage of the respective Fund’s investments (excluding cash equivalents) in certain general sectors. These sectors may include more than one industry. The Fund’s portfolio composition is subject to change at any time. |
4
MARKET ENVIRONMENT |
MARKET ENVIRONMENT: OCTOBER 2012 – SEPTEMBER 2013 (UNAUDITED)
The equity markets for the 12-month period ended September 30, 2013 extended the equity bull market that began in March of 2009. The tenets that supported the market’s gains included a period of modest economic growth, low inflation, and aggressive central bank support. Concerns about the impact of tax increases and potential federal spending cuts, the debt ceiling debate in Congress, and the possibility of military action in Syria weighed on markets from time to time during the fiscal period. These concerns appeared to be offset by generally low inflation, improving corporate earnings and stronger manufacturing activity. Merger and acquisition activity, often a sign of rising business confidence, surged. Pent-up demand, low mortgage rates and an improving labor market supported an advance in home sales. In August, US car sales rose to a rate not experienced since before the financial crisis.
Against this backdrop, investors bid prices higher on stocks and other riskier assets, as central banks continued to pour liquidity into key markets. However, the equity markets retreated during late May and June as Federal Reserve Chairman Ben Bernanke began to talk about “tapering” the current level of bond purchases by the Federal Reserve in order to reduce historic levels of monetary stimulus. Market reaction to Chairman Bernanke’s comments was sharply negative. Stocks and commodities sold off. In the bond market, yields rose sharply. Markets came under additional pressure during the summer as the civil war in Syria intensified.
The markets recovered in mid-September, after the Federal Open Market Committee decided to hold off on cutting back bond purchases until the US economy shows evidence of further progress and support. The decision to delay tapering was welcomed by global markets, and the S&P 500 Index climbed to a record close of 1,725 on September 18, 2013. As of September 30, 2013, US 10-year Treasury bond yields were approximately 2.6%, backing off from the nearly 3% yield in place in late August. As the reporting period came to a close, US budgetary politics came to the fore. A much publicized partisan confrontation about Obamacare, deficits and the debt ceiling took hold.
Despite fiscal, political and macroeconomic challenges, global equities across many developed markets posted double-digit gains for the one-year period ended September 30, 2013 as measured by various indices below. Emerging markets, meanwhile, ended the period with an essentially flat return as measured by the MSCI Emerging Markets Index:
Index Name(1) | Universe of Equities Represented | One-Year Total Return |
| US | ||
| S&P 500 | US large-capitalization equities | +19.34% |
| Russell 3000 | US publicly-traded equities of all sizes | +21.60% |
| Russell 2000 | US small-capitalization equities | +30.06% |
| Russell Mid-Cap | US medium-capitalization equities | +27.91% |
Index Name(1) | Universe of Equities Represented | One-Year Total Return |
| INTERNATIONAL | ||
| MSCI EAFE (US$) | Equities in developed international equity markets, including Japan, Western Europe, and Australasia | +23.77% |
| MSCI Emerging Markets (US$) | Equities in developing international equity markets, including China, India, Eastern Europe, and Latin America | +0.98% |
| MSCI ACWI (US$) | Equities in the global developed and emerging markets | +17.73% |
In terms of the underlying dynamics of US equity market performance, stocks of smaller capitalization companies outperformed their large-capitalization peers. Securities of smaller companies tend to outperform during periods of economic recovery when market participants are seeking more aggressive growth. Since small companies’ businesses tend to focus on their home market, small capitalization equities are sometimes favored by investors seeking less exposure to foreign markets.
International equities in developed markets registered solid gains. Europe, at long last, demonstrated modestly improving economic conditions. European Central Bank (“ECB”) President Mario Draghi emphasized that the ECB will work to keep interest rates very low for the foreseeable future. In Japan, there was continued evidence of The Bank of Japan’s progress toward ending deflation. Within a few months of the commencement of yen depreciation, business sentiment in Japan began to rise and the Tankan Survey of Large Manufacturers jumped to a reading of 12 in September. The Tankan Survey has not been above 8 since the first quarter of 2008 - the eve of the Great Recession. The Survey results suggest that Japanese companies are increasingly competitive with Japan’s currency trading around 100 yen per dollar.
Emerging markets performance, however, was hampered by slowing economic growth in China and associated negative implications for China’s emerging market trading partners. Emerging markets sold off aggressively as US Treasury bond yields rose. Currencies of countries with the largest current-account deficits were under the greatest pressure, given worries that these countries will struggle to close their deficits when the US Federal Reserve starts to scale back its asset purchases program.
Volatility characterized the returns of the US dollar and many international currencies. During the first six months of the reporting period, the US dollar generally rose against other major currencies in anticipation of tapering by the US Federal Reserve. The US dollar weakened late in the reporting period after the Federal Reserve tempered expectations for ending its quantitative easing program. Uncertainty regarding a resolution to the US debt ceiling put additional pressure on the US dollar. As noted earlier, the yen weakened following Japanese policymakers’ initiatives to end Japan’s deflation. The euro, meanwhile, rose versus the US dollar on growing expectations that the worst of the euro zone debt crisis is behind it.
THE MARSICO INVESTMENT TEAM
| (1) | All indices are unmanaged and investors cannot invest directly in an index. |
5
FOCUS FUND & GROWTH FUND |
INVESTMENT REVIEW BY TOM MARSICO AND CORALIE WITTER (UNAUDITED)
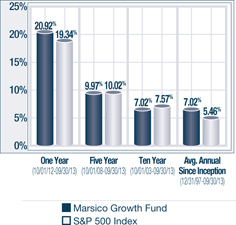
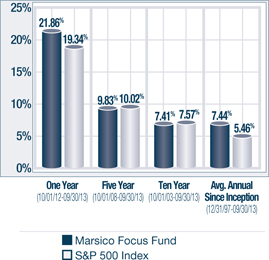
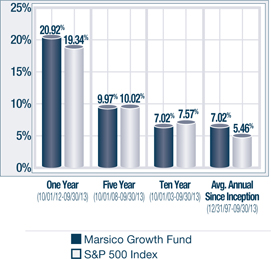
The Marsico Focus Fund and the Marsico Growth Fund generated total returns of +21.86% and +20.92%, respectively, for the one-year fiscal period ended September 30, 2013. Both Funds outperformed their benchmark index, the S&P 500 Index, which had a total return of +19.34% for the one-year period ended September 30, 2013. Please see the Funds’ Overviews for more detailed information about each Fund’s longer-term performance for various periods ended September 30, 2013.
The performance data for the Funds quoted here represent past performance, and past performance is not a guarantee of future results. Investment return and principal value of an investment will fluctuate so that an investor’s shares, when redeemed, may be worth more or less than their original cost. Current performance may be lower or higher than the performance information quoted. To obtain performance information current to the most recent month-end, please call 888-860-8686 or visit www.marsicofunds.com.(1)
This review highlights Fund performance over a one-year fiscal period. Shareholders should keep in mind that the Funds are intended for long-term investors who hold their shares for substantially longer periods of time. You should also keep in mind that our views on all investments discussed in this report are subject to change at any time. References to specific securities, industries, and sectors discussed in this report are not recommendations to buy or sell such securities or related investments, and the Funds may not necessarily hold these securities or investments today. Please see the accompanying Schedules of Investments for the percentage of each Fund’s portfolio represented by the securities mentioned in this report as of the end of the reporting period.
The Focus Fund is non-diversified and may hold fewer securities than a diversified fund because it is permitted to invest a greater percentage of its assets in a smaller number of securities. Holding fewer securities increases the risk that the value of the Fund could go down because of the poor performance of a single investment. The Funds and the stocks and markets in which they invest are subject to general risks that may include periods of turbulence, instability, decline, and cyclical change, and the risk that investors may avoid investments in equity securities generally. Please see the Prospectus for more information.
The Focus Fund and the Growth Fund often invest in similar growth companies. Their performance may differ, however, because of a variety of factors. Among other factors, the Focus Fund is a non-diversified mutual fund that may invest in a more concentrated portfolio and may hold the securities of fewer issuers than the Growth Fund, which is a diversified Fund. As a result, the Focus Fund may hold some securities that are different from those held by the Growth Fund, and the Focus Fund may be more exposed to individual stock volatility than the Growth Fund or other mutual funds that invest in a relatively larger number of securities.
FOCUS FUND
The Marsico Focus Fund’s outperformance versus the S&P 500 Index for the one-year fiscal period ended September 30, 2013 was largely attributable to an overweight posture and favorable stock selection in the Health Care sector, as defined under the Global Industry Classification Standard (“GICS”)(2).
The Fund maintained a significant weighting in the Health Care sector, primarily through investments in several pharmaceutical and biotechnology companies. One of the primary reasons for our interest in these companies is the quality of the science they are using to treat diseases that were considered untreatable just a few years ago; in our view it is exciting and revolutionary. We are seeing a variety of emerging therapeutic pathways and we believe we are in the early stages of a paradigm shift in disease treatment, in which highly-specialized compounds are developed to treat specific genetic targets. A number of the Fund’s Health Care holdings performed very well in the period. Gilead Sciences, Inc. and Biogen Idec Inc. soared +90% and +61%, respectively. Gilead Sciences is the world leader in therapeutics for viral diseases. For the last 20 years, the company has provided best-in-class treatments for Human Immunodeficiency Virus (HIV). Further, we believe the company is likely to experience significant growth with the upcoming launch of a revolutionary drug franchise for Hepatitis C. Biogen Idec. is the leader in developing treatments for the multiple sclerosis (“MS”) market. During the period, the company received approval from the Food & Drug Administration for its MS drug called Tecfidera – the first oral medication that provides an alternative that could allow thousands of patients to stop taking drugs by needle or intravenously. Health Care was a strong-performing sector of the S&P 500 Index, and the Fund did well by having a significant portion of its net assets invested in the sector.
6
FOCUS FUND & GROWTH FUND |
Stock selection in the Information Technology sector also contributed positively to performance. Apple, Inc. was the largest constituent of the S&P 500 Index and was also a significant holding in the Fund early in the reporting period. The Fund began selling Apple in the second half of 2012 and sold completely out of the stock in January 2013. Though Apple declined -27% prior to being sold from the Fund, the Fund’s performance benefitted from selling Apple at relatively high prices before further stock price declines. At the time, we felt that Apple’s product pipeline was lacking a major catalyst and, perhaps more importantly, believed that the company may not have recurring revenues. Financial transaction processor, Visa, Inc. – Cl. A (+44%) and social media company Facebook, Inc. – Cl. A (+33%) were the Fund’s best-performing Information Technology holdings.
Other individual positions having a material, positive impact on performance results included hotel and casino operator Wynn Resorts Ltd. (+50%), insurance company American International Group, Inc. (+49%), and athletic apparel company NIKE, Inc. – Cl. B (+42% prior to being sold from the Fund).
From a sector allocation perspective, the Fund benefitted from having a sizeable stake in the Consumer Discretionary sector, which was the strongest-performing sector of the benchmark index. The Fund also did well by having few investments in the weak-performing Energy and Consumer Staples sectors and by refraining from investments in the Telecommunication Services and Utilities sectors.
Although the Consumer Discretionary sector was a strong performer in the benchmark index, several of the Fund’s investments within the sector proved disappointing. The Fund’s positions in discount retailer Dollar General Corporation (-15%), online travel reservations company priceline.com, Inc. (-9%) and media holding The Walt Disney Company (-2%) each posted negative returns during the period they were held by the Fund. Dollar General and priceline.com, were sold from the Fund prior to period-end.
The collective return of the Fund’s holdings in the Financials sector, +22%, failed to keep pace with the benchmark index Financials sector return of +30%.
Consumer Staples holdings Mead Johnson Nutrition Company (-19% prior to being sold) and brewer Anheuser-Busch InBev N.V. ADR (+5% prior to being sold) each underperformed relative to the overall sector return, and therefore had a material, negative impact on performance.
Other holdings detracting from performance included pharmacy benefit management company Express Scripts Holding Company (-15% prior to being sold) and virtualization software company VMware, Inc. – Cl. A (-20% prior to being sold).
During the reporting period, the Fund reduced its exposure to the Information Technology, Consumer Discretionary and Consumer Staples sectors while increasing its allocations to the Industrials, Materials, Financials, and Health Care sectors.
GROWTH FUND
The Marsico Growth Fund outperformed the S&P 500 Index and shared several of the Focus Fund’s performance attributes for the one-year fiscal period ended September 30, 2013. Like the Focus Fund, the Growth Fund’s Health Care holdings added significantly to performance. Gilead Sciences, Inc. (+89%) and Biogen Idec Inc. (+60%) were the Fund’s top-performing positions.
Also similar to the Focus Fund, the Growth Fund did well by selling its stake in Apple, Inc. (-23% prior to being sold) in early 2013, before the company’s stock price declined further. Financial transaction processor Visa, Inc. – Cl. A rose +43% and was a meaningful positive contributor to the Fund’s holdings in the Information Technology sector.
A few of the Fund’s Consumer Discretionary positions posted strong gains, including media company CBS Corporation – Cl. B (+54%), hotel and casino operator Wynn Resorts Ltd. (+49%) and online travel reservations company priceline.com, Inc. (+60%).
The Fund’s sector allocations benefitted performance, as the Fund had a significant portion of its net assets invested in the strong-performing Consumer Discretionary sector, while refraining from investments in the weak-performing Telecommunication Services and Utilities sectors. The Fund also did well by having underweight allocations to the Energy and Consumer Staples sectors.
7
FOCUS FUND & GROWTH FUND |
Similar to the Focus Fund, the Growth Fund’s performance was dampened by stock selection in the Financials sector. An underweight allocation to the sector further detracted from the Fund’s performance relative to the benchmark index.
Several of the Fund’s consumer-related positions struggled, particularly holdings in the Consumer Staples sector and the Retailing industry. Consumer Staples holdings Anheuser-Busch InBev N.V. ADR (+7%) underperformed relative to the overall sector return and Mead Johnson Nutrition Company (-18%) posted disappointing returns and were sold from the Fund. Within the Retailing industry, discount retailer Dollar General Corporation (-16%), Lowe’s Companies, Inc. (+16%), and Dick’s Sporting Goods, Inc. (-9%) posted returns that lagged the relevant benchmark industry return of +30%. All three positions were sold from the Fund during the period.
Stock selection in the Energy sector detracted from performance. Oilfield services company Halliburton Company (-12%) and offshore drilling components provider National Oilwell Varco, Inc. (-17%) each posted double-digit declines prior to being sold from the Fund.
From a sector allocation standpoint, during the fiscal period, the Fund increased its exposure to Industrials, Materials and Financials while paring its exposure to Information Technology, Consumer Discretionary, Consumer Staples, and Energy.
The Growth Fund experienced slightly elevated portfolio turnover during the fiscal year, which may occur at times when the Fund changes its portfolio composition to harvest gains, take advantage of new opportunities, preserve capital, or limit losses.
Fiscal Period-End Investment Posture
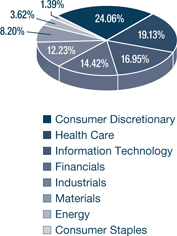
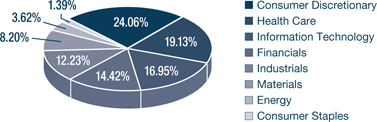
As of September 30, 2013, the Focus Fund’s and the Growth Fund’s largest sector allocations included Consumer Discretionary, Health Care, Information Technology, Industrials, and Financials. The Funds had no exposure at period end to the Utilities and Telecommunication Services sectors.
Sincerely,
THOMAS F. MARSICO
CORALIE T. WITTER, CFA
PORTFOLIO MANAGERS
| (1) | Total returns are based on net change in net asset value assuming reinvestment of distributions. A redemption fee of 2% may be imposed on redemptions or exchanges of Fund shares owned for 30 days or less. Please see the Prospectus for more information. |
| (2) | Regarding GICS data cited throughout this report, the Global Industry Classification Standard (“GICS”) was developed by and is the exclusive property and service mark of MSCI Inc. (“MSCI”) and Standard & Poor’s (“S&P”) and is licensed for use by Marsico Capital Management, LLC (“MCM”). Neither MSCI, S&P, nor MCM or any third party involved in compiling GICS makes any express or implied warranties or representations with respect to such standard or classification (or the results from use thereof), and all such parties hereby expressly disclaim all warranties of originality, accuracy, completeness, merchantability and fitness for a particular purpose with respect to any such standard or classification. MSCI, S&P, MCM, and any of their affiliates or third parties involved in compiling GICS shall not have any liability for any direct, indirect, special, punitive, consequential or any other damages (including lost profits) even if notified of the possibility of such damages. |
8
FOCUS FUND OVERVIEW |
September 30, 2013 (Unaudited)
The Focus Fund invests primarily in the common stocks of large companies that are selected for their long-term growth potential. The Fund will normally hold a core position of between 20 and 30 common stocks.
| TOTAL ANNUAL OPERATING EXPENSES* 1.34% | NET ASSETS $854,708,390 | NET ASSET VALUE PER SHARE $21.47 |
GROWTH OF $10,000(1) | PERFORMANCE COMPARISON | |
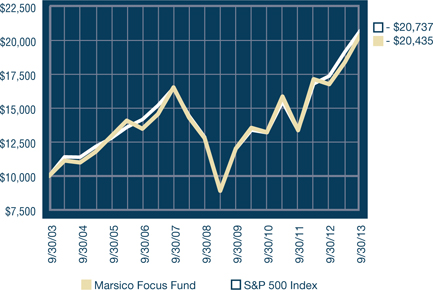 |  | |
SECTOR ALLOCATION(2) | TOP FIVE HOLDINGS | |
 | ||
| GOOGLE, INC. - CL. A | 6.55% | |
| GILEAD SCIENCES, INC. | 6.25% | |
| BIOGEN IDEC INC. | 5.98% | |
| VISA, INC. - CL. A | 5.08% | |
| MONSANTO COMPANY | 5.07% | |
| * | The Total Annual Operating Expenses are reflective of the information disclosed in the Funds’ Prospectus dated February 1, 2013 and may differ from the expense ratio disclosed in this report. |
The performance data quoted here represent past performance, and past performance is not a guarantee of future results. Investment return and principal value of an investment will fluctuate so that an investor’s shares, when redeemed, may be worth more or less than their original cost. Current performance may be lower or higher than the performance information quoted. To obtain performance information current to the most recent month-end, please call 888-860-8686 or visit www.marsicofunds.com. A redemption fee may be imposed on redemptions or exchanges of Fund shares held for 30 days or less. |
| The performance included in the chart and graph does not reflect the deduction of taxes on Fund distributions or the redemption of Fund shares. |
| All indices are unmanaged and investors cannot invest directly in an index. |
| (1) | This chart assumes an initial investment of $10,000 made on September 30, 2003. Total returns are based on net change in NAV, assuming reinvestment of distributions. |
| (2) | Sector weightings represent the percentage of the Fund’s investments (excluding cash equivalents) in certain general sectors. These sectors may include more than one industry. The Fund’s portfolio composition is subject to change at any time. |
9
SCHEDULE OF INVESTMENTS |
MARSICO FOCUS FUND
SCHEDULE OF INVESTMENTS
September 30, 2013
Number of Shares | Value | Percent of Net Assets | ||||||||||
| COMMON STOCKS | ||||||||||||
| Aerospace & Defense | ||||||||||||
| Rolls-Royce Holdings PLC* | 1,665,813 | $ | 29,988,264 | 3.51 | % | |||||||
| Apparel Retail | ||||||||||||
| The TJX Companies, Inc. | 574,973 | 32,422,727 | 3.79 | |||||||||
| Apparel, Accessories & Luxury Goods | ||||||||||||
| lululemon athletica, inc.* | 227,689 | 16,641,789 | 1.95 | |||||||||
| Biotechnology | ||||||||||||
| Biogen Idec Inc.* | 212,417 | 51,141,517 | 5.98 | |||||||||
| Celgene Corporation* | 221,340 | 34,070,866 | 3.99 | |||||||||
| Gilead Sciences, Inc.* | 850,794 | 53,463,895 | 6.25 | |||||||||
| 138,676,278 | 16.22 | |||||||||||
| Cable & Satellite | ||||||||||||
| Comcast Corporation - Cl. A | 153,459 | 6,928,674 | 0.81 | |||||||||
| Casinos & Gaming | ||||||||||||
| Wynn Resorts Ltd. | 217,591 | 34,381,554 | 4.02 | |||||||||
| Construction & Farm Machinery & Heavy Trucks | ||||||||||||
| Cummins, Inc. | 205,969 | 27,367,101 | 3.20 | |||||||||
| Consumer Finance | ||||||||||||
| American Express Company | 363,355 | 27,440,570 | 3.21 | |||||||||
| Data Processing & Outsourced Services | ||||||||||||
| Visa, Inc. - Cl. A | 227,000 | 43,379,700 | 5.08 | |||||||||
| Diversified Banks | ||||||||||||
| Wells Fargo & Company | 672,268 | 27,778,114 | 3.25 | |||||||||
| Fertilizers & Agricultural Chemicals | ||||||||||||
| Monsanto Company | 415,501 | 43,365,839 | 5.07 | |||||||||
| Home Improvement Retail | ||||||||||||
| The Home Depot, Inc. | 332,189 | 25,196,536 | 2.95 | |||||||||
| Hotels, Resorts & Cruise Lines | ||||||||||||
| Starwood Hotels & Resorts Worldwide, Inc. | 317,094 | 21,070,896 | 2.47 | |||||||||
| Internet Software & Services | ||||||||||||
| Facebook, Inc. - Cl. A* | 455,577 | 22,888,188 | 2.68 | |||||||||
| Google, Inc. - Cl. A* | 63,979 | 56,039,846 | 6.55 | |||||||||
| 78,928,034 | 9.23 | |||||||||||
| Managed Health Care | ||||||||||||
| UnitedHealth Group, Inc. | 353,892 | 25,342,206 | 2.97 | |||||||||
| Movies & Entertainment | ||||||||||||
| The Walt Disney Company | 391,347 | 25,237,968 | 2.95 | |||||||||
| Multi-Line Insurance | ||||||||||||
| American International Group, Inc. | 734,393 | 35,713,532 | 4.18 | |||||||||
| Oil & Gas Equipment & Services | ||||||||||||
| Schlumberger Ltd. | 350,669 | 30,985,113 | 3.63 | |||||||||
COMMON STOCKS (continued) | ||||||||||||
| Other Diversified Financial Services | ||||||||||||
| Citigroup, Inc. | 673,095 | $ | 32,651,838 | 3.82 | % | |||||||
| Packaged Foods & Meats | ||||||||||||
| Green Mountain Coffee Roasters, Inc.* | 158,053 | 11,906,133 | 1.39 | |||||||||
| Railroads | ||||||||||||
| Canadian Pacific Railway Ltd. | 194,858 | 24,025,991 | 2.81 | |||||||||
| Union Pacific Corporation | 151,075 | 23,467,991 | 2.75 | |||||||||
| 47,493,982 | 5.56 | |||||||||||
| Restaurants | ||||||||||||
| Chipotle Mexican Grill, Inc.* | 39,191 | 16,801,181 | 1.97 | |||||||||
| Starbucks Corporation | 358,008 | 27,555,876 | 3.22 | |||||||||
| 44,357,057 | 5.19 | |||||||||||
| Semiconductor Equipment | ||||||||||||
| ASML Holding N.V. | 232,870 | 22,998,241 | 2.69 | |||||||||
| Specialty Chemicals | ||||||||||||
| The Sherwin-Williams Company | 147,802 | 26,926,568 | 3.15 | |||||||||
| TOTAL COMMON STOCKS | ||||||||||||
| (Cost $615,647,741) | 857,178,714 | 100.29 | ||||||||||
| SHORT-TERM INVESTMENTS | ||||||||||||
| State Street Institutional U.S. Government Money Market Fund, 0.000% | 5,465,259 | 5,465,259 | 0.64 | |||||||||
| TOTAL SHORT-TERM INVESTMENTS | ||||||||||||
| (Cost $5,465,259) | 5,465,259 | 0.64 | ||||||||||
| TOTAL INVESTMENTS | ||||||||||||
| (Cost $621,113,000) | 862,643,973 | 100.93 | ||||||||||
| Liabilities, Less Cash and Other Assets | (7,935,583 | ) | (0.93 | ) | ||||||||
| NET ASSETS | $ | 854,708,390 | 100.00 | % | ||||||||
| * | Non-income producing. |
| See notes to financial statements. |
10
GROWTH FUND OVERVIEW |
September 30, 2013 (Unaudited)
The Growth Fund invests primarily in the common stocks of large companies that are selected for their long-term growth potential. The Growth Fund will normally hold a core position of between 35 and 50 common stocks.
| TOTAL ANNUAL OPERATING EXPENSES* 1.35% | NET ASSETS $564,765,666 | NET ASSET VALUE PER SHARE $25.03 |
GROWTH OF $10,000(1) | PERFORMANCE COMPARISON | |
 |  | |
SECTOR ALLOCATION(2) | TOP FIVE HOLDINGS | |
 | ||
| GILEAD SCIENCES, INC. | 5.02% | |
| BIOGEN IDEC INC. | 4.12% | |
| MONSANTO COMPANY | 4.08% | |
| GOOGLE, INC. - CL. A | 4.02% | |
| CITIGROUP, INC. | 3.74% | |
| * | The Total Annual Operating Expenses are reflective of the information disclosed in the Funds’ Prospectus dated February 1, 2013 and may differ from the expense ratio disclosed in this report. |
The performance data quoted here represent past performance, and past performance is not a guarantee of future results. Investment return and principal value of an investment will fluctuate so that an investor’s shares, when redeemed, may be worth more or less than their original cost. Current performance may be lower or higher than the performance information quoted. To obtain performance information current to the most recent month-end, please call 888-860-8686 or visit www.marsicofunds.com. A redemption fee may be imposed on redemptions or exchanges of Fund shares held for 30 days or less. |
| The performance included in the chart and graph does not reflect the deduction of taxes on Fund distributions or the redemption of Fund shares. |
| All indices are unmanaged and investors cannot invest directly in an index. |
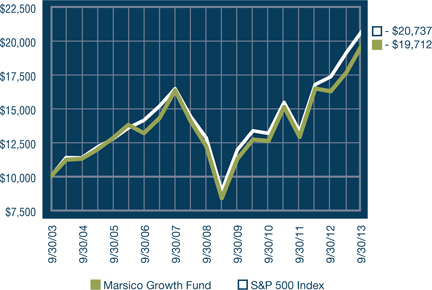
| (1) | This chart assumes an initial investment of $10,000 made on September 30, 2003. Total returns are based on net change in NAV, assuming reinvestment of distributions. |
| (2) | Sector weightings represent the percentage of the Fund’s investments (excluding cash equivalents) in certain general sectors. These sectors may include more than one industry. The Fund’s portfolio composition is subject to change at any time. |
11
SCHEDULE OF INVESTMENTS |
MARSICO GROWTH FUND
SCHEDULE OF INVESTMENTS
September 30, 2013
Number of Shares | Value | Percent of Net Assets | ||||||||||
| COMMON STOCKS | ||||||||||||
| Aerospace & Defense | ||||||||||||
| BE Aerospace, Inc.* | 38,602 | $ | 2,849,600 | 0.51 | % | |||||||
| Lockheed Martin Corporation | 88,722 | 11,316,491 | 2.00 | |||||||||
| Rolls-Royce Holdings PLC* | 597,013 | 10,747,535 | 1.90 | |||||||||
| 24,913,626 | 4.41 | |||||||||||
| Apparel Retail | ||||||||||||
| The Gap, Inc. | 84,162 | 3,390,045 | 0.60 | |||||||||
| The TJX Companies, Inc. | 228,587 | 12,890,021 | 2.28 | |||||||||
| 16,280,066 | 2.88 | |||||||||||
| Apparel, Accessories & Luxury Goods | ||||||||||||
| Compagnie Financière Richemont SA | 42,666 | 4,274,384 | 0.76 | |||||||||
| lululemon athletica, inc.* | 193,407 | 14,136,118 | 2.50 | |||||||||
| Prada S.p.A. | 187,800 | 1,770,031 | 0.31 | |||||||||
| 20,180,533 | 3.57 | |||||||||||
| Application Software | ||||||||||||
| salesforce.com, inc.* | 43,569 | 2,261,667 | 0.40 | |||||||||
| Biotechnology | ||||||||||||
| Biogen Idec Inc.* | 96,585 | 23,253,805 | 4.12 | |||||||||
| Celgene Corporation* | 110,470 | 17,004,647 | 3.01 | |||||||||
| Gilead Sciences, Inc.* | 451,231 | 28,355,356 | 5.02 | |||||||||
| 68,613,808 | 12.15 | |||||||||||
| Broadcasting | ||||||||||||
| CBS Corporation - Cl. B | 290,796 | 16,040,307 | 2.84 | |||||||||
| Liberty Media Corporation - Cl. A* | 27,213 | 4,004,393 | 0.71 | |||||||||
| 20,044,700 | 3.55 | |||||||||||
| Cable & Satellite | ||||||||||||
| Comcast Corporation - Cl. A | 189,020 | 8,534,253 | 1.51 | |||||||||
| Liberty Global PLC - Cl. A* | 136,006 | 10,792,076 | 1.91 | |||||||||
| 19,326,329 | 3.42 | |||||||||||
| Casinos & Gaming | ||||||||||||
| Wynn Resorts Ltd. | 97,319 | 15,377,375 | 2.72 | |||||||||
| Construction & Farm Machinery & Heavy Trucks | ||||||||||||
| Cummins, Inc. | 136,684 | 18,161,203 | 3.22 | |||||||||
| Consumer Finance | ||||||||||||
| American Express Company | 78,963 | 5,963,286 | 1.06 | |||||||||
| Data Processing & Outsourced Services | ||||||||||||
| FleetCor Technologies, Inc.* | 26,409 | 2,909,216 | 0.51 | |||||||||
| Visa, Inc. - Cl. A | 95,142 | 18,181,636 | 3.22 | |||||||||
| 21,090,852 | 3.73 | |||||||||||
| Diversified Banks | ||||||||||||
| Wells Fargo & Company | 345,976 | 14,295,728 | 2.53 | |||||||||
| Fertilizers & Agricultural Chemicals | ||||||||||||
| Monsanto Company | 220,877 | 23,052,932 | 4.08 | |||||||||
| Home Improvement Retail | ||||||||||||
| The Home Depot, Inc. | 146,601 | 11,119,686 | 1.97 | |||||||||
| Hotels, Resorts & Cruise Lines | ||||||||||||
| Starwood Hotels & Resorts Worldwide, Inc. | 224,977 | 14,949,722 | 2.65 | |||||||||
COMMON STOCKS (continued) | ||||||||||||
| Internet Retail | ||||||||||||
| Amazon.com, Inc.* | 19,026 | $ | 5,948,288 | 1.05 | % | |||||||
| priceline.com, Inc.* | 11,724 | 11,852,378 | 2.10 | |||||||||
| 17,800,666 | 3.15 | |||||||||||
| Internet Software & Services | ||||||||||||
| eBay, Inc.* | 136,851 | 7,634,917 | 1.35 | |||||||||
| Facebook, Inc. - Cl. A* | 157,104 | 7,892,905 | 1.40 | |||||||||
| Google, Inc. - Cl. A* | 25,945 | 22,725,485 | 4.02 | |||||||||
| LinkedIn Corporation - Cl. A* | 28,822 | 7,091,941 | 1.26 | |||||||||
| Yahoo!, Inc.* | 205,791 | 6,824,030 | 1.21 | |||||||||
| 52,169,278 | 9.24 | |||||||||||
| Managed Health Care | ||||||||||||
| UnitedHealth Group, Inc. | 76,292 | 5,463,270 | 0.97 | |||||||||
| Movies & Entertainment | ||||||||||||
| The Walt Disney Company | 191,365 | 12,341,129 | 2.19 | |||||||||
| Multi-Line Insurance | ||||||||||||
| American International Group, Inc. | 381,392 | 18,547,093 | 3.28 | |||||||||
| Oil & Gas Equipment & Services | ||||||||||||
| Cameron International Corporation* | 83,028 | 4,846,344 | 0.86 | |||||||||
| Schlumberger Ltd. | 214,851 | 18,984,235 | 3.36 | |||||||||
| 23,830,579 | 4.22 | |||||||||||
| Other Diversified Financial Services | ||||||||||||
| Citigroup, Inc. | 435,909 | 21,145,946 | 3.74 | |||||||||
| Packaged Foods & Meats | ||||||||||||
| Green Mountain Coffee Roasters, Inc.* | 104,628 | 7,881,627 | 1.40 | |||||||||
| Railroads | ||||||||||||
| Canadian Pacific Railway Ltd. | 116,232 | 14,331,406 | 2.54 | |||||||||
| Union Pacific Corporation | 111,342 | 17,295,866 | 3.06 | |||||||||
| 31,627,272 | 5.60 | |||||||||||
| Restaurants | ||||||||||||
| Chipotle Mexican Grill, Inc.* | 6,739 | 2,889,009 | 0.51 | |||||||||
| Starbucks Corporation | 151,102 | 11,630,321 | 2.06 | |||||||||
| 14,519,330 | 2.57 | |||||||||||
| Semiconductor Equipment | ||||||||||||
| ASML Holding N.V. | 185,235 | 18,293,809 | 3.24 | |||||||||
| Semiconductors | ||||||||||||
| Texas Instruments, Inc. | 156,824 | 6,315,302 | 1.12 | |||||||||
| Specialized Finance | ||||||||||||
| IntercontinentalExchange, Inc.* | 31,568 | 5,727,066 | 1.01 | |||||||||
| Specialty Chemicals | ||||||||||||
| The Sherwin-Williams Company | 97,932 | 17,841,252 | 3.16 | |||||||||
| Trading Companies & Distributors | ||||||||||||
| United Rentals, Inc.* | 127,134 | 7,410,641 | 1.31 | |||||||||
| TOTAL COMMON STOCKS | ||||||||||||
| (Cost $404,863,203) | 556,545,773 | 98.54 | ||||||||||
| * | Non-income producing. |
| See notes to financial statements. |
12
SCHEDULE OF INVESTMENTS |
Number of Shares | Value | Percent of Net Assets | ||||||||||
| SHORT-TERM INVESTMENTS | ||||||||||||
| State Street Institutional Treasury Money Market Fund, 0.000% | 9,640,121 | $ | 9,640,121 | 1.71 | % | |||||||
| TOTAL SHORT-TERM INVESTMENTS | ||||||||||||
| (Cost $9,640,121) | 9,640,121 | 1.71 | ||||||||||
| TOTAL INVESTMENTS | ||||||||||||
| (Cost $414,503,324) | 566,185,894 | 100.25 | ||||||||||
| Liabilities, Less Cash and Other Assets | (1,420,228 | ) | (0.25 | ) | ||||||||
| NET ASSETS | $ | 564,765,666 | 100.00 | % | ||||||||
| See notes to financial statements. |
13
21st CENTURY FUND |
INVESTMENT REVIEW BY BRANDON GEISLER (UNAUDITED)
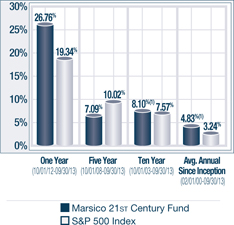
The Marsico 21st Century Fund posted a return of +26.76% for the one-year fiscal period ended September 30, 2013. The Fund significantly outperformed the S&P 500 Index, which we consider to be the Fund’s primary benchmark index and which had a total return of +19.34% over the same time period. The Russell 3000 Index, a proxy for the performance of all publicly-traded US equity securities including smaller capitalization companies (which may be a useful representation of the Fund’s ability to invest across the entire market capitalization spectrum), had a total return of +21.60%. Please see the Fund Overview for more detailed information about the Fund’s longer-term performance for various time periods ended September 30, 2013.
The performance data for the Fund quoted here represent past performance, and past performance is not a guarantee of future results. Investment return and principal value of an investment will fluctuate so that an investor’s shares, when redeemed, may be worth more or less than their original cost. Current performance may be lower or higher than the performance information quoted. To obtain performance information current to the most recent month-end, please call 888-860-8686 or visit www.marsicofunds.com.(1)
This review highlights Fund performance over a one-year fiscal period. Shareholders should keep in mind that the Fund is intended for long-term investors who hold their shares for substantially longer periods of time. You should also keep in mind that our views on all investments discussed in this report are subject to change at any time. References to specific securities, industries, and sectors discussed in this report are not recommendations to buy or sell such securities or related investments, and the Fund may not necessarily hold these securities or investments today. Please see the accompanying Schedule of Investments for the percentage of the Fund’s portfolio represented by the securities mentioned in this report as of the end of the reporting period.
The Fund and the stocks and markets in which it invests are subject to general risks that may include periods of turbulence, instability, decline, and cyclical change, and the risk that investors may avoid investments in equity securities generally. Please see the Prospectus for more information.
The Fund’s strong performance results for the 12-month period ended September 30, 2013 were largely attributable to strong stock selection in the Consumer Discretionary and Health Care sectors. Favorable sector allocations and stock selection in the Consumer Staples and Industrials sectors also aided performance.
Consumer Discretionary was a strong-performing sector of the S&P 500 Index with a return of +32%, and the Fund benefitted from having more than 25% of its net assets, on average, invested in the sector. The Fund’s holdings within the sector gained +44% and substantially surpassed the benchmark index sector return. Investments in automobile manufacturers and consumer service companies were responsible for much of the Fund’s outperformance. Luxury electric car manufacturer Tesla Motors, Inc.’s stock price skyrocketed +646% and was a material contributor to Fund performance. We trimmed the Fund’s position in Tesla as the company’s stock price posted gains. We maintained a position in Tesla as we believe there is further upside potential as the company continues to experience unit sales growth, improved margins, growth opportunities in overseas markets such as Europe, and expects to introduce a new model in 2014. Leading holdings in the Consumer Services industry included hotel and casino operator Wynn Resorts Ltd. (+50%) and Dunkin’ Brands Group, Inc. (+58%), franchisor of Dunkin’ Donuts and Baskin-Robbins restaurants.
The Fund’s Health Care holdings also performed well and recorded a collective return of +51%. Three of the top-performing holdings within the sector were biotechnology companies Gilead Sciences, Inc. (+68%), Biogen Idec Inc. (+62%), and Alkermes PLC (+64%).
In the Consumer Staples sector, beverage companies Green Mountain Coffee Roasters, Inc. and wine, beer and spirits company Constellation Brands, Inc. - Cl. A gained +69% and +76%, respectively.
Stock selection in the Materials sector was also strong, led by specialty chemicals company LyondellBasell Industries N.V. – Cl. A (+20% prior to being sold).
Other top-performing Fund positions included payment processor MasterCard, Inc. - Cl. A (+49%) and industrial component manufacturer Precision Castparts Corp. (+40%).
14
21st CENTURY FUND |
The primary area of weakness for the Fund was stock selection in the Financials sector. The Fund’s Financials holdings posted a collective return of +13%. While positive on an absolute basis, the return significantly lagged the +30% return of the S&P 500 Index Financials sector. Much of the Fund’s underperformance relative to the overall benchmark Financials sector was attributable to holdings in the Diversified Financials sector. Capital One Financial Corporation, for example, posted a modest gain of +6% prior to being sold from the Fund.
A few of the Fund’s positions in Information Technology, Energy, and Retailing also detracted from performance. Technology holdings Fusion-io, Inc. (-36%), VMware, Inc. - Cl. A (-31%), and Red Hat, Inc. (-20%) declined sharply and were sold from the Fund. Offshore drilling components provider National Oilwell Varco, Inc. (-17% prior to being sold) and oil and gas exploration and development company Occidental Petroleum Corporation (-18% prior to being sold) were weak performers. Within the Retailing industry, online travel reservation providers Expedia, Inc. (-30%) and priceline.com, Inc. (+12%) were laggards relative to the overall industry’s performance and were sold from the Fund.
During the reporting period, the Fund increased its investments in the Industrials, Consumer Staples, and Materials sectors while decreasing its allocations to the Information Technology, Energy, and Financials sectors.
Fiscal Period-End Investment Posture
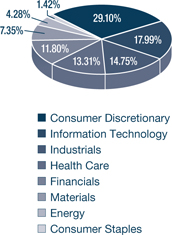
As of September 30, 2013, the Fund’s primary economic sector allocations included Consumer Discretionary, Information Technology, Industrials, and Health Care. The Fund had no investments in the Utilities and Telecommunication Services sectors.
Sincerely,
BRANDON A. GEISLER
PORTFOLIO MANAGER
| (1) | Total returns are based on net change in net asset value assuming reinvestment of distributions. For the period prior to March 31, 2004, the performance returns for the 21st Century Fund reflect a fee waiver in effect; in the absence of such a waiver, the returns would have been reduced. For the period from April 2004 through January 2005, performance returns for the 21st Century Fund would have been higher but for the reimbursement of fees waived previously. A redemption fee of 2% may be imposed on redemptions or exchanges of Fund shares owned for 30 days or less. Please see the Prospectus for more information. |
15
21st CENTURY FUND OVERVIEW |
September 30, 2013 (Unaudited)
The 21st Century Fund invests primarily in common stocks that are selected for their long-term growth potential. The Fund may invest in companies of any size, and will normally hold a core position of between 35 and 50 common stocks.
| TOTAL ANNUAL OPERATING EXPENSES* 1.42% | NET ASSETS $312,214,990 | NET ASSET VALUE PER SHARE $18.05 |
GROWTH OF $10,000(1)(2) | PERFORMANCE COMPARISON | |
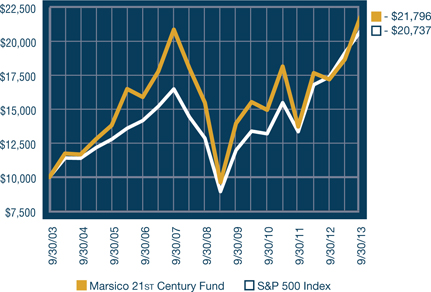 |  | |
SECTOR ALLOCATION(3) | TOP FIVE HOLDINGS | |
 | ||
| GILEAD SCIENCES, INC. | 4.66% | |
| BIOGEN IDEC INC. | 3.97% | |
| MONSANTO COMPANY | 3.91% | |
| MASTERCARD, INC. - CL. A | 3.15% | |
| GOOGLE, INC. - CL. A | 3.10% | |
| * | The Total Annual Operating Expenses are reflective of the information disclosed in the Funds’ Prospectus dated February 1, 2013 and may differ from the expense ratio disclosed in this report. |
The performance data quoted here represent past performance, and past performance is not a guarantee of future results. Investment return and principal value of an investment will fluctuate so that an investor’s shares, when redeemed, may be worth more or less than their original cost. Current performance may be lower or higher than the performance information quoted. To obtain performance information current to the most recent month-end, please call 888-860-8686 or visit www.marsicofunds.com. A redemption fee may be imposed on redemptions or exchanges of Fund shares held for 30 days or less. |
| The performance included in the chart and graph does not reflect the deduction of taxes on Fund distributions or the redemption of Fund shares. |
| All indices are unmanaged and investors cannot invest directly in an index. |
| (1) | The performance returns for the 21st Century Fund (for the period prior to March 31, 2004) reflect a fee waiver in effect; in the absence of such a waiver, the returns would be reduced. For the period from April 2004 through January 2005, performance returns for the 21st Century Fund would be higher but for the reimbursement of fees waived previously. |
| (2) | This chart assumes an initial investment of $10,000 made on September 30, 2003. Total returns are based on net change in NAV, assuming reinvestment of distributions. |
| (3) | Sector weightings represent the percentage of the Fund’s investments (excluding cash equivalents) in certain general sectors. These sectors may include more than one industry. The Fund’s portfolio composition is subject to change at any time. |
16
SCHEDULE OF INVESTMENTS |
MARSICO 21st CENTURY FUND
SCHEDULE OF INVESTMENTS
September 30, 2013
Number of Shares | Value | Percent of Net Assets | ||||||||||
| COMMON STOCKS | ||||||||||||
| Aerospace & Defense | ||||||||||||
| BE Aerospace, Inc.* | 97,678 | $ | 7,210,590 | 2.31 | % | |||||||
| Precision Castparts Corp. | 19,988 | 4,542,073 | 1.45 | |||||||||
| 11,752,663 | 3.76 | |||||||||||
| Apparel Retail | ||||||||||||
| Ross Stores, Inc. | 112,241 | 8,171,145 | 2.62 | |||||||||
| Apparel, Accessories & Luxury Goods | ||||||||||||
| Compagnie Financière Richemont SA | 31,533 | 3,159,053 | 1.01 | |||||||||
| lululemon athletica, inc.* | 82,488 | 6,029,048 | 1.93 | |||||||||
| Michael Kors Holdings Ltd.* | 84,487 | 6,295,971 | 2.02 | |||||||||
| 15,484,072 | 4.96 | |||||||||||
| Application Software | ||||||||||||
| salesforce.com, inc.* | 133,198 | 6,914,308 | 2.21 | |||||||||
| Automobile Manufacturers | ||||||||||||
| General Motors Company* | 84,222 | 3,029,465 | 0.97 | |||||||||
| Tesla Motors, Inc.* | 17,628 | 3,409,608 | 1.09 | |||||||||
| 6,439,073 | 2.06 | |||||||||||
| Automotive Retail | ||||||||||||
| Monro Muffler Brake, Inc. | 66,160 | 3,075,778 | 0.99 | |||||||||
| Biotechnology | ||||||||||||
| Alkermes PLC* | 133,732 | 4,496,070 | 1.44 | |||||||||
| Biogen Idec Inc.* | 51,468 | 12,391,436 | 3.97 | |||||||||
| BioMarin Pharmaceutical, Inc.* | 44,312 | 3,200,212 | 1.02 | |||||||||
| Gilead Sciences, Inc.* | 231,407 | 14,541,616 | 4.66 | |||||||||
| Incyte Corporation Ltd.* | 64,832 | 2,473,341 | 0.79 | |||||||||
| 37,102,675 | 11.88 | |||||||||||
| Cable & Satellite | ||||||||||||
| Liberty Global PLC - Series C* | 76,155 | 5,744,372 | 1.84 | |||||||||
| Casinos & Gaming | ||||||||||||
| Wynn Resorts Ltd. | 54,440 | 8,602,064 | 2.76 | |||||||||
| Construction & Farm Machinery & Heavy Trucks | ||||||||||||
| Cummins, Inc. | 35,352 | 4,697,220 | 1.50 | |||||||||
| Data Processing & Outsourced Services | ||||||||||||
| FleetCor Technologies, Inc.* | 43,170 | 4,755,607 | 1.53 | |||||||||
| MasterCard, Inc. - Cl. A | 14,625 | 9,839,408 | 3.15 | |||||||||
| Wirecard A.G. | 94,937 | 3,247,493 | 1.04 | |||||||||
| 17,842,508 | 5.72 | |||||||||||
| Distillers & Vintners | ||||||||||||
| Constellation Brands, Inc. - Cl. A* | 122,984 | 7,059,282 | 2.26 | |||||||||
| Remy Cointreau S.A. | 14,570 | 1,552,638 | 0.50 | |||||||||
| 8,611,920 | 2.76 | |||||||||||
| Distributors | ||||||||||||
| LKQ Corporation* | 152,549 | 4,860,211 | 1.56 | |||||||||
| Fertilizers & Agricultural Chemicals | ||||||||||||
| Monsanto Company | 116,950 | 12,206,071 | 3.91 | |||||||||
| General Merchandise Stores | ||||||||||||
| Dollar Tree, Inc.* | 69,635 | 3,980,337 | 1.28 | |||||||||
COMMON STOCKS (continued) | ||||||||||||
| Health Care Services | ||||||||||||
| Envision Healthcare Holdings, Inc.* | 113,593 | $ | 2,956,826 | 0.95 | % | |||||||
| Internet Software & Services | ||||||||||||
| Facebook, Inc. - Cl. A* | 68,556 | 3,444,254 | 1.10 | |||||||||
| Google, Inc. - Cl. A* | 11,047 | 9,676,178 | 3.10 | |||||||||
| LinkedIn Corporation - Cl. A* | 7,290 | 1,793,777 | 0.58 | |||||||||
| VeriSign, Inc.* | 78,378 | 3,988,656 | 1.28 | |||||||||
| Yahoo!, Inc.* | 107,739 | 3,572,625 | 1.14 | |||||||||
| Youku.com, Inc. Spon. ADR* | 62,923 | 1,724,090 | 0.55 | |||||||||
| 24,199,580 | 7.75 | |||||||||||
| Investment Banking & Brokerage | ||||||||||||
| Morgan Stanley | 163,746 | 4,412,955 | 1.41 | |||||||||
| Movies & Entertainment | ||||||||||||
| The Walt Disney Company | 141,520 | 9,126,625 | 2.92 | |||||||||
| Oil & Gas Equipment & Services | ||||||||||||
| Dresser-Rand Group, Inc.* | 37,276 | 2,326,023 | 0.74 | |||||||||
| Schlumberger Ltd. | 103,387 | 9,135,275 | 2.93 | |||||||||
| 11,461,298 | 3.67 | |||||||||||
| Other Diversified Financial Services | ||||||||||||
| Citigroup, Inc. | 196,983 | 9,555,645 | 3.06 | |||||||||
| Packaged Foods & Meats | ||||||||||||
| Green Mountain Coffee Roasters, Inc.* | 73,339 | 5,524,627 | 1.77 | |||||||||
| Mondelez International, Inc. - Cl. A | 193,681 | 6,085,457 | 1.95 | |||||||||
| 11,610,084 | 3.72 | |||||||||||
| Railroads | ||||||||||||
| Genesee & Wyoming, Inc. - Cl. A* | 102,493 | 9,528,774 | 3.05 | |||||||||
| Regional Banks | ||||||||||||
| City National Corporation | 67,008 | 4,466,753 | 1.43 | |||||||||
| Research & Consulting Services | ||||||||||||
| IHS, Inc. - Cl. A* | 76,733 | 8,761,374 | 2.81 | |||||||||
| Verisk Analytics, Inc. - Cl. A* | 83,832 | 5,445,727 | 1.74 | |||||||||
| 14,207,101 | 4.55 | |||||||||||
| Restaurants | ||||||||||||
| Chipotle Mexican Grill, Inc.* | 7,304 | 3,131,224 | 1.00 | |||||||||
| Domino's Pizza, Inc. | 36,063 | 2,450,481 | 0.79 | |||||||||
| Dunkin' Brands Group, Inc. | 105,434 | 4,771,943 | 1.53 | |||||||||
| 10,353,648 | 3.32 | |||||||||||
| Semiconductor Equipment | ||||||||||||
| ASML Holding N.V. | 54,200 | 5,352,792 | 1.71 | |||||||||
| Specialized Finance | ||||||||||||
| IntercontinentalExchange, Inc.* | 24,380 | 4,423,020 | 1.42 | |||||||||
| Specialty Chemicals | ||||||||||||
| Ecolab, Inc. | 40,884 | 4,037,704 | 1.29 | |||||||||
| The Sherwin-Williams Company | 43,597 | 7,942,501 | 2.55 | |||||||||
| 11,980,205 | 3.84 | |||||||||||
| Specialty Stores | ||||||||||||
| Sally Beauty Holdings, Inc.* | 137,354 | 3,593,181 | 1.15 | |||||||||
| Ulta Salon, Cosmetics & Fragrance, Inc.* | 35,087 | 4,191,493 | 1.34 | |||||||||
| 7,784,674 | 2.49 | |||||||||||
| * | Non-income producing. |
| See notes to financial statements. |
17
SCHEDULE OF INVESTMENTS |
MARSICO 21st CENTURY FUND
SCHEDULE OF INVESTMENTS (continued)
September 30, 2013
Number of Shares | Value | Percent of Net Assets | ||||||||||
COMMON STOCKS (continued) | ||||||||||||
| Trading Companies & Distributors | ||||||||||||
| United Rentals, Inc.* | 80,266 | $ | 4,678,705 | 1.50 | % | |||||||
| W.W. Grainger, Inc. | 23,674 | 6,195,723 | 1.98 | |||||||||
| 10,874,428 | 3.48 | |||||||||||
| TOTAL COMMON STOCKS | ||||||||||||
| (Cost $225,130,690) | 307,778,825 | 98.58 | ||||||||||
| SHORT-TERM INVESTMENTS | ||||||||||||
| State Street Institutional Treasury Money Market Fund, 0.000% | 4,438,160 | 4,438,160 | 1.42 | |||||||||
| TOTAL SHORT-TERM INVESTMENTS | 4,438,160 | 1.42 | ||||||||||
| (Cost $4,438,160) | ||||||||||||
| TOTAL INVESTMENTS | ||||||||||||
| (Cost $229,568,850) | 312,216,985 | 100.00 | ||||||||||
| Liabilities, Less Cash and Other Assets | (1,995 | ) | 0.00 | |||||||||
| NET ASSETS | $ | 312,214,990 | 100.00 | % | ||||||||
| * | Non-income producing. |
| See notes to financial statements. |
18
INTERNATIONAL OPPORTUNITIES FUND |
INVESTMENT REVIEW BY JIM GENDELMAN AND MUNISH MALHOTRA (UNAUDITED)
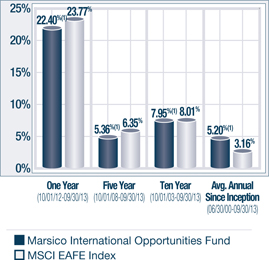
The Marsico International Opportunities Fund posted a total return of (US$) +22.40% for the one-year fiscal period ended September 30, 2013. The Fund modestly underperformed the MSCI EAFE Index, which we consider to be the Fund’s benchmark index and which had a total return of (US$) +23.77%. Please see the Fund Overview for more detailed information about the Fund’s longer-term performance for various time periods ended September 30, 2013.
The performance data for the Fund quoted here represent past performance, and past performance is not a guarantee of future results. Investment return and principal value of an investment will fluctuate so that an investor’s shares, when redeemed, may be worth more or less than their original cost. Current performance may be lower or higher than the performance information quoted. To obtain performance information current to the most recent month-end, please call 888-860-8686 or visit www.marsicofunds.com.(1)
This review highlights Fund performance over a one-year fiscal period. Shareholders should keep in mind that the Fund is intended for long-term investors who hold their shares for substantially longer periods of time. You should also keep in mind that our views on all investments discussed in this report are subject to change at any time. References to specific securities, industries, and sectors discussed in this report are not recommendations to buy or sell such securities or related investments, and the Fund may not necessarily hold these securities or investments today. Please see the accompanying Schedule of Investments for the percentage of the Fund’s portfolio represented by the securities mentioned in this report as of the end of the reporting period.
Foreign investments present additional risks due to currency fluctuations, economic and political factors, lower liquidity, differences in securities regulations and accounting standards, possible changes in taxation, limited public information, and other factors. In addition, the Fund and the stocks and markets in which it invests are subject to other general risks that may include periods of turbulence, instability, decline, and cyclical change, and the risk that investors may avoid investments in equity securities generally. Please see the Prospectus for more information.
Stock selection in the Information Technology sector detracted from Fund performance as compared to its benchmark index. Several of the Fund’s Internet services investments posted negative returns. Chinese Internet search provider Baidu, Inc. – Spon. ADR (-32% prior to being sold), Japanese e-commerce and social media company DeNA Co. Ltd. (-33% prior to being sold), and European data center provider Telecity Group PLC ( 1%), which significantly underperformed relative to the overall sector return, each had a material, negative effect on performance. HOYA CORPORATION, a provider of specialty optics and glass components, declined -15% and was sold from the Fund.
Within the Financials sector, banks BNP Paribas (+5%), Banco Bilbao Vizcaya Argentaria S.A. (-4%), and Standard Chartered PLC (-1%) posted weak stock price returns and were sold. The Fund’s performance was further hampered by having an underweight allocation to the Financials sector, as Financials was one of the strongest-performing sectors of the benchmark index.
The Fund’s performance was also adversely affected by stock selection and an underweight allocation to the Telecommunication Services sector. Mobile phone service providers Millicom International Cellular SA (-17%) and China Unicom Hong Kong Ltd. (-3%) were the primary detractors within the sector. Both positions were sold during the period.
A few of the Fund’s Industrials positions also struggled. Low cost airline Ryanair Holdings PLC Spon. ADR and rail road operator Canadian Pacific Railway Ltd. declined -6% and -2%, respectively. Ryanair was sold from the Fund prior to period-end.
Specialty pharmaceutical companies Shire PLC (-6%) and Perrigo Company (-0.4%) posted negative returns and were sold from the Fund.
The Fund’s Consumer Staples holdings posted a collective return of +13%. While positive, the return trailed the benchmark index Consumer Staples return of +17%.
Several factors aided investment results. From a sector allocation perspective, the Fund did well by having overweight allocations to the Consumer Discretionary and Information Technology sectors while being underweight the relatively weak performing Consumer Staples, Energy, Materials, and Utilities sectors.
19
INTERNATIONAL OPPORTUNITIES FUND |
Although active currency management is not a central facet of the Fund’s investment process, currency fluctuations may at times affect the Fund’s performance. The Fund did well as compared to the benchmark index by having less exposure to securities denominated in the Japanese yen and the Australian dollar, which both weakened during the period.
Several of the Fund’s individual holdings registered strong stock price gains, including pharmaceutical company Roche Holding AG (+48%), auto manufacturer Bayerische Moteren Werke AG (+51%), media company Kabel Deutschland Holding AG (+58% prior to being sold), semiconductor lithography company ASML Holding N.V. (+35%), and Russian Internet company Yandex N.V. – Cl. A (+53%).
The International Opportunities Fund experienced slightly elevated portfolio turnover during the fiscal year, which may occur at times when the Fund changes its portfolio composition to harvest gains, take advantage of new opportunities, preserve capital, or limit losses. Portfolio turnover increases transaction-related expenses and could reduce Fund returns.
Fiscal Period-End Investment Posture
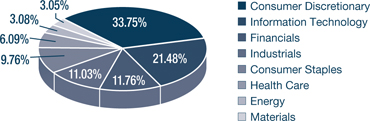
As of September 30, 2013, the Fund’s primary economic sector allocations included Consumer Discretionary, Information Technology, and Financials, although the Fund’s allocation to Financials represented an underweight posture as compared to the MSCI EAFE Index. The Fund had no exposure to the Utilities sector at period-end.
In terms of country allocations, the Fund’s most significant weightings at period-end were the United Kingdom, Switzerland, Canada, and Japan, although the Fund’s investments in Japan represented an underweighted posture relative to the benchmark index. Country-level weightings generally should be considered a residual of the Fund’s stock selection process rather than a major, proactive facet of its investment strategy.
Sincerely,
JAMES G. GENDELMAN
MUNISH MALHOTRA, CFA
PORTFOLIO MANAGERS
| (1) | Total returns are based on net change in net asset value assuming reinvestment of distributions. For the period prior to September 30, 2004 and from October 2011 through September 2013, the performance returns for the International Opportunities Fund reflect a fee waiver in effect; in the absence of such a waiver, the returns would have been reduced. For the period from October 2004 through December 2005, performance returns for the International Opportunities Fund would have been higher but for the reimbursement of fees waived previously. A redemption fee of 2% may be imposed on redemptions or exchanges of Fund shares owned for 30 days or less. Please see the Prospectus for more information. |
20
INTERNATIONAL OPPORTUNITIES FUND OVERVIEW |
September 30, 2013 (Unaudited)
The International Opportunities Fund invests primarily in common stocks of foreign companies that are selected for their long-term growth potential. The Fund may invest in an unlimited number of companies of any size throughout the world. It normally invests in the securities of issuers that are economically tied to one or more foreign countries, and expects to be invested in various issuers or securities that together have ties to at least four different foreign countries. Some issuers or securities in the Fund’s portfolio may be based in or economically tied to the United States or to emerging markets.
TOTAL ANNUAL OPERATING EXPENSES* 1.65% NET EXPENSES*† 1.60% | NET ASSETS $119,521,937 | NET ASSET VALUE PER SHARE $15.30 |
GROWTH OF $10,000(1)(2) | PERFORMANCE COMPARISON | |
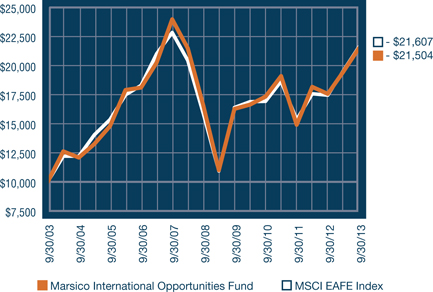 |  | |
SECTOR ALLOCATION(3) | TOP FIVE HOLDINGS | |
 | ||
| ASML HOLDING N.V. | 4.18% | |
| ROCHE HOLDING AG | 4.17% | |
| LIBERTY GLOBAL PLC - SERIES C | 4.06% | |
| MASTERCARD, INC. - CL. A | 3.96% | |
| CANADIAN PACIFIC RAILWAY LTD. | 3.91% | |
| * | The Total Annual Operating Expenses and Net Expenses are reflective of the information disclosed in the Funds’ Prospectus dated February 1, 2013 and may differ from the expense ratios disclosed in this report. |
| † | Marsico Capital Management, LLC (the “Adviser”) has entered into a written expense limitation and fee waiver agreement under which it has agreed to limit the total expenses of the International Opportunities Fund (excluding interest, taxes, acquired fund fees and expenses, litigation, brokerage and extraordinary expenses) to an annual rate of 1.60% of the Fund’s average net assets until January 31, 2014. This expense limitation and fee waiver agreement may be terminated by the Adviser at any time after January 31, 2014, upon 15 days prior notice to the Fund and its administrator. The Adviser may recoup from the Fund fees previously waived or expenses previously reimbursed by the Adviser with respect to the Fund pursuant to this agreement (or a previous expense limitation agreement) if such reimbursement does not cause the Fund to exceed the expense limitation currently in effect and the reimbursement is made within three years after the year in which the Adviser waived the fee or reimbursed the expense. |
The performance data quoted here represent past performance, and past performance is not a guarantee of future results. Investment return and principal value of an investment will fluctuate so that an investor’s shares, when redeemed, may be worth more or less than their original cost. Current performance may be lower or higher than the performance information quoted. To obtain performance information current to the most recent month-end, please call 888-860-8686 or visit www.marsicofunds.com. A redemption fee may be imposed on redemptions or exchanges of Fund shares held for 30 days or less. |
| The performance included in the chart and graph does not reflect the deduction of taxes on Fund distributions or the redemption of Fund shares. |
| All indices are unmanaged and investors cannot invest directly in an index. |
| (1) | The performance returns for the International Opportunities Fund (for the period prior to September 30, 2004 and from October 2011 through September 2013) reflect a fee waiver in effect; in the absence of such a waiver, the returns would be reduced. For the period from October 2004 through December 2005, performance returns for the International Opportunities Fund would be higher but for the reimbursement of fees waived previously. |
| (2) | This chart assumes an initial investment of $10,000 made on September 30, 2003. Total returns are based on net change in NAV, assuming reinvestment of distributions. |
| (3) | Sector weightings represent the percentage of the Fund’s investments (excluding cash equivalents) in certain general sectors. These sectors may include more than one industry. The Fund’s portfolio composition is subject to change at any time. |
| The MSCI EAFE Index tracks the stocks of about 1,000 companies in Europe, Australasia, and the Far East (EAFE). |
21
SCHEDULE OF INVESTMENTS |
MARSICO INTERNATIONAL OPPORTUNITIES FUND
SCHEDULE OF INVESTMENTS
September 30, 2013
Number of Shares | Value | Percent of Net Assets | ||||||||||
| COMMON STOCKS | ||||||||||||
| Aerospace & Defense | ||||||||||||
| Rolls-Royce Holdings PLC* | 185,421 | $ | 3,337,982 | 2.79 | % | |||||||
| Airlines | ||||||||||||
| Copa Holdings S.A. - Cl. A | 8,886 | 1,232,222 | 1.03 | |||||||||
| Apparel, Accessories & Luxury Goods | ||||||||||||
| Adidas A.G. | 21,414 | 2,322,810 | 1.94 | |||||||||
| lululemon athletica, inc.* | 62,121 | 4,540,424 | 3.80 | |||||||||
| Swatch Group AG | 5,821 | 3,746,140 | 3.14 | |||||||||
| 10,609,374 | 8.88 | |||||||||||
| Auto Parts & Equipment | ||||||||||||
| Continental A.G. | 6,886 | 1,167,261 | 0.98 | |||||||||
| Automobile Manufacturers | ||||||||||||
| Bayerische Motoren Werke AG | 34,623 | 3,722,354 | 3.11 | |||||||||
| Tata Motors Ltd. ADR | 44,466 | 1,183,685 | 0.99 | |||||||||
| 4,906,039 | 4.10 | |||||||||||
| Cable & Satellite | ||||||||||||
| Liberty Global PLC - Series C* | 64,350 | 4,853,921 | 4.06 | |||||||||
| Naspers Ltd. - Cl. N | 33,708 | 3,117,039 | 2.61 | |||||||||
| 7,970,960 | 6.67 | |||||||||||
| Casinos & Gaming | ||||||||||||
| Sands China Ltd. | 190,000 | 1,175,879 | 0.98 | |||||||||
| Data Processing & Outsourced Services | ||||||||||||
| MasterCard, Inc. - Cl. A | 7,029 | 4,728,971 | 3.96 | |||||||||
| Wirecard A.G. | 77,971 | 2,667,140 | 2.23 | |||||||||
| 7,396,111 | 6.19 | |||||||||||
| Distillers & Vintners | ||||||||||||
| Diageo PLC | 114,104 | 3,629,808 | 3.04 | |||||||||
| Remy Cointreau S.A. | 11,233 | 1,197,034 | 1.00 | |||||||||
| 4,826,842 | 4.04 | |||||||||||
| Diversified Banks | ||||||||||||
| Mizuho Financial Group, Inc. | 1,251,000 | 2,710,850 | 2.27 | |||||||||
| Diversified Capital Markets | ||||||||||||
| UBS A.G. | 226,510 | 4,633,643 | 3.88 | |||||||||
| Diversified Metals & Mining | ||||||||||||
| Glencore Xstrata PLC | 656,837 | 3,580,313 | 3.00 | |||||||||
| Food Retail | ||||||||||||
| Jeronimo Martins SGPS, S.A. | 142,005 | 2,916,253 | 2.44 | |||||||||
| General Merchandise Stores | ||||||||||||
| Dollarama, Inc. | 16,180 | 1,314,915 | 1.10 | |||||||||
| Hotels, Resorts & Cruise Lines | ||||||||||||
| InterContinental Hotels Group PLC | 120,586 | 3,517,807 | 2.94 | |||||||||
| Industrial Machinery | ||||||||||||
| FANUC Corporation | 22,500 | 3,710,514 | 3.10 | |||||||||
| Integrated Oil & Gas | ||||||||||||
| Suncor Energy, Inc. | 101,103 | 3,614,993 | 3.02 | |||||||||
COMMON STOCKS (continued) | ||||||||||||
| Internet Retail | ||||||||||||
| Rakuten, Inc. | 180,000 | $ | 2,719,365 | 2.27 | % | |||||||
| Start Today Company Ltd. | 70,400 | 1,980,325 | 1.66 | |||||||||
| 4,699,690 | 3.93 | |||||||||||
| Internet Software & Services | ||||||||||||
| MercadoLibre, Inc. | 9,001 | 1,214,325 | 1.01 | |||||||||
| Telecity Group PLC | 273,950 | 3,681,033 | 3.08 | |||||||||
| Yandex N.V. - Cl. A* | 64,622 | 2,353,533 | 1.97 | |||||||||
| Youku.com, Inc. Spon. ADR* | 47,828 | 1,310,487 | 1.10 | |||||||||
| 8,559,378 | 7.16 | |||||||||||
| Life & Health Insurance | ||||||||||||
| AIA Group Ltd. | 727,200 | 3,417,584 | 2.86 | |||||||||
| Movies & Entertainment | ||||||||||||
| Imax Corporation* | 45,268 | 1,368,904 | 1.15 | |||||||||
| Packaged Foods & Meats | ||||||||||||
| Nestlé S.A. | 53,094 | 3,713,380 | 3.11 | |||||||||
| Pharmaceuticals | ||||||||||||
| GlaxoSmithKline PLC | 86,349 | 2,177,237 | 1.82 | |||||||||
| Roche Holding AG | 18,459 | 4,978,327 | 4.17 | |||||||||
| 7,155,564 | 5.99 | |||||||||||
| Publishing | ||||||||||||
| Rightmove PLC | 12,949 | 496,617 | 0.42 | |||||||||
| Railroads | ||||||||||||
| Canadian Pacific Railway Ltd. | 37,909 | 4,677,302 | 3.91 | |||||||||
| Real Estate Operating Companies | ||||||||||||
| BR Malls Participacoes S.A. | 131,400 | 1,191,689 | 1.00 | |||||||||
| Restaurants | ||||||||||||
| Domino's Pizza Group PLC | 124,285 | 1,175,038 | 0.98 | |||||||||
| Semiconductor Equipment | ||||||||||||
| ASML Holding N.V. | 50,618 | 4,998,937 | 4.18 | |||||||||
| Semiconductors | ||||||||||||
| ARM Holdings PLC | 37,951 | 605,787 | 0.51 | |||||||||
| Taiwan Semiconductor Manufacturing Co., Ltd. Spon. ADR | 215,655 | 3,657,509 | 3.06 | |||||||||
| 4,263,296 | 3.57 | |||||||||||
| Specialized Finance | ||||||||||||
| Japan Exchange Group, Inc. | 84,000 | 1,856,981 | 1.55 | |||||||||
| Specialty Stores | ||||||||||||
| Jin Company Ltd. | 32,700 | 1,227,560 | 1.03 | |||||||||
| TOTAL COMMON STOCKS | ||||||||||||
| (Cost $96,941,755) | 117,423,878 | 98.25 |
| * | Non-income producing. |
| See notes to financial statements. |
22
SCHEDULE OF INVESTMENTS |
Number of Shares | Value | Percent of Net Assets | ||||||||||
| SHORT-TERM INVESTMENTS | ||||||||||||
| State Street Institutional Treasury Money Market Fund, 0.000% | 1,950,462 | $ | 1,950,462 | 1.63 | % | |||||||
| TOTAL SHORT-TERM INVESTMENTS | ||||||||||||
| (Cost $1,950,462) | 1,950,462 | 1.63 | ||||||||||
| TOTAL INVESTMENTS | ||||||||||||
| (Cost $98,892,217) | 119,374,340 | 99.88 | ||||||||||
| Cash and Other Assets, Less Liabilities | 147,597 | 0.12 | ||||||||||
| NET ASSETS | $ | 119,521,937 | 100.00 | % | ||||||||
| SUMMARY OF INVESTMENTS BY COUNTRY | ||||||||
| Country | Market Value | Percent of Investment Securities | ||||||
| Argentina | $ | 1,214,325 | 1.02 | % | ||||
| Brazil | 1,191,689 | 1.00 | ||||||
| Canada | 15,516,538 | 13.00 | ||||||
| China/Hong Kong | 5,903,950 | 4.95 | ||||||
| France | 1,197,034 | 1.00 | ||||||
| Germany | 9,879,565 | 8.28 | ||||||
| India | 1,183,685 | 0.99 | ||||||
| Japan | 14,205,595 | 11.90 | ||||||
| Netherlands | 4,998,937 | 4.19 | ||||||
| Panama | 1,232,222 | 1.03 | ||||||
| Portugal | 2,916,253 | 2.44 | ||||||
| Russia | 2,353,533 | 1.97 | ||||||
| South Africa | 3,117,039 | 2.61 | ||||||
| Switzerland | 20,651,803 | 17.30 | ||||||
| Taiwan | 3,657,509 | 3.06 | ||||||
| United Kingdom | 23,475,230 | 19.66 | ||||||
United States(1) | 6,679,433 | 5.60 | ||||||
| $ | 119,374,340 | 100.00 | % | |||||
| (1) | Includes short-term securities. |
| See notes to financial statements. |
23
FLEXIBLE CAPITAL FUND |
INVESTMENT REVIEW BY MUNISH MALHOTRA AND JORDON LAYCOB (UNAUDITED)
The Marsico Flexible Capital Fund posted a total return of +22.34% for the one-year fiscal period ended September 30, 2013. The Fund solidly outperformed the S&P 500 Index, which we consider to be the Fund’s benchmark index and which had a total return of +19.34%. Please see the Fund Overview for more detailed information about the Fund’s performance for various time periods ended September 30, 2013.
The performance data for the Fund quoted here represent past performance, and past performance is not a guarantee of future results. Investment return and principal value of an investment will fluctuate so that an investor’s shares, when redeemed, may be worth more or less than their original cost. Current performance may be lower or higher than the performance information quoted. To obtain performance information current to the most recent month-end, please call 888-860-8686 or visit www.marsicofunds.com.(1)
This review highlights Fund performance over a one-year fiscal period. Shareholders should keep in mind that the Fund is intended for long-term investors who hold their shares for substantially longer periods of time. You should also keep in mind that our views on all investments discussed in this report are subject to change at any time. References to specific securities, industries, and sectors discussed in this report are not recommendations to buy or sell such securities or related investments, and the Fund may not necessarily hold these securities or investments today. Please see the accompanying Schedule of Investments for the percentage of the Fund’s portfolio represented by the securities mentioned in this report as of the end of the reporting period.
The Fund and the stocks and markets in which it invests are subject to general risks that may include periods of turbulence, instability, decline, cyclical change, and the risk that investors may avoid investments in equity securities generally. Please see the Prospectus for more information.
Throughout the period, the Fund’s exposure to the Consumer Discretionary sector was more than twice that of its benchmark index. This positioning benefitted relative performance, as Consumer Discretionary was a strong-performing sector of the benchmark index. Within the Consumer Discretionary sector, electric car manufacturer Tesla Motors, Inc. soared more than +690% during the period and was the largest individual contributor to the Fund’s performance. Tesla reported strong results on better-than-expected deliveries of its luxury Model S sedan and continued to demonstrate improvements in logistics costs. The Fund significantly trimmed its stake in Tesla as the stock reached our near-term price target. As of period-end, the Fund continued to maintain a small position in the company as we believe there is further long-term upside potential as Tesla continues to experience unit sales growth, improved margins, growth opportunities in overseas markets, and expects to introduce a new model in the second half of 2014. Other leading Consumer Discretionary positions included home improvement retailer Lowe’s Companies, Inc. (+61%), online travel reservations company priceline.com, Inc. (+45% prior to being sold), hotel and casino operator Wynn Resorts Ltd. (+47%), and media company Liberty Global PLC Series C (+21%).
The Consumer Staples and Materials sectors also contributed some top performers for the period. Within Consumer Staples, Green Mountain Coffee Roasters, Inc. (+69%) and Constellation Brands, Inc. - Cl. A (+72%) contributed positively to Fund performance. In the Materials sector, specialty chemicals company LyondellBasell Industries N.V. – Cl. A gained +19% and was sold from the Fund.
Underweight allocations to the weaker-performing Information Technology and Utilities sectors also aided results.
In contrast, an underweight allocation to the Health Care sector, a strong-performing sector of the benchmark index, detracted from performance. Express Scripts Holding Company (-2%), the largest US pharmacy benefit manager, posted a modest stock price decline and was sold from the Fund.
Stock selection in the Financials sector was a significant performance detractor. Mexican real estate investment trust company Fibra Uno Administracion S.A. de C.V. (-8%), diversified financials company Capital One Financial Corporation (+4%), and real estate company Global Logistic Properties Ltd. (+5%) posted weak returns relative to the overall Financials sector. All three positions were sold from the Fund.
Certain individual Fund holdings had a material, negative effect on performance, including Equinix, Inc. (-14%), a data center and Internet exchange service provider in the technology sector, which posted a negative return prior to being sold from the Fund. We also sold MRC Global, Inc. (-22%), an industrial valves and fittings company that provides service to the energy sector, after its shares posted a double-digit decline.
24
FLEXIBLE CAPITAL FUND |
From time to time, the Fund may hold elevated cash levels as a buying reserve or as a defensive measure in adverse market conditions. Late in 2012, the Fund’s cash and cash equivalents position was somewhat elevated as a result of uncertainties regarding fiscal policy. We reduced the Fund’s cash position early in 2013 after Washington averted a “fiscal cliff” of tax increases and spending cuts at year-end 2012. We also reduced exposure to international securities in favor of US investments because we believe the United States is further along than many countries in the consumer and corporate debt deleveraging process, and its economy appears to be stabilizing or improving on a number of fronts.
The equity market’s strong performance during the fiscal year contributed to an active initial public offering market with many newly public companies coming to market. The Fund invested selectively in a number of these companies, and these investments on a net basis had a modest positive impact on the Fund’s total return for the year.
The Flexible Capital Fund at times has had a relatively high turnover level during various periods since its inception. This is attributable in part to the Fund’s investment style, under which the Fund may hold core positions for some time, while at times changing its portfolio composition to harvest gains, take advantage of new opportunities, preserve capital, or limit losses. Portfolio turnover increases transaction-related expenses and could reduce Fund returns.
Fiscal Period-End Investment Posture
As of period-end, the Fund’s primary economic sector allocations included Consumer Discretionary, Information Technology, Financials, and Industrials. At period-end, the Fund had no exposure to the Utilities sector. The Fund also held several investments in fixed-income and preferred securities that we believed to offer equity-like return potential.
Sincerely,
MUNISH MALHOTRA, CFA
JORDON S. LAYCOB
PORTFOLIO MANAGERS
| (1) | Total returns are based on net change in net asset value assuming reinvestment of distributions. For the period prior to February 1, 2011, the performance returns for the Flexible Capital Fund reflect a fee waiver in effect; in the absence of such a waiver, the returns would have been reduced. A redemption fee of 2% may be imposed on redemptions or exchanges of Fund shares owned for 30 days or less. Please see the Prospectus for more information. |
25
FLEXIBLE CAPITAL FUND OVERVIEW |
September 30, 2013 (Unaudited)
The Flexible Capital Fund invests primarily in equity securities and other investments that are selected primarily for their long-term growth potential. The Fund may invest in issuers of any size throughout the world, and will normally hold a core position of between 20 and 50 securities or other investments.
| TOTAL ANNUAL OPERATING EXPENSES* 1.44% | NET ASSETS $805,735,492 | NET ASSET VALUE PER SHARE $18.21 |
GROWTH OF $10,000(1)(2) | PERFORMANCE COMPARISON | |
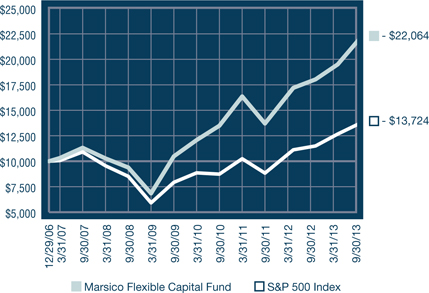 |  | |
SECTOR ALLOCATION(3) | TOP FIVE HOLDINGS | |
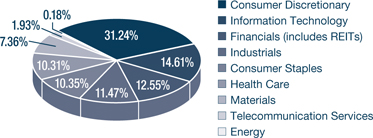 | ||
| MONSANTO COMPANY | 4.14% | |
| BIOGEN IDEC INC. | 3.88% | |
| GOOGLE, INC. - CL. A | 3.81% | |
| LOWE'S COMPANIES, INC. | 3.77% | |
| CSX CORPORATION | 3.50% | |
| * | The Total Annual Operating Expenses are reflective of the information disclosed in the Funds’ Prospectus dated February 1, 2013 and may differ from the expense ratio disclosed in this report. |
The performance data quoted here represent past performance, and past performance is not a guarantee of future results. Investment return and principal value of an investment will fluctuate so that an investor’s shares, when redeemed, may be worth more or less than their original cost. Current performance may be lower or higher than the performance information quoted. To obtain performance information current to the most recent month-end, please call 888-860-8686 or visit www.marsicofunds.com. A redemption fee may be imposed on redemptions or exchanges of Fund shares owned for 30 days or less. |
| The performance included in the chart and graph does not reflect the deduction of taxes on Fund distributions or the redemption of Fund shares. |
| All indices are unmanaged and investors cannot invest directly in an index. |
| (1) | The performance returns for the Flexible Capital Fund (for the period prior to February 1, 2011) reflect a fee waiver in effect; in the absence of such a waiver, the returns would be reduced. |
| (2) | This chart assumes an initial investment of $10,000 made on December 29, 2006 (inception). Total returns are based on change in NAV, assuming reinvestment of distributions. |
| (3) | Sector weightings represent the percentage of the Fund’s investments (excluding cash equivalents) in certain general sectors. These sectors may include more than one industry. The Fund’s portfolio composition is subject to change at any time. |
26
SCHEDULE OF INVESTMENTS |
MARSICO FLEXIBLE CAPITAL FUND
SCHEDULE OF INVESTMENTS
September 30, 2013
Number of Shares | Value | Percent of Net Assets | ||||||||||
| COMMON STOCKS | ||||||||||||
| Aerospace & Defense | ||||||||||||
| Lockheed Martin Corporation | 123,542 | $ | 15,757,782 | 1.96 | % | |||||||
| Apparel, Accessories & Luxury Goods | ||||||||||||
| lululemon athletica, inc.* | 238,943 | 17,464,344 | 2.17 | |||||||||
| Automobile Manufacturers | ||||||||||||
| Tesla Motors, Inc.* | 45,241 | 8,750,514 | 1.09 | |||||||||
| Automotive Retail | ||||||||||||
| AutoZone, Inc.* | 66,275 | 28,016,431 | 3.48 | |||||||||
| Biotechnology | ||||||||||||
| Biogen Idec Inc.* | 129,740 | 31,236,203 | 3.88 | |||||||||
| Celgene Corporation* | 157,366 | 24,223,348 | 3.00 | |||||||||
| Gilead Sciences, Inc.* | 399,657 | 25,114,446 | 3.12 | |||||||||
| 80,573,997 | 10.00 | |||||||||||
| Broadcasting | ||||||||||||
| CBS Corporation - Cl. B | 164,015 | 9,047,067 | 1.12 | |||||||||
| Cable & Satellite | ||||||||||||
| Liberty Global PLC - Series C* | 338,668 | 25,545,727 | 3.17 | |||||||||
| Time Warner Cable, Inc. | 69,789 | 7,788,453 | 0.97 | |||||||||
| 33,334,180 | 4.14 | |||||||||||
| Casinos & Gaming | ||||||||||||
| Pinnacle Entertainment, Inc.* | 538,715 | 13,494,811 | 1.67 | |||||||||
| Wynn Resorts Ltd. | 150,710 | 23,813,687 | 2.96 | |||||||||
| 37,308,498 | 4.63 | |||||||||||
| Data Processing & Outsourced Services | ||||||||||||
| QIWI PLC Spon. ADR | 251,517 | 7,862,421 | 0.98 | |||||||||
| Distillers & Vintners | ||||||||||||
| Constellation Brands, Inc. - Cl. A* | 453,139 | 26,010,178 | 3.23 | |||||||||
| Remy Cointreau S.A. | 93,881 | 10,004,338 | 1.24 | |||||||||
| 36,014,516 | 4.47 | |||||||||||
| Distributors | ||||||||||||
| LKQ Corporation* | 266,910 | 8,503,753 | 1.06 | |||||||||
| Diversified Capital Markets | ||||||||||||
| UBS A.G. | 785,637 | 16,071,526 | 1.99 | |||||||||
| Fertilizers & Agricultural Chemicals | ||||||||||||
| Monsanto Company | 319,850 | 33,382,744 | 4.14 | |||||||||
| Home Improvement Retail | ||||||||||||
| Lowe's Companies, Inc. | 637,997 | 30,375,037 | 3.77 | |||||||||
| Internet Software & Services | ||||||||||||
| Facebook, Inc. - Cl. A* | 196,065 | 9,850,306 | 1.22 | |||||||||
| Google, Inc. - Cl. A* | 35,007 | 30,662,981 | 3.81 | |||||||||
| Yahoo!, Inc.* | 290,166 | 9,621,904 | 1.19 | |||||||||
| Zillow, Inc. - Cl. A* | 94,189 | 7,946,726 | 0.99 | |||||||||
| 58,081,917 | 7.21 | |||||||||||
| Leisure Facilities | ||||||||||||
| ClubCorp Holdings, Inc.* | 406,209 | 6,227,184 | 0.77 | |||||||||
COMMON STOCKS (continued) | ||||||||||||
| Life & Health Insurance | ||||||||||||
| AIA Group Ltd. | 3,386,200 | $ | 15,913,948 | 1.97 | % | |||||||
| Mortgage REITs | ||||||||||||
| Starwood Property Trust, Inc. | 503,619 | 12,071,747 | 1.50 | |||||||||
| Movies & Entertainment | ||||||||||||
| The Walt Disney Company | 318,324 | 20,528,715 | 2.55 | |||||||||
| Other Diversified Financial Services | ||||||||||||
| Citigroup, Inc. | 359,391 | 17,434,057 | 2.16 | |||||||||
| Packaged Foods & Meats | ||||||||||||
| Green Mountain Coffee Roasters, Inc.* | 250,608 | 18,878,301 | 2.34 | |||||||||
| Mondelez International, Inc. - Cl. A | 824,911 | 25,918,703 | 3.22 | |||||||||
| 44,797,004 | 5.56 | |||||||||||
| Railroads | ||||||||||||
| CSX Corporation | 1,094,900 | 28,182,726 | 3.50 | |||||||||
| Real Estate Operating Companies | ||||||||||||
| BR Malls Participacoes S.A. | 883,600 | 8,013,518 | 0.99 | |||||||||
| Research & Consulting Services | ||||||||||||
| IHS, Inc. - Cl. A* | 132,531 | 15,132,389 | 1.88 | |||||||||
| Semiconductor Equipment | ||||||||||||
| ASML Holding N.V. | 253,339 | 25,019,760 | 3.11 | |||||||||
| Semiconductors | ||||||||||||
| Texas Instruments, Inc. | 574,318 | 23,127,786 | 2.87 | |||||||||
| Specialized Finance | ||||||||||||
| IntercontinentalExchange, Inc.* | 123,411 | 22,389,224 | 2.78 | |||||||||
| Specialty Chemicals | ||||||||||||
| The Sherwin-Williams Company | 132,409 | 24,122,272 | 2.99 | |||||||||
| Specialty Stores | ||||||||||||
| Jin Company Ltd. | 221,300 | 8,307,615 | 1.03 | |||||||||
| Sally Beauty Holdings, Inc.* | 554,999 | 14,518,774 | 1.80 | |||||||||
| 22,826,389 | 2.83 | |||||||||||
| Tires & Rubber | ||||||||||||
| Pirelli & C. SpA | 1,121,025 | 14,597,075 | 1.81 | |||||||||
| Trading Companies & Distributors | ||||||||||||
| United Rentals, Inc.* | 348,658 | 20,323,275 | 2.52 | |||||||||
| TOTAL COMMON STOCKS | ||||||||||||
| (Cost $623,390,238) | 741,251,796 | 92.00 | ||||||||||
| * | Non-income producing. |
| See notes to financial statements. |
27
SCHEDULE OF INVESTMENTS |
MARSICO FLEXIBLE CAPITAL FUND
SCHEDULE OF INVESTMENTS (continued)
September 30, 2013
Par Value/ Number of Shares/ Warrants | Value | Percent of Net Assets | ||||||||||
| CORPORATE BONDS | ||||||||||||
| Aerospace & Defense | ||||||||||||
TransDigm, Inc., 7.750%, 12/15/18 | $ | 4,256,000 | $ | 4,532,640 | 0.56 | % | ||||||
| Cable & Satellite | ||||||||||||
Dish DBS Corp., 6.625%, 10/1/14 | 4,099,000 | 4,303,950 | 0.54 | |||||||||
| Casinos & Gaming | ||||||||||||
Marina District Finance Company, Inc., 9.500%, 10/15/15 | 2,569,000 | 2,694,239 | 0.34 | |||||||||
| Research & Consulting Services | ||||||||||||
Nielsen Finance Co., 7.750%, 10/15/18 | 5,185,000 | 5,638,687 | 0.70 | |||||||||
| Wireless Telecommunication Services | ||||||||||||
NII International Telecom SCA 144A, 11.375%, 8/15/19 | 6,094,000 | 6,307,290 | 0.78 | |||||||||
| TOTAL CORPORATE BONDS | ||||||||||||
| (Cost $23,337,091) | 23,476,806 | 2.92 | ||||||||||
| INTERNATIONAL BONDS | ||||||||||||
| Alternative Carriers | ||||||||||||
Ziggo Bond Co. 144A, 8.000%, 5/15/18 | € | 6,086,000 | 8,789,206 | 1.09 | ||||||||
| TOTAL INTERNATIONAL BONDS | ||||||||||||
| (Cost $8,113,754) | 8,789,206 | 1.09 | ||||||||||
| PREFERRED STOCKS | ||||||||||||
| Thrifts & Mortgage Finance | ||||||||||||
First Niagara Financial Group, Inc., Series B, 8.625% | 212,799 | 6,141,379 | 0.76 | |||||||||
| TOTAL PREFERRED STOCKS | ||||||||||||
| (Cost $5,319,975) | 6,141,379 | 0.76 | ||||||||||
| WARRANTS | ||||||||||||
| Oil & Gas Storage & Transportation | ||||||||||||
Kinder Morgan, Inc., Strike Price: $40.00, Expiration Date: May 25, 2017* | 277,141 | 1,377,391 | 0.17 | |||||||||
| TOTAL WARRANTS | ||||||||||||
| (Cost $527,954) | 1,377,391 | 0.17 | ||||||||||
Number of Shares | Value | Percent of Net Assets | ||||||||||
| SHORT-TERM INVESTMENTS | ||||||||||||
| State Street Institutional Treasury Money Market Fund, 0.000% | 41,047,003 | $ | 41,047,003 | 5.09 | % | |||||||
| TOTAL SHORT-TERM INVESTMENTS | ||||||||||||
| (Cost $41,047,003) | 41,047,003 | 5.09 | ||||||||||
| TOTAL INVESTMENTS | ||||||||||||
| (Cost $701,736,015) | 822,083,581 | 102.03 | ||||||||||
| Liabilities, Less Cash and Other Assets | (16,348,089 | ) | (2.03 | ) | ||||||||
| NET ASSETS | $ | 805,735,492 | 100.00 | % | ||||||||
| SUMMARY OF INVESTMENTS BY COUNTRY | ||||||||
| Country | Market Value | Percent of Investment Securities | ||||||
| Brazil | $ | 8,013,518 | 0.97 | % | ||||
| Canada | 17,464,344 | 2.12 | ||||||
| China/Hong Kong | 15,913,948 | 1.94 | ||||||
| France | 10,004,338 | 1.22 | ||||||
| Italy | 14,597,075 | 1.78 | ||||||
| Japan | 8,307,615 | 1.01 | ||||||
| Netherlands | 33,808,966 | 4.11 | ||||||
| Russia | 7,862,421 | 0.96 | ||||||
| Switzerland | 16,071,526 | 1.95 | ||||||
| United Kingdom | 25,545,727 | 3.11 | ||||||
United States(1) | 664,494,103 | 80.83 | ||||||
| $ | 822,083,581 | 100.00 | % | |||||
| (1) | Includes short-term securities. |
| * | Non-income producing. |
| See notes to financial statements. |
28
GLOBAL FUND |
INVESTMENT REVIEW BY TOM MARSICO AND JIM GENDELMAN (UNAUDITED)
The Marsico Global Fund posted a total return of (US$) +28.06% for the one-year fiscal period ended September 30, 2013. The Fund’s return strongly surpassed that of the MSCI All Country World Index (“MSCI ACWI Index”), which we consider to be the Fund’s benchmark index and which had a total return of (US$) +17.73%. The MSCI ACWI Index measures equity market performance in the global developed and emerging markets. Please see the Fund Overview for more detailed information about the Fund’s performance for various time periods ended September 30, 2013.
The performance data for the Fund quoted here represent past performance, and past performance is not a guarantee of future results. Investment return and principal value of an investment will fluctuate so that an investor’s shares, when redeemed, may be worth more or less than their original cost. Current performance may be lower or higher than the performance information quoted. To obtain performance information current to the most recent month-end, please call 888-860-8686 or visit www.marsicofunds.com.(1)
This review highlights Fund performance over a one-year fiscal period. Shareholders should keep in mind that the Fund is intended for long-term investors who hold their shares for substantially longer periods of time. You should also keep in mind that our views on all investments discussed in this report are subject to change at any time. References to specific securities, industries, and sectors discussed in this report are not recommendations to buy or sell such securities or related investments, and the Fund may not necessarily hold these securities or investments today. Please see the accompanying Schedule of Investments for the percentage of the Fund’s portfolio represented by the securities mentioned in this report as of the end of the reporting period.
Foreign investments present additional risks due to currency fluctuations, economic and political factors, lower liquidity, differences in securities regulations and accounting standards, possible changes in taxation, limited public information, and other factors. In addition, the Fund and the stocks and markets in which it invests are subject to other general risks that may include periods of turbulence, instability, decline, and cyclical change, and the risk that investors may avoid investments in equity securities generally. Please see the Prospectus for more information.
The Global Fund’s significant outperformance versus the MSCI ACWI Index was partially attributable to stock selection in the Health Care sector. The Fund’s Health Care holdings posted a collective return of +52%. A number of the Fund’s pharmaceutical and biotechnology holdings posted sizeable stock price gains, including Gilead Sciences, Inc. (+80%), Biogen Idec Inc. (+58%), and Roche Holding AG (+47%).
The Fund was also aided by stock selection and underweight allocations to the Energy and Materials sectors, which were relatively poor performing sectors of the benchmark index. Energy services holding Schlumberger Ltd. gained +25% and specialty chemicals company LyondellBasell Industries N.V. – Cl. A rose +23% (prior to being sold).
Several of the Fund’s Internet services and e-commerce holdings posted very strong returns. Russian e-commerce payment service provider QIWI PLC Spon. ADR (+87%), social media company Facebook, Inc. – Cl. A (+36%), and Internet cloud computing applications provider Workday, Inc. – Cl. A (+74% prior to being sold) were leading positions within the Information Technology sector. QIWI and Workday were purchased by the Fund during the companies’ respective initial public offerings.
Within the Consumer Discretionary sector, electric car manufacturer Tesla Motors, Inc. soared more than +607% during the period and was the largest individual contributor to the Fund’s performance. The Fund did well by having nearly three times the exposure to the Consumer Discretionary sector as compared to its benchmark index, as Consumer Discretionary was a relatively strong-performing sector.
Active currency management is not a central facet of the Fund’s investment process, but fluctuations in major world currencies can affect performance. The net effect of currency moves was positive for the Fund. During the period, the Fund’s performance was helped by having nearly no exposure to companies whose securities trade in the Japanese yen, which weakened relative to the US dollar and certain other currencies in which Fund holdings are traded.
Financials was a strong-performing area of the benchmark index and the Fund’s performance was hampered by having a significant underweight allocation to the sector. Stock selection within Financials was a further detractor. Grupo Financiero Santander Mexico S.A.B. de C.V. Series B ADR, a leading Mexican financial institution, posted a stock price decline of -2% and was sold from the Fund.
29
GLOBAL FUND |
Several of the Fund’s Consumer Staples and Information Technology holdings struggled. Infant formula company Mead Johnson Nutrition Company (-19%), and technology hardware companies Fusion-io, Inc. (-30%) and Apple, Inc. (-23%), each posted double-digit stock price declines prior to being sold from the Fund.
The Global Fund at times has had a relatively high turnover level during various periods since its inception. This is attributable in part to the Fund’s investment style, under which the Fund may hold core positions for some time, while at times changing its portfolio composition to harvest gains, take advantage of new opportunities, preserve capital, or limit losses. Portfolio turnover increases transaction-related expenses and could reduce Fund returns.
Fiscal Period-End Investment Posture
As of September 30, 2013, the Fund’s primary economic sector allocations were Consumer Discretionary, Industrials, Health Care, and Information Technology. The Fund had no investments in the Utilities sector. The Fund’s most significant country allocations were the US, Netherlands, and United Kingdom.
Sincerely,
THOMAS F. MARSICO
JAMES G. GENDELMAN
PORTFOLIO MANAGERS
| (1) | Total returns are based on net change in net asset value assuming reinvestment of distributions. For the period prior to January 1, 2009, from April 2009 through May 2009, and from January 2012 through September 2013, the performance returns for the Global Fund reflect a fee waiver in effect; in the absence of such a waiver, the returns would have been reduced. For the one-month period June 2009, performance returns for the Global Fund would have been higher but for the reimbursement of fees waived previously. A redemption fee of 2% may be imposed on redemptions or exchanges of Fund shares owned for 30 days or less. Please see the Prospectus for more information. |
30
GLOBAL FUND OVERVIEW |
September 30, 2013 (Unaudited)
The Global Fund invests primarily in the common stocks of US and foreign companies that are selected for their long-term growth potential. The Fund may invest in the securities of companies of any size that are economically tied to any countries or markets throughout the world, including the securities of companies economically tied to emerging markets. Under normal market conditions, the Fund will invest significantly (generally, at least 40% of its net assets) in the securities of issuers organized or located outside the US or doing business outside the US (unless market conditions are not deemed favorable by the Adviser, in which case the Fund generally will invest at least 30% of its assets in such foreign securities). The Fund will invest its assets in various regions and countries, including the US, that encompass not less than three different countries overall. The Fund may hold an unlimited number of common stocks.
TOTAL ANNUAL OPERATING EXPENSES* NET EXPENSES*† | 1.71% 1.61% | NET ASSETS $61,383,176 | NET ASSET VALUE PER SHARE $14.74 |
GROWTH OF $10,000(1)(2) | PERFORMANCE COMPARISON | |
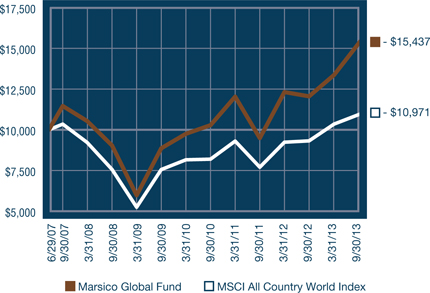 | 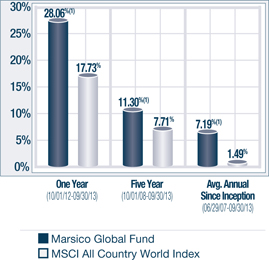 | |
SECTOR ALLOCATION(3) | TOP FIVE HOLDINGS | |
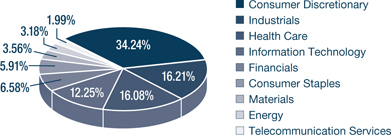 | ||
| ROLLS-ROYCE HOLDINGS PLC | 4.69% | |
| BIOGEN IDEC INC. | 4.42% | |
| GILEAD SCIENCES, INC. | 3.95% | |
| GOOGLE, INC. - CL. A | 3.79% | |
| LULULEMON ATHLETICA, INC. | 3.73% | |
| * | The Total Annual Operating Expenses and Net Expenses are reflective of the information disclosed in the Funds’ Prospectus dated February 1, 2013 and may differ from the expense ratios disclosed in this report. |
| † | Marsico Capital Management, LLC (the “Adviser”) has entered into a written expense limitation and fee waiver agreement under which it has agreed to limit the total expenses of the Global Fund (excluding interest, taxes, acquired fund fees and expenses, litigation, brokerage and extraordinary expenses) to an annual rate of 1.60% of the Fund’s average net assets until January 31, 2014. This expense limitation and fee waiver agreement may be terminated by the Adviser at any time after January 31, 2014, upon 15 days prior notice to the Fund and its administrator. The Adviser may recoup from the Fund fees previously waived or expenses previously reimbursed by the Adviser with respect to the Fund pursuant to this agreement (or a previous expense limitation agreement) if such reimbursement does not cause the Fund to exceed the expense limitation currently in effect and the reimbursement is made within three years after the year in which the Adviser waived the fee or reimbursed the expense. |
The performance data quoted here represent past performance, and past performance is not a guarantee of future results. Investment return and principal value of an investment will fluctuate so that an investor’s shares, when redeemed, may be worth more or less than their original cost. Current performance may be lower or higher than the performance information quoted. To obtain performance information current to the most recent month-end, please call 888-860-8686 or visit www.marsicofunds.com. A redemption fee may be imposed on redemptions or exchanges of Fund shares held for 30 days or less. |
| The performance included in the chart and graph does not reflect the deduction of taxes on Fund distributions or the redemption of Fund shares. |
| All indices are unmanaged and investors cannot invest directly in an index. |
| (1) | The performance returns for the Global Fund (for the period prior to January 1, 2009, from April 2009 through May 2009 and from January 2012 through September 2013) reflect a fee waiver in effect; in absence of such a waiver, the returns would be reduced. For the one-month period June 2009, performance returns for the Global Fund would have been higher but for reimbursement of fees waived previously. |
| (2) | This chart assumes an initial investment of $10,000 made on June 29, 2007 (inception). Total returns are based on change in NAV, assuming reinvestment of distributions. |
| (3) | Sector weightings represent the percentage of the Fund’s investments (excluding cash equivalents) in certain general sectors. These sectors may include more than one industry. The Fund’s portfolio composition is subject to change at any time. |
| The MSCI ACWI (All Country World Index) Index is a free float-adjusted market capitalization index that is designed to measure equity market performance in the global developed and emerging markets. |
31
SCHEDULE OF INVESTMENTS |
MARSICO GLOBAL FUND
SCHEDULE OF INVESTMENTS
September 30, 2013
Number of Shares | Value | Percent of Net Assets | ||||||||||
| COMMON STOCKS | ||||||||||||
| Aerospace & Defense | ||||||||||||
| European Aeronautic Defence and Space Company N.V. | 25,811 | $ | 1,644,483 | 2.68 | % | |||||||
| Lockheed Martin Corporation | 12,871 | 1,641,696 | 2.67 | |||||||||
| Precision Castparts Corp. | 5,337 | 1,212,780 | 1.98 | |||||||||
| Rolls-Royce Holdings PLC* | 160,102 | 2,882,185 | 4.69 | |||||||||
| 7,381,144 | 12.02 | |||||||||||
| Alternative Carriers | ||||||||||||
| Ziggo N.V. | 30,182 | 1,222,502 | 1.99 | |||||||||
| Apparel Retail | ||||||||||||
| The TJX Companies, Inc. | 34,584 | 1,950,192 | 3.18 | |||||||||
| Apparel, Accessories & Luxury Goods | ||||||||||||
| Hermes International | 4,660 | 1,677,570 | 2.73 | |||||||||
| lululemon athletica, inc.* | 31,342 | 2,290,787 | 3.73 | |||||||||
| Luxottica Group SpA Spon. ADR | 32,183 | 1,691,860 | 2.76 | |||||||||
| 5,660,217 | 9.22 | |||||||||||
| Automobile Manufacturers | ||||||||||||
| Bayerische Motoren Werke AG | 17,718 | 1,904,880 | 3.10 | |||||||||
| Tata Motors Ltd. Spon. ADR | 46,785 | 1,245,417 | 2.03 | |||||||||
| Tesla Motors, Inc.* | 2,968 | 574,071 | 0.94 | |||||||||
| 3,724,368 | 6.07 | |||||||||||
| Automotive Retail | ||||||||||||
| AutoZone, Inc.* | 2,190 | 925,779 | 1.51 | |||||||||
| Biotechnology | ||||||||||||
| Biogen Idec Inc.* | 11,274 | 2,714,328 | 4.42 | |||||||||
| Celgene Corporation* | 11,972 | 1,842,850 | 3.00 | |||||||||
| Celldex Therapeutics, Inc.* | 13,575 | 480,962 | 0.78 | |||||||||
| Gilead Sciences, Inc.* | 38,544 | 2,422,105 | 3.95 | |||||||||
| 7,460,245 | 12.15 | |||||||||||
| Cable & Satellite | ||||||||||||
| Comcast Corporation - Cl. A | 27,358 | 1,235,214 | 2.01 | |||||||||
| Casinos & Gaming | ||||||||||||
| Las Vegas Sands Corp. | 14,117 | 937,651 | 1.53 | |||||||||
| Data Processing & Outsourced Services | ||||||||||||
| QIWI PLC Spon. ADR | 19,183 | 599,661 | 0.98 | |||||||||
| Distillers & Vintners | ||||||||||||
| Diageo PLC | 28,277 | 899,531 | 1.46 | |||||||||
| Diversified Banks | ||||||||||||
| Wells Fargo & Company | 29,214 | 1,207,122 | 1.97 | |||||||||
| Fertilizers & Agricultural Chemicals | ||||||||||||
| Monsanto Company | 20,934 | 2,184,882 | 3.56 | |||||||||
| Home Improvement Retail | ||||||||||||
| The Home Depot, Inc. | 18,464 | 1,400,494 | 2.28 | |||||||||
| Homefurnishing Retail | ||||||||||||
| Restoration Hardware Holdings, Inc.* | 25,793 | 1,633,986 | 2.66 | |||||||||
| Hotels, Resorts & Cruise Lines | ||||||||||||
| Starwood Hotels & Resorts Worldwide, Inc. | 13,067 | 868,302 | 1.41 | |||||||||
COMMON STOCKS (continued) | ||||||||||||
| Hypermarkets & Super Centers | ||||||||||||
| PriceSmart, Inc. | 13,683 | $ | 1,303,169 | 2.12 | % | |||||||
| Industrial Machinery | ||||||||||||
| Pentair Ltd. | 20,007 | 1,299,255 | 2.12 | |||||||||
| Internet Software & Services | ||||||||||||
| Facebook, Inc. - Cl. A* | 22,964 | 1,153,711 | 1.88 | |||||||||
| Google, Inc. - Cl. A* | 2,653 | 2,323,789 | 3.79 | |||||||||
| MercadoLibre, Inc. | 9,851 | 1,328,999 | 2.16 | |||||||||
| 4,806,499 | 7.83 | |||||||||||
| Life & Health Insurance | ||||||||||||
| AIA Group Ltd. | 249,800 | 1,173,972 | 1.91 | |||||||||
| Oil & Gas Equipment & Services | ||||||||||||
| Schlumberger Ltd. | 22,075 | 1,950,547 | 3.18 | |||||||||
| Other Diversified Financial Services | ||||||||||||
| Citigroup, Inc. | 34,118 | 1,655,064 | 2.70 | |||||||||
| Packaged Foods & Meats | ||||||||||||
| Nestlé S.A. | 20,393 | 1,426,281 | 2.32 | |||||||||
| Pharmaceuticals | ||||||||||||
| Pacira Pharmaceuticals, Inc.* | 5,468 | 262,956 | 0.43 | |||||||||
| Roche Holding AG | 7,962 | 2,147,323 | 3.50 | |||||||||
| 2,410,279 | 3.93 | |||||||||||
| Railroads | ||||||||||||
| Canadian Pacific Railway Ltd. | 10,279 | 1,268,247 | 2.07 | |||||||||
| Restaurants | ||||||||||||
| Starbucks Corporation | 19,197 | 1,477,593 | 2.41 | |||||||||
| Semiconductor Equipment | ||||||||||||
| ASML Holding N.V. | 17,317 | 1,710,227 | 2.79 | |||||||||
| Systems Software | ||||||||||||
| FireEye, Inc.* | 9,702 | 402,924 | 0.66 | |||||||||
| Textiles | ||||||||||||
| Brunello Cucinelli SpA | 36,900 | 1,199,083 | 1.95 | |||||||||
| TOTAL COMMON STOCKS | ||||||||||||
| (Cost $47,423,028) | 61,374,430 | 99.99 | ||||||||||
| SHORT-TERM INVESTMENTS | ||||||||||||
| State Street Institutional Treasury Money Market Fund, 0.000% | 1,076,151 | 1,076,151 | 1.75 | |||||||||
| TOTAL SHORT-TERM INVESTMENTS | 1,076,151 | 1.75 | ||||||||||
| (Cost $1,076,151) | ||||||||||||
| TOTAL INVESTMENTS | ||||||||||||
| (Cost $48,499,179) | 62,450,581 | 101.74 | ||||||||||
| Liabilities, Less Cash and Other Assets | (1,067,405 | ) | (1.74 | ) | ||||||||
| NET ASSETS | $ | 61,383,176 | 100.00 | % | ||||||||
| * | Non-income producing. |
| See notes to financial statements. |
32
SCHEDULE OF INVESTMENTS |
| SUMMARY OF INVESTMENTS BY COUNTRY | ||||||||
| Country | Market Value | Percent of Investment Securities | ||||||
| Argentina | $ | 1,328,999 | 2.13 | % | ||||
| Canada | 3,559,034 | 5.70 | ||||||
| China/Hong Kong | 1,173,972 | 1.88 | ||||||
| France | 3,322,053 | 5.32 | ||||||
| Germany | 1,904,880 | 3.05 | ||||||
| India | 1,245,417 | 1.99 | ||||||
| Italy | 2,890,943 | 4.63 | ||||||
| Netherlands | 4,883,276 | 7.82 | ||||||
| Russia | 599,661 | 0.96 | ||||||
| Switzerland | 3,573,604 | 5.72 | ||||||
| United Kingdom | 3,781,716 | 6.06 | ||||||
United States(1) | 34,187,026 | 54.74 | ||||||
| $ | 62,450,581 | 100.00 | % | |||||
| (1) | Includes short-term securities. |
| See notes to financial statements. |
33
FINANCIAL STATEMENTS |
STATEMENTS OF ASSETS AND LIABILITIES
September 30, 2013
| (Amounts in thousands) | MARSICO FOCUS FUND | MARSICO GROWTH FUND | ||||||
| ASSETS | ||||||||
| Investments, at value (cost $621,113, $414,503, $229,569, $98,892, $701,736, and $48,499, respectively) | $ | 862,644 | $ | 566,186 | ||||
| Receivable for investments sold | 19,461 | 14,947 | ||||||
| Receivable for capital stock sold | 99 | 248 | ||||||
| Interest and dividends receivable | 353 | 294 | ||||||
| Prepaid expenses and other assets | 1,056 | 732 | ||||||
| Total Assets | 883,613 | 582,407 | ||||||
| LIABILITIES | ||||||||
| Payable for investments purchased | 21,192 | 10,585 | ||||||
| Payable for capital stock redeemed | 3,607 | 4,405 | ||||||
| Payable to investment adviser | 597 | 394 | ||||||
| Accrued trustees' fees | 1,029 | 709 | ||||||
| Accrued distribution fee | 2,195 | 1,342 | ||||||
| Accrued professional fees | 67 | 48 | ||||||
| Accrued transfer agent fees and expenses | 124 | 90 | ||||||
| Accrued printing expenses | 48 | 34 | ||||||
| Accrued expenses and other liabilities | 46 | 34 | ||||||
| Total Liabilities | 28,905 | 17,641 | ||||||
| NET ASSETS | $ | 854,708 | $ | 564,766 | ||||
| NET ASSETS CONSIST OF | ||||||||
| Paid-in-capital | $ | 488,790 | $ | 303,404 | ||||
| Undistributed net investment income (accumulated net investment loss) | (2,174 | ) | (890 | ) | ||||
| Accumulated net realized gain (loss) on investments and foreign currency transactions | 126,222 | 110,344 | ||||||
| Net unrealized appreciation on investments and foreign currency translations | 241,870 | 151,908 | ||||||
| NET ASSETS | $ | 854,708 | $ | 564,766 | ||||
| SHARES OUTSTANDING, $0.001 par value (Unlimited shares authorized) | 39,817 | 22,567 | ||||||
| NET ASSET VALUE, REDEMPTION PRICE, AND OFFERING PRICE PER SHARE (NET ASSETS/SHARES OUTSTANDING)* | $ | 21.47 | $ | 25.03 | ||||
| * | Not in thousands, based on unrounded net assets and shares outstanding. |
| See notes to financial statements. |
34
FINANCIAL STATEMENTS |
MARSICO 21st CENTURY FUND | MARSICO INTERNATIONAL OPPORTUNITIES FUND | MARSICO FLEXIBLE CAPITAL FUND | MARSICO GLOBAL FUND | |||||||||||
| $ | 312,217 | $ | 119,374 | $ | 822,084 | $ | 62,451 | |||||||
| — | — | — | 886 | |||||||||||
| 1,414 | 19 | 727 | 2 | |||||||||||
| 99 | 575 | 1,468 | 81 | |||||||||||
| 644 | 430 | 1,111 | 590 | |||||||||||
| 314,374 | 120,398 | 825,390 | 64,010 | |||||||||||
| — | — | 16,382 | 1,887 | |||||||||||
| 562 | 110 | 1,000 | 5 | |||||||||||
| 216 | 69 | 553 | 9 | |||||||||||
| 630 | 415 | 1,060 | 578 | |||||||||||
| 615 | 200 | 405 | 112 | |||||||||||
| 24 | 9 | 52 | 4 | |||||||||||
| 55 | 34 | 130 | 10 | |||||||||||
| 17 | 7 | 37 | 3 | |||||||||||
| 40 | 32 | 36 | 19 | |||||||||||
| 2,159 | 876 | 19,655 | 2,627 | |||||||||||
| $ | 312,215 | $ | 119,522 | $ | 805,735 | $ | 61,383 | |||||||
| $ | 742,632 | $ | 211,096 | $ | 610,175 | $ | 38,713 | |||||||
| (2,307 | ) | 443 | (651 | ) | (272 | ) | ||||||||
| (510,956 | ) | (112,597 | ) | 75,414 | 8,763 | |||||||||
| 82,846 | 20,580 | 120,797 | 14,179 | |||||||||||
| $ | 312,215 | $ | 119,522 | $ | 805,735 | $ | 61,383 | |||||||
| 17,295 | 7,814 | 44,237 | 4,165 | |||||||||||
| $ | 18.05 | $ | 15.30 | $ | 18.21 | $ | 14.74 | |||||||
35
FINANCIAL STATEMENTS |
STATEMENTS OF OPERATIONS
FOR THE YEAR ENDED September 30, 2013
| (Amounts in thousands) | MARSICO FOCUS FUND | MARSICO GROWTH FUND | ||||||
| INVESTMENT INCOME | ||||||||
| Dividends (net of $131, $274, $90, $208, $239, and $60, respectively, of non-reclaimable foreign withholding taxes) | $ | 10,825 | $ | 8,514 | ||||
| Interest | 6 | — | ||||||
| Miscellaneous income | 9 | 3 | ||||||
| Total Investment Income | 10,840 | 8,517 | ||||||
| EXPENSES | ||||||||
| Investment advisory fees | 7,371 | 5,255 | ||||||
| Distribution fees | 2,168 | 1,546 | ||||||
| Transfer agent fees and expenses | 1,006 | 713 | ||||||
| Trustees' fees and expenses | 322 | (1) | 222 | (1) | ||||
| Professional fees | 232 | 167 | ||||||
| Fund administration fees | 191 | 172 | ||||||
| Custody and fund accounting fees | 174 | 166 | ||||||
| Printing and postage expenses | 130 | 94 | ||||||
| Miscellaneous | 100 | 71 | ||||||
| Federal and state registration fees | 35 | 42 | ||||||
| Total Expenses | 11,729 | 8,448 | ||||||
| Less waiver of expenses and expenses paid indirectly | (1 | ) | (1 | ) | ||||
| Net Expenses | 11,728 | 8,447 | ||||||
| NET INVESTMENT INCOME (LOSS) | (888 | ) | 70 | |||||
| REALIZED AND UNREALIZED GAIN (LOSS) | ||||||||
| Net realized gain on investments | 178,279 | 151,295 | ||||||
| Net realized gain (loss) on foreign currency transactions | 608 | 298 | ||||||
| Change in unrealized appreciation (depreciation) on investments and foreign currency translations | (12,255 | ) | (36,212 | ) | ||||
| Net Gain on Investments | 166,632 | 115,381 | ||||||
| NET INCREASE IN NET ASSETS RESULTING FROM OPERATIONS | $ | 165,744 | $ | 115,451 | ||||
| (1) | Amounts include trustees’ fees and expenses and the mark to market unrealized appreciation during the period for shares held in the Trustees’ Deferred Plan, as more fully described in Note 2(g) in the Notes to Financial Statements. |
Trustees’ Fees and Expenses* | Unrealized Appreciation* | |||||||
| Focus Fund | $ | 146,105 | $ | 176,304 | ||||
| Growth Fund | 105,602 | 116,078 | ||||||
21st Century Fund | 49,338 | 127,271 | ||||||
| International Opportunities Fund | 20,509 | 74,240 | ||||||
| Flexible Capital Fund | 112,965 | 184,449 | ||||||
| Global Fund | 8,368 | 123,120 | ||||||
| * | Not in thousands. |
| See notes to financial statements. |
36
FINANCIAL STATEMENTS |
MARSICO 21st CENTURY FUND | MARSICO INTERNATIONAL OPPORTUNITIES FUND | MARSICO FLEXIBLE CAPITAL FUND | MARSICO GLOBAL FUND | |||||||||||
| $ | 3,462 | $ | 2,659 | $ | 8,096 | $ | 840 | |||||||
| — | — | 2,337 | — | |||||||||||
| — | — | — | — | |||||||||||
| 3,462 | 2,659 | 10,433 | 840 | |||||||||||
| 2,619 | 1,021 | 5,641 | 464 | |||||||||||
| 770 | 300 | 1,659 | 136 | |||||||||||
| 464 | 239 | 988 | 83 | |||||||||||
| 177 | (1) | 95 | (1) | 297 | (1) | 131 | (1) | |||||||
| 79 | 33 | 177 | 13 | |||||||||||
| 141 | 108 | 176 | 68 | |||||||||||
| 109 | 228 | 198 | 79 | |||||||||||
| 58 | 28 | 123 | 8 | |||||||||||
| 38 | 20 | 58 | 11 | |||||||||||
| 26 | 22 | 61 | 19 | |||||||||||
| 4,481 | 2,094 | 9,378 | 1,012 | |||||||||||
| — | (171 | ) | (1 | ) | (140 | ) | ||||||||
| 4,481 | 1,923 | 9,377 | 872 | |||||||||||
| (1,019 | ) | 736 | 1,056 | (32 | ) | |||||||||
| 76,783 | 26,474 | 107,689 | 14,236 | |||||||||||
| 6 | (1,652 | ) | (969 | ) | 96 | |||||||||
| (5,269 | ) | (1,499 | ) | 28,858 | (767 | ) | ||||||||
| 71,520 | 23,323 | 135,578 | 13,565 | |||||||||||
| $ | 70,501 | $ | 24,059 | $ | 136,634 | $ | 13,533 | |||||||
37
FINANCIAL STATEMENTS |
STATEMENTS OF CHANGES IN NET ASSETS
MARSICO FOCUS FUND | MARSICO GROWTH FUND | |||||||||||||||
| (Amounts in thousands) | Year Ended 9/30/13 | Year Ended 9/30/12 | Year Ended 9/30/13 | Year Ended 9/30/12 | ||||||||||||
| OPERATIONS: | ||||||||||||||||
| Net investment income (loss) | $ | (888 | ) | $ | 972 | $ | 70 | $ | 1,070 | |||||||
| Net realized gain on investments | 178,279 | 98,278 | 151,295 | 69,072 | ||||||||||||
| Net realized gain (loss) on foreign currency transactions | 608 | (501 | ) | 298 | 31 | |||||||||||
| Change in unrealized appreciation (depreciation) on investments and foreign currency translations | (12,255 | ) | 129,020 | (36,212 | ) | 92,018 | ||||||||||
| Change in unrealized appreciation (depreciation) on forward foreign currency contracts | — | — | — | — | ||||||||||||
| Net increase in net assets resulting from operations | 165,744 | 227,769 | 115,451 | 162,191 | ||||||||||||
| DISTRIBUTIONS: | ||||||||||||||||
| Net investment income | (1,177 | ) | — | (1,219 | ) | (292 | ) | |||||||||
| Net realized gains | (101,796 | ) | — | (34,354 | ) | — | ||||||||||
| Total distributions | (102,973 | ) | — | (35,573 | ) | (292 | ) | |||||||||
| CAPITAL SHARE TRANSACTIONS: | ||||||||||||||||
| Proceeds from sales of shares | 95,434 | 128,626 | 55,964 | 114,581 | ||||||||||||
| Proceeds from reinvestment of distributions | 100,815 | — | 34,546 | 283 | ||||||||||||
| Redemption fees | 11 | 12 | 9 | 31 | ||||||||||||
| Redemption of shares | (370,333 | ) | (326,779 | ) | (283,024 | ) | (266,326 | ) | ||||||||
| Net increase (decrease) from capital share transactions | (174,073 | ) | (198,141 | ) | (192,505 | ) | (151,431 | ) | ||||||||
| TOTAL INCREASE (DECREASE) IN NET ASSETS | (111,302 | ) | 29,628 | (112,627 | ) | 10,468 | ||||||||||
| NET ASSETS: | ||||||||||||||||
| Beginning of Period | 966,010 | 936,382 | 677,393 | 666,925 | ||||||||||||
| End of Period | $ | 854,708 | $ | 966,010 | $ | 564,766 | $ | 677,393 | ||||||||
| Undistributed net investment income (Accumulated net investment loss) | $ | (2,174 | ) | $ | (231 | ) | $ | (890 | ) | $ | 384 | |||||
| TRANSACTIONS IN SHARES: | ||||||||||||||||
| Shares sold | 4,907 | 6,837 | 2,486 | 5,547 | ||||||||||||
| Shares issued in reinvestment of distributions | 5,817 | �� | — | 1,705 | 15 | |||||||||||
| Shares redeemed | (19,169 | ) | (17,206 | ) | (12,469 | ) | (12,976 | ) | ||||||||
| NET INCREASE (DECREASE) | (8,445 | ) | (10,369 | ) | (8,278 | ) | (7,414 | ) | ||||||||
| See notes to financial statements. |
38
FINANCIAL STATEMENTS |
MARSICO 21st CENTURY FUND | MARSICO INTERNATIONAL OPPORTUNITIES FUND | MARSICO FLEXIBLE CAPITAL FUND | MARSICO GLOBAL FUND | |||||||||||||||||||||||||||
Year Ended 9/30/13 | Year Ended 9/30/12 | Year Ended 9/30/13 | Year Ended 9/30/12 | Year Ended 9/30/13 | Year Ended 9/30/12 | Year Ended 9/30/13 | Year Ended 9/30/12 | |||||||||||||||||||||||
| $ | (1,019 | ) | $ | (1,360 | ) | $ | 736 | $ | 425 | $ | 1,056 | $ | 820 | $ | (32 | ) | $ | (231 | ) | |||||||||||
| 76,783 | 14,722 | 26,474 | 4,076 | 107,689 | 38,397 | 14,236 | 11,459 | |||||||||||||||||||||||
| 6 | (71 | ) | (1,652 | ) | (1,780 | ) | (969 | ) | (2,159 | ) | 96 | 585 | ||||||||||||||||||
| (5,269 | ) | 95,147 | (1,499 | ) | 22,082 | 28,858 | 90,708 | (767 | ) | 7,662 | ||||||||||||||||||||
| — | — | — | 573 | — | — | — | — | |||||||||||||||||||||||
| 70,501 | 108,438 | 24,059 | 25,376 | 136,634 | 127,766 | 13,533 | 19,475 | |||||||||||||||||||||||
| — | — | — | — | (3,473 | ) | (1,878 | ) | — | — | |||||||||||||||||||||
| — | — | — | — | (29,533 | ) | — | — | — | ||||||||||||||||||||||
| — | — | — | — | (33,006 | ) | (1,878 | ) | — | — | |||||||||||||||||||||
| 9,472 | 15,514 | 8,254 | 12,020 | 368,214 | 297,142 | 6,067 | 14,965 | |||||||||||||||||||||||
| — | — | — | — | 29,608 | 1,728 | — | — | |||||||||||||||||||||||
| 2 | 6 | 1 | 1 | 52 | 51 | — | 6 | |||||||||||||||||||||||
| (122,305 | ) | (264,895 | ) | (47,013 | ) | (57,031 | ) | (286,060 | ) | (243,661 | ) | (12,412 | ) | (88,272 | ) | |||||||||||||||
| (112,831 | ) | (249,375 | ) | (38,758 | ) | (45,010 | ) | 111,814 | 55,260 | (6,345 | ) | (73,301 | ) | |||||||||||||||||
| (42,330 | ) | (140,937 | ) | (14,699 | ) | (19,634 | ) | 215,442 | 181,148 | 7,188 | (53,826 | ) | ||||||||||||||||||
| 354,545 | 495,482 | 134,221 | 153,855 | 590,293 | 409,145 | 54,195 | 108,021 | |||||||||||||||||||||||
| $ | 312,215 | $ | 354,545 | $ | 119,522 | $ | 134,221 | $ | 805,735 | $ | 590,293 | $ | 61,383 | $ | 54,195 | |||||||||||||||
| $ | (2,307 | ) | $ | (1,830 | ) | $ | 443 | $ | (215 | ) | $ | (651 | ) | $ | (295 | ) | $ | (272 | ) | $ | (380 | ) | ||||||||
| 607 | 1,159 | 598 | 995 | 22,747 | 20,642 | 461 | 1,416 | |||||||||||||||||||||||
| — | — | — | — | 1,998 | 136 | — | — | |||||||||||||||||||||||
| (8,209 | ) | (19,866 | ) | (3,520 | ) | (4,765 | ) | (17,885 | ) | (17,362 | ) | (1,006 | ) | (8,634 | ) | |||||||||||||||
| (7,602 | ) | (18,707 | ) | (2,922 | ) | (3,770 | ) | 6,860 | 3,416 | (545 | ) | (7,218 | ) | |||||||||||||||||
39
FINANCIAL STATEMENTS |
FINANCIAL HIGHLIGHTS
MARSICO FOCUS FUND | ||||||||||||||||||||
For a Fund Share Outstanding Throughout the Period | Year Ended 9/30/13 | Year Ended 9/30/12 | Year Ended 9/30/11 | Year Ended 9/30/10 | Year Ended 9/30/09 | |||||||||||||||
| Net Asset Value, Beginning of Period | $ | 20.02 | $ | 15.97 | $ | 15.79 | $ | 14.38 | $ | 15.43 | ||||||||||
| Income from Investment Operations: | ||||||||||||||||||||
| Net investment income (loss) | (0.03 | ) | 0.02 | (0.02 | ) | (0.01 | ) | 0.04 | ||||||||||||
| Net realized and unrealized gains (losses) on investments | 3.84 | 4.03 | 0.20 | 1.45 | (0.99 | ) | ||||||||||||||
| Total from investment operations | 3.81 | 4.05 | 0.18 | 1.44 | (0.95 | ) | ||||||||||||||
| Distributions & Other: | ||||||||||||||||||||
| Net investment income | (0.03 | ) | — | — | (0.03 | ) | (0.09 | ) | ||||||||||||
| Tax return of capital | — | — | — | — | — | |||||||||||||||
| Net realized gains | (2.33 | ) | — | — | — | (0.01 | ) | |||||||||||||
| Redemption fees [See Note 2(h)] | — | (1) | — | (1) | — | (1) | — | (1) | — | (1) | ||||||||||
| Total distributions and other | (2.36 | ) | — | — | (0.03 | ) | (0.10 | ) | ||||||||||||
| Net Asset Value, End of Period | $ | 21.47 | $ | 20.02 | $ | 15.97 | $ | 15.79 | $ | 14.38 | ||||||||||
| Total Return | 21.86 | % | 25.36 | % | 1.14 | % | 10.02 | % | (5.98 | )% | ||||||||||
| Supplemental Data and Ratios: | ||||||||||||||||||||
| Net assets, end of Period (000s) | $ | 854,708 | $ | 966,010 | $ | 936,382 | $ | 1,451,877 | $ | 2,001,041 | ||||||||||
| Ratio of expenses to average net assets, less waivers and before expenses paid indirectly, plus reimbursements of previously waived expenses | 1.35 | % | 1.34 | % | 1.33 | % | 1.33 | % | 1.31 | % | ||||||||||
| Ratio of net investment income (loss) to average net assets, net of waivers, reimbursements of previously waived expenses and expenses paid indirectly | (0.10 | )% | 0.09 | % | (0.04 | )% | (0.06 | )% | 0.27 | % | ||||||||||
| Ratio of expenses to average net assets, before waivers, reimbursements of previously waived expenses and expenses paid indirectly | 1.35 | % | 1.34 | % | 1.33 | % | 1.33 | % | 1.31 | % | ||||||||||
| Ratio of net investment income (loss) to average net assets, before waivers, reimbursements of previously waived expenses and expenses paid indirectly | (0.10 | )% | 0.09 | % | (0.04 | )% | (0.06 | )% | 0.27 | % | ||||||||||
| Portfolio turnover rate | 92 | % | 66 | % | 82 | % | 85 | % | 90 | % | ||||||||||
| (1) | Less than $0.01. |
| See notes to financial statements. |
40
FINANCIAL STATEMENTS |
MARSICO GROWTH FUND | MARSICO 21st CENTURY FUND | |||||||||||||||||||||||||||||||||||||
Year Ended 9/30/13 | Year Ended 9/30/12 | Year Ended 9/30/11 | Year Ended 9/30/10 | Year Ended 9/30/09 | Year Ended 9/30/13 | Year Ended 9/30/12 | Year Ended 9/30/11 | Year Ended 9/30/10 | Year Ended 9/30/09 | |||||||||||||||||||||||||||||
| $ | 21.96 | $ | 17.43 | $ | 17.04 | $ | 15.32 | $ | 16.73 | $ | 14.24 | $ | 11.36 | $ | 12.38 | $ | 11.56 | $ | 12.86 | |||||||||||||||||||
| — | (1) | 0.03 | — | (1) | 0.01 | 0.07 | (0.09 | ) | (0.06 | ) | (0.06 | ) | (0.08 | ) | — | (1) | ||||||||||||||||||||||
| 4.30 | 4.51 | 0.40 | 1.78 | (1.38 | ) | 3.90 | 2.94 | (0.96 | ) | 0.90 | (1.27 | ) | ||||||||||||||||||||||||||
| 4.30 | 4.54 | 0.40 | 1.79 | (1.31 | ) | 3.81 | 2.88 | (1.02 | ) | 0.82 | (1.27 | ) | ||||||||||||||||||||||||||
| (0.04 | ) | (0.01 | ) | (0.01 | ) | (0.07 | ) | (0.09 | ) | — | — | — | — | (0.01 | ) | |||||||||||||||||||||||
| — | — | — | — | — | — | — | — | — | (0.02 | ) | ||||||||||||||||||||||||||||
| (1.19 | ) | — | — | — | (0.01 | ) | — | — | — | — | — | |||||||||||||||||||||||||||
| — | (1) | — | (1) | — | (1) | — | (1) | — | (1) | — | (1) | — | (1) | — | (1) | — | (1) | — | (1) | |||||||||||||||||||
| (1.23 | ) | (0.01 | ) | (0.01 | ) | (0.07 | ) | (0.10 | ) | — | — | — | — | (0.03 | ) | |||||||||||||||||||||||
| $ | 25.03 | $ | 21.96 | $ | 17.43 | $ | 17.04 | $ | 15.32 | $ | 18.05 | $ | 14.24 | $ | 11.36 | $ | 12.38 | $ | 11.56 | |||||||||||||||||||
| 20.92 | % | 26.04 | % | 2.34 | % | 11.75 | % | (7.74 | )% | 26.76 | % | 25.35 | % | (8.24 | )% | 7.09 | % | (9.79 | )% | |||||||||||||||||||
| $ | 564,766 | $ | 677,393 | $ | 666,925 | $ | 883,053 | $ | 1,193,231 | $ | 312,215 | $ | 354,545 | $ | 495,482 | $ | 757,438 | $ | 921,676 | |||||||||||||||||||
| 1.37 | % | 1.35 | % | 1.33 | % | 1.33 | % | 1.30 | % | 1.45 | % | 1.41 | % | 1.37 | % | 1.37 | % | 1.37 | % | |||||||||||||||||||
| 0.01 | % | 0.15 | % | 0.03 | % | 0.04 | % | 0.42 | % | (0.33 | )% | (0.31 | )% | (0.32 | )% | (0.60 | )% | 0.06 | % | |||||||||||||||||||
| 1.37 | % | 1.35 | % | 1.33 | % | 1.33 | % | 1.30 | % | 1.45 | % | 1.41 | % | 1.37 | % | 1.37 | % | 1.37 | % | |||||||||||||||||||
| 0.01 | % | 0.15 | % | 0.03 | % | 0.04 | % | 0.41 | % | (0.33 | )% | (0.31 | )% | (0.32 | )% | (0.60 | )% | 0.06 | % | |||||||||||||||||||
| 114 | % | 65 | % | 67 | % | 67 | % | 77 | % | 102 | % | 63 | % | 86 | % | 100 | % | 135 | % | |||||||||||||||||||
41
FINANCIAL STATEMENTS |
FINANCIAL HIGHLIGHTS
MARSICO INTERNATIONAL OPPORTUNITIES FUND | ||||||||||||||||||||
For a Fund Share Outstanding Throughout the Period | Year Ended 9/30/13 | Year Ended 9/30/12 | Year Ended 9/30/11 | Year Ended 9/30/10 | Year Ended 9/30/09 | |||||||||||||||
| Net Asset Value, Beginning of Period | $ | 12.50 | $ | 10.61 | $ | 12.57 | $ | 11.86 | $ | 12.27 | ||||||||||
| Income from Investment Operations: | ||||||||||||||||||||
| Net investment income (loss) | 0.09 | 0.01 | (0.22 | ) | 0.04 | 0.06 | ||||||||||||||
| Net realized and unrealized gains (losses) on investments | 2.71 | 1.88 | (1.49 | ) | 0.72 | (0.33 | ) | |||||||||||||
| Total from investment operations | 2.80 | 1.89 | (1.71 | ) | 0.76 | (0.27 | ) | |||||||||||||
| Distributions & Other: | ||||||||||||||||||||
| Net investment income | — | — | (0.25 | ) | (0.05 | ) | (0.14 | ) | ||||||||||||
| Net realized gains | — | — | — | — | — | |||||||||||||||
| Redemption fees [See Note 2(h)] | — | (1) | — | (1) | — | (1) | — | (1) | — | (1) | ||||||||||
| Total distributions and other | — | — | (0.25 | ) | (0.05 | ) | (0.14 | ) | ||||||||||||
| Net Asset Value, End of Period | $ | 15.30 | $ | 12.50 | $ | 10.61 | $ | 12.57 | $ | 11.86 | ||||||||||
| Total Return | 22.40 | % | 17.81 | % | (13.98 | )% | 6.48 | % | (1.68 | )% | ||||||||||
| Supplemental Data and Ratios: | ||||||||||||||||||||
| Net assets, end of Period (000s) | $ | 119,522 | $ | 134,221 | $ | 153,855 | $ | 359,016 | $ | 450,926 | ||||||||||
| Ratio of expenses to average net assets, less waivers and before expenses paid indirectly, plus reimbursements of previously waived expenses | 1.60 | % | 1.60 | % | 1.56 | % | 1.52 | % | 1.48 | % | ||||||||||
| Ratio of net investment income (loss) to average net assets, net of waivers, reimbursements of previously waived expenses and expenses paid indirectly | 0.61 | % | 0.29 | % | (0.22 | )% | 0.31 | % | 0.54 | % | ||||||||||
| Ratio of expenses to average net assets, before waivers, reimbursements of previously waived expenses and expenses paid indirectly | 1.74 | % | 1.65 | % | 1.56 | % | 1.52 | % | 1.48 | % | ||||||||||
| Ratio of net investment income (loss) to average net assets, before waivers, reimbursements of previously waived expenses and expenses paid indirectly | 0.47 | % | 0.24 | % | (0.22 | )% | 0.31 | % | 0.54 | % | ||||||||||
| Portfolio turnover rate | 121 | % | 66 | % | 103 | % | 134 | % | 108 | % | ||||||||||
| (1) | Less than $0.01. |
| See notes to financial statements. |
42
FINANCIAL STATEMENTS |
MARSICO FLEXIBLE CAPITAL FUND | MARSICO GLOBAL FUND | |||||||||||||||||||||||||||||||||||||
Year Ended 9/30/13 | Year Ended 9/30/12 | Year Ended 9/30/11 | Year Ended 9/30/10 | Year Ended 9/30/09 | Year Ended 9/30/13 | Year Ended 9/30/12 | Year Ended 9/30/11 | Year Ended 9/30/10 | Year Ended 9/30/09 | |||||||||||||||||||||||||||||
| $ | 15.79 | $ | 12.05 | $ | 11.97 | $ | 9.65 | $ | 8.74 | $ | 11.51 | $ | 9.06 | $ | 9.90 | $ | 8.59 | $ | 8.87 | |||||||||||||||||||
| 0.04 | 0.03 | 0.08 | 0.27 | 0.06 | (0.02 | ) | (0.07 | ) | (0.05 | ) | (0.05 | ) | 0.04 | |||||||||||||||||||||||||
| 3.28 | 3.77 | 0.12 | 2.42 | 0.93 | 3.25 | 2.52 | (0.70 | ) | 1.42 | (0.24 | ) | |||||||||||||||||||||||||||
| 3.32 | 3.80 | 0.20 | 2.69 | 0.99 | 3.23 | 2.45 | (0.75 | ) | 1.37 | (0.20 | ) | |||||||||||||||||||||||||||
| (0.09 | ) | (0.06 | ) | (0.09 | ) | (0.37 | ) | (0.08 | ) | — | — | (0.09 | ) | (0.06 | ) | (0.08 | ) | |||||||||||||||||||||
| (0.81 | ) | — | (0.03 | ) | — | — | — | — | — | — | — | |||||||||||||||||||||||||||
| — | (1) | — | (1) | — | (1) | — | (1) | — | (1) | — | (1) | — | (1) | — | (1) | — | (1) | — | (1) | |||||||||||||||||||
| (0.90 | ) | (0.06 | ) | (0.12 | ) | (0.37 | ) | (0.08 | ) | — | — | (0.09 | ) | (0.06 | ) | (0.08 | ) | |||||||||||||||||||||
| $ | 18.21 | $ | 15.79 | $ | 12.05 | $ | 11.97 | $ | 9.65 | $ | 14.74 | $ | 11.51 | $ | 9.06 | $ | 9.90 | $ | 8.59 | |||||||||||||||||||
| 22.34 | % | 31.63 | % | 1.59 | % | 28.68 | % | 11.68 | % | 28.06 | % | 27.04 | % | (7.73 | )% | 16.01 | % | (1.93 | )% | |||||||||||||||||||
| $ | 805,735 | $ | 590,293 | $ | 409,145 | $ | 132,345 | $ | 31,331 | $ | 61,383 | $ | 54,195 | $ | 108,021 | $ | 116,101 | $ | 109,149 | |||||||||||||||||||
| 1.41 | % | 1.43 | % | 1.27 | % | 0.75 | % | 0.75 | % | 1.60 | % | 1.60 | % | 1.48 | % | 1.54 | % | 1.40 | % | |||||||||||||||||||
| 0.16 | % | 0.17 | % | 0.55 | % | 1.33 | % | 1.44 | % | (0.06 | )% | (0.32 | )% | (0.46 | )% | (0.57 | )% | 0.52 | % | |||||||||||||||||||
| 1.41 | % | 1.43 | % | 1.40 | % | 1.73 | % | 2.84 | % | 1.86 | % | 1.70 | % | 1.48 | % | 1.54 | % | 1.58 | % | |||||||||||||||||||
| 0.16 | % | 0.17 | % | 0.42 | % | 0.35 | % | (0.65 | )% | (0.32 | )% | (0.42 | )% | (0.46 | )% | (0.57 | )% | 0.34 | % | |||||||||||||||||||
| 145 | % | 121 | % | 231 | % | 146 | % | 259 | % | 134 | % | 95 | % | 93 | % | 125 | % | 185 | % | |||||||||||||||||||
43
NOTES TO FINANCIAL STATEMENTS |
NOTES TO FINANCIAL STATEMENTS September 30, 2013
| 1. | Organization |
The Marsico Investment Fund (the “Trust”) was organized on October 1, 1997, as a Delaware Statutory Trust and is registered under the Investment Company Act of 1940 (the “1940 Act”) as an open-end management investment company. The Focus Fund, Growth Fund, 21st Century Fund, International Opportunities Fund, Flexible Capital Fund, and Global Fund (collectively, the “Funds”) are separate investment portfolios of the Trust. The Focus Fund is a non-diversified fund and the Growth Fund, the 21st Century Fund, the International Opportunities Fund, the Flexible Capital Fund, and the Global Fund are diversified funds. The Focus Fund and Growth Fund commenced operations on December 31, 1997, the 21st Century Fund commenced operations on February 1, 2000, the International Opportunities Fund commenced operations on June 30, 2000, the Flexible Capital Fund commenced operations on December 29, 2006, and the Global Fund commenced operations on June 29, 2007. Trustees and officers of the Trust and employees of Marsico Capital Management, LLC (the “Adviser”) own approximately 8%, 5%, and 24% of the Focus Fund’s, International Opportunities Fund’s, and Global Fund’s outstanding shares, respectively, as of September 30, 2013.
| 2. | Significant Accounting Policies |
The following is a summary of significant accounting policies consistently followed by the Funds in the preparation of their financial statements. These policies are in conformity with Generally Accepted Accounting Principles (“GAAP”) for investment companies. The presentation of financial statements in conformity with GAAP requires management to make estimates and assumptions that affect the reported amounts of assets and liabilities at the date of the financial statements and the reported amounts of income and expenses during the reporting period. Actual results could differ from those estimates.
| (a) | Investment Valuation — A security traded on a recognized stock exchange is generally valued at the last sale price prior to the closing of the principal exchange on which the security is traded. Securities traded on NASDAQ generally will be valued at the NASDAQ Official Closing Price. If no sale price is reported on the valuation date, the most current bid price will generally be used, with the exception of short option positions which will generally utilize the most current ask price. Other securities for which over-the-counter market quotations are readily available are generally valued at the last sale price. Debt securities that will mature in more than 60 days are generally valued at their bid prices furnished by a pricing service approved by the Funds’ Board of Trustees and subject to review and determination of the appropriate price by the Adviser. Debt securities that will mature in 60 days or less are valued at amortized cost, if it approximates market value. Any securities for which market quotations are not readily available are valued at their fair value as determined in good faith by the Adviser in accordance with procedures established by, and under the general supervision of, the Funds’ Board of Trustees. The Funds may use pricing services to assist in determining market value. The Board of Trustees has authorized the use of a pricing service to assist the Funds in valuing certain equity securities listed or traded on foreign security exchanges in the Funds’ portfolios in certain circumstances where there is a significant change in the value of related US-traded securities, as represented by, for example, the S&P 500 Index. |
“Fair Value Measurements and Disclosures” (the “Fair Value Statement”) defines fair value, establishes a framework for measuring fair value in GAAP, and expands disclosures about fair value measurements. Under the Fair Value Statement, various inputs are used in determining the value of the Funds’ investments.
These inputs are summarized into three broad levels and described below:
| • | Level 1 – quoted prices in active markets for identical investments |
| • | Level 2 – other significant observable inputs (including quoted prices for similar investments, interest rates, and evaluated quotations obtained from pricing services) |
| • | Level 3 – significant unobservable inputs (including the Fund’s own assumptions in determining the fair value of investments). |
44
NOTES TO FINANCIAL STATEMENTS |
The inputs or methodology used for valuing investments are not an indication of the risk associated with investing in those investments. Changes in valuation techniques may result in transfers between the levels during the reporting period. The Funds recognize transfers between the levels as of the end of each reporting period. There were no transfers between each of the three levels during the reporting period. The following is a summary of the fair values of the Funds’ investments in each category and economic sector as of September 30, 2013:
Fund Investments by Major Security Type | Level 1 | Level 2 | Level 3 | Total | ||||||||||||
| Marsico Focus Fund | ||||||||||||||||
| Assets | ||||||||||||||||
| Common Stocks | ||||||||||||||||
| Consumer Discretionary | $ | 206,237,201 | $ | — | $ | — | $ | 206,237,201 | ||||||||
| Consumer Staples | 11,906,133 | — | — | 11,906,133 | ||||||||||||
| Energy | 30,985,113 | — | — | 30,985,113 | ||||||||||||
| Financials | 123,584,054 | — | — | 123,584,054 | ||||||||||||
| Health Care | 164,018,484 | — | — | 164,018,484 | ||||||||||||
| Industrials | 104,849,347 | — | — | 104,849,347 | ||||||||||||
| Information Technology | 145,305,975 | — | — | 145,305,975 | ||||||||||||
| Materials | 70,292,407 | — | — | 70,292,407 | ||||||||||||
| Short-term Investments | 5,465,259 | — | — | 5,465,259 | ||||||||||||
| $ | 862,643,973 | |||||||||||||||
| Marsico Growth Fund | ||||||||||||||||
| Assets | ||||||||||||||||
| Common Stocks | ||||||||||||||||
| Consumer Discretionary | $ | 161,939,536 | $ | — | $ | — | $ | 161,939,536 | ||||||||
| Consumer Staples | 7,881,627 | — | — | 7,881,627 | ||||||||||||
| Energy | 23,830,579 | — | — | 23,830,579 | ||||||||||||
| Financials | 65,679,119 | — | — | 65,679,119 | ||||||||||||
| Health Care | 74,077,078 | — | — | 74,077,078 | ||||||||||||
| Industrials | 82,112,742 | — | — | 82,112,742 | ||||||||||||
| Information Technology | 100,130,908 | — | — | 100,130,908 | ||||||||||||
| Materials | 40,894,184 | — | — | 40,894,184 | ||||||||||||
| Short-term Investments | 9,640,121 | — | — | 9,640,121 | ||||||||||||
| $ | 566,185,894 | |||||||||||||||
Marsico 21st Century Fund | ||||||||||||||||
| Assets | ||||||||||||||||
| Common Stocks | ||||||||||||||||
| Consumer Discretionary | $ | 83,621,999 | $ | — | $ | — | $ | 83,621,999 | ||||||||
| Consumer Staples | 20,222,004 | — | — | 20,222,004 | ||||||||||||
| Energy | 11,461,298 | — | — | 11,461,298 | ||||||||||||
| Financials | 22,858,373 | — | — | 22,858,373 | ||||||||||||
| Health Care | 40,059,501 | — | — | 40,059,501 | ||||||||||||
| Industrials | 51,060,186 | — | — | 51,060,186 | ||||||||||||
| Information Technology | 54,309,188 | — | — | 54,309,188 | ||||||||||||
| Materials | 24,186,276 | — | — | 24,186,276 | ||||||||||||
| Short-term Investments | 4,438,160 | — | — | 4,438,160 | ||||||||||||
| $ | 312,216,985 | |||||||||||||||
| Marsico International Opportunities Fund | ||||||||||||||||
| Assets | ||||||||||||||||
| Common Stocks | ||||||||||||||||
| Consumer Discretionary | $ | 39,630,044 | $ | — | $ | — | $ | 39,630,044 | ||||||||
| Consumer Staples | 11,456,475 | — | — | 11,456,475 | ||||||||||||
| Energy | 3,614,993 | — | — | 3,614,993 | ||||||||||||
| Financials | 13,810,747 | — | — | 13,810,747 | ||||||||||||
| Health Care | 7,155,564 | — | — | 7,155,564 | ||||||||||||
| Industrials | 12,958,020 | — | — | 12,958,020 | ||||||||||||
| Information Technology | 25,217,722 | — | — | 25,217,722 | ||||||||||||
| Materials | 3,580,313 | — | — | 3,580,313 | ||||||||||||
| Short-term Investments | 1,950,462 | — | — | 1,950,462 | ||||||||||||
| $ | 119,374,340 | |||||||||||||||
45
NOTES TO FINANCIAL STATEMENTS |
NOTES TO FINANCIAL STATEMENTS September 30, 2013 (continued)
Fund Investments by Major Security Type | Level 1 | Level 2 | Level 3 | Total | ||||||||||||
| Marsico Flexible Capital Fund | ||||||||||||||||
| Assets | ||||||||||||||||
| Common Stocks | ||||||||||||||||
| Consumer Discretionary | $ | 236,979,187 | $ | — | $ | — | $ | 236,979,187 | ||||||||
| Consumer Staples | 80,811,520 | — | — | 80,811,520 | ||||||||||||
| Financials | 91,894,020 | — | — | 91,894,020 | ||||||||||||
| Health Care | 80,573,997 | — | — | 80,573,997 | ||||||||||||
| Industrials | 79,396,172 | — | — | 79,396,172 | ||||||||||||
| Information Technology | 114,091,884 | — | — | 114,091,884 | ||||||||||||
| Materials | 57,505,016 | — | — | 57,505,016 | ||||||||||||
| Corporate Bonds | — | 23,476,806 | — | 23,476,806 | ||||||||||||
| International Bonds | — | 8,789,206 | — | 8,789,206 | ||||||||||||
| Preferred Stocks | 6,141,379 | — | — | 6,141,379 | ||||||||||||
| Warrants | 1,377,391 | — | — | 1,377,391 | ||||||||||||
| Short-term Investments | 41,047,003 | — | — | 41,047,003 | ||||||||||||
| $ | 822,083,581 | |||||||||||||||
| Marsico Global Fund | ||||||||||||||||
| Assets | ||||||||||||||||
| Common Stocks | ||||||||||||||||
| Consumer Discretionary | $ | 21,012,879 | $ | — | $ | — | $ | 21,012,879 | ||||||||
| Consumer Staples | 3,628,981 | — | — | 3,628,981 | ||||||||||||
| Energy | 1,950,547 | — | — | 1,950,547 | ||||||||||||
| Financials | 4,036,158 | — | — | 4,036,158 | ||||||||||||
| Health Care | 9,870,524 | — | — | 9,870,524 | ||||||||||||
| Industrials | 9,948,646 | — | — | 9,948,646 | ||||||||||||
| Information Technology | 7,519,311 | — | — | 7,519,311 | ||||||||||||
| Materials | 2,184,882 | — | — | 2,184,882 | ||||||||||||
| Telecommunication Services | 1,222,502 | — | — | 1,222,502 | ||||||||||||
| Short-term Investments | 1,076,151 | — | — | 1,076,151 | ||||||||||||
| $ | 62,450,581 | |||||||||||||||
| (b) | Expenses — The Funds are charged for those expenses that are directly attributable to each Fund, such as advisory and custodial fees. Expenses that are not directly attributable to a Fund are typically allocated among the Funds in proportion to their respective net assets and in some cases allocated based on other factors. The Funds’ expenses may be reduced by advisory fee waivers, brokerage credits and uninvested cash balances earning interest or credits. Such credits are included in “Less waiver of expenses and expenses paid indirectly” on the Statements of Operations. |
Brokerage commissions may be paid to certain brokers which reduce transfer agent fees and expenses. For the year ended September 30, 2013 the Funds received no such brokerage commission credits. The Funds received earnings credits on certain cash account balances which reduced transfer agent fees and expenses in the amount of $861, $629, $306, $120, $623, and $52 for the Focus Fund, Growth Fund, 21st Century Fund, International Opportunities Fund, Flexible Capital Fund, and Global Fund, respectively, for the year ended September 30, 2013. Brokerage commission credits and earnings credits are included in “Less waiver of expenses and expenses paid indirectly” on the Statements of Operations.
| (c) | Federal Income Taxes — Each Fund intends to comply with the requirements of the Internal Revenue Code necessary to continue to qualify as a regulated investment company and to make the requisite distributions of income to its shareholders which will be sufficient to relieve it from all or substantially all federal and state income taxes. Certain Funds may utilize earnings and profits on redemption of shares as part of the dividends paid deduction. |
| (d) | Distributions to Shareholders — Dividends from net investment income and net realized capital gains, if any, will be declared and paid at least annually. Distributions to shareholders are recorded on the ex-dividend date. Each Fund may periodically make reclassifications among certain of its capital accounts as a result of the timing and characterization of certain income and capital gains distributions determined in accordance with federal tax regulations, which may differ from GAAP. These reclassifications are due to differing treatment for items such as foreign currency transactions, passive foreign investment companies (“PFICs”) and net investment losses. |
46
NOTES TO FINANCIAL STATEMENTS |
| (e) | Foreign Currency Translation — The accounting records of the Funds are maintained in US dollars. Values of securities denominated in foreign currencies are translated into US dollars at 4:00 p.m. Eastern Time. Amounts related to the purchase and sale of foreign securities and investment income are translated at the rates of exchange prevailing on the respective dates of such transactions. |
Reported realized gains on foreign currency transactions arise from sales of portfolio securities, forward foreign currency contracts, currency gains or losses realized between the trade and settlement dates on securities transactions, and the difference between the amounts of dividends, interest, and foreign withholding taxes recorded on the Funds’ books and the US dollar equivalent of the amounts actually received or paid.
The Funds do not isolate that portion of the results of operations resulting from changes in foreign exchange rates on investments from the fluctuations arising from changes in market prices of securities held at the end of the reporting period. Net unrealized appreciation or depreciation on investments and foreign currency translations arise from changes in the value of assets and liabilities, including investments in securities at the end of the reporting period, resulting from changes in the exchange rates and changes in market prices of securities held. Transactions in foreign-denominated assets may involve greater risks than domestic transactions, including currency risk, political and economic risk, regulatory risk and market risk.
| (f) | Derivative Instruments — “Disclosure about Derivative Instruments and Hedging Activities” (the “Derivatives Statement”) requires enhanced disclosures about the Funds’ derivative and hedging activities, including how such activities are accounted for and their effects on the Funds’ financial position, performance and cash flows. |
The Funds are not intended as vehicles for investing substantially in derivative instruments, and may hold derivative instruments only infrequently. The Funds enter into derivative instruments in order to increase exposure to certain investments, asset classes, or markets, or for hedging purposes to hedge against adverse movements in securities prices, currency rates or interest rates. The Funds can hold various types of derivates instruments such as futures contracts and options on securities, financial indexes, and foreign currencies, options on futures, forward foreign currency contracts, interest rate swaps, credit default swaps, and swap-related products. The use of derivative instruments may involve risks such as the possibility of illiquid markets or imperfect correlation between the value of the derivative instruments and the underlying securities, or that the counterparty will fail to perform its obligations.
There were no outstanding derivative instruments held by the Funds as of September 30, 2013 nor did the Funds utilize derivative instruments during the year ended September 30, 2013. The limited use of derivative instruments by the Funds during the year ended September 30, 2012 was related to the use of forward foreign currency contracts in the International Opportunities Fund and purchased index option contracts for the Flexible Capital Fund, each of which did not have a significant impact on each Fund’s respective performance during the 2012 reporting period. The following tables provide information about the effects of the derivative instruments on the Statements of Operations for the International Opportunities Fund and Flexible Capital Fund, as appropriate, for the year ended September 30, 2012.
The effects of derivative instruments on the Statements of Operations for the period October 1, 2011 through September 30, 2012 (amounts in thousands):
Amount of Realized Gain (Loss) on Derivatives | |||||||||||||||||
Marsico Fund | Derivatives Not Accounted for as Hedging Instruments | Purchased Options | Written Options | Forward Foreign Currency Contracts | Total | ||||||||||||
| International Opportunities Fund | Forward Foreign Currency Contracts | N/A | N/A | $ | (573 | ) | $ | (573 | ) | ||||||||
| Total | N/A | N/A | $ | (573 | ) | $ | (573 | ) | |||||||||
| Flexible Capital Fund | Index contracts | $ | (1,809 | ) | N/A | N/A | $ | (1,809 | ) | ||||||||
| Total | $ | (1,809 | ) | N/A | N/A | $ | (1,809 | ) | |||||||||
Change in Unrealized Appreciation (Depreciation) on Derivatives | ||||||
Marsico Fund | Derivatives Not Accounted for as Hedging Instruments | Forward Foreign Currency Contracts | ||||
| International Opportunities Fund | Forward Foreign Currency Contracts | $ | 573 | |||
| Total | $ | 573 | ||||
47
NOTES TO FINANCIAL STATEMENTS |
NOTES TO FINANCIAL STATEMENTS September 30, 2013 (continued)
Forward Foreign Currency Contracts — A forward currency contract is a commitment to purchase or sell foreign currency at a specified price on a future date. The Funds may enter into a forward foreign currency contract in order to hedge against foreign currency fluctuations, such as when a Fund elects to reduce exposure to changes in foreign currency exchange rates on foreign portfolio holdings denominated in or exposed to foreign currencies, or in preparation for purchasing securities in a particular market, or for other investment purposes.
The market value of a forward foreign currency contract fluctuates with changes in currency exchange rates. Outstanding forward foreign currency contracts are valued daily at current market rates and the resulting change in market value is recorded as unrealized appreciation or depreciation. When a forward foreign currency contract is settled, the Fund records a realized gain or loss equal to the difference between the value at the time the forward foreign currency contract was opened and the value at the time it was settled.
The Funds are subject to foreign currency exchange risk in the normal course of pursuing their investment objectives. Forward foreign currency contracts may involve market risk in excess of the unrealized gain or loss reflected on the Statements of Assets and Liabilities. In addition, the Funds could be exposed to a credit risk if the counterparties are unable or unwilling to meet the terms of the contracts or if the value of the foreign currency changes unfavorably. In connection with these contracts, the Funds typically segregate cash and/or other securities as collateral in a sufficient value equal to the aggregate amount of the Funds’ commitments under the forward foreign currency contracts; such collateral would be in the possession of the Funds’ custodian, if applicable.
Options Contracts — The Funds may purchase or write (sell) put and call options on foreign and domestic stock indices, foreign currencies, and US and foreign securities that are traded on a securities exchange or an over-the-counter market. These transactions are generally for hedging purposes or for the purpose of earning additional income. In addition, the Funds may enter into such transactions for cross-hedging purposes. There is generally limited counterparty credit risk involved when entering into exchange-traded option contracts because the exchange’s clearinghouse, as counterparty to all exchange-traded options, guarantees the options against default.
The risk associated with purchasing an option is that the Fund pays a premium whether or not the option is exercised. Additionally, the Fund bears the risk of loss of premium and change in market value should the counterparty not perform under the contract. Put and call options purchased are accounted for in the same manner as portfolio securities. The cost of securities acquired through the exercise of call options is increased by premiums paid. The proceeds from securities sold through the exercise of put options are decreased by the premiums paid.
When a Fund writes an option, the premium received by the Fund is recorded as a liability and is subsequently adjusted to the current market value of the option written. Premiums received from writing options that expire are recorded by the Fund on the expiration date as realized gains from option transactions. The difference between the premium and the amount paid on effecting a closing purchase transaction, including brokerage commissions, is also treated as a realized gain, or if the premium is less than the amount paid for the closing purchase transaction, as a realized loss. If a call option is exercised, the premium is added to the proceeds from the sale of the underlying security or currency in determining whether the Fund has realized a gain or loss. If a put option is exercised, the premium reduces the cost basis of the security or currency purchased by the Fund. In writing an option, the Fund bears the market risk of an unfavorable change in the price of the security or currency underlying the written option. Exercise of an option written by the Fund could result in the Fund selling or buying a security or currency at a price different from the current market value.
48
NOTES TO FINANCIAL STATEMENTS |
| (g) | Trustees’ Deferred Fee Plan — Effective February 1, 2000, the Board of Trustees adopted the Marsico Investment Fund Deferred Fee Plan (the “Deferred Fee Plan”), amended and restated as of December 30, 2005, which allows the Trustees to defer the receipt of all or a portion of their compensation received from the Funds. Any deferred fees are credited to accounts established on behalf of the Trustees into the Funds as directed by each Trustee. The amounts credited to these accounts increase or decrease in accordance with the performance of the Funds selected by the Trustees. The market value of the deferred account balances as of September 30, 2013 is shown on the Statements of Assets and Liabilities as part of an asset account, “Prepaid expenses and other assets”, and a liability account, “Accrued trustees’ fees”. Additionally, the fluctuation of the account balances due to the Funds’ performance is recorded by the Funds as unrealized appreciation (depreciation) which is shown as part of “Net unrealized appreciation on investments and foreign currency translations” on the Statements of Assets and Liabilities and as compensation expense which is shown as part of the expense account “Trustees’ fees and expenses” on the Statements of Operations. Fees earned and deferred by the Trustees for the year ended September 30, 2013 are also included in “Trustees’ fees and expenses” on the Statements of Operations. Amounts contributed to the Deferred Fee Plan will be deferred until distributed in accordance with the Deferred Fee Plan. Unrealized appreciation (depreciation) of Fund shares held in the Deferred Fee Plan is subject to the Funds’ expense reimbursement agreement with the Adviser. |
| (h) | Redemption Fee — A 2.00% redemption fee is retained by the Funds to offset transaction costs and other expenses associated with short-term investing. The fee is imposed on certain redemptions or exchanges of shares held 30 days or less from their purchase date. Redemption fees are recorded by the Funds as a reduction of shares redeemed and as a credit to paid-in-capital. For the year ended September 30, 2013, the Focus Fund, Growth Fund, 21st Century Fund, International Opportunities Fund, Flexible Capital Fund, and Global Fund received $10,542, $8,826, $2,393, $753, $51,779, and $284, respectively, in redemption fees. |
| (i) | Other — Investment transactions are accounted for on a trade date basis. Each Fund determines the gain or loss realized from the investment transactions by comparing the original cost of the security lot sold with the net sale proceeds. Dividend income is recognized on the ex-dividend date. Certain dividends from foreign securities will be recorded as soon as the Trust is informed of the dividend if such information is obtained subsequent to the ex-dividend date. Interest income is recognized on an accrual basis and includes amortization of premiums and accretion of discounts. |
| (j) | Indemnifications — In the normal course of business, the Funds enter into contracts that contain provisions indemnifying other parties against specified potential liabilities. Each Fund’s maximum exposure under these arrangements is unknown as this would involve future claims that may be made against the Fund that have not yet occurred. However, based on experience, the Funds expect the risk of loss to be remote. |
| 3. | Investment Advisory Agreement and Transactions With Affiliates |
Each Fund has an agreement with the Adviser to furnish investment advisory services to the Funds. Under the terms of these agreements, the Adviser is compensated for managing the Focus Fund and the Growth Fund at the rate of 0.85% per year of average daily net assets up to $3 billion in each Fund, and 0.75% per year of average daily net assets exceeding $3 billion in each Fund; and at a rate of 0.85% of the average daily net assets of the 21st Century Fund, the International Opportunities Fund, the Flexible Capital Fund, and the Global Fund. The Adviser has entered into a written expense limitation and fee waiver agreement under which it has agreed to limit the total expenses of each Fund (excluding interest, taxes, acquired fund fees and expenses, litigation, brokerage, and extraordinary expenses) to an annual rate of 1.60% of the average net assets of the Focus Fund, the International Opportunities Fund, the Flexible Capital Fund, and the Global Fund, and 1.50% of the average net assets of the Growth Fund and the 21st Century Fund until January 31, 2014.
The Adviser is entitled to reimbursement from a Fund of any amounts waived pursuant to this arrangement (or a previous expense limitation agreement) if such reimbursement does not cause a Fund to exceed the expense limitation currently in effect and the reimbursement is made within three years after the year in which the Adviser waived the fee or reimbursed the expense. As of September 30, 2013, reimbursements that may potentially be made by the International Opportunities Fund and Global Fund to the Adviser are $238,907 and $209,187, respectively, which expire between 2015 and 2016.
Certain officers of the Trust are also officers of the Adviser. The Funds pay a portion of the Chief Compliance Officer’s total compensation costs which is shown as part of the expense account “Professional fees” on the Statements of Operations. No other officers of the Trust affiliated with the Adviser received compensation from the Funds.
49
NOTES TO FINANCIAL STATEMENTS |
NOTES TO FINANCIAL STATEMENTS September 30, 2013 (continued)
| 4. | Service and Distribution Plan |
The Funds have adopted a Service and Distribution Plan (the “Plan”) pursuant to Rule 12b-1 under the 1940 Act. The Plan authorizes payments by the Funds in connection with the distribution of their shares at an annual rate, as determined from time to time by the Board of Trustees, of up to 0.25% of a Fund’s average daily net assets. The Adviser may, out of its own resources and at its sole discretion, make certain payments on behalf of the Plan for expenses incurred by a Fund for distribution of Fund shares and related services.
| 5. | Investment Transactions |
The aggregate purchases and sales of securities, excluding short-term investments, for the Funds for the year ended September 30, 2013, were as follows:
(Amounts in thousands) | Focus Fund | Growth Fund | 21st Century Fund | International Opportunities Fund | Flexible Capital Fund | Global Fund | ||||||||||||||||||
| Purchases | $ | 777,979 | $ | 683,584 | $ | 312,111 | $ | 140,552 | $ | 1,010,830 | $ | 70,986 | ||||||||||||
| Sales | $ | 1,034,394 | $ | 906,866 | $ | 421,064 | $ | 175,854 | $ | 897,234 | $ | 75,246 | ||||||||||||
There were no purchases or sales of US government securities, excluding short-term investments.
| 6. | Federal Income Tax Information |
Accounting for Uncertainty in Income Taxes (the “Income Tax Statement”) requires an evaluation of tax positions taken (or expected to be taken) in the course of preparing a Fund’s tax returns to determine whether these positions meet a “more-likely-than-not” standard that, based on the technical merits, have a more than fifty percent likelihood of being sustained by a taxing authority upon examination. A tax position that meets the “more-likely-than-not” recognition threshold is measured to determine the amount of benefit to recognize in the financial statements. The Funds recognize interest and penalties, if any, related to unrecognized tax benefits as income tax expense in the Statements of Operations.
The Income Tax Statement requires management of the Funds to analyze all open tax years, fiscal years 2010-2013 as defined by IRS statute of limitations for all major jurisdictions, including federal tax authorities and certain state tax authorities. As of and during the year ended September 30, 2013, the Funds did not have a liability for any unrecognized tax benefits. The Funds have no examinations in progress and are not aware of any tax positions for which it is reasonably possible that the total amounts of unrecognized tax benefits will significantly change in the next twelve months.
At September 30, 2013 gross unrealized appreciation and depreciation of investments, based on cost for federal income tax purposes were as follows:
(Amounts in thousands) | Focus Fund | Growth Fund | 21st Century Fund | International Opportunities Fund | Flexible Capital Fund | Global Fund | ||||||||||||||||||
| Cost of Investments | $ | 626,150 | $ | 414,963 | $ | 231,445 | $ | 99,059 | $ | 702,441 | $ | 48,551 | ||||||||||||
| Gross Unrealized Appreciation | $ | 238,105 | $ | 152,979 | $ | 80,878 | $ | 20,523 | $ | 119,746 | $ | 13,960 | ||||||||||||
| Gross Unrealized Depreciation | (1,611 | ) | (1,756 | ) | (106 | ) | (208 | ) | (103 | ) | (60 | ) | ||||||||||||
| Net Unrealized Appreciation on Investments | $ | 236,494 | $ | 151,223 | $ | 80,772 | $ | 20,315 | $ | 119,643 | $ | 13,900 | ||||||||||||
The difference between cost amounts for financial statement and federal income tax purposes is due primarily to wash sale loss deferrals.
50
NOTES TO FINANCIAL STATEMENTS |
At September 30, 2013, the Funds had accumulated capital loss carryforwards (in thousands) as follows:
(Amounts in thousands) | Focus Fund | Growth Fund | 21st Century Fund | International Opportunities Fund | Flexible Capital Fund | Global Fund | ||||||||||||||||||
| For Losses Expiring September 30, | ||||||||||||||||||||||||
| 2017 | $ | — | $ | — | $ | 118,543 | $ | 18,872 | $ | — | $ | — | ||||||||||||
| 2018 | — | — | 390,537 | 93,558 | — | — | ||||||||||||||||||
| Not Subject to Expiration | — | — | — | — | — | — | ||||||||||||||||||
| $ | — | $ | — | $ | 509,080 | $ | 112,430 | $ | — | $ | — | |||||||||||||
To the extent that a Fund may realize future net capital gains, those gains will be offset by any of its unused capital loss carryforward. Future capital loss carryover utilization in any given year may be subject to Internal Revenue Code limitations.
Under the Regulated Investment Company Modernization Act of 2010, the Funds are permitted to carryforward capital losses incurred in taxable years beginning after December 22, 2010 for an unlimited period. However, any losses incurred during those future taxable years will be required to be utilized prior to the losses incurred in pre-enactment taxable years. As a result of this ordering rule, pre-enactment capital loss carryforwards may be more likely to expire unused. Additionally, post-enactment capital losses that are carried forward will retain their character as either short-term or long-term capital losses rather than being considered all short-term as under previous law.
As of September 30, 2013, the Focus Fund, Growth Fund, 21st Century Fund, International Opportunities Fund, Flexible Capital Fund, and Global Fund, respectively, had (in thousands) $550, $1,254, $1,616, $0, $53, and $0 of qualified late-year losses, which are deferred until fiscal year 2014 for tax purposes. Net late-year losses incurred after December 31st, and within the taxable year are deemed to arise on the first day of the Fund’s next taxable year.
The Focus Fund, Growth Fund, 21st Century Fund, International Opportunities Fund, Flexible Capital Fund, and Global Fund utilized (in thousands) $0, $0, $75,161, $20,611, $0, and $4,665, respectively, of its capital loss carryforwards, during the year ended September 30, 2013.
As of September 30, 2013, the components of accumulated earnings (deficit) on a tax basis were as follows:
(Amounts in thousands) | Focus Fund | Growth Fund | 21st Century Fund | International Opportunities Fund | Flexible Capital Fund | Global Fund | ||||||||||||||||||
| Undistributed Ordinary Income | $ | 13,018 | $ | 24,012 | $ | — | $ | 741 | $ | 31,563 | $ | — | ||||||||||||
| Undistributed Trustees’ Deferred Compensation | (1,624 | ) | (989 | ) | (691 | ) | (298 | ) | (598 | ) | (272 | ) | ||||||||||||
| Undistributed Long-Term Capital Gains | 118,241 | 88,145 | — | — | 44,555 | 8,814 | ||||||||||||||||||
| Tax Accumulated Earnings (Deficit) | 129,635 | 111,168 | (691 | ) | 443 | 75,520 | 8,542 | |||||||||||||||||
| Accumulated Capital and Other Losses | (550 | ) | (1,254 | ) | (510,696 | ) | (112,430 | ) | (53 | ) | — | |||||||||||||
| Unrealized Appreciation on Investments and on Foreign Currency Translations | 236,494 | 151,221 | 80,772 | 20,331 | 119,648 | 13,902 | ||||||||||||||||||
| Trustees Deferred Compensation Mark to Market | 339 | 227 | 198 | 82 | 445 | 226 | ||||||||||||||||||
| Total Accumulated Earnings (Deficit) | $ | 365,918 | $ | 261,362 | $ | (430,417 | ) | $ | (91,574 | ) | $ | 195,560 | $ | 22,670 | ||||||||||
Undistributed ordinary income (deficit) consists of net investment income and timing differences related to qualified late-year losses and PFICs.
51
NOTES TO FINANCIAL STATEMENTS |
NOTES TO FINANCIAL STATEMENTS September 30, 2013 (continued)
The tax character of distributions paid during the fiscal years ended September 30, 2013 and 2012 were as follows:
| (Amounts in thousands) | 2013 | 2012 | ||||||||||||||
Fund | Ordinary Income | Long-Term Capital Gains | Ordinary Income | Long-Term Capital Gains | ||||||||||||
| Focus Fund | $ | 1,177 | $ | 101,796 | $ | — | $ | — | ||||||||
| Growth Fund | 5,395 | 30,178 | 292 | — | ||||||||||||
21st Century Fund | — | — | — | — | ||||||||||||
| International Opportunities Fund | — | — | — | — | ||||||||||||
| Flexible Capital Fund | 10,360 | 22,646 | 1,878 | — | ||||||||||||
| Global Fund | — | — | — | — | ||||||||||||
The tax character of dividends paid may differ from that shown in the Statements of Changes in Net Assets due to short-term gains being treated as ordinary income for tax purposes.
| 7. | Subsequent Events |
Management of the Adviser has determined that there were no material events that would require disclosure in the Funds’ financial statements.
| 8. | New Accounting Pronouncements |
In January 2013, the Financial Accounting Standards Board (“FASB”) issued Accounting Standards Update (“ASU”) No. 2013-01 “Clarifying the Scope of Disclosures about Offsetting Assets and Liabilities”. This update gives additional clarification to the FASB’s ASU No. 2011-11 “Disclosures about Offsetting Assets and Liabilities”. The amendments in these ASUs require an entity to disclose information about offsetting and related arrangements to enable users of its financial statements to understand the effect of those arrangements on its financial position. The ASUs are effective for annual reporting periods beginning on or after January 1, 2013, and interim periods within those annual periods. The guidance requires retrospective application for all comparative periods presented. The Adviser is currently evaluating the impact the adoption of these ASUs may have on the Funds’ financial statement disclosures.
52
REPORT OF INDEPENDENT REGISTERED PUBLIC ACCOUNTING FIRM |
REPORT OF INDEPENDENT REGISTERED PUBLIC ACCOUNTING FIRM
To the Board of Trustees and Shareholders of The Marsico Investment Fund
In our opinion, the accompanying statements of assets and liabilities, including the schedules of investments, and the related statements of operations and of changes in net assets and the financial highlights present fairly, in all material respects, the financial position of Marsico Focus Fund, Marsico Growth Fund, Marsico 21st Century Fund, Marsico International Opportunities Fund, Marsico Flexible Capital Fund, and Marsico Global Fund (six of the funds constituting The Marsico Investment Fund, hereafter referred to as the “Funds”) at September 30, 2013 and the results of each of their operations for the year then ended, the changes in each of their net assets for each of the two years in the period then ended and the financial highlights for each of the five years in the period then ended, in conformity with accounting principles generally accepted in the United States of America. These financial statements and financial highlights (hereafter referred to as “financial statements”) are the responsibility of the Funds’ management; our responsibility is to express an opinion on these financial statements based on our audits. We conducted our audits of these financial statements in accordance with the standards of the Public Company Accounting Oversight Board (United States). Those standards require that we plan and perform the audit to obtain reasonable assurance about whether the financial statements are free of material misstatement. An audit includes examining, on a test basis, evidence supporting the amounts and disclosures in the financial statements, assessing the accounting principles used and significant estimates made by management, and evaluating the overall financial statement presentation. We believe that our audits, which included confirmation of securities at September 30, 2013 by correspondence with the custodian and brokers, provide a reasonable basis for our opinion.

Denver, Colorado
November 13, 2013
53
EXPENSE EXAMPLE |
EXPENSE EXAMPLE For the six-month period ended September 30, 2013 (Unaudited)
As a shareholder of the Marsico Funds (the “Funds”), you incur two types of costs: (1) transaction costs, including redemption fees on certain redemptions; and (2) ongoing costs, including management fees, distribution (12b-1) fees, and other Fund expenses. This Example is intended to help you understand your ongoing costs (in dollars) of investing in the Funds and to compare these costs with the ongoing costs of investing in other mutual funds.
The Example is based on an investment of $1,000 invested at the beginning of the period and held for the entire period from April 1, 2013 to September 30, 2013 (the “period”).
| Actual Expenses |
The first line of the table below provides information about actual account values and actual expenses. You may use the information in this line, together with the amount you invested, to estimate the expenses you paid over the period. Simply divide your account value by $1,000 (for example, an $8,600 account value divided by $1,000 equals 8.6), then multiply the result by the number in the first line under the heading entitled “Expenses paid for the six-month period ended September 30, 2013” to estimate the expenses you paid on your account during the period.
| Hypothetical Example for Comparison Purposes |
The second line of the table below provides information about hypothetical account values and hypothetical expenses based on the Funds’ actual expense ratios and an assumed rate of return of 5% per year before expenses, which is not the actual return of any of the Funds. The hypothetical account values and expenses may not be used to estimate the actual ending account balance or expenses you paid for the period. You may use this information to compare the ongoing costs of investing in the Funds and other funds. To do so, compare this 5% hypothetical example with the 5% hypothetical examples that appear in the shareholder reports of other funds.
Please note that the expenses shown in the table are meant to highlight your ongoing costs only and do not reflect any transactional costs, such as redemption fees. Therefore, the second line of the table is useful in comparing the ongoing costs only, and will not help you determine the relative total costs of owning different funds. In addition, if these transactional costs were included, your costs could have been higher.
| Expenses Paid During the Period | Beginning account value April 1, 2013 | Ending account value September 30, 2013 | Expenses paid for the six-month period ended September 30, 2013(1) | |||||||||
| FOCUS FUND | ||||||||||||
| Actual Example | $ | 1,000.00 | $ | 1,111.30 | $ | 7.07 | ||||||
| Hypothetical Example, assuming a 5% return before expenses | $ | 1,000.00 | $ | 1,018.30 | $ | 6.76 | ||||||
| GROWTH FUND | ||||||||||||
| Actual Example | $ | 1,000.00 | $ | 1,114.40 | $ | 7.23 | ||||||
| Hypothetical Example, assuming a 5% return before expenses | $ | 1,000.00 | $ | 1,018.16 | $ | 6.90 | ||||||
21st CENTURY FUND | ||||||||||||
| Actual Example | $ | 1,000.00 | $ | 1,167.50 | $ | 7.88 | ||||||
| Hypothetical Example, assuming a 5% return before expenses | $ | 1,000.00 | $ | 1,017.73 | $ | 7.34 | ||||||
| INTERNATIONAL OPPORTUNITIES FUND | ||||||||||||
| Actual Example | $ | 1,000.00 | $ | 1,103.90 | $ | 8.44 | ||||||
| Hypothetical Example, assuming a 5% return before expenses | $ | 1,000.00 | $ | 1,016.98 | $ | 8.09 | ||||||
| FLEXIBLE CAPITAL FUND | ||||||||||||
| Actual Example | $ | 1,000.00 | $ | 1,131.10 | $ | 7.60 | ||||||
| Hypothetical Example, assuming a 5% return before expenses | $ | 1,000.00 | $ | 1,017.87 | $ | 7.20 | ||||||
| GLOBAL FUND | ||||||||||||
| Actual Example | $ | 1,000.00 | $ | 1,167.10 | $ | 8.69 | ||||||
| Hypothetical Example, assuming a 5% return before expenses | $ | 1,000.00 | $ | 1,016.98 | $ | 8.09 | ||||||
| (1) | Expenses are equal to the Funds’ annualized expense ratios (1.336% for the Focus Fund, 1.364% for the Growth Fund, 1.450% for the 21st Century Fund, 1.600% for the International Opportunities Fund, 1.423% for the Flexible Capital Fund, and 1.600% for the Global Fund), multiplied by the average account value over the period, multiplied by 183/365 (to reflect the six-month period). |
54
OTHER INFORMATION |
OTHER INFORMATION (Unaudited) |
| Proxy Voting Guidelines |
The Funds exercise the voting rights associated with the securities held by the Funds under the proxy voting policy of the Funds. A description of those policies and procedures of the Funds and a record of the Funds’ proxy votes for the one-year period ended June 30, 2013 are available without charge, upon request, by calling 888-860-8686. It is also available on the Securities and Exchange Commission’s (SEC) website at www.sec.gov.
| Quarterly Filing of Portfolio Holdings |
The Funds will file their complete schedule of investments with the SEC for the first and third quarters of each fiscal year on Form N-Q. The Funds’ Form N‑Q will be available (i) on the SEC’s website at www.sec.gov; (ii) at the SEC’s Public Reference Room; and (iii) by calling 800-SEC-0330.
| Other Tax Information |
| Corporate Dividends Received Deduction |
For the fiscal year ended September 30, 2013, 100%, 100%, 0%, 0%, 43.73%, and 0% of the dividends paid from net investment income qualifies for the dividends received deduction available to corporate shareholders of the Focus Fund, Growth Fund, 21st Century Fund, International Opportunities Fund, Flexible Capital Fund, and Global Fund, respectively.
| Qualified Dividend Income and Long-Term Capital Gains |
Pursuant to Section 854 of the Internal Revenue Code of 1986, the Focus Fund, Growth Fund, 21st Century Fund, International Opportunities Fund, Flexible Capital Fund, and Global Fund designate income dividends (in thousands) of $1,177, $5,395, $0, $0, $6,527, and $0, respectively, as qualified dividend income paid during the fiscal year ended September 30, 2013.
For the fiscal year ended September 30, 2013, the Focus Fund, Growth Fund, Flexible Capital Fund and Global Fund designate (in thousands) $111,699, $38,791, $28,585 and $257, respectively, as long-term capital gain dividends for the purpose of the dividends paid deduction. These amounts include earnings and profits distributed to shareholders on the redemption of shares. For income tax purposes, the Funds may utilize earnings and profits distributed to shareholders on the redemption of shares as part of the dividends paid deduction.
| Foreign Taxes Paid |
Pursuant to the foreign tax credit election under Section 853 of the Internal Revenue Code of 1986, the International Opportunities Fund designates (in thousands) $923 of income derived from foreign sources and $182 of foreign taxes paid, for the year ended September 30, 2013.
Of the ordinary income (including short-term capital gain) distributions made during the year ended September 30, 2013, the proportionate share of income derived from foreign sources and foreign taxes paid attributable to one share of stock are:
Foreign Source Income | Foreign Taxes Paid | |
| International Opportunities Fund | $0.1181 | $0.0232 |
| Cost Basis Information |
Effective January 1, 2012, federal law required mutual fund companies to maintain and report a shareholder’s cost basis by tax lot, gain/loss information, and holding period of “covered” security sales to the Internal Revenue Service (“IRS”) on Form 1099. Covered securities, that are mutual fund shares, are shares acquired on or after January 1, 2012. A fund is not responsible for maintaining and reporting share information if such shares are not deemed “covered”.
Additionally, if a shareholder had not selected a tax lot identification method for their account, these tax regulations required the Funds to elect a default tax identification methodology in order to perform the required reporting. As a result, the Funds have chosen the first-in-first-out (“FIFO”) method as the default tax lot identification method for those shareholders that had not previously selected a tax lot identification method for their account. FIFO is the method, unless otherwise specified by the shareholder, that the Funds utilize to determine which specific shares are deemed to be sold when a shareholder’s entire position is not sold in a single transaction and is the method in which “covered” share sales are reported on a shareholder’s Form 1099.
However, at the time of purchase or upon the sale of “covered” shares, shareholders may choose a different tax lot identification method other than FIFO. Shareholders should consult a tax advisor with regard to their personal circumstances as the Funds and their service providers do not provide tax advice.
55
TRUSTEE AND OFFICER INFORMATION |
TRUSTEE AND OFFICER INFORMATION INDEPENDENT TRUSTEES
Name, Address and Age | Position(s) Held with the Trust | Term of Office(1) and Length of Time Served | Principal Occupation(s) During Past 5 Years | Number of Portfolios in Fund Complex Overseen by Trustee | Other Directorships Held by Trustee |
Jay S. Goodgold 1200 17th Street Suite 1600 Denver, CO 80202 DOB: 1954 | Trustee | Since February 2006; Lead Independent Trustee (since November 2010) | Private investor (July 2003 - present); Managing Director, Goldman, Sachs & Co. (August 1978 ‑ June 2003). | 6 | None |
Elizabeth Hoffman 1200 17th Street Suite 1600 Denver, CO 80202 DOB: 1946 | Trustee | Since February 2006 | Professor of Economics (January 2007 - present) and Executive Vice President and Provost (January 2007 ‑ July 2012), Iowa State University; President Emerita, University of Colorado (August 2005 - present). | 6 | None |
Walter A. Koelbel, Jr. 1200 17th Street Suite 1600 Denver, CO 80202 DOB: 1952 | Trustee | Since December 1997 | President, and other positions, Koelbel and Company (full service real estate, development, investment, and management company) (more than five years). | 6 | None |
Michael D. Rierson 1200 17th Street Suite 1600 Denver, CO 80202 DOB: 1952 | Trustee | Since November 1998 | Senior Vice President for Development, Colonial Williamsburg Foundation (January 2011 - present); Vice President and Vice Chancellor for University Advancement at the University of Houston and UH System, respectively (November 2005 ‑ December 2010). | 6 | None |
Bruce E. Stangle 1200 17th Street Suite 1600 Denver, CO 80202 DOB: 1948 | Trustee | Since May 2010 | Chairman, Analysis Group, Inc. (economic consulting) (more than five years). | 6 | Director, Wellington Trust Company (Since 2001) |
Joseph T. Willett 1200 17th Street Suite 1600 Denver, CO 80202 DOB: 1951 | Trustee | Since November 2002 | Private investor (2002 - present); Chief Operating Officer, Merrill Lynch Europe (1998 ‑ 2002). | 6 | None |
| (1) | Each Trustee serves an indefinite term until the election of a successor. Each Officer serves an indefinite term, renewed annually, until the election of a successor. |
The Statement of Additional Information includes additional information about the Trustees and is available upon request, without charge, by calling 888-860-8686 or visit www.marsicofunds.com. |
56
TRUSTEE AND OFFICER INFORMATION |
TRUSTEE AND OFFICER INFORMATION INTERESTED TRUSTEES AND OFFICERS
Name, Address and Age | Position(s) Held with the Trust | Term of Office(1) and Length of Time Served | Principal Occupation(s) During Past 5 Years | Number of Portfolios in Fund Complex Overseen by Trustee | Other Directorships Held by Trustee |
Thomas F. Marsico(2) 1200 17th Street Suite 1600 Denver, CO 80202 DOB: 1955 | Trustee, President and Chief Executive Officer | Since December 1997 | Chief Executive Officer, Marsico Capital Management, LLC (more than five years). | 6 | None |
Christopher J. Marsico(2) 1200 17th Street Suite 1600 Denver, CO 80202 DOB: 1961 | Trustee, Executive Vice President and Chief Operating Officer | Trustee (August 2007 – March 2010 and since May 2010); Vice President and Treasurer (September 2002 ‑ May 2010); Executive Vice President and Chief Operating Officer (since May 2010) | President, Marsico Capital Management, LLC (more than five years). | 6 | None |
Neil L. Gloude, CPA 1200 17th Street Suite 1600 Denver, CO 80202 DOB: 1961 | Vice President, Secretary and Treasurer | Vice President and Secretary (Since May 2008); Treasurer (since May 2010) | Executive Vice President, Chief Financial Officer and Treasurer, Marsico Capital Management, LLC (September 2007 ‑ present); Partner, PricewaterhouseCoopers LLP (public accounting firm) (January 1999 ‑ August 2007). | N/A | N/A |
David C. Price, CPA 1200 17th Street Suite 1600 Denver, CO 80202 DOB: 1969 | Chief Compliance Officer | Since August 2004 | Chief Compliance Officer, The Marsico Investment Fund, and Director of Compliance, Marsico Capital Management, LLC (more than five years). | N/A | N/A |
Sander M. Bieber 1775 I Street, N.W. Washington, D.C. 20006 DOB: 1950 | Assistant Secretary | Since December 1997 | Partner, Dechert LLP (law firm) (more than five years). | N/A | N/A |
| (1) | Each Trustee serves an indefinite term until the election of a successor. Each Officer serves an indefinite term, renewed annually, until the election of a successor. |
| (2) | Mr. Thomas Marsico and Mr. Christopher Marsico are considered Interested Trustees of the Trust, within the meaning of the 1940 Act, because of their affiliation with Marsico Capital Management, LLC, the investment adviser to the Funds. Mr. Thomas Marsico and Mr. Christopher Marsico are brothers. |
The Statement of Additional Information includes additional information about the Trustees and is available upon request, without charge, by calling 888-860-8686 or visit www.marsicofunds.com. |
57
MARSICO FUNDS |
NOTES
58
MARSICO FUNDS |
59
MARSICO FUNDS |
NOTES
60
 The Marsico Investment Fund UMB Distribution Services, LLC, Distributor P.O. Box 3210, Milwaukee, WI 53201-3210 www.marsicofunds.com • 888.860.8686 ©2013 MARSICO CAPITAL MANAGEMENT, LLC Not authorized for distribution unless preceded or accompanied by an effective Marsico Funds prospectus. |
Item 2 – Code of Ethics.
| (a) | The Registrant, as of the end of the period covered by this report, has adopted a code of ethics that applies to the Registrant’s principal executive officer, principal financial officer, principal accounting officer or controller, or persons performing similar functions, regardless of whether these individuals are employed by the Registrant or a third party. A copy of this code of ethics is attached hereto as Exhibit (a). |
| (b) | Not used. |
| (c) | There were no amendments, during the period covered by this report, to a provision of the code of ethics that applies to the Registrant’s principal executive officer, principal financial officer, principal accounting officer or controller, or persons performing similar functions, regardless of whether these individuals are employed by the Registrant or a third party, and that relates to any element of the code of ethics description. |
| (d) | The Registrant has not granted any waivers, including an implicit waiver, from a provision of the code of ethics that applies to the Registrant’s principal executive officer, principal financial officer, principal accounting officer or controller, or persons performing similar functions, regardless of whether these individuals are employed by the Registrant or a third party, that relates to one or more of the items set forth in paragraph (b) of this item’s instructions. |
| (e) | Not applicable. |
| (f) | See attached Exhibit (a). |
Item 3 – Audit Committee Financial Expert.
| (a)(1) | The Registrant’s Board of Trustees has determined that the Registrant has at least one audit committee financial expert serving on its audit committee. |
| (a)(2) | Mr. Joseph T. Willett is the audit committee financial expert. Mr. Willett is “independent” under the applicable rules. |
Item 4 – Principal Accountant Fees and Services.
In each of the fiscal years ended September 30, 2013 and September 30, 2012, the aggregate Audit Fees billed (or to be billed) by PricewaterhouseCoopers LLP (PwC) for professional services rendered for the audits of the financial statements, or services that are normally provided in connection with statutory and regulatory filings or engagements as well as reimbursable expenses are listed below.
(a) Audit Fees.
| 2013 | 2012 |
| $146,500 | $150,750 |
| (b) | Audit-Related Fees. |
In each of the fiscal years ended September 30, 2013 and September 30, 2012, the aggregate Audit-Related Fees billed (or to be billed) by PwC for services rendered for assurance and related services to each fund that are reasonably related to the performance of the audit or review of each fund's financial statements, but not reported as Audit Fees, are shown in the table below.
| 2013 | 2012 |
| $6,624 | $0 |
Audit-related fees noted in 2013 are for non-recurring work performed by PwC related to the Funds' distributions to shareholders.
| (c) | Tax Fees. |
In each of the fiscal years ended September 30, 2013 and September 30, 2012 the aggregate Tax Fees billed (or to be billed) by PwC for professional services rendered for tax compliance, tax advice, and tax planning are shown in the table below.
| 2013 | 2012 |
| $28,700 | $32,750 |
All of these fees were approved by the Trust’s Audit Committee as required pursuant to paragraph (c)(7)(ii) of Rule 2-01 of Regulation S-X.
Fees included in the Tax Fees category comprise all services performed by professional staff in the independent registered public accounting firm's tax division except those services related to the audit. Typically, this category would include fees for tax compliance, tax planning, and tax advice. Tax compliance, tax advice, and tax planning services include preparation of original and amended tax returns, claims for refund and tax payment-planning services, assistance with tax audits and appeals, tax advice related to mergers and acquisitions and requests for rulings or technical advice from taxing authorities.
| (d) | All Other Fees. |
In each of the fiscal years ended September 30, 2013 and September 30, 2012 the aggregate Other Fees billed (or to be billed) by PwC for all other non-audit services rendered are shown in the table below.
| 2013 | 2012 |
| $0 | $0 |
| (e) (1) | Audit Committee Pre-Approval Policies and Procedures: |
Pursuant to the Trust’s Audit Committee Charter and Policies and Procedures (collectively, the “Procedures”), the Audit Committee has adopted pre-approval policies and procedures to govern the pre-approval of (i) all audit services and permissible non-audit services to be provided to the Trust by its independent accountant, and (ii) all permissible non-audit services to be provided by such independent accountant to the Trust’s investment adviser and to any entity controlling, controlled by or under common control with the investment adviser that provides on-going services to the Trust (collectively, any “Service Affiliates”) if the engagement directly relates to the Trust’s operations and financial reporting.
In accordance with the Procedures, the Committee is responsible for the engagement of the independent accountant to certify the Trust’s financial statements for each fiscal year. With respect to the pre-approval of non-audit services provided to the Trust and its Service Affiliates, the Procedures provide that the Committee may pre-approve such services on a project-by-project basis as they arise. The Procedures also permit the Committee to delegate authority to the Audit Committee Chairman (the “Designated Member”) to pre-approve any proposed non-audit services that have not been previously approved by the Committee, subject to certain conditions. Any action by the Designated Member in approving a requested non-audit service shall be presented to the Audit Committee not later than at its next scheduled meeting. If the Designated Member does not approve the independent auditor’s provision of a requested non-audit service, the matter may be presented to the full Committee for its consideration and action.
| (e)(2) | Services approved pursuant to paragraph (c)(7)(i)(C) of Rule 2-01 of Regulation S-X: |
100% of these fees were approved by the Trust’s Audit Committee as required pursuant to paragraph (c)(7)(ii) of Rule 2-01 of Regulation S-X.
| (f) | According to PwC for the fiscal year ended September 30, 2013, the percentage of hours spent on the audit of the Marsico Funds’ financial statements for the most recent fiscal year that were attributed to work performed by persons who are not full-time, permanent employees of PwC is as follows: |
| PwC | 2013 |
| Work performed by persons who are not full-time | 0% |
| (g) | In each of the fiscal years ended September 30, 2013 and September 30, 2012, the aggregate fees billed (or to be billed) by PwC relating to non-audit services that were rendered to the Trust, to its investment adviser, and to any entity controlling, controlled by, or under common control with the investment adviser and that provides ongoing services to the Trust are shown in the table below. |
| 2013 | 2012 |
| $0 | $0 |
| (h) | Not applicable. |
Item 5 – Audit Committee of Listed Registrants.
Not applicable.
Item 6 – Schedule of Investments.
The schedule of investments in securities of unaffiliated issuers is included as part of the report to shareholders filed under Item 1.
Item 7 – Disclosure of Proxy Voting Policies and Procedures for Closed-End Management Investment Companies.
Not applicable.
Item 8 – Portfolio Managers of Closed-End Management Investment Companies.
Not applicable.
Item 9 – Purchases of Equity Securities by Closed-End Management Investment Company and Affiliated Purchasers.
Not applicable.
Item 10 – Submission of Matters to a Vote of Security Holders.
Not applicable.
Item 11 – Controls and Procedures.
| (a) | The registrant's principal executive officer and principal financial officer have concluded that the registrant's disclosure controls and procedures (as defined in Rule 30a-3(c) under the Investment Company Act of 1940, as amended) are effective based on their evaluation of these disclosure controls and procedures within 90 days of the filing date of this report on Form N-CSR. |
| (b) | There were no significant changes in the registrant's internal control over financial reporting (as defined in Rule 30a-3(d) under the Investment Company Act of 1940, as amended) that occurred during the second fiscal half-year covered by this report that has materially affected, or is reasonably likely to materially affect, the registrant’s internal control over financial reporting. |
Item 12 – Exhibits.
| (a)(1) | Code of Ethics - Filed as an attachment to this filing. |
| (a)(2) | Certification for each principal executive and principal financial officer of the registrant as required by Rule 30a-2(a) under the Act (17 CFR 270.30a-2(a)). Filed as an attachment to this filing. |
| (a)(3) | Any written solicitation to purchase securities under Rule 23c-1 under the Investment Company Act of 1940, as amended, that was sent or given during the period covered by the report by or on behalf of the registrant to 10 or more persons. |
Not applicable.
| (b) | Certifications required by Rule 30a-2(b) under the Act (17 CFR 270.30a-2(b)), Rule 13a-14(b) or Rule 15d-14(b) under the Exchange Act (17 CFR 240.13a-14(b) or 240.15d-14(b)), and Section 1350 of Chapter 63 of Title 18 of the United States Code (18 U.S.C. 1350). Filed as an attachment to this filing. |
SIGNATURES
Pursuant to the requirements of the Securities Exchange Act of 1934 and the Investment Company Act of 1940, the registrant has duly caused this report to be signed on its behalf by the undersigned, thereunto duly authorized.
The Marsico Investment Fund
| By: | /s/ Christopher J. Marsico |
| Christopher J. Marsico | |
| Executive Vice President and Chief Operating Officer | |
| Date: | December 6, 2013 |
| Pursuant to the requirements of the Securities Exchange Act of 1934 and the Investment Company Act of 1940, this report has been signed below by the following persons on behalf of the registrant and in the capacities and on the dates indicated. | |
| By: | /s/ Christopher J. Marsico |
| Christopher J. Marsico | |
| Executive Vice President and Chief Operating Officer | |
| Date: | December 6, 2013 |
| By: | /s/ Neil L. Gloude |
| Neil L. Gloude | |
| Vice President, Secretary and Treasurer | |
| Date: | December 6, 2013 |