For additional disclosures about the Marsico Funds, please see page 4. The performance data quoted here represent past performance, and past performance is not a guarantee of future results. Investment return and principal value of an investment will fluctuate so that an investor’s shares, when redeemed, may be worth more or less than their original cost.
2
| KEY FUND STATISTICS (UNAUDITED) |
Marsico International
Opportunities Fund | Marsico Flexible Capital
Fund | Marsico Global Fund |
| | MIOFX | | | MFCFX | | | MGLBX | |
| For additional disclosures, please see page 26. | For additional disclosures, please see page 31. | For additional disclosures, please see page 36. |
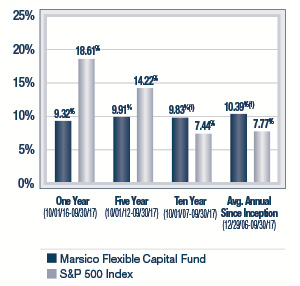
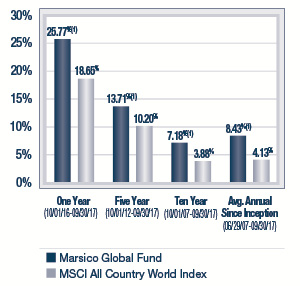
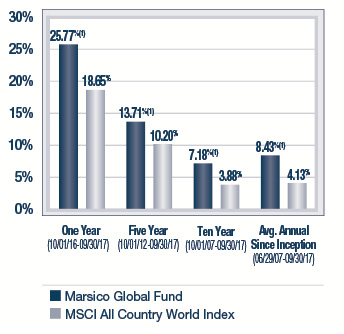
PERFORMANCE COMPARISON(1) | PERFORMANCE COMPARISON(1) | PERFORMANCE COMPARISON(1) |
| | |
TOTAL ANNUAL OPERATING EXPENSES* 1.77% NET EXPENSES*† 1.60% | TOTAL ANNUAL OPERATING EXPENSES* 1.37% | TOTAL ANNUAL OPERATING EXPENSES* 1.69% NET EXPENSES*† 1.60% |
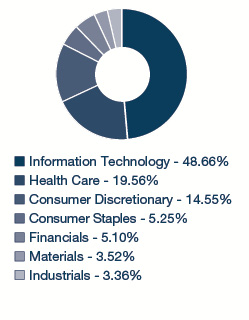
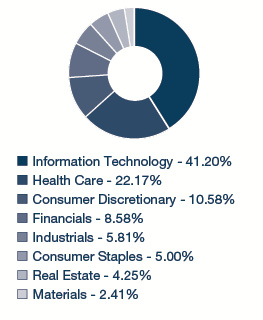
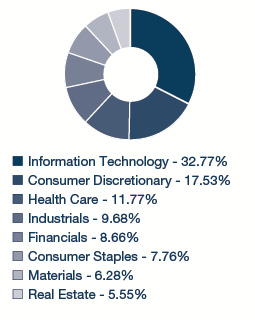
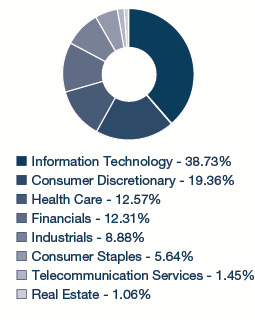
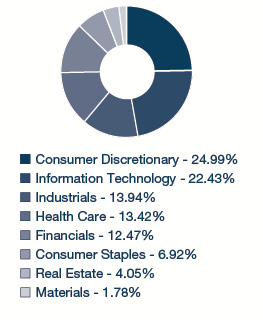
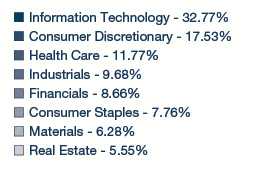
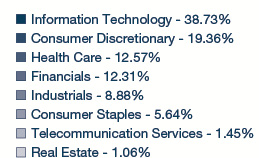
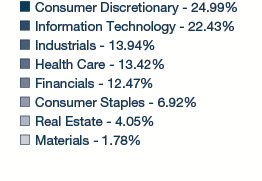
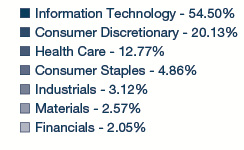
SECTOR ALLOCATION(2) | SECTOR ALLOCATION(2) | SECTOR ALLOCATION(2) |
| | |
TOP FIVE HOLDINGS | TOP FIVE HOLDINGS | TOP FIVE HOLDINGS |
| ASML HOLDING N.V. | 4.71% | LOCKHEED MARTIN CORPORATION | 5.71% | TENCENT HOLDINGS LTD. | 5.85% |
| INTERXION HOLDING N.V. | 4.64% | VISA, INC. - CL. A | 5.42% | ALIBABA GROUP HOLDING LTD. SPON. ADR | 5.68% |
| ALIBABA GROUP HOLDING LTD. SPON. ADR | 3.88% | CONSTELLATION BRANDS, INC. - CL. A | 4.48% | UBISOFT ENTERTAINMENT S.A. | 4.41% |
| JULIUS BAER GROUP LTD. | 3.82% | APPLE, INC. | 4.23% | HERMES INTERNATIONAL | 3.85% |
| BAYER A.G. | 3.82% | FACEBOOK, INC. - CL. A | 4.07% | ANHEUSER-BUSCH INBEV S.A./N.V. | 3.61% |
Current performance may be lower or higher than the performance information quoted. To obtain performance information current to the most recent month-end, please call 888-860-8686 or visit marsicofunds.com.
3
| KEY FUND STATISTICS (UNAUDITED) |
ADDITIONAL DISCLOSURES ABOUT THE MARSICO FUNDS
| * | The Total Annual Operating Expenses and Net Expenses are reflective of the information disclosed in the Funds’ Prospectus dated January 30, 2017. The information may differ from the expense ratios disclosed in this report. |
| † | Marsico Capital Management, LLC (the “Adviser”) has entered into a written expense limitation and fee waiver agreement under which it has agreed to limit the total expenses of each of the International Opportunities Fund and the Global Fund (excluding interest, taxes, acquired fund fees and expenses, litigation, brokerage and extraordinary expenses) to an annual rate of 1.60% of each Fund’s average net assets until January 31, 2018. This expense limitation and fee waiver agreement may be terminated by the Adviser at any time after January 31, 2018, upon 15 days prior notice to the Fund and its administrator. The Adviser may recoup from a Fund fees previously waived or expenses previously reimbursed by the Adviser with respect to that Fund pursuant to this agreement (or a previous expenses limitation agreement) if: (1) such recoupment by the Adviser does not cause the Fund, at the time of recoupment, to exceed the lesser of (a) the expense limitation in effect at the time the relevant amount was waived and/or reimbursed, or (b) the expense limitation in effect at the time of the proposed recoupment, and (2) the recoupment is made within three fiscal years after the end of the fiscal year in which the amount was waived or reimbursed. |
(1) | The performance data quoted here represent past performance, and past performance is not a guarantee of future results. Investment return and principal value of an investment will fluctuate so that an investor’s shares, when redeemed, may be worth more or less than their original cost. Current performance may be lower or higher than the performance information quoted. To obtain performance information current to the most recent month-end, please call 888-860-8686 or visit marsicofunds.com. |
| The performance included in the chart does not reflect the deduction of taxes on Fund distributions or the redemption of Fund shares. |
| All indices are unmanaged and investors cannot invest directly in an index. |
Periodically, certain fees and expenses have been waived or reimbursed by the Adviser for the 21st Century Fund, the International Opportunities Fund, the Flexible Capital Fund and the Global Fund. In the absence of such a waiver or reimbursement, the performance returns reflected would have been reduced. In accordance with the expense limitation and fee waiver agreement, the Adviser may recoup fees and expenses previously waived or reimbursed under certain parameters. Periodically, the Adviser has recouped such fees or expenses from the 21st Century Fund, the International Opportunities Fund, and the Global Fund, resulting in a lower performance return.
(2) | Sector weightings represent the percentage of the respective Fund’s investments (excluding cash equivalents) in certain general sectors. These sectors may include more than one industry. The Fund’s portfolio composition is subject to change at any time. |
4
MARKET ENVIRONMENT: OCTOBER 2016 – SEPTEMBER 2017 (UNAUDITED)
After the election of Donald Trump in November 2016, global equity markets recorded strong performances for the one-year fiscal period ended September 30, 2017. Stocks, bonds, currencies and commodities abruptly repriced around the globe amid this new political reality. The trend of little movement in inflation stayed the same, while in Washington stimulative tax cuts and other domestic fiscal policy actions have been proposed but not yet legislated.
Two of the most striking economic developments early in the period were an initial leap in US Treasury bond yields, and a sharp rise in the US dollar compared to other major currencies. As investors digested an anticipated shift from budgetary austerity, which was typical for the last five years around the world, to potential large tax cuts, major increases in infrastructure and defense spending, and substantial loosening of regulations, it became clear that growth could increase and US interest rates might rise substantially. The US 10-year Treasury yield jumped from just under 1.7% to a high point of 2.6% during the period, although yields subsequently declined to the 2.2%-2.35% range. After rising initially the US dollar also declined substantially in the latter half of the period.
Steady gains for US employment and little to no inflation led the US Federal Reserve Board to raise short-term rates three times during the year, and to signal more changes in the future. The Federal Open Market Committee was careful to emphasize that its prospective tightening plans assumed no change in Federal tax policy and infrastructure spending. Fed officials, in various speeches, explained that they would consider adjusting their policy plans if potentially stimulative Trump policies are enacted.
The US job market remained reasonably healthy. Economic performance in the services sector firmed, especially in the first quarter of 2017, evidenced by upbeat news from surveys and decent gains for services jobs. In addition, manufacturing indicators continued to improve, signaling an end to the pressures emanating from the 2015 dollar rebound and plunge in oil prices during 2015 and early 2016.
In the US, economic output and employment gains for the third quarter of 2017 were meaningfully affected by the powerful string of hurricanes that battered Texas, Louisiana and Florida. The September payroll jobs number fell outright for the first time since June of 2010, as Bureau of Labor Statistics (“BLS”) officials attributed the weakness to weather-related events. Despite the hurricanes, other recent employment indicators were more positive. These positive indicators included the separate BLS household survey, which was not materially affected by the storms, and suggested a solid September 2017 jobs picture, and the overall September unemployment rate, which actually fell to 4.2%
The performance for US GDP growth in the last quarter of the period was also meaningfully affected by the storms. Tourism and related leisure activities slowed in the quarter as activity in the southeast and Texas came to a halt in September. In contrast, motor vehicle sales leapt in September, as consumers sought to replace vehicles destroyed by submersion in floodwaters. Stepping back from the effects of the storms, it appears that both output and employment gains remain on recent positive trajectories. US GDP growth of slightly more than +2% per year, and job gains of 150,000 to 175,000 per month, still look to be the underlying reality. Inflation, as mentioned above, generally seems to remain muted.
Finally, we saw much sound and fury between the US Congress and Trump administration officials on health care reform, tax reform, and infrastructure spending. As of the reporting period’s end, however, no major legislation on these topics had been enacted. Hopes for major tax cuts remained in place. The unsuccessful push to repeal and replace Obamacare in Congress seemed over for the time being, but President Trump has issued executive orders to loosen restrictions and pressure Congress to revisit the troubled program next year. Little talk of infrastructure spending has been evident this quarter, perhaps in part because of the strong response of the economy and markets to the Trump administration’s pro business and de-regulatory initiatives.
5
The performance of global markets during the period is depicted below. US markets posted strong gains for the one-year period ended September 30, 2017. Large capitalization US equities lagged small capitalization stocks, yet both segments rose double digits during the period. Emerging market equities performed positively as their currencies strengthened relative to the US dollar, easing import costs for those countries. Developed international markets posted positive returns as well despite political uncertainty in Europe and an overall focus on domestic agendas.
Index Name(1) | Universe of
Equities Represented | One-Year
Total Return (as of September 30, 2017) |
| US | | |
| S&P 500 | US large-capitalization equities | +18.61% |
| Russell 3000 | US publicly-traded equities of all sizes | +18.71% |
| Russell 2000 | US small-capitalization equities | +20.74% |
| Russell Mid-Cap Growth | US medium-capitalization equities | +17.82% |
Index Name(1) | Universe of
Equities Represented | One-Year
Total Return (as of September 30, 2017) |
| INTERNATIONAL | |
| MSCI EAFE (US$) | Equities in developed international equity markets, including Japan, Western Europe, and Australasia | +19.10% |
| MSCI Emerging Markets (US$) | Equities in developing international equity markets, including China, India, Eastern Europe, and Latin America | +22.46% |
| MSCI ACWI (US$) | Equities in the global developed and emerging markets | +18.65% |
THE MARSICO INVESTMENT TEAM
(1) | All indices are unmanaged and investors cannot invest directly in an index. |
6
INVESTMENT REVIEW BY TOM MARSICO (UNAUDITED)
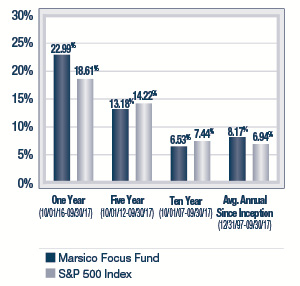
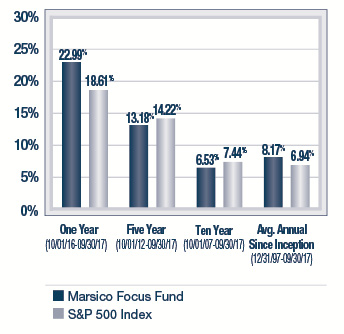
The Marsico Focus Fund posted a total return of +22.99% for the one-year fiscal period ended September 30, 2017. In addition to posting a strong absolute return, the Fund also outperformed its benchmark index, the S&P 500 Index, which had a total return of +18.61% over the same time period. Please see the Fund’s Overview for more detailed information about the Fund’s longer-term performance for various time periods ended September 30, 2017.
The performance data for the Fund quoted here represent past performance, and past performance is not a guarantee of future results. Investment return and principal value of an investment will fluctuate so that an investor’s shares, when redeemed, may be worth more or less than their original cost. Current performance may be lower or higher than the performance information quoted. To obtain performance information current to the most recent month-end, please call 888-860-8686 or visit marsicofunds.com.(1)
This review highlights Fund performance over a one-year fiscal period. Shareholders should keep in mind that the Fund is intended for long-term investors who hold their shares for substantially longer periods of time. You should also keep in mind that our current views and beliefs regarding all investments discussed in this report are subject to change at any time. References to specific securities, industries, and sectors discussed in this report are not recommendations to buy or sell such securities or related investments, and the Fund may not necessarily hold these securities or investments today. Please see the accompanying Schedule of Investments for the percentage of the Fund’s portfolio represented by the securities mentioned in this report as of the end of the reporting period.
The Focus Fund is non-diversified and may hold fewer securities than a diversified fund because it is permitted to invest a greater percentage of its assets in a smaller number of securities. Holding fewer securities increases the risk that the value of the Fund could go down because of the poor performance of a single investment or may be more volatile than its benchmark. The Fund is subject to broad risks associated with investing in equity securities markets generally, including the risks that the securities and markets in which it invests may experience volatility and instability, that domestic and global economies and markets may undergo periods of cyclical change and decline, that investors may at times avoid investments in equity securities, and that investments may not perform as anticipated. Please see the Prospectus for more information.
The Fund is not managed to track the benchmark index, and may hold a substantially overweight or underweight position in a sector, industry, or security compared to its weight in the benchmark. For informational purposes, the discussion below may compare the benchmark weight or performance of a sector or industry to the investment approach of the Fund.
The Focus Fund’s outperformance during the one-year period ended September 30, 2017, as compared to the S&P 500 Index, was primarily attributable to certain Fund holdings in the Information Technology and Health Care sectors, as defined in the Global Industry Classification Standard (“GICS”)(2). The Fund also benefitted from an overweight stance in the Information Technology sector and a lack of exposure to the weak-performing Energy sector, as well as other factors discussed below.
Stock prices of several Information Technology companies performed strongly during the reporting period. Chinese Internet conglomerate Alibaba Group Holding Ltd. Spon. ADR returned +63%. Alibaba has transformed itself from an e-commerce marketplace into a much broader platform that includes payments, search, logistics, supply-chain, cloud computing, and Internet media. Alibaba has created an ecosystem that includes Taobao, TMall and Alibaba.com to enable consumer to consumer, business to consumer, and business to business transactions, respectively. In addition, the company has created Alipay which allows users to pay via its platform, and AntFinancial which provides financing to businesses. The scale of these businesses reaches over 500 million people and spans over 200 countries, including China. Social network company Facebook, Inc. – Cl. A (+33%) has been anchored by consistent user engagement and monetization of its core Facebook application, and the company’s impressive results this year have also been driven by its Instagram property. The monetization of Instagram has allowed Facebook’s advertising revenue to re-accelerate, driving operating margins higher. This, in turn, has powered significant free cash flow growth – permitting Facebook to reinvest in its core business and in new innovation initiatives that we believe should fuel consistency and sustainability of growth.
A holding in the Health Care sector, UnitedHealth Group, Inc. (+42%), had a significant, positive impact on Fund performance. UnitedHealth’s performance was driven by its return to operational growth. The company’s decision to exit the Affordable Care Act (“ACA”) exchanges resulted in a normalization of growth as the company capped its exchange insurance losses in 2016. In addition, UnitedHealth’s insurance division continued to outperform the industry in the commercial, Medicare, and Medicaid markets as the company grew membership by 2.5 million subscribers organically on a year over year basis. Last, the company continued to experience robust growth in its OptumHealth business as UnitedHealth expanded its ambulatory healthcare services offerings in the US.
7
During the period, the Fund initiated a position in Graphics Processing Unit (“GPU”) maker NVIDIA Corporation, which rose +63% as investors began to understand and appreciate the growth opportunities for the company in several different verticals. Nvidia offers the most powerful graphics cards for the latest PC games that need to be run on the highest specs to get the most out of game play. A major competitor launched a new line of graphics cards earlier this year, but appears to have fallen short of the technical requirements to play the latest popular titles. Additionally, Nvidia’s burgeoning datacenter and automotive businesses are beginning to show more promise as the next legs of growth for the company.
Video game maker Activision Blizzard, Inc. has been a strong contributor to the Fund (+49%). Shares have materially outperformed the broader market, as game and other content consumption trends are moving away from traditional models toward digital distribution consistent with the company’s approach. With the move toward digital downloads versus in store purchases of its content, Activision has dramatically increased its revenue and margins, and appears likely to continue to do so as it further monetizes its user base of nearly 500 million monthly active users.
As mentioned above, the Fund was aided relative to its benchmark index by having an overweight allocation to the strong-performing Information Technology sector, while having no exposure to the weak-performing Energy and Telecommunication Services sectors, and an underweight allocation to the Consumer Staples sector.
There were a few positions that didn’t perform as anticipated and were detractors from performance. One of the Fund’s Consumer Discretionary holdings struggled during the period. Australia-based Domino’s Pizza Enterprises Ltd. (-31%) faced challenges as the company misfired on the European rollout of its new technology platform, leading to some customer frustration until the issues were resolved. After talking to the company’s CEO, Don Meij, we feel confident that management has learned from its missteps, and we remain optimistic about the long-term opportunities for store growth and operating margin expansion.
Video game maker Electronic Arts, Inc. (“EA”) returned -9% during the period before being sold from the Fund. EA detracted from performance due to poor reviews of one of the company’s newly launched games that caused investors to question the future sales prospects of the company.
Restaurant operator Chipotle Mexican Grill, Inc. (-5%) posted a negative return during the period before being sold from the Fund. This decline was a result of continued uncertainty around the company’s ability to recover from the food-quality related issues it suffered in late 2015.
Certain holdings within the Pharmaceutical, Biotechnology & Life Sciences industry group posted negative returns. The Fund’s Allergan PLC position (-9% prior to being sold) struggled on weak operational results in the company’s specialty pharmaceutical brands division. Incyte Corp. (-16% prior to being sold) dropped as a result of an FDA approval setback for its rheumatoid arthritis drug.
From a sector allocation perspective, the Fund’s performance was impaired by having an underweight exposure to the Financials and Industrials sectors – two of the strongest-performing sectors of the S&P 500 Index during the period. In the post-Trump election environment, primarily in the 4th quarter of 2016, these sectors led the market higher as they were perceived to be the most direct beneficiaries of President Trump’s pro-growth initiatives. We believed valuations for many companies in both sectors became stretched very rapidly, and we found more compelling, longer-term growth investment opportunities in other sectors, such as Information Technology. Later in the reporting period, we also identified select opportunities in Financials and Industrials where we initiated positions.
In addition, a slightly higher than normal 4% average cash weight posed a slight headwind to Fund performance during the period.
During the reporting period, the Fund sold its position in the Real Estate sector(3) and reduced its exposure to the Consumer Discretionary sector. The Fund increased its allocations to the Information Technology, Financials, Health Care Industrials, and Consumer Staples sectors. There was no significant change to the Fund’s allocation to the Materials sector.
8
Fiscal Period-End Investment Posture
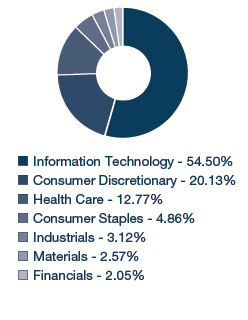
As of September 30, 2017, the Fund’s largest sector allocations included Information Technology, Health Care and Consumer Discretionary. As of that date, the Fund had no exposure to the Energy, Real Estate, Utilities or Telecommunication Services sectors.
Effective on and after December 1, 2016, Coralie Witter no longer served as co-manager of the Marsico Focus Fund, and Thomas F. Marsico is solely responsible for day-to-day management of the Fund.
Sincerely,
THOMAS F. MARSICO
PORTFOLIO MANAGER
(1) | Total returns are based on net change in net asset value assuming reinvestment of distributions. Please see the Prospectus for more information. |
(2) | Regarding GICS data cited throughout this report, the Global Industry Classification Standard (“GICS”) was developed by and is the exclusive property and service mark of MSCI Inc. (“MSCI”) and Standard & Poor’s (“S&P”) and is licensed for use by Marsico Capital Management, LLC (the “Adviser”). Neither MSCI, S&P, nor the Adviser or any third party involved in compiling GICS makes any express or implied warranties or representations with respect to such standard or classification (or the results from use thereof), and all such parties hereby expressly disclaim all warranties of originality, accuracy, completeness, merchantability and fitness for a particular purpose with respect to any such standard or classification. MSCI, S&P, the Adviser, and any of their affiliates or third parties involved in compiling GICS shall not have any liability for any direct, indirect, special, punitive, consequential or any other damages (including lost profits) even if notified of the possibility of such damages. |
(3) | Through September 30, 2016, the Funds reported certain real estate investment trusts as having been classified within the Financials sector. These investments are now reported in the new GICS Real Estate sector. References to investment sector exposure included throughout this annual report reflect the impact of this change. |
9
September 30, 2017 (Unaudited)
The Focus Fund is a non-diversified portfolio and invests primarily in the common stocks of large companies that are selected for their long-term growth potential. The Fund will normally hold a core position of between 20 and 35 common stocks.
TOTAL ANNUAL OPERATING EXPENSES* 1.27% | NET ASSETS $559,657,308 | NET ASSET VALUE PER SHARE $19.63 |
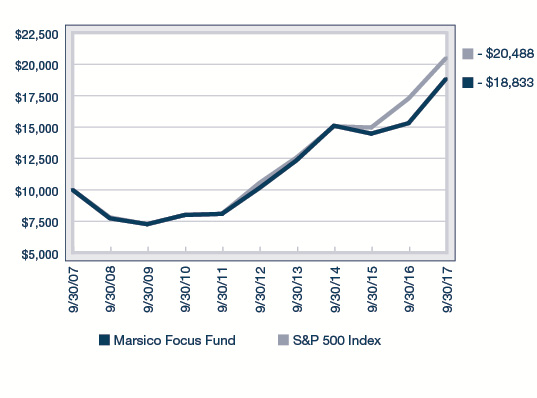
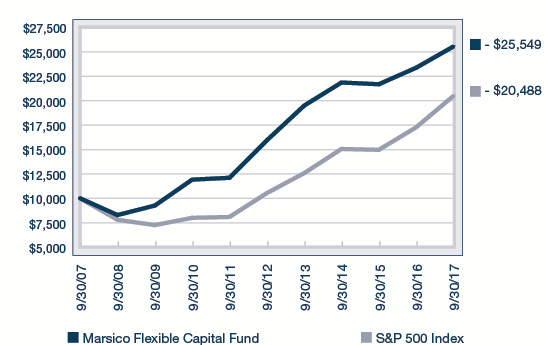
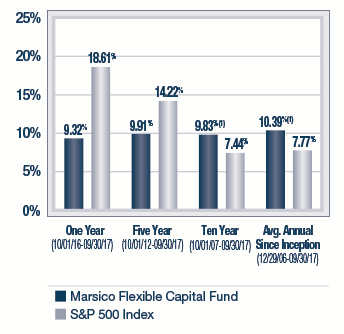
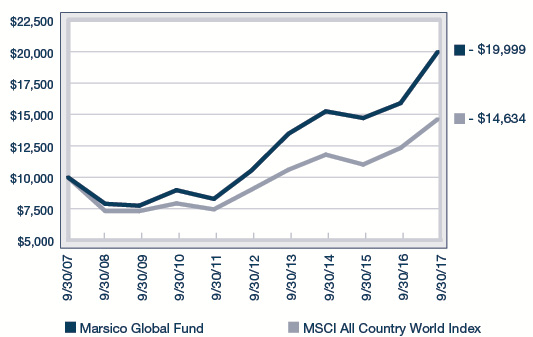
GROWTH OF $10,000(1) | PERFORMANCE COMPARISON |
| |
SECTOR ALLOCATION(2) | TOP FIVE HOLDINGS |
| | | | |
| | Alibaba Group Holding Ltd. Spon. ADR | 7.87% | |
| | Visa, Inc. - Cl. A | 5.25% | |
| | UnitedHealth Group, Inc. | 5.08% | |
| | PayPal Holdings, Inc. | 4.95% | |
| | Apple, Inc. | 4.67% | |
| | | | |
| * | The Total Annual Operating Expenses are reflective of the information disclosed in the Funds’ Prospectus dated January 30, 2017 and may differ from the expense ratio disclosed in this report. |
| The performance data quoted here represent past performance, and past performance is not a guarantee of future results. Investment return and principal value of an investment will fluctuate so that an investor’s shares, when redeemed, may be worth more or less than their original cost. Current performance may be lower or higher than the performance information quoted. To obtain performance information current to the most recent month-end, please call 888-860-8686 or visit marsicofunds.com. |
| The performance included in the chart and graph does not reflect the deduction of taxes on Fund distributions or the redemption of Fund shares. |
| All indices are unmanaged and investors cannot invest directly in an index. |
(1) | This chart assumes an initial investment of $10,000 made on September 30, 2007. Total returns are based on net change in NAV, assuming reinvestment of distributions. |
(2) | Sector weightings represent the percentage of the Fund’s investments (excluding cash equivalents) in certain general sectors. These sectors may include more than one industry. The Fund’s portfolio composition is subject to change at any time. |
10
MARSICO FOCUS FUND
SCHEDULE OF INVESTMENTS
September 30, 2017
| | | Number
of
Shares | | | Value | | | Percent
of Net
Assets | |
| COMMON STOCKS | | | | | | | | | |
| Aerospace & Defense | | | | | | | | | |
| Lockheed Martin Corporation | | | 57,426 | | | $ | 17,818,713 | | | | 3.18 | % |
| | | | | | | | | | | | | |
| Application Software | | | | | | | | | | | | |
| salesforce.com, inc.* | | | 253,464 | | | | 23,678,607 | | | | 4.23 | |
| | | | | | | | | | | | | |
| Biotechnology | | | | | | | | | | | | |
| Celgene Corporation* | | | 172,901 | | | | 25,212,424 | | | | 4.51 | |
| | | | | | | | | | | | | |
| Brewers | | | | | | | | | | | | |
| Anheuser-Busch InBev S.A./N.V. | | | 92,593 | | | | 11,085,836 | | | | 1.98 | |
| | | | | | | | | | | | | |
| Data Processing & Outsourced Services | | | | | |
| PayPal Holdings, Inc.* | | | 432,626 | | | | 27,701,043 | | | | 4.95 | |
| Visa, Inc. - Cl. A | | | 279,338 | | | | 29,397,531 | | | | 5.25 | |
| | | | | | | | 57,098,574 | | | | 10.20 | |
| Distillers & Vintners | | | | | | | | | | | | |
| Constellation Brands, Inc. - Cl. A | | | 84,218 | | | | 16,797,280 | | | | 3.00 | |
| | | | | | | | | | | | | |
| Financial Exchanges & Data | | | | | |
| Intercontinental Exchange, Inc. | | | 143,778 | | | | 9,877,549 | | | | 1.77 | |
| | | | | | | | | | | | | |
| Health Care Equipment | | | | | | | | | | | | |
| Boston Scientific Corporation* | | | 556,508 | | | | 16,233,338 | | | | 2.90 | |
| | | | | | | | | | | | | |
| Home Entertainment Software | | | | | | | | | |
| Activision Blizzard, Inc. | | | 279,181 | | | | 18,009,966 | | | | 3.22 | |
| | | | | | | | | | | | | |
| Internet & Direct Marketing Retail | | | | | |
| Amazon.com, Inc.* | | | 24,741 | | | | 23,784,760 | | | | 4.25 | |
| Netflix, Inc.* | | | 127,281 | | | | 23,082,409 | | | | 4.12 | |
| The Priceline Group, Inc.* | | | 8,797 | | | | 16,105,724 | | | | 2.88 | |
| | | | | | | | 62,972,893 | | | | 11.25 | |
| Internet Software & Services | | | | | |
| Alibaba Group Holding Ltd. Spon. ADR* | | | 255,102 | | | | 44,058,666 | | | | 7.87 | |
| Alphabet, Inc. - Cl. A* | | | 23,998 | | | | 23,367,333 | | | | 4.18 | |
| Facebook, Inc. - Cl. A* | | | 136,507 | | | | 23,324,951 | | | | 4.17 | |
| | | | | | | | 90,750,950 | | | | 16.22 | |
| Managed Health Care | | | | | | | | | | | | |
| Anthem, Inc. | | | 80,392 | | | | 15,264,833 | | | | 2.73 | |
| UnitedHealth Group, Inc. | | | 145,147 | | | | 28,427,040 | | | | 5.08 | |
| | | | | | | | 43,691,873 | | | | 7.81 | |
| Pharmaceuticals | | | | | | | | | | | | |
| Merck & Co., Inc. | | | 291,426 | | | | 18,660,007 | | | | 3.33 | |
| | | | | | | | | | | | | |
| Regional Banks | | | | | | | | | | | | |
| First Republic Bank | | | 164,495 | | | | 17,183,148 | | | | 3.07 | |
| | | | | | | | | | | | | |
| Restaurants | | | | | | | | | | | | |
| Domino's Pizza Enterprises Ltd. | | | 397,088 | | | | 14,271,820 | | | | 2.55 | |
COMMON STOCKS (continued) | | | | | | | | | |
| Semiconductor Equipment | | | | | | | | | | | | |
| Applied Materials, Inc. | | | 427,648 | | | $ | 22,276,184 | | | | 3.98 | % |
| | | | | | | | | | | | | |
| Semiconductors | | | | | | | | | | | | |
| NVIDIA Corporation | | | 113,988 | | | | 20,377,635 | | | | 3.64 | |
| | | | | | | | | | | | | |
| Specialty Chemicals | | | | | | | | | | | | |
| The Sherwin-Williams Company | | | 52,220 | | | | 18,696,849 | | | | 3.34 | |
| | | | | | | | | | | | | |
| Technology Hardware, Storage & Peripherals | | | | | |
| Apple, Inc. | | | 169,380 | | | | 26,104,846 | | | | 4.67 | |
| | | | | | | | | | | | | |
| TOTAL COMMON STOCKS | | | | | | | | | | | | |
(Cost $364,454,830) | | | | | | | 530,798,492 | | | | 94.85 | |
| | | | | | | | | | | | | |
| SHORT-TERM INVESTMENTS | | | | | | | | | |
| State Street Institutional U.S. Government Money Market Fund, 0.000% | | | 35,842,753 | | | | 35,842,753 | | | | 6.40 | |
| | | | | | | | | | | | | |
| TOTAL SHORT-TERM INVESTMENTS | | | | | | | | | |
| (Cost $35,842,753) | | | | | | | 35,842,753 | | | | 6.40 | |
| | | | | | | | | | | | | |
| TOTAL INVESTMENTS | | | | | | | | | | | | |
(Cost $400,297,583) | | | | | | | 566,641,245 | | | | 101.25 | |
| | | | | | | | | | | | | |
| Liabilities, Less Cash and Other Assets | | | | | | | (6,983,937 | ) | | | (1.25 | ) |
| | | | | | | | | | | | | |
| NET ASSETS | | | | | | $ | 559,657,308 | | | | 100.00 | % |
See notes to financial statements.
11
INVESTMENT REVIEW BY TOM MARSICO (UNAUDITED)
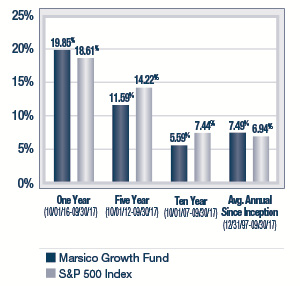
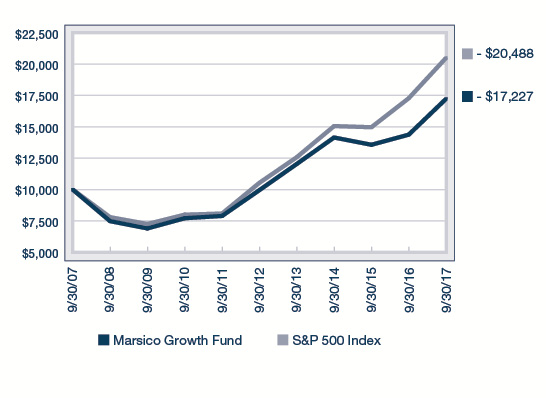
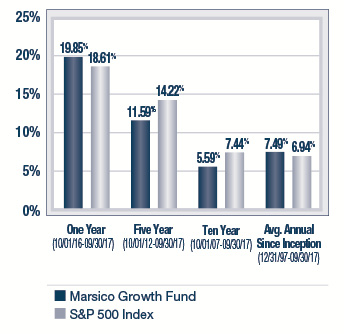
The Marsico Growth Fund posted a total return of +19.85% for the one-year fiscal period ended September 30, 2017. The Fund outperformed the S&P 500 Index, the Fund’s benchmark index, which had a total return of +18.61% over the same time period. Please see the Fund’s Overview for more detailed information about the Fund’s longer-term performance for various time periods ended September 30, 2017.
The performance data for the Fund quoted here represent past performance, and past performance is not a guarantee of future results. Investment return and principal value of an investment will fluctuate so that an investor’s shares, when redeemed, may be worth more or less than their original cost. Current performance may be lower or higher than the performance information quoted. To obtain performance information current to the most recent month-end, please call 888-860-8686 or visit marsicofunds.com.(1)
This review highlights Fund performance over a one-year fiscal period. Shareholders should keep in mind that the Fund is intended for long-term investors who hold their shares for substantially longer periods of time. You should also keep in mind that our current views and beliefs regarding all investments discussed in this report are subject to change at any time. References to specific securities, industries, and sectors discussed in this report are not recommendations to buy or sell such securities or related investments, and the Fund may not necessarily hold these securities or investments today. Please see the accompanying Schedule of Investments for the percentage of the Fund’s portfolio represented by the securities mentioned in this report as of the end of the reporting period.
The Fund is subject to broad risks associated with investing in equity securities markets generally, including the risks that the securities and markets in which it invests may experience volatility and instability, that domestic and global economies and markets may undergo periods of cyclical change and decline, that investors may at times avoid investments in equity securities, and that investments may not perform as anticipated. Please see the Prospectus for more information.
The Fund is not managed to track the benchmark index, and may hold a substantially overweight or underweight position in a sector, industry, or security compared to its weight in the benchmark. For informational purposes, the discussion below may compare the benchmark weight or performance of a sector or industry to the investment approach of the Fund.
Much of the Growth Fund’s outperformance during the one-year period ended September 30, 2017, as compared to the S&P 500 Index, was attributable to certain holdings in the Information Technology and Health Care sectors. Additionally, the Fund beat the Index due to an overweight stance in the Information Technology sector and a lack of exposure to the weak-performing Energy sector, as well as other factors discussed below.
Stock prices of several Information Technology companies performed strongly during the reporting period. Chinese Internet conglomerate Alibaba Group Holding Ltd. Spon. ADR returned +63%. Alibaba has transformed itself from an e-commerce marketplace into a much broader platform that includes payments, search, logistics, supply-chain, cloud computing, and Internet media. Alibaba has created an ecosystem that includes Taobao, TMall and Alibaba.com to enable consumer to consumer, business to consumer, and business to business transactions, respectively. In addition, the company has created Alipay which allows users to pay via its platform, and AntFinancial which provides financing to businesses. The scale of these businesses reaches over 500 million people and spans over 200 countries, including China. Social network company Facebook, Inc. – Cl. A (+33%) has been anchored by consistent user engagement and monetization of its core Facebook application, and the company’s impressive results this year have also been driven by its Instagram property. The monetization of Instagram has allowed Facebook’s advertising revenue to re-accelerate, driving operating margins higher. This, in turn, has powered significant free cash flow growth – permitting Facebook to reinvest in its core business and in new innovation initiatives that we believe should fuel consistency and sustainability of growth.
A holding in the Health Care sector, UnitedHealth Group, Inc. (+42%), had a significant, positive impact on Fund performance. UnitedHealth’s performance was driven by its return to operational growth. The company’s decision to exit the Affordable Care Act (“ACA”) exchanges resulted in a normalization of growth as the company capped its exchange insurance losses in 2016. In addition, UnitedHealth’s insurance division continued to outperform the industry in the commercial, Medicare, and Medicaid markets as the company grew membership by 2.5 million subscribers organically on a year over year basis. Last, the company continued to experience robust growth in its OptumHealth business as UnitedHealth expanded its ambulatory healthcare services offerings in the US.
One of the Fund’s Information Technology holdings in the Software & Services industry group, Adobe Systems, Inc., returned +37% during the period. The company benefitted as more businesses are investing their information technology budgets in digital marketing efforts. We believe that Adobe is one of the best positioned software companies in the digital marketing space.
12
During the period, the Fund initiated a position in Graphics Processing Unit (“GPU”) maker NVIDIA Corporation, which rose +45% as investors began to understand and appreciate the growth opportunities for the company in several different verticals. Nvidia offers the most powerful graphics cards for the latest PC games that need to be run on the highest specs to get the most out of game play. A major competitor launched a new line of graphics cards earlier this year, but appears to have fallen short of the technical requirements to play the latest popular titles. Additionally, Nvidia’s burgeoning datacenter and automotive businesses are beginning to show more promise as the next legs of growth for the company.
As mentioned above, the Fund was aided relative to its benchmark index by having no exposure to the weak-performing Energy sector and maintaining an overweight allocation to the strong-performing Information Technology sector. Additionally, the Fund benefitted from an underweight stance in the Consumer Staples sector, as the sector’s return significantly lagged the return of the S&P 500 Index.
There were a few positions that didn’t perform as anticipated and were detractors from performance. One of the Fund’s Consumer Discretionary holdings struggled during the period. Automotive aftermarket parts retailer O’Reilly Automotive, Inc. (-39%) posted a negative return prior to being sold. This occurred as investors grew cautious over Amazon.com, Inc.’s entrance into the auto parts market and due to uncertainty regarding O’Reilly’s ability to outperform strong sales growth from the prior year.
A holding in the Industrials sector, Nielsen Holdings PLC, dropped -21% during the period and was sold from the Fund. It underperformed due to substantial missteps by management in addressing the changing landscape in its consumer packaged goods measurement business.
In the Software & Services industry group, shares of FleetCor Technologies, Inc., a fleet credit card company, dropped -17% before being sold. The weakness in the stock reflected the persistent slowdown in US oil & gas and construction markets – industries that are large users of fleet cards. Video game maker Electronic Arts, Inc. (“EA”) returned -9% during the period before being sold from the Fund. EA detracted from performance due to poor reviews of one of the company’s newly launched games that caused investors to question the future sales prospects of the company.
An individual holding within the Health Care Equipment & Services industry group posted a negative return. Edwards Lifesciences Corporation declined by -25% prior to being sold from the Fund. The company has struggled to meet expectations for its expansion into the minimally-invasive heart valve replacement market.
From a sector allocation perspective, the Fund’s performance was impaired by having an underweight exposure to the Financials sector, which was the strongest-performing sector of the S&P 500 Index during the period. In the post-Trump election environment, primarily in the 4th quarter of 2016, Financials led the market higher as they were perceived to be the most direct beneficiaries of President Trump’s pro-growth initiatives. We believed valuations for many companies in the sector became stretched very rapidly, and we found more compelling, longer-term growth investment opportunities in other sectors, such as Information Technology. Later in the reporting period, we identified select opportunities in Financials and increased our weight in the sector as the period progressed.
In addition, a 3% average cash weight posed a slight headwind to Fund performance during the period.
During the reporting period, the Fund reduced its exposure to the Consumer Discretionary, Materials and Industrials sectors. The Fund increased its allocations to the Information Technology, Health Care, Financials and Consumer Staples sectors. There was no significant change to the Fund’s allocation to the Real Estate(2) sector.
13
Fiscal Period-End Investment Posture
As of September 30, 2017, the Fund’s largest sector allocations included Information Technology, Health Care and Consumer Discretionary. As of that date, the Fund had no exposure to the Energy, Utilities or Telecommunication Services sectors.
Effective on and after December 1, 2016, Coralie Witter no longer served as a co-manager of the Marsico Growth Fund, and Thomas F. Marsico is solely responsible for day-to-day management of the Fund.
Sincerely,
THOMAS F. MARSICO
PORTFOLIO MANAGER
(1) | Total returns are based on net change in net asset value assuming reinvestment of distributions. Please see the Prospectus for more information. |
(2) | Through September 30, 2016, the Funds reported certain real estate investment trusts as having been classified within the Financials sector. These investments are now reported in the new GICS Real Estate sector. References to investment sector exposure included throughout this annual report reflect the impact of this change. |
14
September 30, 2017 (Unaudited)
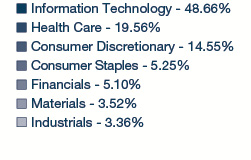
The Growth Fund is a diversified portfolio and invests primarily in the common stocks of large companies that are selected for their long-term growth potential. The Growth Fund will normally hold a core position of between 35 and 50 common stocks.
TOTAL ANNUAL OPERATING EXPENSES* 1.36% | NET ASSETS $266,921,832 | NET ASSET VALUE PER SHARE $18.47 |
GROWTH OF $10,000(1) | PERFORMANCE COMPARISON |
| |
SECTOR ALLOCATION(2) | TOP FIVE HOLDINGS |
| | | | |
| | Alibaba Group Holding Ltd. Spon. ADR | 5.66% | |
| | Visa, Inc. - Cl. A | 4.78% | |
| | Adobe Systems, Inc. | 4.06% | |
| | PayPal Holdings, Inc. | 3.69% | |
| | Facebook, Inc. - Cl. A | 3.63% | |
| | | | |
| * | The Total Annual Operating Expenses are reflective of the information disclosed in the Funds’ Prospectus dated January 30, 2017 and may differ from the expense ratio disclosed in this report. |
| The performance data quoted here represent past performance, and past performance is not a guarantee of future results. Investment return and principal value of an investment will fluctuate so that an investor’s shares, when redeemed, may be worth more or less than their original cost. Current performance may be lower or higher than the performance information quoted. To obtain performance information current to the most recent month-end, please call 888-860-8686 or visit marsicofunds.com. |
| The performance included in the chart and graph does not reflect the deduction of taxes on Fund distributions or the redemption of Fund shares. |
| All indices are unmanaged and investors cannot invest directly in an index. |
(1) | This chart assumes an initial investment of $10,000 made on September 30, 2007. Total returns are based on net change in NAV, assuming reinvestment of distributions. |
(2) | Sector weightings represent the percentage of the Fund’s investments (excluding cash equivalents) in certain general sectors. These sectors may include more than one industry. The Fund’s portfolio composition is subject to change at any time. |
15
MARSICO GROWTH FUND
SCHEDULE OF INVESTMENTS
September 30, 2017
| | | Number
of
Shares | | | Value | | | Percent
of Net
Assets | |
| COMMON STOCKS | | | | | | | | | |
| Aerospace & Defense | | | | | | | | | |
| Lockheed Martin Corporation | | | 30,332 | | | $ | 9,411,717 | | | | 3.52 | % |
| Raytheon Company | | | 31,428 | | | | 5,863,836 | | | | 2.20 | |
| | | | | | | | 15,275,553 | | | | 5.72 | |
| Application Software | | | | | | | | | | | | |
| Adobe Systems, Inc.* | | | 72,717 | | | | 10,847,922 | | | | 4.06 | |
| salesforce.com, inc.* | | | 90,863 | | | | 8,488,421 | | | | 3.18 | |
| | | | | | | | 19,336,343 | | | | 7.24 | |
| Biotechnology | | | | | | | | | | | | |
| Amgen, Inc. | | | 51,709 | | | | 9,641,143 | | | | 3.61 | |
| Celgene Corporation* | | | 54,671 | | | | 7,972,125 | | | | 2.99 | |
| | | | | | | | 17,613,268 | | | | 6.60 | |
| Brewers | | | | | | | | | | | | |
| Anheuser-Busch InBev S.A./N.V. | | | 53,842 | | | | 6,446,315 | | | | 2.42 | |
| | | | | | | | | | | | | |
| Data Processing & Outsourced Services | | | | | |
| PayPal Holdings, Inc.* | | | 153,764 | | | | 9,845,509 | | | | 3.69 | |
| Visa, Inc. - Cl. A | | | 121,278 | | | | 12,763,297 | | | | 4.78 | |
| | | | | | | | 22,608,806 | | | | 8.47 | |
| Distillers & Vintners | | | | | | | | | | | | |
| Constellation Brands, Inc. - Cl. A | | | 33,546 | | | | 6,690,750 | | | | 2.51 | |
| | | | | | | | | | | | | |
| Financial Exchanges & Data | | | | | | | | | |
| Intercontinental Exchange, Inc. | | | 57,579 | | | | 3,955,677 | | | | 1.48 | |
| | | | | | | | | | | | | |
| Health Care Equipment | | | | | | | | | | | | |
| Boston Scientific Corporation* | | | 150,353 | | | | 4,385,797 | | | | 1.64 | |
| | | | | | | | | | | | | |
| Health Care Services | | | | | | | | | | | | |
| Laboratory Corporation of America Holdings* | | | 46,035 | | | | 6,949,904 | | | | 2.60 | |
| | | | | | | | | | | | | |
| Hotel & Resort REITs | | | | | | | | | | | | |
| MGM Growth Properties LLC - Cl. A | | | 103,079 | | | | 3,114,017 | | | | 1.17 | |
| | | | | | | | | | | | | |
| Hotels, Resorts & Cruise Lines | | | | | |
| Norwegian Cruise Line Holdings Ltd.* | | | 116,431 | | | | 6,293,096 | | | | 2.36 | |
| | | | | | | | | | | | | |
| Internet & Direct Marketing Retail | | | | | |
| Amazon.com, Inc.* | | | 9,266 | | | | 8,907,869 | | | | 3.34 | |
| Netflix, Inc.* | | | 22,766 | | | | 4,128,614 | | | | 1.54 | |
| The Priceline Group, Inc.* | | | 4,633 | | | | 8,482,189 | | | | 3.18 | |
| | | | | | | | 21,518,672 | | | | 8.06 | |
COMMON STOCKS (continued) | | | | | | | | | |
| Internet Software & Services | | | | | | | | | |
| Alibaba Group Holding Ltd. Spon. ADR* | | | 87,498 | | | $ | 15,111,780 | | | | 5.66 | % |
| Alphabet, Inc. - Cl. A* | | | 9,493 | | | | 9,243,524 | | | | 3.46 | |
| Facebook, Inc. - Cl. A* | | | 56,624 | | | | 9,675,343 | | | | 3.63 | |
| Tencent Holdings Ltd. | | | 198,100 | | | | 8,525,938 | | | | 3.19 | |
| | | | | | | | 42,556,585 | | | | 15.94 | |
| Investment Banking & Brokerage | | | | | | | | | |
| The Charles Schwab Corporation | | | 99,291 | | | | 4,342,988 | | | | 1.63 | |
| | | | | | | | | | | | | |
| Managed Health Care | | | | | | | | | | | | |
| Anthem, Inc. | | | 29,840 | | | | 5,666,019 | | | | 2.12 | |
| UnitedHealth Group, Inc. | | | 47,060 | | | | 9,216,701 | | | | 3.46 | |
| | | | | | | | 14,882,720 | | | | 5.58 | |
| Multi-Sector Holdings | | | | | | | | | | | | |
| Berkshire Hathaway, Inc. - Cl. B* | | | 44,885 | | | | 8,228,318 | | | | 3.08 | |
| | | | | | | | | | | | | |
| Pharmaceuticals | | | | | | | | | | | | |
| Merck & Co., Inc. | | | 99,440 | | | | 6,367,143 | | | | 2.38 | |
| Zoetis, Inc. | | | 126,679 | | | | 8,077,053 | | | | 3.03 | |
| | | | | | | | 14,444,196 | | | | 5.41 | |
| Regional Banks | | | | | | | | | | | | |
| First Republic Bank | | | 57,608 | | | | 6,017,732 | | | | 2.26 | |
| | | | | | | | | | | | | |
| Semiconductor Equipment | | | | | | | | | | | | |
| Applied Materials, Inc. | | | 127,624 | | | | 6,647,934 | | | | 2.49 | |
| | | | | | | | | | | | | |
| Semiconductors | | | | | | | | | | | | |
| NVIDIA Corporation | | | 46,887 | | | | 8,381,989 | | | | 3.14 | |
| | | | | | | | | | | | | |
| Specialized REITs | | | | | | | | | | | | |
| Crown Castle International Corp. | | | 80,646 | | | | 8,062,987 | | | | 3.02 | |
| | | | | | | | | | | | | |
| Specialty Chemicals | | | | | | | | | | | | |
| The Sherwin-Williams Company | | | 17,682 | | | | 6,330,863 | | | | 2.37 | |
| | | | | | | | | | | | | |
| Technology Hardware, Storage & Peripherals | | | | | |
| Apple, Inc. | | | 56,960 | | | | 8,778,675 | | | | 3.29 | |
| | | | | | | | | | | | | |
| TOTAL COMMON STOCKS | | | | | | | | | | | | |
(Cost $179,890,246) | | | | | | | 262,863,185 | | | | 98.48 | |
| See notes to financial statements. |
16
| | | Number
of
Shares | | | Value | | | Percent
of Net
Assets | |
| SHORT-TERM INVESTMENTS | | | | |
| State Street Institutional Treasury Money Market Fund, 0.000% | | | 12,889,369 | | | $ | 12,889,369 | | | | 4.83 | % |
| | | | | | | | | | | | | |
| TOTAL SHORT-TERM INVESTMENTS | | | | | |
| (Cost $12,889,369) | | | | | | | 12,889,369 | | | | 4.83 | |
| | | | | | | | | | | | | |
| TOTAL INVESTMENTS | | | | | | | | | | | | |
(Cost $192,779,615) | | | | | | | 275,752,554 | | | | 103.31 | |
| | | | | | | | | | | | | |
| Liabilities, Less Cash and Other Assets | | | | | | | (8,830,722 | ) | | | (3.31 | ) |
| | | | | | | | | | | | | |
| NET ASSETS | | | | | | $ | 266,921,832 | | | | 100.00 | % |
| See notes to financial statements. |
17
INVESTMENT REVIEW BY BRANDON GEISLER (UNAUDITED)
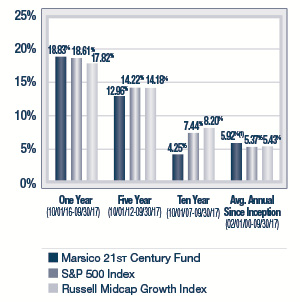
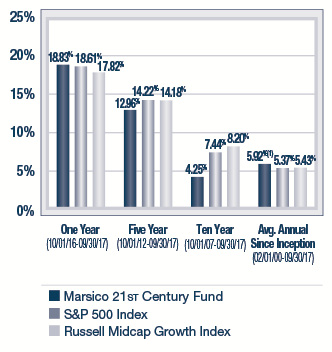
The Marsico 21st Century Fund posted a total return of +18.83% for the one-year fiscal period ended September 30, 2017. The Fund modestly outperformed the S&P 500 Index, the Fund’s primary benchmark index, which had a total return of +18.61% over the same time period. The Russell Midcap Growth Index, a proxy for the performance of medium-capitalization US equity securities (which may be a useful comparison in light of the Fund’s current medium-capitalization positioning), had a total return of +17.82%. Please see the Fund’s Overview for more detailed information about the Fund’s longer-term performance for various time periods ended September 30, 2017.
The performance data for the Fund quoted here represent past performance, and past performance is not a guarantee of future results. Investment return and principal value of an investment will fluctuate so that an investor’s shares, when redeemed, may be worth more or less than their original cost. Current performance may be lower or higher than the performance information quoted. To obtain performance information current to the most recent month-end, please call 888-860-8686 or visit marsicofunds.com.(1)
This review highlights Fund performance over a one-year fiscal period. Shareholders should keep in mind that the Fund is intended for long-term investors who hold their shares for substantially longer periods of time. You should also keep in mind that our current views and beliefs regarding all investments discussed in this report are subject to change at any time. References to specific securities, industries, and sectors discussed in this report are not recommendations to buy or sell such securities or related investments, and the Fund may not necessarily hold these securities or investments today. Please see the accompanying Schedule of Investments for the percentage of the Fund’s portfolio represented by the securities mentioned in this report as of the end of the reporting period.
The Fund is subject to broad risks associated with investing in equity securities markets generally, including the risks that the securities and markets in which it invests may experience volatility and instability, that domestic and global economies and markets may undergo periods of cyclical change and decline, that investors may at times avoid investments in equity securities, and that investments may not perform as anticipated. Please see the Prospectus for more information.
The Fund is not managed to track the benchmark index, and may hold a substantially overweight or underweight position in a sector, industry, or security compared to its weight in the benchmark. For informational purposes, the discussion below may compare the benchmark weight or performance of a sector or industry to the investment approach of the Fund.
The 21st Century Fund’s modest outperformance during the one-year period ended September 30, 2017 as compared to the S&P 500 Index was primarily attributable to certain holdings in the Consumer Discretionary sector and other sectors. Additionally, the Fund was aided by an overweight stance in the Information Technology sector and a lack of exposure to the weak-performing Energy sector.
In the Software & Services industry group, global payments network Mastercard, Inc. – Cl. A was up +40% over the last 12 months for a few reasons: 1) consumers’ continued shift from cash to electronic payments, 2) increasing share gains from e-commerce merchants (which only take electronic payments), 3) company specific actions including the acquisition of VocaLink in the UK, which allows Mastercard to enter a new arena of real-time ACH payments. The company also exceeded estimates each quarter and positively revised its revenue growth guidance at its analyst day in September.
Two Financials holdings, The Charles Schwab Corporation (+40%) and First Republic Bank (+36%), performed well during the period. At Schwab, business trends (especially increasing assets under management) remain excellent. In addition, the stock traded higher as the Federal Reserve raised interest rates, and we expect it to continue down that path. Higher interest rates typically result in higher net investment income at Schwab. Regional bank First Republic (“FIRC”) outperformed as part of a broader bank stock rally post the Donald Trump victory. We like FIRC’s position as a mid-size consumer bank serving markets with many technology businesses (such as San Francisco, Silicon Valley, and New York City). It is a long-term growth story as it pulls share from larger banks with exceptional customer service, often starting a banking relationship with a mortgage before cross-selling wealth management and other services.
In the Health Care sector, Intuitive Surgical, Inc. (+44%) was a top contributor. The company manufactures a robotic, surgical console that facilitates the ongoing migration from invasive open surgery to a minimally invasive approach. Minimally invasive surgery reduces complications, facilitates faster recovery, and reduces costs for the overall healthcare system. Intuitive Surgical has benefitted from the advancement of its surgical system to next generation instruments capable of more types of surgeries, which have performed more than 750,000 surgeries in 2016.
Salesforce.com, inc. shares rose +31% as the company is benefitting from rising demand for its cloud-based products, including services focused on e-commerce and artificial intelligence. Salesforce also announced a partnership, early in the period, with International Business Machines to integrate the artificial intelligence capabilities of both companies’ business
18
software and to attract customers by offering more advanced data analysis. As part of the partnership, IBM’s Watson can be integrated with Salesforce’s Einstein artificial intelligence service, with the objective of improving customer interactions in sales, service, marketing and commerce.
As mentioned above, Fund holdings in the Consumer Discretionary sector performed well. A position in cruise line operator Norwegian Cruise Line Holdings Ltd. posted a gain of +44% during the reporting period. Norwegian contributed to the Fund’s performance as the company reported improving demand trends for European itineraries, driving enthusiasm for a full recovery in pricing and bookings after a challenging year in 2016 caused by geopolitical events in the region. In addition, the company is benefitting from demographics as more baby-boomers retire and look to enjoy cruises and other experiences.
Several of the Fund’s holdings posted negative returns. Within the Health Care sector, Dexcom, Inc. (-46% prior to being sold) detracted from Fund performance. The company is commercializing its fifth generation continuous glucose monitoring (CGM) system for people with diabetes, but has faced product recalls, increased competition, and market expansion challenges which contributed to stock underperformance.
Consumer Staples company TreeHouse Foods, Inc. underperformed (-22%) due to a challenging period driven by integration issues with its newly acquired Private Brands business, and the announcement that a key executive left the company.
Automotive aftermarket parts retailer O’Reilly Automotive, Inc. (-23%) posted a negative return. This occurred as investors grew cautious over Amazon.com, Inc.’s entrance into the auto parts market and due to uncertainty regarding O’Reilly’s ability to outperform strong sales growth from the prior year. The Fund continued to hold shares of O’Reilly at period end because we believe it remains well-positioned for growth.
Cyber security firm Palo Alto Networks, Inc. slid -15% during the period and was sold from the Fund. Palo Alto was a detractor because the company missed market expectations for its January 2017 revenues and earnings.
While we still like the core business at Element Fleet Management Corporation, the largest auto fleet management business in North America, the company experienced complications surrounding the spinoff of the business from Element Financial that caused weakness in the stock (-33% prior to being sold).
From a sector allocation perspective, the Fund’s performance was impaired by having an underweight exposure (9% average weight over the period) to the Financials sector – the strongest-performing sector of the S&P 500 Index during the period. In the post-Trump election environment, primarily in the 4th quarter of 2016, Financials led the market higher as they were perceived to be the most direct beneficiaries of President Trump’s pro-growth initiatives. We believed valuations for many companies in the sector became stretched very rapidly, and we found more compelling, longer-term growth investment opportunities in other sectors, such as Information Technology.
In addition, a 4% average cash weight posed a modest headwind to Fund performance during the period.
The Fund invests across the market capitalization spectrum in companies of any size. Over the reporting period, the Fund continued to increase its exposure to medium-capitalization companies, as we believe these companies have compelling growth opportunities that may not be recognized by the broader market. However, the Fund continues to hold stocks in what we consider to be high quality large companies that we believe offer strong long-term growth potential.
During the reporting period, the Fund reduced its exposure to the Consumer Discretionary, Information Technology Telecommunication Services, and Consumer Staples sectors. The Fund increased its investment assets in the Real Estate(2) Materials, Industrials, Health Care, and Financials sectors.
19
Fiscal Period-End Investment Posture
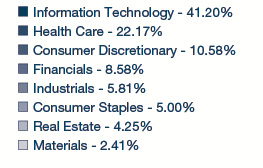
As of September 30, 2017, the Fund’s primary economic sector allocations included Information Technology, Consumer Discretionary and Health Care. The Fund had no investments in the Energy or Utilities sectors.
Sincerely,
BRANDON A. GEISLER
PORTFOLIO MANAGER
(1) | Total returns are based on net change in net asset value assuming reinvestment of distributions. Periodically, certain fees and expenses have been waived or reimbursed by the Adviser for the 21st Century Fund. In the absence of such a waiver or reimbursement, the performance returns reflected would have been reduced. In accordance with the expense limitation and fee waiver agreement, the Adviser may recoup fees and expenses previously waived or reimbursed under certain parameters. Periodically, the Adviser has recouped such fees or expenses from the 21st Century Fund, resulting in a lower performance return. Please see the Prospectus for more information. |
(2) | Through September 30, 2016, the Funds reported certain real estate investment trusts as having been classified within the Financials sector. These investments are now reported in the new GICS Real Estate sector. References to investment sector exposure included throughout this annual report reflect the impact of this change. |
20
21st CENTURY FUND OVERVIEW |
September 30, 2017 (Unaudited)
The 21st Century Fund is a diversified portfolio and invests primarily in common stocks that are selected for their long-term growth potential. The Fund may invest in companies of any size. The portions of Fund assets invested in large-capitalization, medium-capitalization, or small-capitalization companies will vary based on market conditions, depending on the portfolio manager’s judgment as to how to achieve the Fund’s investment objective. Under current market conditions the portfolio manager expects to invest substantially in medium-capitalization companies. The Fund will normally hold a core position of between 35 and 60 common stocks.
��
TOTAL ANNUAL OPERATING EXPENSES* 1.41% | NET ASSETS $234,322,251 | NET ASSET VALUE PER SHARE $26.19 |
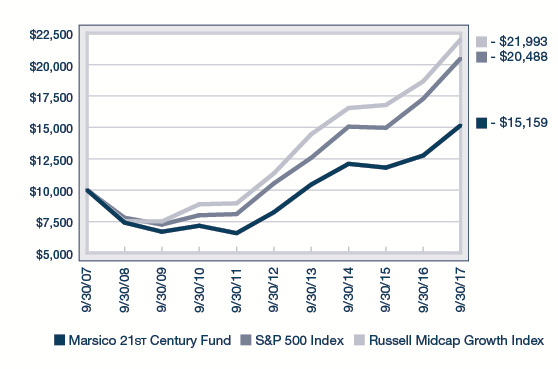
GROWTH OF $10,000(2) | PERFORMANCE COMPARISON |
| |
SECTOR ALLOCATION(3) | TOP FIVE HOLDINGS |
| | | | |
| | First Republic Bank | 3.42% | |
| | Mastercard, Inc. - Cl. A | 3.17% | |
| | Intuitive Surgical, Inc. | 3.13% | |
| | Constellation Brands, Inc. - Cl. A | 2.99% | |
| | salesforce.com, inc. | 2.94% | |
| | | | |
| * | The Total Annual Operating Expenses are reflective of the information disclosed in the Funds’ Prospectus dated January 30, 2017 and may differ from the expense ratio disclosed in this report. |
| The performance data quoted here represent past performance, and past performance is not a guarantee of future results. Investment return and principal value of an investment will fluctuate so that an investor’s shares, when redeemed, may be worth more or less than their original cost. Current performance may be lower or higher than the performance information quoted. To obtain performance information current to the most recent month-end, please call 888-860-8686 or visit marsicofunds.com. |
| The performance included in the chart and graph does not reflect the deduction of taxes on Fund distributions or the redemption of Fund shares. |
| All indices are unmanaged and investors cannot invest directly in an index. |
| The Russell Midcap Growth Index is the Fund’s supplemental benchmark index. The Russell Midcap Growth Index is an index composed of mid-capitalization US equities that exhibit growth characteristics. |
(1) | Periodically, certain fees and expenses have been waived or reimbursed by the Adviser for the 21st Century Fund. In the absence of such a waiver or reimbursement, the performance returns reflected would have been reduced. In accordance with the expense limitation and fee waiver agreement, the Adviser may recoup fees and expenses previously waived or reimbursed under certain parameters. Periodically, the Adviser has recouped such fees or expenses from the 21st Century Fund, resulting in a lower performance return. |
(2) | This chart assumes an initial investment of $10,000 made on September 30, 2007. Total returns are based on net change in NAV, assuming reinvestment of distributions. |
(3) | Sector weightings represent the percentage of the Fund’s investments (excluding cash equivalents) in certain general sectors. These sectors may include more than one industry. The Fund’s portfolio composition is subject to change at any time. |
21
MARSICO 21st CENTURY FUND
SCHEDULE OF INVESTMENTSSeptember 30, 2017
| | | Number
of
Shares | | | Value | | | Percent
of Net
Assets | |
| COMMON STOCKS | | | | | | | | | |
| Aerospace & Defense | | | | | | | | | |
| HEICO Corporation | | | 12,827 | | | $ | 1,151,993 | | | | 0.49 | % |
| | | | | | | | | | | | | |
| Airlines | | | | | | | | | | | | |
| Ryanair Holdings PLC Spon. ADR* | | | 10,743 | | | | 1,132,527 | | | | 0.48 | |
| | | | | | | | | | | | | |
| Apparel Retail | | | | | | | | | | | | |
| Burlington Stores, Inc.* | | | 48,805 | | | | 4,658,925 | | | | 1.99 | |
| | | | | | | | | | | | | |
| Apparel, Accessories & Luxury Goods | | | | | |
| lululemon athletica, inc.* | | | 42,206 | | | | 2,627,324 | | | | 1.12 | |
| | | | | | | | | | | | | |
| Application Software | | | | | | | | | | | | |
| Adobe Systems, Inc.* | | | 38,139 | | | | 5,689,576 | | | | 2.43 | |
| Atlassian Corporation PLC - Cl. A* | | | 39,927 | | | | 1,403,434 | | | | 0.60 | |
| PTC, Inc.* | | | 71,905 | | | | 4,046,813 | | | | 1.72 | |
| salesforce.com, inc.* | | | 73,785 | | | | 6,892,995 | | | | 2.94 | |
| Snap, Inc. - Cl. A* | | | 76,933 | | | | 1,118,606 | | | | 0.48 | |
| The Descartes Systems Group, Inc.* | | | 107,200 | | | | 2,923,675 | | | | 1.25 | |
| | | | | | | | 22,075,099 | | | | 9.42 | |
| Automobile Manufacturers | | | | | | | | | | | | |
| Tesla, Inc.* | | | 3,589 | | | | 1,224,208 | | | | 0.52 | |
| | | | | | | | | | | | | |
| Automotive Retail | | | | | | | | | | | | |
| O'Reilly Automotive, Inc.* | | | 14,646 | | | | 3,154,309 | | | | 1.35 | |
| | | | | | | | | | | | | |
| Biotechnology | | | | | | | | | | | | |
| Alkermes PLC* | | | 39,854 | | | | 2,026,177 | | | | 0.86 | |
| | | | | | | | | | | | | |
| Construction Materials | | | | | | | | | | | | |
| Vulcan Materials Company | | | 40,483 | | | | 4,841,767 | | | | 2.07 | |
| | | | | | | | | | | | | |
| Data Processing & Outsourced Services | | | | | |
| Broadridge Financial Solutions, Inc. | | | 55,281 | | | | 4,467,810 | | | | 1.91 | |
| FleetCor Technologies, Inc.* | | | 25,930 | | | | 4,013,186 | | | | 1.71 | |
| Mastercard, Inc. - Cl. A | | | 52,550 | | | | 7,420,060 | | | | 3.17 | |
| Vantiv, Inc. - Cl. A* | | | 72,563 | | | | 5,113,515 | | | | 2.18 | |
| | | | | | | | 21,014,571 | | | | 8.97 | |
| Distillers & Vintners | | | | | | | | | | | | |
| Constellation Brands, Inc. - Cl. A | | | 35,067 | | | | 6,994,113 | | | | 2.99 | |
| | | | | | | | | | | | | |
| Diversified Support Services | | | | | | | | | |
| Healthcare Services Group, Inc. | | | 103,117 | | | | 5,565,224 | | | | 2.38 | |
| | | | | | | | | | | | | |
| Electrical Components & Equipment | | | | | |
| AMETEK, Inc. | | | 56,218 | | | | 3,712,637 | | | | 1.58 | |
| | | | | | | | | | | | | |
| Electronic Equipment & Instruments | | | | | | | | | |
| Cognex Corporation | | | 12,368 | | | | 1,363,943 | | | | 0.58 | |
| | | | | | | | | | | | | |
| General Merchandise Stores | | | | | |
| Ollie's Bargain Outlet Holdings, Inc.* | | | 81,394 | | | | 3,776,682 | | | | 1.61 | |
COMMON STOCKS (continued) | | | | | | | | | |
| Health Care Equipment | | | | | | | | | | | | |
| Hologic, Inc.* | | | 52,860 | | | $ | 1,939,434 | | | | 0.83 | % |
| IDEXX Laboratories, Inc.* | | | 14,615 | | | | 2,272,486 | | | | 0.97 | |
| Intuitive Surgical, Inc.* | | | 7,008 | | | | 7,329,527 | | | | 3.13 | |
| LivaNova PLC* | | | 19,352 | | | | 1,355,801 | | | | 0.58 | |
| Teleflex, Inc. | | | 22,925 | | | | 5,547,162 | | | | 2.36 | |
| | | | | | | | 18,444,410 | | | | 7.87 | |
| Health Care Facilities | | | | | | | | | | | | |
| Acadia Healthcare Company, Inc.* | | | 78,555 | | | | 3,751,787 | | | | 1.60 | |
| | | | | | | | | | | | | |
| Home Entertainment Software | | | | | | | | | |
| Activision Blizzard, Inc. | | | 58,832 | | | | 3,795,252 | | | | 1.62 | |
| Take-Two Interactive Software, Inc.* | | | 24,838 | | | | 2,539,189 | | | | 1.08 | |
| | | | | | | | 6,334,441 | | | | 2.70 | |
| Hotels, Resorts & Cruise Lines | | | | | | | | | |
| Marriott International, Inc. - Cl. A | | | 33,630 | | | | 3,708,044 | | | | 1.58 | |
| Norwegian Cruise Line Holdings Ltd.* | | | 114,387 | | | | 6,182,617 | | | | 2.64 | |
| | | | | | | | 9,890,661 | | | | 4.22 | |
| Industrial Machinery | | | | | | | | | | | | |
| RBC Bearings, Inc.* | | | 5,866 | | | | 734,130 | | | | 0.31 | |
| | | | | | | | | | | | | |
| Internet & Direct Marketing Retail | | | | | | | | | |
| Ctrip.com International, Ltd. ADR* | | | 93,285 | | | | 4,919,851 | | | | 2.10 | |
| Netflix, Inc.* | | | 22,778 | | | | 4,130,790 | | | | 1.76 | |
| | | | | | | | 9,050,641 | | | | 3.86 | |
| Internet Software & Services | | | | | | | | | |
| CoStar Group, Inc.* | | | 23,131 | | | | 6,204,891 | | | | 2.65 | |
| Scout24 A.G. | | | 65,258 | | | | 2,668,644 | | | | 1.14 | |
| Twilio, Inc. - Cl. A* | | | 33,147 | | | | 989,438 | | | | 0.42 | |
| | | | | | | | 9,862,973 | | | | 4.21 | |
| Investment Banking & Brokerage | | | | | | | | | |
| The Charles Schwab Corporation | | | 133,916 | | | | 5,857,486 | | | | 2.50 | |
| | | | | | | | | | | | | |
| IT Consulting & Other Services | | | | | | | | | |
| Gartner, Inc.* | | | 38,816 | | | | 4,829,099 | | | | 2.06 | |
| | | | | | | | | | | | | |
| Metal & Glass Containers | | | | | | | | | | | | |
| Ball Corporation | | | 84,260 | | | | 3,479,938 | | | | 1.49 | |
| | | | | | | | | | | | | |
| Packaged Foods & Meats | | | | | | | | | | | | |
| Blue Buffalo Pet Products, Inc.* | | | 70,623 | | | | 2,002,162 | | | | 0.86 | |
| TreeHouse Foods, Inc.* | | | 48,450 | | | | 3,281,519 | | | | 1.40 | |
| | | | | | | | 5,283,681 | | | | 2.26 | |
| Pharmaceuticals | | | | | | | | | | | | |
| Pacira Pharmaceuticals, Inc.* | | | 38,675 | | | | 1,452,246 | | | | 0.62 | |
| | | | | | | | | | | | | |
| Railroads | | | | | | | | | | | | |
| Genesee & Wyoming, Inc. - Cl. A* | | | 63,960 | | | | 4,733,680 | | | | 2.02 | |
| | | | | | | | | | | | | |
| Real Estate Services | | | | | | | | | | | | |
| FirstService Corporation | | | 18,100 | | | | 1,189,356 | | | | 0.51 | |
| See notes to financial statements. |
22
| | | Number
of
Shares | | | Value | | | Percent
of Net
Assets | |
COMMON STOCKS (continued) | | | | | | | |
| Regional Banks | | | | | | | | | |
| First Republic Bank | | | 76,842 | | | $ | 8,026,915 | | | | 3.42 | % |
| Signature Bank* | | | 39,099 | | | | 5,006,236 | | | | 2.14 | |
| | | | | | | | 13,033,151 | | | | 5.56 | |
| Research & Consulting Services | | | | | | | | | |
| Verisk Analytics, Inc.* | | | 49,049 | | | | 4,080,386 | | | | 1.74 | |
| | | | | | | | | | | | | |
| Restaurants | | | | | | | | | | | | |
| Domino's Pizza, Inc. | | | 19,393 | | | | 3,850,480 | | | | 1.64 | |
| | | | | | | | | | | | | |
| Semiconductor Equipment | | | | | | | | | | | | |
| ASML Holding N.V. | | | 17,726 | | | | 3,034,691 | | | | 1.30 | |
| | | | | | | | | | | | | |
| Semiconductors | | | | | | | | | | | | |
| NVIDIA Corporation | | | 16,501 | | | | 2,949,884 | | | | 1.26 | |
| | | | | | | | | | | | | |
| Soft Drinks | | | | | | | | | | | | |
| Monster Beverage Corporation* | | | 83,895 | | | | 4,635,199 | | | | 1.98 | |
| | | | | | | | | | | | | |
| Specialized REITs | | | | | | | | | | | | |
| Crown Castle International Corp. | | | 46,674 | | | | 4,666,467 | | | | 1.99 | |
| SBA Communications Corporation - Cl. A* | | | 43,307 | | | | 6,238,373 | | | | 2.66 | |
| | | | | | | | 10,904,840 | | | | 4.65 | |
| Specialty Chemicals | | | | | | | | | | | | |
| The Sherwin-Williams Company | | | 15,007 | | | | 5,373,106 | | | | 2.29 | |
| | | | | | | | | | | | | |
| TOTAL COMMON STOCKS | | | | | | | | | | | | |
(Cost $152,483,652) | | | | | | | 218,075,765 | | | | 93.06 | |
| | | | | | | | | | | | | |
| SHORT-TERM INVESTMENTS | | | | | | | | | |
| State Street Institutional Treasury Money Market Fund, 0.000% | | | 15,925,232 | | | $ | 15,925,232 | | | | 6.80 | % |
| | | | | | | | | | | | | |
| TOTAL SHORT-TERM INVESTMENTS | | | | | | | | | |
| (Cost $15,925,232) | | | | | | | 15,925,232 | | | | 6.80 | |
| | | | | | | | | | | | | |
| TOTAL INVESTMENTS | | | | | | | | | | | | |
(Cost $168,408,884) | | | | | | | 234,000,997 | | | | 99.86 | |
| | | | | | | | | | | | | |
| Cash and Other Assets, Less Liabilities | | | | | | | 321,254 | | | | 0.14 | |
| | | | | | | | | | | | | |
| NET ASSETS | | | | | | $ | 234,322,251 | | | | 100.00 | % |
| See notes to financial statements. |
23
| INTERNATIONAL OPPORTUNITIES FUND |
INVESTMENT REVIEW BY TOM MARSICO AND ROB SUSMAN (UNAUDITED)
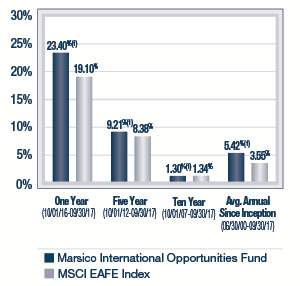
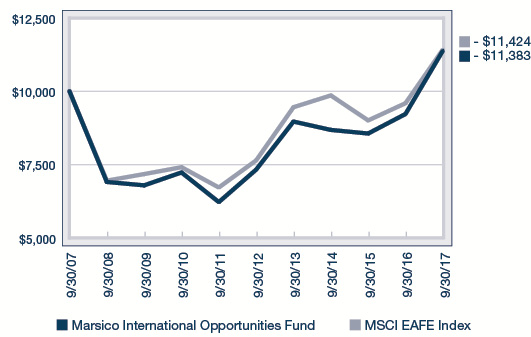
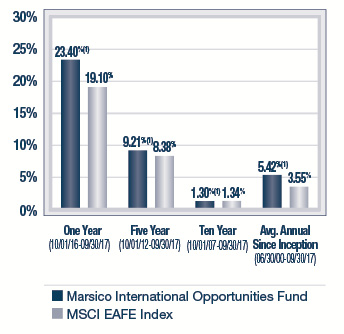
The Marsico International Opportunities Fund posted a total return of (US$) +23.40% for the one-year fiscal period ended September 30, 2017. In addition to posting a strong absolute return, the Fund outperformed the MSCI EAFE Index, the Fund’s benchmark index, which had a total return of (US$) +19.10% over the same time period. Please see the Fund’s Overview for more detailed information about the Fund’s longer-term performance for various time periods ended September 30, 2017.
The performance data for the Fund quoted here represent past performance, and past performance is not a guarantee of future results. Investment return and principal value of an investment will fluctuate so that an investor’s shares, when redeemed, may be worth more or less than their original cost. Current performance may be lower or higher than the performance information quoted. To obtain performance information current to the most recent month-end, please call 888-860-8686 or visit marsicofunds.com.(1)
This review highlights Fund performance over a one-year fiscal period. Shareholders should keep in mind that the Fund is intended for long-term investors who hold their shares for substantially longer periods of time. You should also keep in mind that our current views and beliefs regarding all investments discussed in this report are subject to change at any time. References to specific securities, industries, and sectors discussed in this report are not recommendations to buy or sell such securities or related investments, and the Fund may not necessarily hold these securities or investments today. Please see the accompanying Schedule of Investments for the percentage of the Fund’s portfolio represented by the securities mentioned in this report as of the end of the reporting period.
Foreign investments present additional risks due to currency fluctuations, economic and political factors, lower liquidity, differences in securities regulations and accounting standards, possible changes in taxation, limited public information, and other factors. In addition, the Fund is subject to broad risks associated with investing in equity securities markets generally, including the risks that the securities and markets in which it invests may experience volatility and instability, that domestic and global economies and markets may undergo periods of cyclical change and decline, that investors may at times avoid investments in equity securities, and that investments may not perform as anticipated. Please see the Prospectus for more information.
The Fund is not managed to track the benchmark index, and may hold a substantially overweight or underweight position in a sector, industry, or security compared to its weight in the benchmark. For informational purposes, the discussion below may compare the benchmark weight or performance of a sector or industry to the investment approach of the Fund.
The International Opportunities Fund’s outperformance during the one-year period ended September 30, 2017 as compared to the MSCI EAFE Index was primarily attributable to certain stock holdings in the Information Technology and Health Care sectors. In addition, the Fund benefited from an overweight allocation to the strong-performing Information Technology sector.
Several Information Technology stocks performed well over the last year. In particular, the Fund’s holdings within the Software & Services industry group, in aggregate, rose +49%, beating the broader MSCI EAFE Index return.
Wirecard A.G. (+76% during the period), a large European payment processor and merchant acquirer for online businesses, outperformed due to stronger than expected organic growth. Wirecard is an online pure play, meaning the company only processes payments for e-commerce businesses. This has exposed Wirecard to faster growing end-markets than payment processors that are exposed to brick and mortar retail businesses. Also, Wirecard’s acquisition of the Citi Prepaid Card Services has been integrated within Wirecard’s business and is realizing margin benefits sooner than originally expected.
ASML Holding N.V. posted a +56% return for the period. ASML is a critical supplier to the global semiconductor industry, and produces photolithography machines that are used to imprint the pattern of the circuits of a chip onto silicon wafers with a precision measured in nanometers. The company has benefitted from an improved spending backdrop from its customers that produce logic, memory, and other semiconductors used in smartphones and cars. ASML’s next generation machines are expected to drive revenue and earnings growth through 2020.
Tencent Holdings Ltd. (+58%) operates two of China’s top social networking digital platforms: QQ and WeChat. With these two large user bases of close to one billion monthly active users, Tencent was a strong contributor to the Fund in the period. The company reaccelerated its revenue growth in 2017 to above 50%, largely based on further monetization of its platform assets through gaming, advertising, and payments, which led to strong returns for the stock as estimates have been continually revised higher.
Chinese Internet conglomerate Alibaba Group Holding Ltd. Spon. ADR returned +63%. Alibaba has transformed itself from an e-commerce marketplace into a much broader platform that includes payments, search, logistics, supply-chain, cloud computing, and Internet media. Alibaba has created an ecosystem that includes Taobao, TMall and Alibaba.com to enable consumer to consumer, business to consumer, and business to business transactions, respectively. In addition, the company has created Alipay which allows users to pay via its platform, and AntFinancial which provides financing to businesses. The scale of these businesses reaches over 500 million people and spans over 200 countries, including China.
InterXion Holding N.V., a leading provider of cloud and colocation data centers in Europe, was a top contributor to the Fund (+40%) for three reasons. First, InterXion reported revenue and operating profit that were strong and exceeded expectations over the last 12 months. Second, tailwinds around colocation/retail data centers were strong and only got stronger as investors focused more on the growth of cloud computing in Europe. Last, speculation around a takeover of InterXion by a larger competitor grew throughout the year. We remain very confident in the company’s growth prospects as it expands throughout Europe.
24
| INTERNATIONAL OPPORTUNITIES FUND |
As mentioned above, the Fund was rewarded for an overweight stance in the strong-performing Information Technology sector. By the same measure, an underweight stance in the Telecommunication Services and Real Estate sectors contributed positively to the Fund’s performance compared to the MSCI EAFE Index.
There were a few positions that didn’t perform as anticipated and were detractors from performance. One of the Fund’s Consumer Discretionary holdings struggled during the period. Australia-based Domino’s Pizza Enterprises Ltd. (-31%) faced challenges as the company misfired on the European rollout of its new technology platform, leading to some customer frustration until the issues were resolved. After talking to the company’s CEO, Don Meij, we feel confident that management has learned from its missteps, and we remain optimistic about the long-term opportunities for store growth and operating margin expansion.
While we still like the core business at Element Fleet Management Corporation, the largest auto fleet management business in North America, the company experienced complications surrounding the spinoff of the business from Element Financial that caused weakness in the stock (-35% prior to being sold).
Health Care holding Medtronic PLC (-17% prior to being sold) develops therapeutic and diagnostic medical products for various surgical markets involving the cardiac, vascular, spine, pain, and diabetes markets. The company’s performance was hampered due to slower product launches and slower healthcare utilization in core surgical markets.
One of the Fund’s Industrials holdings, global data measurement company Nielsen Holdings PLC, posted a return of -22% during the period prior to being sold, and was a detractor from performance. It underperformed due to substantial missteps by management in addressing the changing landscape in its Consumer Packaged Goods (“CPG”) measurement business.
In terms of sector weights, the Fund was penalized for an underweight stance in the Financials sector and no exposure to the Materials sector, two of the stronger-performing sectors in the MSCI EAFE Index during the period.
Although active currency management is not a central facet of the Fund’s investment process, fluctuations in major world currencies can at times affect the Fund’s performance. During the period, the net effect of currency moves was strongly positive for the Fund. In particular, the Fund’s results were positively affected by having an underweight allocation, as compared to the MSCI EAFE Index, to investments denominated in the Japanese Yen.
There were a few shifts in the Fund’s sector allocations during the period. The Fund reduced its allocations to the Consumer Staples, Industrials and Consumer Discretionary sectors and increased its allocations to the Information Technology, Financials, Health Care, Telecommunication Services and Real Estate(2) sectors.
The International Opportunities Fund experienced slightly elevated portfolio turnover during the period, which primarily related to the Fund’s changing its portfolio composition to reinvest in other positions that we believe may have more upside potential, and to take advantage of new opportunities. Increased portfolio turnover increases transaction-related expenses, which could reduce Fund returns. Increased portfolio turnover also may result in higher taxes when Fund shares are held in a taxable account.
Fiscal Period-End Investment Posture
As of September 30, 2017, the Fund’s primary economic sector allocations included Information Technology, Consumer Discretionary, Health Care, and Financials. The Fund had no exposure to the Energy, Utilities, and Materials sectors.
In terms of country allocations, the Fund’s most significant weightings at period-end, excluding short-term investments, were Germany, United Kingdom, Netherlands, China/Hong Kong and Japan. Country-level weightings generally should be considered a residual of the Fund’s stock selection process rather than a major, proactive facet of its investment strategy.
Effective on and after July 1, 2017, Munish Malhotra no longer served as a manager of the Marsico International Opportunities Fund, and Thomas F. Marsico and Robert G. Susman, CFA, are co-managers of the Fund.
Sincerely,
THOMAS F. MARSICO
ROBERT G. SUSMAN, CFA
PORTFOLIO MANAGERS
(1) | Total returns are based on net change in net asset value assuming reinvestment of distributions. Periodically, certain fees and expenses have been waived or reimbursed by the Adviser for the International Opportunities Fund. In the absence of such a waiver or reimbursement, the performance returns reflected would have been reduced. In accordance with the expense limitation and fee waiver agreement, the Adviser may recoup fees and expenses previously waived or reimbursed under certain parameters. Periodically, the Adviser has recouped such fees or expenses from the International Opportunities Fund, resulting in a lower performance return. Please see the Prospectus for more information. |
(2) | Through September 30, 2016, the Funds reported certain real estate investment trusts as having been classified within the Financials sector. These investments are now reported in the new GICS Real Estate sector. References to investment sector exposure included throughout this annual report reflect the impact of this change. |
25
| INTERNATIONAL OPPORTUNITIES FUND OVERVIEW |
September 30, 2017 (Unaudited)
The International Opportunities Fund is a diversified portfolio and invests primarily (no less than 65% of its total assets) in common stocks of foreign companies that are selected for their long-term growth potential, including foreign securities, whether traded in the US (including as American Depositary Receipts) or in foreign markets or both. The Fund may invest in an unlimited number of companies of any size throughout the world. It normally invests in the securities of issuers that are economically tied to one or more foreign countries, and expects to be invested in various issuers or securities that together have ties to at least four different foreign countries. The Fund may invest in securities of companies economically tied to emerging markets. Some issuers or securities in the Fund’s portfolio may be economically tied to the US.
TOTAL ANNUAL OPERATING EXPENSES* 1.77% NET EXPENSES*† 1.60% | NET ASSETS $63,789,100 | NET ASSET VALUE PER SHARE $19.30 |
GROWTH OF $10,000(1)(2) | PERFORMANCE COMPARISON |
| |
SECTOR ALLOCATION(3) | TOP FIVE HOLDINGS |
| | | | |
| | ASML Holding N.V. | 4.71% | |
| | InterXion Holding N.V. | 4.64% | |
| | Alibaba Group Holding Ltd. Spon. ADR | 3.88% | |
| | Julius Baer Group Ltd. | 3.82% | |
| | Bayer A.G. | 3.82% | |
| | | | |
| * | The Total Annual Operating Expenses and Net Expenses are reflective of the information disclosed in the Funds’ Prospectus dated January 30, 2017 and may differ from the expense ratios disclosed in this report. |
| † | Marsico Capital Management, LLC (the “Adviser”) has entered into a written expense limitation and fee waiver agreement under which it has agreed to limit the total expenses of the International Opportunities Fund (excluding interest, taxes, acquired fund fees and expenses, litigation, brokerage and extraordinary expenses) to an annual rate of 1.60% of the Fund’s average net assets until January 31, 2018. This expense limitation and fee waiver agreement may be terminated by the Adviser at any time after January 31, 2018, upon 15 days prior notice to the Fund and its administrator. The Adviser may recoup from the Fund fees previously waived or expenses previously reimbursed by the Adviser with respect to the Fund pursuant to this agreement (or a previous expense limitation agreement) if: (1) such recoupment by the Adviser does not cause the Fund, at the time of recoupment, to exceed the lesser of (a) the expense limitation in effect at the time the relevant amount was waived and/or reimbursed, or (b) the expense limitation in effect at the time of the proposed recoupment, and (2) the recoupment is made within three fiscal years after the end of the fiscal year in which the amount was waived or reimbursed. |
| The performance data quoted here represent past performance, and past performance is not a guarantee of future results. Investment return and principal value of an investment will fluctuate so that an investor’s shares, when redeemed, may be worth more or less than their original cost. Current performance may be lower or higher than the performance information quoted. To obtain performance information current to the most recent month-end, please call 888-860-8686 or visit marsicofunds.com. |
| The performance included in the chart and graph does not reflect the deduction of taxes on Fund distributions or the redemption of Fund shares. |
| All indices are unmanaged and investors cannot invest directly in an index. |
| The MSCI EAFE Index tracks the stocks of about 1,000 companies in Europe, Australasia, and the Far East (EAFE). |
(1) | Periodically, certain fees and expenses have been waived or reimbursed by the Adviser for the International Opportunities Fund. In the absence of such a waiver or reimbursement, the performance returns reflected would have been reduced. In accordance with the expense limitation and fee waiver agreement, the Adviser may recoup fees and expenses previously waived or reimbursed under certain parameters. Periodically, the Adviser has recouped such fees or expenses from the International Opportunities Fund, resulting in a lower performance return. |
(2) | This chart assumes an initial investment of $10,000 made on September 30, 2007. Total returns are based on net change in NAV, assuming reinvestment of distributions. |
(3) | Sector weightings represent the percentage of the Fund’s investments (excluding cash equivalents) in certain general sectors. These sectors may include more than one industry. The Fund’s portfolio composition is subject to change at any time. |
26
MARSICO INTERNATIONAL OPPORTUNITIES FUND
SCHEDULE OF INVESTMENTS
September 30, 2017
| | | Number
of
Shares | | | Value | | | Percent
of Net
Assets | |
| COMMON STOCKS | | | | | | | | | |
| Airlines | | | | | | | | | |
| Ryanair Holdings PLC Spon. ADR* | | | 19,680 | | | $ | 2,074,666 | | | | 3.25 | % |
| | | | | | | | | | | | | |
| Apparel, Accessories & Luxury Goods | | | | | |
| lululemon athletica, inc.* | | | 12,647 | | | | 787,276 | | | | 1.23 | |
| | | | | | | | | | | | | |
| Application Software | | | | | | | | | | | | |
| Constellation Software, Inc. | | | 2,761 | | | | 1,506,330 | | | | 2.36 | |
| Dassault Systemes | | | 12,621 | | | | 1,276,726 | | | | 2.00 | |
| SAP S.E. | | | 11,329 | | | | 1,241,096 | | | | 1.95 | |
| | | | | | | | 4,024,152 | | | | 6.31 | |
| Asset Management & Custody Banks | | | | | |
| Hargreaves Lansdown PLC | | | 98,370 | | | | 1,950,873 | | | | 3.06 | |
| Julius Baer Group Ltd. | | | 41,230 | | | | 2,439,695 | | | | 3.82 | |
| | | | | | | | 4,390,568 | | | | 6.88 | |
| Biotechnology | | | | | | | | | | | | |
| Genmab A/S* | | | 3,350 | | | | 739,567 | | | | 1.16 | |
| | | | | | | | | | | | | |
| Brewers | | | | | | | | | | | | |
| Anheuser-Busch InBev S.A./N.V. | | | 15,104 | | | | 1,808,349 | | | | 2.84 | |
| | | | | | | | | | | | | |
| Casinos & Gaming | | | | | | | | | | | | |
| MGM China Holdings Ltd. | | | 737,200 | | | | 1,766,653 | | | | 2.77 | |
| | | | | | | | | | | | | |
| Data Processing & Outsourced Services | | | | | |
| Cielo S.A. | | | 70,500 | | | | 489,270 | | | | 0.77 | |
| Paysafe Group PLC* | | | 190,238 | | | | 1,484,902 | | | | 2.33 | |
| Vantiv, Inc. - Cl. A* | | | 15,228 | | | | 1,073,117 | | | | 1.68 | |
| Wirecard A.G. | | | 23,762 | | | | 2,174,007 | | | | 3.41 | |
| | | | | | | | 5,221,296 | | | | 8.19 | |
| Diversified Banks | | | | | | | | | | | | |
| HDFC Bank Ltd. ADR | | | 12,839 | | | | 1,237,294 | | | | 1.94 | |
| UniCredit SpA* | | | 22,621 | | | | 481,779 | | | | 0.75 | |
| | | | | | | | 1,719,073 | | | | 2.69 | |
| Financial Exchanges & Data | | | | | |
| Bolsa Mexicana de Valores S.A.B. de C.V. | | | 187,200 | | | | 313,028 | | | | 0.49 | |
| Deutsche Boerse A.G. | | | 11,504 | | | | 1,246,943 | | | | 1.96 | |
| | | | | | | | 1,559,971 | | | | 2.45 | |
| General Merchandise Stores | | | | | | | | | |
| Dollarama, Inc. | | | 12,529 | | | | 1,370,935 | | | | 2.15 | |
| | | | | | | | | | | | | |
| Health Care Distributors | | | | | | | | | | | | |
| Sinopharm Group Company Ltd. - Cl. H | | | 106,000 | | | | 466,793 | | | | 0.73 | |
| | | | | | | | | | | | | |
| Health Care Equipment | | | | | | | | | | | | |
| Koninklijke Philips N.V. | | | 48,620 | | | | 2,007,217 | | | | 3.15 | |
| | | | | | | | | | | | | |
| Home Entertainment Software | | | | | | | | | |
| Ubisoft Entertainment S.A.* | | | 26,851 | | | | 1,845,720 | | | | 2.89 | |
COMMON STOCKS (continued) | | | | | | | | | |
| Household Products | | | | | | | | | | | | |
| Reckitt Benckiser Group PLC | | | 18,672 | | | $ | 1,704,644 | | | | 2.67 | % |
| | | | | | | | | | | | | |
| Industrial Machinery | | | | | | | | | | | | |
| FANUC Corporation | | | 8,700 | | | | 1,762,035 | | | | 2.76 | |
| | | | | | | | | | | | | |
| Integrated Telecommunication Services | | | | | |
| Cellnex Telecom SA | | | 13,379 | | | | 306,133 | | | | 0.48 | |
| | | | | | | | | | | | | |
| Internet & Direct Marketing Retail | | | | | |
| ASOS PLC* | | | 8,198 | | | | 654,176 | | | | 1.02 | |
| Ctrip.com International, Ltd. ADR* | | | 33,371 | | | | 1,759,987 | | | | 2.76 | |
| MakeMyTrip Ltd.* | | | 27,198 | | | | 781,942 | | | | 1.23 | |
| Start Today Company Ltd. | | | 22,800 | | | | 722,346 | | | | 1.13 | |
| | | | | | | | 3,918,451 | | | | 6.14 | |
| Internet Software & Services | | | | | | | | | |
| Alibaba Group Holding Ltd. Spon. ADR* | | | 14,315 | | | | 2,472,344 | | | | 3.88 | |
| Just Eat PLC* | | | 84,355 | | | | 755,643 | | | | 1.18 | |
| Scout24 A.G. | | | 39,587 | | | | 1,618,861 | | | | 2.54 | |
| Tencent Holdings Ltd. | | | 51,600 | | | | 2,220,790 | | | | 3.48 | |
| | | | | | | | 7,067,638 | | | | 11.08 | |
| IT Consulting & Other Services | | | | | | | | | |
| InterXion Holding N.V.* | | | 58,168 | | | | 2,962,496 | | | | 4.64 | |
| | | | | | | | | | | | | |
| Life Sciences Tools & Services | | | | | | | | | |
| QIAGEN N.V. | | | 30,952 | | | | 974,988 | | | | 1.53 | |
| | | | | | | | | | | | | |
| Pharmaceuticals | | | | | | | | | | | | |
| Bayer A.G. | | | 17,889 | | | | 2,437,790 | | | | 3.82 | |
| Dechra Pharmaceuticals PLC | | | 44,072 | | | | 1,204,751 | | | | 1.89 | |
| | | | | | | | 3,642,541 | | | | 5.71 | |
| Publishing | | | | | | | | | | | | |
| Lifull Company Ltd. | | | 167,900 | | | | 1,459,286 | | | | 2.29 | |
| | | | | | | | | | | | | |
| Real Estate Operating Companies | | | | | | | | | |
| Aroundtown S.A. | | | 92,123 | | | | 659,814 | | | | 1.03 | |
| | | | | | | | | | | | | |
| Restaurants | | | | | | | | | | | | |
| Domino's Pizza Enterprises Ltd. | | | 42,508 | | | | 1,527,788 | | | | 2.40 | |
| Domino's Pizza Group PLC | | | 294,839 | | | | 1,225,551 | | | | 1.92 | |
| | | | | | | | 2,753,339 | | | | 4.32 | |
| Semiconductor Equipment | | | | | | | | | | | | |
| ASML Holding N.V. | | | 17,635 | | | | 3,002,407 | | | | 4.71 | |
| | | | | | | | | | | | | |
| Trading Companies & Distributors | | | | | | | | | |
| MISUMI Group, Inc. | | | 64,400 | | | | 1,695,776 | | | | 2.66 | |
| | | | | | | | | | | | | |
| Wireless Telecommunication Services | | | | | |
| SoftBank Group Corporation | | | 7,400 | | | | 597,393 | | | | 0.94 | |
| | | | | | | | | | | | | |
| TOTAL COMMON STOCKS | | | | | | | | | | | | |
| (Cost $48,365,810) | | | | | | | 62,289,177 | | | | 97.65 | |
| See notes to financial statements. |
27
MARSICO INTERNATIONAL OPPORTUNITIES FUND
SCHEDULE OF INVESTMENTS (continued)
September 30, 2017
| | | Number
of
Shares | | | Value | | | Percent
of Net
Assets | |
| SHORT-TERM INVESTMENTS | | | | | | | |
| State Street Institutional Treasury Money Market Fund, 0.000% | | | 1,893,432 | | | $ | 1,893,432 | | | | 2.97 | % |
| | | | | | | | | | | | | |
| TOTAL SHORT-TERM INVESTMENTS | | | | | | | | | |
| (Cost $1,893,432) | | | | | | | 1,893,432 | | | | 2.97 | |
| | | | | | | | | | | | | |
| TOTAL INVESTMENTS | | | | | | | | | | | | |
| (Cost $50,259,242) | | | | | | | 64,182,609 | | | | 100.62 | |
| | | | | | | | | | | | | |
| Liabilities, Less Cash and Other Assets | | | | | | | (393,509 | ) | | | (0.62 | ) |
| | | | | | | | | | | | | |
| NET ASSETS | | | | | | $ | 63,789,100 | | | | 100.00 | % |
| SUMMARY OF INVESTMENTS BY COUNTRY | |
| Country | | Market Value | | | Percent of
Investment
Securities | |
| Australia | | $ | 1,527,788 | | | | 2.38 | % |
| Belgium | | | 1,808,349 | | | | 2.82 | |
| Brazil | | | 489,270 | | | | 0.76 | |
| Canada | | | 2,877,265 | | | | 4.48 | |
| China/Hong Kong | | | 8,686,567 | | | | 13.53 | |
| Denmark | | | 739,567 | | | | 1.15 | |
| France | | | 3,122,446 | | | | 4.87 | |
| Germany | | | 9,378,511 | | | | 14.61 | |
| India | | | 2,019,236 | | | | 3.15 | |
| Ireland | | | 2,074,666 | | | | 3.23 | |
| Italy | | | 481,779 | | | | 0.75 | |
| Japan | | | 6,236,836 | | | | 9.72 | |
| Mexico | | | 313,028 | | | | 0.49 | |
| Netherlands | | | 8,947,108 | | | | 13.94 | |
| Spain | | | 306,133 | | | | 0.48 | |
| Switzerland | | | 2,439,695 | | | | 3.80 | |
| United Kingdom | | | 8,980,540 | | | | 13.99 | |
United States(1) | | | 3,753,825 | | | | 5.85 | |
| | | $ | 64,182,609 | | | | 100.00 | % |
(1) | Includes short-term securities. |
| See notes to financial statements. |
28
INVESTMENT REVIEW BY JORDON LAYCOB (UNAUDITED)
The Marsico Flexible Capital Fund posted a total return of +9.32% for the one-year fiscal period ended September 30, 2017. The Fund underperformed the S&P 500 Index, the Fund’s benchmark index, which had a total return of +18.61% over the same time period. Please see the Fund’s Overview for more detailed information about the Fund’s longer-term performance for various time periods ended September 30, 2017.
The performance data for the Fund quoted here represent past performance, and past performance is not a guarantee of future results. Investment return and principal value of an investment will fluctuate so that an investor’s shares, when redeemed, may be worth more or less than their original cost. Current performance may be lower or higher than the performance information quoted. To obtain performance information current to the most recent month-end, please call 888-860-8686 or visit marsicofunds.com. (1)
This review highlights Fund performance over a one-year fiscal period. Shareholders should keep in mind that the Fund is intended for long-term investors who hold their shares for substantially longer periods of time. You should also keep in mind that our current views and beliefs regarding all investments discussed in this report are subject to change at any time. References to specific securities, industries, and sectors discussed in this report are not recommendations to buy or sell such securities or related investments, and the Fund may not necessarily hold these securities or investments today. Please see the accompanying Schedule of Investments for the percentage of the Fund’s portfolio represented by the securities mentioned in this report as of the end of the reporting period.
The Fund is subject to broad risks associated with investing in equity securities markets generally, including the risks that the securities and markets in which it invests may experience volatility and instability, that domestic and global economies and markets may undergo periods of cyclical change and decline, that investors may at times avoid investments in equity securities, and that investments may not perform as anticipated. Please see the Prospectus for more information.
The Fund is not managed to track the benchmark index, and may hold a substantially overweight or underweight position in a sector, industry, or security compared to its weight in the benchmark. For informational purposes, the discussion below may compare the benchmark weight or performance of a sector or industry to the investment approach of the Fund.
The Flexible Capital Fund’s underperformance during the one-year period ended September 30, 2017 versus the S&P 500 Index was largely attributable to certain holdings in the Financials, Consumer Discretionary, Industrials and Consumer Staples sectors.
Given the Fund’s flexible mandate and ability to invest across the capital structure of a company, the Fund invested a small percentage of its assets (approximately 4% on average over the period) in preferred shares of certain banks and other financial firms, including Wells Fargo & Company, JPMorgan Chase & Co. and KeyCorp (sold during the period), The Charles Schwab Corporation, and Regions Financial Corporation. These investments provided stability and dividend yield to the Fund, but also modestly hampered the Fund’s relative performance in the rising equity market environment witnessed during the period.
A holding in the Industrials sector, Nielsen Holdings PLC, dropped -22% during the period and was sold from the Flexible Capital Fund. It underperformed due to substantial missteps by management in addressing the changing landscape in its consumer packaged goods measurement business.
In the Consumer Staples sector, a beer holding, Molson Coors Brewing Company – Cl. B, declined -17% and was sold from the Fund. Overall beer volumes were sluggish in the fourth quarter of 2016, due in part to unusually bad weather.
In the Consumer Discretionary sector, a position in Domino’s Pizza Group PLC, a United Kingdom-based master franchiser of pizza stores, posted a return of -12%. The company experienced a slowdown in overall same store sales. The Fund maintained a position in the stock at period end, as we believe these issues aren’t structural but rather are temporary cyclical matters. Automotive aftermarket parts retailer O’Reilly Automotive, Inc. (-23%) also posted a negative return during the period. This occurred as investors grew cautious over Amazon.com, Inc.’s entrance into the auto parts market and due to uncertainty regarding O’Reilly’s ability to outperform strong sales growth from the prior year. The Fund continued to hold shares of O’Reilly at period end because we believe the company remains well-positioned for growth.
TreeHouse Foods, Inc. (-18% prior to being sold) was another holding in the Consumer Staples sector that had a negative impact on Fund performance. Integration issues with its newly acquired Private Brands business, and the announcement that a key executive left the company caused weakness in the name.
From a sector allocation perspective, the Fund’s performance was impaired by having an overweight posture to the Consumer Discretionary sector.
29
On the positive side, Lockheed Martin Corporation was up (+33%) during the period on the back of strong underlying support for defense spending from both President Trump and Congress. The current product portfolio, including F-35 strike fighters and missile defense programs, should continue to perform well in an environment of elevated geopolitical concerns.
Beer-maker Constellation Brands, Inc. – Cl. A (+22%) continues to take significant market share with the company’s Mexican beer portfolio. The company’s operating margins also continue to improve as it has completed the transition to producing 100% of its beer supply. In addition, consistent marketing has helped the company’s Corona and Modelo brands outperform almost all other beer brands. In whole, Constellation’s various beer brands are contributing about 60% of the overall US beer market’s growth.
Visa, Inc. – Cl. A was one of the top Information Technology holdings for the Fund during the period (+28%), as the company continues to benefit from the shift in consumer behavior away from cash-transactions and toward online and e-commerce spending.
The Fund maintained no exposure to the Energy sector during the period, thereby benefitting relative to the S&P 500 Index in which Energy is a 7% average weight. The sector return was flat for the period, and significantly trailed the Index return of 19%. We continue to anticipate little growth for companies in the Energy sector, as technology developments increase the supply of oil and other potentially cleaner sources of energy for cars and homes. The Fund also was rewarded for an underweight stance in the Health Care sector, where returns were dampened in the beginning of the reporting period, due to the increased politicization of drug pricing, as well as uncertainty surrounding the future of the Affordable Care Act.
The Fund has a flexible mandate, and its allocations to equities, fixed income, preferred securities and cash may change over time. The Fund’s cash or cash equivalent position was slightly elevated (6%), particularly during the latter portions of the reporting period, as we assessed the direction of the markets. In a generally rising equity market, the Fund’s cash position was a modest drag on performance when measured over the full year period.
The Fund increased its holdings in the Health Care, Information Technology and Financials sectors, and trimmed or eliminated its allocations to the Consumer Staples, Telecommunication Services, Real Estate(2) and Industrials sectors. There was no significant change to the Fund’s allocation to the Materials and Consumer Discretionary sectors.
Fiscal Period-End Investment Posture
As of period-end, the Fund’s primary economic sector allocations included Consumer Discretionary, Information Technology, Industrials, Health Care and Financials. At period-end, the Fund had no exposure to the Energy, Utilities and Telecommunication Services sectors.
Effective on and after July 1, 2017, Munish Malhotra no longer served as a co-manager of the Marsico Flexible Capital Fund, and Jordon Laycob is solely responsible for day-to-day management of the Fund.
Sincerely,
JORDON S. LAYCOB
PORTFOLIO MANAGER
(1) | Total returns are based on net change in net asset value assuming reinvestment of distributions. Periodically, certain fees and expenses have been waived or reimbursed by the Adviser for the Flexible Capital Fund. In the absence of such a waiver or reimbursement, the performance returns reflected would have been reduced. In accordance with the expense limitation and fee waiver agreement, the Adviser may recoup fees and expenses previously waived or reimbursed under certain parameters. Please see the Prospectus for more information. |
(2) | Through September 30, 2016, the Funds reported certain real estate investment trusts as having been classified within the Financials sector. These investments are now reported in the new GICS Real Estate sector. References to investment sector exposure included throughout this annual report reflect the impact of this change. |
30
| FLEXIBLE CAPITAL FUND OVERVIEW |
September 30, 2017 (Unaudited)
The Flexible Capital Fund is a diversified portfolio and invests primarily in equity securities and other investments that are selected primarily for their long-term growth potential. The Fund may invest in issuers of any size throughout the world, and will normally hold a core position of between 20 and 50 securities or other investments.
TOTAL ANNUAL OPERATING EXPENSES* 1.37% | NET ASSETS $245,983,243 | NET ASSET VALUE PER SHARE $15.50 |
GROWTH OF $10,000(1)(2) | PERFORMANCE COMPARISON |
| |
SECTOR ALLOCATION(3) | TOP FIVE HOLDINGS |
| | | | |
| | Lockheed Martin Corporation | 5.71% | |
| | Visa, Inc. - Cl. A | 5.42% | |
| | Constellation Brands, Inc. - Cl. A | 4.48% | |
| | Apple, Inc. | 4.23% | |
| | Facebook, Inc. - Cl. A | 4.07% | |
| | | | |
| * | The Total Annual Operating Expenses are reflective of the information disclosed in the Funds’ Prospectus dated January 30, 2017 and may differ from the expense ratio disclosed in this report. |
| The performance data quoted here represent past performance, and past performance is not a guarantee of future results. Investment return and principal value of an investment will fluctuate so that an investor’s shares, when redeemed, may be worth more or less than their original cost. Current performance may be lower or higher than the performance information quoted. To obtain performance information current to the most recent month-end, please call 888-860-8686 or visit marsicofunds.com. |
| The performance included in the chart and graph does not reflect the deduction of taxes on Fund distributions or the redemption of Fund shares. |
| All indices are unmanaged and investors cannot invest directly in an index. |
(1) | Periodically, certain fees and expenses have been waived or reimbursed by the Adviser for the Flexible Capital Fund. In the absence of such a waiver or reimbursement, the performance returns reflected would have been reduced. In accordance with the expense limitation and fee waiver agreement, the Adviser may recoup fees and expenses previously waived or reimbursed under certain parameters. |
(2) | This chart assumes an initial investment of $10,000 made on September 30, 2007. Total returns are based on change in NAV, assuming reinvestment of distributions. |
(3) | Sector weightings represent the percentage of the Fund’s investments (excluding cash equivalents) in certain general sectors. These sectors may include more than one industry. The Fund’s portfolio composition is subject to change at any time. |
31
MARSICO FLEXIBLE CAPITAL FUND
SCHEDULE OF INVESTMENTS
September 30, 2017
| | | Number
of
Shares | | | Value | | | Percent
of Net
Assets | |
| COMMON STOCKS | | | | | | | | | |
| Aerospace & Defense | | | | | | | | | |
| BAE Systems PLC | | | 516,686 | | | $ | 4,372,247 | | | | 1.78 | % |
| Lockheed Martin Corporation | | | 45,288 | | | | 14,052,413 | | | | 5.71 | |
| | | | | | | | 18,424,660 | | | | 7.49 | |
| Airport Services | | | | | | | | | | | | |
| Macquarie Infrastructure Corporation | | | 88,696 | | | | 6,402,077 | | | | 2.60 | |
| | | | | | | | | | | | | |
| Automotive Retail | | | | | | | | | | | | |
| O'Reilly Automotive, Inc.* | | | 24,425 | | | | 5,260,412 | | | | 2.14 | |
| | | | | | | | | | | | | |
| Biotechnology | | | | | | | | | | | | |
| Amgen, Inc. | | | 42,723 | | | | 7,965,703 | | | | 3.24 | |
| | | | | | | | | | | | | |
| Brewers | | | | | | | | | | | | |
| Anheuser-Busch InBev S.A./N.V. | | | 30,445 | | | | 3,645,074 | | | | 1.48 | |
| | | | | | | | | | | | | |
| Broadcasting | | | | | | | | | | | | |
| CBS Corporation - Cl. B | | | 36,947 | | | | 2,142,926 | | | | 0.87 | |
| | | | | | | | | | | | | |
| Casinos & Gaming | | | | | | | | | | | | |
| Red Rock Resorts, Inc. - Cl. A | | | 68,409 | | | | 1,584,352 | | | | 0.64 | |
| | | | | | | | | | | | | |
| Data Processing & Outsourced Services | | | | | |
| Visa, Inc. - Cl. A | | | 126,675 | | | | 13,331,277 | | | | 5.42 | |
| | | | | | | | | | | | | |
| Distillers & Vintners | | | | | | | | | | | | |
| Constellation Brands, Inc. - Cl. A | | | 55,317 | | | | 11,032,976 | | | | 4.48 | |
| | | | | | | | | | | | | |
| Environmental & Facilities Services | | | | | |
| Waste Management, Inc. | | | 92,089 | | | | 7,207,806 | | | | 2.93 | |
| | | | | | | | | | | | | |
| Financial Exchanges & Data | | | | | |
| CME Group, Inc. | | | 54,812 | | | | 7,436,892 | | | | 3.02 | |
| | | | | | | | | | | | | |
| General Merchandise Stores | | | | | | | | | |
| Target Corporation | | | 86,293 | | | | 5,092,150 | | | | 2.07 | |
| | | | | | | | | | | | | |
| Health Care Equipment | | | | | |
| Zimmer Biomet Holdings, Inc. | | | 41,427 | | | | 4,850,687 | | | | 1.97 | |
| | | | | | | | | | | | | |
| Home Improvement Retail | | | | | | | | | | | | |
| The Home Depot, Inc. | | | 33,053 | | | | 5,406,149 | | | | 2.20 | |
| | | | | | | | | | | | | |
| Hotels, Resorts & Cruise Lines | | | | | |
| Hilton Grand Vacations, Inc.* | | | 134,324 | | | | 5,188,936 | | | | 2.11 | |
| | | | | | | | | | | | | |
| Internet Software & Services | | | | | | | | | |
| Alphabet, Inc. - Cl. A* | | | 9,218 | | | | 8,975,751 | | | | 3.65 | |
| Facebook, Inc. - Cl. A* | | | 58,619 | | | | 10,016,229 | | | | 4.07 | |
| | | | | | | | 18,991,980 | | | | 7.72 | |
COMMON STOCKS (continued) | | | | | | | | | |
| Leisure Facilities | | | | | | | | | | | | |
| Six Flags Entertainment Corporation | | | 90,874 | | | $ | 5,537,862 | | | | 2.25 | % |
| | | | | | | | | | | | | |
| Managed Health Care | | | | | | | | | | | | |
| Anthem, Inc. | | | 31,893 | | | | 6,055,843 | | | | 2.46 | |
| | | | | | | | | | | | | |
| Mortgage REITs | | | | | | | | | | | | |
| Starwood Property Trust, Inc. | | | 375,761 | | | | 8,161,529 | | | | 3.32 | |
| | | | | | | | | | | | | |
| Movies & Entertainment | | | | | | | | | | | | |
| Time Warner, Inc. | | | 66,035 | | | | 6,765,286 | | | | 2.75 | |
| | | | | | | | | | | | | |
| Packaged Foods & Meats | | | | | | | | | | | | |
| Mondelez International, Inc. - Cl. A | | | 30,438 | | | | 1,237,609 | | | | 0.50 | |
| | | | | | | | | | | | | |
| Pharmaceuticals | | | | | | | | | | | | |
| Johnson & Johnson | | | 68,803 | | | | 8,945,078 | | | | 3.64 | |
| | | | | | | | | | | | | |
| Regional Banks | | | | | | | | | | | | |
| Signature Bank* | | | 27,651 | | | | 3,540,434 | | | | 1.44 | |
| | | | | | | | | | | | | |
| Restaurants | | | | | | | | | | | | |
| Domino's Pizza Group PLC | | | 1,662,453 | | | | 6,910,282 | | | | 2.81 | |
| | | | | | | | | | | | | |
| Semiconductors | | | | | | | | | | | | |
| Texas Instruments, Inc. | | | 68,225 | | | | 6,115,689 | | | | 2.49 | |
| | | | | | | | | | | | | |
| Specialized REITs | | | | | | | | | | | | |
| Crown Castle International Corp. | | | 93,131 | | | | 9,311,237 | | | | 3.79 | |
| | | | | | | | | | | | | |
| Systems Software | | | | | | | | | | | | |
| Microsoft Corporation | | | 36,566 | | | | 2,723,801 | | | | 1.11 | |
| | | | | | | | | | | | | |
| Technology Hardware, Storage & Peripherals | | | | | |
| Apple, Inc. | | | 67,488 | | | | 10,401,251 | | | | 4.23 | |
| | | | | | | | | | | | | |
| TOTAL COMMON STOCKS | | | | | | | | | | | | |
(Cost $150,557,043) | | | | | | | 199,669,958 | | | | 81.17 | |
| | | | | | | | | | | | | |
| CONVERTIBLE PREFERRED STOCKS | | | | | |
| Pharmaceuticals | | | | | | | | | | | | |
| Allergan PLC, Series A, 5.500%, 3/1/18 | | | 4,091 | | | | 3,018,422 | | | | 1.23 | |
| | | | | | | | | | | | | |
| TOTAL CONVERTIBLE PREFERRED STOCKS | | | | | |
| (Cost $3,343,424) | | | | | | | 3,018,422 | | | | 1.23 | |
| See notes to financial statements. |
32
| | | Par Value/
Number
of Shares | | | Value | | | Percent
of Net
Assets | |
| CORPORATE BONDS | | | | | | | | | |
| Casinos & Gaming | | | | | | | | | |
| MGM Resorts International, 6.625%, 12/15/21 | | $ | 3,500,000 | | | $ | 3,937,500 | | | | 1.60 | % |
| | | | | | | | | | | | | |
| General Merchandise Stores | | | | | |
| Dollar Tree, Inc., 5.750%, 3/1/23 | | | 5,000,000 | | | | 5,275,000 | | | | 2.14 | |
| | | | | | | | | | | | | |
| Metal & Glass Containers | | | | | | | | | | | | |
| Ball Corp., 4.000%, 11/15/23 | | | 4,000,000 | | | | 4,090,000 | | | | 1.66 | |
| | | | | | | | | | | | | |
| Movies & Entertainment | | | | | | | | | | | | |
Lions Gate Entertainment Corporation 144A, 5.875%, 11/1/24† | | | 1,000,000 | | | | 1,050,000 | | | | 0.43 | |
| | | | | | | | | | | | | |
| Restaurants | | | | | | | | | | | | |
| Yum! Brands, Inc., 6.875%, 11/15/37 | | | 3,000,000 | | | | 3,296,250 | | | | 1.34 | |
| | | | | | | | | | | | | |
| TOTAL CORPORATE BONDS | | | | | | | | | |
| (Cost $16,232,341) | | | | | | | 17,648,750 | | | | 7.17 | |
| | | | | | | | | | | | | |
| PREFERRED STOCKS | | | | | | | | | | | | |
| Diversified Banks | | | | | | | | | | | | |
| JPMorgan Chase & Co., Series BB, 6.150%, Perpetual Maturity | | | 94,101 | | | | 2,549,196 | | | | 1.03 | |
| Wells Fargo & Company, Series N, 5.200%, Perpetual Maturity | | | 102,044 | | | | 2,552,121 | | | | 1.04 | |
| | | | | | | | 5,101,317 | | | | 2.07 | |
| Investment Banking & Brokerage | | | | | |
| The Charles Schwab Corporation, Series C, 6.000%, Perpetual Maturity | | | 93,162 | | | | 2,528,417 | | | | 1.03 | |
| | | | | | | | | | | | | |
| Regional Banks | | | | | | | | | | | | |
| Regions Financial Corporation, Series A, 6.375%, Perpetual Maturity | | | 74,183 | | | | 1,887,957 | | | | 0.77 | |
| | | | | | | | | | | | | |
| TOTAL PREFERRED STOCKS | | | | | | | | | |
| (Cost $8,982,862) | | | | | | | 9,517,691 | | | | 3.87 | |
| | | Number
of
Shares | | | Value | | | Percent
of Net
Assets | |
| SHORT-TERM INVESTMENTS | | | | | | | |
| State Street Institutional Treasury Money Market Fund, 0.000% | | | 14,751,151 | | | $ | 14,751,151 | | | | 6.00 | % |
| | | | | | | | | | | | | |
| TOTAL SHORT-TERM INVESTMENTS | | | | | |
| (Cost $14,751,151) | | | | | | | 14,751,151 | | | | 6.00 | |
| | | | | | | | | | | | | |
| TOTAL INVESTMENTS | | | | | | | | | | | | |
(Cost $193,866,821) | | | | | | | 244,605,972 | | | | 99.44 | |
| | | | | | | | | | | | | |
| Cash and Other Assets, Less Liabilities | | | | | | | 1,377,271 | | | | 0.56 | |
| | | | | | | | | | | | | |
| NET ASSETS | | | | | | $ | 245,983,243 | | | | 100.00 | % |
| † | These securities have been determined to be liquid under guidelines established by the Board of Trustees. At September 30, 2017, the total value of the Fund’s 144A securities was 0.43% of net assets. |
| See notes to financial statements. |
33
INVESTMENT REVIEW BY TOM MARSICO (UNAUDITED)
The Marsico Global Fund posted a total return of (US$) +25.77% for the one-year fiscal period ended September 30, 2017. In addition to posting a strong absolute return, the Fund outperformed the MSCI All Country World Index (“MSCI ACWI Index”), the Fund’s benchmark index, which had a total return of (US$) +18.65% over the same time period. The MSCI ACWI Index measures equity market performance in the global developed and emerging markets. Please see the Fund’s Overview for more detailed information about the Fund’s longer-term performance for various time periods ended September 30, 2017.
The performance data for the Fund quoted here represent past performance, and past performance is not a guarantee of future results. Investment return and principal value of an investment will fluctuate so that an investor’s shares, when redeemed, may be worth more or less than their original cost. Current performance may be lower or higher than the performance information quoted. To obtain performance information current to the most recent month-end, please call 888-860-8686 or visit marsicofunds.com.(1)
This review highlights Fund performance over a one-year fiscal period. Shareholders should keep in mind that the Fund is intended for long-term investors who hold their shares for substantially longer periods of time. You should also keep in mind that our current views and beliefs regarding all investments discussed in this report are subject to change at any time. References to specific securities, industries, and sectors discussed in this report are not recommendations to buy or sell such securities or related investments, and the Fund may not necessarily hold these securities or investments today. Please see the accompanying Schedule of Investments for the percentage of the Fund’s portfolio represented by the securities mentioned in this report as of the end of the reporting period.
Foreign investments present additional risks due to currency fluctuations, economic and political factors, lower liquidity, differences in securities regulations and accounting standards, possible changes in taxation, limited public information, and other factors. In addition, the Fund is subject to broad risks associated with investing in equity securities markets generally, including the risks that the securities and markets in which it invests may experience volatility and instability, that domestic and global economies and markets may undergo periods of cyclical change and decline, that investors may at times avoid investments in equity securities, and that investments may not perform as anticipated. Please see the Prospectus for more information.
The Fund is not managed to track the benchmark index, and may hold a substantially overweight or underweight position in a sector, industry, or security compared to its weight in the benchmark. For informational purposes, the discussion below may compare the benchmark weight or performance of a sector or industry to the investment approach of the Fund.
The Global Fund’s outperformance during the one-year period ended September 30, 2017 versus the MSCI ACWI Index was primarily attributable to certain holdings in the Information Technology and Health Care sectors. The Fund was also aided by an overweight allocation to the strong-performing Information Technology sector and by a lack of exposure to the weak-performing Energy sector, as well as other factors discussed below.
Chinese Internet conglomerate Alibaba Group Holding Ltd. Spon. ADR returned +63%. Alibaba has transformed itself from an e-commerce marketplace into a much broader platform that includes payments, search, logistics, supply-chain, cloud computing, and Internet media. Alibaba has created an ecosystem that includes Taobao, TMall and Alibaba.com to enable consumer to consumer, business to consumer, and business to business transactions, respectively. In addition, the company has created Alipay which allows users to pay via its platform, and AntFinancial which provides financing to businesses. The scale of these businesses reaches over 500 million people and spans over 200 countries, including China.
Tencent Holdings Ltd. (+57%) operates two of China’s top social networking digital platforms: QQ and WeChat. With these two large user bases of close to one billion monthly active users, Tencent was a strong contributor to the Fund in the period. The company reaccelerated its revenue growth in 2017 to above 50%, largely based on further monetization of its platform assets through gaming, advertising, and payments, which led to strong returns for the stock as estimates have been continually revised higher.
A position in Graphics Processing Unit (“GPU”) maker NVIDIA Corporation rose +60% as investors began to understand and appreciate the growth opportunities for the company in several different verticals. Nvidia offers the most powerful graphics cards for the latest PC games that need to be run on the highest specs to get the most out of game play. A major competitor launched a new line of graphics cards earlier this year, but appears to have fallen short of the technical requirements to play the latest popular titles. Additionally, Nvidia’s burgeoning datacenter and automotive businesses are beginning to show more promise as the next legs of growth for the company.
Social network company Facebook, Inc. – Cl. A (+33%) has been anchored by consistent user engagement and monetization of its core Facebook application, and the company’s impressive results this year have also been driven by its Instagram property. The monetization of Instagram has allowed Facebook’s advertising revenue to re-accelerate, driving operating margins higher. This, in turn, has powered significant free cash flow growth – permitting Facebook to reinvest in its core business and in new innovation initiatives that we believe should fuel consistency and sustainability of growth.
Ubisoft Entertainment S.A., a French video game publisher, reported robust operating results throughout the year leading to strong performance (71%). Operating results were driven by a successful product lineup and strong user engagement across Ubisoft’s portfolio. Profit margins expanded significantly, and should continue to do so as more games are downloaded digitally and more users purchase in-game digital items to advance their experience within the game. These emerging sales drivers carry significantly higher profit margins leading to increased visibility in profit growth for years to come.
34
As mentioned above, the Fund was aided by an overweight allocation to the strong-performing Information Technology sector and an underweight stance in the weak-performing Consumer Staples sector. The Fund also benefitted from having no exposure to the Energy, Real Estate, and Telecommunication Services sectors.
One of the Fund’s positions in the Consumer Services industry was the top detractor from performance. Australia-based Domino’s Pizza Enterprises Ltd. (-32%) faced challenges as the company misfired on the European rollout of its new technology platform, leading to some customer frustration until the issues were resolved. After talking to the company’s CEO, Don Meij, we feel confident that management has learned from its missteps, and we remain optimistic about the long-term opportunities for store growth and operating margin expansion.
A holding in the Industrials sector, Nielsen Holdings PLC, dropped -21% during the period and was sold from the Fund. It underperformed due to substantial missteps by management in addressing the changing landscape in its consumer packaged goods measurement business.
Chinese online travel marketplace Ctrip.com International, Ltd. ADR was an underperformer over the period (-15%) because of concerns around the possibility of a new regulatory headwind. China’s civil aviation authority has issued new guidelines for the airlines it oversees with regards to selling add-on services for airline tickets (e.g., lounge seats and travel insurance). While Ctrip is not regulated by this authority, the company’s management has indicated that it will comply with guidelines for the airlines in spirit. We believe this will likely negatively impact cross-selling revenues, but we also believe the market is over-reacting to the issue, and the Fund maintained a position in the stock at period end.
A select Consumer Staples holding detracted from performance. Anheuser-Busch InBev S.A./N.V. (“ABI”) posted a return of -8%. ABI underperformed in the period as fourth quarter results were challenged by a weak Brazilian economy, a strong dollar, and market share losses in developed markets. We expect earnings to reaccelerate in 2018 as the company emerges from past comparisons with an unfavorable currency environment and begins to realize synergies from its newly acquired international beer company, SABMiller, a process that is taking a bit longer than expected due to recent natural disasters in Mexico and the US.
The Fund’s performance also was held back by having an underweight allocation to the strongest-performing sector of the MSCI ACWI Index, Financials.
Although active currency management is not a central facet of the Fund’s investment process, fluctuations in major world currencies can at times affect the Fund’s performance. During the period, the net effect of currency moves was strongly positive for the Fund. In particular, the Fund’s results were positively affected by having an overweight allocation, as compared to the MSCI ACWI Index, to investments denominated in the Euro.
During the period, the Fund increased its allocations to the Information Technology, Health Care, Financials and Consumer Staples sectors. The Fund reduced its positions in the Consumer Discretionary and Industrials sectors. There was no significant change to the Fund’s allocation to the Materials sector.
Fiscal Period-End Investment Posture
As of September 30, 2017, the Fund’s primary economic sector allocations were Information Technology, Consumer Discretionary and Health Care. The Fund had no investments in the Real Estate(2), Energy, Telecommunication Services or Utilities sectors. The Fund’s most significant country allocations were the United States, China/Hong Kong, Netherlands and France. Country-level weightings generally should be considered a residual of the Fund’s stock selection process rather than a major, proactive facet of its investment strategy.
Sincerely,
THOMAS F. MARSICO
PORTFOLIO MANAGER
(1) | Total returns are based on net change in net asset value assuming reinvestment of distributions. Periodically, certain fees and expenses have been waived or reimbursed by the Adviser for the Global Fund. In the absence of such a waiver or reimbursement, the performance returns reflected would have been reduced. In accordance with the expense limitation and fee waiver agreement, the Adviser may recoup fees and expenses previously waived or reimbursed under certain parameters. Periodically, the Adviser has recouped such fees or expenses from the Global Fund, resulting in a lower performance return. Please see the Prospectus for more information. |
(2) | Through September 30, 2016, the Funds reported certain real estate investment trusts as having been classified within the Financials sector. These investments are now reported in the new GICS Real Estate sector. References to investment sector exposure included throughout this annual report reflect the impact of this change. |
35
September 30, 2017 (Unaudited)
The Global Fund is a diversified portfolio and invests primarily in the common stocks of US and foreign companies that are selected for their long-term growth potential. The Fund may invest in an unlimited number of companies of any size that are economically tied to any countries or markets throughout the world, including securities of companies economically tied to emerging markets. Under normal market conditions, the Fund will invest significantly (generally, at least 40% of its net assets) in the securities of issuers organized or located outside the US or doing business outside the US or other foreign securities (unless market conditions are not deemed favorable by the Adviser, in which case the Fund generally will invest at least 30% of its assets in such foreign securities). The Fund will invest its assets in various regions and countries, including the US, that encompass not less than three different countries overall.
TOTAL ANNUAL OPERATING EXPENSES* 1.69% NET EXPENSES*† 1.60% | NET ASSETS $44,493,135 | NET ASSET VALUE PER SHARE $15.13 |
GROWTH OF $10,000(1)(2) | PERFORMANCE COMPARISON |
| |
SECTOR ALLOCATION(3) | TOP FIVE HOLDINGS |
| | | | |
| | Tencent Holdings Ltd. | 5.85% | |
| | Alibaba Group Holding Ltd. Spon. ADR | 5.68% | |
| | Ubisoft Entertainment S.A. | 4.41% | |
| | Hermes International | 3.85% | |
| | Anheuser-Busch InBev S.A./N.V. | 3.61% | |
| | | | |
| * | The Total Annual Operating Expenses and Net Expenses are reflective of the information disclosed in the Funds’ Prospectus dated January 30, 2017 and may differ from the expense ratios disclosed in this report. |
| † | Marsico Capital Management, LLC (the “Adviser”) has entered into a written expense limitation and fee waiver agreement under which it has agreed to limit the total expenses of the Global Fund (excluding interest, taxes, acquired fund fees and expenses, litigation, brokerage and extraordinary expenses) to an annual rate of 1.60% of the Fund’s average net assets until January 31, 2018. This expense limitation and fee waiver agreement may be terminated by the Adviser at any time after January 31, 2018, upon 15 days prior notice to the Fund and its administrator. The Adviser may recoup from the Fund fees previously waived or expenses previously reimbursed by the Adviser with respect to the Fund pursuant to this agreement (or a previous expense limitation agreement) if: (1) such recoupment by the Adviser does not cause the Fund, at the time of recoupment, to exceed the lesser of (a) the expense limitation in effect at the time the relevant amount was waived and/or reimbursed, or (b) the expense limitation in effect at the time of the proposed recoupment, and (2) the recoupment is made within three fiscal years after the end of the fiscal year in which the amount was waived or reimbursed. |
| The performance data quoted here represent past performance, and past performance is not a guarantee of future results. Investment return and principal value of an investment will fluctuate so that an investor’s shares, when redeemed, may be worth more or less than their original cost. Current performance may be lower or higher than the performance information quoted. To obtain performance information current to the most recent month-end, please call 888-860-8686 or visit marsicofunds.com. |
| The performance included in the chart and graph does not reflect the deduction of taxes on Fund distributions or the redemption of Fund shares. |
| All indices are unmanaged and investors cannot invest directly in an index. |
| The MSCI ACWI (All Country World Index) Index is a free float-adjusted market capitalization index that is designed to measure equity market performance in the global developed and emerging markets. |
(1) | Periodically, certain fees and expenses have been waived or reimbursed by the Adviser for the Global Fund. In the absence of such a waiver or reimbursement, the performance returns reflected would have been reduced. In accordance with the expense limitation and fee waiver agreement, the Adviser may recoup fees and expenses previously waived or reimbursed under certain parameters. Periodically, the Adviser has recouped such fees or expenses from the Global Fund, resulting in a lower performance return. |
(2) | This chart assumes an initial investment of $10,000 made on September 30, 2007. Total returns are based on change in NAV, assuming reinvestment of distributions. |
(3) | Sector weightings represent the percentage of the Fund’s investments (excluding cash equivalents) in certain general sectors. These sectors may include more than one industry. The Fund’s portfolio composition is subject to change at any time. |
36
MARSICO GLOBAL FUND
SCHEDULE OF INVESTMENTS
September 30, 2017
| | | Number
of
Shares | | | Value | | | Percent
of Net
Assets | |
| COMMON STOCKS | | | | | | | | | |
| Airlines | | | | | | | | | |
| Ryanair Holdings PLC Spon. ADR* | | | 12,677 | | | $ | 1,336,409 | | | | 3.00 | % |
| | | | | | | | | | | | | |
| Apparel, Accessories & Luxury Goods | | | | | |
| Hermes International | | | 3,395 | | | | 1,711,554 | | | | 3.85 | |
| | | | | | | | | | | | | |
| Application Software | | | | | | | | | | | | |
| salesforce.com, inc.* | | | 11,359 | | | | 1,061,158 | | | | 2.39 | |
| SAP S.E. | | | 12,916 | | | | 1,414,952 | | | | 3.18 | |
| Snap, Inc. - Cl. A* | | | 43,763 | | | | 636,314 | | | | 1.43 | |
| | | | | | | | 3,112,424 | | | | 7.00 | |
| Biotechnology | | | | | | | | | | | | |
| Amgen, Inc. | | | 4,750 | | | | 885,638 | | | | 1.99 | |
| Celgene Corporation* | | | 6,055 | | | | 882,940 | | | | 1.99 | |
| | | | | | | | 1,768,578 | | | | 3.98 | |
| Brewers | | | | | | | | | | | | |
| Anheuser-Busch InBev S.A./N.V. | | | 13,422 | | | | 1,606,969 | | | | 3.61 | |
| | | | | | | | | | | | | |
| Data Processing & Outsourced Services | | | | | |
| Visa, Inc. - Cl. A | | | 13,913 | | | | 1,464,204 | | | | 3.29 | |
| Wirecard A.G. | | | 15,894 | | | | 1,454,157 | | | | 3.27 | |
| | | | | | | | 2,918,361 | | | | 6.56 | |
| Distillers & Vintners | | | | | | | | | | | | |
| Constellation Brands, Inc. - Cl. A | | | 2,364 | | | | 471,500 | | | | 1.06 | |
| | | | | | | | | | | | | |
| General Merchandise Stores | | | | | | | | | |
| Dollarama, Inc. | | | 10,144 | | | | 1,109,966 | | | | 2.49 | |
| | | | | | | | | | | | | |
| Health Care Equipment | | | | | | | | | | | | |
| Intuitive Surgical, Inc.* | | | 1,053 | | | | 1,101,312 | | | | 2.48 | |
| Koninklijke Philips N.V. | | | 32,559 | | | | 1,344,158 | | | | 3.02 | |
| | | | | | | | 2,445,470 | | | | 5.50 | |
| Home Entertainment Software | | | | | | | | | |
| Activision Blizzard, Inc. | | | 22,496 | | | | 1,451,217 | | | | 3.26 | |
| Nintendo Co., Ltd. | | | 3,200 | | | | 1,181,888 | | | | 2.66 | |
| Ubisoft Entertainment S.A.* | | | 28,581 | | | | 1,964,639 | | | | 4.41 | |
| | | | | | | | 4,597,744 | | | | 10.33 | |
| Internet & Direct Marketing Retail | | | | | |
| Amazon.com, Inc.* | | | 1,371 | | | | 1,318,011 | | | | 2.96 | |
| Ctrip.com International, Ltd. ADR* | | | 21,233 | | | | 1,119,828 | | | | 2.52 | |
| Netflix, Inc.* | | | 6,882 | | | | 1,248,051 | | | | 2.80 | |
| | | | | | | | 3,685,890 | | | | 8.28 | |
| Internet Software & Services | | | | | | | | | |
| Alibaba Group Holding Ltd. Spon. ADR* | | | 14,625 | | | | 2,525,884 | | | | 5.68 | |
| Alphabet, Inc. - Cl. A* | | | 1,131 | | | | 1,101,277 | | | | 2.47 | |
| Facebook, Inc. - Cl. A* | | | 8,776 | | | | 1,499,555 | | | | 3.37 | |
| Tencent Holdings Ltd. | | | 60,500 | | | | 2,603,833 | | | | 5.85 | |
| | | | | | | | 7,730,549 | | | | 17.37 | |
| IT Consulting & Other Services | | | | | |
| InterXion Holding N.V.* | | | 25,375 | | | | 1,292,349 | | | | 2.90 | |
| | | | | | | | | | | | | |
| Managed Health Care | | | | | | | | | | | | |
| UnitedHealth Group, Inc. | | | 6,391 | | | | 1,251,677 | | | | 2.81 | |
COMMON STOCKS (continued) | | | | | | | | | |
| Regional Banks | | | | | | | | | | | | |
| First Republic Bank | | | 8,412 | | | $ | 878,718 | | | | 1.98 | % |
| | | | | | | | | | | | | |
| Restaurants | | | | | | | | | | | | |
| Domino's Pizza Enterprises Ltd. | | | 30,936 | | | | 1,111,877 | | | | 2.50 | |
| Domino's Pizza Group PLC | | | 240,769 | | | | 1,000,799 | | | | 2.25 | |
| | | | | | | | 2,112,676 | | | | 4.75 | |
| Semiconductor Equipment | | | | | | | | | | | | |
| Applied Materials, Inc. | | | 25,422 | | | | 1,324,232 | | | | 2.98 | |
| ASML Holding N.V. | | | 6,752 | | | | 1,149,547 | | | | 2.58 | |
| | | | | | | | 2,473,779 | | | | 5.56 | |
| Semiconductors | | | | | | | | | | | | |
| NVIDIA Corporation | | | 6,763 | | | | 1,209,021 | | | | 2.72 | |
| | | | | | | | | | | | | |
| Specialty Chemicals | | | | | | | | | | | | |
| The Sherwin-Williams Company | | | 3,078 | | | | 1,102,047 | | | | 2.48 | |
| | | | | | | | | | | | | |
| TOTAL COMMON STOCKS | | | | | | | | | | | | |
(Cost $30,054,879) | | | | | | | 42,815,681 | | | | 96.23 | |
| | | | | | | | | | | | | |
| SHORT-TERM INVESTMENTS | | | | | |
| State Street Institutional Treasury Money Market Fund, 0.000% | | | 1,496,567 | | | | 1,496,567 | | | | 3.36 | |
| | | | | | | | | | | | | |
| TOTAL SHORT-TERM INVESTMENTS | | | | | |
| (Cost $1,496,567) | | | | | | | 1,496,567 | | | | 3.36 | |
| | | | | | | | | | | | | |
| TOTAL INVESTMENTS | | | | | | | | | | | | |
(Cost $31,551,446) | | | | | | | 44,312,248 | | | | 99.59 | |
| | | | | | | | | | | | | |
| Cash and Other Assets, Less Liabilities | | | | | | | 180,887 | | | | 0.41 | |
| | | | | | | | | | | | | |
| NET ASSETS | | | | | | $ | 44,493,135 | | | | 100.00 | % |
| SUMMARY OF INVESTMENTS BY COUNTRY | |
| Country | | Market Value | | | Percent of
Investment
Securities | |
| Australia | | $ | 1,111,877 | | | | 2.51 | % |
| Belgium | | | 1,606,969 | | | | 3.63 | |
| Canada | | | 1,109,966 | | | | 2.50 | |
| China/Hong Kong | | | 6,249,545 | | | | 14.10 | |
| France | | | 3,676,193 | | | | 8.30 | |
| Germany | | | 2,869,109 | | | | 6.47 | |
| Ireland | | | 1,336,409 | | | | 3.02 | |
| Japan | | | 1,181,888 | | | | 2.67 | |
| Netherlands | | | 3,786,054 | | | | 8.54 | |
| United Kingdom | | | 1,000,799 | | | | 2.26 | |
United States(1) | | | 20,383,439 | | | | 46.00 | |
| | | $ | 44,312,248 | | | | 100.00 | % |
(1) | Includes short-term securities. |
| See notes to financial statements. |
37
STATEMENTS OF ASSETS AND LIABILITIES
September 30, 2017
| (Amounts in thousands) | | MARSICO
FOCUS FUND | | | MARSICO
GROWTH FUND | |
| | | | | | | |
| ASSETS | | | | | | |
| Investments, at value (cost $400,298, $192,780, $168,409, $50,259, $193,867, and $31,551, respectively) | | $ | 566,641 | | | $ | 275,753 | |
| Receivable for investments sold | | | — | | | | — | |
| Receivable for capital stock sold | | | 15 | | | | 1 | |
| Interest and dividends receivable | | | 363 | | | | 98 | |
| Prepaid expenses and other assets | | | 2,937 | | | | 1,132 | |
| Total Assets | | | 569,956 | | | | 276,984 | |
| | | | | | | | | |
| LIABILITIES | | | | | | | | |
| Payable for investments purchased | | | 2,467 | | | | 6,651 | |
| Payable for capital stock redeemed | | | 239 | | | | 231 | |
| Payable to investment adviser | | | 351 | | | | 175 | |
| Accrued trustees' fees | | | 2,934 | | | | 1,128 | |
| Accrued distribution fee | | | 4,098 | | | | 1,761 | |
| Accrued professional fees | | | 94 | | | | 45 | |
| Accrued transfer agent fees and expenses | | | 17 | | | | 9 | |
| Accrued printing expenses | | | 33 | | | | 16 | |
| Accrued custody and fund accounting fees | | | 24 | | | | 16 | |
| Accrued expenses and other liabilities | | | 42 | | | | 30 | |
| Total Liabilities | | | 10,299 | | | | 10,062 | |
| | | | | | | | | |
| NET ASSETS | | $ | 559,657 | | | $ | 266,922 | |
| | | | | | | | | |
| NET ASSETS CONSIST OF | | | | | | | | |
| Paid-in-capital | | $ | 309,223 | | | $ | 160,547 | |
| Undistributed net investment income (accumulated net investment loss) | | | (4,373 | ) | | | (2,262 | ) |
| Accumulated net realized gain (loss) on investments and foreign currency transactions | | | 87,351 | | | | 25,176 | |
| Net unrealized appreciation on investments and foreign currency translations | | | 167,456 | | | | 83,461 | |
| NET ASSETS | | $ | 559,657 | | | $ | 266,922 | |
| | | | | | | | | |
| SHARES OUTSTANDING, $0.001 par value | | | | | | | | |
| (Unlimited shares authorized) | | | 28,517 | | | | 14,451 | |
| | | | | | | | | |
| NET ASSET VALUE, REDEMPTION PRICE, AND OFFERING PRICE PER SHARE (NET ASSETS/SHARES OUTSTANDING)* | | $ | 19.63 | | | $ | 18.47 | |
| * | Not in thousands, based on unrounded net assets and shares outstanding. |
| See notes to financial statements. |
38
| | MARSICO
21st CENTURY FUND | | | MARSICO
INTERNATIONAL
OPPORTUNITIES
FUND | | | MARSICO
FLEXIBLE
CAPITAL FUND | | | MARSICO
GLOBAL FUND | |
| | | | | | | | | | | | |
| | | | | | | | | | | | |
| | $ | 234,001 | | | $ | 64,183 | | | $ | 244,606 | | | $ | 44,312 | |
| | | 1,558 | | | | — | | | | 1,398 | | | | 1,687 | |
| | | 1 | | | | 1 | | | | 25 | | | | 20 | |
| | | 38 | | | | 91 | | | | 545 | | | | 26 | |
| | | 410 | | | | 203 | | | | 1,747 | | | | 132 | |
| | | 236,008 | | | | 64,478 | | | | 248,321 | | | | 46,177 | |
| | | | | | | | | | | | | | | | |
| | | | | | | | | | | | | | | | |
| | | — | | | | 136 | | | | — | | | | 1,325 | |
| | | 40 | | | | 23 | | | | 102 | | | | — | |
| | | 153 | | | | 47 | | | | 161 | | | | 31 | |
| | | 407 | | | | 194 | | | | 1,741 | | | | 123 | |
| | | 973 | | | | 227 | | | | 204 | | | | 162 | |
| | | 40 | | | | 10 | | | | 46 | | | | 6 | |
| | | 8 | | | | 5 | | | | 29 | | | | 3 | |
| | | 14 | | | | 3 | | | | 16 | | | | 2 | |
| | | 15 | | | | 18 | | | | 16 | | | | 11 | |
| | | 36 | | | | 26 | | | | 23 | | | | 21 | |
| | | 1,686 | | | | 689 | | | | 2,338 | | | | 1,684 | |
| | | | | | | | | | | | | | | | |
| | $ | 234,322 | | | $ | 63,789 | | | $ | 245,983 | | | $ | 44,493 | |
| | | | | | | | | | | | | | | | |
| | | | | | | | | | | | | | | | |
| | $ | 554,671 | | | $ | 144,577 | | | $ | 168,451 | | | $ | 28,516 | |
| | | (2,457 | ) | | | (553 | ) | | | 1,907 | | | | (574 | ) |
| | | (383,693 | ) | | | (94,231 | ) | | | 24,125 | | | | 3,716 | |
| | | 65,801 | | | | 13,996 | | | | 51,500 | | | | 12,835 | |
| | $ | 234,322 | | | $ | 63,789 | | | $ | 245,983 | | | $ | 44,493 | |
| | | | | | | | | | | | | | | | |
| | | | | | | | | | | | | | | | |
| | | 8,947 | | | | 3,305 | | | | 15,865 | | | | 2,941 | |
| | | | | | | | | | | | | | | | |
| | $ | 26.19 | | | $ | 19.30 | | | $ | 15.50 | | | $ | 15.13 | |
39
STATEMENTS OF OPERATIONS
FOR THE YEAR ENDED September 30, 2017
| (Amounts in thousands) | | MARSICO
FOCUS FUND | | | MARSICO
GROWTH FUND | |
| | | | | | | |
| INVESTMENT INCOME | | | | | | |
| Dividends (net of $31, $6, $10, $34, $0, and $18, respectively, non-reclaimable foreign withholding taxes) | | $ | 4,133 | | | $ | 2,309 | |
| Interest | | | — | | | | — | |
| Total Investment Income | | | 4,133 | | | | 2,309 | |
| | | | | | | | | |
| EXPENSES | | | | | | | | |
| Investment advisory fees | | | 4,210 | | | | 2,089 | |
| Distribution fees | | | 1,370 | | | | 655 | |
| Trustees' fees and expenses | | | 715 | (1) | | | 267 | (1) |
| Transfer agent fees and expenses | | | 416 | | | | 214 | |
| Professional fees | | | 297 | | | | 141 | |
| Fund administration fees | | | 165 | | | | 136 | |
| Custody and fund accounting fees | | | 134 | | | | 90 | |
| Miscellaneous | | | 87 | | | | 42 | |
| Printing and postage expenses | | | 85 | | | | 42 | |
| Federal and state registration fees | | | 33 | | | | 29 | |
| Total Expenses | | | 7,512 | | | | 3,705 | |
| Less waiver of expenses and expenses paid indirectly | | | (1 | ) | | | — | |
| Net Expenses | | | 7,511 | | | | 3,705 | |
| | | | | | | | | |
| NET INVESTMENT INCOME (LOSS) | | | (3,378 | ) | | | (1,396 | ) |
| | | | | | | | | |
| REALIZED AND UNREALIZED GAIN (LOSS) | | | | | | | | |
| Net realized gain on investments | | | 91,438 | | | | 25,336 | |
| Net realized gain (loss) on foreign currency transactions | | | 222 | | | | — | |
| Change in unrealized appreciation (depreciation) on investments and foreign currency translations | | | 20,700 | | | | 21,972 | |
| | | | | | | | | |
| Net Gain on Investments | | | 112,360 | | | | 47,308 | |
| | | | | | | | | |
| NET INCREASE IN NET ASSETS RESULTING FROM OPERATIONS | | $ | 108,982 | | | $ | 45,912 | |
(1) | Amounts include trustees’ fees and expenses and the mark to market unrealized appreciation during the period for shares held in the Trustees’ Deferred Fee Plan, as more fully described in Note 2(g) in the Notes to Financial Statements. |
| | | Trustees’
Fees and
Expenses* | | | Unrealized
Appreciation* | |
| Focus Fund | | $ | 183,091 | | | $ | 531,725 | |
| Growth Fund | | | 86,488 | | | | 180,836 | |
21st Century Fund | | | 76,627 | | | | 61,584 | |
| International Opportunities Fund | | | 18,818 | | | | 33,971 | |
| Flexible Capital Fund | | | 90,959 | | | | 147,851 | |
| Global Fund | | | 12,156 | | | | 23,742 | |
| See notes to financial statements. |
40
| | MARSICO
21st CENTURY FUND | | | MARSICO
INTERNATIONAL
OPPORTUNITIES
FUND | | | MARSICO
FLEXIBLE
CAPITAL FUND | | | MARSICO
GLOBAL FUND | |
| | | | | | | | | | | | |
| | | | | | | | | | | | |
| | $ | 997 | | | $ | 478 | | | $ | 6,344 | | | $ | 302 | |
| | | — | | | | — | | | | 1,686 | | | | — | |
| | | 997 | | | | 478 | | | | 8,030 | | | | 302 | |
| | | | | | | | | | | | | | | | |
| | | | | | | | | | | | | | | | |
| | | 1,818 | | | | 461 | | | | 2,181 | | | | 309 | |
| | | 568 | | | | 144 | | | | 686 | | | | 96 | |
| | | 138 | (1) | | | 53 | (1) | | | 239 | (1) | | | 36 | (1) |
| | | 210 | | | | 72 | | | | 399 | | | | 48 | |
| | | 124 | | | | 38 | | | | 156 | | | | 27 | |
| | | 128 | | | | 100 | | | | 137 | | | | 78 | |
| | | 91 | | | | 116 | | | | 106 | | | | 71 | |
| | | 33 | | | | 8 | | | | 50 | | | | 5 | |
| | | 43 | | | | 17 | | | | 52 | | | | 6 | |
| | | 22 | | | | 19 | | | | 29 | | | | 18 | |
| | | 3,175 | | | | 1,028 | | | | 4,035 | | | | 694 | |
| | | — | | | | (106 | ) | | | — | | | | (76 | ) |
| | | 3,175 | | | | 922 | | | | 4,035 | | | | 618 | |
| | | | | | | | | | | | | | | | |
| | | (2,178 | ) | | | (444 | ) | | | 3,995 | | | | (316 | ) |
| | | | | | | | | | | | | | | | |
| | | | | | | | | | | | | | | | |
| | | 34,718 | | | | 9,143 | | | | 30,234 | | | | 4,701 | |
| | | (353 | ) | | | (402 | ) | | | (2,164 | ) | | | 36 | |
| | | 6,689 | | | | 3,642 | | | | (11,428 | ) | | | 4,001 | |
| | | | | | | | | | | | | | | | |
| | | 41,054 | | | | 12,383 | | | | 16,642 | | | | 8,738 | |
| | | | | | | | | | | | | | | | |
| | $ | 38,876 | | | $ | 11,939 | | | $ | 20,637 | | | $ | 8,422 | |
41
STATEMENTS OF CHANGES IN NET ASSETS
| | | MARSICO
FOCUS FUND | | | MARSICO
GROWTH FUND | |
| | | | | | | | | | | | | |
| (Amounts in thousands) | | Year
Ended
9/30/17 | | | Year
Ended
9/30/16 | | | Year
Ended
9/30/17 | | | Year
Ended
9/30/16 | |
| | | | | | | | | | | | | |
| OPERATIONS: | | | | | | | | | | | | |
| Net investment income (loss) | | $ | (3,378 | ) | | $ | (4,486 | ) | | $ | (1,396 | ) | | $ | (2,098 | ) |
| Net realized gain (loss) on investments | | | 91,438 | | | | (119 | ) | | | 25,336 | | | | 2,049 | |
| Net realized gain (loss) on foreign currency transactions | | | 222 | | | | (292 | ) | | | — | | | | — | |
| Change in unrealized appreciation (depreciation) on investments and foreign currency translations | | | 20,700 | | | | 45,999 | | | | 21,972 | | | | 19,892 | |
| | | | | | | | | | | | | | | | | |
| Net increase in net assets resulting from operations | | | 108,982 | | | | 41,102 | | | | 45,912 | | | | 19,843 | |
| | | | | | | | | | | | | | | | | |
| DISTRIBUTIONS: | | | | | | | | | | | | | | | | |
| Net investment income | | | — | | | | — | | | | — | | | | — | |
| Net realized gains | | | — | | | | (157,703 | ) | | | (2,136 | ) | | | (111,369 | ) |
| | | | | | | | | | | | | | | | | |
| Total distributions | | | — | | | | (157,703 | ) | | | (2,136 | ) | | | (111,369 | ) |
| | | | | | | | | | | | | | | | | |
| CAPITAL SHARE TRANSACTIONS: | | | | | | | | | | | | | | | | |
| Proceeds from sales of shares | | | 30,112 | | | | 30,902 | | | | 14,269 | | | | 16,765 | |
| Proceeds from reinvestment of distributions | | | — | | | | 147,665 | | | | 2,048 | | | | 106,035 | |
| Redemption of shares | | | (193,307 | ) | | | (236,947 | ) | | | (81,384 | ) | | | (153,503 | ) |
| | | | | | | | | | | | | | | | | |
| Net decrease from capital share transactions | | | (163,195 | ) | | | (58,380 | ) | | | (65,067 | ) | | | (30,703 | ) |
| | | | | | | | | | | | | | | | | |
| TOTAL INCREASE (DECREASE) IN NET ASSETS | | | (54,213 | ) | | | (174,981 | ) | | | (21,291 | ) | | | (122,229 | ) |
| | | | | | | | | | | | | | | | | |
| NET ASSETS: | | | | | | | | | | | | | | | | |
| Beginning of Period | | | 613,870 | | | | 788,851 | | | | 288,213 | | | | 410,442 | |
| | | | | | | | | | | | | | | | | |
| End of Period | | $ | 559,657 | | | $ | 613,870 | | | $ | 266,922 | | | $ | 288,213 | |
| | | | | | | | | | | | | | | | | |
| Undistributed net investment income (Accumulated net investment loss) | | $ | (4,373 | ) | | $ | (5,164 | ) | | $ | (2,262 | ) | | $ | (2,709 | ) |
| | | | | | | | | | | | | | | | | |
| TRANSACTIONS IN SHARES: | | | | | | | | | | | | | | | | |
| Shares sold | | | 1,762 | | | | 1,894 | | | | 864 | | | | 1,038 | |
| Shares issued in reinvestment of distributions | | | — | | | | 9,166 | | | | 137 | | | | 6,814 | |
| Shares redeemed | | | (11,719 | ) | | | (14,476 | ) | | | (5,100 | ) | | | (9,708 | ) |
| | | | | | | | | | | | | | | | | |
| NET DECREASE | | | (9,957 | ) | | | (3,416 | ) | | | (4,099 | ) | | | (1,856 | ) |
| See notes to financial statements. |
42
MARSICO
21st CENTURY FUND | | | MARSICO
INTERNATIONAL
OPPORTUNITIES FUND | | | MARSICO
FLEXIBLE
CAPITAL FUND | | | MARSICO
GLOBAL FUND | |
| | | | | | | | | | | | | | | | | | | | | | | |
Year
Ended
9/30/17 | | | Year
Ended
9/30/16 | | | Year
Ended
9/30/17 | | | Year
Ended
9/30/16 | | | Year
Ended
9/30/17 | | | Year
Ended
9/30/16 | | | Year
Ended
9/30/17 | | | Year
Ended
9/30/16 | |
| | | | | | | | | | | | | | | | | | | | | | | |
| | | | | | | | | | | | | | | | | | | | | | | |
| $ | (2,178 | ) | | $ | (2,547 | ) | | $ | (444 | ) | | $ | (501 | ) | | $ | 3,995 | | | $ | 5,812 | | | $ | (316 | ) | | $ | (341 | ) |
| | 34,718 | | | | (1,442 | ) | | | 9,143 | | | | 1,451 | | | | 30,234 | | | | 28,781 | | | | 4,701 | | | | 627 | |
| | (353 | ) | | | (201 | ) | | | (402 | ) | | | (982 | ) | | | (2,164 | ) | | | (2,492 | ) | | | 36 | | | | (979 | ) |
| | 6,689 | | | | 23,264 | | | | 3,642 | | | | 5,801 | | | | (11,428 | ) | | | 3,467 | | | | 4,001 | | | | 4,517 | |
| | | | | | | | | | | | | | | | | | | | | | | | | | | | | | | |
| | 38,876 | | | | 19,074 | | | | 11,939 | | | | 5,769 | | | | 20,637 | | | | 35,568 | | | | 8,422 | | | | 3,824 | |
| | | | | | | | | | | | | | | | | | | | | | | | | | | | | | | |
| | | | | | | | | | | | | | | | | | | | | | | | | | | | | | | |
| | — | | | | — | | | | — | | | | — | | | | (4,808 | ) | | | (3,373 | ) | | | — | | | | — | |
| | — | | | | — | | | | — | | | | — | | | | (21,758 | ) | | | (64,551 | ) | | | — | | | | (6,835 | ) |
| | | | | | | | | | | | | | | | | | | | | | | | | | | | | | | |
| | — | | | | — | | | | — | | | | — | | | | (26,566 | ) | | | (67,924 | ) | | | — | | | | (6,835 | ) |
| | | | | | | | | | | | | | | | | | | | | | | | | | | | | | | |
| | | | | | | | | | | | | | | | | | | | | | | | | | | | | | | |
| | 6,114 | | | | 3,888 | | | | 3,027 | | | | 2,573 | | | | 13,810 | | | | 74,732 | | | | 3,764 | | | | 6,817 | |
| | — | | | | — | | | | — | | | | — | | | | 23,955 | | | | 57,636 | | | | — | | | | 5,566 | |
| | (45,448 | ) | | | (56,566 | ) | | | (14,010 | ) | | | (34,650 | ) | | | (138,944 | ) | | | (296,134 | ) | | | (11,966 | ) | | | (31,711 | ) |
| | | | | | | | | | | | | | | | | | | | | | | | | | | | | | | |
| | (39,334 | ) | | | (52,678 | ) | | | (10,983 | ) | | | (32,077 | ) | | | (101,179 | ) | | | (163,766 | ) | | | (8,202 | ) | | | (19,328 | ) |
| | | | | | | | | | | | | | | | | | | | | | | | | | | | | | | |
| | (458 | ) | | | (33,604 | ) | | | 956 | | | | (26,308 | ) | | | (107,108 | ) | | | (196,122 | ) | | | 220 | | | | (22,339 | ) |
| | | | | | | | | | | | | | | | | | | | | | | | | | | | | | | |
| | | | | | | | | | | | | | | | | | | | | | | | | | | | | | | |
| | 234,780 | | | | 268,384 | | | | 62,833 | | | | 89,141 | | | | 353,091 | | | | 549,213 | | | | 44,273 | | | | 66,612 | |
| | | | | | | | | | | | | | | | | | | | | | | | | | | | | | | |
| $ | 234,322 | | | $ | 234,780 | | | $ | 63,789 | | | $ | 62,833 | | | $ | 245,983 | | | $ | 353,091 | | | $ | 44,493 | | | $ | 44,273 | |
| | | | | | | | | | | | | | | | | | | | | | | | | | | | | | | |
| $ | (2,457 | ) | | $ | (2,729 | ) | | $ | (553 | ) | | $ | (464 | ) | | $ | 1,907 | | | $ | 2,348 | | | $ | (574 | ) | | $ | (532 | ) |
| | | | | | | | | | | | | | | | | | | | | | | | | | | | | | | |
| | | | | | | | | | | | | | | | | | | | | | | | | | | | | | | |
| | 256 | | | | 180 | | | | 181 | | | | 164 | | | | 944 | | | | 5,059 | | | | 267 | | | | 572 | |
| | — | | | | — | | | | — | | | | — | | | | 1,738 | | | | 3,850 | | | | — | | | | 467 | |
| | (1,963 | ) | | | (2,693 | ) | | | (893 | ) | | | (2,292 | ) | | | (9,521 | ) | | | (19,300 | ) | | | (1,007 | ) | | | (2,743 | ) |
| | | | | | | | | | | | | | | | | | | | | | | | | | | | | | | |
| | (1,707 | ) | | | (2,513 | ) | | | (712 | ) | | | (2,128 | ) | | | (6,839 | ) | | | (10,391 | ) | | | (740 | ) | | | (1,704 | ) |
43
FINANCIAL HIGHLIGHTS
| | | MARSICO FOCUS FUND | |
For a Fund Share Outstanding Throughout the Period | | Year
Ended
9/30/17 | | | Year
Ended
9/30/16 | | | Year
Ended
9/30/15 | | | Year
Ended
9/30/14 | | | Year
Ended
9/30/13 | |
| | | | | | | | | | | | | | | | |
| Net Asset Value, Beginning of Period | | $ | 15.96 | | | $ | 18.83 | | | $ | 22.41 | | | $ | 21.47 | | | $ | 20.02 | |
| | | | | | | | | | | | | | | | | | | | | |
| Income from Investment Operations: | | | | | | | | | | | | | | | | | | | | |
| Net investment income (loss) | | | (0.17 | ) | | | (0.13 | ) | | | (0.10 | ) | | | (0.07 | ) | | | (0.03 | ) |
| Net realized and unrealized gains (losses) on investments | | | 3.84 | | | | 1.25 | | | | (0.62 | ) | | | 4.46 | | | | 3.84 | |
| | | | | | | | | | | | | | | | | | | | | |
| Total from investment operations | | | 3.67 | | | | 1.12 | | | | (0.72 | ) | | | 4.39 | | | | 3.81 | |
| | | | | | | | | | | | | | | | | | | | | |
| Distributions & Other: | | | | | | | | | | | | | | | | | | | | |
| Net investment income | | | — | | | | — | | | | — | | | | — | | | | (0.03 | ) |
| Net realized gains | | | — | | | | (3.99 | ) | | | (2.86 | ) | | | (3.45 | ) | | | (2.33 | ) |
| Redemption fees [See Note 2(h)] | | | — | | | | — | | | | — | | | | — | (1) | | | — | (1) |
| | | | | | | | | | | | | | | | | | | | | |
| Total distributions and other | | | — | | | | (3.99 | ) | | | (2.86 | ) | | | (3.45 | ) | | | (2.36 | ) |
| | | | | | | | | | | | | | | | | | | | | |
| Net Asset Value, End of Period | | $ | 19.63 | | | $ | 15.96 | | | $ | 18.83 | | | $ | 22.41 | | | $ | 21.47 | |
| | | | | | | | | | | | | | | | | | | | | |
| Total Return | | | 22.99 | % | | | 5.75 | % | | | (4.15 | )% | | | 22.27 | % | | | 21.86 | % |
| | | | | | | | | | | | | | | | | | | | | |
| Supplemental Data and Ratios: | | | | | | | | | | | | | | | | | | | | |
| | | | | | | | | | | | | | | | | | | | | |
| Net assets, end of period (000s) | | $ | 559,657 | | | $ | 613,870 | | | $ | 788,851 | | | $ | 933,054 | | | $ | 854,708 | |
| | | | | | | | | | | | | | | | | | | | | |
| Ratio of expenses to average net assets, less waivers and before expenses paid indirectly, plus recoupment of previously waived fees or expenses paid | | | 1.37 | % | | | 1.29 | % | | | 1.31 | % | | | 1.34 | % | | | 1.35 | % |
| | | | | | | | | | | | | | | | | | | | | |
| Ratio of net investment income (loss) to average net assets, net of waivers, recoupment of previously waived fees or expenses paid and expenses paid indirectly | | | (0.62 | )% | | | (0.63 | )% | | | (0.45 | )% | | | (0.35 | )% | | | (0.10 | )% |
| | | | | | | | | | | | | | | | | | | | | |
| Ratio of expenses to average net assets, before waivers, recoupment of previously waived fees or expenses paid and expenses paid indirectly | | | 1.37 | % | | | 1.29 | % | | | 1.31 | % | | | 1.34 | % | | | 1.35 | % |
| | | | | | | | | | | | | | | | | | | | | |
| Ratio of net investment income (loss) to average net assets, before waivers, recoupment of previously waived fees or expenses paid and expenses paid indirectly | | | (0.62 | )% | | | (0.63 | )% | | | (0.45 | )% | | | (0.35 | )% | | | (0.10 | )% |
| | | | | | | | | | | | | | | | | | | | | |
| Portfolio turnover rate | | | 67 | % | | | 45 | % | | | 68 | % | | | 71 | % | | | 92 | % |
| See notes to financial statements. |
44
MARSICO
GROWTH FUND | | | MARSICO
21st CENTURY FUND | |
Year
Ended
9/30/17 | | | Year
Ended
9/30/16 | | | Year
Ended
9/30/15 | | | Year
Ended
9/30/14 | | | Year
Ended
9/30/13 | | | Year
Ended
9/30/17 | | | Year
Ended
9/30/16 | | | Year
Ended
9/30/15 | | | Year
Ended
9/30/14 | | | Year
Ended
9/30/13 | |
| | | | | | | | | | | | | | | | | | | | | | | | | | | | | |
| $ | 15.54 | | | $ | 20.11 | | | $ | 23.63 | | | $ | 25.03 | | | $ | 21.96 | | | $ | 22.04 | | | $ | 20.38 | | | $ | 20.90 | | | $ | 18.05 | | | $ | 14.24 | |
| | | | | | | | | | | | | | | | | | | | | | | | | | | | | | | | | | | | | | | |
| | | | | | | | | | | | | | | | | | | | | | | | | | | | | | | | | | | | | | | |
| | (0.14 | ) | | | (0.13 | ) | | | (0.15 | ) | | | (0.08 | ) | | | — | (1) | | | (0.29 | ) | | | (0.29 | ) | | | (0.21 | ) | | | (0.21 | ) | | | (0.09 | ) |
| | 3.19 | | | | 1.33 | | | | (0.62 | ) | | | 4.01 | | | | 4.30 | | | | 4.44 | | | | 1.95 | | | | (0.31 | ) | | | 3.06 | | | | 3.90 | |
| | | | | | | | | | | | | | | | | | | | | | | | | | | | | | | | | | | | | | | |
| | 3.05 | | | | 1.20 | | | | (0.77 | ) | | | 3.93 | | | | 4.30 | | | | 4.15 | | | | 1.66 | | | | (0.52 | ) | | | 2.85 | | | | 3.81 | |
| | | | | | | | | | | | | | | | | | | | | | | | | | | | | | | | | | | | | | | |
| | | | | | | | | | | | | | | | | | | | | | | | | | | | | | | | | | | | | | | |
| | — | | | | — | | | | — | | | | (0.06 | ) | | | (0.04 | ) | | | — | | | | — | | | | — | | | | — | | | | — | |
| | (0.12 | ) | | | (5.77 | ) | | | (2.75 | ) | | | (5.27 | ) | | | (1.19 | ) | | | — | | | | — | | | | — | | | | — | | | | — | |
| | — | | | | — | | | | — | | | | — | (1) | | | — | (1) | | | — | | | | — | | | | — | | | | — | (1) | | | — | (1) |
| | | | | | | | | | | | | | | | | | | | | | | | | | | | | | | | | | | | | | | |
| | (0.12 | ) | | | (5.77 | ) | | | (2.75 | ) | | | (5.33 | ) | | | (1.23 | ) | | | — | | | | — | | | | — | | | | — | | | | — | |
| | | | | | | | | | | | | | | | | | | | | | | | | | | | | | | | | | | | | | | |
| $ | 18.47 | | | $ | 15.54 | | | $ | 20.11 | | | $ | 23.63 | | | $ | 25.03 | | | $ | 26.19 | | | $ | 22.04 | | | $ | 20.38 | | | $ | 20.90 | | | $ | 18.05 | |
| | | | | | | | | | | | | | | | | | | | | | | | | | | | | | | | | | | | | | | |
| | 19.85 | % | | | 5.94 | % | | | (4.10 | )% | | | 17.51 | % | | | 20.92 | % | | | 18.83 | % | | | 8.15 | % | | | (2.49 | )% | | | 15.79 | % | | | 26.76 | % |
| | | | | | | | | | | | | | | | | | | | | | | | | | | | | | | | | | | | | | | |
| | | | | | | | | | | | | | | | | | | | | | | | | | | | | | | | | | | | | | | |
| | | | | | | | | | | | | | | | | | | | | | | | | | | | | | | | | | | | | | | |
| $ | 266,922 | | | $ | 288,213 | | | $ | 410,442 | | | $ | 562,653 | | | $ | 564,766 | | | $ | 234,322 | | | $ | 234,780 | | | $ | 268,384 | | | $ | 316,293 | | | $ | 312,215 | |
| | | | | | | | | | | | | | | | | | | | | | | | | | | | | | | | | | | | | | | |
| | 1.42 | % | | | 1.37 | % | | | 1.35 | % | | | 1.37 | % | | | 1.37 | % | | | 1.40 | % | | | 1.41 | % | | | 1.38 | % | | | 1.42 | % | | | 1.45 | % |
| | | | | | | | | | | | | | | | | | | | | | | | | | | | | | | | | | | | | | | |
| | (0.53 | )% | | | (0.61 | )% | | | (0.52 | )% | | | (0.34 | )% | | | 0.01 | % | | | (0.96 | )% | | | (1.01 | )% | | | (0.78 | )% | | | (0.88 | )% | | | (0.33 | )% |
| | | | | | | | | | | | | | | | | | | | | | | | | | | | | | | | | | | | | | | |
| | 50 | % | | | 52 | % | | | 81 | % | | | 80 | % | | | 114 | % | | | 28 | % | | | 44 | % | | | 94 | % | | | 83 | % | | | 102 | % |
45
FINANCIAL HIGHLIGHTS
| | | MARSICO
INTERNATIONAL OPPORTUNITIES FUND | |
For a Fund Share Outstanding Throughout the Period | | Year
Ended
9/30/17 | | | Year
Ended
9/30/16 | | | Year
Ended
9/30/15 | | | Year
Ended
9/30/14 | | | Year
Ended
9/30/13 | |
| | | | | | | | | | | | | | | | |
| Net Asset Value, Beginning of Period | | $ | 15.64 | | | $ | 14.51 | | | $ | 14.72 | | | $ | 15.30 | | | $ | 12.50 | |
| | | | | | | | | | | | | | | | | | | | | |
| Income from Investment Operations: | | | | | | | | | | | | | | | | | | | | |
| Net investment income (loss) | | | (0.16 | ) | | | (0.20 | ) | | | (0.21 | ) | | | (0.06 | ) | | | 0.09 | |
| Net realized and unrealized gains (losses) on investments | | | 3.82 | | | | 1.33 | | | | — | (1) | | | (0.42 | ) | | | 2.71 | |
| | | | | | | | | | | | | | | | | | | | | |
| Total from investment operations | | | 3.66 | | | | 1.13 | | | | (0.21 | ) | | | (0.48 | ) | | | 2.80 | |
| | | | | | | | | | | | | | | | | | | | | |
| Distributions & Other: | | | | | | | | | | | | | | | | | | | | |
| Net investment income | | | — | | | | — | | | | — | | | | (0.10 | ) | | | — | |
| Net realized gains | | | — | | | | — | | | | — | | | | — | | | | — | |
| Redemption fees [See Note 2(h)] | | | — | | | | — | | | | — | | | | — | (1) | | | — | (1) |
| | | | | | | | | | | | | | | | | | | | | |
| Total distributions and other | | | — | | | | — | | | | — | | | | (0.10 | ) | | | — | |
| | | | | | | | | | | | | | | | | | | | | |
| Net Asset Value, End of Period | | $ | 19.30 | | | $ | 15.64 | | | $ | 14.51 | | | $ | 14.72 | | | $ | 15.30 | |
| | | | | | | | | | | | | | | | | | | | | |
| Total Return | | | 23.40 | % | | | 7.79 | % | | | (1.43 | )% | | | (3.18 | )% | | | 22.40 | % |
| | | | | | | | | | | | | | | | | | | | | |
| Supplemental Data and Ratios: | | | | | | | | | | | | | | | | | | | | |
| | | | | | | | | | | | | | | | | | | | | |
| Net assets, end of period (000s) | | $ | 63,789 | | | $ | 62,833 | | | $ | 89,141 | | | $ | 175,984 | | | $ | 119,522 | |
| | | | | | | | | | | | | | | | | | | | | |
| Ratio of expenses to average net assets, less waivers and before expenses paid indirectly, plus recoupment of previously waived fees or expenses paid | | | 1.60 | % | | | 1.60 | % | | | 1.60 | % | | | 1.60 | % | | | 1.60 | % |
| | | | | | | | | | | | | | | | | | | | | |
| Ratio of net investment income (loss) to average net assets, net of waivers, recoupment of previously waived fees or expenses paid and expenses paid indirectly | | | (0.77 | )% | | | (0.71 | )% | | | (0.86 | )% | | | (0.55 | )% | | | 0.61 | % |
| | | | | | | | | | | | | | | | | | | | | |
| Ratio of expenses to average net assets, before waivers, recoupment of previously waived fees or expenses paid and expenses paid indirectly | | | 1.79 | % | | | 1.78 | % | | | 1.63 | % | | | 1.52 | % | | | 1.74 | % |
| | | | | | | | | | | | | | | | | | | | | |
| Ratio of net investment income (loss) to average net assets, before waivers, recoupment of previously waived fees or expenses paid and expenses paid indirectly | | | (0.96 | )% | | | (0.89 | )% | | | (0.89 | )% | | | (0.47 | )% | | | 0.47 | % |
| | | | | | | | | | | | | | | | | | | | | |
| Portfolio turnover rate | | | 108 | % | | | 223 | % | | | 217 | % | | | 178 | % | | | 121 | % |
| See notes to financial statements. |
46
MARSICO
FLEXIBLE CAPITAL FUND | | | MARSICO
GLOBAL FUND | |
Year
Ended
9/30/17 | | | Year
Ended
9/30/16 | | | Year
Ended
9/30/15 | | | Year
Ended
9/30/14 | | | Year
Ended
9/30/13 | | | Year
Ended
9/30/17 | | | Year
Ended
9/30/16 | | | Year
Ended
9/30/15 | | | Year
Ended
9/30/14 | | | Year
Ended
9/30/13 | |
| | | | | | | | | | | | | | | | | | | | | | | | | | | | | |
| $ | 15.55 | | | $ | 16.59 | | | $ | 18.39 | | | $ | 18.21 | | | $ | 15.79 | | | $ | 12.03 | | | $ | 12.37 | | | $ | 14.45 | | | $ | 14.74 | | | $ | 11.51 | |
| | | | | | | | | | | | | | | | | | | | | | | | | | | | | | | | | | | | | | | |
| | | | | | | | | | | | | | | | | | | | | | | | | | | | | | | | | | | | | | | |
| | 0.23 | | | | 0.24 | | | | 0.09 | | | | (0.04 | ) | | | 0.04 | | | | (0.14 | ) | | | (0.16 | ) | | | (0.10 | ) | | | (0.05 | ) | | | (0.02 | ) |
| | 1.05 | | | | 0.96 | | | | (0.15 | ) | | | 2.18 | | | | 3.28 | | | | 3.24 | | | | 1.14 | | | | (0.32 | ) | | | 1.93 | | | | 3.25 | |
| | | | | | | | | | | | | | | | | | | | | | | | | | | | | | | | | | | | | | | |
| | 1.28 | | | | 1.20 | | | | (0.06 | ) | | | 2.14 | | | | 3.32 | | | | 3.10 | | | | 0.98 | | | | (0.42 | ) | | | 1.88 | | | | 3.23 | |
| | | | | | | | | | | | | | | | | | | | | | | | | | | | | | | | | | | | | | | |
| | | | | | | | | | | | | | | | | | | | | | | | | | | | | | | | | | | | | | | |
| | (0.24 | ) | | | (0.11 | ) | | | — | | | | — | | | | (0.09 | ) | | | — | | | | — | | | | — | | | | — | | | | — | |
| | (1.09 | ) | | | (2.13 | ) | | | (1.74 | ) | | | (1.96 | ) | | | (0.81 | ) | | | — | | | | (1.32 | ) | | | (1.66 | ) | | | (2.17 | ) | | | — | |
| | — | | | | — | | | | — | | | | — | (1) | | | — | (1) | | | — | | | | — | | | | — | | | | — | (1) | | | — | (1) |
| | | | | | | | | | | | | | | | | | | | | | | | | | | | | | | | | | | | | | | |
| | (1.33 | ) | | | (2.24 | ) | | | (1.74 | ) | | | (1.96 | ) | | | (0.90 | ) | | | — | | | | (1.32 | ) | | | (1.66 | ) | | | (2.17 | ) | | | — | |
| | | | | | | | | | | | | | | | | | | | | | | | | | | | | | | | | | | | | | | |
| $ | 15.50 | | | $ | 15.55 | | | $ | 16.59 | | | $ | 18.39 | | | $ | 18.21 | | | $ | 15.13 | | | $ | 12.03 | | | $ | 12.37 | | | $ | 14.45 | | | $ | 14.74 | |
| | | | | | | | | | | | | | | | | | | | | | | | | | | | | | | | | | | | | | | |
| | 9.32 | % | | | 7.79 | % | | | (0.81 | )% | | | 12.15 | % | | | 22.34 | % | | | 25.77 | % | | | 8.05 | % | | | (3.51 | )% | | | 13.23 | % | | | 28.06 | % |
| | | | | | | | | | | | | | | | | | | | | | | | | | | | | | | | | | | | | | | |
| | | | | | | | | | | | | | | | | | | | | | | | | | | | | | | | | | | | | | | |
| | | | | | | | | | | | | | | | | | | | | | | | | | | | | | | | | | | | | | | |
| $ | 245,983 | | | $ | 353,091 | | | $ | 549,213 | | | $ | 806,448 | | | $ | 805,735 | | | $ | 44,493 | | | $ | 44,273 | | | $ | 66,612 | | | $ | 73,475 | | | $ | 61,383 | |
| | | | | | | | | | | | | | | | | | | | | | | | | | | | | | | | | | | | | | | |
| | 1.47 | % | | | 1.38 | % | | | 1.37 | % | | | 1.38 | % | | | 1.41 | % | | | 1.60 | % | | | 1.60 | % | | | 1.60 | % | | | 1.60 | % | | | 1.60 | % |
| | | | | | | | | | | | | | | | | | | | | | | | | | | | | | | | | | | | | | | |
| | 1.46 | % | | | 1.25 | % | | | 0.53 | % | | | (0.21 | )% | | | 0.16 | % | | | (0.82 | )% | | | (0.60 | )% | | | (0.80 | )% | | | (0.42 | )% | | | (0.06 | )% |
| | | | | | | | | | | | | | | | | | | | | | | | | | | | | | | | | | | | | | | |
| | 1.47 | % | | | 1.38 | % | | | 1.37 | % | | | 1.38 | % | | | 1.41 | % | | | 1.80 | % | | | 1.69 | % | | | 1.54 | % | | | 1.66 | % | | | 1.86 | % |
| | | | | | | | | | | | | | | | | | | | | | | | | | | | | | | | | | | | | | | |
| | 1.46 | % | | | 1.25 | % | | | 0.53 | % | | | (0.21 | )% | | | 0.16 | % | | | (1.02 | )% | | | (0.69 | )% | | | (0.74 | )% | | | (0.48 | )% | | | (0.32 | )% |
| | | | | | | | | | | | | | | | | | | | | | | | | | | | | | | | | | | | | | | |
| | 20 | % | | | 35 | % | | | 69 | % | | | 118 | % | | | 145 | % | | | 79 | % | | | 82 | % | | | 110 | % | | | 129 | % | | | 134 | % |
47
| NOTES TO FINANCIAL STATEMENTS |
NOTES TO FINANCIAL STATEMENTS September 30, 2017
The Marsico Investment Fund (the “Trust”) was organized on October 1, 1997, as a Delaware statutory trust and is registered under the Investment Company Act of 1940 (the “1940 Act”) as an open-end management investment company. The Focus Fund, Growth Fund, 21st Century Fund, International Opportunities Fund, Flexible Capital Fund, and Global Fund (collectively, the “Funds”) are separate investment portfolios of the Trust. The Focus Fund is a non-diversified fund and the Growth Fund, the 21st Century Fund, the International Opportunities Fund, the Flexible Capital Fund, and the Global Fund are diversified funds. The Focus Fund and Growth Fund commenced operations on December 31, 1997, the 21st Century Fund commenced operations on February 1, 2000, the International Opportunities Fund commenced operations on June 30, 2000, the Flexible Capital Fund commenced operations on December 29, 2006, and the Global Fund commenced operations on June 29, 2007. Trustees and officers of the Trust and employees of Marsico Capital Management, LLC (the “Adviser”) own approximately 6% and 18% of the International Opportunities Fund’s and Global Fund’s outstanding shares, respectively, as of September 30, 2017.
2. | Significant Accounting Policies |
The Funds qualify as investment companies under Accounting Standards Update No. 2013-08, Accounting Standard Codification Topic 946, Financial Services — Investment Companies (“ASC 946”). The following is a summary of significant accounting policies consistently followed by the Funds in the preparation of their financial statements. These policies are in conformity with Generally Accepted Accounting Principles (“GAAP”) in the United States of America for investment companies and follow the accounting guidance provided in ASC 946. The presentation of financial statements in conformity with GAAP requires management to make estimates and assumptions that affect the reported amounts and disclosures of assets and liabilities at the date of the financial statements and the reported amounts and disclosures of income and expenses during the reporting period. Actual results could differ from those estimates.
| | (a) | Investment Valuation — A security traded on a recognized stock exchange is generally valued at the last sale price prior to the closing of the principal exchange on which the security is traded. Securities traded on NASDAQ generally will be valued at the NASDAQ Official Closing Price. If no sale price is reported on the valuation date, the most current bid price will generally be used, with the exception of short option positions which will generally utilize the most current ask price. Other securities for which over-the-counter market quotations are readily available are generally valued at the last sale price. Debt securities that will mature in more than 60 days are generally valued at their bid prices furnished by a pricing service approved by the Funds’ Board of Trustees and subject to review pursuant to procedures established by, and under the general supervision of, the Board of Trustees. Debt securities that will mature in 60 days or less are valued at amortized cost, if it approximates market value. Any securities for which market quotations are not readily available are valued at their fair value as determined in good faith by the Adviser in accordance with procedures established by, and under the general supervision of, the Funds’ Board of Trustees. The Funds may use pricing services to assist in determining market value. The Board of Trustees has authorized the use of a pricing service to assist the Funds in valuing certain equity securities listed or traded on foreign security exchanges in the Funds’ portfolios in certain circumstances where there is a significant change in the value of related US-traded securities, as represented by, for example, the S&P 500 Index. |
“Fair Value Measurements and Disclosures” (the “Fair Value Statement”) defines fair value, establishes a framework for measuring fair value in GAAP, and expands disclosures about fair value measurements. Under the Fair Value Statement, various inputs are used in determining the value of the Funds’ investments.
These inputs are summarized into three broad levels and described below:
| | ● | Level 1 – quoted prices in active markets for identical investments |
| | ● | Level 2 – other significant observable inputs (including quoted prices for similar investments, interest rates, and evaluated quotations obtained from pricing services) |
| | ● | Level 3 – significant unobservable inputs (including the Fund’s assumptions that market participants would use in determining the fair value of investments) |
48
| NOTES TO FINANCIAL STATEMENTS |
The inputs or methodology used for valuing investments are not an indication of the risk associated with investing in those investments. Changes in valuation techniques may result in transfers between the levels during the reporting period. The Funds recognize transfers between the levels as of the end of each reporting period and consider securities that are purchased during the reporting period as not having transferred between levels as of the end of the reporting period. There were no transfers between each of the three levels during the reporting period. The following is a summary of the fair values of the Funds’ investments in each category and economic sector as of September 30, 2017:
Fund Investments by
Major Security Type | | Level 1 | | | Level 2 | | | Level 3 | | | Total | |
| Marsico Focus Fund | | | | | | | | | | | | |
| Assets | | | | | | | | | | | | |
| Common Stocks | | | | | | | | | | | | |
| Consumer Discretionary | | $ | 77,244,713 | | | $ | — | | | $ | — | | | $ | 77,244,713 | |
| Consumer Staples | | | 27,883,116 | | | | — | | | | — | | | | 27,883,116 | |
| Financials | | | 27,060,697 | | | | — | | | | — | | | | 27,060,697 | |
| Health Care | | | 103,797,642 | | | | — | | | | — | | | | 103,797,642 | |
| Industrials | | | 17,818,713 | | | | — | | | | — | | | | 17,818,713 | |
| Information Technology | | | 258,296,762 | | | | — | | | | — | | | | 258,296,762 | |
| Materials | | | 18,696,849 | | | | — | | | | — | | | | 18,696,849 | |
| Short-term Investments | | | 35,842,753 | | | | — | | | | — | | | | 35,842,753 | |
| | | | | | | | | | | | | | | $ | 566,641,245 | |
| Marsico Growth Fund | | | | | | | | | | | | | | | | |
| Assets | | | | | | | | | | | | | | | | |
| Common Stocks | | | | | | | | | | | | | | | | |
| Consumer Discretionary | | $ | 27,811,768 | | | $ | — | | | $ | — | | | $ | 27,811,768 | |
| Consumer Staples | | | 13,137,065 | | | | — | | | | — | | | | 13,137,065 | |
| Financials | | | 22,544,715 | | | | — | | | | — | | | | 22,544,715 | |
| Health Care | | | 58,275,885 | | | | — | | | | — | | | | 58,275,885 | |
| Industrials | | | 15,275,553 | | | | — | | | | — | | | | 15,275,553 | |
| Information Technology | | | 108,310,332 | | | | — | | | | — | | | | 108,310,332 | |
| Materials | | | 6,330,863 | | | | — | | | | — | | | | 6,330,863 | |
| Real Estate | | | 11,177,004 | | | | — | | | | — | | | | 11,177,004 | |
| Short-term Investments | | | 12,889,369 | | | | — | | | | — | | | | 12,889,369 | |
| | | | | | | | | | | | | | | $ | 275,752,554 | |
Marsico 21st Century Fund | | | | | | | | | | | | | | | | |
| Assets | | | | | | | | | | | | | | | | |
| Common Stocks | | | | | | | | | | | | | | | | |
| Consumer Discretionary | | $ | 38,233,230 | | | $ | — | | | $ | — | | | $ | 38,233,230 | |
| Consumer Staples | | | 16,912,993 | | | | — | | | | — | | | | 16,912,993 | |
| Financials | | | 18,890,637 | | | | — | | | | — | | | | 18,890,637 | |
| Health Care | | | 25,674,620 | | | | — | | | | — | | | | 25,674,620 | |
| Industrials | | | 21,110,577 | | | | — | | | | — | | | | 21,110,577 | |
| Information Technology | | | 71,464,701 | | | | — | | | | — | | | | 71,464,701 | |
| Materials | | | 13,694,811 | | | | — | | | | — | | | | 13,694,811 | |
| Real Estate | | | 12,094,196 | | | | — | | | | — | | | | 12,094,196 | |
| Short-term Investments | | | 15,925,232 | | | | — | | | | — | | | | 15,925,232 | |
| | | | | | | | | | | | | | | $ | 234,000,997 | |
| Marsico International Opportunities Fund | | | | | | | | | | | | | | | | |
| Assets | | | | | | | | | | | | | | | | |
| Common Stocks | | | | | | | | | | | | | | | | |
| Consumer Discretionary | | $ | 12,055,940 | | | $ | — | | | $ | — | | | $ | 12,055,940 | |
| Consumer Staples | | | 3,512,993 | | | | — | | | | — | | | | 3,512,993 | |
| Financials | | | 7,669,612 | | | | — | | | | — | | | | 7,669,612 | |
| Health Care | | | 7,831,106 | | | | — | | | | — | | | | 7,831,106 | |
| Industrials | | | 5,532,477 | | | | — | | | | — | | | | 5,532,477 | |
| Information Technology | | | 24,123,709 | | | | — | | | | — | | | | 24,123,709 | |
| Real Estate | | | 659,814 | | | | — | | | | — | | | | 659,814 | |
| Telecommunication Services | | | 903,526 | | | | — | | | | — | | | | 903,526 | |
| Short-term Investments | | | 1,893,432 | | | | — | | | | — | | | | 1,893,432 | |
| | | | | | | | | | | | | | | $ | 64,182,609 | |
49
| NOTES TO FINANCIAL STATEMENTS |
NOTES TO FINANCIAL STATEMENTS September 30, 2017 (continued)
Fund Investments by
Major Security Type | | Level 1 | | | Level 2 | | | Level 3 | | | Total | |
| Marsico Flexible Capital Fund | | | | | | | | | | | | |
| Assets | | | | | | | | | | | | |
| Common Stocks | | | | | | | | | | | | |
| Consumer Discretionary | | $ | 43,888,355 | | | $ | — | | | $ | — | | | $ | 43,888,355 | |
| Consumer Staples | | | 15,915,659 | | | | — | | | | — | | | | 15,915,659 | |
| Financials | | | 19,138,855 | | | | — | | | | — | | | | 19,138,855 | |
| Health Care | | | 27,817,311 | | | | — | | | | — | | | | 27,817,311 | |
| Industrials | | | 32,034,543 | | | | — | | | | — | | | | 32,034,543 | |
| Information Technology | | | 51,563,998 | | | | — | | | | — | | | | 51,563,998 | |
| Real Estate | | | 9,311,237 | | | | — | | | | — | | | | 9,311,237 | |
| Convertible Preferred Stocks | | | 3,018,422 | | | | — | | | | — | | | | 3,018,422 | |
| Corporate Bonds | | | — | | | | 17,648,750 | | | | — | | | | 17,648,750 | |
| Preferred Stocks | | | 9,517,691 | | | | — | | | | — | | | | 9,517,691 | |
| Short-term Investments | | | 14,751,151 | | | | — | | | | — | | | | 14,751,151 | |
| | | | | | | | | | | | | | | $ | 244,605,972 | |
| Marsico Global Fund | | | | | | | | | | | | | | | | |
| Assets | | | | | | | | | | | | | | | | |
| Common Stocks | | | | | | | | | | | | | | | | |
| Consumer Discretionary | | $ | 8,620,086 | | | $ | — | | | $ | — | | | $ | 8,620,086 | |
| Consumer Staples | | | 2,078,469 | | | | — | | | | — | | | | 2,078,469 | |
| Financials | | | 878,718 | | | | — | | | | — | | | | 878,718 | |
| Health Care | | | 5,465,725 | | | | — | | | | — | | | | 5,465,725 | |
| Industrials | | | 1,336,409 | | | | — | | | | — | | | | 1,336,409 | |
| Information Technology | | | 23,334,227 | | | | — | | | | — | | | | 23,334,227 | |
| Materials | | | 1,102,047 | | | | — | | | | — | | | | 1,102,047 | |
| Short-term Investments | | | 1,496,567 | | | | — | | | | — | | | | 1,496,567 | |
| | | | | | | | | | | | | | | $ | 44,312,248 | |
| | (b) | Expenses — The Funds are charged for those expenses that are directly attributable to each Fund, such as advisory and custodial fees. Expenses that are not directly attributable to a Fund are typically allocated among the Funds in proportion to their respective net assets and are in some cases allocated based on other factors. The Funds’ expenses may be reduced by advisory fee waivers, brokerage credits and uninvested cash balances earning interest or credits. Such credits are included in “Less waiver of expenses and expenses paid indirectly” on the Statements of Operations. |
Brokerage commissions may be paid to certain brokers which reduce transfer agent fees and expenses. For the year ended September 30, 2017, the Funds received no such brokerage commission credits. The Funds received earnings credits on certain cash account balances which reduced transfer agent fees and expenses in the amount of (in thousands) $1 for the Focus Fund and less than $1 for the Growth Fund, 21st Century Fund, International Opportunities Fund, Flexible Capital Fund, and Global Fund, respectively, for the year ended September 30, 2017. Brokerage commission credits and earnings credits (if any) are included in “Less waiver of expenses and expenses paid indirectly” on the Statements of Operations.
| | (c) | Federal Income Taxes — Each Fund intends to comply with the requirements of the Internal Revenue Code of 1986, as amended (the “Internal Revenue Code”), necessary to continue to qualify as a regulated investment company and to make the requisite distributions of income to its shareholders which will be sufficient to relieve it from all or substantially all federal and state income taxes. Certain Funds may utilize earnings and profits on redemption of shares as part of the dividends paid deduction. |
| | (d) | Distributions to Shareholders — Dividends from net investment income and net realized capital gains, if any, will be declared and paid at least annually. Distributions to shareholders are recorded on the ex-dividend date. Each Fund may periodically make reclassifications among certain of its capital accounts as a result of the timing and characterization of certain income and capital gains distributions determined in accordance with federal tax regulations, which may differ from GAAP. These reclassifications are due to differing treatment for items such as foreign currency transactions, passive foreign investment companies and net investment losses. |
The Funds at times may invest in real estate investment trusts (“REITs”). REITs generally pay dividends to their investors based upon cash available from their operations and this amount may differ significantly from the REITs’ actual earnings and profits (“E&P”) determined for income tax purposes. It is common for these dividends to exceed the REITs’ taxable E&P, resulting in the excess portion of such dividends eventually being designated as a return of capital. Determination of the tax character of dividends made by REITs is typically performed by the REIT several months subsequent to the payment of the dividend. Therefore, due to timing issues, the Funds may be in a position of being required to calculate and pay required distribution amounts to their shareholders based on the best information available from the REITs, which may be prior to the final determination of the REITs’ taxable E&P, and it is possible that a portion of the Funds’ distribution amounts could include a return of capital to shareholders for federal income tax purposes.
50
| NOTES TO FINANCIAL STATEMENTS |
| | (e) | Foreign Currency Translation — The accounting records of the Funds are maintained in US dollars. For valuation purposes, values of securities denominated in foreign currencies are translated into US dollars at 4:00 p.m. Eastern Time. Amounts related to the purchase and sale of foreign securities and investment income are translated at the rates of exchange prevailing on the respective dates of such transactions. |
Reported realized gains and losses on foreign currency transactions arise from sales of portfolio securities, forward foreign currency contracts, currency gains or losses realized between the trade and settlement dates on securities transactions, and the difference between the amounts of dividends, interest, and foreign withholding taxes recorded on the Funds’ books and the US dollar equivalent of the amounts actually received or paid.
The Funds do not isolate that portion of the results of operations resulting from changes in foreign exchange rates on investments from the fluctuations arising from changes in market prices of securities held at the end of the reporting period. Net unrealized appreciation or depreciation on investments and foreign currency translations arises from changes in the value of assets and liabilities, including investments in securities at the end of the reporting period, resulting from changes in the exchange rates and changes in market prices of securities held. Transactions in foreign-denominated assets may involve greater risks than domestic transactions, including currency risk, political and economic risk, regulatory risk and market risk.
| | (f) | Derivative Instruments — “Disclosure about Derivative Instruments and Hedging Activities” (the “Derivatives Statement”) requires enhanced disclosures about the Funds’ derivative and hedging activities, including how such activities are accounted for and their effects on the Funds’ financial position, performance and cash flows. |
The Funds are not intended as vehicles for investing substantially in derivative instruments, and may hold derivative instruments only infrequently. The Funds enter into derivative instruments in order to increase exposure to certain investments, asset classes, or markets, or for hedging purposes to hedge against adverse movements in securities prices, currency rates or interest rates. The Funds can hold various types of derivative instruments such as futures contracts and options on securities, financial indexes, and foreign currencies, options on futures, forward foreign currency contracts, interest rate swaps, credit default swaps, and swap-related products. The use of derivative instruments may involve risks such as the possibility of illiquid markets or imperfect correlation between the value of the derivative instruments and the underlying securities, or that the counterparty will fail to perform its obligations. There were no outstanding derivative instruments held by the Funds as of September 30, 2017 nor did the Funds utilize derivative instruments during the year ended September 30, 2017.
| | (g) | Trustees’ Deferred Fee Plan — Effective February 1, 2000, the Board of Trustees adopted the Marsico Investment Fund Deferred Fee Plan (the “Deferred Fee Plan”), amended and restated as of December 30, 2005, which allows the Trustees to defer the receipt of all or a portion of their compensation received from the Funds. Any deferred fees are credited to accounts established on behalf of the Trustees into the Funds as directed by each Trustee. The amounts credited to these accounts increase or decrease in accordance with the performance of the Funds selected by the Trustees. The market value of the deferred account balances as of September 30, 2017 is shown on the Statements of Assets and Liabilities as part of an asset account, “Prepaid expenses and other assets”, and a liability account, “Accrued trustees’ fees”. Additionally, the fluctuation of the account balances due to the Funds’ performance is recorded by the Funds as unrealized appreciation (depreciation), which is shown as part of “Net unrealized appreciation on investments and foreign currency translations” on the Statements of Assets and Liabilities, and as compensation expense, which is shown as part of the expense account “Trustees’ fees and expenses” on the Statements of Operations. Fees earned and deferred by the Trustees for the year ended September 30, 2017 are also included in “Trustees’ fees and expenses” on the Statements of Operations. Amounts contributed to the Deferred Fee Plan will be deferred until distributed in accordance with the Deferred Fee Plan. Unrealized appreciation (depreciation) of Fund shares held in the Deferred Fee Plan is subject to the Funds’ expense reimbursement agreement with the Adviser. |
| | (h) | Redemption Fee — Effective January 31, 2014, the Funds’ Board of Trustees approved the elimination of redemption fees from Fund share transactions placed on and after January 31, 2014. Prior to January 31, 2014, a 2.00% redemption fee was retained by the Funds to offset transaction costs and other expenses associated with short-term investing. The fee was imposed on certain redemptions or exchanges of shares held 30 days or less from their purchase date. Redemption fees were recorded by the Funds as a reduction of shares redeemed and as a credit to paid-in-capital. |
| | (i) | Other — Investment transactions are accounted for on a trade date basis. Each Fund determines the gain or loss realized from the investment transactions by comparing the original cost of the security lot sold with the net sale proceeds. Dividend income is recognized on the ex-dividend date. Certain dividends from foreign securities are recorded when the Funds are informed of the dividend if such information is obtained subsequent to the ex-dividend date. Interest income is recognized on an accrual basis and includes amortization of premiums and accretion of discounts. |
During the fiscal year ended September 30, 2016, the custodian reimbursed the Funds, including interest, for billing processing errors. The custodian paid (in thousands) $32, $31, $35, $116, $8, and $11 to the Focus Fund, Growth Fund, 21st Century Fund, International Opportunities Fund, Flexible Capital Fund, and Global Fund, respectively. These amounts are included in Paid-in-capital and Capital Share Transactions for each of the Funds. The amounts did not have a significant effect on each of the Fund’s total return.
| | (j) | Indemnifications — In the normal course of business, the Funds enter into contracts that contain provisions indemnifying other parties against specified potential liabilities. Each Fund’s maximum exposure under these arrangements is unknown as this would involve future claims that |
51
| NOTES TO FINANCIAL STATEMENTS |
NOTES TO FINANCIAL STATEMENTS September 30, 2017 (continued)
may be made against the Fund that have not yet occurred. However, based on experience, the Funds expect the risk of loss in connection with these potential indemnification obligations to be remote. There can be no assurance that material liabilities related to such obligations will not arise in the future, which may adversely impact a Fund.
3. | Investment Advisory Agreement and Transactions With Affiliates |
Each Fund has an agreement with the Adviser to furnish investment advisory services to the Funds. Prior to December 1, 2015, the Adviser was compensated for managing the Focus Fund and the Growth Fund at the rate of 0.85% per year of average daily net assets up to $3 billion in each Fund, and 0.75% per year of average daily net assets exceeding $3 billion in each Fund; and at a rate of 0.85% of the average daily net assets of the 21st Century Fund, the International Opportunities Fund, the Flexible Capital Fund, and the Global Fund. As of December 1, 2015, each Fund pays the Adviser a fee calculated using the following, lower rates:
| Annual Rate of Average Daily Net Assets | Asset Threshold |
| 0.80% | First $250 million |
| 0.75% | Next $250 million |
| 0.70% | Next $250 million |
| 0.65% | In excess of $750 million |
The Adviser has entered into a written expense limitation and fee waiver agreement under which it has agreed to limit the total expenses of each Fund (excluding interest, taxes, acquired fund fees and expenses, litigation, brokerage, and extraordinary expenses) to an annual rate of 1.60% of the average net assets of the Focus Fund, the International Opportunities Fund, the Flexible Capital Fund, and the Global Fund, and 1.50% of the average net assets of the Growth Fund and the 21st Century Fund until January 31, 2018. This expense limitation and fee waiver agreement may be terminated by the Adviser at any time after January 31, 2018, upon 15 days prior notice to the Fund and its administrator.
The Adviser may recoup from a Fund fees previously waived or expenses previously reimbursed by the Adviser with respect to that Fund pursuant to this agreement (or a previous expense limitation agreement) if: (1) such recoupment by the Adviser does not cause the Fund, at the time of recoupment, to exceed the lesser of (a) the expense limitation in effect at the time the relevant amount was waived and/or reimbursed, or (b) the expense limitation in effect at the time of the proposed recoupment, and (2) the recoupment is made within three fiscal years after the end of the fiscal year in which the amount was waived or reimbursed. As of September 30, 2017, recoupment amounts (in thousands) that may potentially be made by the International Opportunities Fund and Global Fund to the Adviser are as follows:
| Year of Expiration | | International
Opportunities Fund | | | Global Fund | |
| 2018 | | $ | 32 | | | $ | — | |
| 2019 | | | 128 | | | | 53 | |
| 2020 | | | 106 | | | | 76 | |
| | | $ | 266 | | | $ | 129 | |
Certain officers of the Trust are also officers of the Adviser. The Funds pay a portion of the Chief Compliance Officer’s total compensation costs which is shown as part of the expense account “Professional fees” on the Statements of Operations. No other officers of the Trust received compensation from the Funds during the year ended September 30, 2017.
4. | Distribution and Service Plan |
The Funds have adopted a Distribution and Service Plan (the “Plan”) pursuant to Rule 12b-1 under the 1940 Act. The Plan authorizes payments by the Funds in connection with the distribution of their shares at an annual rate, as determined from time to time by the Board of Trustees, of 0.25% of a Fund’s average daily net assets. Payments may be made by the Funds under the Plan for the purpose of financing any activity primarily intended to result in the sale of shares of the Funds, as determined by the Board of Trustees, as well as for account maintenance and personal services to shareholders and any other non-distribution-related services. The Adviser may, out of its own resources (which may include legitimate profits from providing advisory services to the Funds or other clients) and at its sole discretion, make certain payments on behalf of the Funds or the Plan for expenses incurred by a Fund for distribution of Fund shares and related services or for administrative or other expenses incurred by the Fund. The Plan was amended in November 2016 to reflect certain non-material changes, which were intended to clarify the types of non-distribution expenses, such as administrative fees charged by supermarket intermediaries, that may be paid for through 12b-1 fees under the Plan. Prior to May 1, 2017, the Funds utilized 12b-1 fees to pay for only a portion of the administrative fees charged by supermarket intermediaries. Any remaining amounts were expensed by the Funds and included in “Transfer agent fees and expenses” on the Statements of Operations. Subsequent to amending the Plan in November 2016, the Board of Trustees authorized the Funds to utilize available 12b-1 fees for payment of the entire balance of administrative fees charged by supermarket intermediaries if and to the extent a Fund had sufficient accrued 12b-1 fee balances available.
52
| NOTES TO FINANCIAL STATEMENTS |
5. | Investment Transactions |
The aggregate purchases and sales of securities, excluding short-term investments, for the Funds for the year ended September 30, 2017, were as follows:
| (Amounts in thousands) | | Focus
Fund | | | Growth
Fund | | | 21st
Century
Fund | | | International
Opportunities
Fund | | | Flexible
Capital
Fund | | | Global
Fund | |
| Purchases | | $ | 353,334 | | | $ | 127,899 | | | $ | 61,866 | | | $ | 61,541 | | | $ | 53,845 | | | $ | 29,938 | |
| Sales | | $ | 536,399 | | | $ | 180,131 | | | $ | 117,970 | | | $ | 74,251 | | | $ | 190,253 | | | $ | 36,978 | |
There were no purchases or sales of US government securities, excluding short-term investments.
6. | Federal Income Tax Information |
“Accounting for Uncertainty in Income Taxes” (the “Income Tax Statement”) requires an evaluation of tax positions taken (or expected to be taken) in the course of preparing a Fund’s tax returns to determine whether these positions meet a “more-likely-than-not” standard that, based on the technical merits, have a more than fifty percent likelihood of being sustained by a taxing authority upon examination. A tax position that meets the “more-likely-than-not” recognition threshold is measured to determine the amount of benefit to recognize in the financial statements. The Funds recognize interest and penalties, if any, related to unrecognized tax benefits as income tax expense in the Statements of Operations.
The Income Tax Statement requires management of the Funds to analyze all open tax years, fiscal years 2014-2017 as defined by Internal Revenue Service (“IRS”) statute of limitations for all major jurisdictions, including federal tax authorities and certain state tax authorities. As of and during the year ended September 30, 2017, the Funds did not have any liabilities for any unrecognized tax benefits. The Funds have no examinations in progress and are not aware of any tax positions for which it is reasonably possible that the total amounts of unrecognized tax benefits will significantly change in the next twelve months.
At September 30, 2017, gross unrealized appreciation and depreciation of investments, based on cost for federal income tax purposes were as follows:
| (Amounts in thousands) | | Focus
Fund | | | Growth
Fund | | | 21st
Century
Fund | | | International
Opportunities
Fund | | | Flexible
Capital
Fund | | | Global
Fund | |
| Cost of Investments | | $ | 400,718 | | | $ | 192,788 | | | $ | 168,509 | | | $ | 50,994 | | | $ | 194,119 | | | $ | 31,905 | |
| | | | | | | | | | | | | | | | | | | | | | | | | |
| Gross Unrealized Appreciation | | $ | 170,575 | | | $ | 83,056 | | | $ | 69,062 | | | $ | 13,497 | | | $ | 52,030 | | | $ | 12,468 | |
| Gross Unrealized Depreciation | | | (4,652 | ) | | | (91 | ) | | | (3,570 | ) | | | (308 | ) | | | (1,543 | ) | | | (61 | ) |
| | | | | | | | | | | | | | | | | | | | | | | | | |
| Net Unrealized Appreciation on Investments | | $ | 165,923 | | | $ | 82,965 | | | $ | 65,492 | | | $ | 13,189 | | | $ | 50,487 | | | $ | 12,407 | |
The difference between cost amounts for financial statement and federal income tax purposes is due primarily to wash sale loss deferrals.
At September 30, 2017, for federal income tax purposes, the Funds had accumulated capital loss carryforwards as follows:
| (Amounts in thousands) | | Focus
Fund | | | Growth
Fund | | | 21st
Century
Fund | | | International
Opportunities
Fund | | | Flexible
Capital
Fund | | | Global
Fund | |
| For losses expiring September 30, | | | | | | | | | | | | | | | | | | |
| 2018 | | $ | — | | | $ | — | | | $ | 383,616 | | | $ | 93,558 | | | $ | — | | | $ | — | |
| Not Subject to Expiration | | | — | | | | — | | | | — | | | | — | | | | — | | | | — | |
| | | $ | — | | | $ | — | | | $ | 383,616 | | | $ | 93,558 | | | $ | — | | | $ | — | |
To the extent that a Fund may realize future net capital gains, those gains will be offset by any of its unused capital loss carryforwards if and to the extent a Fund is able to under the Internal Revenue Code. Amounts reflected in the table above are not available to offset any future net capital gains for excise tax purposes.
Future capital loss carryforward utilization in any given year may be subject to Internal Revenue Code limitations. The 21st Century Fund and International Opportunities Fund anticipate that a significant portion of the capital loss carryforwards reflected in the table above will not be utilized prior to their expiration.
The Funds are permitted to carryforward capital losses incurred in taxable years beginning after December 22, 2010 for an unlimited period, and such capital losses will retain their character as either short-term or long-term capital losses. Capital losses incurred by the Funds in taxable years beginning before December 23, 2010 may only be carried forward eight taxable years as short-term capital losses.
53
| NOTES TO FINANCIAL STATEMENTS |
NOTES TO FINANCIAL STATEMENTS September 30, 2017 (continued)
During the year ended September 30, 2017, the Focus Fund, 21st Century Fund, International Opportunities Fund, and Global Fund utilized capital loss carryforwards of (in thousands) $1,199, $34,343, $8,663 and $416, respectively.
As of September 30, 2017, the Focus Fund, Growth Fund, 21st Century Fund, International Opportunities Fund, Flexible Capital Fund, and Global Fund, respectively, had (in thousands) $1,870, $894, $1,560, $144, $0 and $192 of qualified late-year losses, which are deferred until fiscal year 2018 for tax purposes. Net late-year losses that are deferred, are deemed to arise on the first day of the Fund’s next taxable year.
As of September 30, 2017, the components of accumulated earnings (deficit) on a tax basis were as follows:
| (Amounts in thousands) | | Focus
Fund | | | Growth
Fund | | | 21st
Century
Fund | | | International
Opportunities
Fund | | | Flexible
Capital
Fund | | | Global
Fund | |
| Undistributed Ordinary Income | | $ | — | | | $ | — | | | $ | — | | | $ | — | | | $ | 2,975 | | | $ | 362 | |
| Undistributed Trustees’ Deferred Compensation | | | (2,503 | ) | | | (1,368 | ) | | | (897 | ) | | | (347 | ) | | | (1,068 | ) | | | (382 | ) |
| Undistributed Long-Term Capital Gains | | | 87,734 | | | | 25,152 | | | | — | | | | — | | | | 24,025 | | | | 3,705 | |
| Tax Accumulated Earnings (Deficit) | | | 85,231 | | | | 23,784 | | | | (897 | ) | | | (347 | ) | | | 25,932 | | | | 3,685 | |
| Accumulated Capital and Other Losses | | | (1,870 | ) | | | (894 | ) | | | (385,176 | ) | | | (93,702 | ) | | | — | | | | (192 | ) |
| Net Unrealized Appreciation on Investments and on Foreign Currency Translations | | | 165,923 | | | | 82,965 | | | | 65,492 | | | | 13,189 | | | | 50,487 | | | | 12,408 | |
| Trustees' Deferred Compensation Mark-to-Market | | | 1,112 | | | | 488 | | | | 209 | | | | 72 | | | | 761 | | | | 73 | |
| Total Accumulated Earnings (Deficit) | | $ | 250,396 | | | $ | 106,343 | | | $ | (320,372 | ) | | $ | (80,788 | ) | | $ | 77,180 | | | $ | 15,974 | |
Undistributed ordinary income consists of net investment income and timing differences related to qualified late-year losses.
The tax character of distributions paid during the fiscal years ended September 30, 2017 and 2016 was as follows:
| | | 2017 | | | 2016 | |
| (Amounts in thousands) | | Ordinary Income | | | Long-Term Capital Gains | | | Ordinary Income | | | Long-Term Capital Gains | |
| Focus Fund | | $ | — | | | $ | — | | | $ | — | | | $ | 157,703 | |
| Growth Fund | | | — | | | | 2,136 | | | | — | | | | 111,369 | |
21st Century Fund | | | — | | | | — | | | | — | | | | — | |
| International Opportunities Fund | | | — | | | | — | | | | — | | | | — | |
| Flexible Capital Fund | | | 4,808 | | | | 21,758 | | | | 3,373 | | | | 64,551 | |
| Global Fund | | | — | | | | — | | | | — | | | | 6,835 | |
The tax character of dividends paid may differ from that shown in the Statements of Changes in Net Assets due to short-term gains being treated as ordinary income for tax purposes.
On November 15, 2017, the Board of Trustees approved the Adviser’s decision to amend the written expense limitation and fee waiver agreement between each of the Funds and the Adviser. Under the amended written expense limitation and fee waiver agreement, the Adviser has agreed to further reduce the limit of total expenses of each Fund (excluding interest, taxes, acquired fund fees and expenses, litigation, brokerage, and extraordinary expenses) to the annual rates stated below based on the average net assets of each of the Funds. Effective December 1, 2017, the amended total expense limitation for each of the Funds will be as follows:
| Fund | Current Total
Expense Limitation | Amended Total
Expense Limitation |
| Focus Fund | 1.60% | 1.45% |
| Growth Fund | 1.50% | 1.45% |
21st Century Fund | 1.50% | 1.45% |
| International Opportunities Fund | 1.60% | 1.50% |
| Flexible Capital Fund | 1.60% | 1.45% |
| Global Fund | 1.60% | 1.50% |
Additionally on November 15, 2017, the Board of Trustees approved an amendment to the Fund’s Distribution and Service Plan pursuant to Rule 12b-1 under the 1940 Act that clarifies the Board’s authority to waive or limit a Fund’s 12b-1 fee to less than 0.25% of the Fund’s average daily net assets, or thereafter authorize the Fund to charge a 12b-1 fee not exceeding 0.25%. The Board of Trustees also approved a reduction in the annual
54
| NOTES TO FINANCIAL STATEMENTS |
rate of accrual of 12b-1 fees for the Focus Fund, Growth Fund and 21st Century Fund from an annual rate of 0.25% of each Fund’s average daily net assets to an annual rate of 0.20% of each Fund’s average daily net assets. These reduced annual rates will be effective December 1, 2017. Future changes to these rates as well as the annual rates established for the other Marsico Funds may be approved by the Board of Trustees from time to time.
Management of the Adviser has determined that there were no other material subsequent events that would require disclosure in the Funds’ financial statements.
8. New Accounting Pronouncements
The FASB issued Accounting Standards Update No. 2017-08, Receivables – Nonrefundable Fees and Other Costs (Subtopic 310-20), Premium Amortization on Purchased Callable Debt Securities (“ASU 2017-08”) to amend the amortization period for certain purchased callable debt securities held at a premium. The guidance requires certain premiums on callable debt securities to be amortized to the earliest call date. The amortization period for callable debt securities purchased at a discount will not be impacted. The guidance is effective for fiscal years beginning after December 15, 2018, and interim periods within those fiscal years, with early adoption permitted. Management is currently evaluating the impact these changes may have on the Funds’ financial statements.
55
| REPORT OF INDEPENDENT REGISTERED PUBLIC ACCOUNTING FIRM |
REPORT OF INDEPENDENT REGISTERED PUBLIC ACCOUNTING FIRM
To the Board of Trustees of The Marsico Investment Fund and Shareholders of Marsico Focus Fund, Marsico Growth Fund, Marsico 21st Century Fund, Marsico International Opportunities Fund, Marsico Flexible Capital Fund and Marsico Global Fund
In our opinion, the accompanying statements of assets and liabilities, including the schedules of investments, and the related statements of operations and of changes in net assets and the financial highlights present fairly, in all material respects, the financial position of Marsico Focus Fund, Marsico Growth Fund, Marsico 21st Century Fund, Marsico International Opportunities Fund, Marsico Flexible Capital Fund and Marsico Global Fund (constituting The Marsico Investment Fund, hereafter collectively referred to as the “Funds”) as of September 30, 2017, the results of each of their operations for the year then ended, the changes in each of their net assets for each of the two years in the period then ended and the financial highlights for each of the five years in the period then ended, in conformity with accounting principles generally accepted in the United States of America. These financial statements and financial highlights (hereafter referred to as “financial statements”) are the responsibility of the Funds’ management. Our responsibility is to express an opinion on these financial statements based on our audits. We conducted our audits of these financial statements in accordance with the standards of the Public Company Accounting Oversight Board (United States). Those standards require that we plan and perform the audit to obtain reasonable assurance about whether the financial statements are free of material misstatement. An audit includes examining, on a test basis, evidence supporting the amounts and disclosures in the financial statements, assessing the accounting principles used and significant estimates made by management, and evaluating the overall financial statement presentation. We believe that our audits, which included confirmation of securities as of September 30, 2017 by correspondence with the custodian and brokers, provide a reasonable basis for our opinion.

Denver, Colorado
November 15, 2017
56
EXPENSE EXAMPLE For the six-month period ended September 30, 2017 (Unaudited)
As a shareholder of the Marsico Funds (the “Funds”), you incur two types of costs: (1) transaction costs, including redemption fees (if any), and (2) ongoing costs, including management fees, distribution (12b-1) fees, and other Fund expenses. This Example is intended to help you understand your ongoing costs (in dollars) of investing in the Funds and to compare these costs with the ongoing costs of investing in other mutual funds.
The Example is based on an investment of $1,000 invested at the beginning of the period and held for the entire period from April 1, 2017 to September 30, 2017 (the “period”).
Actual Expenses
The first line of the table below provides information about actual account values and actual expenses. You may use the information in this line, together with the amount you invested, to estimate the expenses you paid over the period. Simply divide your account value by $1,000 (for example, an $8,600 account value divided by $1,000 equals 8.6), then multiply the result by the number in the first line under the heading entitled “Expenses paid for the six-month period ended September 30, 2017” to estimate the expenses you paid on your account during the period.
Hypothetical Example for Comparison Purposes
The second line of the table below provides information about hypothetical account values and hypothetical expenses based on the Funds’ actual expense ratios and an assumed rate of return of 5% per year before expenses, which is not the actual return of any of the Funds. The hypothetical account values and expenses may not be used to estimate the actual ending account balance or expenses you paid for the period. You may use this information to compare the ongoing costs of investing in the Funds and other funds. To do so, compare this 5% hypothetical example with the 5% hypothetical examples that appear in the shareholder reports of other funds.
Please note that the expenses shown in the table are meant to highlight your ongoing costs only and do not reflect any transactional costs such as redemption fees (if any). Therefore, the second line of the table is useful in comparing the ongoing costs only, and will not help you determine the relative total costs of owning different funds. In addition, if these transactional costs (if any) were included, your costs could have been higher.
| Expenses Paid During the Period | Beginning
account value
April 1, 2017 | Ending
account value
September 30, 2017 | Expenses paid for the
six-month period ended
September 30, 2017(1) |
| FOCUS FUND | | | |
| Actual Example | $ 1,000.00 | $ 1,161.50 | $ 7.34 |
| Hypothetical Example, assuming a 5% return before expenses | $ 1,000.00 | $ 1,018.21 | $ 6.85 |
| | | | |
| GROWTH FUND | | | |
| Actual Example | $ 1,000.00 | $ 1,138.00 | $ 7.41 |
| Hypothetical Example, assuming a 5% return before expenses | $ 1,000.00 | $ 1,018.07 | $ 6.99 |
| | | | |
21st CENTURY FUND | | | |
| Actual Example | $ 1,000.00 | $ 1,111.20 | $ 7.14 |
| Hypothetical Example, assuming a 5% return before expenses | $ 1,000.00 | $ 1,018.24 | $ 6.83 |
| | | | |
| INTERNATIONAL OPPORTUNITIES FUND | | | |
| Actual Example | $ 1,000.00 | $ 1,219.20 | $ 8.90 |
| Hypothetical Example, assuming a 5% return before expenses | $ 1,000.00 | $ 1,016.98 | $ 8.09 |
| | | | |
| FLEXIBLE CAPITAL FUND | | | |
| Actual Example | $ 1,000.00 | $ 1,064.60 | $ 7.46 |
| Hypothetical Example, assuming a 5% return before expenses | $ 1,000.00 | $ 1,017.78 | $ 7.29 |
| | | | |
| GLOBAL FUND | | | |
| Actual Example | $ 1,000.00 | $ 1,212.30 | $ 8.87 |
| Hypothetical Example, assuming a 5% return before expenses | $ 1,000.00 | $ 1,016.98 | $ 8.09 |
(1) | Expenses are equal to the Funds’ annualized expense ratios (1.35% for the Focus Fund, 1.38% for the Growth Fund, 1.35% for the 21st Century Fund, 1.60% for the International Opportunities Fund, 1.44% for the Flexible Capital Fund, and 1.60% for the Global Fund), multiplied by the average account value over the period, multiplied by 183/365 (to reflect the six-month period). |
57
OTHER INFORMATION (Unaudited)
Proxy Voting Guidelines
The Funds exercise the voting rights associated with the securities held by the Funds under the proxy voting policy of the Funds. A description of those policies and procedures of the Funds and a record of the Funds’ proxy votes for the one-year period ended June 30, 2017 are available without charge, upon request, by calling 888-860-8686. It is also available on the Securities and Exchange Commission’s (SEC) website at www.sec.gov.
Quarterly Filing of Portfolio Holdings
The Funds will file their complete schedule of investments with the SEC for the first and third quarters of each fiscal year on Form N-Q. The Funds’ Form N-Q will be available (i) on the SEC’s website at www.sec.gov; (ii) at the SEC’s Public Reference Room; and (iii) by calling 800-SEC-0330.
Other Tax Information
Corporate Dividends Received Deduction
For the fiscal year ended September 30, 2017, 0%, 0%, 0%, 0%, 100% and 0% of the dividends paid from net investment income qualified for the dividends received deduction available to corporate shareholders of the Focus Fund, Growth Fund, 21st Century Fund, International Opportunities Fund, Flexible Capital Fund, and Global Fund, respectively.
Qualified Dividend Income
Pursuant to Section 854 of the Internal Revenue Code, the Focus Fund, Growth Fund, 21st Century Fund, International Opportunities Fund, Flexible Capital Fund, and Global Fund designate income dividends (in thousands) of $0, $0, $0, $0, $4,808 and $0, respectively, as qualified dividend income paid during the fiscal year ended September 30, 2017.
Foreign Taxes Paid
Pursuant to the foreign tax credit election under Section 853 of the Internal Revenue Code, the International Opportunities Fund designated (in thousands) $503 of income derived from foreign sources and $33 of foreign taxes paid, for the year ended September 30, 2017.
Of the ordinary income (including short-term capital gain) distributions made during the year ended September 30, 2017, the proportionate share of income derived from foreign sources and foreign taxes paid attributable to one share of stock are:
| | | Foreign Source Income | | | Foreign Taxes Paid | |
| International Opportunities Fund | | $ | 0.1523 | | | $ | 0.0100 | |
Long Term Capital Gains Designation
For the fiscal year ended September 30, 2017, the Focus Fund, Growth Fund and Flexible Capital Fund designated (in thousands) $514, $2,136 and $24,697, respectively, as a 20% rate gain distribution for the purpose of the dividends paid deduction. These amounts include earnings and profits distributed to shareholders on the redemption of shares. For income tax purposes, the Funds may utilize earnings and profits distributed to shareholders on the redemption of shares as part of the dividends paid deduction.
Cost Basis Information
Federal law requires mutual fund companies to maintain a shareholder’s cost basis by tax lot and report gain/loss information and holding periods for sales of mutual fund shares that are “covered” securities to the IRS and to shareholders on Form 1099. Mutual fund shares, such as shares of the Funds, acquired on or after January 1, 2012 are covered securities. The Funds are not responsible for maintaining and reporting share information for their shares that are not deemed “covered.”
The tax regulations require that the Funds elect a default tax identification methodology in order to perform the required reporting. The Funds have chosen the first-in-first-out (“FIFO”) method as the default tax lot identification method for its shareholders. This is the method the Funds will use to determine which specific shares are deemed to be sold when a shareholder’s entire position is not sold in a single transaction and is the method in which “covered” share sales will be reported on a shareholder’s Form 1099.
However, at the time of purchase or upon the sale of “covered” shares, shareholders may generally choose a different tax lot identification method. Shareholders should consult a tax advisor with regard to their personal circumstances as the Funds and their service providers do not provide tax advice.
58
| TRUSTEE AND OFFICER INFORMATION |
TRUSTEE AND OFFICER INFORMATION INDEPENDENT TRUSTEES
| Name, Address and Age | Position(s) Held
with the Trust | Term of Office(1)
and Length of
Time Served | Principal Occupation(s)
During Past 5 Years | Number of Portfolios
in Fund Complex
Overseen by Trustee | Other Directorships
Held by Trustee |
Jay S. Goodgold
1200 17th Street
Suite 1600
Denver, CO 80202
DOB: 1954 | Trustee; Lead Independent Trustee | Trustee (since February 2006);
Lead Independent Trustee (since November 2010) | Private investor (July 2003 - present);
Managing Director, Goldman, Sachs & Co.
(August 1978 - June 2003). | 6 | None |
Elizabeth Hoffman
1200 17th Street
Suite 1600
Denver, CO 80202
DOB: 1946 | Trustee | Since February 2006 | Professor of Economics (January 2007 - present) and Executive Vice President and Provost (January 2007 - July 2012), Iowa State University; President Emerita, University of Colorado (August 2005 - present). | 6 | None |
Walter A. Koelbel, Jr.
1200 17th Street
Suite 1600
Denver, CO 80202
DOB: 1952 | Trustee | Since December 1997 | President, and other positions, Koelbel
and Company (full service real estate,
development, investment, and management
company) (more than five years). | 6 | None |
Michael D. Rierson
1200 17th Street
Suite 1600
Denver, CO 80202
DOB: 1952 | Trustee | Since November 1998 | President, The Rierson Group (marketing and consulting firm serving non-profit organizations) (June 2015 - present); Senior Vice President for Development, Colonial Williamsburg Foundation (January 2011 - June 2015). | 6 | None |
Bruce E. Stangle
1200 17th Street
Suite 1600
Denver, CO 80202
DOB: 1948 | Trustee | Since May 2010 | Chairman, Analysis Group, Inc. (economic
consulting) (more than five years). | 6 | Director, Wellington Trust Company, NA (since 2001). |
Joseph T. Willett
1200 17th Street
Suite 1600
Denver, CO 80202
DOB: 1951 | Trustee | Since November 2002 | Private investor (2002 - present); Chief
Operating Officer, Merrill Lynch Europe
(1998 - 2002). | 6 | None |
(1) | Each Trustee serves an indefinite term until the election of a successor or until reaching the mandatory retirement age for non-interested Trustees as established by the Trustees and set forth in the Trust’s Statement of Independent Trustee Retirement Policy, or until his or her resignation, death or removal. Each Officer serves an indefinite term, renewed annually, until the election of a successor (or until their resignation or removal). |
| The Statement of Additional Information includes additional information about the Trustees and is available upon request, without charge, by calling 888-860-8686 or visiting marsicofunds.com. |
59
| TRUSTEE AND OFFICER INFORMATION |
TRUSTEE AND OFFICER INFORMATION INTERESTED TRUSTEES* AND OFFICERS
| Name, Address and Age | Position(s) Held
with the Trust | Term of Office(1)
and Length of
Time Served | Principal Occupation(s)
During Past 5 Years | Number of Portfolios
in Fund Complex
Overseen by Trustee | Other Directorships
Held by Trustee |
Thomas F. Marsico(2)
1200 17th Street
Suite 1600
Denver, CO 80202
DOB: 1955 | Trustee, President, Chief Executive Officer and Chief Investment Officer | Since December 1997 | Chief Executive Officer,
Marsico Capital Management, LLC
(more than five years). | 6 | None |
Christopher J. Marsico(2) 1200 17th Street
Suite 1600
Denver, CO 80202
DOB: 1961 | Trustee, Executive
Vice President and
Chief Operating Officer | Trustee (August 2007 - March 2010 and since May 2010); Vice President and Treasurer (September 2002 - May 2010); Executive Vice President and Chief Operating Officer
(since May 2010) | President,
Marsico Capital Management, LLC
(more than five years). | 6 | None |
Neil L. Gloude, CPA
1200 17th Street
Suite 1600
Denver, CO 80202
DOB: 1961 | Vice President, Secretary and Treasurer | Vice President and Secretary
(since May 2008);
Treasurer (since May 2010) | Executive Vice President, Chief
Financial Officer and Treasurer, Marsico Capital Management, LLC
(more than five years). | N/A | N/A |
Steven R. Carlson
1200 17th Street
Suite 1600
Denver, CO 80202
DOB: 1964 | Chief Compliance Officer | Since July 2016 | Executive Vice President and Chief Compliance Officer,
Marsico Capital Management, LLC
(more than five years). | N/A | N/A |
Thomas M. J. Kerwin
1200 17th Street
Suite 1600
Denver, CO 80202
DOB: 1955 | Chief Legal Officer | Since August 2003 | Executive Vice President and General Counsel, Marsico Capital Management, LLC (more than five years). | N/A | N/A |
| * | Trustees who are “interested persons” of the Funds, as defined in the 1940 Act. |
(1) | Each Trustee serves an indefinite term until the election of a successor or until reaching the mandatory retirement age for non-interested Trustees as established by the Trustees and set forth in the Trust’s Statement of Independent Trustee Retirement Policy, or until his or her resignation, death or removal. Each Officer serves an indefinite term, renewed annually, until the election of a successor (or until their resignation or removal). |
(2) | Mr. Thomas Marsico and Mr. Christopher Marsico are considered Interested Trustees of the Trust because of their affiliation with Marsico Capital Management, LLC, the Adviser to the Funds. Mr. Thomas Marsico and Mr. Christopher Marsico are brothers. |
| The Statement of Additional Information includes additional information about the Trustees and is available upon request, without charge, by calling 888-860-8686 or visiting marsicofunds.com. |
60
(a) The Registrant, as of the end of the period covered by this report, has adopted a code of ethics that applies to the Registrant’s principal executive officer, principal financial officer, principal accounting officer or controller, or persons performing similar functions, regardless of whether these individuals are employed by the Registrant or a third party. A copy of this code of ethics is attached hereto as Exhibit (a).
(b) Not used.
(c) There were no amendments, during the period covered by this report, to a provision of the code of ethics that applies to the Registrant’s principal executive officer, principal financial officer, principal accounting officer or controller, or persons performing similar functions, regardless of whether these individuals are employed by the Registrant or a third party, and that relates to any element of the code of ethics description.
(d) The Registrant has not granted any waivers, including an implicit waiver, from a provision of the code of ethics that applies to the Registrant’s principal executive officer, principal financial officer, principal accounting officer or controller, or persons performing similar functions, regardless of whether these individuals are employed by the Registrant or a third party, that relates to one or more of the items set forth in paragraph (b) of this item’s instructions.
(e) Not applicable.
(f) See attached Exhibit (a).
| Item 3. | Audit Committee Financial Expert |
(a)(1) The Registrant’s Board of Trustees has determined that the Registrant has at least one audit committee financial expert serving on its audit committee.
(a)(2) Mr. Joseph T. Willett is the audit committee financial expert. Mr. Willett is “independent” under the applicable rules.
| Item 4. | Principal Accountant Fees and Services |
In each of the fiscal years ended September 30, 2017 and September 30, 2016, the aggregate Audit Fees billed (or to be billed) by PricewaterhouseCoopers LLP (PwC) for professional services rendered for the audits of the financial statements, or services that are normally provided in connection with statutory and regulatory filings or engagements as well as reimbursable expenses are listed below.
(a) Audit Fees.
(b) Audit-Related Fees.
In each of the fiscal years ended September 30, 2017 and September 30, 2016, the aggregate Audit-Related Fees billed (or to be billed) by PwC for services rendered for assurance and related services to each fund that are reasonably related to the performance of the audit or review of each fund's financial statements, but not reported as Audit Fees, are shown in the table below.
Audit-related fees noted in 2017 and 2016 are for non-recurring work performed by PwC related to the Funds’ distributions to shareholders.
(c) Tax Fees.
In each of the fiscal years ended September 30, 2017 and September 30, 2016 the aggregate Tax Fees billed (or to be billed) by PwC for professional services rendered for tax compliance, tax advice, and tax planning are shown in the table below.
All of these fees were approved by the Trust’s Audit Committee as required pursuant to paragraph (c)(7)(ii) of Rule 2-01 of Regulation S-X.
Fees included in the Tax Fees category comprise all services performed by professional staff in the independent registered public accounting firm's tax division except those services related to the audit. Typically, this category would include fees for tax compliance, tax planning, and tax advice. Tax compliance, tax advice, and tax planning services include preparation of original and amended tax returns, claims for refund and tax payment-planning services, assistance with tax audits and appeals, tax advice related to mergers and acquisitions and requests for rulings or technical advice from taxing authorities.
(d) All Other Fees.
In each of the fiscal years ended September 30, 2017 and September 30, 2016 the aggregate Other Fees billed (or to be billed) by PwC for all other non-audit services rendered are shown in the table below.
(e) (1) Audit Committee Pre-Approval Policies and Procedures:
Pursuant to the Trust’s Audit Committee Charter and Policies and Procedures (collectively, the “Procedures”), the Audit Committee has adopted pre-approval policies and procedures to govern the pre-approval of (i) all audit services and permissible non-audit services to be provided to the Trust by its independent accountant, and (ii) all permissible non-audit services to be provided by such independent accountant to the Trust’s investment adviser and to any entity controlling, controlled by or under common control with the investment adviser that provides on-going services to the Trust (collectively, any “Service Affiliates”) if the engagement directly relates to the Trust’s operations and financial reporting.
In accordance with the Procedures, the Committee is responsible for the engagement of the independent accountant to certify the Trust’s financial statements for each fiscal year. With respect to the pre-approval of non-audit services provided to the Trust and its Service Affiliates, the Procedures provide that the Committee may pre-approve such services on a project-by-project basis as they arise. The Procedures also permit the Committee to delegate authority to the Audit Committee Chairman (the “Designated Member”) to pre-approve any proposed non-audit services that have not been previously approved by the Committee, subject to certain conditions. Any action by the Designated Member in approving a requested non-audit service shall be presented to the Audit Committee not later than at its next scheduled meeting. If the Designated Member does not approve the independent auditor’s provision of a requested non-audit service, the matter may be presented to the full Committee for its consideration and action.
(e)(2) Services approved pursuant to paragraph (c)(7)(i)(C) of Rule 2-01 of Regulation S-X:
100% of these fees were approved by the Trust’s Audit Committee as required pursuant to paragraph (c)(7)(ii) of Rule 2-01 of Regulation S-X.
(f) According to PwC for the fiscal year ended September 30, 2017, the percentage of hours spent on the audit of the Marsico Funds’ financial statements for the most recent fiscal year that were attributed to work performed by persons who are not full-time, permanent employees of PwC is as follows:
| PwC | 2017 |
| Work performed by persons who are not full-time | 0% |
(g) In each of the fiscal years ended September 30, 2017 and September 30, 2016, the aggregate fees billed (or to be billed) by PwC relating to non-audit services that were rendered to the Trust, to its investment adviser, and to any entity controlling, controlled by, or under common control with the investment adviser and that provides ongoing services to the Trust are shown in the table below.
(h) Not applicable.
| Item 5. | Audit Committee of Listed Registrants |
Not applicable.
| Item 6. | Schedule of Investments |
The schedule of investments in securities of unaffiliated issuers is included as part of the report to shareholders filed under Item 1.
| Item 7. | Disclosure of Proxy Voting Policies and Procedures for Closed-End Management Investment Companies |
Not applicable.
| Item 8. | Portfolio Managers of Closed-End Management Investment Companies |
Not applicable.
| Item 9. | Purchases of Equity Securities by Closed-End Management Investment Company and Affiliated Purchasers |
Not applicable.
| Item 10. | Submission of Matters to a Vote of Security Holders |
Not applicable.
Item 11. | Controls and Procedures. |
(a) The registrant's principal executive officer and principal financial officer have concluded that the registrant's disclosure controls and procedures (as defined in Rule 30a-3(c) under the Investment Company Act of 1940, as amended) are effective based on their evaluation of these disclosure controls and procedures within 90 days of the filing date of this report on Form N-CSR.
(b) There were no changes in the registrant's internal control over financial reporting (as defined in Rule 30a-3(d) under the Investment Company Act of 1940, as amended) that occurred during the last fiscal quarter of the period covered by this report that have materially affected, or are reasonably likely to materially affect, the registrant's internal control over financial reporting.
| Item 12. | Disclosure of Securities Lending Activities for Closed-End Management Investment Companies. |
Not applicable.
(a)(1) Code of Ethics - Filed as an attachment to this filing.
(a)(2) Certification for each principal executive and principal financial officer of the registrant as required by Rule 30a-2(a) under the Act (17 CFR 270.30a-2(a)). Filed as an attachment to this filing.
(a)(3) Any written solicitation to purchase securities under Rule 23c-1 under the Investment Company Act of 1940, as amended, that was sent or given during the period covered by the report by or on behalf of the registrant to 10 or more persons.
Not applicable.
(b) Certifications required by Rule 30a-2(b) under the Act (17 CFR 270.30a-2(b)), Rule 13a-14(b) or Rule 15d-14(b) under the Exchange Act (17 CFR 240.13a-14(b) or 240.15d-14(b)), and Section 1350 of Chapter 63 of Title 18 of the United States Code (18 U.S.C. 1350). Filed as an attachment to this filing.
SIGNATURES
Pursuant to the requirements of the Securities Exchange Act of 1934 and the Investment Company Act of 1940, the registrant has duly caused this report to be signed on its behalf by the undersigned, thereunto duly authorized.
The Marsico Investment Fund
| By: | /s/ Christopher J. Marsico | |
| | Christopher J. Marsico, | |
| | Executive Vice President and Chief Operating Officer | |
| | | |
| Date: | December 5, 2017 | |
Pursuant to the requirements of the Securities Exchange Act of 1934 and the Investment Company Act of 1940, this report has been signed below by the following persons on behalf of the registrant and in the capacities and on the dates indicated.
| By: | /s/ Christopher J. Marsico | |
| | Christopher J. Marsico, | |
| | Executive Vice President and Chief Operating Officer | |
| | | |
| Date: | December 5, 2017 | |
| By: | /s/ Neil L. Gloude | |
| | Neil L. Gloude, | |
| | Vice President, Secretary and Treasurer | |
| | | |
| Date: | December 5, 2017 | |