UNITED STATES
SECURITIES AND EXCHANGE COMMISSION
Washington, D.C. 20549
FORM N-CSR
CERTIFIED SHAREHOLDER REPORT OF REGISTERED MANAGEMENT INVESTMENT
COMPANIES
Investment Company Act File Number: 811-08397
THE MARSICO INVESTMENT FUND
(Exact Name of Registrant as Specified in Charter)
1200 17th Street, Suite 1700
Denver, CO 80202
(Address of Principal Executive Offices) (Zip Code)
The Corporation Trust Company
The Marsico Investment Fund
Corporation Trust Center 1209 Orange Street
Wilmington, Delaware 19802
(Name and address of Agent for Service of Process)
Copies to:
Anthony H. Zacharski
Dechert LLP
90 State House Square
Hartford, CT 06103
Registrant's Telephone Number, including Area Code: 1-888-860-8686
Date of fiscal year end: September 30
Date of Reporting Period: March 31, 2020
| Item 1. | Reports to Stockholders |
APRIL 2020 |
DEAR SHAREHOLDER:
Enclosed is your semi-annual report for each portfolio of The Marsico Investment Fund (the “Marsico Funds”), encompassing the six-month fiscal period from October 1, 2019 to March 31, 2020.
The purpose of this report is to provide a review of the Marsico Funds’ six-month investment results by discussing what we believe were the main areas that impacted performance – including the macroeconomic environment, sector and industry positioning, and individual stock selection – as compared to the Funds’ performance benchmark indices.
For updated information regarding the market environment and each Fund’s overall investment positioning and performance, please refer to the Funds’ most recent monthly fact sheets and quarterly investment updates, which are available in the Investor Resources section of the Funds’ website at marsicofunds.com.(1)
The Marsico Funds have issued a supplement to the Marsico Funds’ Prospectus discussing the potential risks that may impact the Marsico Funds due to the effects of the COVID-19 pandemic and similar global events on global economies and markets. Please visit the Investor Resources/Literature Library/Marsico Funds Prospectus section of the Marsico Funds website at marsicofunds.com to read the Prospectus supplement.
Note: Effective November 30, 2019, Peter C. Marsico became co-manager of the Marsico Growth Fund with Thomas F. Marsico and Brandon A. Geisler.
(1) | The references to the Marsico Funds website (marsicofunds.com) included throughout this semi-annual report do not incorporate the website’s contents into this report. |
TABLE OF CONTENTS |
KEY FUND STATISTICS | 2 | |
MARKET ENVIRONMENT | 5 | |
MARSICO FOCUS FUND | ||
Investment Review | 7 | |
Fund Overview | 10 | |
Schedule of Investments | 11 | |
MARSICO GROWTH FUND | ||
Investment Review | 12 | |
Fund Overview | 14 | |
Schedule of Investments | 15 | |
MARSICO 21st CENTURY FUND | ||
Investment Review | 16 | |
Fund Overview | 18 | |
Schedule of Investments | 19 | |
MARSICO INTERNATIONAL OPPORTUNITIES FUND | ||
Investment Review | 21 | |
Fund Overview | 23 | |
Schedule of Investments | 24 | |
MARSICO GLOBAL FUND | ||
Investment Review | 26 | |
Fund Overview | 28 | |
Schedule of Investments | 29 | |
FINANCIAL STATEMENTS | 30 | |
NOTES TO FINANCIAL STATEMENTS | 40 | |
EXPENSE EXAMPLE | 47 | |
CONSIDERATION OF INVESTMENT ADVISORY AGREEMENTS | 48 | |
OTHER INFORMATION | 51 | |
1
KEY FUND STATISTICS (UNAUDITED) |
Marsico Focus Fund | Marsico Growth Fund | Marsico | ||||||
MFOCX | MGRIX | MXXIX | ||||||
For additional disclosures, please see page 10. | For additional disclosures, please see page 14. | For additional disclosures, please see page 18. | ||||||
PERFORMANCE COMPARISON(1) | PERFORMANCE COMPARISON(1) | PERFORMANCE COMPARISON(1) | ||||||
Average Annualized Returns | Average Annualized Returns | Average Annualized Returns | ||||||
|
|
| ||||||
TOTAL ANNUAL OPERATING EXPENSES* 1.04% | TOTAL ANNUAL OPERATING EXPENSES* 1.37% | TOTAL ANNUAL OPERATING EXPENSES* 1.40% | ||||||
SECTOR ALLOCATION(3) | SECTOR ALLOCATION(3) | SECTOR ALLOCATION(3) | ||||||
|
|
| ||||||
TOP FIVE HOLDINGS | TOP FIVE HOLDINGS | TOP FIVE HOLDINGS | |||||||||
Amazon.com, Inc. | 8.28% | Microsoft Corporation | 8.84% | Fidelity National Information Services, Inc. | 3.80% | ||||||
Microsoft Corporation | 7.73% | Amazon.com, Inc. | 7.35% | CoStar Group, Inc. | 3.65% | ||||||
Visa, Inc. - Cl. A | 5.90% | Apple, Inc. | 7.26% | Teleflex, Inc. | 3.11% | ||||||
Apple, Inc. | 5.78% | Alphabet, Inc. - Cl. A | 4.65% | Global Payments, Inc. | 2.99% | ||||||
Alphabet, Inc. - Cl. A | 5.18% | Adobe, Inc. | 4.39% | Atlassian Corporation PLC - Cl. A | 2.95% | ||||||
For additional disclosures about the Marsico Funds, please see page 4. The performance data quoted here represent past performance, and past performance is not a guarantee of future results. Investment return and principal value of an investment will fluctuate so that an investor’s shares, when redeemed, may be worth more or less than their original cost.
2
KEY FUND STATISTICS (UNAUDITED) |
Marsico International | Marsico Global Fund | ||||
MIOFX | MGLBX | ||||
For additional disclosures, please see page 23. | For additional disclosures, please see page 28. | ||||
PERFORMANCE COMPARISON(1) | PERFORMANCE COMPARISON(1) | ||||
Average Annualized Returns | Average Annualized Returns | ||||
|
| ||||
TOTAL ANNUAL OPERATING EXPENSES* 1.74% NET EXPENSES*† 1.51% | TOTAL ANNUAL OPERATING EXPENSES* 1.41% NET EXPENSES*† 1.45% | ||||
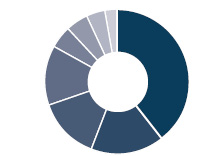
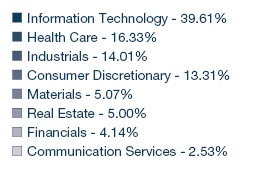
SECTOR ALLOCATION(3) | SECTOR ALLOCATION(3) | ||||
|
| ||||

TOP FIVE HOLDINGS | TOP FIVE HOLDINGS | ||||||
Tencent Holdings Ltd. | 5.00% | Microsoft Corporation | 6.13% | ||||
Alibaba Group Holding Ltd. Spon. ADR | 4.75% | Amazon.com, Inc. | 5.80% | ||||
Nestlé S.A. | 3.39% | Alibaba Group Holding Ltd. Spon. ADR | 5.74% | ||||
Koninklijke Philips N.V. | 3.18% | Visa, Inc. - Cl. A | 4.46% | ||||
Deutsche Boerse A.G. | 2.85% | Facebook, Inc. - Cl. A | 4.07% | ||||
Current performance may be lower or higher than the performance information quoted. To obtain performance information current to the most recent month-end, please call 888-860-8686 or visit marsicofunds.com.
3
KEY FUND STATISTICS (UNAUDITED) |
ADDITIONAL DISCLOSURES ABOUT THE MARSICO FUNDS
* | The Total Annual Operating Expenses and Net Expenses are reflective of the information disclosed in the Funds’ Prospectus dated January 31, 2020, as supplemented. The information may differ from the expense ratios disclosed in this report. |
† | Marsico Capital Management, LLC (the “Adviser”) has entered into a written expense limitation and fee waiver agreement under which it has agreed to limit the total expenses of each Fund (excluding taxes, interest, acquired fund fees and expenses, litigation, extraordinary expenses, and brokerage and other transaction expenses relating to the purchase or sale of portfolio investments) to an annual rate of 1.50% of the average net assets of the International Opportunities Fund and 1.45% of the average net assets of the Global Fund until January 31, 2021. This expense limitation and fee waiver agreement may be terminated by the Adviser at any time after January 31, 2021, upon 15 days prior notice to the Fund and its administrator. The Adviser may recoup from a Fund fees previously waived or expenses previously reimbursed by the Adviser with respect to that Fund pursuant to this agreement (or a previous expense limitation agreement) if: (1) such recoupment by the Adviser does not cause the Fund, at the time of recoupment, to exceed the lesser of (a) the expense limitation in effect at the time the relevant amount was waived and/or reimbursed, or (b) the expense limitation in effect at the time of the proposed recoupment, and (2) the recoupment is made within three years after the fiscal year end date as of which the amount to be waived or reimbursed was determined and the waiver or reimbursement occurred. |
(1) | The performance data quoted here represent past performance, and past performance is not a guarantee of future results. Investment return and principal value of an investment will fluctuate so that an investor’s shares, when redeemed, may be worth more or less than their original cost. Current performance may be lower or higher than the performance information quoted. To obtain performance information current to the most recent month-end, please call 888-860-8686 or visit marsicofunds.com. |
The performance included in the chart does not reflect the deduction of taxes on Fund distributions or the redemption of Fund shares. |
All indices are unmanaged and investors cannot invest directly in an index. |
(2) | Periodically, certain fees and expenses have been waived or reimbursed by the Adviser for the21st Century Fund, the International Opportunities Fund, and the Global Fund. In the absence of such a waiver or reimbursement, the performance returns reflected would have been reduced. In accordance with the expense limitation and fee waiver agreement, the Adviser may recoup fees and expenses previously waived or reimbursed under certain parameters. Periodically, the Adviser has recouped such fees or expenses from the21st Century Fund, the International Opportunities Fund, and the Global Fund, resulting in a lower performance return. |
(3) | Sector weightings represent the percentage of the respective Fund’s investments (excluding cash equivalents) in certain general sectors. These sectors may include more than one industry. The Fund’s portfolio composition is subject to change at any time. |
4
MARKET ENVIRONMENT |
MARKET ENVIRONMENT: OCTOBER 2019 – MARCH 2020 (UNAUDITED)
Although economic momentum and stock prices rose for much of the period, the appearance of a novel strain of coronavirus (COVID-19) in early 2020 led to a pandemic that exploded around the globe in March, causing equities to sell off dramatically. In addition, oil prices plummeted and the yield on the US 10-year Treasury note dropped to historically low levels, all in the span of a few weeks.
Prior to the pandemic, the US equity market finished 2019 with strong fourth-quarter performance, leading to its best annual gain since 2013. Breaking the fourth quarter of 2019 down further, stocks rose in October on the back of a “Phase One” US/China trade deal announcement, and a 25 basis point cut to the Federal Funds rate. During his speech that month, Federal Reserve Chairman Powell indicated that a pause in future rate cuts was likely. November brought new highs for stocks following more progress on trade negotiations and job growth as reflected in a robust 266,000 increase in non-farm payrolls, a blowout number compared to economists’ expectations. In December, the Federal Reserve paused on rate cuts as expected, while noting that any rate increase would face a high bar, and the White House announced an official date for signing the “Phase One” trade deal.
As 2020 arrived, the US/China trade deal was signed, President Trump was ultimately acquitted of the charges for which he was impeached, and several Democratic candidates with more left-wing agendas lost momentum. As the first quarter of 2020 progressed, however, the COVID-19 outbreak spread from China to many other countries across the globe. Equities experienced significant losses, and volatility surged across most asset classes as governments of many countries imposed lockdowns, clamping down on economic activity in the name of containing the spread of the virus. Late in the quarter, stocks began to rebound as the spate of algorithm-driven selling eased, while buy-and-hold investors like pension funds rebalanced their allocations. Hope began to emerge about potential peaks in new COVID-19 cases and extraordinary US fiscal and monetary packages aimed at countering the financial impact of the pandemic, allowing equities to finish the quarter well off their lows. In late March stocks posted their best three-day streak since 1931, rallying more than +20% off levels posted only three days prior.
As the COVID-19 crisis grew across the US, and many cities and states issued lockdown or “shelter in place” orders, federal policymakers took action to put in place measures (both fiscal and monetary) to help mitigate the financial impact of the crisis on markets, industries, corporations, small business and families. In the area of monetary policy, the Federal Reserve took unprecedented action to simultaneously cut interest rates, lower reserve requirements, back-stop money market funds and purchase hundreds of billions of dollars in US Treasury notes and other securities.
On the fiscal policy front, the US Senate and House of Representatives passed the CARES Act, the largest single economic relief bill in the country’s history. The roughly $2 trillion plan includes provisions for one-time payments to individuals, strengthened unemployment insurance, loans and grants to small businesses to deter layoffs, student loan assistance, and other funds earmarked for corporations and public health facilities. The CARES Act’s goal is to mitigate immediate damage to the economy, leaving open the door for more federal aid in the country’s economic “recovery” phase. Policymakers have begun to discuss another potential phase of stimulus, which could come in the form of a package focused on jobs and rebuilding American infrastructure, thereby assisting state and local governments in the process.
While these events affected all business sectors, energy markets were perhaps hit the hardest by aggressive supply increases as well as demand declines relating to the pandemic, as the price of West Texas Intermediate crude oil dropped by an astounding $41 dollars per barrel during the quarter end March 31, 2020. Global isolation (i.e. social distancing) measures are leading to an unparalleled collapse in oil demand now expected to fall by millions of barrels per day in 2020. In addition to the impact of the COVID-19 pandemic, the oil market also endured pricing pressure due to production increases of spare oil capacity and a price war between Russia and Saudi Arabia that only began to be resolved after period end.
The US 10-year Treasury bond yield began 2020 at 1.88% but as stocks dropped and volatility rose, investors put their appetite for risk aside and instead flocked to perceived “safer” assets, despite the volatility of even these assets from a price movement perspective. Capital flight increased in March, pushing the US 10-year Treasury bond yield down to 0.70% by period-end, a remarkable decline.
On the employment front, US job growth averaged approximately 176,000 jobs per month for calendar year 2019. After a strong start to 2020, payrolls dropped by 701,000 in March in response to lockdown orders imposed by states and cities, the first decline since September 2010, and the unemployment rate rose from 3.5% to 4.4% as American workers displaced by the crisis filed unemployment claims in record numbers. The Labor Department reported 3.3 million and 6.6 million unemployment claims in each of the last two weeks of March, respectively. The prior peak for unemployment claims filed in one week was 695,000 in 1982.
5
MARKET ENVIRONMENT |
Outside the US, many countries remained in various states of lockdown at period-end. China, the first epicenter of COVID-19 cases, now appears to be past peak infection rates, and China’s economy is starting to come back. Meanwhile, other economies have suffered amid lockdowns, although COVID-19 cases appear to have peaked at least temporarily in some countries.
The performance of global markets during the six-month fiscal period ended March 31, 2020 is depicted below. After all of the volatility, US indices posted double-digit losses while global indices followed suit. Large capitalization US equities outperformed US small- and medium-capitalization stocks during the period. Emerging market equities, led by China, outperformed compared to developed international markets, yet both posted strongly negative returns.
Index Name(1) | Universe of | Six-Month |
US | ||
S&P 500 | US large-capitalization equities | -12.31% |
Russell 3000 | US publicly-traded equities of all sizes | -13.70% |
Russell 2000 | US small-capitalization equities | -23.72% |
Russell Mid-Cap Growth | US medium-capitalization equities | -13.50% |
Index Name(1) | Universe of | Six-Month |
INTERNATIONAL | ||
MSCI EAFE (US$) | Equities in developed international equity markets, including Japan, Western Europe, and Australasia | -16.52% |
MSCI Emerging Markets (US$) | Equities in developing international equity markets, including China, India, Eastern Europe, and Latin America | -14.55% |
MSCI ACWI (US$) | Equities in the global developed and emerging markets | -14.33% |
Sincerely,
THE MARSICO INVESTMENT TEAM
(1) | All indices are unmanaged and investors cannot invest directly in an index. |
6
FOCUS FUND |
Investment Review BY TOM MARSICO AND BRANDON GEISLER (UNAUDITED)
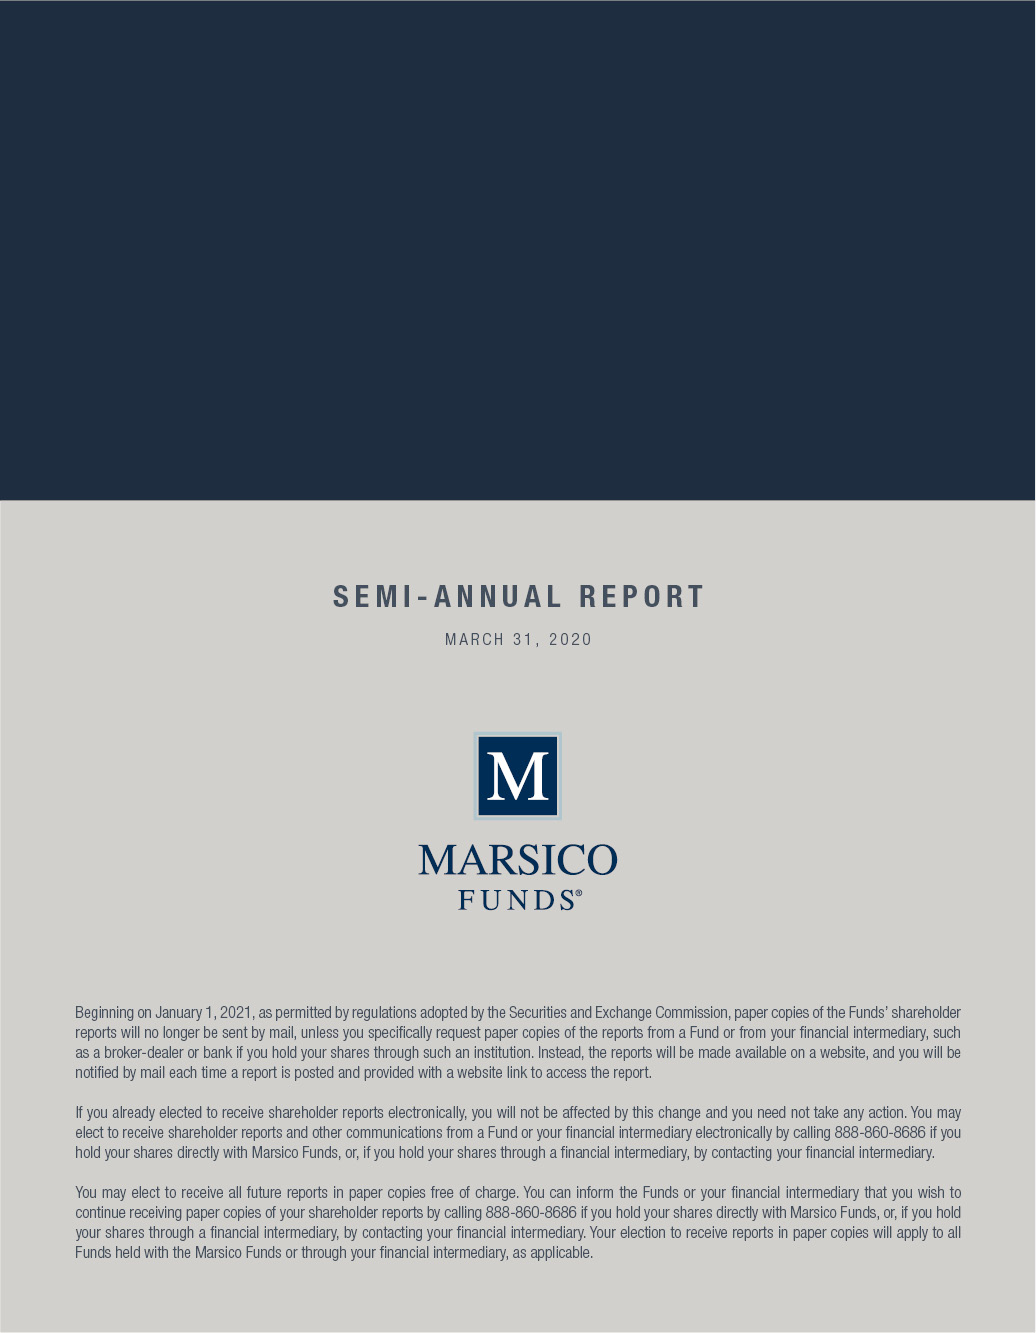
The Marsico Focus Fund posted a total return of -2.44% for the six-month fiscal period ended March 31, 2020. The Fund strongly outperformed its benchmark index, the S&P 500 Index, which had a total return of -12.31% over the same time period. Please see the Fund’s Overview for more detailed information about the Fund’s longer-term performance for various time periods ended March 31, 2020.
The performance data for the Fund quoted here represent past performance, and past performance is not a guarantee of future results. Investment return and principal value of an investment will fluctuate so that an investor’s shares, when redeemed, may be worth more or less than their original cost. Current performance may be lower or higher than the performance information quoted. To obtain performance information current to the most recent month-end, please call 888-860-8686 or visit marsicofunds.com.(1)
This review highlights Fund performance over a six-month fiscal period. Shareholders should keep in mind that the Fund is intended for long-term investors who hold their shares for substantially longer periods of time. You should also keep in mind that our current views and beliefs regarding all investments discussed in this report are subject to change at any time. References to specific securities, industries, and sectors discussed in this report are not recommendations to buy or sell such securities or related investments, and the Fund may not necessarily hold these securities or investments today. Please see the accompanying Schedule of Investments for the percentage of the Fund’s portfolio represented by the securities mentioned in this report as of the end of the reporting period.
The Focus Fund is non-diversified and may hold fewer securities than a diversified fund because it is permitted to invest a greater percentage of its assets in a smaller number of issuers. Holding securities of fewer issuers increases the risk that the value of the Fund could go down because of the poor performance of a single investment or may be more volatile than its benchmark. The Fund is subject to broad risks associated with investing in equity securities markets generally, including the risks that the securities and markets in which it invests may experience volatility and instability, that domestic and global economies and markets may undergo periods of cyclical change and decline, that investors may at times avoid investments in equity securities, and that investments may not perform as anticipated. Please see the Prospectus for more information.
The Fund is not managed to track its benchmark index, and may hold a substantially overweight or underweight position in a sector, industry, or security compared to its weight in the benchmark. The Fund may be subject to risks associated with a particular sector or other area in which it is overweight, including the risk that the stocks of companies within one area could simultaneously decline in price because of an event that affects the entire area. For informational purposes, the discussion below may compare the benchmark weight or performance of a sector or industry to the investment approach of the Fund.
The Focus Fund’s strong outperformance during the six-month period ended March 31, 2020, as compared to the S&P 500 Index, was primarily attributable to certain Fund holdings in the Consumer Discretionary and Information Technology sectors, as defined in the Global Industry Classification Standard (“GICS”)(2). From a sector allocation perspective, the Fund’s performance was boosted relative to its benchmark index by maintaining an overweight position in the strong-performing Information Technology sector and by having no investments in the weak-performing Energy sector. Given the volatility during the period, the Fund maintained a 3% average cash position, which also helped returns.
In the Information Technology sector, semiconductor company NVIDIA Corporation (“NVDA”) (+52%) was a top contributor because of improving demand for its gaming and datacenter chips. We believe that NVDA is the technology leader in developing graphics processing units that excel at generating graphics in video games as well as computations in artificial intelligence and other datacenter applications. Both of these segments saw reduced demand through much of 2019 due to excess inventory in gaming channels after the cryptocurrency bust and the overproduction of capacity by cloud service providers during 2018. By early 2020, however, gaming inventory channels were clean, leading to increased sales matching demand. Despite the COVID-19 outbreak, global demand for NVDA’s chips has remained strong from datacenter customers through the end of the period.
Another Information Technology sector holding, Adobe, Inc. (“Adobe”) returned +15% during the period. Adobe is one of the largest global software companies, with an estimated total addressable market of over $100 billion, and has a dominant and defensible market share in some of the most dynamic areas of software such as creative design, dynamic media, and marketing automation. This positioning, combined with a subscription-based recurring revenue model, make Adobe a consistent, durable franchise. During its investor day in November 2019, Adobe laid out positive guidance for 2020 as well as longer-term targets that reflected better than expected renewal rates and a faster pace of new user adoption. The COVID-19 outbreak arose after that event, but we believe Adobe’s prospects may remain relatively positive as the company’s products are useful in working or teaching remotely and other actions common during the outbreak. These dynamics bolster the company’s earnings and cash flow profile, and gave us even more conviction in the stock as one of our core holdings.
7
FOCUS FUND |
Another top contributor over the past six months was e-commerce giant Amazon.com, Inc. (“Amazon”) (+13%), a long-term holding in the Focus Fund. We have retained our strong convictions about the attractive opportunities available to the company, and added to our position during the reporting period. Amazon posted a solid fourth-quarter result, and its stock price also benefited from investors’ beliefs that Amazon’s services (including e-commerce, Prime delivery and Amazon Web Services) would benefit from a “stay-at-home” economy during the COVID-19-induced restrictions on movement.
We added new positions during the period including Starbucks Corp. (“Starbucks”) (+3%), as we view its position in China as a huge competitive advantage compared to other restaurant peers. As the US continues to feel the negative impacts of the COVID-19 pandemic, China is reopening commerce, which should help Starbucks mitigate negative cash flow impacts from the impairment of its US business. With lack of clarity as to when other countries will reopen commerce, we see companies with exposure to China as having better lines of sight to earnings growth.
In the Information Technology sector, Tesla, Inc. (“Tesla”) (-20%) was added to the Fund’s portfolio as the broader sell-off in the market allowed us the opportunity to gain exposure to one of the most innovative companies in the world at what we view as an attractive price point. After scaling an entire production facility in a matter of weeks in China, we feel Tesla is well positioned to ride out the impact from COVID-19. Tesla appears to be far ahead of its competitors, and the impact from COVID-19 should only extend its lead, given the inability of other traditional original equipment manufacturers to produce competitive electric-powered vehicles while suffering hampered cash flow and production capabilities.
From a sector allocation perspective, the Fund’s performance was held back relative to its benchmark index by having an underweight exposure to the strong-performing Health Care sector. In addition, two stocks in the Industrials sector underperformed and were sold from the Fund, as discussed further below.
The Boeing Company (“Boeing”) stock dropped -32% prior to being sold as the spread of COVID-19 resulted in a drastic decrease in commercial airline travel demand. While airlines were generally in good financial health prior to the pandemic, the unprecedented drop in travel demand resulted in corresponding drops in airline revenues. It was our belief that, in the absence of revenue, airlines would delay or possibly cancel the delivery of new aircraft. This delay in aircraft deliveries would hurt Boeing’s revenue while production continued to consume company cash, thereby threatening both Boeing’s financial balance sheet and its liquidity. While there is speculation that airlines will receive some form of a government bailout, it is inconsistent with our investment philosophy to maintain a position in a business that is likely dependent on government assistance. Further, it remains unclear what the long-term demand for aircraft will be as travel remains reduced due to the remaining threat of COVID-19 and other potential pandemics.
Uber Technologies, Inc. (“UBER”) slid -47% and was sold as the spread of COVID-19 led to the global population avoiding activities outside of their homes. Because UBER is highly reliant on consumer demand for transportation to work, the airport, or other commerce activities to drive revenue, the company’s business is understandably under pressure as the world largely stays at home. With continued uncertainty regarding when the world can return to normal activities, we believe that UBER’s stock will likely remain challenged.
During the period, we also sold several positions whose core businesses were negatively impacted by the COVID-19 outbreak. In many of these instances, we feel the companies may be compromised over longer-term periods as their business model is disrupted and/or as consumers change their behaviors. An example is Marriott International, Inc. – Cl. A. (“Marriott”) In addition to the obvious near-term hit to Marriott’s business, we expect lodging demand to be impaired in the future given the COVID-19 outbreak. We believe that the uneven global policy responses to curtail the spread of the virus will likely create uneasiness among tourists and business travelers resulting in lower earnings for Marriott for the foreseeable future.
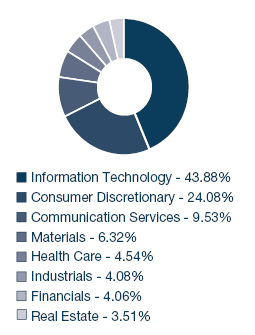
During the reporting period, the Fund reduced exposure to the Industrials, Health Care, and Financials sectors, and increased its allocations to the Consumer Discretionary and Information Technology sectors. There were no significant changes to the Fund’s allocations to the Materials, Real Estate, and Communication Services sectors. As mentioned above, the Fund maintained a 3% cash position on average, including a 5% cash position (as represented by the Fund’s short-term investments holding) at period-end.
8
FOCUS FUND |
Fiscal Period-End Investment Posture
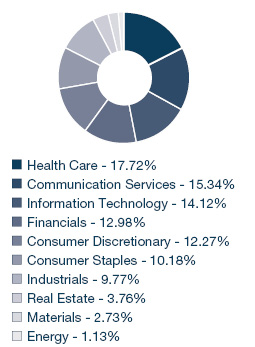
As of March 31, 2020, the Fund’s largest sector allocations included Information Technology, Consumer Discretionary, and Communication Services. As of that date, the Fund had no investments in the Consumer Staples, Energy, or Utilities sectors.
Sincerely,
THOMAS F. MARSICO
BRANDON A. GEISLER
PORTFOLIO MANAGERS
(1) | Total returns are based on net change in net asset value assuming reinvestment of distributions. Please see the Prospectus for more information. |
(2) | Regarding GICS data cited throughout this report, the Global Industry Classification Standard was developed by and is the exclusive property and service mark of MSCI Inc. (“MSCI”) and Standard & Poor’s (“S&P”) and is licensed for use by Marsico Capital Management, LLC (the “Adviser”). Neither MSCI, S&P, nor the Adviser or any third party involved in compiling GICS makes any express or implied warranties or representations with respect to such standard or classification (or the results from use thereof), and all such parties hereby expressly disclaim all warranties of originality, accuracy, completeness, merchantability and fitness for a particular purpose with respect to any such standard or classification. MSCI, S&P, the Adviser, and any of their affiliates or third parties involved in compiling GICS shall not have any liability for any direct, indirect, special, punitive, consequential or any other damages (including lost profits) even if notified of the possibility of such damages. |
9
FOCUS Fund Overview |
March 31, 2020 (Unaudited)
The Focus Fund is a non-diversified portfolio and invests primarily in the common stocks of large companies that are selected for their long-term growth potential. The Fund will normally hold a core position of between 20 and 35 common stocks.
TOTAL ANNUAL OPERATING EXPENSES* 1.04% | NET ASSETS $514,079,990 | NET ASSET VALUE PER SHARE $16.78 |
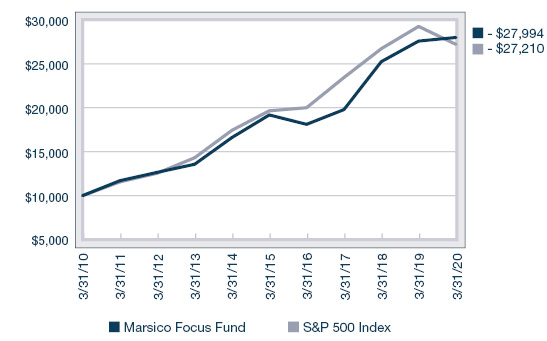
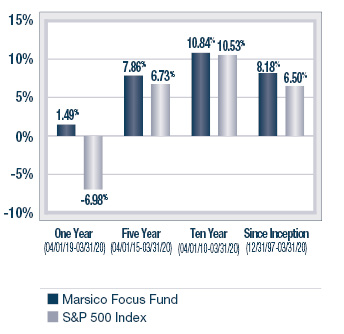
GROWTH OF $10,000(1)(2) | PERFORMANCE COMPARISON(1) | |||
Average Annualized Returns | ||||
|
| |||
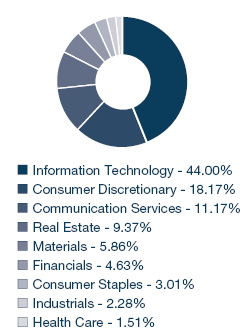
SECTOR ALLOCATION(3) | TOP FIVE HOLDINGS | |||
| ||||
Amazon.com, Inc. | 8.28% | |||
Microsoft Corporation | 7.73% | |||
Visa, Inc. - Cl. A | 5.90% | |||
Apple, Inc. | 5.78% | |||
Alphabet, Inc. - Cl. A | 5.18% | |||
* | The Total Annual Operating Expenses are reflective of the information disclosed in the Funds’ Prospectus dated January 31, 2020, as supplemented, and may differ from the expense ratio disclosed in this report. |
(1) | The performance data quoted here represent past performance, and past performance is not a guarantee of future results. Investment return and principal value of an investment will fluctuate so that an investor’s shares, when redeemed, may be worth more or less than their original cost. Current performance may be lower or higher than the performance information quoted. To obtain performance information current to the most recent month-end, please call 888-860-8686 or visit marsicofunds.com. |
The performance included in the chart and graph does not reflect the deduction of taxes on Fund distributions or the redemption of Fund shares. |
All indices are unmanaged and investors cannot invest directly in an index. |
(2) | This chart assumes an initial investment of $10,000 made on March 31, 2010. Total returns are based on net change in NAV, assuming reinvestment of distributions. |
(3) | Sector weightings represent the percentage of the Fund’s investments (excluding cash equivalents) in certain general sectors. These sectors may include more than one industry. The Fund’s portfolio composition is subject to change at any time. |
10
Schedule of Investments |
MARSICO FOCUS FUND
SCHEDULE OF INVESTMENTS
March 31, 2020 (Unaudited)
Number | Value | Percent | ||||||||||
COMMON STOCKS | ||||||||||||
Aerospace & Defense | ||||||||||||
Lockheed Martin Corporation | 59,296 | $ | 20,098,379 | 3.91 | % | |||||||
Apparel, Accessories & Luxury Goods | ||||||||||||
lululemon athletica, inc.* | 32,771 | 6,211,743 | 1.21 | |||||||||
Application Software | ||||||||||||
Adobe, Inc.* | 69,814 | 22,217,608 | 4.32 | |||||||||
salesforce.com, inc.* | 130,686 | 18,816,170 | 3.66 | |||||||||
| 41,033,778 | 7.98 | ||||||||||
Automobile Manufacturers | ||||||||||||
Tesla, Inc.* | 33,195 | 17,394,180 | 3.38 | |||||||||
Data Processing & Outsourced Services | ||||||||||||
PayPal Holdings, Inc.* | 253,465 | 24,266,739 | 4.72 | |||||||||
Square, Inc. - Cl. A* | 136,447 | 7,147,094 | 1.39 | |||||||||
Visa, Inc. - Cl. A | 188,089 | 30,304,900 | 5.90 | |||||||||
| 61,718,733 | 12.01 | ||||||||||
Financial Exchanges & Data | ||||||||||||
S&P Global, Inc. | 81,626 | 20,002,451 | 3.89 | |||||||||
Footwear | ||||||||||||
NIKE, Inc. - Cl. B | 180,748 | 14,955,089 | 2.91 | |||||||||
Health Care Equipment | ||||||||||||
Danaher Corporation | 120,203 | 16,637,297 | 3.24 | |||||||||
Intuitive Surgical, Inc.* | 11,522 | 5,705,810 | 1.11 | |||||||||
| 22,343,107 | 4.35 | ||||||||||
Interactive Media & Services | ||||||||||||
Alphabet, Inc. - Cl. A* | 22,894 | 26,601,683 | 5.18 | |||||||||
Facebook, Inc. - Cl. A* | 121,838 | 20,322,579 | 3.95 | |||||||||
| 46,924,262 | 9.13 | ||||||||||
Internet & Direct Marketing Retail | ||||||||||||
Amazon.com, Inc.* | 21,841 | 42,583,834 | 8.28 | |||||||||
Metal & Glass Containers | ||||||||||||
Ball Corporation | 160,448 | 10,374,568 | 2.02 | |||||||||
Restaurants | ||||||||||||
Chipotle Mexican Grill, Inc.* | 15,789 | 10,332,322 | 2.01 | |||||||||
McDonald’s Corporation | 92,001 | 15,212,365 | 2.96 | |||||||||
Starbucks Corp. | 180,054 | 11,836,750 | 2.30 | |||||||||
| 37,381,437 | 7.27 | ||||||||||
Semiconductor Equipment | ||||||||||||
Lam Research Corporation | 59,981 | 14,395,440 | 2.80 | |||||||||
Semiconductors | ||||||||||||
NVIDIA Corporation | 82,665 | 21,790,494 | 4.24 | |||||||||
Specialized REITs | ||||||||||||
Crown Castle International Corp. | 119,765 | 17,294,066 | 3.36 | |||||||||
COMMON STOCKS(continued) | ||||||||||||
Specialty Chemicals | ||||||||||||
The Sherwin-Williams Company | 45,085 | �� | 20,717,459 | 4.03 | % | |||||||
Systems Software | ||||||||||||
Microsoft Corporation | 251,948 | 39,734,719 | 7.73 | |||||||||
ServiceNow, Inc.* | 26,626 | 7,630,479 | 1.48 | |||||||||
| 47,365,198 | 9.21 | ||||||||||
Technology Hardware, Storage & Peripherals | ||||||||||||
Apple, Inc. | 116,886 | 29,722,941 | 5.78 | |||||||||
TOTAL COMMON STOCKS | ||||||||||||
(Cost $343,468,400) | 492,307,159 | 95.76 | ||||||||||
| ||||||||||||
SHORT-TERM INVESTMENTS | ||||||||||||
State Street Institutional U.S. Government Money Market Fund - Premier Class, 0.001% | 24,098,044 | 24,098,044 | 4.69 | |||||||||
TOTAL SHORT-TERM INVESTMENTS | ||||||||||||
(Cost $24,098,044) | 24,098,044 | 4.69 | ||||||||||
TOTAL INVESTMENTS | ||||||||||||
(Cost $367,566,444) | 516,405,203 | 100.45 | ||||||||||
Liabilities, Less Cash and Other Assets | (2,325,213 | ) | (0.45 | ) | ||||||||
NET ASSETS | $ | 514,079,990 | 100.00 | % | ||||||||
* | Non-income producing. |
See notes to financial statements. |
11
GROWTH FUND |
Investment Review BY TOM MARSICO, BRANDON GEISLER, AND PETER MARSICO (UNAUDITED)
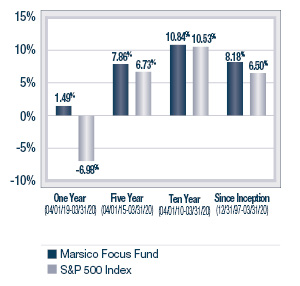
The Marsico Growth Fund posted a total return of -3.18% for the six-month fiscal period ended March 31, 2020. The Fund strongly outperformed the S&P 500 Index, the Fund’s benchmark index, which had a total return of -12.31% over the same time period. Please see the Fund’s Overview for more detailed information about the Fund’s longer-term performance for various time periods ended March 31, 2020.
The performance data for the Fund quoted here represent past performance, and past performance is not a guarantee of future results. Investment return and principal value of an investment will fluctuate so that an investor’s shares, when redeemed, may be worth more or less than their original cost. Current performance may be lower or higher than the performance information quoted. To obtain performance information current to the most recent month-end, please call 888-860-8686 or visit marsicofunds.com.(1)
This review highlights Fund performance over a six-month fiscal period. Shareholders should keep in mind that the Fund is intended for long-term investors who hold their shares for substantially longer periods of time. You should also keep in mind that our current views and beliefs regarding all investments discussed in this report are subject to change at any time. References to specific securities, industries, and sectors discussed in this report are not recommendations to buy or sell such securities or related investments, and the Fund may not necessarily hold these securities or investments today. Please see the accompanying Schedule of Investments for the percentage of the Fund’s portfolio represented by the securities mentioned in this report as of the end of the reporting period.
The Fund is subject to broad risks associated with investing in equity securities markets generally, including the risks that the securities and markets in which it invests may experience volatility and instability, that domestic and global economies and markets may undergo periods of cyclical change and decline, that investors may at times avoid investments in equity securities, and that investments may not perform as anticipated. Please see the Prospectus for more information.
The Fund is not managed to track its benchmark index, and may hold a substantially overweight or underweight position in a sector, industry, or security compared to its weight in the benchmark. The Fund may be subject to risks associated with a particular sector or other area in which it is overweight, including the risk that the stocks of companies within one area could simultaneously decline in price because of an event that affects the entire area. For informational purposes, the discussion below may compare the benchmark weight or performance of a sector or industry to the investment approach of the Fund.
The Growth Fund’s strong outperformance during the six-month period ended March 31, 2020, as compared to the S&P 500 Index, was in part attributable to certain Fund holdings in the Information Technology and Consumer Discretionary sectors as defined in the Global Industry Classification Standard (“GICS”). From a sector allocation perspective, the Fund’s performance was boosted relative to its benchmark index by maintaining an overweight position in the strong-performing Information Technology sector and by having no investments in the weak-performing Energy sector. Given the volatility during the period, the Fund maintained a 4% average cash position, which also helped returns.
In the Information Technology sector, semiconductor company NVIDIA Corporation (“NVDA”) (+42%) was a top contributor because of improving demand for its gaming and datacenter chips. We believe that NVDA is the technology leader in developing graphics processing units that excel at generating graphics in video games as well as computations in artificial intelligence and other datacenter applications. Both of these segments saw reduced demand through much of 2019 due to excess inventory in gaming channels after the cryptocurrency bust and the overproduction of capacity by cloud service providers during 2018. By early 2020, however, gaming inventory channels were clean, leading to increased sales matching demand. Despite the COVID-19 outbreak, global demand for NVDA’s chips has remained strong from datacenter customers through the end of the period.
Another Information Technology sector holding, Adobe, Inc. (“Adobe”) returned +15% during the period. Adobe is one of the largest global software companies, with an estimated total addressable market of over $100 billion, and has a dominant and defensible market share in some of the most dynamic areas of software such as creative design, dynamic media, and marketing automation. This positioning, combined with a subscription-based recurring revenue model, make Adobe a consistent, durable franchise. During its investor day in November 2019, Adobe laid out positive guidance for 2020 as well as longer-term targets that reflected better than expected renewal rates and a faster pace of new user adoption. The COVID-19 outbreak arose after that event, but we believe Adobe’s prospects may remain relatively positive as the company’s products are useful in working or teaching remotely and other actions common during the outbreak. These dynamics bolster the company’s earnings and cash flow profile, and gave us even more conviction in the stock as one of our core holdings.
Another top contributor over the past six months was e-commerce giant Amazon.com, Inc. (“Amazon”), (+12%) a long-term holding in the Growth Fund. We have retained our strong convictions about the attractive opportunities available to the company, and added to our position during the reporting period. Amazon posted a solid fourth-quarter result, and its stock price also benefited from investors’ beliefs that Amazon’s services (including e-commerce, Prime delivery and Amazon Web Services) would benefit from a “stay-at-home” economy during the COVID-19-induced restrictions on movement.
12
GROWTH FUND |
We added various new positions during the period, including Starbucks Corp. (“Starbucks”) (-28%) and Chipotle Mexican Grill, Inc. (“Chipotle”) (+9%). We view Starbucks’s position in China as a huge competitive advantage compared to other restaurant peers. As the US continues to feel the negative impacts of the COVID-19 pandemic, China is reopening commerce, which should help Starbucks mitigate negative cash flow impacts from the impairment of its US business. With lack of clarity as to when other countries will reopen commerce, we see companies with exposure to China as having better lines of sight to earnings growth.
Also in the Consumer Discretionary sector, the stock price of Chipotle had been negatively affected by a COVID-19-related slowdown in customer traffic into company stores, thus hampering Chipotle’s ability to hit near-term revenue estimates. However, given Chipotle’s corporate-owned-store model (in contrast to a franchisee model), we expect the company to rebound quickly when economies fully reopen, given the company’s strong brand perception. The company’s delivery and e-commerce capabilities are further strengths that we think will help Chipotle to weather the downturn and accelerate rapidly as the pandemic subsides.
From a sector allocation perspective, the Fund’s performance was held back relative to the benchmark index by having underweight exposure to the strong-performing Health Care sector. Also, stocks in various sectors underperformed and were sold from the Fund, such as The Boeing Company (“Boeing”) and NIKE, Inc. – Cl. B. (“Nike”).
Boeing dropped -33% prior to being sold, as the spread of COVID-19 resulted in a drastic decrease in commercial airline travel demand. While airlines were generally in good financial health prior to the pandemic, the unprecedented drop in travel demand resulted in corresponding drops in airline revenues. It was our belief that, in the absence of revenue, airlines would delay or possibly cancel the delivery of new aircraft. This delay in aircraft deliveries would hurt Boeing’s revenue while production continued to consume company cash, thereby threatening both Boeing’s financial balance sheet and its liquidity. While there is speculation that airlines will receive some form of a government bailout, it is inconsistent with our investment philosophy to maintain a position in a business that is likely dependent on government assistance. Further, it remains unclear what the long-term demand for aircraft will be as travel remains reduced due to the remaining threat of COVID-19 and other potential pandemics.
Consumer discretionary stock Nike dropped -20% and was sold during the period as its exposure to traditional wholesale retail distribution impaired its revenue growth. As consumer traffic to physical locations has slowed in favor of digital commerce, we see Nike in a difficult spot as its e-commerce business is still nascent and too small to offset losses from physical store sales.
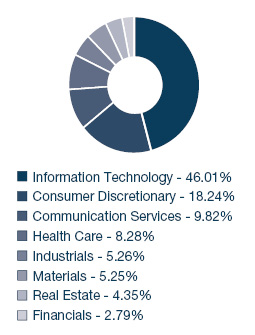
During the reporting period, the Fund reduced its exposure to the Health Care, Industrials, Communication Services, and Financials sectors. The Fund increased its allocation to the Information Technology sector. There were no significant changes to the Fund’s allocation to the Real Estate, Consumer Discretionary, and Materials sectors. As mentioned above, the Fund maintained a 4% cash position on average, including a 7% cash position (as represented by the Fund’s short-term investments holding) at period-end.
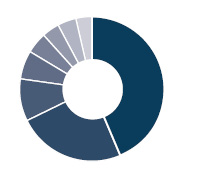
Fiscal Period-End Investment Posture
As of March 31, 2020, the Fund’s largest sector allocations included Information Technology, Consumer Discretionary, Communication Services, and Health Care. As of that date, the Fund had no investments in the Consumer Staples, Energy, or Utilities sectors.
Other Developments
Effective November 30, 2019, Peter C. Marsico became co-manager of the Growth Fund with Thomas F. Marsico and Brandon A. Geisler.
Sincerely,
THOMAS F. MARSICO
BRANDON A. GEISLER
PETER C. MARSICO
PORTFOLIO MANAGERS
(1) | Total returns are based on net change in net asset value assuming reinvestment of distributions. Please see the Prospectus for more information. |
13
GROWTH Fund Overview |
March 31, 2020 (Unaudited)
The Growth Fund is a diversified portfolio and invests primarily in the common stocks of large companies that are selected for their long-term growth potential. The Growth Fund will normally hold a core position of up to 50 common stocks.
TOTAL ANNUAL OPERATING EXPENSES* 1.37% | NET ASSETS $242,426,408 | NET ASSET VALUE PER SHARE $16.44 |
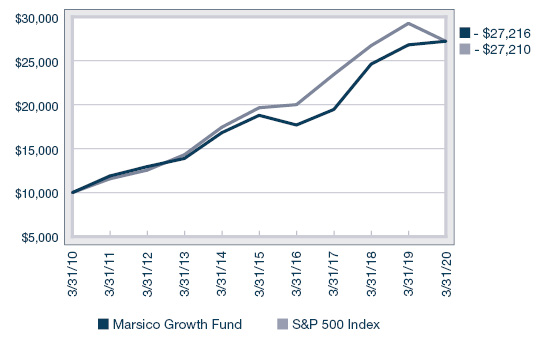
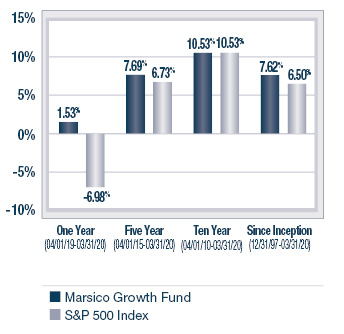
GROWTH OF $10,000(1)(2) | PERFORMANCE COMPARISON(1) | |||
Average Annualized Returns | ||||
|
| |||
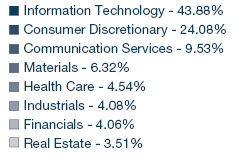
SECTOR ALLOCATION(3) | TOP FIVE HOLDINGS | |||
| ||||
Microsoft Corporation | 8.84% | |||
Amazon.com, Inc. | 7.35% | |||
Apple, Inc. | 7.26% | |||
Alphabet, Inc. - Cl. A | 4.65% | |||
Adobe, Inc. | 4.39% | |||
* | The Total Annual Operating Expenses are reflective of the information disclosed in the Funds’ Prospectus dated January 31, 2020, as supplemented, and may differ from the expense ratio disclosed in this report. |
(1) | The performance data quoted here represent past performance, and past performance is not a guarantee of future results. Investment return and principal value of an investment will fluctuate so that an investor’s shares, when redeemed, may be worth more or less than their original cost. Current performance may be lower or higher than the performance information quoted. To obtain performance information current to the most recent month-end, please call 888-860-8686 or visit marsicofunds.com. |
The performance included in the chart and graph does not reflect the deduction of taxes on Fund distributions or the redemption of Fund shares. |
All indices are unmanaged and investors cannot invest directly in an index. |
(2) | This chart assumes an initial investment of $10,000 made on March 31, 2010. Total returns are based on net change in NAV, assuming reinvestment of distributions. |
(3) | Sector weightings represent the percentage of the Fund’s investments (excluding cash equivalents) in certain general sectors. These sectors may include more than one industry. The Fund’s portfolio composition is subject to change at any time. |
14
Schedule of Investments |
MARSICO GROWTH FUND
SCHEDULE OF INVESTMENTS
March 31, 2020 (Unaudited)
Number | Value | Percent | ||||||||||
COMMON STOCKS | ||||||||||||
Aerospace & Defense | ||||||||||||
Lockheed Martin Corporation | 20,202 | $ | 6,847,468 | 2.83 | % | |||||||
Apparel, Accessories & Luxury Goods | ||||||||||||
lululemon athletica, inc.* | 6,933 | 1,314,150 | 0.54 | |||||||||
Application Software | ||||||||||||
Adobe, Inc.* | 33,487 | 10,656,903 | 4.39 | |||||||||
salesforce.com, inc.* | 66,805 | 9,618,584 | 3.97 | |||||||||
| 20,275,487 | 8.36 | ||||||||||
Automobile Manufacturers | ||||||||||||
Tesla, Inc.* | 7,117 | 3,729,308 | 1.54 | |||||||||
Data Processing & Outsourced Services | ||||||||||||
Mastercard, Inc. - Cl. A | 31,563 | 7,624,358 | 3.14 | |||||||||
PayPal Holdings, Inc.* | 86,359 | 8,268,011 | 3.41 | |||||||||
Square, Inc. - Cl. A* | 83,195 | 4,357,754 | 1.80 | |||||||||
Visa, Inc. - Cl. A | 55,369 | 8,921,053 | 3.68 | |||||||||
| 29,171,176 | 12.03 | ||||||||||
Financial Exchanges & Data | ||||||||||||
S&P Global, Inc. | 25,935 | 6,355,372 | 2.62 | |||||||||
Health Care Equipment | ||||||||||||
Danaher Corporation | 45,129 | 6,246,305 | 2.58 | |||||||||
Interactive Media & Services | ||||||||||||
Alphabet, Inc. - Cl. A* | 9,689 | 11,258,134 | 4.65 | |||||||||
Facebook, Inc. - Cl. A* | 51,173 | 8,535,656 | 3.52 | |||||||||
| 19,793,790 | 8.17 | ||||||||||
Internet & Direct Marketing Retail | ||||||||||||
Alibaba Group Holding Ltd. Spon. ADR* | 19,003 | 3,695,703 | 1.53 | |||||||||
Amazon.com, Inc.* | 9,144 | 17,828,240 | 7.35 | |||||||||
| 21,523,943 | 8.88 | ||||||||||
Life Sciences Tools & Services | ||||||||||||
Mettler-Toledo International, Inc.* | 7,783 | 5,374,239 | 2.22 | |||||||||
Metal & Glass Containers | ||||||||||||
Ball Corporation | 50,179 | 3,244,574 | 1.34 | |||||||||
Movies & Entertainment | ||||||||||||
Netflix, Inc.* | 6,988 | 2,623,994 | 1.08 | |||||||||
Pharmaceuticals | ||||||||||||
Zoetis, Inc. | 61,831 | 7,276,890 | 3.00 | |||||||||
Restaurants | ||||||||||||
Chipotle Mexican Grill, Inc.* | 8,412 | 5,504,813 | 2.27 | |||||||||
Starbucks Corp. | 145,346 | 9,555,046 | 3.94 | |||||||||
| 15,059,859 | 6.21 | ||||||||||
Semiconductors | ||||||||||||
NVIDIA Corporation | 39,571 | 10,430,916 | 4.30 | % | ||||||||
Specialized REITs | ||||||||||||
Crown Castle International Corp. | 68,703 | 9,920,713 | 4.09 | |||||||||
Specialty Chemicals | ||||||||||||
The Sherwin-Williams Company | 18,996 | 8,729,042 | 3.60 | |||||||||
Systems Software | ||||||||||||
Microsoft Corporation | 135,813 | 21,419,068 | 8.84 | |||||||||
ServiceNow, Inc.* | 21,274 | 6,096,703 | 2.51 | |||||||||
| 27,515,771 | 11.35 | ||||||||||
Technology Hardware, Storage & Peripherals | ||||||||||||
Apple, Inc. | 69,236 | 17,606,022 | 7.26 | |||||||||
Trucking | ||||||||||||
Uber Technologies, Inc.* | 184,905 | 5,162,548 | 2.13 | |||||||||
TOTAL COMMON STOCKS | ||||||||||||
(Cost $159,662,222) | 228,201,567 | 94.13 | ||||||||||
| ||||||||||||
SHORT-TERM INVESTMENTS | ||||||||||||
State Street Institutional Treasury Money Market Fund - Premier Class, 0.001% | 16,710,360 | 16,710,360 | 6.90 | |||||||||
TOTAL SHORT-TERM INVESTMENTS | ||||||||||||
(Cost $16,710,360) | 16,710,360 | 6.90 | ||||||||||
TOTAL INVESTMENTS | ||||||||||||
(Cost $176,372,582) | 244,911,927 | 101.03 | ||||||||||
Liabilities, Less Cash and Other Assets | (2,485,519 | ) | (1.03 | ) | ||||||||
NET ASSETS | $ | 242,426,408 | 100.00 | % | ||||||||
* | Non-income producing. |
See notes to financial statements. |
15
21st CENTURY FUND |
Investment Review BY BRANDON GEISLER (UNAUDITED)
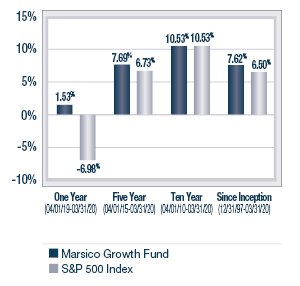
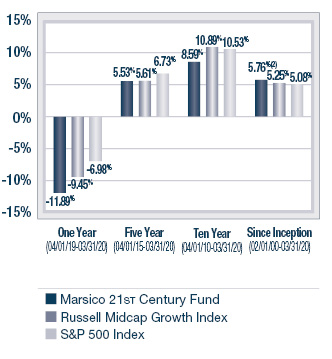
The Marsico 21st Century Fund posted a total return of -17.36% for the six-month fiscal period ended March 31, 2020. The Fund underperformed the Russell Midcap Growth Index, the Fund’s primary benchmark, which had a total return of -13.50% over the same time period. Please see the Fund’s Overview for more detailed information about the Fund’s longer-term performance for various time periods ended March 31, 2020.
The performance data for the Fund quoted here represent past performance, and past performance is not a guarantee of future results. Investment return and principal value of an investment will fluctuate so that an investor’s shares, when redeemed, may be worth more or less than their original cost. Current performance may be lower or higher than the performance information quoted. To obtain performance information current to the most recent month-end, please call 888-860-8686 or visit marsicofunds.com.(1)
This review highlights Fund performance over a six-month fiscal period. Shareholders should keep in mind that the Fund is intended for long-term investors who hold their shares for substantially longer periods of time. You should also keep in mind that our current views and beliefs regarding all investments discussed in this report are subject to change at any time. References to specific securities, industries, and sectors discussed in this report are not recommendations to buy or sell such securities or related investments, and the Fund may not necessarily hold these securities or investments today. Please see the accompanying Schedule of Investments for the percentage of the Fund’s portfolio represented by the securities mentioned in this report as of the end of the reporting period.
The Fund is subject to broad risks associated with investing in equity securities markets generally, including the risks that the securities and markets in which it invests may experience volatility and instability, that domestic and global economies and markets may undergo periods of cyclical change and decline, that investors may at times avoid investments in equity securities, and that investments may not perform as anticipated. Please see the Prospectus for more information.
The Fund is not managed to track its benchmark index, and may hold a substantially overweight or underweight position in a sector, industry, or security compared to its weight in the benchmark. The Fund may be subject to risks associated with a particular sector or other area in which it is overweight, including the risk that the stocks of companies within one area could simultaneously decline in price because of an event that affects the entire area. For informational purposes, the discussion below may compare the benchmark weight or performance of a sector or industry to the investment approach of the Fund.
The 21st Century Fund’s underperformance during the six-month period ended March 31, 2020 as compared to its benchmark, the Russell Midcap Growth Index, was due in part to certain stocks in various sectors. From a sector allocation perspective, Fund performance was marginally impaired by having an underweight allocation to the Health Care and Consumer Staples sectors, based on average weight for the period, as those sectors’ returns outpaced the overall benchmark index return over the same period.
In the Consumer Discretionary space, residential and commercial service company ServiceMaster Global Holdings, Inc. (“ServiceMaster”) (-51%) underperformed after an aggressive termite swarm caused outsized claims liabilities in parts of Alabama. This swarm occurred in 2015, but the damage claims were elevated in the last quarter of 2019 and the total damages are still unknown, resulting in ServiceMaster’s stock selling off. We retained the position in the Fund as we continue to believe the evidence supports the company’s assertion that the issue is isolated to the Alabama region.
In the Information Technology sector, software company WEX, Inc. (“WEX”) dropped -47% due to the decline in oil prices. WEX does not face oil price risk directly, but provides payment processing and information management services to the commercial and government vehicle fleet industry, and the decline in oil prices has resulted in lower fees on payments as transaction amounts are smaller. Further, the transportation market served by WEX has been negatively impacted by COVID-19. We continue to believe WEX is a high quality payments business and that it has a strong ability to navigate hard economic conditions.
Last, aircraft parts maker HEICO Corporation (“HEICO”) dropped -40%. COVID-19 has resulted in a dramatic decline in demand for commercial air travel and reductions in the number of flights. With less flight hours, airlines need fewer repairs and less maintenance on aircraft, which impacts HEICO’s aftermarket part sales. However, we continue to view HEICO as the best positioned commercial aerospace aftermarket parts and services provider due to a strong balance sheet and best-in-class management.
On the positive side, the 21st Century Fund’s performance was boosted by maintaining no exposure in the weak-performing Energy sector, as the sector posted a -50% return for the period. In addition, the Fund benefitted from an underweight posture in the Communication Services sector, as it was one of the weaker sectors in the benchmark index during the period. As volatility increased during the period, we maintained elevated cash levels in the Fund at 5% on average, aiding returns.
16
21st CENTURY FUND |
Several stocks added to returns in the Fund, including Atlassian Corporation PLC – Cl. A, (“Atlassian”) which rose +9%. The company has solidified its position as a leading software company that focuses on collaboration, software development, and enterprise communication. Continuous product innovation and a growing partner community has allowed Atlassian to increase prices across its significant customer base this year. As a result, the company achieved revenue growth, margins expanded, and free cash flow growth inflected upward, leading to strong performance for Atlassian shares.
Also on the positive side in the Consumer Discretionary sector, athleisure retailer lululemon athletica, inc. (“lululemon”) was added to the Fund and subsequently rose +29%. Prior to our purchase, the company’s shares had been negatively affected by a COVID-19-related slowdown in customer traffic in its stores, hampering lululemon’s ability to hit near-term revenue estimates. However, given lululemon’s corporate-owned-store model (in contrast to a franchisee model), we expect sales to rebound quickly when economies fully reopen, given the company’s strong brand perception. The company’s delivery and e-commerce capabilities are further strengths that we think will help lululemon to weather the downturn and accelerate rapidly as the COVID-19 pandemic subsides.
Lam Research Corporation (“Lam”) (+5%) also added to Fund returns. Lam is a global leader in the production of large pieces of capital equipment used to produce semiconductors. The company has distinguished itself from its peers by utilizing the most automated tools with less human intervention. Additionally, Lam has a sound balance sheet, strong cash flow generation, and a margin improvement story due to its growing, high-margin services business. We continue to like the stock as it gives us exposure to trends such as cloud computing, artificial intelligence, and 5G networks.
A new addition during the period was fast casual restaurant operator Chipotle Mexican Grill, Inc. (“Chipotle”) (-13%) whose stock price had been negatively affected by a COVID-19-related slowdown in customer traffic into company stores, thus hampering Chipotle’s ability to hit near-term revenue estimates. However, given Chipotle’s corporate-owned-store model (in contrast to a franchisee model), we expect the company to rebound quickly when economies fully reopen, given the company’s strong brand perception. The company’s delivery and e-commerce capabilities are further strengths that we think will help Chipotle to weather the downturn and accelerate rapidly as the pandemic subsides.
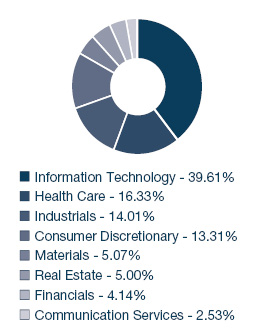
During the reporting period, the Fund reduced its exposure to the Industrials, Consumer Staples, and Consumer Discretionary sectors and increased its allocation to the Information Technology and Health Care sectors. There were no significant changes to the Fund’s allocations to the Real Estate, Communication Services, Financials, and Materials sectors.
Fiscal Period-End Investment Posture
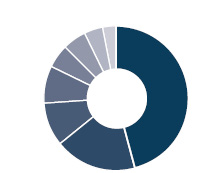
As of March 31, 2020 the Fund’s primary economic sector allocations included Information Technology, Health Care, Industrials, and Consumer Discretionary. At period end, the Fund had no investments in the Consumer Staples, Energy, or Utilities sectors.
Sincerely,
BRANDON A. GEISLER
PORTFOLIO MANAGER
(1) | Total returns are based on net change in net asset value assuming reinvestment of distributions. Periodically, certain fees and expenses have been waived or reimbursed by the Adviser for the 21st Century Fund. In the absence of such a waiver or reimbursement, the performance returns reflected would have been reduced. In accordance with the expense limitation and fee waiver agreement, the Adviser may recoup fees and expenses previously waived or reimbursed under certain parameters. Periodically, the Adviser has recouped such fees or expenses from the 21st Century Fund, resulting in a lower performance return. Please see the Prospectus for more information. |
17
21st CENTURY Fund Overview |
March 31, 2020 (Unaudited)
The21st Century Fund is a diversified portfolio and invests primarily in common stocks that are selected for their long-term growth potential. The Fund may invest in companies of any size. The portions of Fund assets invested in large-capitalization, medium-capitalization, or small-capitalization companies will vary based on market conditions, depending on the portfolio manager’s judgment as to how to achieve the Fund’s investment objective. Under current market conditions the portfolio manager expects to invest substantially in medium-capitalization companies. The Fund will normally hold a core position of between 35 and 60 common stocks.
TOTAL ANNUAL OPERATING EXPENSES* 1.40% | NET ASSETS $211,978,970 | NET ASSET VALUE PER SHARE $26.96 |
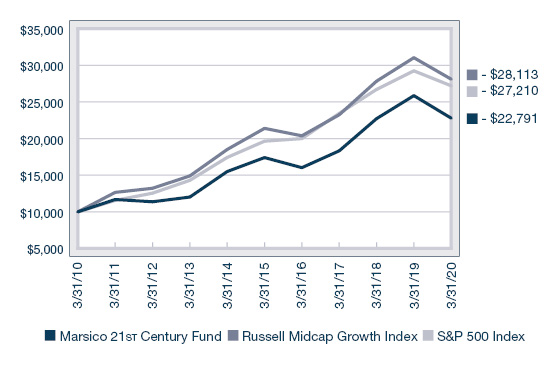
GROWTH OF $10,000(1)(3) | PERFORMANCE COMPARISON(1) | |||
Average Annualized Returns | ||||
|
| |||
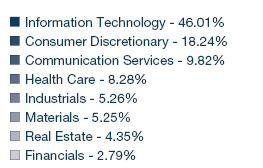
SECTOR ALLOCATION(4) | TOP FIVE HOLDINGS | |||
| ||||
Fidelity National Information Services, Inc. | 3.80% | |||
CoStar Group, Inc. | 3.65% | |||
Teleflex, Inc. | 3.11% | |||
Global Payments, Inc. | 2.99% | |||
Atlassian Corporation PLC - Cl. A | 2.95% | |||
* | The Total Annual Operating Expenses are reflective of the information disclosed in the Funds’ Prospectus dated January 31, 2020, as supplemented, and may differ from the expense ratio disclosed in this report. |
(1) | The performance data quoted here represent past performance, and past performance is not a guarantee of future results. Investment return and principal value of an investment will fluctuate so that an investor’s shares, when redeemed, may be worth more or less than their original cost. Current performance may be lower or higher than the performance information quoted. To obtain performance information current to the most recent month-end, please call 888-860-8686 or visit marsicofunds.com. |
The performance included in the chart and graph does not reflect the deduction of taxes on Fund distributions or the redemption of Fund shares. |
All indices are unmanaged and investors cannot invest directly in an index. |
The Russell Midcap Growth Index (the “Underlying Index”) measures the performance of the mid-capitalization growth sector of the US equity market, and is composed of mid-capitalization US equities that exhibit growth characteristics. It is a subset of the Russell Midcap® Index, which measures the performance of the mid-capitalization sector of the US equity market. The Underlying Index measures the performance of equity securities of Russell Midcap Index issuers with higher price-to-book ratios and higher forecasted growth. |
(2) | Periodically, certain fees and expenses have been waived or reimbursed by the Adviser for the21st Century Fund. In the absence of such a waiver or reimbursement, the performance returns reflected would have been reduced. In accordance with the expense limitation and fee waiver agreement, the Adviser may recoup fees and expenses previously waived or reimbursed under certain parameters. Periodically, the Adviser has recouped such fees or expenses from the21st Century Fund, resulting in a lower performance return. |
(3) | This chart assumes an initial investment of $10,000 made on March 31, 2010. Total returns are based on net change in NAV, assuming reinvestment of distributions. |
(4) | Sector weightings represent the percentage of the Fund’s investments (excluding cash equivalents) in certain general sectors. These sectors may include more than one industry. The Fund’s portfolio composition is subject to change at any time. |
18
Schedule of Investments |
MARSICO 21st CENTURY FUND
SCHEDULE OF INVESTMENTS
March 31, 2020 (Unaudited)
Number | Value | Percent | ||||||||||
COMMON STOCKS | ||||||||||||
Aerospace & Defense | ||||||||||||
HEICO Corporation | 43,510 | $ | 3,246,281 | 1.53 | % | |||||||
L3Harris Technologies, Inc. | 33,391 | 6,014,387 | 2.84 | |||||||||
| 9,260,668 | 4.37 | ||||||||||
Apparel Retail | ||||||||||||
Burlington Stores, Inc.* | 37,941 | 6,012,131 | 2.84 | |||||||||
Apparel, Accessories & Luxury Goods | ||||||||||||
lululemon athletica, inc.* | 18,175 | 3,445,071 | 1.63 | |||||||||
Application Software | ||||||||||||
Atlassian Corporation PLC - Cl. A* | 45,603 | 6,259,468 | 2.95 | |||||||||
Constellation Software, Inc. | 5,889 | 5,352,198 | 2.53 | |||||||||
Guidewire Software, Inc.* | 57,671 | 4,573,887 | 2.16 | |||||||||
PTC, Inc.* | 62,052 | 3,798,203 | 1.79 | |||||||||
RealPage, Inc.* | 84,965 | 4,497,198 | 2.12 | |||||||||
The Descartes Systems Group, Inc.* | 143,100 | 4,922,526 | 2.32 | |||||||||
| 29,403,480 | 13.87 | ||||||||||
Biotechnology | ||||||||||||
Exact Sciences Corporation* | 33,016 | 1,914,928 | 0.90 | |||||||||
Construction Materials | ||||||||||||
Vulcan Materials Company | 45,671 | 4,935,665 | 2.33 | |||||||||
Data Processing & Outsourced Services | ||||||||||||
Fidelity National Information Services, Inc. | 66,150 | 8,046,486 | 3.80 | |||||||||
Global Payments, Inc. | 44,029 | 6,350,303 | 2.99 | |||||||||
Square, Inc. - Cl. A* | 62,616 | 3,279,826 | 1.55 | |||||||||
WEX, Inc.* | 32,368 | 3,384,074 | 1.60 | |||||||||
| 21,060,689 | 9.94 | ||||||||||
Education Services | ||||||||||||
Bright Horizons Family Solutions, Inc.* | 24,251 | 2,473,602 | 1.17 | |||||||||
Electrical Components & Equipment | ||||||||||||
AMETEK, Inc. | 70,986 | 5,112,412 | 2.41 | |||||||||
Electronic Components | ||||||||||||
Amphenol Corp. – Cl. A | 36,073 | 2,629,000 | 1.24 | |||||||||
Electronic Equipment & Instruments | ||||||||||||
Cognex Corporation | 109,346 | 4,616,588 | 2.18 | |||||||||
Novanta, Inc.* | 57,727 | 4,611,233 | 2.17 | |||||||||
| 9,227,821 | 4.35 | ||||||||||
Financial Exchanges & Data | ||||||||||||
MSCI, Inc. | 14,888 | 4,302,037 | 2.03 | |||||||||
General Merchandise Stores | ||||||||||||
Ollie’s Bargain Outlet Holdings, Inc.* | 51,481 | 2,385,630 | 1.13 | |||||||||
Health Care Equipment | ||||||||||||
DexCom, Inc.* | 13,176 | 3,547,902 | 1.67 | % | ||||||||
IDEXX Laboratories, Inc.* | 19,088 | 4,623,877 | 2.18 | |||||||||
Insulet Corp.* | 9,269 | 1,535,688 | 0.73 | |||||||||
Intuitive Surgical, Inc.* | 9,992 | 4,948,138 | 2.34 | |||||||||
Teleflex, Inc. | 22,527 | 6,597,257 | 3.11 | |||||||||
| 21,252,862 | 10.03 | ||||||||||
Health Care Supplies | ||||||||||||
The Cooper Companies, Inc. | 19,474 | 5,368,398 | 2.53 | |||||||||
Home Improvement Retail | ||||||||||||
Floor & Decor Holdings, Inc. - Cl. A* | 48,648 | 1,561,114 | 0.74 | |||||||||
Hotels, Resorts & Cruise Lines | ||||||||||||
Hilton Worldwide Holdings, Inc. | 31,821 | 2,171,465 | 1.02 | |||||||||
Interactive Media & Services | ||||||||||||
Snap, Inc. - Cl. A* | 438,132 | 5,209,390 | 2.46 | |||||||||
Internet Services & Infrastructure | ||||||||||||
Okta, Inc.* | 12,540 | 1,533,140 | 0.72 | |||||||||
Twilio, Inc. - Cl. A* | 59,222 | 5,299,777 | 2.50 | |||||||||
| 6,832,917 | 3.22 | ||||||||||
Life Sciences Tools & Services | ||||||||||||
Avantor, Inc.* | 81,165 | 1,013,751 | 0.48 | |||||||||
Mettler-Toledo International, Inc.* | 3,291 | 2,272,468 | 1.07 | |||||||||
| 3,286,219 | 1.55 | ||||||||||
Managed Health Care | ||||||||||||
Centene Corp.* | 29,078 | 1,727,524 | 0.81 | |||||||||
Metal & Glass Containers | ||||||||||||
Ball Corporation | 84,843 | 5,485,948 | 2.59 | |||||||||
Real Estate Services | ||||||||||||
FirstService Corporation | 63,800 | 4,919,758 | 2.32 | |||||||||
Regional Banks | ||||||||||||
First Republic Bank | 51,040 | 4,199,571 | 1.98 | |||||||||
Research & Consulting Services | ||||||||||||
CoStar Group, Inc.* | 13,191 | 7,745,887 | 3.65 | |||||||||
Verisk Analytics, Inc. | 33,690 | 4,695,712 | 2.22 | |||||||||
| 12,441,599 | 5.87 | ||||||||||
Restaurants | ||||||||||||
Chipotle Mexican Grill, Inc.* | 6,164 | 4,033,722 | 1.90 | |||||||||
Semiconductor Equipment | ||||||||||||
Lam Research Corporation | 23,981 | 5,755,440 | 2.72 | |||||||||
Semiconductors | ||||||||||||
Marvell Technology Group Ltd. | 127,202 | 2,878,581 | 1.36 | |||||||||
Microchip Technology, Inc. | 53,322 | 3,615,232 | 1.70 | |||||||||
| 6,493,813 | 3.06 | ||||||||||
* | Non-income producing. |
See notes to financial statements. |
19
SCHEDULE OF INVESTMENTS |
MARSICO 21st CENTURY FUND
SCHEDULE OF INVESTMENTS (continued)
March 31, 2020 (Unaudited)
Number | Value | Percent | ||||||||||
COMMON STOCKS (continued) | ||||||||||||
Specialized Consumer Services | ||||||||||||
frontdoor, Inc.* | 56,422 | $ | 1,962,357 | 0.92 | % | |||||||
ServiceMaster Global Holdings, Inc.* | 122,349 | 3,303,423 | 1.56 | |||||||||
| 5,265,780 | 2.48 | ||||||||||
Specialized REITs | ||||||||||||
SBA Communications Corporation - Cl. A | 19,864 | 5,362,684 | 2.53 | |||||||||
Trucking | ||||||||||||
Lyft, Inc. - Cl. A* | 73,614 | 1,976,536 | 0.93 | |||||||||
TOTAL COMMON STOCKS | ||||||||||||
(Cost $188,705,411) | 205,507,874 | 96.95 | ||||||||||
| ||||||||||||
SHORT-TERM INVESTMENTS | ||||||||||||
State Street Institutional Treasury Money Market Fund - Premier Class, 0.001% | 7,025,062 | 7,025,062 | 3.31 | |||||||||
TOTAL SHORT-TERM INVESTMENTS | ||||||||||||
(Cost $7,025,062) | 7,025,062 | 3.31 | ||||||||||
TOTAL INVESTMENTS | ||||||||||||
(Cost $195,730,473) | 212,532,936 | 100.26 | ||||||||||
Liabilities, Less Cash and Other Assets | (553,966 | ) | (0.26 | ) | ||||||||
NET ASSETS | $ | 211,978,970 | 100.00 | % | ||||||||
* | Non-income producing |
See notes to financial statements. |
20
INTERNATIONAL OPPORTUNITIES FUND |
Investment Review BY TOM MARSICO AND ROB SUSMAN (UNAUDITED)
The Marsico International Opportunities Fund posted a total return of (US$) -12.32% for the six-month fiscal period ended March 31, 2020. The Fund outperformed the MSCI EAFE Index, the Fund’s benchmark index, which had a total return of (US$) -16.52% over the same time period. Please see the Fund’s Overview for more detailed information about the Fund’s longer-term performance for various time periods ended March 31, 2020.
The performance data for the Fund quoted here represent past performance, and past performance is not a guarantee of future results. Investment return and principal value of an investment will fluctuate so that an investor’s shares, when redeemed, may be worth more or less than their original cost. Current performance may be lower or higher than the performance information quoted. To obtain performance information current to the most recent month-end, please call 888-860-8686 or visit marsicofunds.com.(1)
This review highlights Fund performance over a six-month fiscal period. Shareholders should keep in mind that the Fund is intended for long-term investors who hold their shares for substantially longer periods of time. You should also keep in mind that our current views and beliefs regarding all investments discussed in this report are subject to change at any time. References to specific securities, industries, and sectors discussed in this report are not recommendations to buy or sell such securities or related investments, and the Fund may not necessarily hold these securities or investments today. Please see the accompanying Schedule of Investments for the percentage of the Fund’s portfolio represented by the securities mentioned in this report as of the end of the reporting period.
Foreign investments present additional risks due to currency fluctuations, economic and political factors, lower liquidity, differences in securities regulations and accounting standards, possible changes in taxation, limited public information, and other factors. In addition, the Fund is subject to broad risks associated with investing in equity securities markets generally, including the risks that the securities and markets in which it invests may experience volatility and instability, that domestic and global economies and markets may undergo periods of cyclical change and decline, that investors may at times avoid investments in equity securities, and that investments may not perform as anticipated. Please see the Prospectus for more information.
The Fund is not managed to track its benchmark index, and may hold a substantially overweight or underweight position in a sector, industry, or security compared to its weight in the benchmark. The Fund may be subject to risks associated with a particular sector or other area in which it is overweight, including the risk that the stocks of companies within one area could simultaneously decline in price because of an event that affects the entire area. For informational purposes, the discussion below may compare the benchmark weight or performance of a sector or industry to the investment approach of the Fund.
The International Opportunities Fund’s outperformance during the six-month period ended March 31, 2020 as compared to the MSCI EAFE Index was due, in part, to certain strong-performing stocks in the Communication Services and Consumer Discretionary sectors as defined in the Global Industry Classification Standard (“GICS”). In addition, the Fund benefitted from an overweight posture in the Information Technology sector, as it was one of the stronger-performing sectors in the benchmark index during the period, and an underweight posture in both the Financial Services and Energy sectors, two of the weaker performing sectors in the benchmark index. As volatility increased during the period, we maintained elevated cash levels of 5% on average, boosting returns.
Several positions in the Fund performed positively during the period, including cellular tower company Cellnex Telecom SA (“Cellnex”) (+16%), which is quickly acquiring cell-phone towers around Europe. In contrast to the US where numerous cell tower companies operate, in Europe Cellnex is largely alone and competes against potentially less efficient, big nationalized operators. Importantly, cell-tower stocks are viewed as defensive given the need for cell phones to work well in a pandemic, which positions Cellnex as an attractive stock to own during this challenging time.
Also contributing to the Fund’s performance was Chinese e-commerce company Alibaba Group Holding Ltd. Spon. ADR (“BABA”) (+17%). Alibaba’s investments in multiple business lines, including its retail presence, personalized recommendation feeds, and live-streaming services have improved the customer experience across its on-line marketplaces. As efficiencies continue across various other segments such as Alibaba Cloud, earnings steadily improved throughout the second half of 2019, and were poised to continue to do so in 2020 prior to the COVID-19 pandemic. As we look out to the remainder of 2020 and beyond, we see BABA further distinguishing itself from peers in China as the go-to player for everyday and specialty e-commerce, as well as cloud, media, local delivery and financial services.
Also based in China, Tencent Holdings Ltd. (“Tencent”) (+16%) was a strong performer over the last sixth months as video gaming, Tencent’s largest revenue source, has grown significantly while users have spent more time inside as a result of the COVID-19 pandemic. We don’t see this as a one-time occurrence, but as a paradigm shift toward consumers spending more time and money on home-based activities instead of larger gatherings in event centers or malls. Tencent’s platform also is levered to the growth of cloud computing services. Much like Amazon and Microsoft, Tencent has a fast growing cloud computing business model that is still in its early innings. Given that media consumption is migrating toward use of portable digital devices rather than devices in fixed locations, we believe that Tencent will benefit across its portfolio of assets.
21
INTERNATIONAL OPPORTUNITIES FUND |
From a sector allocation perspective, Fund performance was marginally penalized for maintaining no exposure to the Utilities sector, one of the stronger-performing sectors in the MSCI EAFE Index during the period, and for maintaining an underweight stance to the Consumer Staples sector.
Several of the Fund’s positions in the Consumer Staples sector detracted from performance including beverage-maker Anheuser-Busch InBev S.A./N.V. (“ABI”) (-62% prior to being sold). The explosive growth in the hard seltzer category negatively impacted ABI’s beer sales during the period. The company has responded to the hard seltzer craze with Bud Light Seltzer and Natural Light Seltzer, but it may be late to the game and its first entry into the category, Bon & Viv, never gained significant market share. ABI also has higher financial leverage than peers, which led to additional pressure on the shares during the COVID-19 sell-off.
In the Real Estate sector, Germany-based Aroundtown S.A. (“Aroundtown”) (-39%) performed well in 2019 and the first two months of 2020. Then, as concerns mounted about a growing recession and the question of when Europeans will travel again and stay at hotels, Aroundtown’s stock languished with those of other commercial and hotel real estate operators. That said, Aroundtown has very low leverage, a large portfolio of unencumbered real estate assets, and a strong balance sheet. As the COVID-19 pandemic wanes, we believe the stock will recover and Aroundtown’s management will use its balance sheet to opportunistically grow the portfolio.
Although active currency management is not a central facet of the International Opportunities Fund’s investment process, fluctuations in major world currencies can at times affect the Fund’s performance. During the period, the net effect of currency moves was positive for the Fund.
There were a few shifts in the Fund’s sector allocations during the period. The Fund reduced its allocations to the Industrials, Information Technology and Consumer Staples sectors and increased its allocations to the Health Care and Financials sectors. There were no significant changes to the Fund’s allocations to the Materials, Communication Services, Energy, Real Estate, and Consumer Discretionary sectors.
Fiscal Period-End Investment Posture
As of March 31, 2020, the Fund’s primary economic sector allocations included Health Care, Communication Services, Information Technology, Financials, Consumer Discretionary, and Consumer Staples. The Fund had no investments in the Utilities sector.
In terms of country allocations, the Fund’s most significant weightings at period-end, excluding short-term investments, were in Germany, Japan, the United Kingdom, Switzerland, China/Hong Kong, France, and the Netherlands. Country-level weightings generally should be considered a residual of the Fund’s stock selection process rather than a major, proactive facet of its investment strategy.
Sincerely,
THOMAS F. MARSICO
ROBERT G. SUSMAN, CFA
PORTFOLIO MANAGERS
(1) | Total returns are based on net change in net asset value assuming reinvestment of distributions. Periodically, certain fees and expenses have been waived or reimbursed by the Adviser for the International Opportunities Fund. In the absence of such a waiver or reimbursement, the performance returns reflected would have been reduced. In accordance with the expense limitation and fee waiver agreement, the Adviser may recoup fees and expenses previously waived or reimbursed under certain parameters. Periodically, the Adviser has recouped such fees or expenses from the International Opportunities Fund, resulting in a lower performance return. Please see the Prospectus for more information. |
22
INTERNATIONAL OPPORTUNITIES Fund Overview |
March 31, 2020 (Unaudited)
The International Opportunities Fund is a diversified portfolio and invests primarily in common stocks of foreign companies that are selected for their long-term growth potential, including foreign securities, whether traded in the US (including as American Depositary Receipts) or in foreign markets or both. The Fund may invest in an unlimited number of companies of any size throughout the world. It normally invests in the securities of issuers that are economically tied to one or more foreign countries, and expects to be invested in various issuers or securities that together have ties to at least four different foreign countries. The Fund may invest in securities of companies economically tied to emerging markets. Some issuers or securities in the Fund’s portfolio may be economically tied to the US.
TOTAL ANNUAL OPERATING EXPENSES* 1.74% NET EXPENSES*† 1.51% | NET ASSETS $46,882,369 | NET ASSET VALUE PER SHARE $15.53 |
GROWTH OF $10,000(1)(2)(3) | PERFORMANCE COMPARISON(1) | |||
Average Annualized Returns | ||||
|
| |||
SECTOR ALLOCATION(4) | TOP FIVE HOLDINGS | |||
| ||||
Tencent Holdings Ltd. | 5.00% | |||
Alibaba Group Holding Ltd. Spon. ADR | 4.75% | |||
Nestlé S.A. | 3.39% | |||
Koninklijke Philips N.V. | 3.18% | |||
Deutsche Boerse A.G. | 2.85% | |||
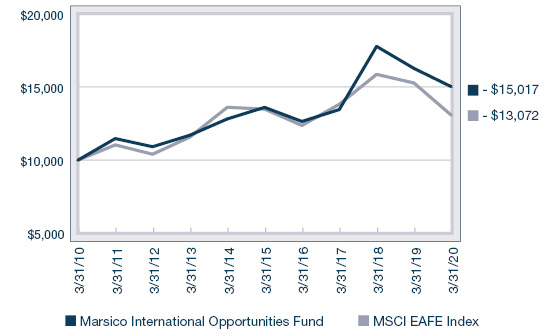
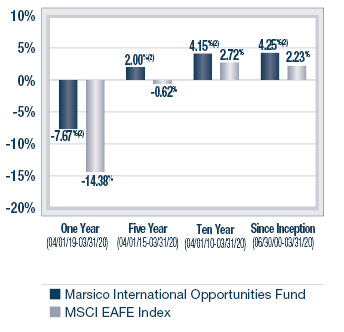
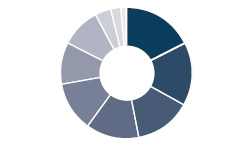
* | The Total Annual Operating Expenses and Net Expenses are reflective of the information disclosed in the Funds’ Prospectus dated January 31, 2020, as supplemented, and may differ from the expense ratios disclosed in this report. |
† | Marsico Capital Management, LLC (the “Adviser”) has entered into a written expense limitation and fee waiver agreement under which it has agreed to limit the total expenses of the International Opportunities Fund (excluding taxes, interest, acquired fund fees and expenses, litigation, extraordinary expenses, and brokerage and other transaction expenses relating to the purchase or sale of portfolio investments) to an annual rate of 1.50% of the Fund’s average net assets until January 31, 2021. This expense limitation and fee waiver agreement may be terminated by the Adviser at any time after January 31, 2021 upon 15 days prior notice to the Fund and its administrator. The Adviser may recoup from the Fund fees previously waived or expenses previously reimbursed by the Adviser with respect to that Fund pursuant to this agreement (or a previous expense limitation agreement) if: (1) such recoupment by the Adviser does not cause the Fund, at the time of recoupment, to exceed the lesser of (a) the expense limitation in effect at the time the relevant amount was waived and/or reimbursed, or (b) the expense limitation in effect at the time of the proposed recoupment, and (2) the recoupment is made within three years after the fiscal year end date as of which the amount to be waived or reimbursed was determined and the waiver or reimbursement occurred. |
(1) | The performance data quoted here represent past performance, and past performance is not a guarantee of future results. Investment return and principal value of an investment will fluctuate so that an investor’s shares, when redeemed, may be worth more or less than their original cost. Current performance may be lower or higher than the performance information quoted. To obtain performance information current to the most recent month-end, please call 888-860-8686 or visit marsicofunds.com. |
The performance included in the chart and graph does not reflect the deduction of taxes on Fund distributions or the redemption of Fund shares. |
All indices are unmanaged and investors cannot invest directly in an index. |
The MSCI EAFE Index tracks the stocks of about 1,000 companies in Europe, Australasia, and the Far East (EAFE). |
(2) | Periodically, certain fees and expenses have been waived or reimbursed by the Adviser for the International Opportunities Fund. In the absence of such a waiver or reimbursement, the performance returns reflected would have been reduced. In accordance with the expense limitation and fee waiver agreement, the Adviser may recoup fees and expenses previously waived or reimbursed under certain parameters. Periodically, the Adviser has recouped such fees or expenses from the International Opportunities Fund, resulting in a lower performance return. |
(3) | This chart assumes an initial investment of $10,000 made on March 31, 2010. Total returns are based on net change in NAV, assuming reinvestment of distributions. |
(4) | Sector weightings represent the percentage of the Fund’s investments (excluding cash equivalents) in certain general sectors. These sectors may include more than one industry. The Fund’s portfolio composition is subject to change at any time. |
23
Schedule of Investments |
MARSICO INTERNATIONAL OPPORTUNITIES FUND
SCHEDULE OF INVESTMENTS
March 31, 2020 (Unaudited)
Number | Value | Percent | ||||||||||
COMMON STOCKS | ||||||||||||
Aerospace & Defense | ||||||||||||
Airbus SE | 7,247 | $ | 467,300 | 1.00 | % | |||||||
BAE Systems PLC | 75,197 | 483,142 | 1.03 | |||||||||
Safran S.A. | 2,132 | 188,889 | 0.40 | |||||||||
| 1,139,331 | 2.43 | ||||||||||
Airlines | ||||||||||||
Ryanair Holdings PLC Spon. ADR* | 2,046 | 108,622 | 0.23 | |||||||||
Apparel, Accessories & Luxury Goods | ||||||||||||
adidas A.G. | 743 | 164,966 | 0.35 | |||||||||
LVMH Moet Hennessy Louis Vuitton S.E. | 1,018 | 373,353 | 0.80 | |||||||||
| 538,319 | 1.15 | ||||||||||
Application Software | ||||||||||||
Atlassian Corporation PLC - Cl. A* | 931 | 127,789 | 0.27 | |||||||||
Constellation Software, Inc. | 288 | 261,748 | 0.56 | |||||||||
SAP S.E. | 11,660 | 1,301,815 | 2.78 | |||||||||
The Descartes Systems Group, Inc.* | 6,800 | 233,914 | 0.50 | |||||||||
Xero Ltd.* | 6,419 | 266,969 | 0.57 | |||||||||
| 2,192,235 | 4.68 | ||||||||||
Asset Management & Custody Banks | ||||||||||||
Hargreaves Lansdown PLC | 13,288 | 225,775 | 0.48 | |||||||||
Julius Baer Group Ltd. | 12,162 | 407,396 | 0.87 | |||||||||
| 633,171 | 1.35 | ||||||||||
Biotechnology | ||||||||||||
CSL Ltd. | 1,898 | 344,053 | 0.73 | |||||||||
Communications Equipment | ||||||||||||
Telefonaktiebolaget LM Ericsson B Shares | 46,423 | 375,792 | 0.80 | |||||||||
Construction & Engineering | ||||||||||||
Taisei Corporation | 8,100 | 247,034 | 0.53 | |||||||||
Consumer Electronics | ||||||||||||
Sony Corporation | 14,600 | 864,810 | 1.84 | |||||||||
Data Processing & Outsourced Services | ||||||||||||
Fidelity National Information Services, Inc. | 4,853 | 590,319 | 1.26 | |||||||||
Pagseguro Digital Ltd. - Cl. A* | 19,006 | 367,386 | 0.78 | |||||||||
PayPal Holdings, Inc.* | 1,902 | 182,097 | 0.39 | |||||||||
Wirecard A.G. | 3,605 | 406,176 | 0.87 | |||||||||
| 1,545,978 | 3.30 | ||||||||||
Distillers & Vintners | ||||||||||||
Diageo PLC | 12,733 | 403,757 | 0.86 | |||||||||
Pernod Ricard S.A. | 3,016 | 428,079 | 0.91 | |||||||||
Treasury Wine Estates Ltd. | 41,223 | 255,936 | 0.55 | |||||||||
| 1,087,772 | 2.32 | ||||||||||
Diversified Banks | ||||||||||||
BAWAG Group A.G. | 9,866 | 275,215 | 0.59 | |||||||||
BNP Paribas S.A. | 7,085 | 206,848 | 0.44 | |||||||||
HDFC Bank Ltd. ADR | 7,605 | 292,488 | 0.62 | |||||||||
HSBC Holdings PLC | 75,625 | 424,541 | 0.91 | |||||||||
Mitsubishi UFJ Financial Group, Inc. | 147,900 | 553,376 | 1.18 | |||||||||
| 1,752,468 | 3.74 | ||||||||||
Electrical Components & Equipment | ||||||||||||
ABB Ltd. | 19,658 | 341,676 | 0.73 | % | ||||||||
Electronic Equipment & Instruments | ||||||||||||
Keyence Corporation | 1,900 | 610,874 | 1.30 | |||||||||
Financial Exchanges & Data | ||||||||||||
Deutsche Boerse A.G. | 9,730 | 1,336,745 | 2.85 | |||||||||
London Stock Exchange Group PLC | 1,658 | 148,318 | 0.32 | |||||||||
| 1,485,063 | 3.17 | ||||||||||
Food Retail | ||||||||||||
Koninklijke Ahold Delhaize N.V. | 7,657 | 178,382 | 0.38 | |||||||||
General Merchandise Stores | ||||||||||||
B&M European Value Retail S.A. | 240,904 | 818,162 | 1.75 | |||||||||
Dollarama, Inc. | 13,758 | 381,662 | 0.81 | |||||||||
| 1,199,824 | 2.56 | ||||||||||
Health Care Equipment | ||||||||||||
Koninklijke Philips N.V. | 36,359 | 1,492,804 | 3.18 | |||||||||
Olympus Corporation | 19,000 | 273,890 | 0.59 | |||||||||
Straumann Holding A.G. | 342 | 250,038 | 0.53 | |||||||||
| 2,016,732 | 4.30 | ||||||||||
Health Care Supplies | ||||||||||||
Alcon, Inc.* | 7,510 | 384,743 | 0.82 | |||||||||
Human Resource & Employment Services | ||||||||||||
Recruit Holdings Company Ltd. | 18,300 | 472,712 | 1.01 | |||||||||
Industrial Conglomerates | ||||||||||||
Siemens A.G. | 7,371 | 617,211 | 1.32 | |||||||||
Industrial Gases | ||||||||||||
Air Liquide S.A. | 2,740 | 349,754 | 0.75 | |||||||||
Industrial Machinery | ||||||||||||
FANUC Corporation | 1,600 | 213,801 | 0.45 | |||||||||
MISUMI Group, Inc. | 24,200 | 523,469 | 1.12 | |||||||||
| 737,270 | 1.57 | ||||||||||
Integrated Oil & Gas | ||||||||||||
BP PLC | 123,254 | 505,458 | 1.08 | |||||||||
Integrated Telecommunication Services | ||||||||||||
Cellnex Telecom SA | 27,814 | 1,261,711 | 2.69 | |||||||||
China Tower Corporation Ltd. - Cl. H | 994,000 | 220,868 | 0.47 | |||||||||
Infrastrutture Wireless Italiane SpA | 22,349 | 241,990 | 0.52 | |||||||||
| 1,724,569 | 3.68 | ||||||||||
Interactive Home Entertainment | ||||||||||||
Nintendo Co., Ltd. | 1,800 | 699,576 | 1.49 | |||||||||
Sea Ltd. ADR* | 2,232 | 98,900 | 0.21 | |||||||||
| 798,476 | 1.70 | ||||||||||
Interactive Media & Services | ||||||||||||
Facebook, Inc. - Cl. A* | 2,973 | 495,896 | 1.06 | |||||||||
REA Group Ltd. | 8,380 | 392,552 | 0.84 | |||||||||
Scout24 A.G. | 13,844 | 827,579 | 1.76 | |||||||||
Tencent Holdings Ltd. | 47,400 | 2,342,868 | 5.00 | |||||||||
| 4,058,895 | 8.66 | ||||||||||
* | Non-income producing. |
See notes to financial statements. |
24
SCHEDULE OF INVESTMENTS |
Number | Value | Percent | ||||||||||
COMMON STOCKS(continued) | ||||||||||||
Internet & Direct Marketing Retail | ||||||||||||
Alibaba Group Holding Ltd. Spon. ADR* | 11,452 | $ | 2,227,185 | 4.75 | % | |||||||
Trainline PLC* | 45,709 | 189,772 | 0.41 | |||||||||
| 2,416,957 | 5.16 | ||||||||||
Internet Services & Infrastructure | ||||||||||||
Shopify, Inc. - Cl. A* | 609 | 253,910 | 0.54 | |||||||||
Life & Health Insurance | ||||||||||||
AIA Group Ltd. | 51,000 | 456,686 | 0.97 | |||||||||
Life Sciences Tools & Services | ||||||||||||
Eurofins Scientific S.E. | 712 | 347,456 | 0.74 | |||||||||
Multi-Line Insurance | ||||||||||||
AXA S.A. | 41,804 | 707,823 | 1.51 | |||||||||
Packaged Foods & Meats | ||||||||||||
Nestlé S.A. | 15,514 | 1,588,134 | 3.39 | |||||||||
Personal Products | ||||||||||||
L’Oreal S.A. | 1,030 | 266,575 | 0.57 | |||||||||
Shiseido Company Ltd. | 3,700 | 217,458 | 0.46 | |||||||||
Unilever PLC | 23,710 | 1,195,700 | 2.55 | |||||||||
| 1,679,733 | 3.58 | ||||||||||
Pharmaceuticals | ||||||||||||
AstraZeneca PLC | 5,614 | 500,201 | 1.07 | |||||||||
Bayer A.G. | 5,491 | 314,626 | 0.67 | |||||||||
Dechra Pharmaceuticals PLC | 22,959 | 662,078 | 1.41 | |||||||||
GW Pharmaceuticals PLC ADR* | 2,728 | 238,891 | 0.51 | |||||||||
Novartis AG | 13,975 | 1,152,920 | 2.46 | |||||||||
Roche Holding AG | 3,540 | 1,138,966 | 2.43 | |||||||||
Takeda Pharmaceutical Company Ltd. | 25,900 | 788,606 | 1.68 | |||||||||
| 4,796,288 | 10.23 | ||||||||||
Property & Casualty Insurance | ||||||||||||
Tokio Marine Holdings, Inc. | 5,600 | 256,225 | 0.55 | |||||||||
Real Estate Operating Companies | ||||||||||||
Aroundtown S.A. | 265,425 | 1,328,572 | 2.83 | |||||||||
Real Estate Services | ||||||||||||
FirstService Corporation | 4,500 | 347,005 | 0.74 | |||||||||
Reinsurance | ||||||||||||
Muenchener Rueckversicherungs-Gesellschaft AG | 2,430 | 488,601 | 1.04 | |||||||||
Research & Consulting Services | ||||||||||||
Experian PLC | 13,157 | 365,651 | 0.78 | |||||||||
RELX PLC | 15,000 | 320,136 | 0.68 | |||||||||
| 685,787 | 1.46 | ||||||||||
Restaurants | ||||||||||||
Domino’s Pizza Enterprises Ltd. | 14,290 | 442,423 | 0.94 | |||||||||
Semiconductor Equipment | ||||||||||||
ASML Holding N.V. | 2,894 | 762,900 | 1.63 | |||||||||
Tokyo Electron Ltd. | 1,700 | 316,835 | 0.67 | |||||||||
| 1,079,735 | 2.30 | ||||||||||
Semiconductors | ||||||||||||
NXP Semiconductors N.V. | 2,763 | 229,136 | 0.49 | % | ||||||||
Specialty Chemicals | ||||||||||||
Shin-Etsu Chemical Company Ltd. | 6,400 | 629,038 | 1.34 | |||||||||
Symrise A.G. | 2,568 | 237,563 | 0.51 | |||||||||
| 866,601 | 1.85 | ||||||||||
Wireless Telecommunication Services | ||||||||||||
SoftBank Group Corporation | 7,000 | 247,817 | 0.53 | |||||||||
TOTAL COMMON STOCKS | ||||||||||||
(Cost $43,726,593) | 44,530,113 | 94.98 | ||||||||||
| ||||||||||||
SHORT-TERM INVESTMENTS | ||||||||||||
State Street Institutional Treasury Money Market Fund - Premier Class, 0.001% | 2,169,811 | 2,169,811 | 4.63 | |||||||||
TOTAL SHORT-TERM INVESTMENTS | ||||||||||||
(Cost $2,169,811) | 2,169,811 | 4.63 | ||||||||||
TOTAL INVESTMENTS | ||||||||||||
(Cost $45,896,404) | 46,699,924 | 99.61 | ||||||||||
Cash and Other Assets, Less Liabilities | 182,445 | 0.39 | ||||||||||
NET ASSETS | $ | 46,882,369 | 100.00 | % | ||||||||
SUMMARY OF INVESTMENTS BY COUNTRY | ||||||||
Country | Market Value | Percent of | ||||||
Australia | $ | 1,562,753 | 3.35% | |||||
Austria | 275,215 | 0.59 | ||||||
Brazil | 367,386 | 0.79 | ||||||
Canada | 1,478,239 | 3.17 | ||||||
China/Hong Kong | 5,247,607 | 11.24 | ||||||
France | 3,336,077 | 7.14 | ||||||
Germany | 7,023,854 | 15.04 | ||||||
India | 292,488 | 0.63 | ||||||
Ireland | 108,622 | 0.23 | ||||||
Italy | 241,990 | 0.52 | ||||||
Japan | 6,915,521 | 14.81 | ||||||
Netherlands | 2,663,222 | 5.70 | ||||||
New Zealand | 266,969 | 0.57 | ||||||
Singapore | 98,900 | 0.21 | ||||||
Spain | 1,261,711 | 2.70 | ||||||
Sweden | 375,792 | 0.80 | ||||||
Switzerland | 5,263,873 | 11.27 | ||||||
United Kingdom | 6,481,582 | 13.88 | ||||||
United States(1) | 3,438,123 | 7.36 | ||||||
| $ | 46,699,924 | 100.00% | ||||||
(1) | Includes short-term securities. |
* | Non-income producing. |
See notes to financial statements. |
25
GLOBAL FUND |
Investment Review BY TOM MARSICO, BRANDON GEISLER, AND ROB SUSMAN (UNAUDITED)
The Marsico Global Fund posted a total return of (US$) -4.86% for the six-month fiscal period ended March 31, 2020. The Fund strongly outperformed the MSCI All Country World Index (“MSCI ACWI Index”), the Fund’s benchmark index, which had a total return of (US$) -14.33% over the same time period. Please see the Fund’s Overview for more detailed information about the Fund’s longer-term performance for various time periods ended March 31, 2020.
The performance data for the Fund quoted here represent past performance, and past performance is not a guarantee of future results. Investment return and principal value of an investment will fluctuate so that an investor’s shares, when redeemed, may be worth more or less than their original cost. Current performance may be lower or higher than the performance information quoted. To obtain performance information current to the most recent month-end, please call 888-860-8686 or visit marsicofunds.com.(1)
This review highlights Fund performance over a six-month fiscal period. Shareholders should keep in mind that the Fund is intended for long-term investors who hold their shares for substantially longer periods of time. You should also keep in mind that our current views and beliefs regarding all investments discussed in this report are subject to change at any time. References to specific securities, industries, and sectors discussed in this report are not recommendations to buy or sell such securities or related investments, and the Fund may not necessarily hold these securities or investments today. Please see the accompanying Schedule of Investments for the percentage of the Fund’s portfolio represented by the securities mentioned in this report as of the end of the reporting period.
Foreign investments present additional risks due to currency fluctuations, economic and political factors, lower liquidity, differences in securities regulations and accounting standards, possible changes in taxation, limited public information, and other factors. In addition, the Fund is subject to broad risks associated with investing in equity securities markets generally, including the risks that the securities and markets in which it invests may experience volatility and instability, that domestic and global economies and markets may undergo periods of cyclical change and decline, that investors may at times avoid investments in equity securities, and that investments may not perform as anticipated. Please see the Prospectus for more information.
The Fund is not managed to track its benchmark index, and may hold a substantially overweight or underweight position in a sector, industry, or security compared to its weight in the benchmark. The Fund may be subject to risks associated with a particular sector or other area in which it is overweight, including the risk that the stocks of companies within one area could simultaneously decline in price because of an event that affects the entire area. For informational purposes, the discussion below may compare the benchmark weight or performance of a sector or industry to the investment approach of the Fund.
The Global Fund’s strong outperformance during the six-month period ended March 31, 2020 as compared to the MSCI ACWI Index was due, in part, to certain strong-performing stocks in the Information Technology and Consumer Discretionary sectors as defined in the Global Industry Classification Standard (“GICS”). The Fund’s performance was also aided relative to the benchmark index by having an overweight allocation in the Information Technology sector and no allocation to the Energy sector, which was the weakest-performing sector during the period. The Fund also benefitted by maintaining a 2% average cash weight during the volatile six-month period.
In the Information Technology sector, semiconductor company NVIDIA Corporation (“NVDA”) (+49%) was a top contributor because of improving demand for its gaming and datacenter chips. We believe that NVDA is the technology leader in developing graphics processing units that excel at generating graphics in video games as well as computations in artificial intelligence and other datacenter applications. Both of these segments saw reduced demand through much of 2019 due to excess inventory in gaming channels after the cryptocurrency bust and the overproduction of capacity by cloud service providers during 2018. By early 2020, however, gaming inventory channels were clean, leading to increased sales matching demand. Despite the COVID-19 outbreak, global demand for NVDA’s chips has remained strong from datacenter customers through the end of the period.
Also contributing to the Fund’s outperformance was Chinese e-commerce company Alibaba Group Holding Ltd. Spon. ADR (“BABA”) (+14%). Alibaba’s investments in multiple business lines, including its retail presence, personalized recommendation feeds, and live-streaming services have improved the customer experience across its on-line marketplaces. As efficiencies continue across various other segments such as Alibaba Cloud, earnings steadily improved throughout the second half of 2019, and were poised to continue to do so in 2020 prior to the COVID-19 pandemic. As we look out to the remainder of 2020 and beyond, we see BABA further distinguishing itself from peers in China as the go-to player for everyday e-commerce, as well as cloud computing, media, delivery and financial services.
Several new positions entered the Global Fund portfolio during the six-month period, one of which was athleisure retailer lululemon athletica, inc. (“lululemon”) (-9%). The company’s shares had been negatively affected by a COVID-19-related slowdown in customer traffic in its stores, hampering lululemon’s ability to hit near-term revenue estimates. However, given lululemon’s corporate-owned-store model (in contrast to a franchisee model), we expect sales to rebound quickly when economies fully reopen, given the company’s strong brand perception. The company’s delivery and e-commerce capabilities are further strengths that we think will help lululemon to weather the downturn and accelerate rapidly as the pandemic subsides.
26
GLOBAL FUND |
The Fund’s performance was inhibited by an underweight stance in the strong-performing Health Care sector and an overweight stance in the Real Estate sector, which dropped during March as investors appeared to question the ability of businesses and homeowners to pay their rental liabilities.
Specifically, Real Estate holding Germany-based Aroundtown S.A. (“Aroundtown”) (-39%) performed well in 2019 and the first two months of 2020. Then, as concerns mounted about a growing recession and the question of when Europeans will travel again and stay at a hotel, Aroundtown’s stock languished with those of other commercial and hotel real estate operators. That said, Aroundtown has very low leverage, a large portfolio of unencumbered real estate assets, and a strong balance sheet. As the COVID-19 pandemic wanes, we believe the stock will recover and Aroundtown’s management will use its balance sheet to opportunistically grow the portfolio.
In addition, Uber Technologies, Inc. (“UBER”) slid -55% and was sold as the spread of COVID-19 led to the global population avoiding activities outside of their homes. Because UBER is highly reliant on consumer demand for transportation to work, the airport, or other commerce activities to drive revenue, the company’s business is understandably under pressure as the world largely stays at home. With continued uncertainty regarding when the world can return to normal activities, we believe that UBER’s stock will likely remain challenged.
Although active currency management is not a central facet of the Global Fund’s investment process, fluctuations in major world currencies can at times affect the Fund’s performance. During the period, the net effect of currency moves had a positive effect on Fund performance.
During the period, the Fund increased its allocations to the Information Technology, Real Estate, Consumer Discretionary, Financials, and Communication Services sectors. The Fund reduced its position in the Health Care and Industrials sectors. There were no significant changes to the Fund’s allocations to the Consumer Staples and Materials sectors.
Fiscal Period-End Investment Posture
As of March 31, 2020, the Fund’s primary economic sector allocations included Information Technology, Consumer Discretionary, and Communication Services. The Fund had no investments in the Energy or Utilities sectors.
The Fund’s most significant country allocation weightings at period-end, excluding short-term investments, were in the United States, Germany, China/Hong Kong, France, and the Netherlands. Country-level weightings generally should be considered a residual of the Fund’s stock selection process rather than a major, proactive facet of its investment strategy.
Sincerely,
THOMAS F. MARSICO
BRANDON A. GEISLER
ROBERT G. SUSMAN, CFA
PORTFOLIO MANAGERS
(1) | Total returns are based on net change in net asset value assuming reinvestment of distributions. Periodically, certain fees and expenses have been waived or reimbursed by the Adviser for the Global Fund. In the absence of such a waiver or reimbursement, the performance returns reflected would have been reduced. In accordance with the expense limitation and fee waiver agreement, the Adviser may recoup fees and expenses previously waived or reimbursed under certain parameters. Periodically, the Adviser has recouped such fees or expenses from the Global Fund, resulting in a lower performance return. Please see the Prospectus for more information. |
27
GLOBAL Fund Overview |
March 31, 2020 (Unaudited)
The Global Fund is a diversified portfolio and invests primarily in the common stocks of US and foreign companies that are selected for their long-term growth potential. The Fund may invest in an unlimited number of companies of any size that are economically tied to any countries or markets throughout the world, including securities of companies economically tied to emerging markets. Under normal market conditions, the Fund will invest significantly (generally, at least 40% of its net assets) in the securities of issuers organized or located outside the US or doing business outside the US or other foreign securities (unless market conditions are not deemed favorable by the Adviser, in which case the Fund generally will invest at least 30% of its assets in such foreign securities). The Fund will invest its assets in various regions and countries, including the US, that encompass not less than three different countries overall.
TOTAL ANNUAL OPERATING EXPENSES* 1.41% NET EXPENSES*† 1.45% | NET ASSETS $196,079,841 | NET ASSET VALUE PER SHARE $15.28 |
GROWTH OF $10,000(1)(2)(3) | PERFORMANCE COMPARISON(1) | |||
Average Annualized Returns | ||||
|
| |||
SECTOR ALLOCATION(4) | TOP FIVE HOLDINGS | |||
| ||||
Microsoft Corporation | 6.13% | |||
Amazon.com, Inc. | 5.80% | |||
Alibaba Group Holding Ltd. Spon. ADR | 5.74% | |||
Visa, Inc. - Cl. A | 4.46% | |||
Facebook, Inc. - Cl. A | 4.07% | |||
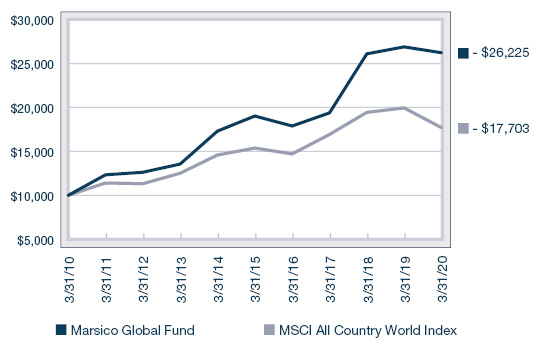
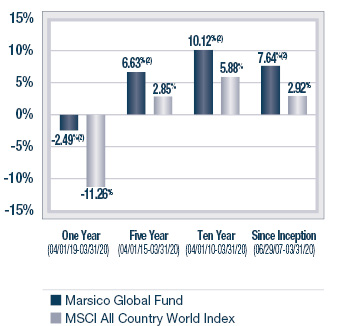
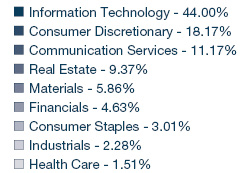
* | The Total Annual Operating Expenses and Net Expenses are reflective of the information disclosed in the Funds’ Prospectus dated January 31, 2020, as supplemented, and may differ from the expense ratios disclosed in this report. |
† | Marsico Capital Management, LLC (the “Adviser”) has entered into a written expense limitation and fee waiver agreement under which it has agreed to limit the total expenses of the Global Fund (excluding taxes, interest, acquired fund fees and expenses, litigation, extraordinary expenses, and brokerage and other transaction expenses relating to the purchase or sale of portfolio investments) to an annual rate of 1.45% of the Fund’s average net assets until January 31, 2021. This expense limitation and fee waiver agreement may be terminated by the Adviser at any time after January 31, 2021 upon 15 days prior notice to the Fund and its administrator. The Adviser may recoup from the Fund fees previously waived or expenses previously reimbursed by the Adviser with respect to that Fund pursuant to this agreement (or a previous expense limitation agreement) if: (1) such recoupment by the Adviser does not cause the Fund, at the time of recoupment, to exceed the lesser of (a) the expense limitation in effect at the time the relevant amount was waived and/or reimbursed, or (b) the expense limitation in effect at the time of the proposed recoupment, and (2) the recoupment is made within three years after the fiscal year end date as of which the amount to be waived or reimbursed was determined and the waiver or reimbursement occurred. |
(1) | The performance data quoted here represent past performance, and past performance is not a guarantee of future results. Investment return and principal value of an investment will fluctuate so that an investor’s shares, when redeemed, may be worth more or less than their original cost. Current performance may be lower or higher than the performance information quoted. To obtain performance information current to the most recent month-end, please call 888-860-8686 or visit marsicofunds.com. |
The performance included in the chart and graph does not reflect the deduction of taxes on Fund distributions or the redemption of Fund shares. |
All indices are unmanaged and investors cannot invest directly in an index. |
The MSCI ACWI (All Country World Index) Index is a free float-adjusted market capitalization index that is designed to measure equity market performance in the global developed and emerging markets. |
(2) | Periodically, certain fees and expenses have been waived or reimbursed by the Adviser for the Global Fund. In the absence of such a waiver or reimbursement, the performance returns reflected would have been reduced. In accordance with the expense limitation and fee waiver agreement, the Adviser may recoup fees and expenses previously waived or reimbursed under certain parameters. Periodically, the Adviser has recouped such fees or expenses from the Global Fund, resulting in a lower performance return. |
(3) | This chart assumes an initial investment of $10,000 made on March 31, 2010. Total returns are based on change in NAV, assuming reinvestment of distributions. |
(4) | Sector weightings represent the percentage of the Fund’s investments (excluding cash equivalents) in certain general sectors. These sectors may include more than one industry. The Fund’s portfolio composition is subject to change at any time. |
28
Schedule of Investments |
MARSICO GLOBAL FUND
SCHEDULE OF INVESTMENTS
March 31, 2020 (Unaudited)
Number | Value | Percent | ||||||||||
COMMON STOCKS | ||||||||||||
Aerospace & Defense | ||||||||||||
Lockheed Martin Corporation | 12,513 | $ | 4,241,281 | 2.16 | % | |||||||
Apparel, Accessories & Luxury Goods | ||||||||||||
Hermes International | 8,813 | 5,996,458 | 3.06 | |||||||||
lululemon athletica, inc.* | 27,734 | 5,256,980 | 2.68 | |||||||||
| 11,253,438 | 5.74 | ||||||||||
Application Software | ||||||||||||
Atlassian Corporation PLC - Cl. A* | 26,520 | 3,640,135 | 1.86 | |||||||||
RingCentral, Inc. - Cl. A* | 5,000 | 1,059,550 | 0.54 | |||||||||
salesforce.com, inc.* | 38,118 | 5,488,230 | 2.80 | |||||||||
SAP S.E. | 53,723 | 5,998,061 | 3.06 | |||||||||
| 16,185,976 | 8.26 | ||||||||||
Data Processing & Outsourced Services | ||||||||||||
PayPal Holdings, Inc.* | 35,999 | 3,446,544 | 1.76 | |||||||||
Square, Inc. - Cl. A* | 54,767 | 2,868,695 | 1.46 | |||||||||
Visa, Inc. - Cl. A | 54,241 | 8,739,310 | 4.46 | |||||||||
Wirecard A.G. | 38,826 | 4,374,529 | 2.23 | |||||||||
| 19,429,078 | 9.91 | ||||||||||
Financial Exchanges & Data | ||||||||||||
Deutsche Boerse A.G. | 29,063 | 3,992,788 | 2.03 | |||||||||
S&P Global, Inc. | 18,937 | 4,640,512 | 2.37 | |||||||||
| 8,633,300 | 4.40 | ||||||||||
Integrated Telecommunication Services | ||||||||||||
Cellnex Telecom SA | 86,564 | 3,926,754 | 2.00 | |||||||||
Interactive Media & Services | ||||||||||||
Facebook, Inc. - Cl. A* | 47,851 | 7,981,547 | �� | 4.07 | ||||||||
Scout24 A.G. | 53,030 | 3,170,074 | 1.62 | |||||||||
Tencent Holdings Ltd. ADR | 116,935 | 5,740,339 | 2.93 | |||||||||
| 16,891,960 | 8.62 | ||||||||||
Internet & Direct Marketing Retail | ||||||||||||
Alibaba Group Holding Ltd. Spon. ADR* | 57,888 | 11,258,058 | 5.74 | |||||||||
Amazon.com, Inc.* | 5,829 | 11,364,918 | 5.80 | |||||||||
| 22,622,976 | 11.54 | ||||||||||
Internet Services & Infrastructure | ||||||||||||
Okta, Inc.* | 7,773 | 950,327 | 0.48 | |||||||||
Shopify, Inc. - Cl. A* | 7,744 | 3,228,706 | 1.65 | |||||||||
Twilio, Inc. - Cl. A* | 42,833 | 3,833,125 | 1.96 | |||||||||
| 8,012,158 | 4.09 | ||||||||||
Metal & Glass Containers | ||||||||||||
Ball Corporation | 90,874 | 5,875,913 | 3.00 | |||||||||
Personal Products | ||||||||||||
L’Oreal S.A. | 21,664 | 5,606,873 | 2.86 | |||||||||
Pharmaceuticals | ||||||||||||
Roche Holding AG | 8,771 | 2,821,998 | 1.44 | |||||||||
Real Estate Operating Companies | ||||||||||||
Aroundtown S.A. | 1,195,621 | 5,984,623 | 3.05 | |||||||||
Semiconductor Equipment | ||||||||||||
ASML Holding N.V. - NY Reg. Shs. | 26,284 | 6,876,946 | 3.51 | % | ||||||||
Semiconductors | ||||||||||||
NVIDIA Corporation | 25,874 | 6,820,386 | 3.48 | |||||||||
Specialized REITs | ||||||||||||
Crown Castle International Corp. | 44,159 | 6,376,560 | 3.25 | |||||||||
Digital Realty Trust, Inc. | 36,739 | 5,103,414 | 2.60 | |||||||||
| 11,479,974 | 5.85 | ||||||||||
Specialty Chemicals | ||||||||||||
The Sherwin-Williams Company | 10,971 | 5,041,394 | 2.57 | |||||||||
Systems Software | ||||||||||||
Microsoft Corporation | 76,272 | 12,028,857 | 6.13 | |||||||||
ServiceNow, Inc.* | 20,862 | 5,978,632 | 3.05 | |||||||||
| 18,007,489 | 9.18 | ||||||||||
Technology Hardware, Storage & Peripherals | ||||||||||||
Apple, Inc. | 26,241 | 6,672,824 | 3.40 | |||||||||
TOTAL COMMON STOCKS | ||||||||||||
(Cost $151,414,857) | 186,385,341 | 95.06 | ||||||||||
SHORT-TERM INVESTMENTS | ||||||||||||
State Street Institutional Treasury Money Market Fund - Premier Class, 0.001% | 10,058,952 | 10,058,952 | 5.13 | |||||||||
TOTAL SHORT-TERM INVESTMENTS | ||||||||||||
(Cost $10,058,952) | 10,058,952 | 5.13 | ||||||||||
TOTAL INVESTMENTS | ||||||||||||
(Cost $161,473,809) | 196,444,293 | 100.19 | ||||||||||
Liabilities, Less Cash and Other Assets | (364,452 | ) | (0.19 | ) | ||||||||
NET ASSETS | $ | 196,079,841 | 100.00 | % | ||||||||
SUMMARY OF INVESTMENTS BY COUNTRY | ||||||||
Country | Market Value | Percent of | ||||||
Australia | $ | 3,640,135 | 1.85 | % | ||||
Canada | 3,228,706 | 1.64 | ||||||
China/Hong Kong | 16,998,397 | 8.65 | ||||||
France | 11,603,331 | 5.91 | ||||||
Germany | 23,520,075 | 11.97 | ||||||
Netherlands | 6,876,946 | 3.50 | ||||||
Spain | 3,926,754 | 2.00 | ||||||
Switzerland | 2,821,998 | 1.44 | ||||||
United States(1) | 123,827,951 | 63.04 | ||||||
| $ | 196,444,293 | 100.00 | % | |||||
(1) | Includes short-term securities. |
* | Non-income producing. |
See notes to financial statements. |
29
FINANCIAL STATEMENTS |
STATEMENTS OF ASSETS AND LIABILITIES
March 31, 2020 (Unaudited)
(Amounts in thousands) | MARSICO | MARSICO | ||||||
ASSETS | ||||||||
Investments, at value (cost $367,566, $176,373, $195,730, $45,896, and $161,474, respectively) | $ | 516,405 | $ | 244,912 | ||||
Foreign currency (cost $0, $0, $0, $10, and $0, respectively) | — | — | ||||||
Receivable for investments sold | — | 2,009 | ||||||
Receivable for capital stock sold | 11 | 11 | ||||||
Dividends receivable | 172 | 39 | ||||||
Prepaid expenses and other assets | 3,105 | 1,104 | ||||||
Total Assets | 519,693 | 248,075 | ||||||
LIABILITIES | ||||||||
Payable for investments purchased | — | 2,931 | ||||||
Payable for capital stock redeemed | 230 | 150 | ||||||
Payable to investment adviser | 337 | 166 | ||||||
Accrued trustees’ fees | 3,103 | 1,095 | ||||||
Accrued distribution fee | 1,692 | 1,175 | ||||||
Accrued transfer agent fees and expenses | 87 | 45 | ||||||
Accrued professional fees | 80 | 37 | ||||||
Accrued reporting, printing and postage expenses | 39 | 18 | ||||||
Accrued expenses and other liabilities | 45 | 32 | ||||||
Total Liabilities | 5,613 | 5,649 | ||||||
NET ASSETS | $ | 514,080 | $ | 242,426 | ||||
NET ASSETS CONSIST OF | ||||||||
Paid-in-capital | $ | 329,818 | $ | 160,141 | ||||
Total distributable earnings (deficit) | 184,262 | 82,285 | ||||||
NET ASSETS | $ | 514,080 | $ | 242,426 | ||||
SHARES OUTSTANDING, $0.001 par value | ||||||||
(Unlimited shares authorized) | 30,634 | 14,743 | ||||||
NET ASSET VALUE, REDEMPTION PRICE, AND OFFERING PRICE PER SHARE (NET ASSETS/SHARES OUTSTANDING)* | $ | 16.78 | $ | 16.44 | ||||
* | Not in thousands, based on unrounded net assets and shares outstanding. |
See notes to financial statements. |
30
FINANCIAL STATEMENTS |
MARSICO | MARSICO | MARSICO | |||||||||
| $ | 212,533 | $ | 46,700 | $ | 196,444 | ||||||
| — | 10 | — | |||||||||
| — | 353 | — | |||||||||
| 1 | 19 | 185 | |||||||||
| 69 | 217 | 51 | |||||||||
| 338 | 190 | 1,789 | |||||||||
| 212,941 | 47,489 | 198,469 | |||||||||
| — | 185 | — | |||||||||
| 52 | 14 | 54 | |||||||||
| 153 | 45 | 292 | |||||||||
| 326 | 176 | 1,780 | |||||||||
| 276 | 135 | 145 | |||||||||
| 56 | 14 | 38 | |||||||||
| 40 | 10 | 31 | |||||||||
| 20 | 4 | 13 | |||||||||
| 39 | 24 | 36 | |||||||||
| 962 | 607 | 2,389 | |||||||||
| $ | 211,979 | $ | 46,882 | $ | 196,080 | ||||||
| $ | 202,506 | $ | 50,366 | $ | 161,391 | ||||||
| 9,473 | (3,484 | ) | 34,689 | ||||||||
| $ | 211,979 | $ | 46,882 | $ | 196,080 | ||||||
| 7,864 | 3,018 | 12,830 | |||||||||
| $ | 26.96 | $ | 15.53 | $ | 15.28 | ||||||
31
FINANCIAL STATEMENTS |
STATEMENTS OF OPERATIONS
FOR THE SIX-MONTH PERIOD ENDED March 31, 2020 (Unaudited)
(Amounts in thousands) | MARSICO | MARSICO | ||||||
INVESTMENT INCOME | ||||||||
Dividends (net of $0, $0, $5, $40, and $24, respectively, of non-reclaimable foreign withholding taxes) | $ | 2,574 | $ | 1,142 | ||||
Total Investment Income | 2,574 | 1,142 | ||||||
EXPENSES | ||||||||
Investment advisory fees | 2,194 | 1,066 | ||||||
Distribution fees | — | 335 | ||||||
Transfer agent fees and expenses | 274 | 132 | ||||||
Professional fees | 152 | 71 | ||||||
Fund administration fees | 79 | 63 | ||||||
Trustees’ fees and expenses | 69 | (1) | 22 | (1) | ||||
Custody and fund accounting fees | 60 | 43 | ||||||
Reporting, printing, and postage expenses | 47 | 25 | ||||||
Miscellaneous | 43 | 21 | ||||||
Federal and state registration fees | 15 | 14 | ||||||
Total Expenses | 2,933 | 1,792 | ||||||
Recoupment of previously waived expenses | — | — | ||||||
Less waiver of expenses and expenses paid indirectly | — | — | ||||||
Net Expenses | 2,933 | 1,792 | ||||||
NET INVESTMENT LOSS | (359 | ) | (650 | ) | ||||
REALIZED AND UNREALIZED GAIN (LOSS) | ||||||||
Net realized gain (loss) on investments | 38,427 | 16,087 | ||||||
Net realized loss on foreign currency transactions | — | — | ||||||
Change in unrealized appreciation (depreciation) on investments, foreign currency translations, and non-interested trustees’ deferred compensation | (48,207 | ) | (24,181 | ) | ||||
Net Loss on Investments | (9,780 | ) | (8,094 | ) | ||||
NET DECREASE IN NET ASSETS RESULTING FROM OPERATIONS | $ | (10,139 | ) | $ | (8,744 | ) | ||
(1) | Amounts include Trustees’ fees and expenses and the mark to market unrealized appreciation (depreciation) during the period for shares held in the Non-Interested Trustees’ Deferred Fee Plan, as more fully described in Note 2(g) in the Notes to Financial Statements. |
Trustees’ | Unrealized | |||||||
Focus Fund | $ | 68,698 | $ | 232 | ||||
Growth Fund | 31,941 | (9,645 | ) | |||||
21stCentury Fund | 34,345 | (56,620 | ) | |||||
International Opportunities Fund | 6,544 | (22,889 | ) | |||||
Global Fund | 26,719 | (43,191 | ) | |||||
* | Not in thousands. |
See notes to financial statements. |
32
FINANCIAL STATEMENTS |
MARSICO | MARSICO | MARSICO | |||||||||
| $ | 771 | $ | 384 | $ | 684 | ||||||
| 771 | 384 | 684 | |||||||||
| 1,081 | 217 | 920 | |||||||||
| 340 | 68 | 288 | |||||||||
| 181 | 44 | 157 | |||||||||
| 76 | 18 | 61 | |||||||||
| 64 | 29 | 71 | |||||||||
| (22 | )(1) | (16 | )(1) | (16 | )(1) | ||||||
| 50 | 59 | 65 | |||||||||
| 25 | 10 | 21 | |||||||||
| 21 | 5 | 19 | |||||||||
| 11 | 9 | 13 | |||||||||
| 1,827 | 443 | 1,599 | |||||||||
| — | — | 69 | |||||||||
| — | (35 | ) | — | ||||||||
| 1,827 | 408 | 1,668 | |||||||||
| (1,056 | ) | (24 | ) | (984 | ) | ||||||
| (4,067 | ) | 399 | 5,298 | ||||||||
| — | (255 | ) | (1,382 | ) | |||||||
| (41,070 | ) | (6,901 | ) | (12,293 | ) | ||||||
| (45,137 | ) | (6,757 | ) | (8,377 | ) | ||||||
| $ | (46,193 | ) | $ | (6,781 | ) | $ | (9,361 | ) | |||
33
FINANCIAL STATEMENTS |
STATEMENTS OF CHANGES IN NET ASSETS
MARSICO | MARSICO | |||||||||||||||
(Amounts in thousands) | Six-Month | Year | Six-Month | Year | ||||||||||||
OPERATIONS: | ||||||||||||||||
Net investment income (loss) | $ | (359 | ) | $ | (1,064 | ) | $ | (650 | ) | $ | (1,037 | ) | ||||
Net realized gain (loss) on investments | 38,427 | 44,005 | 16,087 | 25,286 | ||||||||||||
Net realized gain (loss) on foreign currency transactions | — | 30 | — | (41 | ) | |||||||||||
Change in unrealized appreciation (depreciation) on investments, foreign currency translations, and non-interested trustees’ deferred compensation | (48,207 | ) | (31,757 | ) | (24,181 | ) | (18,902 | ) | ||||||||
Net increase (decrease) in net assets resulting from operations | (10,139 | ) | 11,214 | (8,744 | ) | 5,306 | ||||||||||
DISTRIBUTIONS: | (43,408 | ) | (51,626 | ) | (25,236 | ) | (29,351 | ) | ||||||||
CAPITAL SHARE TRANSACTIONS: | ||||||||||||||||
Proceeds from sales of shares | 17,803 | 26,190 | 20,785 | 6,134 | ||||||||||||
Proceeds from reinvestment of distributions | 42,039 | 49,333 | 24,193 | 28,064 | ||||||||||||
Redemption of shares | (46,860 | ) | (86,480 | ) | (27,877 | ) | (49,788 | ) | ||||||||
Net increase (decrease) from capital share transactions | 12,982 | (10,957 | ) | 17,101 | (15,590 | ) | ||||||||||
TOTAL INCREASE (DECREASE) IN NET ASSETS | (40,565 | ) | (51,369 | ) | (16,879 | ) | (39,635 | ) | ||||||||
NET ASSETS: | ||||||||||||||||
Beginning of Period | 554,645 | 606,014 | 259,305 | 298,940 | ||||||||||||
End of Period | $ | 514,080 | $ | 554,645 | $ | 242,426 | $ | 259,305 | ||||||||
TRANSACTIONS IN SHARES: | ||||||||||||||||
Shares sold | 1,033 | 1,522 | 1,082 | 343 | ||||||||||||
Shares issued in reinvestment of distributions | 2,280 | 3,105 | 1,345 | 1,763 | ||||||||||||
Shares redeemed | (2,522 | ) | (4,824 | ) | (1,510 | ) | (2,730 | ) | ||||||||
NET INCREASE (DECREASE) | 791 | (197 | ) | 917 | (624 | ) | ||||||||||
See notes to financial statements. |
34
FINANCIAL STATEMENTS |
MARSICO | MARSICO | MARSICO | ||||||||||||||||||||||||
Six-Month | Year | Six-Month | Year | Six-Month | Year | |||||||||||||||||||||
| $ | (1,056 | ) | $ | (1,736 | ) | $ | (24 | ) | $ | 78 | $ | (984 | ) | $ | (1,330 | ) | ||||||||||
| (4,067 | ) | 11,833 | 399 | 2,299 | 5,298 | 2,142 | ||||||||||||||||||||
| — | — | (255 | ) | (479 | ) | (1,382 | ) | (2,347 | ) | |||||||||||||||||
| (41,070 | ) | 7,337 | (6,901 | ) | (2,783 | ) | (12,293 | ) | (16,018 | ) | ||||||||||||||||
| (46,193 | ) | 17,434 | (6,781 | ) | (885 | ) | (9,361 | ) | (17,553 | ) | ||||||||||||||||
| (8,884 | ) | (11,665 | ) | (2,281 | ) | (4,245 | ) | — | (2,537 | ) | ||||||||||||||||
| 3,115 | 16,696 | 4,467 | 3,123 | 4,637 | 13,813 | |||||||||||||||||||||
| 8,549 | 11,079 | 2,211 | 4,007 | — | 2,299 | |||||||||||||||||||||
| (27,387 | ) | (23,632 | ) | (4,045 | ) | (10,841 | ) | (28,089 | ) | (53,643 | ) | |||||||||||||||
| (15,723 | ) | 4,143 | 2,633 | (3,711 | ) | (23,452 | ) | (37,531 | ) | |||||||||||||||||
| (70,800 | ) | 9,912 | (6,429 | ) | (8,841 | ) | (32,813 | ) | (57,621 | ) | ||||||||||||||||
| 282,779 | 272,867 | 53,311 | 62,152 | 228,893 | 286,514 | |||||||||||||||||||||
| $ | 211,979 | $ | 282,779 | $ | 46,882 | $ | 53,311 | $ | 196,080 | $ | 228,893 | |||||||||||||||
| 96 | 516 | 235 | 173 | 270 | 897 | |||||||||||||||||||||
| 258 | 405 | 118 | 257 | — | 163 | |||||||||||||||||||||
| (880 | ) | (756 | ) | (221 | ) | (616 | ) | (1,695 | ) | (3,499 | ) | |||||||||||||||
| (526 | ) | 165 | 132 | (186 | ) | (1,425 | ) | (2,439 | ) | |||||||||||||||||
35
FINANCIAL STATEMENTS |
FINANCIAL HIGHLIGHTS
MARSICO FOCUS FUND | |||||||||||||||||||||||||
For a Fund Share Outstanding Throughout the Period | Six-Month | Year | Year | Year | Year | Year | |||||||||||||||||||
Net Asset Value, Beginning of Period | $ | 18.59 | $ | 20.17 | $ | 19.63 | $ | 15.96 | $ | 18.83 | $ | 22.41 | |||||||||||||
Income from Investment Operations: | |||||||||||||||||||||||||
Net investment loss | (0.01 | ) | (0.04 | ) | (0.09 | ) | (0.17 | ) | (0.13 | ) | (0.10 | ) | |||||||||||||
Net realized and unrealized gains (losses) on investments | (0.31 | ) | 0.25 | 3.82 | 3.84 | 1.25 | (0.62 | ) | |||||||||||||||||
Total from investment operations | (0.32 | ) | 0.21 | 3.73 | 3.67 | 1.12 | (0.72 | ) | |||||||||||||||||
Distributions & Other: | |||||||||||||||||||||||||
Net realized gains | (1.49 | ) | (1.79 | ) | (3.19 | ) | — | (3.99 | ) | (2.86 | ) | ||||||||||||||
Total distributions and other | (1.49 | ) | (1.79 | ) | (3.19 | ) | — | (3.99 | ) | (2.86 | ) | ||||||||||||||
Net Asset Value, End of Period | $ | 16.78 | $ | 18.59 | $ | 20.17 | $ | 19.63 | $ | 15.96 | $ | 18.83 | |||||||||||||
Total Return | (2.44 | )%(1) | 2.52 | % | 21.78 | % | 22.99 | % | 5.75 | % | (4.15 | )% | |||||||||||||
Supplemental Data and Ratios: | |||||||||||||||||||||||||
Net assets, end of period (000s) | $ | 514,080 | $ | 554,645 | $ | 606,014 | $ | 559,657 | $ | 613,870 | $ | 788,851 | |||||||||||||
Ratio of expenses to average net assets, less waivers and before expenses paid indirectly, plus recoupment of previously waived fees or expenses paid | 1.02 | %(2) | 1.02 | % | 1.21 | % | 1.37 | % | 1.29 | % | 1.31 | % | |||||||||||||
Ratio of net investment loss to average net assets, net of waivers, recoupment of previously waived fees or expenses paid and expenses paid indirectly | (0.13 | )%(2) | (0.19 | )% | (0.48 | )% | (0.62 | )% | (0.63 | )% | (0.45 | )% | |||||||||||||
Ratio of expenses to average net assets, before waivers, recoupment of previously waived fees or expenses paid and expenses paid indirectly | 1.02 | %(2) | 1.02 | % | 1.21 | % | 1.37 | % | 1.29 | % | 1.31 | % | |||||||||||||
Ratio of net investment loss to average net assets, before waivers, recoupment of previously waived fees or expenses paid and expenses paid indirectly | (0.13 | )%(2) | (0.19 | )% | (0.48 | )% | (0.62 | )% | (0.63 | )% | (0.45 | )% | |||||||||||||
Portfolio turnover rate | 29 | %(1) | 42 | % | 53 | % | 67 | % | 45 | % | 68 | % | |||||||||||||
(1) | Not annualized. |
(2) | Annualized. |
See notes to financial statements. |
36
FINANCIAL STATEMENTS |
MARSICO | MARSICO | ||||||||||||||||||||||||||||||||||||||||||||||||
Six-Month | Year | Year | Year | Year | Year | Six-Month | Year | Year | Year | Year | Year | ||||||||||||||||||||||||||||||||||||||
| $ | 18.75 | $ | 20.69 | $ | 18.47 | $ | 15.54 | $ | 20.11 | $ | 23.63 | $ | 33.70 | $ | 33.18 | $ | 26.19 | $ | 22.04 | $ | 20.38 | $ | 20.90 | ||||||||||||||||||||||||||
| (0.03 | ) | (0.08 | ) | (0.09 | ) | (0.14 | ) | (0.13 | ) | (0.15 | ) | (0.15 | ) | (0.20 | ) | (0.25 | ) | (0.29 | ) | (0.29 | ) | (0.21 | ) | ||||||||||||||||||||||||||
| (0.41 | ) | 0.34 | 4.06 | 3.19 | 1.33 | (0.62 | ) | (5.50 | ) | 2.15 | 7.24 | 4.44 | 1.95 | (0.31 | ) | ||||||||||||||||||||||||||||||||||
| (0.44 | ) | 0.26 | 3.97 | 3.05 | 1.20 | (0.77 | ) | (5.65 | ) | 1.95 | 6.99 | 4.15 | 1.66 | (0.52 | ) | ||||||||||||||||||||||||||||||||||
| (1.87 | ) | (2.20 | ) | (1.75 | ) | (0.12 | ) | (5.77 | ) | (2.75 | ) | (1.09 | ) | (1.43 | ) | — | — | — | — | ||||||||||||||||||||||||||||||
| (1.87 | ) | (2.20 | ) | (1.75 | ) | (0.12 | ) | (5.77 | ) | (2.75 | ) | (1.09 | ) | (1.43 | ) | — | — | — | — | ||||||||||||||||||||||||||||||
| $ | 16.44 | $ | 18.75 | $ | 20.69 | $ | 18.47 | $ | 15.54 | $ | 20.11 | $ | 26.96 | $ | 33.70 | $ | 33.18 | $ | 26.19 | $ | 22.04 | $ | 20.38 | ||||||||||||||||||||||||||
| (3.18 | )%(1) | 3.16 | % | 23.10 | % | 19.85 | % | 5.94 | % | (4.10 | )% | (17.36 | )%(1) | 6.88 | % | 26.69 | % | 18.83 | % | 8.15 | % | (2.49 | )% | ||||||||||||||||||||||||||
| $ | 242,426 | $ | 259,305 | $ | 298,940 | $ | 266,922 | $ | 288,213 | $ | 410,442 | $ | 211,979 | $ | 282,779 | $ | 272,867 | $ | 234,322 | $ | 234,780 | $ | 268,384 | ||||||||||||||||||||||||||
| 1.34 | %(2) | 1.27 | % | 1.25 | % | 1.42 | % | 1.37 | % | 1.35 | % | 1.34 | %(2) | 1.30 | % | 1.21 | % | 1.40 | % | 1.41 | % | 1.38 | % | ||||||||||||||||||||||||||
| (0.49 | )%(2) | (0.40 | )% | (0.46 | )% | (0.53 | )% | (0.61 | )% | (0.52 | )% | (0.78 | )%(2) | (0.66 | )% | (0.74 | )% | (0.96 | )% | (1.01 | )% | (0.78 | )% | ||||||||||||||||||||||||||
| 1.34 | %(2) | 1.27 | % | 1.25 | % | 1.42 | % | 1.37 | % | 1.35 | % | 1.34 | %(2) | 1.30 | % | 1.21 | % | 1.40 | % | 1.41 | % | 1.38 | % | ||||||||||||||||||||||||||
| �� | |||||||||||||||||||||||||||||||||||||||||||||||||
| (0.49 | )%(2) | (0.40 | )% | (0.46 | )% | (0.53 | )% | (0.61 | )% | (0.52 | )% | (0.78 | )%(2) | (0.66 | )% | (0.74 | )% | (0.96 | )% | (1.01 | )% | (0.78 | )% | ||||||||||||||||||||||||||
| 45 | %(1) | 39 | % | 40 | % | 50 | % | 52 | % | 81 | % | 25 | %(1) | 34 | % | 90 | % | 28 | % | 44 | % | 94 | % | ||||||||||||||||||||||||||
37
FINANCIAL STATEMENTS |
FINANCIAL HIGHLIGHTS
MARSICO | |||||||||||||||||||||||||
For a Fund Share Outstanding Throughout the Period | Six-Month | Year | Year | Year | Year | Year | |||||||||||||||||||
Net Asset Value, Beginning of Period | $ | 18.47 | $ | 20.23 | $ | 19.30 | $ | 15.64 | $ | 14.51 | $ | 14.72 | |||||||||||||
Income from Investment Operations: | |||||||||||||||||||||||||
Net investment income (loss) | 0.01 | 0.01 | (0.09 | ) | (0.16 | ) | (0.20 | ) | (0.21 | ) | |||||||||||||||
Net realized and unrealized gains (losses) on investments | (2.14 | ) | (0.35 | ) | 1.02 | 3.82 | 1.33 | — | (1) | ||||||||||||||||
Total from investment operations | (2.13 | ) | (0.34 | ) | 0.93 | 3.66 | 1.13 | (0.21 | ) | ||||||||||||||||
Distributions & Other: | |||||||||||||||||||||||||
Net investment income | (0.07 | ) | — | — | — | — | — | ||||||||||||||||||
Net realized gains | (0.74 | ) | (1.42 | ) | — | — | — | — | |||||||||||||||||
Total distributions and other | (0.81 | ) | (1.42 | ) | — | — | — | — | |||||||||||||||||
Net Asset Value, End of Period | $ | 15.53 | $ | 18.47 | $ | 20.23 | $ | 19.30 | $ | 15.64 | $ | 14.51 | |||||||||||||
Total Return | (12.32 | )%(2) | (0.37 | )% | 4.82 | % | 23.40 | % | 7.79 | % | (1.43 | )% | |||||||||||||
Supplemental Data and Ratios: | |||||||||||||||||||||||||
Net assets, end of period (000s) | $ | 46,882 | $ | 53,311 | $ | 62,152 | $ | 63,789 | $ | 62,833 | $ | 89,141 | |||||||||||||
Ratio of expenses to average net assets, less waivers and before expenses paid indirectly, plus recoupment of previously waived fees or expenses paid | 1.50 | %(3) | 1.50 | % | 1.52 | % | 1.60 | % | 1.60 | % | 1.60 | % | |||||||||||||
Ratio of net investment income (loss) to average net assets, net of waivers, recoupment of previously waived fees or expenses paid and expenses paid indirectly | (0.09 | )%(3) | 0.14 | % | (0.33 | )% | (0.77 | )% | (0.71 | )% | (0.86 | )% | |||||||||||||
Ratio of expenses to average net assets, before waivers, recoupment of previously waived fees or expenses paid and expenses paid indirectly | 1.63 | %(3) | 1.72 | % | 1.59 | % | 1.79 | % | 1.78 | % | 1.63 | % | |||||||||||||
Ratio of net investment loss to average net assets, before waivers, recoupment of previously waived fees or expenses paid and expenses paid indirectly | (0.22 | )%(3) | (0.08 | )% | (0.40 | )% | (0.96 | )% | (0.89 | )% | (0.89 | )% | |||||||||||||
Portfolio turnover rate | 35 | %(2) | 57 | % | 33 | % | 108 | % | 223 | % | 217 | % | |||||||||||||
(1) | Less than $0.01. |
(2) | Not annualized. |
(3) | Annualized. |
See notes to financial statements. |
38
FINANCIAL STATEMENTS |
MARSICO | |||||||||||||||||||||||
Six-Month | Year | Year | Year | Year | Year | ||||||||||||||||||
| $ | 16.06 | $ | 17.16 | $ | 15.13 | $ | 12.03 | $ | 12.37 | $ | 14.45 | ||||||||||||
| (0.09 | ) | (0.12 | ) | 0.11 | (0.14 | ) | (0.16 | ) | (0.10 | ) | |||||||||||||
| (0.69 | ) | (0.82 | ) | 3.26 | 3.24 | 1.14 | (0.32 | ) | |||||||||||||||
| (0.78 | ) | (0.94 | ) | 3.37 | 3.10 | 0.98 | (0.42 | ) | |||||||||||||||
| — | — | — | — | — | — | ||||||||||||||||||
| — | (0.16 | ) | (1.34 | ) | — | (1.32 | ) | (1.66 | ) | ||||||||||||||
| — | (0.16 | ) | (1.34 | ) | — | (1.32 | ) | (1.66 | ) | ||||||||||||||
| $ | 15.28 | $ | 16.06 | $ | 17.16 | $ | 15.13 | $ | 12.03 | $ | 12.37 | ||||||||||||
| (4.86 | )%(2) | (5.36 | )% | 23.94 | % | 25.77 | % | 8.05 | % | (3.51 | )% | ||||||||||||
| $ | 196,080 | $ | 228,893 | $ | 286,514 | $ | 44,493 | $ | 44,273 | $ | 66,612 | ||||||||||||
| 1.45 | %(3) | 1.45 | % | 1.48 | % | 1.60 | % | 1.60 | % | 1.60 | % | ||||||||||||
| (0.86 | )%(3) | (0.55 | )% | (0.87 | )% | (0.82 | )% | (0.60 | )% | (0.80 | )% | ||||||||||||
| 1.39 | %(3) | 1.41 | % | 1.59 | % | 1.80 | % | 1.69 | % | 1.54 | % | ||||||||||||
| (0.80 | )%(3) | (0.51 | )% | (0.98 | )% | (1.02 | )% | (0.69 | )% | (0.74 | )% | ||||||||||||
| 40 | %(2) | 67 | % | 89 | % | 79 | % | 82 | % | 110 | % | ||||||||||||
39
NOTES TO FINANCIAL STATEMENTS |
NOTES TO FINANCIAL STATEMENTS March 31, 2020 (Unaudited)
1. | Organization |
The Marsico Investment Fund (the “Trust”) was organized on October 1, 1997, as a Delaware statutory trust and is registered under the Investment Company Act of 1940 (the “1940 Act”) as an open-end management investment company. The Focus Fund, Growth Fund,21st Century Fund, International Opportunities Fund, and Global Fund (collectively, the “Funds”) are separate investment portfolios of the Trust. The Focus Fund is a non-diversified fund and the Growth Fund, the21st Century Fund, the International Opportunities Fund, and the Global Fund are diversified funds. The Focus Fund and Growth Fund commenced operations on December 31, 1997, the21st Century Fund commenced operations on February 1, 2000, the International Opportunities Fund commenced operations on June 30, 2000, and the Global Fund commenced operations on June 29, 2007. Trustees and officers of the Trust and employees of Marsico Capital Management, LLC (the “Adviser”) own approximately 6%, 5%, 6%, and 10% of the Focus Fund’s, Growth Fund’s, International Opportunities Fund’s, and Global Fund’s outstanding shares, respectively, as of March 31, 2020.
2. | Significant Accounting Policies |
The Funds qualify as investment companies under Accounting Standards Update No. 2013-08, Accounting Standard Codification Topic 946, Financial Services — Investment Companies (“ASC 946”). The following is a summary of significant accounting policies consistently followed by the Funds in the preparation of their financial statements. These policies are in conformity with Generally Accepted Accounting Principles (“GAAP”) in the United States of America for investment companies and follow the accounting guidance provided in ASC 946. The presentation of financial statements in conformity with GAAP requires management to make estimates and assumptions that affect the reported amounts and disclosures of assets and liabilities at the date of the financial statements and the reported amounts and disclosures of income and expenses during the reporting period. Actual results could differ from those estimates.
(a) | Investment Valuation — A security traded on a recognized stock exchange is generally valued at the last sale price prior to the closing of the principal exchange on which the security is traded. Securities traded on NASDAQ generally will be valued at the NASDAQ Official Closing Price. If no sale price is reported on the valuation date, the most current bid price will generally be used, with the exception of short option positions which will generally utilize the most current ask price. Other securities for which over-the-counter market quotations are readily available are generally valued at the last sale price. Debt securities that will mature in more than 60 days are generally valued at their bid prices furnished by a pricing service approved by the Funds’ Board of Trustees and subject to review pursuant to procedures established by, and under the general supervision of, the Board of Trustees. Debt securities that will mature in 60 days or less are valued at amortized cost, if it approximates market value. Any securities for which market quotations are not readily available are valued at their fair value as determined in good faith by the Adviser in accordance with procedures established by, and under the general supervision of, the Funds’ Board of Trustees. The Funds may use pricing services to assist in determining market value. The Board of Trustees has authorized the use of a pricing service to assist the Funds in valuing certain equity securities listed or traded on foreign security exchanges in the Funds’ portfolios in certain circumstances where there is a significant change in the value of related US-traded securities, as represented by, for example, the S&P 500 Index. |
“Fair Value Measurements and Disclosures” (the “Fair Value Statement”) defines fair value, establishes a framework for measuring fair value in GAAP, and expands disclosures about fair value measurements. Under the Fair Value Statement, various inputs are used in determining the value of the Funds’ investments.
These inputs are summarized into three broad levels and described below:
● | Level 1 – quoted prices in active markets for identical investments |
● | Level 2 – other significant observable inputs (including quoted prices for similar investments, interest rates, and evaluated quotations obtained from pricing services) |
● | Level 3 – significant unobservable inputs (including the Fund’s assumptions that market participants would use in determining the fair value of investments) |
40
NOTES TO FINANCIAL STATEMENTS |
The inputs or methodology used for valuing investments are not an indication of the risk associated with investing in those investments. Changes in valuation techniques may result in transfers between the levels during the reporting period. In accordance with procedures established by, and under the general supervision of, the Funds’ Board of Trustees, certain equity securities listed or traded on foreign security exchanges in the Funds’ portfolios that had a fair valuation adjustment factor applied to their equity prices at the end of the reporting period are categorized as Level 2. There were no transfers into or out of Level 3 during the reporting period. The following is a summary of the fair values of the Funds’ investments in each category and economic sector as of March 31, 2020:
Fund Investments by | Level 1 | Level 2 | Level 3 | Total | ||||||||||||
Marsico Focus Fund | ||||||||||||||||
Assets | ||||||||||||||||
Common Stocks | ||||||||||||||||
Communication Services | $ | 46,924,262 | $ | — | $ | — | $ | 46,924,262 | ||||||||
Consumer Discretionary | 118,526,283 | — | — | 118,526,283 | ||||||||||||
Financials | 20,002,451 | — | — | 20,002,451 | ||||||||||||
Health Care | 22,343,107 | — | — | 22,343,107 | ||||||||||||
Industrials | 20,098,379 | — | — | 20,098,379 | ||||||||||||
Information Technology | 216,026,584 | — | — | 216,026,584 | ||||||||||||
Materials | 31,092,027 | — | — | 31,092,027 | ||||||||||||
Real Estate | 17,294,066 | — | — | 17,294,066 | ||||||||||||
Short-term Investments | 24,098,044 | — | — | 24,098,044 | ||||||||||||
| $ | 516,405,203 | |||||||||||||||
Marsico Growth Fund | ||||||||||||||||
Assets | ||||||||||||||||
Common Stocks | ||||||||||||||||
Communication Services | $ | 22,417,784 | $ | — | $ | — | $ | 22,417,784 | ||||||||
Consumer Discretionary | 41,627,260 | — | — | 41,627,260 | ||||||||||||
Financials | 6,355,372 | — | — | 6,355,372 | ||||||||||||
Health Care | 18,897,434 | — | — | 18,897,434 | ||||||||||||
Industrials | 12,010,016 | — | — | 12,010,016 | ||||||||||||
Information Technology | 104,999,372 | — | — | 104,999,372 | ||||||||||||
Materials | 11,973,616 | — | — | 11,973,616 | ||||||||||||
Real Estate | 9,920,713 | — | — | 9,920,713 | ||||||||||||
Short-term Investments | 16,710,360 | — | — | 16,710,360 | ||||||||||||
| $ | 244,911,927 | |||||||||||||||
Marsico21st Century Fund | ||||||||||||||||
Assets | ||||||||||||||||
Common Stocks | ||||||||||||||||
Communication Services | $ | 5,209,390 | $ | — | $ | — | $ | 5,209,390 | ||||||||
Consumer Discretionary | 27,348,515 | — | �� | — | 27,348,515 | |||||||||||
Financials | 8,501,608 | — | — | 8,501,608 | ||||||||||||
Health Care | 33,549,931 | — | — | 33,549,931 | ||||||||||||
Industrials | 28,791,215 | — | — | 28,791,215 | ||||||||||||
Information Technology | 81,403,160 | — | — | 81,403,160 | ||||||||||||
Materials | 10,421,613 | — | — | 10,421,613 | ||||||||||||
Real Estate | 10,282,442 | — | — | 10,282,442 | ||||||||||||
Short-term Investments | 7,025,062 | — | — | 7,025,062 | ||||||||||||
| $ | 212,532,936 | |||||||||||||||
Marsico International Opportunities Fund | ||||||||||||||||
Assets | ||||||||||||||||
Common Stocks | ||||||||||||||||
Communication Services | $ | 594,796 | $ | 6,234,961 | $ | — | $ | 6,829,757 | ||||||||
Consumer Discretionary | 2,608,847 | 2,853,486 | — | 5,462,333 | ||||||||||||
Consumer Staples | — | 4,534,021 | — | 4,534,021 | ||||||||||||
Energy | — | 505,458 | — | 505,458 | ||||||||||||
Financials | 292,488 | 5,487,549 | — | 5,780,037 | ||||||||||||
Health Care | 238,891 | 7,650,381 | — | 7,889,272 | ||||||||||||
Industrials | 108,622 | 4,241,021 | — | 4,349,643 | ||||||||||||
Information Technology | 2,246,299 | 4,041,361 | — | 6,287,660 | ||||||||||||
Materials | — | 1,216,355 | — | 1,216,355 | ||||||||||||
Real Estate | 347,005 | 1,328,572 | — | 1,675,577 | ||||||||||||
Short-term Investments | 2,169,811 | — | — | 2,169,811 | ||||||||||||
| $ | 46,699,924 | |||||||||||||||
41
NOTES TO FINANCIAL STATEMENTS |
NOTES TO FINANCIAL STATEMENTS March 31, 2020 (Unaudited) (continued)
Fund Investments by | Level 1 | Level 2 | Level 3 | Total | ||||||||||||
Marsico Global Fund | ||||||||||||||||
Assets | ||||||||||||||||
Common Stocks | ||||||||||||||||
Communication Services | $ | 13,721,886 | $ | 7,096,828 | $ | — | $ | 20,818,714 | ||||||||
Consumer Discretionary | 27,879,956 | 5,996,458 | — | 33,876,414 | ||||||||||||
Consumer Staples | — | 5,606,873 | — | 5,606,873 | ||||||||||||
Financials | 4,640,512 | 3,992,788 | — | 8,633,300 | ||||||||||||
Health Care | — | 2,821,998 | — | 2,821,998 | ||||||||||||
Industrials | 4,241,281 | — | — | 4,241,281 | ||||||||||||
Information Technology | 71,632,267 | 10,372,590 | — | 82,004,857 | ||||||||||||
Materials | 10,917,307 | — | — | 10,917,307 | ||||||||||||
Real Estate | 11,479,974 | 5,984,623 | — | 17,464,597 | ||||||||||||
Short-term Investments | 10,058,952 | — | — | 10,058,952 | ||||||||||||
| $ | 196,444,293 | |||||||||||||||
(b) | Expenses — The Funds are charged for those expenses that are directly attributable to each Fund, such as advisory and custodial fees. Expenses that are not directly attributable to a Fund are typically allocated among the Funds in proportion to their respective net assets and are in some cases allocated based on other factors. The Funds’ expenses may be reduced by advisory fee waivers, brokerage credits and uninvested cash balances earning interest or credits. Such credits are included in “Less waiver of expenses and expenses paid indirectly” on the Statements of Operations. |
Brokerage commissions may be paid to certain brokers which reduce transfer agent fees and expenses. For the six-month period ended March 31, 2020, the Funds received no such brokerage commission credits. The Funds received earnings credits on certain cash account balances which reduced transfer agent fees and expenses by less than $1 (in thousands) for each of the Focus Fund, Growth Fund,21st Century Fund, International Opportunities Fund, and Global Fund for the six-month period ended March 31, 2020. Brokerage commission credits and earnings credits (if any) are included in “Less waiver of expenses and expenses paid indirectly” on the Statements of Operations.
(c) | Federal Income Taxes — Each Fund intends to comply with the requirements of the Internal Revenue Code of 1986, as amended (the “Internal Revenue Code”), necessary to continue to qualify as a regulated investment company and to make the requisite distributions of income to its shareholders which will be sufficient to relieve it from all or substantially all federal and state income taxes. Certain Funds may utilize earnings and profits on redemption of shares as part of the dividends paid deduction. |
(d) | Distributions to Shareholders — Dividends from net investment income and net realized capital gains, if any, will be declared and paid at least annually. Distributions to shareholders are recorded on the ex-dividend date. Each Fund may periodically make reclassifications among certain of its capital accounts as a result of the timing and characterization of certain income and capital gains distributions determined in accordance with federal tax regulations, which may differ from GAAP. These reclassifications are due to differing treatment for items such as foreign currency transactions, passive foreign investment companies and net investment losses. |
The Funds at times may invest in real estate investment trusts (“REITs”). REITs generally pay dividends to their investors based upon cash available from their operations and this amount may differ significantly from the REITs’ actual earnings and profits (“E&P”) determined for income tax purposes. It is common for these dividends to exceed the REITs’ taxable E&P, resulting in the excess portion of such dividends eventually being designated as a return of capital. Determination of the tax character of dividends made by REITs is typically performed by the REIT several months subsequent to the payment of the dividend. Therefore, due to timing issues, the Funds may be in a position of being required to calculate and pay required distribution amounts to their shareholders based on the best information available from the REITs, which may be prior to the final determination of the REITs’ taxable E&P, and it is possible that a portion of the Funds’ distribution amounts could include a return of capital to shareholders for federal income tax purposes.
(e) | Foreign Currency Translation — The accounting records of the Funds are maintained in US dollars. For valuation purposes, values of securities denominated in foreign currencies are translated into US dollars at 4:00 p.m. Eastern Time. Amounts related to the purchase and sale of foreign securities and investment income are translated at the rates of exchange prevailing on the respective dates of such transactions. |
Reported realized gains and losses on foreign currency transactions arise from sales of portfolio securities, forward foreign currency contracts, currency gains or losses realized between the trade and settlement dates on securities transactions, and the difference between the amounts of dividends, interest, and foreign withholding taxes recorded on the Funds’ books and the US dollar equivalent of the amounts actually received or paid.
The Funds do not isolate that portion of the results of operations resulting from changes in foreign exchange rates on investments from the fluctuations arising from changes in market prices of securities held at the end of the reporting period. Net unrealized appreciation or depreciation on investments and foreign currency translations arises from changes in the value of assets and liabilities, including investments in securities at the end of the reporting period, resulting from changes in the exchange rates and changes in market prices of securities held.
42
NOTES TO FINANCIAL STATEMENTS |
Transactions in foreign-denominated assets may involve greater risks than domestic transactions, including currency risk, political and economic risk, regulatory risk and market risk.
(f) | Derivative Instruments — “Disclosure about Derivative Instruments and Hedging Activities” (the “Derivatives Statement”) requires enhanced disclosures about the Funds’ derivative and hedging activities, including how such activities are accounted for and their effects on the Funds’ financial position, performance and cash flows. |
The Funds are not intended as vehicles for investing substantially in derivative instruments, and may hold derivative instruments only infrequently. The Funds enter into derivative instruments in order to increase exposure to certain investments, asset classes, or markets, or for hedging purposes to hedge against adverse movements in securities prices, currency rates or interest rates. The Funds can hold various types of derivative instruments such as futures contracts and options on securities, financial indexes, and foreign currencies, options on futures, forward foreign currency contracts, interest rate swaps, credit default swaps, and swap-related products. The use of derivative instruments may involve risks such as the possibility of illiquid markets or imperfect correlation between the value of the derivative instruments and the underlying securities, or that the counterparty will fail to perform its obligations. There were no outstanding derivative instruments held by the Funds as of March 31, 2020 nor did the Funds utilize derivative instruments during the six-month period ended March 31, 2020.
(g) | Non-Interested Trustees’ Deferred Fee Plan — Effective February 1, 2000, the Board of Trustees adopted the Marsico Investment Fund Deferred Fee Plan (the “Deferred Fee Plan”), amended and restated as of December 30, 2005, which allows the Trustees who are not “interested persons” of the Funds, as defined in the 1940 Act (“non-interested Trustees”), to defer the receipt of all or a portion of their compensation received from the Funds. Any deferred fees are credited to accounts established on behalf of the non-interested Trustees into the Funds as directed by each non-interested Trustee. The amounts credited to these accounts increase or decrease in accordance with the performance of the Funds selected by the non-interested Trustees. The market value of the deferred account balances as of March 31, 2020 is shown on the Statements of Assets and Liabilities as part of an asset account, “Prepaid expenses and other assets”, and a liability account, “Accrued trustees’ fees”. Additionally, the fluctuation of the account balances due to the Funds’ performance is recorded by the Funds as unrealized appreciation (depreciation), which is shown as part of “Total distributable earnings (deficit)” on the Statements of Assets and Liabilities, and as compensation expense, which is shown as part of the expense account “Trustees’ fees and expenses” on the Statements of Operations. Fees earned and deferred by the non-interested Trustees for the six-month period ended March 31, 2020 are also included in “Trustees’ fees and expenses” on the Statements of Operations. Amounts contributed to the Deferred Fee Plan will be deferred until distributed in accordance with the Deferred Fee Plan. Unrealized appreciation (depreciation) of Fund shares held in the Deferred Fee Plan is subject to the Funds’ expense reimbursement agreement with the Adviser. |
(h) | Other — Investment transactions are accounted for on a trade date basis. Each Fund determines the gain or loss realized from the investment transactions by comparing the original cost of the security lot sold with the net sale proceeds. Dividend income is recognized on the ex-dividend date. Certain dividends from foreign securities are recorded when the Funds are informed of the dividend if such information is obtained subsequent to the ex-dividend date. Interest income is recognized on an accrual basis and includes amortization of premiums and accretion of discounts. |
(i) | Indemnifications — In the normal course of business, the Funds enter into contracts that contain provisions indemnifying other parties against specified potential liabilities. Each Fund’s maximum exposure under these arrangements is unknown as this would involve future claims that may be made against the Fund that have not yet occurred. However, based on experience, the Funds expect the risk of loss in connection with these potential indemnification obligations to be remote. There can be no assurance that material liabilities related to such obligations will not arise in the future, which may adversely impact a Fund. |
3. | Investment Advisory Agreement and Transactions With Affiliates |
Each Fund has an agreement with the Adviser to furnish investment advisory services to the Funds. Each Fund calculates and accrues the investment advisory fee daily based on the following rates (expressed as annual rates) and pays the Adviser monthly:
Annual Rate of Average Daily Net Assets | Asset Threshold |
0.80% | First $250 million |
0.75% | Next $250 million |
0.70% | Next $250 million |
0.65% | In excess of $750 million |
The Adviser has entered into a written expense limitation and fee waiver agreement under which it has agreed to limit the total expenses of each Fund (excluding taxes, interest, acquired fund fees and expenses, litigation, extraordinary expenses, and brokerage and other transaction expenses relating to the purchase or sale of portfolio investments) to an annual rate of 1.50% of the average net assets of the International Opportunities Fund, and 1.45% of the average net assets of the Focus Fund, the Growth Fund, the21st Century Fund, and the Global Fund until January 31, 2021. This expense limitation and fee waiver agreement may be terminated by the Adviser at any time after January 31, 2021, upon 15 days prior notice to the Fund and its administrator.
43
NOTES TO FINANCIAL STATEMENTS |
NOTES TO FINANCIAL STATEMENTS March 31, 2020 (Unaudited) (continued)
The Adviser may recoup from a Fund fees previously waived or expenses previously reimbursed by the Adviser with respect to that Fund pursuant to these agreements (or a previous expense limitation agreement) if: (1) such recoupment by the Adviser does not cause the Fund, at the time of recoupment, to exceed the lesser of (a) the expense limitation in effect at the time the relevant amount was waived and/or reimbursed, or (b) the expense limitation in effect at the time of the proposed recoupment, and (2) the recoupment is made within three years after the fiscal year end date as of which the amount to be waived or reimbursed was determined and the waiver or reimbursement occurred. Under this arrangement during the six-month period ended March 31, 2020, the Adviser received $69 (in thousands) of reimbursement from the Global Fund for previously waived or reimbursed expenses. The reimbursement amount is reflected in “Recoupment of previously waived expenses” on the Statements of Operations. As of March 31, 2020, recoupment amounts (in thousands) that may potentially be made by the International Opportunities Fund and Global Fund to the Adviser are as follows:
Year of Expiration | International | Global Fund | ||||||
2020 | $ | 106 | $ | — | ||||
2021 | 46 | 59 | ||||||
2022 | 123 | — | ||||||
2023 | 35 | — | ||||||
| $ | 310 | $ | 59 | |||||
Certain officers of the Trust are also officers of the Adviser. The Funds pay a portion of the Chief Compliance Officer’s total compensation costs which is shown as part of the expense account “Professional fees” on the Statements of Operations. No other officers of the Trust received compensation from the Funds during the six-month period ended March 31, 2020.
4. | Distribution and Service Plan |
The Funds have adopted a Distribution and Service Plan pursuant to Rule 12b-1 under the 1940 Act, and effective December 1, 2017, the Board of Trustees approved a Second Amended and Restated Distribution and Service Plan (the “Plan”). The Plan authorizes payments by the Funds in connection with the distribution of their shares at an annual rate, as determined from time to time by the Board of Trustees, of up to 0.25% of a Fund’s average daily net assets. The Plan, as amended, clarifies that while the maximum 12b-1 Fee rate remains limited to 0.25% per annum of each Fund’s average daily net assets, one or more Funds may be charged a lower rate from time to time upon approval by the Board of Trustees, and the rate may vary by Fund. The Plan, as amended, also clarifies that previously accrued amounts of the 12b-1 Fee for each Fund may be used by that Fund to pay any current or previously accrued expenses of the Fund authorized by the amended Plan, including non-distribution expenses, authorized by the Plan.
Payments may be made by the Funds under the Plan for the purpose of financing any activity primarily intended to result in the sale of shares of the Funds, as determined by the Board of Trustees, as well as for account maintenance and personal services to shareholders and any other non-distribution-related services. The Adviser may, out of its own resources (which may include legitimate profits from providing advisory services to the Funds or other clients) and at its sole discretion, make certain payments on behalf of the Funds or the Plan for expenses incurred by a Fund for distribution of Fund shares and related services or for administrative or other expenses incurred by the Fund.
Pursuant to the amended Plan, the Board of Trustees determined to cause the Focus Fund to no longer accrue 12b-1 Fees effective on June 1, 2018 and continuing until such time as the Board authorizes a different rate (not exceeding 0.25% per annum). The Board also temporarily eliminated 12b-1 accruals for the Growth Fund and the21st Century Fund for the period from June 1, 2018 to January 31, 2019. Effective February 1, 2019, the Growth Fund and the21st Century Fund began accruing 12b-1 Fees at a rate of 0.25% per annum of the average daily net assets of each Fund, and continuing until such time as the Board authorizes a different rate. The International Opportunities Fund and Global Fund continue to accrue 12b-1 Fees at a rate of 0.25% per annum of the average daily net assets of each Fund.
5. | Investment Transactions |
The aggregate purchases and sales of securities, excluding short-term investments, for the Funds for the six-month period ended March 31, 2020, were as follows:
(Amounts in thousands) | Focus | Growth | 21st | International | Global | |||||||||||||||
Purchases | $ | 157,156 | $ | 114,245 | $ | 63,969 | $ | 18,313 | $ | 88,035 | ||||||||||
Sales | $ | 186,423 | $ | 125,294 | $ | 76,470 | $ | 17,677 | $ | 113,146 | ||||||||||
There were no purchases or sales of US government securities, excluding short-term investments.
44
NOTES TO FINANCIAL STATEMENTS |
6. | COVID-19 Pandemic |
The recent global outbreak of an infectious respiratory illness caused by a novel strain of coronavirus (“COVID-19”) has disrupted economic and financial markets, resulted in substantial market volatility and impacted the valuations of the Funds’ investments during the reporting period. The prolonged economic impact of COVID-19 remains uncertain. The operational and financial performance of the issuers of securities in which the Funds invest depends on future developments, including the duration and spread of the COVID-19 pandemic, and such uncertainty may in turn continue to impact the value of the Funds’ investments.
7. | Federal Income Tax Information |
“Accounting for Uncertainty in Income Taxes” (the “Income Tax Statement”) requires an evaluation of tax positions taken (or expected to be taken) in the course of preparing a Fund’s tax returns to determine whether these positions meet a “more-likely-than-not” standard that, based on the technical merits, have a more than fifty percent likelihood of being sustained by a taxing authority upon examination. A tax position that meets the “more-likely-than-not” recognition threshold is measured to determine the amount of benefit to recognize in the financial statements. The Funds recognize interest and penalties, if any, related to unrecognized tax benefits as income tax expense in the Statements of Operations.
The Income Tax Statement requires management of the Funds to analyze all open tax years, consisting of fiscal years 2016-2020 as defined by Internal Revenue Service (“IRS”) statute of limitations for all major jurisdictions, including federal tax authorities and certain state tax authorities. As of and during the six-month period ended March 31, 2020, the Funds did not have any liabilities for any unrecognized tax benefits. The Funds have no examinations in progress and are not aware of any tax positions for which it is reasonably possible that the total amounts of unrecognized tax benefits will significantly change in the next twelve months.
At March 31, 2020, gross unrealized appreciation and depreciation of investments, based on cost for federal income tax purposes, were as follows:
(Amounts in thousands) | Focus | Growth | 21st | International | Global | |||||||||||||||
Cost of Investments | $ | 367,868 | $ | 177,668 | $ | 195,732 | $ | 46,329 | $ | 161,918 | ||||||||||
Gross Unrealized Appreciation | $ | 163,432 | $ | 77,136 | $ | 37,296 | $ | 5,811 | $ | 44,285 | ||||||||||
Gross Unrealized Depreciation | (14,895 | ) | (9,892 | ) | (20,495 | ) | (5,440 | ) | (9,759 | ) | ||||||||||
Net Unrealized Appreciation on Investments | $ | 148,537 | $ | 67,244 | $ | 16,801 | $ | 371 | $ | 34,526 | ||||||||||
The difference between cost amounts for financial statement and federal income tax purposes is due primarily to wash sale loss deferrals.
As of September 30, 2019, the Focus Fund, Growth Fund,21st Century Fund, International Opportunities Fund, and Global Fund, respectively, had (in thousands) $896, $949, $1,448, $0, and $628 of qualified late-year losses, which are deferred until fiscal year 2020 for tax purposes. Net late-year losses that are deferred are deemed to arise on the first day of the Fund’s next taxable year.
The International Opportunities Fund had realized capital losses (in thousands) from transactions between November 1, 2018 and September 30, 2019 of $1,441. The International Opportunities Fund has elected to treat post-October capital losses as arising in the next fiscal year.
As of September 30, 2019, the components of accumulated earnings on a tax basis were as follows:
(Amounts in thousands) | Focus | Growth | 21st | International | Global | |||||||||||||||
Undistributed Ordinary Income | $ | — | $ | — | $ | — | $ | — | $ | — | ||||||||||
Undistributed Trustees’ Deferred Compensation | (3,062 | ) | (1,568 | ) | (951 | ) | (337 | ) | (1,612 | ) | ||||||||||
Undistributed Long-Term Capital Gains | 43,405 | 25,235 | 8,885 | — | — | |||||||||||||||
Tax Accumulated Earnings (Deficit) | 40,343 | 23,667 | 7,934 | (337 | ) | (1,612 | ) | |||||||||||||
Accumulated Capital and Other Losses | (896 | ) | (949 | ) | (1,448 | ) | (1,441 | ) | (1,617 | ) | ||||||||||
Net Unrealized Appreciation on Investments and on Foreign Currency Translations | 196,671 | 92,753 | 57,812 | 7,275 | 46,348 | |||||||||||||||
Trustees’ Deferred Compensation Mark-to-Market | 1,678 | 670 | 252 | 81 | 926 | |||||||||||||||
Total Accumulated Earnings | $ | 237,796 | $ | 116,141 | $ | 64,550 | $ | 5,578 | $ | 44,045 | ||||||||||
Undistributed ordinary income consists of net investment income, passive foreign investment company (“PFICs”) and timing differences related to qualified late-year losses.
45
NOTES TO FINANCIAL STATEMENTS |
NOTES TO FINANCIAL STATEMENTS March 31, 2020 (Unaudited) (continued)
At September 30, 2019, for federal income tax purposes, the Funds had accumulated capital loss carryforwards as follows:
(Amounts in thousands) | Focus | Growth | 21st | International | Global | |||||||||||||||
Not Subject to Expiration | $ | — | $ | — | $ | — | $ | — | $ | 989 | ||||||||||
| $ | — | $ | — | $ | — | $ | — | $ | 989 | |||||||||||
To the extent that a Fund may realize future net capital gains, those gains will be offset by any of its unused capital loss carryforwards if and to the extent a Fund is able to under the Internal Revenue Code.
The tax character of distributions paid during the fiscal years ended September 30, 2019 and 2018 was as follows:
2019 | 2018 | |||||||||||||||
(Amounts in thousands) | Ordinary Income | Long-Term Capital Gains | Ordinary Income | Long-Term Capital Gains | ||||||||||||
Focus Fund | $ | 202 | $ | 51,424 | $ | — | $ | 87,734 | ||||||||
Growth Fund | 1,218 | 28,133 | — | 25,153 | ||||||||||||
21stCentury Fund | 10,934 | 731 | — | — | ||||||||||||
International Opportunities Fund | — | 4,245 | — | — | ||||||||||||
Global Fund | — | 2,537 | 361 | 3,707 | ||||||||||||
The tax character of dividends paid may differ from that shown in the Financial Highlights due to short-term gains being treated as ordinary income for tax purposes.
8. New Accounting Pronouncements
The FASB issued Accounting Standards Update No. 2018-13, Fair Value Measurement (Topic 820), Disclosure Framework – Changes to the Disclosure Requirements for Fair Value Measurement (“ASU 2018-13”), which includes amendments intended to improve the effectiveness of disclosures in the notes to financial statements, add disclosure requirements regarding the range and weighted average of significant unobservable inputs used to develop Level 3 fair value measurements, and provide clarifications to the narrative description of measurement uncertainty disclosures. ASU 2018-13 is effective for interim and annual periods beginning after December 15, 2019. However, ASU 2018-13 allowed for immediate adoption of those provisions that eliminated certain disclosure items while delaying the adoption of the remaining provisions within ASU 2018-13 until the effective date. Management elected to early adopt only those provisions related to the elimination of certain disclosures, and is currently evaluating the impact that ASU 2018-13 will have on the Funds’ financial statements and related disclosures for the remaining provisions.
9. | Subsequent Events |
Management of the Adviser has determined that there were no material subsequent events that would require disclosure in the Funds’ financial statements.
46
EXPENSE EXAMPLE |
EXPENSE EXAMPLE For the six-month period ended March 31, 2020 (Unaudited)
As a shareholder of the Marsico Funds (the “Funds”), you incur two types of costs: (1) transaction costs, including redemption fees (if any), and (2) ongoing costs, including management fees, distribution (12b-1) fees, and other Fund expenses. This Example is intended to help you understand your ongoing costs (in dollars) of investing in the Funds and to compare these costs with the ongoing costs of investing in other mutual funds.
The Example is based on an investment of $1,000 invested at the beginning of the period and held for the entire period from October 1, 2019 to March 31, 2020 (the “period”).
Actual Expenses
The first line of the table below provides information about actual account values and actual expenses. You may use the information in this line, together with the amount you invested, to estimate the expenses you paid over the period. Simply divide your account value by $1,000 (for example, an $8,600 account value divided by $1,000 equals 8.6), then multiply the result by the number in the first line under the heading entitled “Expenses paid for the six-month period ended March 31, 2020” to estimate the expenses you paid on your account during the period.
Hypothetical Example for Comparison Purposes
The second line of the table below provides information about hypothetical account values and hypothetical expenses based on the Funds’ actual expense ratios and an assumed rate of return of 5% per year before expenses, which is not the actual return of any of the Funds. The hypothetical account values and expenses may not be used to estimate the actual ending account balance or expenses you paid for the period. You may use this information to compare the ongoing costs of investing in the Funds and other funds. To do so, compare this 5% hypothetical example with the 5% hypothetical examples that appear in the shareholder reports of other funds.
Please note that the expenses shown in the table are meant to highlight your ongoing costs only and do not reflect any transactional costs such as redemption fees (if any). Therefore, the second line of the table is useful in comparing the ongoing costs only, and will not help you determine the relative total costs of owning different funds. In addition, if these transactional costs (if any) were included, your costs could have been higher.
Annualized | Beginning | Ending | Expenses paid for the | |
FOCUS FUND | ||||
Actual Example | 1.02% | $ 1,000.00 | $ 975.60 | $ 5.05 |
Hypothetical Example, assuming a 5% return before expenses | $ 1,000.00 | $ 1,019.88 | $ 5.17 | |
GROWTH FUND | ||||
Actual Example | 1.34% | $ 1,000.00 | $ 968.20 | $ 6.59 |
Hypothetical Example, assuming a 5% return before expenses | $ 1,000.00 | $ 1,018.30 | $ 6.76 | |
21st CENTURY FUND | ||||
Actual Example | 1.34% | $ 1,000.00 | $ 826.40 | $ 6.14 |
Hypothetical Example, assuming a 5% return before expenses | $ 1,000.00 | $ 1,018.28 | $ 6.79 | |
INTERNATIONAL OPPORTUNITIES FUND | ||||
Actual Example | 1.50% | $ 1,000.00 | $ 876.80 | $ 7.04 |
Hypothetical Example, assuming a 5% return before expenses | $ 1,000.00 | $ 1,017.50 | $ 7.57 | |
GLOBAL FUND | ||||
Actual Example | 1.45% | $ 1,000.00 | $ 951.40 | $ 7.07 |
Hypothetical Example, assuming a 5% return before expenses | $ 1,000.00 | $ 1,017.75 | $ 7.31 |
(1) Expenses are equal to the Fund’s annualized expense ratio multiplied by the average account value over the period, multiplied by 183/366 (to reflect the six-month period). |
47
CONSIDERATION OF INVESTMENT ADVISORY AGREEMENTS |
CONSIDERATION OF INVESTMENT ADVISORY AGREEMENTS (Unaudited)
At a meeting of the Board of Trustees of the Trust held on November 20, 2019, the Trustees, by a unanimous vote (including a separate vote of those Trustees who are not “interested persons” (as the term is defined in the 1940 Act) of the Trust (the “Independent Trustees”)), approved the renewal of the Investment Advisory and Management Agreements for the Focus Fund, Growth Fund,21st Century Fund, International Opportunities Fund, and Global Fund (the “Advisory Agreements”). In advance of the meeting, the Independent Trustees requested and received extensive materials from Marsico Capital Management, LLC (the “Adviser” or “MCM”) to assist them in considering the renewal of the Advisory Agreements. The materials provided by the Adviser contained information with respect to the factors noted below, including detailed information relating to the performance, advisory fees and other expenses of the Funds, other funds sub-advised by the Adviser and non-fund advisory accounts of the Adviser. The materials also included comparisons of the Funds with third party funds of similar size and investment objectives in terms of performance, fees and other expenses, as well as the performance of each Fund versus its benchmark. In addition, the Adviser provided information regarding its overall expenses and profitability, as well as other information requested by the Trustees.
In addition to the materials prepared specifically for contract review analysis, on an ongoing basis the Trustees receive information and reports from the Adviser and other service providers to the Funds regarding the investment performance of the Funds as well as operational, compliance, marketing and other matters.
The Trustees engaged in a detailed discussion of the materials with management of the Adviser. The Independent Trustees then met separately with independent counsel to the Independent Trustees for a review of the materials. Following this session, the full Board reconvened and approved the continuation of the Advisory Agreements for the Focus Fund, Growth Fund,21st Century Fund, International Opportunities Fund, and Global Fund.
Discussion of Certain Factors Considered
1. Nature, Extent, and Quality of Services. The Independent Trustees considered the nature, quality and extent of the services performed by the Adviser under the Investment Advisory and Management Agreements (the “Advisory Agreements”) with the Adviser, including portfolio management, supervision of Fund operations, regulatory filings and disclosures to shareholders, compliance functions, general oversight of other service providers, review of Fund legal issues, and other services. The Independent Trustees also considered the personnel who provide these services, which includes a team of individuals collectively having years of experience in their particular areas of expertise. The Independent Trustees reviewed the Adviser’s investment philosophy and experience, noting that the Adviser and its affiliates employ a focused stock-picking strategy that involves extensive research. The Independent Trustees noted MCM’s continued investment in research. The Independent Trustees discussed the Adviser’s ability to continue to provide the same level and quality of services to the Funds, and discussed with members of management of MCM the financial condition of the Adviser and its ability to attract and retain experienced personnel. The Independent Trustees considered the reinvestment in MCM by Mr. T. Marsico and the steps taken to ensure the financial viability of the Adviser, including the extinguishment of debt to third parties and elimination of most of MCM’s overall debt in 2016. The Independent Trustees also discussed MCM’s commitment to devoting substantial resources to the Adviser’s investment management process. The Independent Trustees concluded that the services are extensive in nature, that the Adviser employs investment advisory personnel who consistently delivered a high level of service and that, with respect to third-party service providers, the Adviser effectively manages the outsourcing by the Funds of certain services to other service providers and the oversight of those service providers.
2. Investment Performance of the Funds and Adviser. The Independent Trustees considered the Adviser’s substantial investment advisory experience and capabilities. The Independent Trustees considered short-term and long-term investment performance for each Fund over various periods of time as compared to both relevant equity indices and the performance of each Fund’s Lipper, Inc. peer group universe. The Independent Trustees noted the positive performance of all five of the Funds relative to their benchmark indexes during both the year-to-date period ended September 30, 2019, and the three-year period ended September 30, 2019, and discussed with representatives of the Adviser the factors underlying the performance of the Funds over various time periods. The Independent Trustees discussed the Funds’ performance with representatives of MCM and concluded that the Adviser was delivering acceptable performance results consistent with the long-term investment strategies being pursued by the Funds. The Independent Trustees took into account that they regularly review each Fund’s performance.
The Independent Trustees noted that the investment performance delivered by the Adviser to the Funds appeared to be generally consistent with the performance delivered for other clients of the Adviser with similar strategies. Based on this review, the Independent Trustees concluded that the performance of the Adviser with respect to each Fund was acceptable for the purposes of approving the Advisory Agreements.
48
CONSIDERATION OF INVESTMENT ADVISORY AGREEMENTS |
3. Costs of Services and Profits Realized by the Adviser.
(a) Costs of Services to Funds: Fees and Expenses. The Independent Trustees considered each Fund’s management fee rates and expense ratios relative to industry averages for the Fund’s benchmark category and the advisory fees charged by the Adviser to other clients, including information regarding expense limitation commitments from the Adviser, and the breakpoints in the advisory fee schedule for all of the Funds. The Independent Trustees noted that the information provided by MCM stated that the mix of services under the Advisory Agreements are much more extensive than those under the Adviser’s advisory agreements for sub-advised and non-fund clients.
The Independent Trustees also noted previous actions taken by MCM to reduce Fund expenses, including that MCM had waived fees and absorbed expenses from time to time, and that some of those expenditures may not be recouped. The Independent Trustees reviewed various expense information and noted that overall Fund expenses are in a range that continues to be reasonable. The Trustees also noted other recent actions that have been taken to reduce expenses including (1) applying certain previously accrued 12b-1 balances for four of the Funds to pay for certain administrative fees charged by intermediaries for periods of time; (2) a reduction in the 12b-1 fees accrued by the Focus, Growth, and21st Century Funds for periods of time; (3) that MCM agreed to lower expense caps for all of the Funds for the benefit of all shareholders effective December 1, 2017, and in the case of the Global Fund, to further lower the expense cap effective August 4, 2018; and (4) that MCM had paid most of the costs of the reorganization of the Flexible Capital Fund into the Global Fund in 2018. The Independent Trustees concluded that the investment advisory fees are acceptable based upon the qualifications, experience, reputation, and performance of the Adviser and the overall expense ratios of the Funds.
(b) Profitability and Costs of Services to Adviser. The Independent Trustees reviewed the information provided by MCM regarding its overall profitability and costs and an estimate of the Adviser’s profitability and costs in serving the Funds as part of MCM’s overall investment management business serving many clients. The Independent Trustees noted that MCM’s estimated overall profitability from managing the Funds increased only slightly during the fiscal year ended September 30, 2019, that estimated profit margins were low to moderate overall, that profit margins for two Funds were minimal or negative, and that MCM had not reduced its services, but continued to devote substantial resources and personnel to the Funds. The Independent Trustees also noted that the Adviser previously had substantially increased its resources devoted to Fund matters in response to regulatory requirements enacted in prior years. The Independent Trustees discussed the level of estimated profit of MCM from its relationship to the Funds and considered profitability levels reviewed by federal courts that were found to be reasonable. The Independent Trustees concluded that the estimated profits received by the Adviser under the Advisory Agreements were acceptable for purposes of approving the Advisory Agreements.
4. Extent of Economies of Scale as Funds Grow. The Independent Trustees considered whether there have been economies of scale with respect to the management of each Fund and whether such Fund has appropriately benefited from any economies of scale. The Independent Trustees noted that economies of scale may develop for certain Funds as their assets increase and their Fund-level expenses decline as a percentage of assets, but that Fund-level economies of scale may not necessarily result in Adviser-level economies of scale. It was reported to the Independent Trustees that the resources devoted by the Adviser relating to management of the Funds had increased substantially in prior years, and that the net asset levels of the Funds had decreased moderately (by -9.7%) for all Funds together during the one-year fiscal period ended September 30, 2019, and for four of the five Funds individually over that period. The Independent Trustees agreed that it was possible that if trends changed and Fund assets began growing again beyond certain thresholds, Adviser-level expenses incurred in managing the Funds eventually could level off or decline as a percentage of management fees in the future, potentially resulting in economies of scale. The Independent Trustees noted that should economies of scale be realized in the future, the advisory fee schedule contains breakpoints that would benefit shareholders of the Funds as assets increase.
5. Whether Fee Levels Reflect Economies of Scale. The Independent Trustees also considered whether the management fee rate is reasonable in relation to the asset size of each Fund and any economies of scale that may exist. The Independent Trustees noted that the management fee schedule for each Fund contained breakpoints and a fee reduction (both implemented in late 2015) in an effort to maintain overall Fund expenses in a range that continues to be reasonable. The Independent Trustees also took note that the Adviser agreed to implement new, lower expense limitations for all Funds effective December 1, 2017 which would remain in place until at least January 31, 2020. In the case of the Global Fund, the expense limitation was further lowered effective August 4, 2018 and would also remain in place until at least January 31, 2020.
6. Other Relevant Considerations. The Independent Trustees considered the character and amount of other incidental benefits received by the Adviser and its affiliates from its association with the Funds. The Independent Trustees concluded that potential ancillary or “fall-out” benefits that the Adviser may receive, such as greater name recognition or increased ability to obtain research or brokerage services, appear to be reasonable, and may in some cases benefit the Funds.
49
CONSIDERATION OF INVESTMENT ADVISORY AGREEMENTS |
CONSIDERATION OF INVESTMENT ADVISORY AGREEMENTS (Unaudited) (continued)
Conclusions
In considering the Advisory Agreements, the Independent Trustees did not identify any factor as all-important or all-controlling and instead considered these factors collectively in light of each Fund’s surrounding circumstances. Based on this review, it was the judgment of the Independent Trustees that each Fund’s fees were reasonable, the extent and quality of services were acceptable and performance of the Funds was acceptable. Therefore, re-approval of the Advisory Agreements was in the best interests of each Fund and its shareholders. As a part of their decision-making process, the Independent Trustees noted that the Adviser has managed the Funds since their inception, and the Independent Trustees believe that a long-term relationship with a capable, conscientious adviser is in the best interests of the Funds and their shareholders. The Independent Trustees considered, generally, that shareholders invested in a Fund knowing that the Adviser managed that Fund and knowing its investment management fee. As such, the Independent Trustees considered whether the Adviser managed each Fund in accordance with its investment objectives and policies as disclosed to shareholders. Additionally, as part of its deliberations, the Board also considered the information about the Funds and MCM that had been provided to them throughout the year in connection with their regular Board meetings at which they engage in the ongoing oversight of the Funds and their operations.
Upon conclusion of their review and discussion, the Trustees, including all of the Independent Trustees, unanimously agreed the Advisory Agreements for each of the Funds should be continued.
50
OTHER INFORMATION |
OTHER INFORMATION (Unaudited)
Proxy Voting Guidelines
The Funds exercise the voting rights associated with the securities held by the Funds under the proxy voting policy of the Funds. A description of those policies and procedures of the Funds and a record of the Funds’ proxy votes for the one-year period ended June 30, 2019 are available without charge, upon request, by calling 888-860-8686. It is also available on the Securities and Exchange Commission’s (SEC) website at www.sec.gov.
Quarterly Filing of Portfolio Holdings
The Funds will file their portfolio holdings information for each month in a fiscal quarter within 60 days after the end of the relevant fiscal quarter on Form N-PORT. Portfolio holdings information for the third month of each fiscal quarter will be made available immediately upon filing on the SEC’s website at www.sec.gov.
Cost Basis Information
Federal law requires mutual fund companies to maintain a shareholder’s cost basis by tax lot and report gain/loss information and holding periods for sales of mutual fund shares that are “covered” securities to the IRS and to shareholders on Form 1099. Mutual fund shares, such as shares of the Funds, acquired on or after January 1, 2012 are covered securities. The Funds are not responsible for maintaining and reporting share information for their shares that are not deemed “covered.”
The tax regulations require that the Funds elect a default tax identification methodology in order to perform the required reporting. The Funds have chosen the first-in-first-out (“FIFO”) method as the default tax lot identification method for its shareholders. This is the method the Funds will use to determine which specific shares are deemed to be sold when a shareholder’s entire position is not sold in a single transaction and is the method in which “covered” share sales will be reported on a shareholder’s Form 1099.
However, at the time of purchase or upon the sale of “covered” shares, shareholders may generally choose a different tax lot identification method. Shareholders should consult a tax advisor with regard to their personal circumstances as the Funds and their service providers do not provide tax advice.
51
MARSICO FUNDS |
NOTES
|
|
|
|
|
|
|
|
|
|
|
|
|
|
|
|
|
|
|
|
|
|
|
|
|
|
|
|
|
|
|
|
|
|
|
|
|
52
| Item 2. | Code of Ethics |
Not applicable to semi-annual reports.
| Item 3. | Audit Committee Financial Expert |
Not applicable to semi-annual reports.
| Item 4. | Principal Accountant Fees and Services |
Not applicable to semi-annual reports.
| Item 5. | Audit Committee of Listed Registrants |
Not applicable.
| Item 6. | Schedule of Investments |
The schedule of investments in securities of unaffiliated issuers is included as part of the report to shareholders filed under Item 1.
| Item 7. | Disclosure of Proxy Voting Policies and Procedures for Closed-End Management Investment Companies |
Not applicable.
| Item 8. | Portfolio Managers of Closed-End Management Investment Companies |
Not applicable.
| Item 9. | Purchases of Equity Securities by Closed-End Management Investment Company and Affiliated Purchasers |
Not applicable.
| Item 10. | Submission of Matters to a Vote of Security Holders |
Not applicable.
| Item 11. | Controls and Procedures. |
(a) The registrant's principal executive officer and principal financial officer have concluded that the registrant's disclosure controls and procedures (as defined in Rule 30a-3(c) under the Investment Company Act of 1940, as amended) are effective based on their evaluation of these disclosure controls and procedures within 90 days of the filing date of this report on Form N-CSR.
(b) There were no changes in the registrant's internal control over financial reporting (as defined in Rule 30a-3(d) under the Investment Company Act of 1940, as amended) that occurred during the period covered by this report that have materially affected, or are reasonably likely to materially affect, the registrant's internal control over financial reporting.
| Item 12. | Disclosure of Securities Lending Activities for Closed-End Management Investment Companies. |
Not applicable.
| Item 13. | Exhibits |
(a)(1) Code of Ethics
Not applicable to semi-annual reports.
(a)(3) Any written solicitation to purchase securities under Rule 23c--1 under the Investment Company Act of 1940, as amended, that was sent or given during the period covered by the report by or on behalf of the registrant to 10 or more persons.
Not applicable.
(a)(4) Change in the registrant’s independent public accountant.
Not applicable.
SIGNATURES
Pursuant to the requirements of the Securities Exchange Act of 1934 and the Investment Company Act of 1940, the registrant has duly caused this report to be signed on its behalf by the undersigned, thereunto duly authorized.
The Marsico Investment Fund
| By: | /s/ Christopher J. Marsico | |
| Christopher J. Marsico, | ||
| Trustee, Executive Vice President and Chief Operating Officer (Principal Executive Officer) | ||
| Date: | June 4, 2020 | |
Pursuant to the requirements of the Securities Exchange Act of 1934 and the Investment Company Act of 1940, this report has been signed below by the following persons on behalf of the registrant and in the capacities and on the dates indicated.
| By: | /s/ Christopher J. Marsico | |
| Christopher J. Marsico, | ||
| Trustee, Executive Vice President and Chief Operating Officer (Principal Executive Officer) | ||
| Date: | June 4, 2020 | |
| By: | /s/ Neil L. Gloude | |
| Neil L. Gloude, | ||
| Vice President, Secretary and Treasurer (Principal Financial Officer) | ||
| Date: | June 4, 2020 | |