Goldman Sachs Global Capital Goods Conference 2005 November 2, 2005 Exhibit 99.1 |
Note: This presentation provides information about free cash flow, which is a non-GAAP measure, and includes a reconciliation between free cash flow and GAAP cash flow from operations. 2 Introductory Information Unless otherwise specified, the information in this presentation, including forward looking statements, is as of the date of our most recent quarterly public investor conference call and should not be construed as an update of such information. The company’s results for 2004 and the third quarter and first nine months of 2005 have not been finalized and, consequently, the results and other data for these periods are preliminary and subject to change. Certain statements contained in this presentation are forward-looking in nature. These statements can be identified by the use of forward-looking terminology such as "believes," "expects," "plans," "intends," "projects," "forecasts," "may," "will," "should," "on track" or "anticipates" or the negative thereof or comparable terminology, or by discussions of strategy or outlook. The company's business and operations are subject to a variety of risks and uncertainties and, consequently, actual results may differ materially from those projected by any forward-looking statements. Factors that could cause actual results to differ from those projected include, but are not limited to, the following: (1) unfavorable economic and industry conditions can reduce demand and prices for the company's products and services, (2) governmental funding for highway and other construction projects may not reach expected levels, (3) the company may not have access to capital that it may require, (4) any companies that United Rentals acquires could have undiscovered liabilities and may be difficult to integrate, (5) rates may increase less than anticipated or costs may increase more than anticipated, (6) the audit of the company’s 2004 results has not yet been completed and, accordingly, previously announced data for 2004 are preliminary and subject to change, (7) the company’s results for the first nine months of 2005 have not been finalized and, consequently, are preliminary and subject to change, (8) the evaluation and testing of the company’s internal controls over financial reporting have not yet been completed and additional material weaknesses may be identified, (9) the company may incur significant expenses in connection with the SEC inquiry of the company and the class action lawsuits and derivative actions that were filed in light of the SEC inquiry, (10) there can be no assurance that the outcome of the SEC inquiry or internal revie w will not require changes in the company’s accounting policies and practices, restatement of financial statements, revisions of preliminary results or guidance, and/or otherwise be adverse to the company, (11) the company may be unable to deliver financial statements or make SEC filings within the time period required by its lenders or the indentures governing various securities, as amended, and (12) the estimated impact of expected restatements is preliminary and may change based upon additional analysis by the company or its auditors. Certain of these risks and uncertainties, as well as others, are discussed in greater detail in the company's filings with the SEC. The company makes no commitment to revise or update any forward-looking statements in order to reflect events or circumstances after the date any such statement is made. |

Company Profile Service Rental Equipment Sales Contractor Supplies New Equipment Sales 4% 9% 9% 6% 72% Rentals 72% Rentals Revenues by End Market Revenues by End Market First Nine Months 2005 Revenues by Line of Business Revenues by Line of Business Largest equipment rental company in the world More than 500,000 rental units with original cost of $4.0 billion Operates in 48 states, 10 Canadian provinces and Mexico Diverse customer base Industrial Homeowner Traffic Control 65% Private Non- Residential Construction 65% Private Non- Residential Construction 15% 15% 10% 10% 10% 10% 3 |
740 Rental Locations Across North America 4 |
URI’s Competitive Advantages Strong brand recognition One-stop shopping Better equipment utilization through sharing Significant purchasing power Leading information technology 5 |
Diversified Equipment Mix Earthmoving & Light Equipment High Reach Traffic Control Trench Safety 6 |
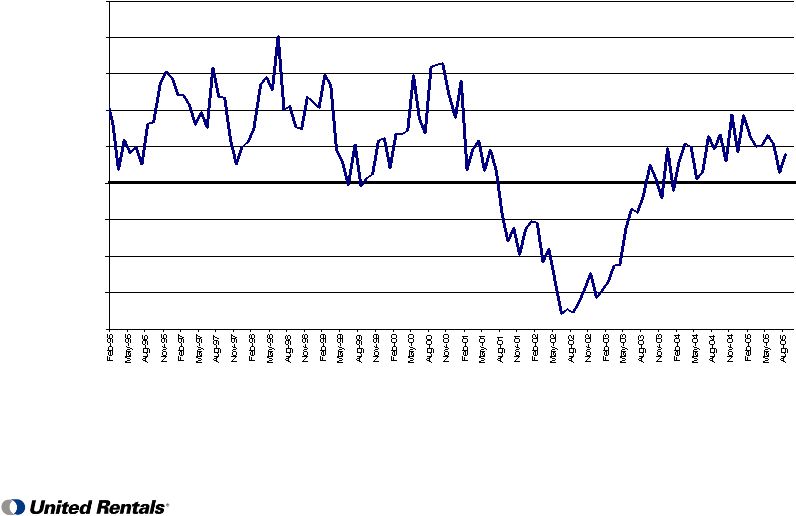
Current Industry Conditions 7 Private non-residential construction continues moderate improvement – Improved 5.3% in first eight months of 2005 and 4.2% in 2004 – Declined 7% in 2003 and 13% in 2002 – Still 15% below peak levels of August 2000 State budget shortfalls and TEA-21 delays postponed highway spending – TEA-21 had been on extension since October 2003 – SAFETEA-LU signed on August 10 at $286.4 billion over six years – Will not impact 2005 but should benefit 2006 and beyond |
Cyclicality of Private Non-Residential Construction (YOY % Change) Source: U.S. Department of Commerce 8 Non-Residential Spending Trend Not Seasonally Adjusted -20.0% -15.0% -10.0% -5.0% 0.0% 5.0% 10.0% 15.0% 20.0% 25.0% |
URI’s Performance – 2004 (preliminary) 9 URI growth outperformed rental industry and end markets 2004 results expected to meet or exceed 2004 outlook 2004 total revenues increased 8.4% to a record $3.1B 2004 rental rates increased 7.5% – Increased 2.1% in 2003 following decline of 4.8% in 2002 2004 free cash flow of $385MM after $634MM of total CapEx 2004 year end cash balance of $302 million |
URI’s Performance – 2005 (preliminary) First nine months 2005 total revenues increased 15.1% — Increased 15.9% in third quarter First nine months 2005 rental rates increased 6.3% — Increased 5.0% in third quarter First nine months 2005 preliminary EPS of $1.45 — Third quarter preliminary EPS of $0.76 First nine months free cash flow of $(76MM) after $734MM of total CapEx September 30, 2005 cash balance of $151 million 10 |
Total revenues increased 15.1% in first nine months 2005 Same-store rental revenues increased 11.6% in first nine months of 2005; General Rentals up 11.8%, Traffic Control up 9.4% Total revenues increased 8.4% in 2004 Same-store rental revenues increased 5.9% in 2004; General Rentals up 10.9%, Traffic Control down 25.5% Total Revenues Total Revenues $ in millions $0 $500 $1,000 $1,500 $2,000 $2,500 $3,000 $3,500 $4,000 2004 2005 $3,107 $3.5B $2,270 $2,612 First Nine Months Actual 2005 Outlook Revenues (preliminary) 11 |
($100) $0 $100 $200 $300 $400 $500 $600 $700 $800 $900 Free cash flow was $(76) million in first nine months 2005 after total rental and non-rental CapEx of $734 million Record free cash flow of $385 million in 2004 was the result of higher rental rates, lower interest expense and working capital improvements CapEx and Free Cash Flow CapEx and Free Cash Flow $507 $216 $634 $385 $825 $100 2004 2004 2005 2005 Outlook CapEx Free Cash Flow CapEx Free Cash Flow $ in millions $734 $(76) CapEx and Free Cash Flow (preliminary) 12 9 mos Full Year 9 mos Actual Actual |
Borrowings as of September 30, 2005 Total of $202 million, including LC’s, utilized on $650 million revolver $200 million AR facility undrawn Earliest significant maturity 2009 Amendments to credit facility obtained through December 31, 2005 Consents from bondholders obtained through March 31, 2006 -- $ Term Debt Term Debt Senior unsecured debt Senior unsecured debt Convertible subordinated debt Convertible subordinated debt ($ in millions) ($ in millions) September 30, 2005 September 30, 2005 739 739 900 900 144 144 Senior secured bank debt: Senior secured bank debt: Total debt Total debt $2,936 $2,936 Subordinated debt Subordinated debt A/R securitization -- Other debt Other debt 16 16 $137 $137 $1,000 $1,000 Convertible preferred Convertible preferred 222 222 $ Revolver 13 |
2005 Outlook(2004 preliminary) Improve rental rates at least 5% Grow contractor supplies sales more than 40% Diluted EPS of $1.68-$1.75 EBITDA of $935-$950 million Achieve $100 million of free cash flow Revenues ($ in billions) Revenues ($ in billions) Rental equipment sales Rental equipment sales Contractor supplies growth Contractor supplies growth Rental CapEx Rental CapEx Growth Growth ($ in millions) ($ in millions) Outlook 2005 Outlook 2005 $3.5 $3.5 $260-285 $260-285 40%+ 40%+ $475-500 $475-500 $250-275 $250-275 Rates Rates 7.5% 7.5% $3.1 $3.1 5%+ 5%+ $275 $275 22% 22% $452 $452 $125 $125 Free Cash Flow Free Cash Flow $385 $385 $100 $100 Maintenance Maintenance Earnings per Share $1.68-$1.75 EBITDA EBITDA $935-950 $935-950 EBITDA is a non- GAAP term, which represents net income plus interest expense, income taxes, depreciation and amortization, and should not be considered an alternative to net income or cash flow from operating activities as an indicator of operating performance or liquidity. 2004 14 |
Conclusion 15 Compelling economics support rental trend Low market penetration provides continued growth opportunities United Rentals outperforming industry and end-markets We believe rate increases, fleet expansion, new branches and contractor supplies growth will improve earnings and cash flow going forward We believe high operating leverage will drive earnings growth as construction spending continues to improve |
Net cash provided by operating activities Purchases of rental equipment Purchases of property and equipment Proceeds from sales of rental equipment Proceeds from real estate sale- leaseback/sales of rental locations Net cash provided by operating activities Purchases of rental equipment Purchases of property and equipment Proceeds from sales of rental equipment Proceeds from real estate sale- leaseback/sales of rental locations ($ in millions) ($ in millions) 2004 2004 $721 $721 (577) (577) (57) (57) 275 275 $385 $385 Free Cash Flow 23 23 2004 2004 2005 2005 $531 $531 (465) (465) (42) (42) 192 192 $216 $216 $427 $427 (678) (678) (56) (56) 228 228 3 3 $(76) $(76) First Nine Months -- -- GAAP Reconciliation Free cash flow 16 Full Year |
Goldman Sachs Global Capital Goods Conference 2005 November 2, 2005 |