EXHIBIT 99.1
Excerpts from Confidential Information Memorandum
Syndication Timetable
| | | | | | | | | | | | | | | | | | | | | | | | | | | | |
JUNE 2008 | | | | JULY 2008 |
S | | M | | T | | W | | T | | F | | S | | | | S | | M | | T | | W | | T | | F | | S |
1 | | 2 | | 3 | | 4 | | 5 | | 6 | | 7 | | | | | | | | 1 | | 2 | | 3 | | 4 | | 5 |
8 | | 9 | | 10 | | 11 | | 12 | | 13 | | 14 | | | | 6 | | 7 | | 8 | | 9 | | 10 | | 11 | | 12 |
15 | | 16 | | 17 | | 18 | | 19 | | 20 | | 21 | | | | 13 | | 14 | | 15 | | 16 | | 17 | | 18 | | 19 |
22 | | 23 | | 24 | | 25 | | 26 | | 27 | | 28 | | | | 20 | | 21 | | 22 | | 23 | | 24 | | 25 | | 26 |
29 | | 30 | | | | | | | | | | | | | | 27 | | 28 | | 29 | | 30 | | 31 | | | | |
| | |
| Key Dates | | |
| |
| June 10, 2008 | | Lender presentation (New York) |
| |
| June 20, 2008 | | Shareholder Vote |
| |
| June 25, 2008 | | Lender commitments due 5:00 pm (EDT) |
| |
| Week of June 30, 2008 | | Comments on credit documentation due |
| |
| Week of June 30 or July 7, 2008 | | Close and fund |
Getty Images is well-positioned to benefit from this growth as a market leader across its major product segments. The Company has a leading position in the traditional creative stills segment, the related microstock segment through its rapidly growing iStockphoto business, as well as in the editorial segment. Competitors – most of whom follow Getty Images’ lead on industry trends and market practices – include Corbis, The Associated Press, Jupiterimages, Reuters Pictures, Amana and a dispersed group of region specific specialists, small agencies and distributors.
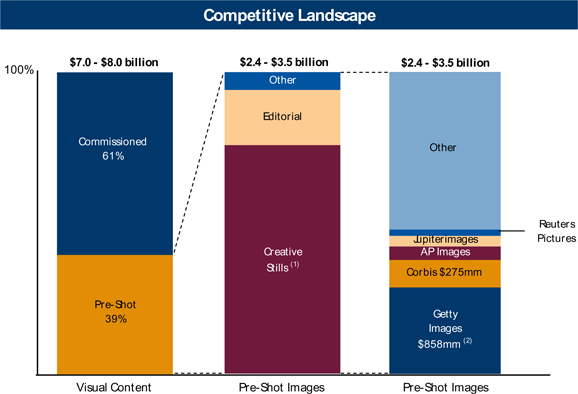
Competitive Landscape
100% $7.0 - $8.0 billion $2.4 - $3.5 billion $2.4 - $3.5 billion
Other
Editorial
Commissioned 61% Other
Reuters Pictures
Jupiterimages
Creative Stills (1) AP Images
Corbis $275mm
Pre-Shot 39%
Getty Images $858mm (2)
Visual Content Pre-Shot Images Pre-Shot Images
Note: Competitive landscape based on estimated 2007 revenue.
| (1) | Includes traditional stills and microstock. |
| (2) | Represents actual 2007 revenue. |
Source: Public filings and management estimates.
Products and Services
Getty Images offers its customers a variety of visual content, including creative or “stock” imagery, editorial imagery (news, sports and entertainment imagery), stock footage and related services. The Company also offers music for use in advertising, communications, television programming and feature films. Getty Images has three product segments, as illustrated below.

PF2007 Revenue Mix
Revenue: $878 million
B2B Music 1%
Footage & Multimedia 5%
Microstock 8%
Creative Stills 72%
Other 5%
Traditional Creative Stills 64%
Editorial 17%
Creative Stills

Creative Stills
72% of PF 2007 Revenue
Images covering a wide variety of commercial, conceptual and contemporary subjects
Used in marketing campaigns, corporate collateral, textbooks, websites, direct mail
A leading market position in every country except Japan
Includes microstock images – the most rapidly growing industry segment
Brands include: gettyimages stone photonica PUNCHSTOCK iStockphoto
Getty Images supplies creative, pre-shot still images that cover a wide variety of contemporary subjects including lifestyle, business, science, health and beauty, sports, transportation and travel. The Company’s creative still imagery business is comprised of two main sub-segments: (i) traditional creative stills, which are higher quality professional images sold at higher price points and often include specific usage rights; and (ii) microstock images, which are lower quality hobbyist or semi-professional images sold at lower price points. The bulk of images are licensed from independent photographers to professional users of imagery and digital content, resulting in Getty Images acting as one of the industry’s largest and most effective clearinghouses.
Traditional creative stills account for approximately 64% of the Company’s revenue. The Company’s 300,000+ traditional creative stills customers include every major advertising and design agency, and most major media companies, with no customer accounting for more than 0.5% of total revenue. Typical end-uses
for traditional creative stills include both print and web-based advertising, corporate marketing materials including websites, publications such as text books and magazines, along with many other forms of media which contain imagery. Suppliers of traditional creative stills are mostly professional freelance photographers who often receive creative direction and editing from the Company to ensure the best matches of supply with demand in the marketplace.

Traditional Creative Stills Revenue Growth
($ in millions)
CAGR = 3.4%
$593 $612 $561
$507
2004 2005 2006 2007
iStockphoto Revenue Growth
($ in millions)
$33
$25
$19
$16
$13
$4 $5 $6 $8
Q1 Q2 Q3 Q4 Q1 Q2 Q3 Q4 Q1
2006 2006 2006 2006 2007 2007 2007 2007 2008
Microstock images are generally lower quality and are typically used in small business websites, newsletters and mailings. Getty Images professionalized the microstock segment of the industry with the acquisition of iStockphoto in 2006, and their subsequent efforts to improve and grow the business. The introduction of microstock has greatly expanded overall demand for stock imagery. Today, the volume of microstock images sold is 15-20x greater than the volume of traditional creative stills and has been growing very rapidly. The majority of microstock customers are small and medium-sized businesses for whom stock imagery was previously too expensive, and these customers are now finding ways to utilize imagery in their marketing and communications. Additionally, previous users of traditional creative stills are finding new ways of using microstock images such as for work-in-process projects or internal presentations. The majority of microstock suppliers are semi-professional or hobbyist photographers working without professional creative direction or editing assistance.
Editorial Imagery (NSEA)

Editorial
17% of PF 2007 Revenue
Live news, sports and entertainment imagery and largest and best archive of historical imagery (“NSEA”)
Used primarily by media customers in newspapers, magazines and websites
Official photographer and exclusive image distributor for most major sports leagues and entertainment associations
Global coverage via partnership arrangements
Brands include: Hulton Archive WireIMAGE®
Getty Images covers major world events in order to supply news, sports, and entertainment photographs to customers who are reporting on these subjects. Editorial imagery also includes extensive archival image collections containing iconic and historic imagery. Editorial imagery accounts for approximately 17% of the Company’s revenue. Customers are primarily media companies (e.g., newspapers, magazines and websites) and number over 40,000, with no single customer accounting for more than 0.3% of total revenue. The editorial imagery segment is a highly complementary business segment for Getty Images because the Company can leverage its expertise and infrastructure in creative imagery into commercializing editorial content. As a result, Getty Images has secured contracts to be the official, and often exclusive, photography licensor for 64 sports leagues and 31 entertainment event organizers. These relationships ensure preferential access to events and celebrities, enhanced recruiting of photographers, and a differentiated supply of editorial imagery which can also be cross-sold to creative stills customers for commercial uses.

NSEA Revenue Growth
($ in millions)
CAGR = 23.9% $137
$100
$85
$72
2004 2005 2006 2007
Selection of Rights-Holder Relationships
USA NFL NBA
50 GRAMMY® AWARDS TV GUIDE NETWORK SUNDANCE FILM FESTIVAL
Multimedia and Other

Multimedia and Other
11% of PF 2007 Revenue
Contemporary and archival footage/ video
Music licensing
Commissioned photography
Digital media management services
Consumer websites
Brands include: PUMPAUDIO contourphotos
Getty Images offers footage to customers engaged in producing commercial motion pictures, television advertisements and programming, web-based advertisements, trade show and promotional videos, documentaries and other footage-based media. The Company also has a platform that allows customers to license pre-cleared, original, professional quality music to enhance their broadcast, film, video, advertising and online projects. In addition, Getty Images offers imagery related products and services including assignment photography and digital media management services.
Trends in Imagery Market
Two key trends are currently impacting the imagery market in which Getty Images operates. The first major trend is the transition from traditional print-based image usage to web-based usage. Corporations and advertising agencies are relying more heavily on electronic communication, including Internet advertising, and therefore are printing fewer brochures and marketing collateral. The second major trend is the introduction of microstock images. The proliferation of microstock has significantly expanded the imagery market, both increasing the number of available stock images and providing stock images at price points affordable for smaller businesses. Together, these two key trends are leading to a dramatic overall increase in the number of images being used, which benefits Getty Images, as a leading supplier of pre-shot imagery. A significant portion of this new demand, however, is at lower price points than traditional print-based stock imagery and has put pressure on overall industry revenues. These two key trends are described in more detail below, as well as a description of their overall impact on Getty Images.
Transition from Print to Web
As usage of the Internet continues to grow, there has been a general shift in advertising, corporate communications and other media online. As a result of this shift, there has been a decline in the use of print materials. This shift has coincided with overall growth in Internet advertising, which is expected to grow at a CAGR of 17.9% from 2007 to 2011.
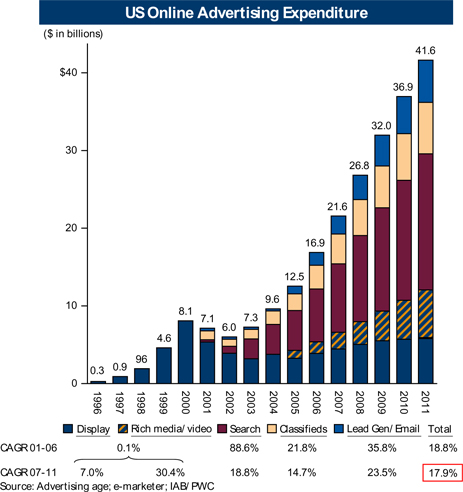
US Online Advertising Expenditure
($ in billions)
41.6
$40
36.9
32.0
30
26.8
21.6
20
16.9
12.5
9.6
10 8.1 7.1 7.3
6.0
4.6
0.9 96
0.3
0
1996 1997 1998 1999 2000 2001 2002 2003 2004 2005 2006 2007 2008 2009 2010 2011
Display Rich media/ video Search Classifieds Lead Gen/ Email Total
CAGR 01-06 0.1% 88.6% 21.8% 35.8% 18.8%
CAGR 07-11 7.0% 30.4% 18.8% 14.7% 23.5% 17.9%
Source: Advertising age; e-marketer; IAB/ PWC
Imagery used online is characterized by lower resolutions and lower price points but significantly higher volumes than print-based applications. Web-use image licenses carry lower price points because of the lower
required resolution, lower quality requirements, and shorter usage duration. The volumes are higher however because of the larger number of pictures used in a single application (images per page and pages per site) and the frequency of website refreshes (often requiring different images).
The shift from print to web usage is not impacting certain end-uses such as high-end marketing (e.g., magazine ads), outdoor advertising and publishing (e.g., textbooks), primarily because these end-uses still require high resolution, high quality images with higher-touch service and more comprehensive rights management. Additionally, while Editorial content is also migrating online, the price per image is not changing as significantly because a large percentage of Editorial images are “current event” imagery delivered via wire service for combined print and web use.
Microstock
The introduction of microstock has significantly increased the availability and usage of stock imagery. The advent of affordable high-end digital cameras and broadband Internet access has enabled semi-professional and hobbyist photographers to greatly expand the supply of digital stock imagery, and low microstock prices have put stock images within reach of far more potential customers. The primary consequence of the introduction of microstock has been to open the creative stock imagery market to new segments of users. Small and medium-sized businesses represent a large customer segment for which stock imagery was previously too expensive. For example, a dental practice might now include a microstock image of a boy brushing his teeth on its mailers to patients, whereas before it might have only shown a drawing of a tooth and toothbrush (or perhaps just a message in formatted text) on its appointment reminders because of the relatively high cost of stock imagery. Microstock also enables traditional stock image users to cost-effectively use stock images for interim uses such as storyboarding, customer pitches and internal presentations. Previously these applications would have contained lower quality, freely available images, or hand-drawn sketches. Customer research suggests that approximately 40-50% of microstock demand is comprised of entirely new end-uses, such as those described above. As a result of the combination of new customer segments and new end uses, volumes of microstock images are 15-20x greater than traditional stills.
Quarterly Volume
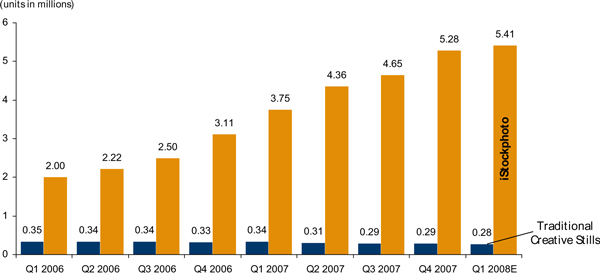
(units in millions)
6
5.28 5.41
5 4.65
4.36
4 3.75
3.11
3
2.50
2.22
2.00
2 iStockphoto
1
0.35 0.34 0.34 0.33 0.34 0.31 0.29 0.29 0.28 Traditional Creative Stills
0
Q1 2006 Q2 2006 Q3 2006 Q4 2006 Q1 2007 Q2 2007 Q3 2007 Q4 2007 Q1 2008E
Sales volumes for iStockphoto have grown substantially in recent years, and the vast majority of these sales have been to new customers. For certain customers however, microstock may be a viable substitute for traditional stock imagery. Such substitution has largely been limited to lower-end applications of traditional creative stills, such as direct mailing and web advertising. In most cases, these applications do not require the highest quality images, assistance with purchasing or full-service rights management.
Net Impact on the Business
Market segmentation based on user behavior demonstrates that certain core elements of the traditional creative still business – high end marketing and media publishers – continue to show stable growth, while lower-end advertising/marketing applications show increased use of microstock and reduced usage of print-based communication.
As depicted in the graph below, the net impact of these imagery market trends has been continued growth for Getty Images, despite erosion in certain specific end-uses. By anticipating and shaping trends in the industry, Getty Images has positioned itself to be on the receiving end of favorable growth trends in online communication and the surge in imagery usage by new customers and end-uses associated with the introduction of microstock. Management anticipates that, going forward, further declines in aspects of the traditional creative stills business will be more than offset by growth in microstock and multi-media.
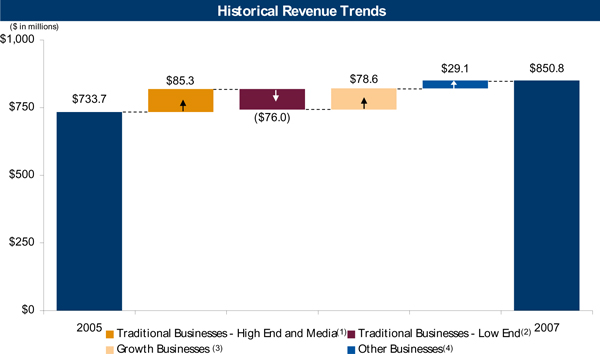
Historical Revenue Trends
($ in millions)
$1,000
$29.1 $850.8
$85.3 $78.6
$750 $733.7
($76.0)
$500
$250
$0
2005 2007
Traditional Businesses - High End and Media(1) Traditional Businesses - Low End(2)
Growth Businesses (3) Other Businesses(4)
| Note: | Certain figures do not reconcile to other totals due to pro forma and currency adjustments and different categorization / level of disclosure, and GAAP restatements. |
| (1) | Includes High End advertising and corporate traditional stills (higher quality/ price), Growth with Media Companies and Editorial Imagery. |
| (2) | Includes Low End agency and corporate marketing (medium and low quality). |
| (3) | Includes $49 Web Res product, Microstock and Footage. |
| (4) | Includes Music and other products. |
Historical Financial Information
| | | | | | | | | | | | | | | | | | | | |
| ($ in millions) | | | | | | | | | | | | | | | |
| | | | | | | | | | | | | | | PF LTM
3/31/08 | |
| | | 2004 | | | 2005 | | | 2006 | | | PF2007(1) | | |
Revenue | | | | | | | | | | | | | | | | | | | | |
Traditional Stills | | $ | 506.7 | | | $ | 592.9 | | | $ | 611.5 | | | $ | 560.8 | | | | — | |
% Growth | | | 15.6 | % | | | 17.0 | % | | | 3.1 | % | | | (8.3 | %) | | | — | |
% of Total | | | 81.4 | % | | | 80.9 | % | | | 75.8 | % | | | 63.9 | % | | | — | |
Microstock | | | — | | | | — | | | $ | 21.5 | | | $ | 71.9 | | | | — | |
% Growth | | | — | | | | — | | | | — | | | | 234.4 | % | | | — | |
% of Total | | | — | | | | — | | | | 2.7 | % | | | 8.2 | % | | | — | |
| | | | | | | | | | | | | | | | | | | | |
Total Creative Stills | | $ | 506.7 | | | $ | 592.9 | | | $ | 633.0 | | | $ | 632.7 | | | | — | |
% Growth | | | 15.6 | % | | | 17.0 | % | | | 6.8 | % | | | (0.0 | %) | | | — | |
% of Total | | | 81.4 | % | | | 80.9 | % | | | 78.5 | % | | | 72.1 | % | | | — | |
Editorial | | $ | 72.3 | | | $ | 85.3 | | | $ | 99.9 | | | $ | 151.7 | | | | — | |
% Growth | | | 39.4 | % | | | 18.0 | % | | | 17.1 | % | | | 51.9 | % | | | — | |
% of Total | | | 11.6 | % | | | 11.6 | % | | | 12.4 | % | | | 17.3 | % | | | — | |
Multimedia & Other(2) | | $ | 43.3 | | | $ | 54.9 | | | $ | 73.7 | | | $ | 93.7 | | | | — | |
% Growth | | | 30.7 | % | | | 26.9 | % | | | 34.2 | % | | | 27.0 | % | | | — | |
% of Total | | | 7.0 | % | | | 7.5 | % | | | 9.1 | % | | | 10.7 | % | | | — | |
| | | | | | | | | | | | | | | | | | | | |
Total Revenue | | $ | 622.2 | | | $ | 733.2 | | | $ | 806.6 | | | $ | 878.1 | | | $ | 883.1 | |
% Growth | | | 18.9 | % | | | 17.8 | % | | | 10.0 | % | | | 8.9 | % | | | 7.9 | % |
| | | | | |
Gross Profit | | $ | 449.6 | | | $ | 536.3 | | | $ | 599.8 | | | $ | 643.0 | | | $ | 641.3 | |
% Margin | | | 72.3 | % | | | 73.1 | % | | | 74.4 | % | | | 73.2 | % | | | 72.6 | % |
| | | | | |
Adj. SG&A(3) | | $ | 224.6 | | | $ | 250.8 | | | $ | 287.6 | | | $ | 316.6 | | | $ | 323.4 | |
| | | | | | | | | | | | | | | | | | | | |
Adj. EBITDA | | $ | 225.0 | | | $ | 285.5 | | | $ | 312.2 | | | $ | 326.4 | | | $ | 317.9 | |
% Growth | | | 35.0 | % | | | 26.8 | % | | | 9.4 | % | | | 4.5 | % | | | 1.8 | % |
% Margin | | | 36.2 | % | | | 38.9 | % | | | 38.7 | % | | | 37.2 | % | | | 36.0 | % |
| | | | | |
Capex | | $ | 36.7 | | | $ | 57.8 | | | $ | 64.0 | | | $ | 62.9 | | | $ | 60.9 | |
% of Sales | | | 5.9 | % | | | 7.9 | % | | | 7.9 | % | | | 7.2 | % | | | 6.9 | % |
| | | | | | | | | | | | | | | | | | | | |
| (1) | The difference between reported 2007 revenue ($857.6 million) and PF 2007 revenue ($878.1 million) is approximately $20.5 million of revenue earned by companies acquired by Getty Images during 2007, for the period in 2007 during which they were not owned by Getty Images. We believe PF 2007 revenue is a useful measure because it illustrates trends in annualized revenue, for comparison purposes. |
| (2) | Includes footage, music, new business and other revenue. |
| (3) | The difference between reported selling, general and administrative expenses (SG&A) and adjusted SG&A (Adj. SG&A) in all periods is the subtraction of stock-based compensation. Please see the Adjusted EBITDA reconciliations below for the amount of stock-based compensation subtracted in each period. We believe Adj. SG&A is a useful measure because it provides an SG&A figure that is significantly closer to cash-based SG&A, which is useful when analyzing a company’s ability to service its debt. |
Robust Free Cash Flow and Conservative Leverage
Getty Images generates robust cash flow, with free cash flow conversion of nearly 48%1. This is due in part to the following factors:
| | • | | High gross and EBITDA margins |
| | • | | Low and highly discretionary capital expenditures |
| | • | | Minimal working capital needs – suppliers fund the business |
| | • | | Low effective cash tax rate due to effective organizational structuring |
1 | Free cash flow conversion defined as free cash flow as a percentage of Adjusted EBITDA; calculated based on 2007 performance pro forma for the proposed capital structure. |
| | | | |
| ($ in millions) | | | |
| | | PF2007 | |
Adj. EBITDA | | $ | 326.4 | |
Estimated Maintenance Capex | | | (30.0 | ) |
Discretionary Capex | | | (32.9 | ) |
Change in Net Working Capital | | | 2.7 | |
Cash Taxes | | | (34.2 | ) |
Interest Expense | | | (75.2 | ) |
| | | | |
Free Cash Flow | | $ | 156.9 | |
| | | | |
% of Adj. EBITDA | | | 48.1 | % |
| | | | |
The conservative proposed capital structure, including a significant equity cushion, also supports significant free cash flow generation. Total net leverage of 3.0x LTM 3/31/08E Adjusted EBITDA results in modest pro forma interest expense.
Historical Quarterly Financials
| | | | | | | | | | | | | | | | | | | | | | | | | | | | | | | | | | | | | | | | | | | | | | | | |
| ($ in millions) | | | | | | | | | | | | | | | | | | | | | | | | | |
| | | 2006 | | | FY
2006 | | | 2007 | | | FY
2007 | | | FY
PF2007 | | | Q1
2008 | |
| | | Q1 | | | Q2 | | | Q3 | | | Q4 | | | | Q1 | | | Q2 | | | Q3 | | | Q4 | | | | |
Revenue | | $ | 200.4 | | | $ | 204.6 | | | $ | 197.9 | | | $ | 203.6 | | | $ | 806.6 | | | $ | 212.6 | | | $ | 218.0 | | | $ | 208.9 | | | $ | 218.1 | | | $ | 857.6 | | | $ | 878.1 | | | $ | 233.2 | |
% Growth YoY | | | 12.5 | % | | | 10.5 | % | | | 7.4 | % | | | 9.6 | % | | | 10.0 | % | | | 6.1 | % | | | 6.5 | % | | | 5.5 | % | | | 7.1 | % | | | 6.3 | % | | | 8.9 | % | | | 9.7 | % |
| | | | | | | | | | | | |
Gross Profit | | $ | 148.2 | | | $ | 153.9 | | | $ | 147.6 | | | $ | 150.1 | | | $ | 599.8 | | | | 157.8 | | | | 159.8 | | | | 152.6 | | | | 159.2 | | | $ | 629.4 | | | $ | 643.0 | | | $ | 166.4 | |
% Margin | | | 74.0 | % | | | 75.2 | % | | | 74.6 | % | | | 73.7 | % | | | 74.4 | % | | | 74.2 | % | | | 73.3 | % | | | 73.1 | % | | | 73.0 | % | | | 73.4 | % | | | 73.2 | % | | | 71.4 | % |
| | | | | | | | | | | | |
Adj. EBITDA | | $ | 77.2 | | | $ | 80.0 | | | $ | 78.2 | | | $ | 76.8 | | | $ | 312.2 | | | $ | 84.0 | | | $ | 81.3 | | | $ | 72.3 | | | $ | 78.3 | | | $ | 316.0 | | | $ | 326.4 | | | $ | 80.5 | |
% Margin | | | 38.5 | % | | | 39.1 | % | | | 39.5 | % | | | 37.7 | % | | | 38.7 | % | | | 39.5 | % | | | 37.3 | % | | | 34.6 | % | | | 35.9 | % | | | 36.8 | % | | | 37.2 | % | | | 34.5 | % |
% Growth YoY | | | 15.2 | % | | | 12.6 | % | | | 6.0 | % | | | 4.4 | % | | | 9.4 | % | | | 8.9 | % | | | 1.7 | % | | | (7.6 | %) | | | 2.0 | % | | | 1.2 | % | | | 4.6 | % | | | (4.3 | %) |
| | | | | | | | | | | | |
Reported Capex | | $ | 14.6 | | | $ | 20.5 | | | $ | 14.5 | | | $ | 11.9 | | | $ | 61.5 | | | $ | 16.2 | | | $ | 19.6 | | | $ | 13.4 | | | $ | 13.7 | | | $ | 62.9 | | | $ | 62.9 | | | $ | 14.2 | |
% of Sales | | | 7.3 | % | | | 10.0 | % | | | 7.3 | % | | | 5.8 | % | | | 7.6 | % | | | 7.6 | % | | | 9.0 | % | | | 6.4 | % | | | 6.3 | % | | | 7.3 | % | | | 7.2 | % | | | 6.1 | % |
Reconciliation of Non-GAAP Financial Measures
EBITDA and Adjusted EBITDA are non-GAAP financial measures. EBITDA and Adjusted EBITDA are not recognized in accordance with GAAP and should not be viewed as alternatives to GAAP measures of performance.
EBITDA represents income before interest, taxes, depreciation and amortization. Adjusted EBITDA represents EBITDA adjusted for certain cash and non-cash charges. Getty Images presented EBITDA and Adjusted EBITDA in the Confidential Information Memorandum and the Lender Presentation because it believes they are important supplemental measures of its performance and frequently used by debt investors to analyze operating performance and debt service capacity. These financial measures are subject to limitations, however, and should not be considered measures of free cash flow for management’s discretionary use.
Because not all companies use identical calculations, these presentations of EBITDA and Adjusted EBITDA may not be comparable to other similarly titled measures of other companies.
| | | | | | | | | | | | | | | |
| ($ in millions) | | 2004 | | | 2005 | | | 2006 | | | PF2007 | | | PF LTM
3/31/08 | |
Adjusted-EBITDA | | | | | |
Income before income taxes | | $173.9 | | | $230.1 | | | $204.7 | | | $201.6 | | | $187.6 | |
Less: | | | | | | | | | | | | | | | |
Investment income | | $9.1 | | | $12.0 | | | $8.8 | | | $11.1 | | | $9.7 | |
Interest expense | | ($3.8 | ) | | ($7.6 | ) | | ($1.5 | ) | | ($6.7 | ) | | ($7.2 | ) |
Add: | | | | | | | | | | | | | | | |
Depreciation | | $53.0 | | | $48.6 | | | $53.3 | | | $61.6 | | | $63.8 | |
Amortization | | $4.6 | | | $9.5 | | | $19.7 | | | $29.2 | | | $32.1 | |
| | | | | | | | | | | | | | | |
EBITDA | | $226.1 | | | $283.8 | | | $270.3 | | | $288.0 | | | $281.1 | |
Less: | | | | | | | | | | | | | | | |
Other non-operating income (expenses), net | | $0.5 | | | $0.4 | | | ($0.7 | ) | | $0.9 | | | ($0.2 | ) |
Add: | | | | | | | | | | | | | | | |
Other operating (income) expenses | | ($1.2 | ) | | $0.7 | | | $26.1 | | | $6.4 | | | $5.8 | |
Stock-based compensation | | $0.6 | | | $1.3 | | | $15.1 | | | $14.0 | | | $15.7 | |
SEC investigation and related professional fees | | – | | | – | | | – | | | $3.8 | | | $1.2 | |
Professional fees related to exploration of strategic alternatives | | – | | | – | | | – | | | $0.6 | | | $6.0 | |
Failed acquisition professional fees | | – | | | – | | | – | | | $1.5 | | | ($0.0 | ) |
Net public company costs | | – | | | – | | | – | | | $2.4 | | | $2.4 | |
Acquisition annualization add-backs | | – | | | – | | | – | | | $10.4 | | | $5.5 | |
| | | | | | | | | | | | | | | |
Adjusted EBITDA | | $225.0 | | | $285.5 | | | $312.2 | | | $326.4 | | | $317.9 | |
| | | | | | | | | | | | | | | | | | | | | | | | | | | | | | | | | | | | |
| | | | | | | | | | | | | | | | | | | | | | | |
($ in millions) Adjusted-EBITDA: | | 2006 | | | FY
2006 | | | 2007 | | | FY
2007 | | | FY
PF2007 | | | Q1
2008 | |
| | Q1 | | | Q2 | | | Q3 | | | Q4 | | | | Q1 | | | Q2 | | | Q3 | | | Q4 | | | | |
Income before income taxes | | $62.3 | | | $38.9 | | | $56.3 | | | $47.1 | | | $204.7 | | | $57.8 | | | $54.0 | | | $39.8 | | | $50.2 | | | $201.6 | | | $201.6 | | | $43.7 | |
Less: | | | | | | | | | | | | | | | | | | | | | | | | | | | | | | | | | | | | |
Investment income | | $4.0 | | | ($1.2 | ) | | $2.3 | | | $3.7 | | | $8.8 | | | $3.3 | | | $2.3 | | | $2.9 | | | $2.6 | | | $11.1 | | | $11.1 | | | $1.9 | |
Interest expense | | ($0.4 | ) | | ($0.4 | ) | | ($0.4 | ) | | ($0.4 | ) | | ($1.5 | ) | | ($0.4 | ) | | ($1.7 | ) | | ($2.6 | ) | | ($1.9 | ) | | ($6.7 | ) | | ($6.7 | ) | | ($0.9 | ) |
Add: | | | | | | | | | | | | | | | | | | | | | | | | | | | | | | | | | | | | |
Depreciation | | $12.3 | | | $13.3 | | | $13.9 | | | $13.8 | | | $53.3 | | | $14.5 | | | $15.1 | | | $16.0 | | | $16.0 | | | $61.6 | | | $61.6 | | | $16.8 | |
Amortization | | $3.7 | | | $5.2 | | | $5.5 | | | $5.3 | | | $19.7 | | | $5.2 | | | $7.1 | | | $8.4 | | | $8.5 | | | $29.2 | | | $29.2 | | | $8.2 | |
| | | | | | | | | | | | | | | | | | | | | | | | | | | | | | | | | | | | |
EBITDA | | $74.7 | | | $58.9 | | | $73.8 | | | $62.9 | | | $270.3 | | | $74.7 | | | $75.5 | | | $63.9 | | | $73.9 | | | $288.0 | | | $288.0 | | | $67.7 | |
Less: | | | | | | | | | | | | | | | | | | | | | | | | | | | | | | | | | | | | |
Other non-operating income (expenses), net | | $0.0 | | | ($0.7 | ) | | $0.2 | | | ($0.3 | ) | | ($0.7 | ) | | ($0.8 | ) | | $0.3 | | | ($0.2 | ) | | $1.6 | | | $0.9 | | | $0.9 | | | ($1.9 | ) |
Add: | | | | | | | | | | | | | | | | | | | | | | | | | | | | | | | | | | | | |
Other operating (income) expenses | | ($0.7 | ) | | $16.5 | | | $0.4 | | | $9.9 | | | $26.1 | | | $0.9 | | | $0.4 | | | $4.5 | | | $0.5 | | | $6.4 | | | $6.4 | | | $0.4 | |
Stock-based compensation | | $3.3 | | | $3.9 | | | $4.2 | | | $3.6 | | | $15.1 | | | $2.9 | | | $3.8 | | | $3.1 | | | $4.2 | | | $14.0 | | | $14.0 | | | $4.6 | |
SEC investigation and related professional fees | | — | | | — | | | — | | | — | | | — | | | $2.6 | | | $1.3 | | | ($0.1 | ) | | ($0.0 | ) | | $3.8 | | | $3.8 | | | — | |
Professional fees related to exploration of strategic alternatives | | — | | | — | | | — | | | — | | | — | | | — | | | — | | | — | | | $0.6 | | | $0.6 | | | $0.6 | | | $5.3 | |
Failed acquisition professional fees | | — | | | — | | | — | | | — | | | — | | | $1.5 | | | ($0.0 | ) | | ($0.0 | ) | | — | | | $1.5 | | | $1.5 | | | — | |
Net public company costs | | — | | | — | | | — | | | — | | | — | | | $0.6 | | | $0.6 | | | $0.6 | | | $0.6 | | | $2.4 | | | $2.4 | | | $0.6 | |
Acquisition annualization add-backs | | — | | | — | | | — | | | — | | | — | | | — | | | — | | | — | | | — | | | — | | | $10.4 | | | — | |
| | | | | | | | | | | | | | | | | | | | | | | | | | | | | | | | | | | | |
Adjusted-EBITDA | | $77.2 | | | $80.0 | | | $78.2 | | | $76.8 | | | $312.2 | | | $84.0 | | | $81.3 | | | $72.3 | | | $78.3 | | | $316.0 | | | $326.4 | | | $80.5 | |
| | | | | | | | | | | | |
PF2007 Adj-EBITDA by quarter | | | | | | | | | | | | | | | | | | | | | | | | | | | | | | | | | | | | |
2007 Adjusted-EBITDA | | | | | | | | | | | | | | | | | $84.0 | | | $81.3 | | | $72.3 | | | $78.3 | | | $316.0 | | | | | | | |
Add: | | | | | | | | | | | | | | | | | | | | | | | | | | | | | | | | | | | | |
WireImage Adj EBITDA add-back | | | | | | | | | | | | | | | | | $3.7 | | | $2.1 | | | $0.6 | | | $0.2 | | | $6.5 | | | | | | | |
Punchstock Adj-EBITDA add-back | | | | | | | | | | | | | | | | | $1.0 | | | $0.8 | | | $0.8 | | | $0.8 | | | $3.5 | | | | | | | |
Pump Audio Adj-EBITDA add-back | | | | | | | | | | | | | | | | | $0.2 | | | $0.2 | | | ($0.0 | ) | | $0.0 | | | $0.4 | | | | | | | |
| | | | | | | | | | | | | | | | | | | | | | | | | | | | | | | | | | | | |
Subtotal Acquisition annualization add-backs | | | | | | | | | | | | | | | | | $4.9 | | | $3.1 | | | $1.4 | | | $1.0 | | | $10.4 | | | | | | | |
| | | | | | | | | | | | |
PF2007 Adjusted-EBITDA | | | | | | | | | | | | | | | | | $89.0 | | | $84.4 | | | $73.7 | | | $79.3 | | | $326.4 | | | | | | | |
The foregoing information is included in this exhibit to the Company’s Current Report on Form 8-K in accordance with the requirements of Regulation G.