EXHIBIT (c)(2)
| Valuation of Intangible Assets of EXE Technologies, Inc. Valuation Date: August 1, 2003 Economic and Valuation Services Practice |
| November 12, 2003 PRIVATE & CONFIDENTIAL Mr. Nick Pessimisis Vice President - Finance SSA Global Technologies, Inc. 500 West Madison, Suite 1600 Chicago, IL 60661 Dear Mr. Pessimisis: Preliminary Valuation of Intangible Assets for SSA Global Technologies, Inc. in Connection with the Purchase of EXE Technologies, Inc. KPMG LLP's Economic and Valuation Services Practice ("KPMG") has completed its preliminary valuation of certain intangible assets in connection with the acquisition of EXE Technologies, Inc. ("EXE") by SSA Global Technologies ("SSA" or the "Company"). This preliminary valuation was performed as of August 1, 2003 (the "Valuation Date"). We will update our results once the transaction closes. This study was performed in accordance with the objectives, scope and approaches described in our proposal to SSA. We understand that SSA will use our values for financial reporting purposes under the purchase accounting rules of SFAS 141. We understand that SSA will disclose this report for SEC related filings to the EXE acquisition. This letter summarizes the findings of our study. The accompanying report provides a detailed explanation of our analysis. Our conclusions are subject to the Statement of Limiting Conditions and Assumptions included as Appendix B to our report. Findings KPMG was asked to identify and value certain intangible assets that were acquired. We identified and valued two categories of intangible assets: customer relationships and developed technology. Management represented that the book values of the tangible assets are their approximate fair value, and did not request a separate valuation on any of these assets. In estimating the value of the acquired assets, we have considered the generally accepted valuation methods: the income approach, the cost approach, and the market approach. We selected the method or methods that were most appropriate for each asset analyzed. |
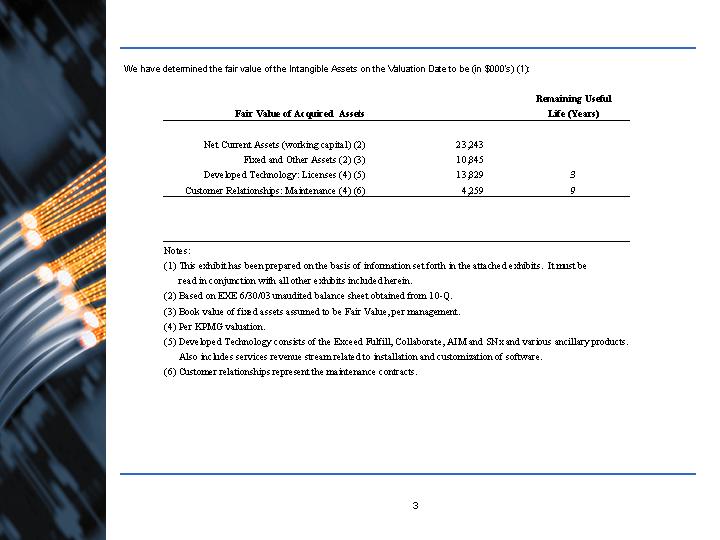
| We have determined the fair value of the Intangible Assets on the Valuation Date to be (in $000's) (1): |

| Statement of Qualifications and Disinterest This report has been prepared under the direction of Mr. Robert Musur, a principal with KPMG LLP. Mr. Musur is one of the designated principals within KPMG authorized to conduct valuation studies. If you have any questions or comments regarding this report please call Mr. Musur at (312) 665-5134. KPMG has no present or contemplated future interest in SSA, EXE, or any other interest which might prevent us from performing an unbiased valuation. We thank you for the opportunity to assist you on this project. Very truly yours, /s/ KPMG LLP KPMG LLP |

| Table of Contents n Executive Summary 7 n Overview - The Transaction 10 - SSA Global Technologies 11 - EXE Technologies, Inc. 12 n Approach 14 n Findings - Summary of Intangible Assets 18 - Customer Relationships 21 - Developed Technology 23 - Assembled Workforce 24 - Weighted Average Cost of Capital 25 - Required Rates of Return 27 n Appendices Page |
| Executive Summary |
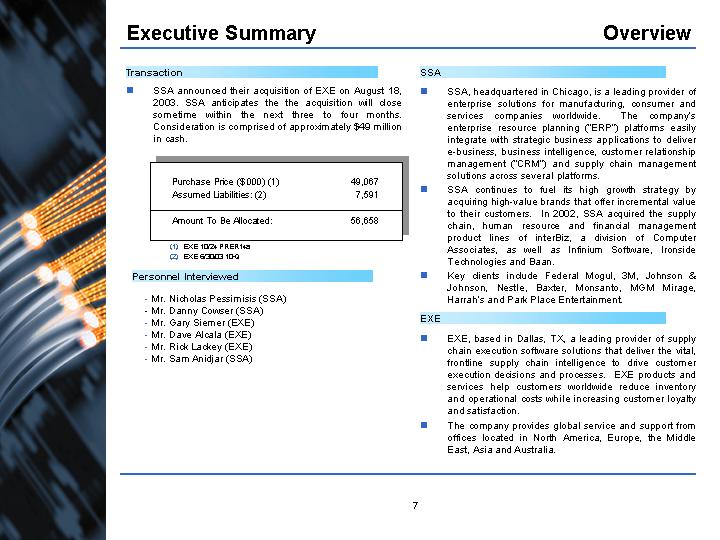
| Executive Summary Overview SSA announced their acquisition of EXE on August 18, 2003. SSA anticipates the the acquisition will close sometime within the next three to four months. Consideration is comprised of approximately $49 million in cash. SSA, headquartered in Chicago, is a leading provider of enterprise solutions for manufacturing, consumer and services companies worldwide. The company's enterprise resource planning ("ERP") platforms easily integrate with strategic business applications to deliver e-business, business intelligence, customer relationship management ("CRM") and supply chain management solutions across several platforms. SSA continues to fuel its high growth strategy by acquiring high-value brands that offer incremental value to their customers. In 2002, SSA acquired the supply chain, human resource and financial management product lines of interBiz, a division of Computer Associates, as well as Infinium Software, Ironside Technologies and Baan. Key clients include Federal Mogul, 3M, Johnson & Johnson, Nestle, Baxter, Monsanto, MGM Mirage, Harrah's and Park Place Entertainment. EXE Personnel Interviewed Mr. Nicholas Pessimisis (SSA) Mr. Danny Cowser (SSA) Mr. Gary Siemer (EXE) Mr. Dave Alcala (EXE) Mr. Rick Lackey (EXE) Mr. Sam Anidjar (SSA) Transaction Purchase Price ($ 000) (1) 49,067 Assumed Liabilities: (2) 7,591 Amount To Be Allocated: 56,658 EXE, based in Dallas, TX, a leading provider of supply chain execution software solutions that deliver the vital, frontline supply chain intelligence to drive customer execution decisions and processes. EXE products and services help customers worldwide reduce inventory and operational costs while increasing customer loyalty and satisfaction. The company provides global service and support from offices located in North America, Europe, the Middle East, Asia and Australia. SSA EXE 10/24 PRER14a EXE 6/30/03 10-Q |

| Executive Summary Findings Values of Assets Amortization Periods Identifiable Asset Allocation Intangible Assets Fair Value ($ 000's) Working Capital, Fixed and Other (1) 34,088 Customer Relationships (2) 4,259 Developed Technology (2) 13,829 Total Assets 52,176 Total Intangibles 18,088 Intangible Assets Years Customer Relationships 9 Developed Technology 3 Goodwill Non-amortizable EXE 6/30/03 10-Q Per KPMG valuation |

| Overview The Transaction SSA Global Technologies EXE Technologies, Inc. |
| Overview The Transaction SSA has been pursing a strategy to enhance their growth by acquiring brands that will complement their current product offerings and offer incremental value to their existing customer base. By acquiring EXE, SSA adds complementary solutions to their existing product offerings. The two companies share many synergies including industry focus. EXE's software will increase the supply chain management and execution functionality with their warehouse management, fulfillment, collaboration, inventory management ad supply chain execution. This should allow them to further penetrate existing customers with new offerings. This also allows SSA to cross sell their solutions to EXE's customer base. This continues SSA's growth through acquisitions strategy. In 2002, the Company acquired two companies. In April, SSA acquired the supply chain, human resources, and financial management product lines of interBiz, a division of Computer Associates International. In December, SSA purchased Infinium Software, a provider of Web integrated enterprise business applications. In 2003, SSA has acquired Baan and Ironside Technologies. Description of Transaction Potential Benefits SSA announced their acquisition of EXE on August 18, 2003. SSA anticipates the the acquisition will close sometime within the next three to four months. Consideration is comprised of approximately $49 million in cash. The acquisition included the assumption of $7.6 million in liabilities. |
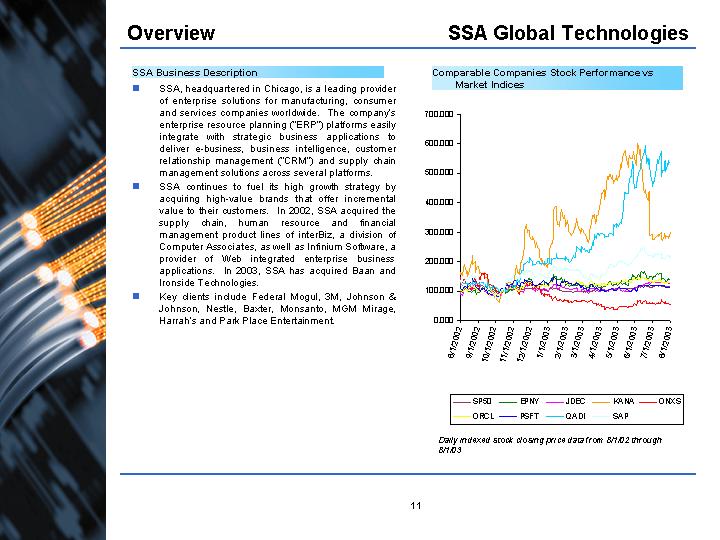
| Overview SSA Global Technologies SSA, headquartered in Chicago, is a leading provider of enterprise solutions for manufacturing, consumer and services companies worldwide. The company's enterprise resource planning ("ERP") platforms easily integrate with strategic business applications to deliver e-business, business intelligence, customer relationship management ("CRM") and supply chain management solutions across several platforms. SSA continues to fuel its high growth strategy by acquiring high-value brands that offer incremental value to their customers. In 2002, SSA acquired the supply chain, human resource and financial management product lines of interBiz, a division of Computer Associates, as well as Infinium Software, a provider of Web integrated enterprise business applications. In 2003, SSA has acquired Baan and Ironside Technologies. Key clients include Federal Mogul, 3M, Johnson & Johnson, Nestle, Baxter, Monsanto, MGM Mirage, Harrah's and Park Place Entertainment. Comparable Companies Stock Performance vs Market Indices Daily indexed stock closing price data from 8/1/02 through 8/1/03 SSA Business Description |
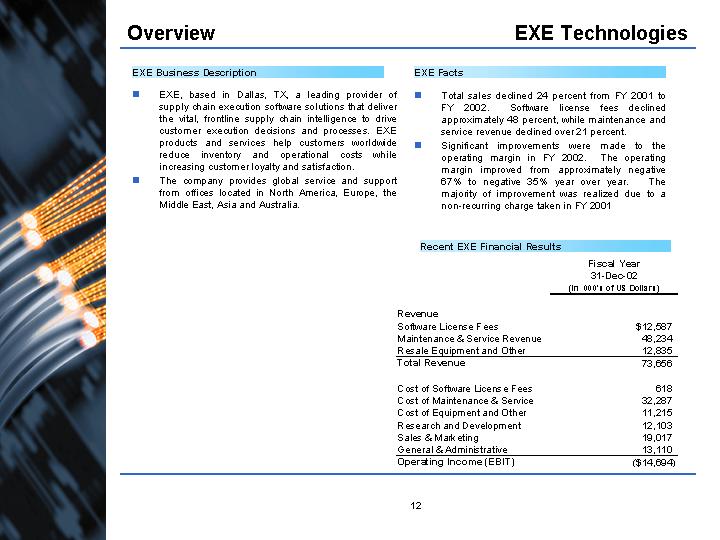
| Overview EXE Technologies EXE, based in Dallas, TX, a leading provider of supply chain execution software solutions that deliver the vital, frontline supply chain intelligence to drive customer execution decisions and processes. EXE products and services help customers worldwide reduce inventory and operational costs while increasing customer loyalty and satisfaction. The company provides global service and support from offices located in North America, Europe, the Middle East, Asia and Australia. Recent EXE Financial Results EXE Business Description EXE Facts Total sales declined 24 percent from FY 2001 to FY 2002. Software license fees declined approximately 48 percent, while maintenance and service revenue declined over 21 percent. Significant improvements were made to the operating margin in FY 2002. The operating margin improved from approximately negative 67% to negative 35% year over year. The majority of improvement was realized due to a non-recurring charge taken in FY 2001 |
| Our Approach |

| Statement of Financial Accounting Standards No. 141 ("SFAS 141") requires that purchasers allocate the total consideration paid in an acquisition to the fair value of the acquired company's identifiable assets and liabilities. Any remainder of consideration above the fair value of identifiable net assets acquired is to be allocated to goodwill. .. Our Approach Background Financial Accounting Background Standard of Value Valuation Approaches According to SFAS 141, the standard of value to be used in the application of purchase accounting rules is fair value. We therefore used a fair value premise with respect to SSA's purchase of EXE. In compliance with the premise of fair value our analysis also reflects assumptions that would be made by market participants if they were valuing each identified asset on a piecemeal basis. For the purposes of our analysis we have used the definition of fair value found in SFAS 141: The amount for which an asset (or liability) could be exchanged in a current transaction between knowledgeable, unrelated willing parties when neither party is acting under compulsion. Market Approach - Reflects the price at which comparable assets are purchased under similar circumstances. Must look for recent transactions in the marketplace involving similar assets. Cost Approach - Estimates the current cost to purchase or replace the asset. Replacement cost new is established and adjustments are made for obsolescence. Income Approach - Estimates the present value of future cash flows that an asset will generate over its remaining useful life. These cash flows are discounted at a rate appropriate for the risk of the asset. Primary Secondary Weak Patents/Technology Trademarks Copyrights MIS Software Product Software Distribution Networks Core Deposits Franchise Rights Corporate Practices Income Income Income Cost Income Cost Income Income Cost Market Market Market Market Market Income Market Market Income Cost Cost Cost Income Cost Market Cost Cost Market Source: "Valuation of Intellectual Property and Intangible Assets" (Second Edition), Smith and Parr, 1994. |
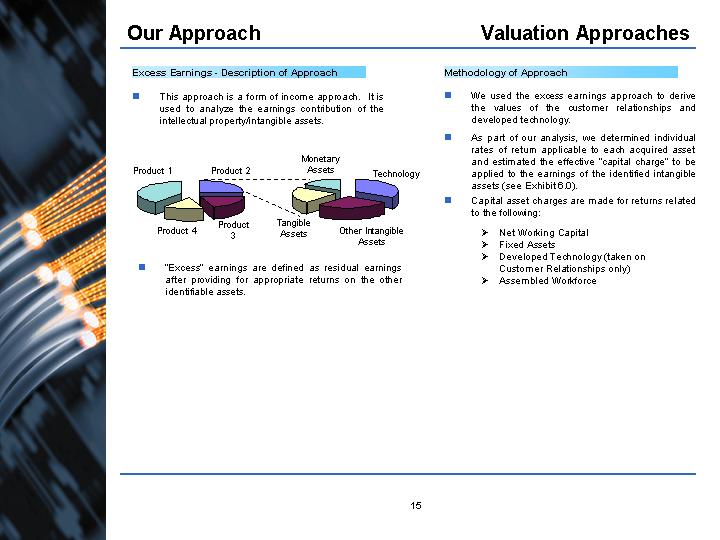
| Our Approach Valuation Approaches This approach is a form of income approach. It is used to analyze the earnings contribution of the intellectual property/intangible assets. Product 1 Product 2 Tangible Assets Product 4 Technology Monetary Assets Other Intangible Assets Product 3 "Excess" earnings are defined as residual earnings after providing for appropriate returns on the other identifiable assets. Excess Earnings - Description of Approach Methodology of Approach We used the excess earnings approach to derive the values of the customer relationships and developed technology. As part of our analysis, we determined individual rates of return applicable to each acquired asset and estimated the effective "capital charge" to be applied to the earnings of the identified intangible assets (see Exhibit 6.0). Capital asset charges are made for returns related to the following: Net Working Capital Fixed Assets Developed Technology (taken on Customer Relationships only) Assembled Workforce |
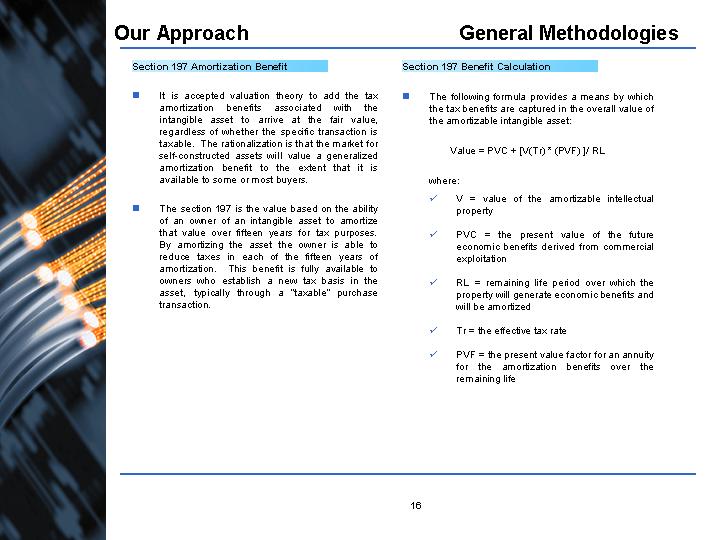
| It is accepted valuation theory to add the tax amortization benefits associated with the intangible asset to arrive at the fair value, regardless of whether the specific transaction is taxable. The rationalization is that the market for self-constructed assets will value a generalized amortization benefit to the extent that it is available to some or most buyers. The section 197 is the value based on the ability of an owner of an intangible asset to amortize that value over fifteen years for tax purposes. By amortizing the asset the owner is able to reduce taxes in each of the fifteen years of amortization. This benefit is fully available to owners who establish a new tax basis in the asset, typically through a "taxable" purchase transaction. Section 197 Amortization Benefit Section 197 Benefit Calculation The following formula provides a means by which the tax benefits are captured in the overall value of the amortizable intangible asset: Value = PVC + [V(Tr) * (PVF) ]/ RL where: Our Approach General Methodologies V = value of the amortizable intellectual property PVC = the present value of the future economic benefits derived from commercial exploitation RL = remaining life period over which the property will generate economic benefits and will be amortized Tr = the effective tax rate PVF = the present value factor for an annuity for the amortization benefits over the remaining life |
| Findings Summary of Intangible Assets Customer Relationships Developed Technology Assembled Workforce Weighted Average Cost of Capital Required Rates of Return 33 DRAFT |
| Findings Summary of Intangible Assets Identification of Intangible Assets Potential Intangible Present In Transaction Rationale Asset Identified Core Technology No Company management indicated that there was no core technology that had multiple future alternatives identified and was distinguishable from developed technology. Therefore, we have not valued core technology. Developed Technology Yes As part of the transaction, SSA acquired EXE's developed technology, which consisted of the Exceed Fulfill, Collaborate, AIM, SNx, and various ancillary products that were in production as of the valuation date. In-Process Research and Development No Company management indicated that at the time of the acquisition, EXE had no significant development efforts underway. We have researched the projects and have determined that none of their development efforts qualify as in-process research and development as defined in the AICPA white paper entitled "Assets Acquired in a Business Combination to Be Used in Research and Development Activities". This list of potential intangible assets was developed from a review of the transaction agreement, press releases, product brochures, and information provided by, and discussions with, SSA and EXE management. |
| Findings Summary of Intangible Assets Identification of Intangible Assets Potential Intangible Present In Transaction Rationale Asset Identified Customer Relationships Yes As part of the acquisition, SSA acquired EXE's existing customer relationships. These customer relationships qualify as a separately identifiable intangible asset because they qualify under the SFAS 141 guidelines because it meets the contractual- legal criterion for recognition apart from goodwill since the acquired customers are under contract. Trade and Internet Domain Names No Company management indicated that they will not utilize the EXE trade name after the acquisition. Therefore, we did not assign any value to the trade and internet domain names. Patents No EXE had no registered patents as of the Valuation Date. Non-compete Agreements No No EXE employee was required to sign a non-compete agreement. Assembled Workforce Yes As part of the acquisition, SSA acquired EXE's assembled workforce. However, under SFAS 141, an assembled workforce no longer qualifies for separate recognition as an intangible asset because of the perceived difficulty in measuring its value reliably. We have valued the assembled workforce for tax purposes and for taking capital asset charges on the other assets. |
| Findings Summary of Intangible Assets Identification of Intangible Assets Potential Intangible Present In Transaction Rationale Asset Identified Strategic Relationships Yes As of the Valuation Date, EXE had established relationships with some systems integrators and consulting services companies. Under the agreements, EXE provides referrals for services work to the strategic partners while they provide referrals of potential licensees. The relationships are governed by short-term, non-exclusive, renewable written or oral contracts, with limited or no up front commitments. Based on these characteristics of the relationships and conversations with EXE management stating the relationships are immaterial, we have not valued the strategic relationships. |
| Findings Customer Relationships Definition of Customer Relationships Through its purchase of EXE, SSA acquired the customer relationships. The customers sign contracts that automatically renew each year. Customers are then billed annually and are entitled to bug fixes, upgrades, etc. After the first year, customers may notify EXE that they wish to terminate their services. Valuation Approach The excess earnings approach was used to value the customer relationships. The following summarizes the methodology employed: Determine the life characteristics and expected attrition of the relationships. Estimate the future earnings to be generated by the relationships over their remaining useful lives. Calculate the present value of future earnings by discounting at a risk adjusted discount rate. To project revenues associated with the customer relationships, we analyzed the maintenance revenue of the company's total income stream. This portion of the company's revenues are associated with the customer contracts. Management provided a one year forecast for FY 2004. Then, based on discussions with management, we determined the proportion of the maintenance revenue associated with the acquired customers only (see Exhibit 2.0). To arrive at after-tax income, we applied a 39 percent tax rate. After-tax income was then adjusted to determine the marginal after-tax cash flow attributable to the subject relationships. These adjustments included the deduction of the required returns on other renewable assets supporting the established relationships. The identified supporting assets included: net working capital, PP&E, assembled workforce, and developed technology. Using this methodology, we estimated a normalized level of cash flow attributable to the subject relationships. We estimated the average remaining life of the existing relationships to be 9 years based on historical attrition information provided by company management. KPMG applied a discount rate of 17 percent for the analysis of the customer relationships, as explained in the Weighted Average Cost of Capital section. Conclusions Based on the income approach, we conclude that the fair value of the Customer Relationship is approximately $4.3 million. The average remaining useful life is 9 years. Exhibit 9.0 sets out the fair value analysis of the customer relationships. |
| Findings Customer Relationship Lifing The standardized curve then becomes a proxy of the observed data, reflecting the retirement characteristics of the observed property. We statistically matched the observed curve to the standardized curves to determine which standardized curve best fits the observed curve. The sets of standardized curves that we selected are known as "Iowa curves." Studies at Iowa State University over the last 70 years have lead to the development of 31 curves to fit retirement data to standard mathematical functions. The Iowa curves are based on actual observed retirements of different types of property over the 70-year period of time the studies were conducted. The curve fitting measures we used included relevant statistical tests and visual curve fitting. In this comparison, the best fit was defined to be the Iowa curve which had the least sum of squared differences between the standard curve and the observed curve. In this case, the "03" Iowa curve best described EXE's historical experience with its customers. Using this methodology we estimate the average remaining useful life of the acquired customer relationships as of the Valuation Date to be 9 years. Lifing Analysis Comparison of Standardized and Observed Curves With respect to the customer relationships, we utilized annual retention figures provided by Management, as of the Valuation Date, to determine an attrition rate. KPMG used information provided by Management regarding attrition rates and average lives of the customers. Management provided us with retention rates as determined by analyzing historical information. Historically, the level of attrition rates for the customers has been relatively stable. Once the attrition rate was calculated, we formulated a survival curve for the relationships. Standardized Curves Standardized survival curves are used to project future retirement patterns of acquired property. The curves are precise mathematical functions from which various relationships between the average expected life, the current age, and the expected useful life of a property can be derived. The development of these relationships is generally not possible using observed survival curves which have not been smoothed into mathematical functions and sometimes include only partial information. By comparing the observed data to standardized survival curves, we can choose a standardized survival curve that most closely matches the historical observed data. |

| The revenues earned by developed technology represent the return on all of the assets acquired under the agreement. The cash flows generated by the products must provide a return on each asset purchased that is consistent with the value and the relative risk of that asset. To separately value the developed technology, the value and required rate of return for other identifiable assets must be determined. The required return on these other assets is "charged to" (deducted from) the cash flows generated by the projects shown in the developed technology model to determine the incremental cash flows specifically attributable to the developed technology. Findings Developed Technology Projected Revenues Background We used the excess earnings approach in valuing the developed technology. The income approach reflects the present value of the operating cash flows generated by the developed technology after taking into account the relative risk of the project, the contribution of other assets, and an appropriate discount rate to reflect the time value of invested capital. These elements are discussed below. The schedule setting out the fair value analysis is shown in Exhibit 8.0. Methodology Conclusions The projected revenues used in the income approach are based upon the software license fee and professional services projections provided by company management. Professional services revenues are related to customization and implementation of the software. A summary of revenue forecasts is provided in Exhibit 2.0. Discount Rate In estimating the applicable discount rate to be used in the valuation of the developed technology, we have analyzed the risks of an investment in EXE. We have considered the weighted average cost of capital ("WACC"), determined by examining market information for several comparable companies, as explained in the WACC section. KPMG applied a discount rate of 17 percent for the analysis of the developed technology. Based on the income approach, we conclude that the fair value of the Developed Technology is approximately $13.8 million. Through discussions with management regarding historical and projected life cycles, the average remaining useful life is 3 years. |
| Findings Assembled Workforce According to SFAS 141, an assembled workforce no longer qualifies for separate recognition as an intangible asset because of the perceived difficulty in measuring its value reliably. However, it is sometimes necessary to value the assembled workforce in order to apply a capital charge to the other intangible assets. We valued the assembled workforce using the cost approach. Under this approach, the workforce is valued by calculating the costs avoided by SSA through obtaining a pre-existing, trained and fully efficient team rather than incurring the costs to assemble this workforce. The cost approach focuses on the investment in an asset as opposed to the income approach which focuses on returns from an asset. By acquiring an assembled workforce, SSA avoided costs of identifying, recruiting and interviewing the appropriate staff. Based on discussions with management, we identified a representative unit cost for hiring new staff in each personnel category. These rates were applied to the number of acquired employees in each category to estimate the after-tax savings realized by SSA. New employees require a period of time to reach full productivity and are therefore not as efficient as seasoned employees. This period of lower productivity represents an implicit cost of assembling a workforce. This effect was quantified in terms of the period of time that a new employee could be expected to be less than fully productive and their starting efficiency compared to their expected seasoned efficiency. This period was compared to the average fully loaded cost (salary plus benefits) of the assembled workforce to determine the after-tax cost of this lost productivity (see Exhibit 10.0). Based on the cost approach, we conclude that the fair value of the Assembled Workforce is $1.3 million. Background Valuation and Allocation Approach Conclusions |
| Findings Weighted Average Cost of Capital WACC We calculated the weighted average cost of capital ("WACC") to provide a starting point for the required returns assigned to the contributory assets in the excess earnings approach, as well as determining the appropriate discount rate for the customer relationships and developed technology. Cost of Capital The WACC is typically used as the discount rate at which to discount a company's debt-free future cash flows. The WACC incorporates the returns demanded by both debt holders and shareholders because pre-debt cash flows are discounted (i.e., cash flows on which both debt holders and shareholders have claims). Therefore, the costs of debt and equity must be considered in proportion to their relative capital contribution. This is performed by weighting the costs of the two components in the calculation of the cost of capital. The cost of equity capital represents the expected after-tax return to an equity investor in a company to compensate him for both the business and the financial risk inherent in his investment in a business. The cost of equity capital can be estimated using several different methods. For the purpose of this valuation, we used the capital asset pricing model ("CAPM") which can be expressed by the formula: COEC = Rf + ß(Rp)+Erp COEC is the cost of equity capital; Rf is the "riskless" rate of return; ß is the beta coefficient of the stock; Rp is the industry equity risk premium; Erp is the equity size premium; and Cost of Equity Capital |
| Findings Weighted Average Cost of Capital Weighted Average Cost of Capital The WACC is the blended cost of equity and debt capital applicable to a company. EXE's existing capitalization represents the financial structure chosen by its current owners and may not represent an ideal ratio of debt to equity. The appropriate mix of debt and equity for us to assume is the one indicated as "prevailing" in the industry for companies deemed similar to EXE as of the Valuation Date. We have analyzed industry statistics to determine the capitalization structure of companies similar to EXE. From our analysis, we determined that the average market capital structure would be comprised of 100.0 percent equity. We performed the procedures described above and estimated that EXE's WACC was approximately 16 percent as of the Valuation Date (Exhibit 7.0). We have added an additional factor to the WACC to incorporate the risk associated with the intangible assets of 1 percent, based on KPMG's professional judgment. Based upon the adjusted WACC, we have utilized a discount rate of 17 percent for the intangible assets. Cost of Debt Capital The cost of debt capital represents the after-tax interest cost to a company from borrowing long- term funds. The cost of debt capital can be expressed by the formula: CODC = i (1 - t) CODC is the cost of debt capital; i is the debt investment rate; and, t is the corporate income tax rate. Comparable Companies The comparable companies utilized to determine the beta and industry debt/total capitalization weightings include: JDA Software Group; Logility Inc.; Manhattan Assoc. Inc.; Oracle Corp.; Retek, Inc.; and SAP |
| Findings Required Rates of Return Intangible Assets We used the adjusted WACC (17 percent) as the discount rate for the customer relationships and developed technology. Net Working Capital We applied a required rate of return of 4 percent for the net working capital (see Exhibit 6.0). We believe that these assets demand a rate that is similar to short term securities with low risk due to the tangible nature and duration of these assets. Fixed Assets We applied a required rate of return of 7 percent for the fixed assets (see Exhibit 6.0). We believe that these assets demand a rate that is higher than a risk free rate and lower than the WACC. We have examined the rates of a Baa rated corporate bonds as a proxy based for the type of financing that would be used to acquire fixed assets. Fixed assets are believed to be less risky than intangible assets because they possess liquidation value. We applied a required rate of return of 17 percent for the assembled workforce (see Exhibit 6.0). We believe that these assets demand a rate that is commensurate with the risk of the overall company. The assembled workforce is generally more risky than the other assets that charges are taken for due to its intangible nature. Assembled Workforce |

| Appendix A - Exhibits |
| SSA GLOBAL TECHNOLOGIES Acquisition of EXE Technologies Valuation Date: August 1, 2003 | EXHIBIT 1.0 Summary (1) |
($ in 000’s)
| Remaining Useful | ||||||||
| Fair Value of Acquired Assets | Life (Years) | |||||||
| Net Current Assets (working capital) (2) | 23,243 | |||||||
| Fixed and Other Assets (2) (3) | 10,845 | |||||||
| Developed Technology: Licenses (4) (5) | 13,829 | 3 | ||||||
| Customer Relationships: Maintenance (4) (6) | 4,259 | 9 | ||||||
Notes:
| (1) | This exhibit has been prepared on the basis of information set forth in the attached exhibits. It must be read in conjunction with all other exhibits included herein. |
| (2) | Based on EXE 6/30/03 unaudited balance sheet obtained from 10-Q. |
| (3) | Book value of fixed assets assumed to be Fair Value, per management. |
| (4) | Per KPMG valuation. |
| (5) | Developed Technology consists of the Exceed Fulfill, Collaborate, AIM and SNx and various ancillary products. Also includes services revenue stream related to installation and customization of software. |
| (6) | Customer relationships represent the maintenance contracts. |
| SSA Global Technologies Acquisition of EXE Technologies Valuation Date: August 1, 2003 | Exhibit 2.0 Revenue Analysis |
($ in 000’s)
Revenue Forecast — By Product/Project
| Forecast | ||||||||||||||||||||||||||||||||||||||||||||
| Historical | Full Yr. | |||||||||||||||||||||||||||||||||||||||||||
| 2003 | 2004 | 2005 | 2006 | 2007 | 2008 | 2009 | 2010 | 2011 | 2012 | 2013 | ||||||||||||||||||||||||||||||||||
| Licenses | 12,587 | 16,000 | 19,500 | 22,000 | 23,760 | 26,136 | 29,272 | 31,907 | 33,821 | 35,512 | 37,288 | |||||||||||||||||||||||||||||||||
| Services | 34,360 | 29,206 | 30,082 | 31,887 | 34,757 | 38,928 | 43,988 | 48,387 | 52,258 | 55,394 | 58,163 | |||||||||||||||||||||||||||||||||
| Maintenance | 15,700 | 18,840 | 21,666 | 24,049 | 26,214 | 28,311 | 31,142 | 33,633 | 35,988 | 38,147 | 40,054 | |||||||||||||||||||||||||||||||||
| Hardware Resale | 11,009 | 11,559 | 11,906 | 12,263 | 12,631 | 13,010 | 13,401 | 13,803 | 14,217 | 14,643 | 15,082 | |||||||||||||||||||||||||||||||||
| IBM Contract (Licenses) | — | — | — | — | — | — | — | — | — | — | — | |||||||||||||||||||||||||||||||||
Total | 73,656 | 75,605 | 83,154 | 90,200 | 97,362 | 106,385 | 117,803 | 127,730 | 136,284 | 143,696 | 150,588 | |||||||||||||||||||||||||||||||||
Revenue Forecast — By Technology
| Forecast | ||||||||||||||||||||||||||||||||||||||||||||
| Historical | Full Yr. | |||||||||||||||||||||||||||||||||||||||||||
| 2003 | 2004 | 2005 | 2006 | 2007 | 2008 | 2009 | 2010 | 2011 | 2012 | 2013 | ||||||||||||||||||||||||||||||||||
| Intangible Assets | 50,060 | 62,446 | 65,398 | 62,536 | 26,214 | 28,311 | 31,142 | 33,633 | 35,988 | 38,147 | 40,054 | |||||||||||||||||||||||||||||||||
| Future | 23,596 | 13,159 | 17,756 | 27,663 | 71,148 | 78,074 | 86,661 | 94,097 | 100,296 | 105,549 | 110,534 | |||||||||||||||||||||||||||||||||
Total | 73,656 | 75,605 | 83,154 | 90,200 | 97,362 | 106,385 | 117,803 | 127,730 | 136,284 | 143,696 | 150,588 | |||||||||||||||||||||||||||||||||
Growth in Revenue $
| Forecast | ||||||||||||||||||||||||||||||||||||||||||||
| Historical | Full Yr. | |||||||||||||||||||||||||||||||||||||||||||
| 2003 | 2004 | 2005 | 2006 | 2007 | 2008 | 2009 | 2010 | 2011 | 2012 | 2013 | ||||||||||||||||||||||||||||||||||
| Intangible Assets | 12,386 | 2,952 | (2,862 | ) | (36,323 | ) | 2,097 | 2,831 | 2,491 | 2,354 | 2,159 | 1,907 | ||||||||||||||||||||||||||||||||
| Future | (10,437 | ) | 4,597 | 9,907 | 43,485 | 6,926 | 8,587 | 7,435 | 6,199 | 5,253 | 4,985 | |||||||||||||||||||||||||||||||||
Total $ | 1,949 | 7,549 | 7,045 | 7,162 | 9,023 | 11,418 | 9,927 | 8,554 | 7,412 | 6,892 | ||||||||||||||||||||||||||||||||||
Growth in Revenue %
| Forecast | ||||||||||||||||||||||||||||||||||||||||||||
| Historical | Full Yr. | |||||||||||||||||||||||||||||||||||||||||||
| 2003 | 2004 | 2005 | 2006 | 2007 | 2008 | 2009 | 2010 | 2011 | 2012 | 2013 | ||||||||||||||||||||||||||||||||||
| Intangible Assets | 25 | % | 5 | % | -4 | % | -58 | % | 8 | % | 10 | % | 8 | % | 7 | % | 6 | % | 5 | % | ||||||||||||||||||||||||
| Future | -44 | % | 35 | % | 56 | % | 157 | % | 10 | % | 11 | % | 9 | % | 7 | % | 5 | % | 5 | % | ||||||||||||||||||||||||
Total % | 3 | % | 10 | % | 8 | % | 8 | % | 9 | % | 11 | % | 8 | % | 7 | % | 5 | % | 5 | % | ||||||||||||||||||||||||
| SSA Global Technologies Acquisition of EXE Technologies Valuation Date: August 1, 2003 | Exhibit 2.0 Revenue Analysis |
($ in 000’s)
| Forecast | ||||||||||||||||||||||||||||||||||||||||||||
| Historical | Full Yr. | |||||||||||||||||||||||||||||||||||||||||||
| Licenses | 2003 | 2004 | 2005 | 2006 | 2007 | 2008 | 2009 | 2010 | 2011 | 2012 | 2013 | |||||||||||||||||||||||||||||||||
| Developed Technology | 0 | % | 90 | % | 70 | % | 30 | % | 0 | % | 0 | % | 0 | % | 0 | % | 0 | % | 0 | % | 0 | % | ||||||||||||||||||||||
| Future | 100 | % | 10 | % | 30 | % | 70 | % | 100 | % | 100 | % | 100 | % | 100 | % | 100 | % | 100 | % | 100 | % | ||||||||||||||||||||||
| Total | 100 | % | 100 | % | 100 | % | 100 | % | 100 | % | 100 | % | 100 | % | 100 | % | 100 | % | 100 | % | 100 | % | ||||||||||||||||||||||
| Current | — | 14,400 | 13,650 | 6,600 | — | — | — | — | — | — | — | |||||||||||||||||||||||||||||||||
| Future | 12,587 | 1,600 | 5,850 | 15,400 | 23,760 | 26,136 | 29,272 | 31,907 | 33,821 | 35,512 | 37,288 | |||||||||||||||||||||||||||||||||
Total | 12,587 | 16,000 | 19,500 | 22,000 | 23,760 | 26,136 | 29,272 | 31,907 | 33,821 | 35,512 | 37,288 | |||||||||||||||||||||||||||||||||
| Services | ||||||||||||||||||||||||||||||||||||||||||||
| Developed Technology | 100 | % | 100 | % | 100 | % | 100 | % | 0 | % | 0 | % | 0 | % | 0 | % | 0 | % | 0 | % | 0 | % | ||||||||||||||||||||||
| Future | 0 | % | 0 | % | 0 | % | 0 | % | 100 | % | 100 | % | 100 | % | 100 | % | 100 | % | 100 | % | 100 | % | ||||||||||||||||||||||
| Total | 100 | % | 100 | % | 100 | % | 100 | % | 100 | % | 100 | % | 100 | % | 100 | % | 100 | % | 100 | % | 100 | % | ||||||||||||||||||||||
| Current | 34,360 | 29,206 | 30,082 | 31,887 | — | — | — | — | — | — | — | |||||||||||||||||||||||||||||||||
| Future | — | — | — | — | 34,757 | 38,928 | 43,988 | 48,387 | 52,258 | 55,394 | 58,163 | |||||||||||||||||||||||||||||||||
Total | 34,360 | 29,206 | 30,082 | 31,887 | 34,757 | 38,928 | 43,988 | 48,387 | 52,258 | 55,394 | 58,163 | |||||||||||||||||||||||||||||||||
Maintenance
| Customer Relationships | 100 | % | 100 | % | 100 | % | 100 | % | 100 | % | 100 | % | 100 | % | 100 | % | 100 | % | 100 | % | 100 | % | ||||||||||||||||||||||
| Future | 0 | % | 0 | % | 0 | % | 0 | % | 0 | % | 0 | % | 0 | % | 0 | % | 0 | % | 0 | % | 0 | % | ||||||||||||||||||||||
| Total | 100 | % | 100 | % | 100 | % | 100 | % | 100 | % | 100 | % | 100 | % | 100 | % | 100 | % | 100 | % | 100 | % | ||||||||||||||||||||||
| Current | 15,700 | 18,840 | 21,666 | 24,049 | 26,214 | 28,311 | 31,142 | 33,633 | 35,988 | 38,147 | 40,054 | |||||||||||||||||||||||||||||||||
| Future | — | — | — | — | — | — | — | — | — | — | — | |||||||||||||||||||||||||||||||||
Total | 15,700 | 18,840 | 21,666 | 24,049 | 26,214 | 28,311 | 31,142 | 33,633 | 35,988 | 38,147 | 40,054 | |||||||||||||||||||||||||||||||||
| SSA GLOBAL TECHNOLOGIES Acquisition of EXE Technologies Valuation Date: August 1, 2003 | EXHIBIT 3.0 Fair Value of Balance Sheet Items |
($ in 000’s)
Fair Value of Balance Sheet Items
| ADJUSTMENTS | ||||||||||||||||
| B/S AS OF | CLOSING | |||||||||||||||
| 30-JUN-03 | DEBIT | CREDIT | FAIR VALUE | |||||||||||||
Current Assets | ||||||||||||||||
| Operating Cash & Equivalents | 32,007 | — | — | 32,007 | ||||||||||||
| Accounts Receivable | 14,994 | — | — | 14,994 | ||||||||||||
| Other Receivables | 784 | — | — | 784 | ||||||||||||
| Prepaid and Other Current Assets | 2,489 | — | — | 2,489 | ||||||||||||
| Total Current Assets | $ | 50,274 | $ | — | $ | — | $ | 50,274 | ||||||||
Long-Term Assets | ||||||||||||||||
| Long-term Marketable Securities | — | — | — | — | ||||||||||||
| Plant & Equipment, Depreciable | 3,504 | — | — | 3,504 | ||||||||||||
| Goodwill | 5,266 | — | — | 5,266 | ||||||||||||
| Intangible Assets | 1,167 | — | — | 1,167 | ||||||||||||
| Other Assets | 909 | — | — | 909 | ||||||||||||
| Total Long-Term Assets | $ | 10,845 | $ | — | $ | — | $ | 10,845 | ||||||||
Total Assets | $ | 61,119 | $ | — | $ | — | $ | 61,119 | ||||||||
Current Liabilities | ||||||||||||||||
| Current Portion of Long Term Debt | $ | 511 | $ | — | $ | — | $ | 511 | ||||||||
| Accounts Payable | 7,140 | — | — | 7,140 | ||||||||||||
| Accrued Expenses | 8,694 | — | — | 8,694 | ||||||||||||
| Accrued Payroll | 1,957 | — | — | 1,957 | ||||||||||||
| Deferred Revenue | 8,728 | — | — | 8,728 | ||||||||||||
| Total Current Liabilities | $ | 27,031 | $ | — | $ | — | $ | 27,031 | ||||||||
Long-Term Liabilities | ||||||||||||||||
| Interest Bearing Long Term Debt | $ | 158 | $ | — | $ | — | $ | 158 | ||||||||
| Long-term accrued Expenses | 7,630 | — | — | 7,630 | ||||||||||||
| Minority Interest | 163 | — | — | 163 | ||||||||||||
| Total Long-Term Liabilities | $ | 7,951 | $ | — | $ | — | $ | 7,951 | ||||||||
| Total Liabilities | $ | 34,982 | $ | — | $ | — | $ | 34,982 | ||||||||
Equity | ||||||||||||||||
| Implied Equity | $ | 26,137 | $ | — | $ | — | $ | 26,137 | ||||||||
| Total Equity | $ | 26,137 | $ | — | $ | — | $ | 26,137 | ||||||||
Total Liabilities & Equity | $ | 61,119 | $ | — | $ | — | $ | 61,119 | ||||||||
| SSA GLOBAL TECHNOLOGIES Acquisition of EXE Technologies Valuation Date: August 1, 2003 | EXHIBIT 4.0 Working Capital Schedule |
($ in 000’s)
| WORKING CAPITAL ADJUSTMENT | ||||||||
| Working Capital from Fair Value Balance Sheet | $ | 23,754 | ||||||
Adjustments | ||||||||
| Adjustment 1 | $ | (16,389 | ) | |||||
| Sub-Total | $ | (16,389 | ) | |||||
Adjusted Working Capital | $ | 7,366 | ||||||
| Projected Incremental Working Capital & Working Capital Balance | ||||||||||||||||||||||||||||||||||||||||
| Adjusted Working Capital | $ | 7,366 | $ | 7,561 | $ | 8,315 | $ | 9,020 | $ | 9,736 | $ | 10,638 | $ | 11,780 | $ | 12,773 | $ | 13,628 | $ | 14,370 | ||||||||||||||||||||
| Increase in Revenue | $ | 1,949 | $ | 7,549 | $ | 7,045 | $ | 7,162 | $ | 9,023 | $ | 11,418 | $ | 9,927 | $ | 8,554 | $ | 7,412 | $ | 6,892 | ||||||||||||||||||||
| Increase/(Decrease) in Working Capital @ 10% | $ | 195 | $ | 755 | $ | 705 | $ | 716 | $ | 902 | $ | 1,142 | $ | 993 | $ | 855 | $ | 741 | $ | 689 | ||||||||||||||||||||
| Ending Working Capital | $ | 7,561 | $ | 8,315 | $ | 9,020 | $ | 9,736 | $ | 10,638 | $ | 11,780 | $ | 12,773 | $ | 13,628 | $ | 14,370 | $ | 15,059 | ||||||||||||||||||||
Average Working Capital Balance | $ | 7,463 | $ | 7,938 | $ | 8,668 | $ | 9,378 | $ | 10,187 | $ | 11,209 | $ | 12,277 | $ | 13,201 | $ | 13,999 | $ | 14,714 | ||||||||||||||||||||
| SSA Global Technologies | Exhibit 5.0 | |
| Acquisition of EXE Technologies | Depreciation Schedule | |
| Valuation Date: August 1, 2003 | ||
| ($ in 000’s) | ||
| Depreciable Assets Adjustments | ||||||||
| Plant & Equipment, Depreciable | $ | 3,504 | ||||||
| Goodwill | 5,266 | |||||||
| Intangible Assets | 1,167 | |||||||
| Other Assets | 909 | |||||||
| Total Depreciable Assets | $ | 10,845 | ||||||
Adjustments | ||||||||
| Adjustment 1 | $ | (5,266 | ) | |||||
| Sub-Total | $ | (5,266 | ) | |||||
Adjusted Depreciable Assets | $ | 5,580 | ||||||
| Asset | 1 | 2 | 3 | 4 | 5 | 6 | 7 | 8 | 9 | 10 | |||||||||||||||||||||||||||||||||||
| Life | 2004 | 2005 | 2006 | 2007 | 2008 | 2009 | 2010 | 2011 | 2012 | 2013 | |||||||||||||||||||||||||||||||||||
| Starting Depreciable Fixed Assets | 5 | 5,580 | 5,144 | 4,625 | 4,004 | 3,266 | 2,415 | 2,645 | 2,888 | 3,126 | 3,346 | ||||||||||||||||||||||||||||||||||
| Capital Expenditures | 5 | 756 | 832 | 902 | 974 | 1,064 | 1,178 | 1,277 | 1,363 | 1,437 | 1,506 | ||||||||||||||||||||||||||||||||||
| Gross Fixed Assets | 6,336 | 5,976 | 5,527 | 4,977 | 4,330 | 3,593 | 3,923 | 4,251 | 4,563 | 4,852 | |||||||||||||||||||||||||||||||||||
| Depreciation — Existing Assets | 1,116 | 1,116 | 1,116 | 1,116 | 1,116 | — | — | — | — | — | |||||||||||||||||||||||||||||||||||
| Depreciation- Year 1 | 76 | 151 | 151 | 151 | 151 | 76 | — | — | — | — | |||||||||||||||||||||||||||||||||||
| Depreciation- Year 2 | 83 | 166 | 166 | 166 | 166 | 83 | — | — | — | ||||||||||||||||||||||||||||||||||||
| Depreciation- Year 3 | 90 | 180 | 180 | 180 | 180 | 90 | — | — | |||||||||||||||||||||||||||||||||||||
| Depreciation- Year 4 | 97 | 195 | 195 | 195 | 195 | 97 | — | ||||||||||||||||||||||||||||||||||||||
| Depreciation- Year 5 | 106 | 213 | 213 | 213 | 213 | 106 | |||||||||||||||||||||||||||||||||||||||
| Depreciation- Year 6 | 118 | 236 | 236 | 236 | 236 | ||||||||||||||||||||||||||||||||||||||||
| Depreciation- Year 7 | 128 | 255 | 255 | 255 | |||||||||||||||||||||||||||||||||||||||||
| Depreciation- Year 8 | 136 | 273 | 273 | ||||||||||||||||||||||||||||||||||||||||||
| Depreciation- Year 9 | 144 | 287 | |||||||||||||||||||||||||||||||||||||||||||
| Depreciation- Year 10 | 151 | ||||||||||||||||||||||||||||||||||||||||||||
| Depreciation- Year 11 | |||||||||||||||||||||||||||||||||||||||||||||
| Depreciation- Year 12 | |||||||||||||||||||||||||||||||||||||||||||||
| Depreciation- Year 13 | |||||||||||||||||||||||||||||||||||||||||||||
| Depreciation- Year 14 | |||||||||||||||||||||||||||||||||||||||||||||
| Depreciation- Year 15 | |||||||||||||||||||||||||||||||||||||||||||||
| Total Depreciation | 1,192 | 1,350 | 1,524 | 1,711 | 1,915 | 948 | 1,034 | 1,125 | 1,217 | 1,308 | |||||||||||||||||||||||||||||||||||
| Ending (gross — dep.) | 5,144 | 4,625 | 4,004 | 3,266 | 2,415 | 2,645 | 2,888 | 3,126 | 3,346 | 3,544 | |||||||||||||||||||||||||||||||||||
Average Fixed Asset Balance | 5,362 | 4,885 | 4,315 | 3,635 | 2,841 | 2,530 | 2,767 | 3,007 | 3,236 | 3,445 | |||||||||||||||||||||||||||||||||||
| SSA Global Technologies | Exhibit 6.0 | |
| Acquisition of EXE Technologies | Aggregate Capital Charge | |
| Valuation Date: August 1, 2003 | ||
| Annual Fair Value of Assets | ||||||||||||||||||||||||||||||||||||||||||||||||||||||||
| Annual Fair Value of Assets | ||||||||||||||||||||||||||||||||||||||||||||||||||||||||
| Fair | Starting | Change in | Growth | |||||||||||||||||||||||||||||||||||||||||||||||||||||
| Value (1) | Value (2) | Value | in Value (3) | 2004 | 2005 | 2006 | 2007 | 2008 | 2009 | 2010 | 2011 | 2012 | 2013 | |||||||||||||||||||||||||||||||||||||||||||
Balance Sheet Items @ Fair Value | ||||||||||||||||||||||||||||||||||||||||||||||||||||||||
| Adjusted Working Capital | 23,754 | 7,366 | n.a | n.a. | 7,463 | 7,938 | 8,668 | 9,378 | 10,187 | 11,209 | 12,277 | 13,201 | 13,999 | 14,714 | ||||||||||||||||||||||||||||||||||||||||||
| Adjusted Depreciable Assets | 10,845 | 5,580 | n.a | n.a. | 5,362 | 4,885 | 4,315 | 3,635 | 2,841 | 2,530 | 2,767 | 3,007 | 3,236 | 3,445 | ||||||||||||||||||||||||||||||||||||||||||
Non-Balance Sheet Items/Intangibles @ Fair Value | ||||||||||||||||||||||||||||||||||||||||||||||||||||||||
| Workforce | 1,334 | 1,334 | At rate | 0.00 | % | 1,334 | 1,334 | 1,334 | 1,334 | 1,334 | 1,334 | 1,334 | 1,334 | 1,334 | 1,334 | |||||||||||||||||||||||||||||||||||||||||
| Required Return on Assets | ||||||||||||||||||||||||||||||||||||||||||||||||||||
| Required Annual Return on Asset Value | ||||||||||||||||||||||||||||||||||||||||||||||||||||
| Starting FV | Return | Return | ||||||||||||||||||||||||||||||||||||||||||||||||||
| of Assets | Charged (4) | in Allo. (5) | 2004 | 2005 | 2006 | 2007 | 2008 | 2009 | 2010 | 2011 | 2012 | 2013 | ||||||||||||||||||||||||||||||||||||||||
Balance Sheet Items @ Fair Value | ||||||||||||||||||||||||||||||||||||||||||||||||||||
| Adjusted Working Capital | 7,366 | 4.00 | % | n.a | 299 | 318 | 347 | 375 | 407 | 448 | 491 | 528 | 560 | 589 | ||||||||||||||||||||||||||||||||||||||
| Adjusted Depreciable Assets | 5,580 | 7.00 | % | n.a | 375 | 342 | 302 | 254 | 199 | 177 | 194 | 211 | 227 | 241 | ||||||||||||||||||||||||||||||||||||||
Non-Balance Sheet Items/Intangibles @ Fair Value | ||||||||||||||||||||||||||||||||||||||||||||||||||||
| Workforce | 1,334 | 17.00 | % | n.a | 227 | 227 | 227 | 227 | 227 | 227 | 227 | 227 | 227 | 227 | ||||||||||||||||||||||||||||||||||||||
Total Required Return | 901 | 886 | 875 | 856 | 833 | 852 | 911 | 965 | 1,013 | 1,056 | ||||||||||||||||||||||||||||||||||||||||||
| Aggregate Capital Charge | ||||||||||||||||||||||||||||||||||||||||
| 2004 | 2005 | 2006 | 2007 | 2008 | 2009 | 2010 | 2011 | 2012 | 2013 | |||||||||||||||||||||||||||||||
| Total Revenue | 75,605 | 83,154 | 90,200 | 97,362 | 106,385 | 117,803 | 127,730 | 136,284 | 143,696 | 150,588 | ||||||||||||||||||||||||||||||
| Total Required Return | 901 | 886 | 875 | 856 | 833 | 852 | 911 | 965 | 1,013 | 1,056 | ||||||||||||||||||||||||||||||
Aggregate Capital Charge=Required Return/Revenue | 1.19 | % | 1.07 | % | 0.97 | % | 0.88 | % | 0.78 | % | 0.72 | % | 0.71 | % | 0.71 | % | 0.71 | % | 0.70 | % | ||||||||||||||||||||
| SSA Global Technologies | Exhibit 7.0 | |
| Acquisition of EXE Technologies | Weight Average Cost of Capital (“WACC”) | |
| Valuation Date: August 1, 2003 | ||
| Capital Structure | Weighted Average | |||||||||||||||||||
| Cost of Equity/Debt | Percentage | Cost of Capital | ||||||||||||||||||
Equity: | ||||||||||||||||||||
| Market risk premium (1) | 7.00 | % | ||||||||||||||||||
| Times: Estimated adjusted beta | 0.99 | |||||||||||||||||||
| Equals: Equity market risk premium | 6.93 | % | ||||||||||||||||||
| Plus: Current risk-free rate of return (2) | 5.42 | % | ||||||||||||||||||
| Plus: Equity size premium | 3.53 | % | ||||||||||||||||||
| Equals: Expected cost of equity | 15.88 | % | x | 100 | % | = | 15.88 | % | ||||||||||||
Debt: | ||||||||||||||||||||
| Effective overall tax rate | 39.00 | % | ||||||||||||||||||
| 1-Effective overall tax rate | 61.00 | % | ||||||||||||||||||
| Times: BAA bond rate (3) | 7.01 | % | ||||||||||||||||||
| Equals: after-tax cost of debt | 4.28 | % | x | 0 | % | = | 0.00 | % | ||||||||||||
Weighted Average Cost of Capital (Rounded) | 100 | % | = | 16.00 | % | |||||||||||||||
| NOTES: | ||||||
| (1) | A market risk premium based on Ibbotson Associates, Inc. Stocks, Bonds, Bills, and Inflation 2003 Yearbook, Market Results for 1926-2002. | |||||
| (2) | The current risk-free rate (Rf,Current) reported by the Federal Reserve Statistical Release as of the Valuation Date. | |||||
| (3) | The cost of debt reported by the Federal Reserve Statistical Release as of the Valuation Date. | |||||
| SSA Global Technologies | Exhibit 8.0 | |
| Acquisition of EXE Technologies | Developed Technology: Licenses | |
| Valuation Date: August 1, 2003 | ||
| ($ in 000’s) | ||
| Licenses | |||||||||||||||||||||||||
| Use Cost Structure: 1 | Historical | Full Yr. | Forecast | ||||||||||||||||||||||
| 2003 | 2004 | 2005 | 2006 | ||||||||||||||||||||||
Revenue | $ | — | $ | 43,606 | $ | 43,732 | $ | 38,487 | |||||||||||||||||
Revenue Growth | 0 | % | -12 | % | |||||||||||||||||||||
Cost of Sales | |||||||||||||||||||||||||
| Cost of Goods Sold | 21,367 | 19,679 | 15,780 | ||||||||||||||||||||||
| Total Cost of Sales | $ | 21,367 | $ | 19,679 | $ | 15,780 | |||||||||||||||||||
Gross Profit | $ | 22,239 | $ | 24,053 | $ | 22,707 | |||||||||||||||||||
| Gross Profit (%) | 51 | % | 55 | % | 59 | % | |||||||||||||||||||
Operating Expenses | |||||||||||||||||||||||||
| Sales and Marketing | 8,721 | 7,872 | 6,543 | ||||||||||||||||||||||
| Research and Development | 872 | 875 | 770 | ||||||||||||||||||||||
| General and Administrative | 6,105 | 5,248 | 3,849 | ||||||||||||||||||||||
| Compensation Expense | 872 | 875 | 385 | ||||||||||||||||||||||
| Depreciation | 687 | 710 | 650 | ||||||||||||||||||||||
| Total Operating Expenses | $ | 17,258 | $ | 15,579 | $ | 12,196 | |||||||||||||||||||
| Operating Income | $ | 4,982 | $ | 8,474 | $ | 10,511 | |||||||||||||||||||
Operating Income (%) | 11 | % | 19 | % | 27 | % | |||||||||||||||||||
| Income Tax @ 39% | 1,943 | 3,305 | 4,099 | ||||||||||||||||||||||
| Net Operating Income | $ | 3,039 | $ | 5,169 | $ | 6,412 | |||||||||||||||||||
Net Income (%) | 7 | % | 12 | % | 17 | % | |||||||||||||||||||
Contributory Asset Charges | |||||||||||||||||||||||||
| Capital Asset Charge | 519 | 466 | 374 | ||||||||||||||||||||||
| Depreciation | (687 | ) | (710 | ) | (650 | ) | |||||||||||||||||||
| Total Capital Charges | $ | (168 | ) | $ | (244 | ) | $ | (277 | ) | ||||||||||||||||
| Incremental Operating Income | $ | 3,207 | $ | 5,413 | $ | 6,688 | |||||||||||||||||||
| Discount Period (Years) | 0.50 | 1.50 | 2.50 | ||||||||||||||||||||||
| Discount Rate/Factor 17% | 92 | % | 79 | % | 68 | % | |||||||||||||||||||
| Present Value of Incremental Op. Income | $ | 2,964 | $ | 4,277 | $ | 4,517 | |||||||||||||||||||
| Sum of Present Value of Adj. Operating Income | $ | 11,759 | �� | ||||||||||||||||||||||
| Section 197 Tax Benefit | 2,071 | ||||||||||||||||||||||||
Fair Value of Dev. Technology | $ | 13,829 | |||||||||||||||||||||||
Note: Numbers may not tie directly due to rounding
| SSA Global Technologies | EXHIBIT 9.0 | |
| Acquisition of EXE Technologies | Customer Relationships: Maintenance | |
| Valuation Date: August 1, 2003 | ||
| ($ in 000’s) | ||
| Maintenance | ||||||||||||||||||||||||||||||||||||||||||||||||||||||||||
| Use Cost Structure: 2 | Historical | Full Yr. | ||||||||||||||||||||||||||||||||||||||||||||||||||||||||
| 2003 | 2004 | 2005 | 2006 | 2007 | 2008 | 2009 | 2010 | 2011 | 2012 | 2013 | ||||||||||||||||||||||||||||||||||||||||||||||||
Revenue | $ | 15,700 | $ | 18,840 | $ | 21,666 | $ | 24,049 | $ | 26,214 | $ | 28,311 | $ | 31,142 | $ | 33,633 | $ | 35,988 | $ | 38,147 | $ | 40,054 | ||||||||||||||||||||||||||||||||||||
| Revenue Growth | NM | 15 | % | 11 | % | 9 | % | 8 | % | 10 | % | 8 | % | 7 | % | 6 | % | 5 | % | |||||||||||||||||||||||||||||||||||||||
Cost of Sales | ||||||||||||||||||||||||||||||||||||||||||||||||||||||||||
| Cost of Goods Sold | 12,434 | 13,650 | 14,430 | 15,728 | 16,986 | 18,685 | 20,180 | 21,593 | 22,888 | 24,032 | ||||||||||||||||||||||||||||||||||||||||||||||||
| Total Cost of Sales | $ | 12,434 | $ | 13,650 | $ | 14,430 | $ | 15,728 | $ | 16,986 | $ | 18,685 | $ | 20,180 | $ | 21,593 | $ | 22,888 | $ | 24,032 | ||||||||||||||||||||||||||||||||||||||
| Gross Profit | $ | 6,406 | $ | 8,016 | $ | 9,620 | $ | 10,485 | $ | 11,324 | $ | 12,457 | $ | 13,453 | $ | 14,395 | $ | 15,259 | $ | 16,022 | ||||||||||||||||||||||||||||||||||||||
Gross Profit (%) | 34 | % | 37 | % | 40 | % | 40 | % | 40 | % | 40 | % | 40 | % | 40 | % | 40 | % | 40 | % | ||||||||||||||||||||||||||||||||||||||
Operating Expenses | ||||||||||||||||||||||||||||||||||||||||||||||||||||||||||
| Cost-to-Complete Sales and Marketing | 565 | 433 | 481 | 524 | 566 | 623 | 673 | 720 | 763 | 801 | ||||||||||||||||||||||||||||||||||||||||||||||||
| Research and Development | 2,449 | 2,600 | 2,405 | 2,621 | 2,548 | 2,803 | 3,027 | 3,239 | 3,433 | 3,605 | ||||||||||||||||||||||||||||||||||||||||||||||||
| General and Administrative | 2,638 | 2,600 | 2,405 | 2,359 | 2,265 | 2,491 | 2,691 | 2,879 | 3,052 | 3,204 | ||||||||||||||||||||||||||||||||||||||||||||||||
| Compensation Expense | 377 | 433 | 240 | 262 | 283 | 311 | 336 | 360 | 381 | 401 | ||||||||||||||||||||||||||||||||||||||||||||||||
| Depreciation | 297 | 352 | 406 | 461 | 510 | 251 | 272 | 297 | 323 | 348 | ||||||||||||||||||||||||||||||||||||||||||||||||
| Total Operating Expenses | $ | 6,326 | $ | 6,418 | $ | 5,938 | $ | 6,228 | $ | 6,172 | $ | 6,479 | $ | 6,999 | $ | 7,495 | $ | 7,953 | $ | 8,359 | ||||||||||||||||||||||||||||||||||||||
| Operating Income | $ | 80 | $ | 1,598 | $ | 3,682 | $ | 4,258 | $ | 5,153 | $ | 5,978 | $ | 6,454 | $ | 6,900 | $ | 7,306 | $ | 7,663 | ||||||||||||||||||||||||||||||||||||||
Operating Income (%) | 0 | % | 7 | % | 15 | % | 16 | % | 18 | % | 19 | % | 19 | % | 19 | % | 19 | % | 19 | % | ||||||||||||||||||||||||||||||||||||||
| Income Tax @ 39% | 31 | 623 | 1,436 | 1,661 | 2,009 | 2,331 | 2,517 | 2,691 | 2,849 | 2,989 | ||||||||||||||||||||||||||||||||||||||||||||||||
| Net Operating Income | $ | 49 | $ | 975 | $ | 2,246 | $ | 2,597 | $ | 3,143 | $ | 3,646 | $ | 3,937 | $ | 4,209 | $ | 4,457 | $ | 4,674 | ||||||||||||||||||||||||||||||||||||||
Net Income (%) | 0 | % | 4 | % | 9 | % | 10 | % | 11 | % | 12 | % | 12 | % | 12 | % | 12 | % | 12 | % | ||||||||||||||||||||||||||||||||||||||
Contributory Asset Charges | ||||||||||||||||||||||||||||||||||||||||||||||||||||||||||
| Capital Asset Charge | 224 | 231 | 233 | 231 | 222 | 225 | 240 | 255 | 269 | 281 | ||||||||||||||||||||||||||||||||||||||||||||||||
| Depreciation | (297 | ) | (352 | ) | (406 | ) | (461 | ) | (510 | ) | (251 | ) | (272 | ) | (297 | ) | (323 | ) | (348 | ) | ||||||||||||||||||||||||||||||||||||||
| Developed Technology Charge | 586 | 613 | 627 | 633 | 626 | 622 | 619 | 621 | 624 | 625 | ||||||||||||||||||||||||||||||||||||||||||||||||
| Total Capital Charges | $ | 513 | $ | 492 | $ | 454 | $ | 403 | $ | 338 | $ | 596 | $ | 587 | $ | 579 | $ | 570 | $ | 558 | ||||||||||||||||||||||||||||||||||||||
| Incremental Operating Income | $ | (465 | ) | $ | 483 | $ | 1,792 | $ | 2,194 | $ | 2,805 | $ | 3,050 | $ | 3,350 | $ | 3,631 | $ | 3,887 | $ | 4,116 | |||||||||||||||||||||||||||||||||||||
| Survivorship (relating to start) | 0.95 | 0.86 | 0.77 | 0.69 | 0.62 | 0.55 | 0.48 | 0.43 | 0.38 | 0.34 | ||||||||||||||||||||||||||||||||||||||||||||||||
| Growth Rate Adjustment Factor | 1.00 | 1.15 | 1.28 | 1.39 | 1.50 | 1.65 | 1.79 | 1.91 | 2.02 | 2.13 | ||||||||||||||||||||||||||||||||||||||||||||||||
| Adjustment Factor | 0.95 | 0.75 | 0.61 | 0.50 | 0.41 | 0.33 | 0.27 | 0.22 | 0.19 | 0.16 | ||||||||||||||||||||||||||||||||||||||||||||||||
| Surviving Operating Revenue | (442 | ) | 362 | 1,087 | 1,091 | 1,149 | 1,006 | 907 | 814 | 731 | 651 | |||||||||||||||||||||||||||||||||||||||||||||||
| Discount Period (Years) | 0.50 | 1.50 | 2.50 | 3.50 | 4.50 | 5.50 | 6.50 | 7.50 | 8.50 | 9.50 | ||||||||||||||||||||||||||||||||||||||||||||||||
| Discount Rate/Factor 17% | 92 | % | 79 | % | 68 | % | 58 | % | 49 | % | 42 | % | 36 | % | 31 | % | 26 | % | 23 | % | ||||||||||||||||||||||||||||||||||||||
| Present Value of Incremental Op. Income | $ | (408 | ) | $ | 286 | $ | 734 | $ | 630 | $ | 567 | $ | 424 | $ | 327 | $ | 251 | $ | 192 | $ | 147 | |||||||||||||||||||||||||||||||||||||
| Sum of Present Value of Adj. Operating Income | $ | 3,621 | ||||||||||||||||||||||||||||||||||||||||||||||||||||||||
| Section 197 Tax Benefit | 638 | |||||||||||||||||||||||||||||||||||||||||||||||||||||||||
Fair Value of Customer Relationships | $ | 4,259 | ||||||||||||||||||||||||||||||||||||||||||||||||||||||||
Note: Numbers may not tie directly due to rounding
| SSA Global Technologies | Exhibit 10.0 | |
| Acquisition of EXE Technologies | Fair Value of Workforce-In-Place | |
| Valuation Date: August 1, 2003 | ||
| Avoided Recruiting & Training Costs | ||||||||||||||||||||||||||||||
| Number of | Average | Recruiting | Estimated | Estimated | Avoided Recruit/ | |||||||||||||||||||||||||
| Position/Category | Employee | Base Salary | Cost % | Recruiting Cost | Training Cost | Train Cost (1) | ||||||||||||||||||||||||
| Sales and Marketing | 63 | $ | 95,000 | 2 | % | $ | 1,900 | $ | 950 | $ | 179,550 | |||||||||||||||||||
| Services | 160 | $ | 70,000 | 2 | % | $ | 1,400 | $ | 700 | $ | 336,000 | |||||||||||||||||||
| General and Administration | 64 | $ | 60,000 | 2 | % | $ | 1,200 | $ | 600 | $ | 115,200 | |||||||||||||||||||
| Research and Development | 68 | $ | 84,000 | 2 | % | $ | 1,680 | $ | 840 | $ | 171,360 | |||||||||||||||||||
| Total | 355 | $ | 802,110 | |||||||||||||||||||||||||||
| Less: Income Tax Deduction Benefit @ 39% | $ | (312,823 | ) | |||||||||||||||||||||||||||
| After-Tax Cost of Recruiting & Training: | $ | 489,287 | ||||||||||||||||||||||||||||
| Avoided Loss of Productivity Costs | ||||||||||||||||||||||||||
| Number of | Benefit | Starting | Time to Full | Avoided Productivity | ||||||||||||||||||||||
| Position/Category | Employees | Load | Efficiency | Productivity | Cost (2) | |||||||||||||||||||||
| Sales and Marketing | 63 | 12 | % | 60 | % | 4 | $ | 446,880 | ||||||||||||||||||
| Services | 160 | 12 | % | 75 | % | 3 | $ | 392,000 | ||||||||||||||||||
| General and Administration | 64 | 12 | % | 90 | % | 1 | $ | 17,920 | ||||||||||||||||||
| Research and Development | 68 | 12 | % | 75 | % | 3 | $ | 199,920 | ||||||||||||||||||
| Total | 355 | $ | 1,056,720 | |||||||||||||||||||||||
| Less: Income Tax Deduction Benefit @ 39% | $ | (412,121 | ) | |||||||||||||||||||||||
| After Tax Avoided Cost of Lost Productivity | $ | 644,599 | ||||||||||||||||||||||||
| Total of Avoided Cost | $ | 1,133,886 | ||||||||||||||||||||||||
| Add: Section 197 Tax Amortization Benefit | 199,680 | |||||||||||||||||||||||||
Fair Value of Workforce | $ | 1,333,566 | ||||||||||||||||||||||||
| NOTES: | ||||||
| 1) | Avoided Recruiting/Training Cost=[(Ave. Salary x Recruiting Cost%)+Training Cost] x Number of Employees. | |||||
| 2) | Productivity Cost=[(Ave. Salary x (1+Benefit Load)) x (1-Starting Eff.) x (Time/12) x 1/2] x Number of Employees. | |||||
| Appendix B - Limiting Conditions and Assumptions |
| 1. Report Distribution - This report has been prepared solely for the purpose stated and should not be used for any other purpose. Except as specifically stated in the report, neither our report nor its contents are to be referred to or quoted, in whole or in part, in any registration statement, prospectus, public filing, loan agreement, or other agreement or document without our prior written approval. In addition, except as set forth in the report, our analysis and report presentation are not intended for general circulation or publication, nor are they to be reproduced or distributed to other third parties without our prior written consent. 2. Scope of Analysis - The valuation of any financial instrument or business is a matter of informed judgment. The accompanying valuation has been prepared on the basis of information and assumptions set forth in the attached report, associated appendices, or underlying work papers, and these Limiting Conditions and Assumptions. 3. Nature of Opinion - Neither our opinion nor our report are to be construed as a fairness opinion as to the fairness of an actual or proposed transaction, a solvency opinion, or an investment recommendation, but, instead, are the expression of our determination of the fair value of the Acquired Assets between a hypothetical willing buyer and a hypothetical willing seller in an assumed transaction on an assumed valuation date. For various reasons, the price at which the Acquired Assets might be sold in a specific transaction between specific parties on a specific date might be significantly different from the fair value as expressed in our report. 4. Going Concern Assumption, No Undisclosed Contingencies - Our analysis: (i) assumes that as of the Valuation Date the Company and its assets will continue to operate as configured as a going concern; (ii) is based on the past and present financial condition of the Company and its assets as of the Valuation Date; and (iii) assumes that the Company had no undisclosed real or contingent assets or liabilities, no unusual obligations or substantial commitments, other than in the ordinary course of business, nor had any litigation pending or threatened that would have a material effect on our analyses. 5. Lack of Verification of Information Provided - We have relied on information supplied by the Company without audit or verification. We have assumed that all information furnished is complete, accurate and reflects management's good faith efforts to describe the status and prospects of the Company at the Valuation Date from an operating and a financial point of view. As part of this engagement, we have relied upon publicly available data from recognized sources of financial information which have not been verified in all cases. |
30
| 6. Reliance on Forecasted Data - Any use of management's projections or forecasts in our analysis does not constitute an examination or compilation of prospective financial statements in accordance with standards established by the American Institute of Certified Public Accountants ("AICPA"). We do not express an opinion or any other form of assurance on the reasonableness of the underlying assumptions or whether any of the prospective financial statements, if used, are presented in conformity with AICPA presentation guidelines. Further, there will usually be differences between prospective and actual results because events and circumstances frequently do not occur as expected and those differences may be material. 7. Subsequent Events - The terms of our engagement are such that we have no obligation to update this report or to revise the valuation because of events and transactions occurring subsequent to the Valuation Date. 8. Legal Matters - We assume no responsibility for legal matters including interpretations of either the law or contracts. We have made no investigation of legal title and have assumed that owner(s) claim(s) to property are valid. We have given no consideration to liens or encumbrances except as specifically stated. We assumed that all required licenses, permits, etc. are in full force and effect. We assume no responsibility for the acceptability of the valuation approaches used in our report as legal evidence in any particular court or jurisdiction. The suitability of our report and opinion for any legal forum is a matter for the client and the client's legal advisor to determine. 9. USPAP - Unless otherwise described in our opinion, it is understood that this engagement is not required to be conducted pursuant to the Uniform Standards of Professional Appraisal Practice. 10. Verification of Legal Description or Title - As part of this engagement, we will not assume any responsibility for matters of a legal nature. No investigation of legal description or title to the property will be made and we will assume that your claim to the property is valid. No consideration will be given to liens or encumbrances which may be against the property except as specifically stated as part of the financial statements you provide to us as part of this engagement. Full compliance with all applicable federal, state, local zoning, environmental and similar laws and regulations is assumed, unless otherwise stated, and responsible ownership and competent property management are assumed. 11. Verification of Hazardous Conditions - We will not investigate the extent of any hazardous substances that may exist as we are not qualified to test for such substances or conditions. If the presence of such substances, such as asbestos, urea formaldehyde foam insulation or other hazardous substances or environmental conditions may affect the value of the property, the value will be estimated predicated on the assumption that there is no such condition on or in the property or in such proximity thereto that it would cause a loss in value. No responsibility will be assumed for any such conditions, or for any expertise or engineering knowledge required to discover them. |
31

| 11. Condition of Property - We assume no liability whatsoever with respect to the condition of the subject property or for hidden or unapparent conditions, if any, of the subject property, subsoil or structures, and further assume no liability or responsibility whatsoever with respect to the correction of any defects which may now exist or which may develop in the future. Equipment components considered, if any, were assumed to be adequate for the needs of the property's improvements, and in good working condition, unless otherwise reported. 13. Zoning - It was assumed that all public and private zoning and use restrictions and regulations had been complied with, unless non-conformity was stated, defined and considered in the report. 14. The Americans with Disabilities Act ("ADA") - The ADA became effective January 26, 1992. The valuation professional will not make a specific compliance survey and analysis of this property to determine whether or not it is in conformity with the various detailed requirements of the ADA. It is possible that a compliance survey of the property, together with a detailed analysis of the requirements of the ADA, could reveal that the property is not in compliance with one or more of the requirements of the Act. If so, this fact could have a negative effect upon the value of the property. Since the valuation professional has no direct evidence relating to this issue, he will not consider possible non-compliance with the requirements of the ADA in estimating the value of the property. 15. Confidentiality - It is expressly understood that this Agreement and the work product resulting from the same are confidential and not for disclosure to any parties not a part of this Agreement. |
32