Searchable text section of graphics shown above
[LOGO] | Relational Investors LLC |
Welcome
Shareholder Value Forum
Sovereign Bancorp, Inc.
November 8, 2005
Disclaimer
The analyses presented in this document are based on information published by Sovereign Bancorp and others. Relational Investors LLC has relied upon these public disclosures without any ability or opportunity for independent verification.
On October 20, 2005, Relational Investors LLC (“Relational”), together with a number of affiliated persons and entities that may be deemed “participants” for purposes of the solicitation rules of the Securities and Exchange Commission (“SEC”), filed a preliminary proxy statement on Schedule 14A with the SEC relating to a possible solicitation of proxies from the shareholders of Sovereign Bancorp, Inc. (“Sovereign”) in connection with Relational’s nomination of Ralph Whitworth and David Batchelder for election to Sovereign’s board of directors at Sovereign’s 2006 Annual Meeting of shareholders. Relational will prepare and file with the SEC a definitive proxy statement relating to their nomination of Messrs. Whitworth and Batchelder and may file other proxy solicitation materials. RELATIONAL ANTICIPATES THAT IT WILL REVISE AND FILE THE PRELIMINARY PROXY STATEMENT IN RESPONSE TO SEC COMMENTS AND SHAREHOLDERS ARE URGED TO READ THE PRELIMINARY PROXY STATEMENT AS REVISED (AND THE DEFINITIVE PROXY STATEMENT, WHEN IT BECOMES AVAILABLE) BECAUSE IT CONTAINS IMPORTANT INFORMATION REGARDING RELATIONAL’S NOMINATION OF MESSRS. WHITWORTH AND BATCHELDER FOR ELECTION AS DIRECTORS. The preliminary proxy statement is, and the revised preliminary proxy statement and the definitive proxy statement (when they become available) will be, available for free at www.sec.gov, along with any other relevant documents. You may also obtain a free copy of the preliminary proxy statement, or the definitive proxy statement (when it becomes available), by contacting Maudie Holland of Relational at (858) 704-3321, or by sending an email to maudie@rillc.com. Information regarding the names, affiliation, and interests of persons who may be deemed to be participants in our solicitation of proxies of Sovereign’s shareholders is available in the preliminary proxy statement filed with the SEC on October 20, 2005.
2
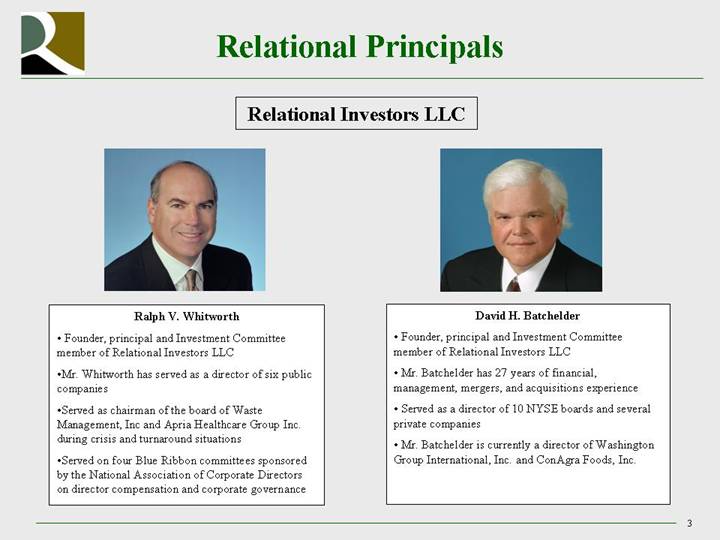
Relational Principals
Relational Investors LLC
[GRAPHIC] | | [GRAPHIC] |
| | |
Ralph V. Whitworth | | David H. Batchelder |
| | |
• Founder, principal and Investment Committee member of Relational Investors LLC • Mr. Whitworth has served as a director of six public companies • Served as chairman of the board of Waste Management, Inc and Apria Healthcare Group Inc. during crisis and turnaround situations • Served on four Blue Ribbon committees sponsored by the National Association of Corporate Directors on director compensation and corporate governance | | • Founder, principal and Investment Committee member of Relational Investors LLC • Mr. Batchelder has 27 years of financial, management, mergers, and acquisitions experience • Served as a director of 10 NYSE boards and several private companies • Mr. Batchelder is currently a director of Washington Group International, Inc. and ConAgra Foods, Inc. |
3
Forum Panel Members
[GRAPHIC] | | [GRAPHIC] |
| | |
John Eggemeyer | | Mark Merlo |
| | |
• Founder and CEO of Castle Creek Financial • 35 years experience in the banking industry • Involved in over $3 billion of mergers/acquisitions • Chairman of First Community Bancorp • Chairman and CEO of Centennial Bank Holdings, Inc. • Director of TCF Financial | | • Senior Vice President of Castle Creek Financial • Over 20 years of experience in the banking industry • Worked on over 150 different M&A transactions since 1996 • Previously worked at Mercantile Bancorp and United Postal Bancorporation • Director of State National Bancshares, Inc. |
4
[GRAPHIC]
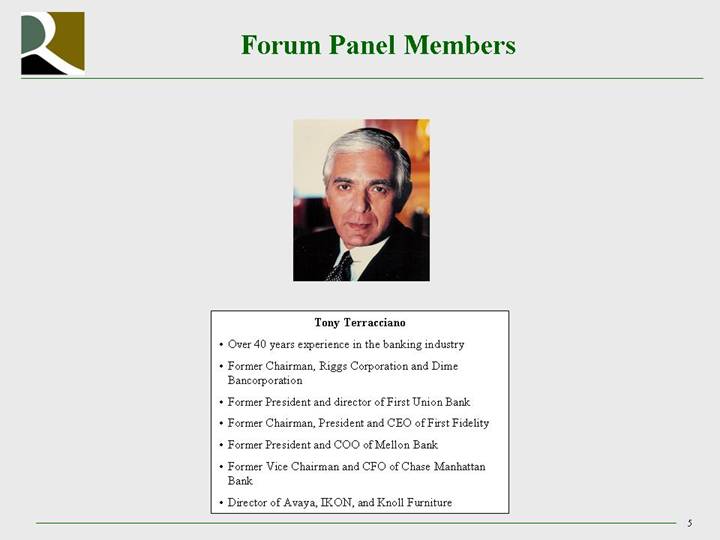
Tony Terracciano
• Over 40 years experience in the banking industry
• Former Chairman, Riggs Corporation and Dime Bancorporation
• �� Former President and director of First Union Bank
• Former Chairman, President and CEO of First Fidelity
• Former President and COO of Mellon Bank
• Former Vice Chairman and CFO of Chase Manhattan Bank
• Director of Avaya, IKON, and Knoll Furniture
5
Relational Investors LLC
• Founded in 1996 – $6 billion AUM; focus on equity market caps of $3 billion+
• 8 to 12 portfolio companies, proactive engagement
• Board representation at 7 companies, chaired 2 boards
• Voluntarily restricted from participating in leveraged buyouts, takeovers, and change in control initiatives
6
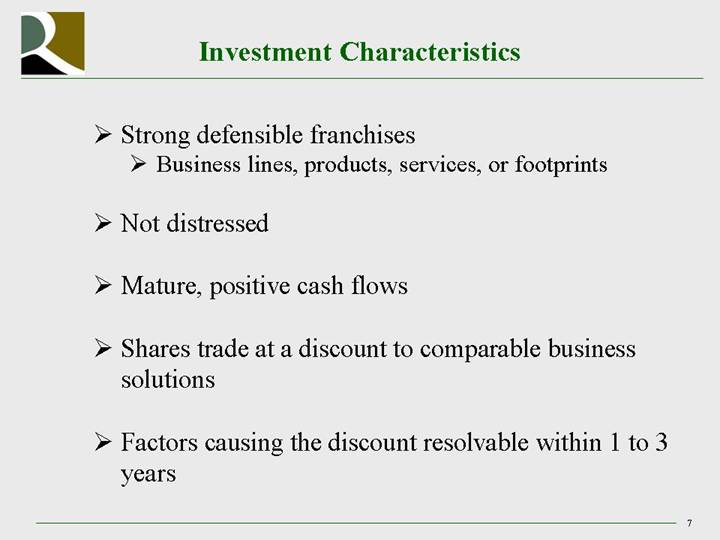
Investment Characteristics
• Strong defensible franchises
• Business lines, products, services, or footprints
• Not distressed
• Mature, positive cash flows
• Shares trade at a discount to comparable business solutions
• Factors causing the discount resolvable within 1 to 3 years
7
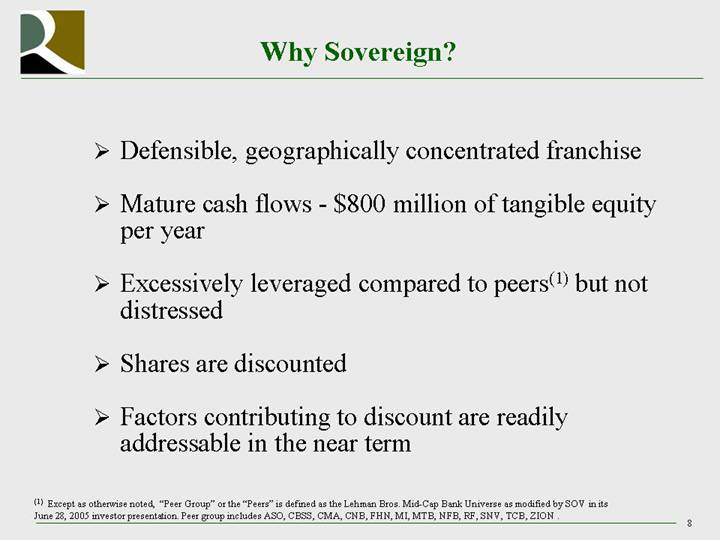
Why Sovereign?
• Defensible, geographically concentrated franchise
• Mature cash flows - $800 million of tangible equity per year
• Excessively leveraged compared to peers(1) but not distressed
• Shares are discounted
• Factors contributing to discount are readily addressable in the near term
(1) Except as otherwise noted, “Peer Group” or the “Peers” is defined as the Lehman Bros. Mid-Cap Bank Universe as modified by SOV in its June 28, 2005 investor presentation. Peer group includes ASO, CBSS, CMA, CNB, FHN, MI, MTB, NFB, RF, SNV, TCB, ZION.
8
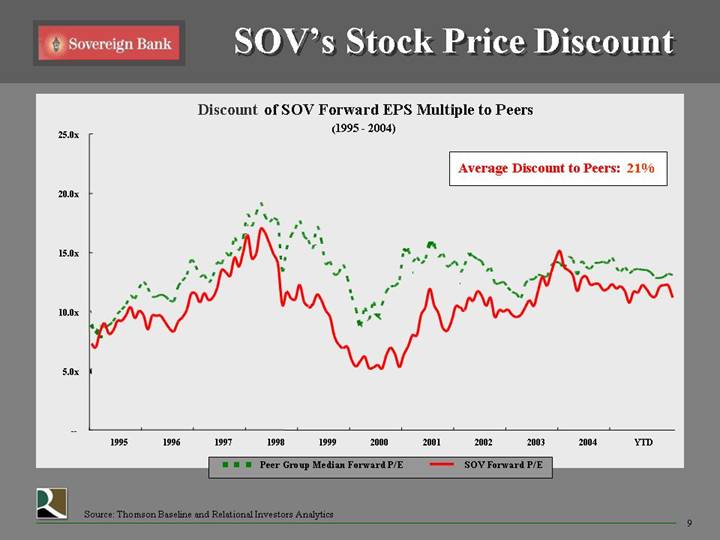
[LOGO] SOV’s Stock Price Discount
Discount of SOV Forward EPS Multiple to Peers
(1995 - 2004)
[CHART]
[LOGO] Source: Thomson Baseline and Relational Investors Analytics
9
Price to Forward EPS Discount/Premium to Peers
[CHART]
Source: Thomson Baseline and Relational Investors Analytics
10
Why we believe Sovereign shares are discounted
• Enterprise risk
• Operating performance
• Director conflicts of interest
• Management credibility
11
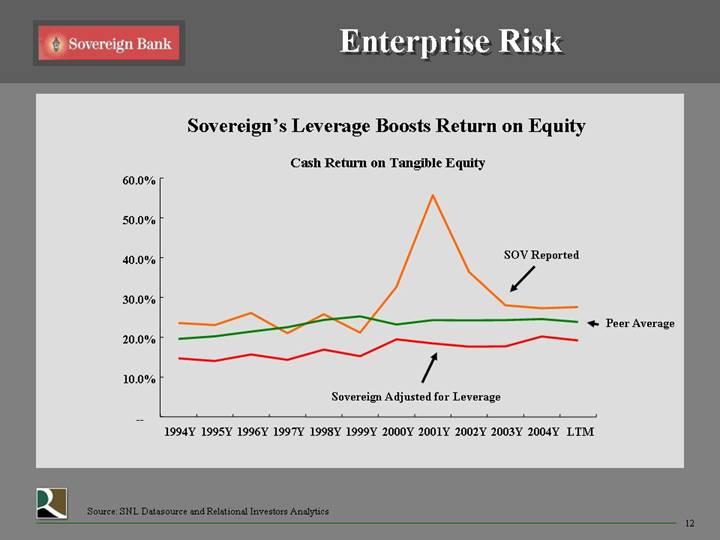
Enterprise Risk
Sovereign’s Leverage Boosts Return on Equity
Cash Return on Tangible Equity
[CHART]
Source: SNL Datasource and Relational Investors Analytics
12
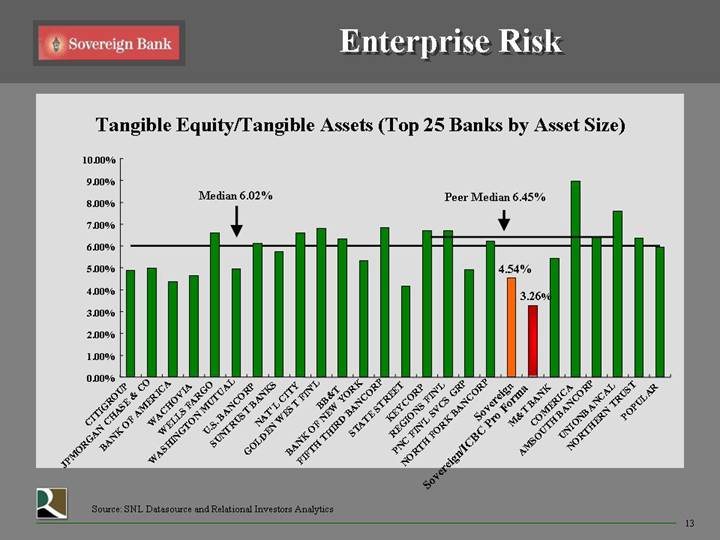
Tangible Equity/Tangible Assets (Top 25 Banks by Asset Size)
[CHART]
Source: SNL Datasource and Relational Investors Analytics
13
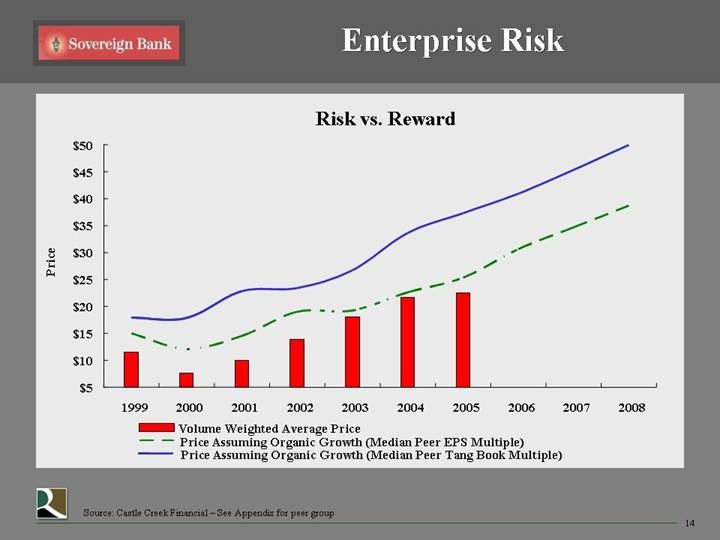
Risk vs. Reward
[CHART]
Source: Castle Creek Financial – See Appendix for peer group
14
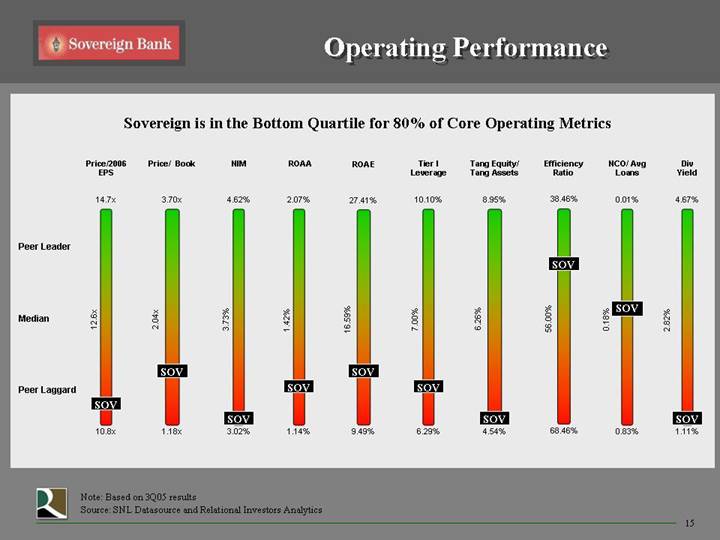
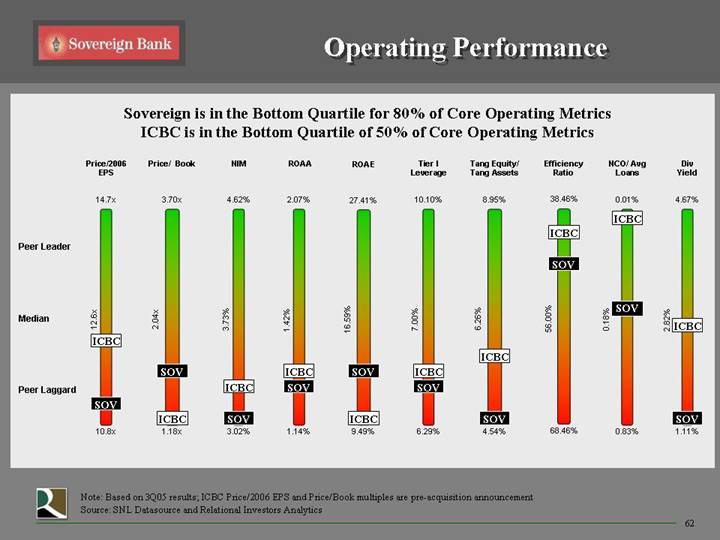
Operating Performance
Sovereign is in the Bottom Quartile for 80% of Core Operating Metrics
[CHART]
Note: Based on 3Q05 results
Source: SNL Datasource and Relational Investors Analytics
15
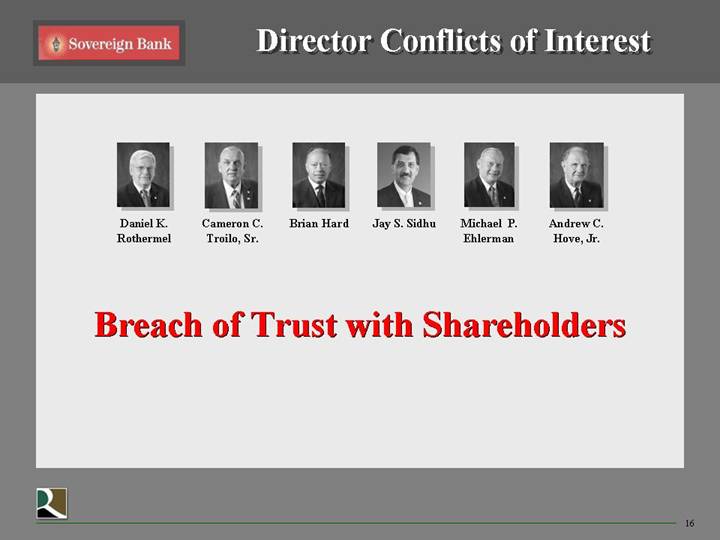
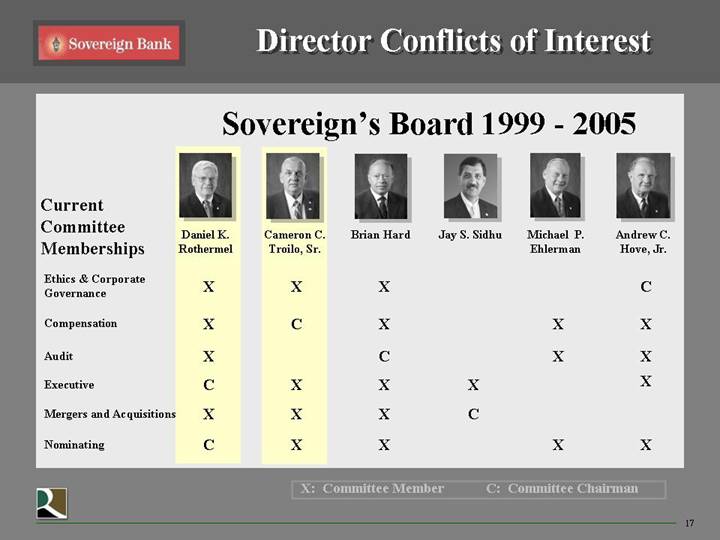
Director Conflicts of Interest
[GRAPHIC] | | [GRAPHIC] | | [GRAPHIC] | | [GRAPHIC] | | [GRAPHIC] | | [GRAPHIC] |
Daniel K. | | Cameron C. | | Brian Hard | | Jay S. Sidhu | | Michael P. | | Andrew C. |
Rothermel | | Troilo, Sr. | | | | | | Ehlerman | | Hove, Jr. |
Breach of Trust with Shareholders
16
Sovereign’s Board 1999 -2005
| | [GRAPHIC] | | [GRAPHIC] | | [GRAPHIC] | | [GRAPHIC] | | [GRAPHIC] | | [GRAPHIC] | |
Current | | | | | | | | | | | | | |
Committee | | Daniel K. | | Cameron C. | | Brian Hard | | Jay S. Sidhu | | Michael P. | | Andrew C. | |
Memberships | | Rothermel | | Troilo, Sr. | | | | | | Ehlerman | | Hove, Jr. | |
Ethics & Corporate Governance | | X | | X | | X | | | | | | C | |
| | | | | | | | | | | | | |
Compensation | | X | | C | | X | | | | X | | X | |
| | | | | | | | | | | | | |
Audit | | X | | | | C | | | | X | | X | |
| | | | | | | | | | | | | |
Executive | | C | | X | | X | | X | | | | X | |
| | | | | | | | | | | | | |
Mergers and Acquisitions | | X | | X | | X | | C | | | | | |
| | | | | | | | | | | | | |
Nominating | | C | | X | | X | | | | X | | X | |
| X: Committee Member | | C: Committee Chairman |
17
[GRAPHIC]
B. General Policy
Sovereign must have the confidence of its customers and the public. Directors and Team Members must avoid conflicts or the appearance of conflicts, as discussed above.
18
[GRAPHIC]
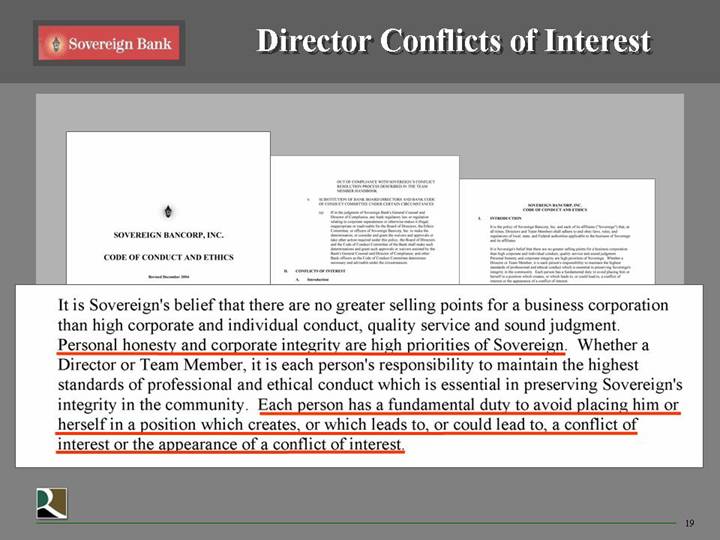
It is Sovereign’s belief that there are no greater selling points for a business corporation than high corporate and individual conduct, quality service and sound judgment. Personal honesty and corporate integrity are high priorities of Sovereign. Whether a Director or Team Member, it is each person’s responsibility to maintain the highest standards of professional and ethical conduct which is essential in preserving Sovereign’s integrity in the community. Each person has a fundamental duty to avoid placing him or herself in a position which creates, or which leads to, or could lead to, a conflict of interest or the appearance of a conflict of interest.
19
[GRAPHIC]
Act as a Fiduciary
As a fiduciary, you must think and act independently and in the best interests of the association. When acting in an official capacity, your personal interests and those of your family and associates must be subordinate to the best interests of the association. You should evaluate issues in terms of the associations resources and capabilities, the reasonableness of risk and returns, and any potential adverse
Department of the Treasury
20
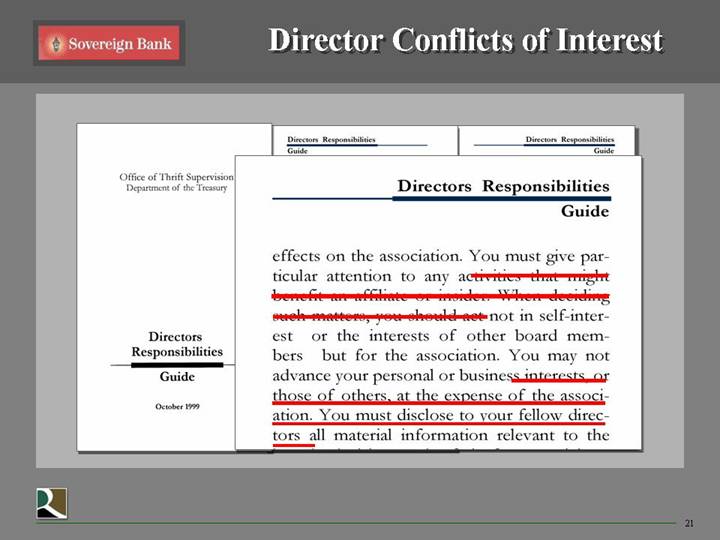
[GRAPHIC]
Directors Responsibilities
Guide
effects on the association. You must give particular attention to any activities that might benefit an affiliate or insider. When deciding such matters, you should act not in self-interest or the interests of other board members but for the association. You may not advance your personal or business interests, or those of others, at the expense of the association. You must disclose to your fellow directors all material information relevant to the
21
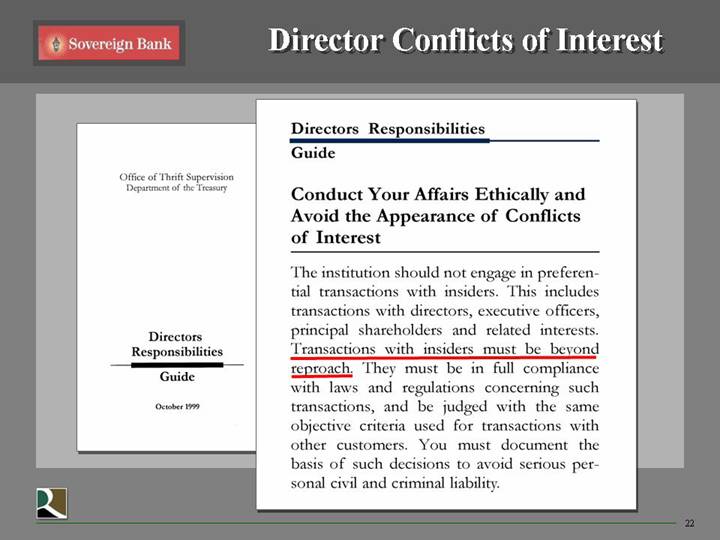
[GRAPHIC]
Conduct Your Affairs Ethically and Avoid the Appearance of Conflicts of Interest
The institution should not engage in preferential transactions with insiders. This includes transactions with directors, executive officers, principal shareholders and related interests. Transactions with insiders must be beyond reproach. They must be in full compliance with laws and regulations concerning such transactions, and be judged with the same objective criteria used for transactions, with other customers. You must document the basis of such decisions to avoid serious personal civil and criminal liability.
22
[GRAPHIC]
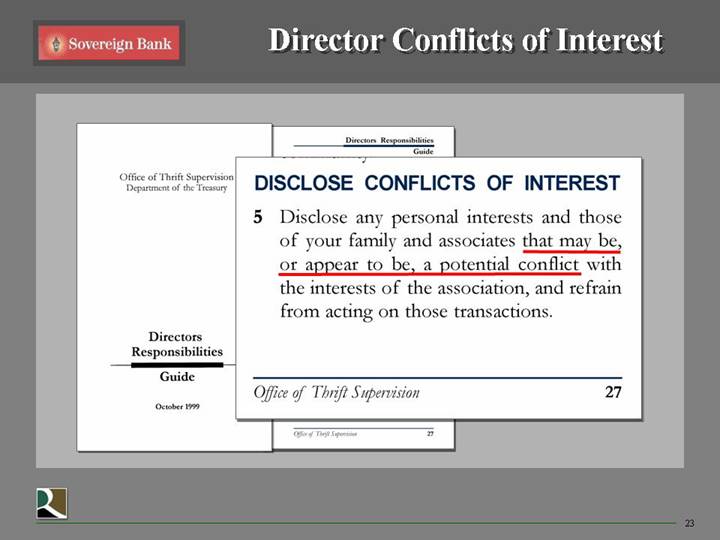
DISCLOSE CONFLICTS OF INTEREST
5 Disclose any personal interests and those of your family and associates that may be, or appear to be, a potential conflict with the interests of the association, and refrain from acting on those transactions.
Office of Thrift Supervision
23
[GRAPHIC]
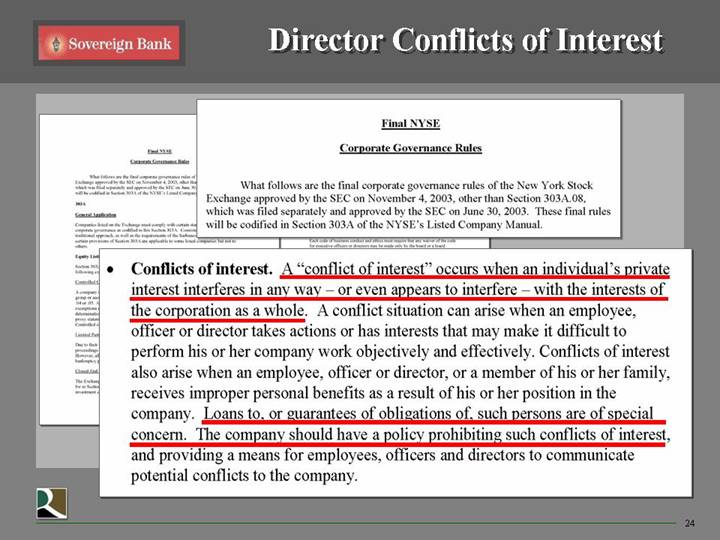
• Conflicts of interest. A “conflict of interest” occurs when an individual’s private interest interferes in any way – or even appears to interfere – with the interests of the corporation as a whole. A conflict situation can arise when an employee, officer or director takes actions or has interests that may make it difficult to perform his or her company work objectively and effectively. Conflicts of interests also arise when an employee, officer or director, or a member of his or her family, receives improper personal benefits as a result of his or her position in the company. Loans to, or guarantees of obligations of, such persons are of special concern. The company should have a policy prohibiting such conflicts of interest, and providing a means for employees, officers and directors to communicate potential conflicts to the company.
24
Skyrocketing Related Party Loans
1999 - 2004
[CHART]
Source: SOV’s Thrift Financial Reports filed with the OTS for corresponding periods
25
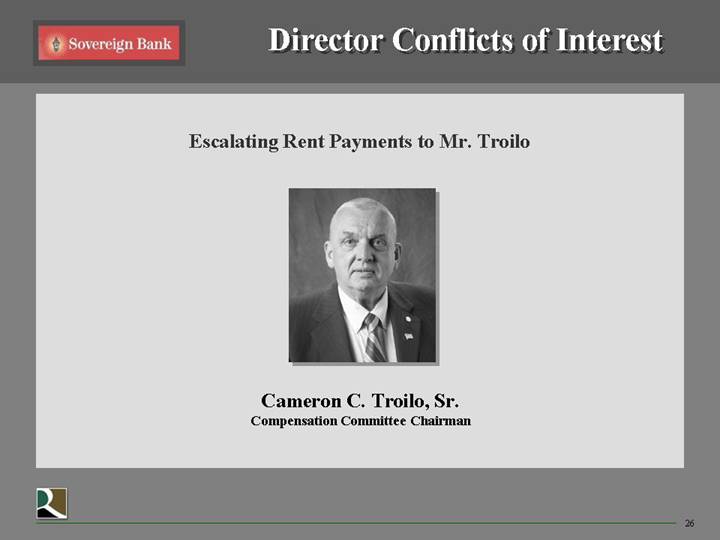
Escalating Rent Payments to Mr. Troilo
[GRAPHIC]
Cameron C. Troilo, Sr.
Compensation Committee Chairman
26
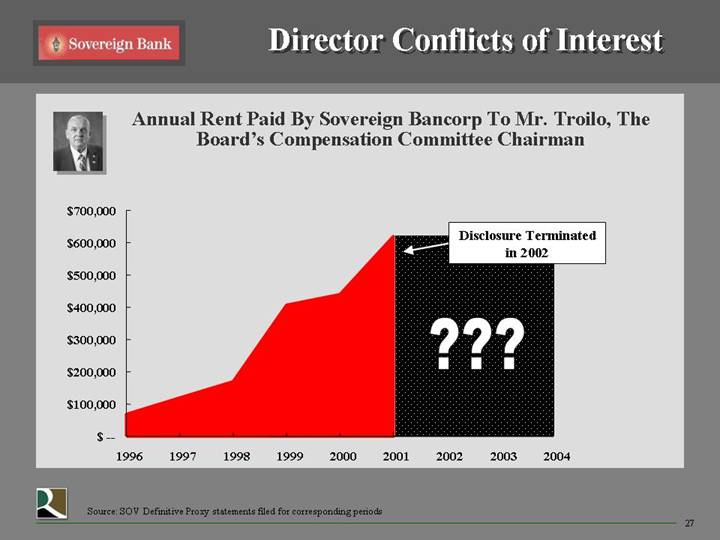
[GRAPHIC] | Annual Rent Paid By Sovereign Bancorp To Mr. Troilo, The Board’s Compensation Committee Chairman | |
[CHART]
Source: SOV Definitive Proxy statements filed for corresponding periods
27
• From 1996 to 2001, rent paid to Troilo and affiliates increased 803%
• The board suddenly stopped reporting the amount of rent paid to Mr. Troilo after 2002
• The 2003 Proxy Statement reported the relationship as follows:
“The Board also concluded that a landlord and tenant relationship between another non-management director and Sovereign Bank did not affect the independence of that director …”
28
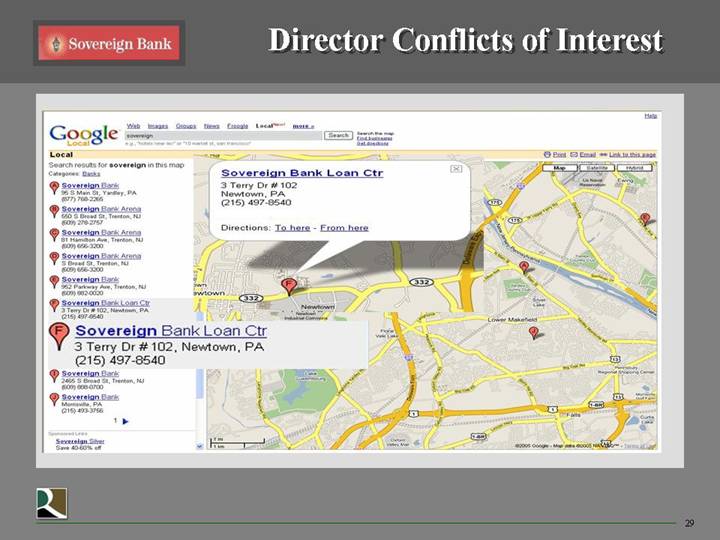
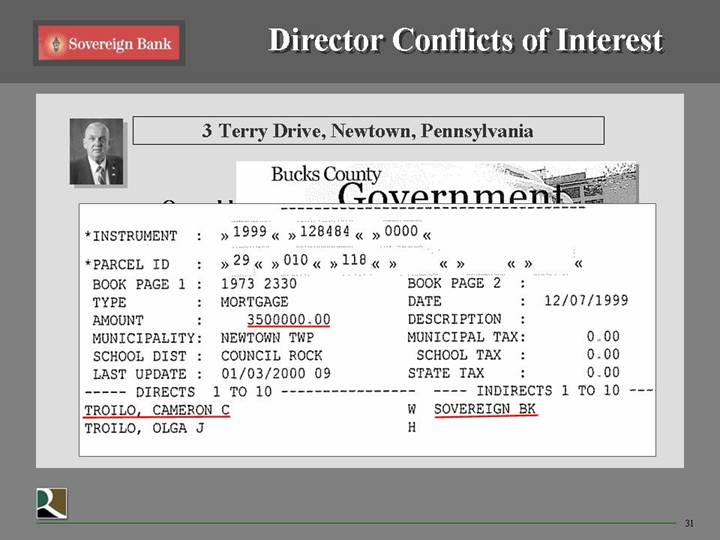
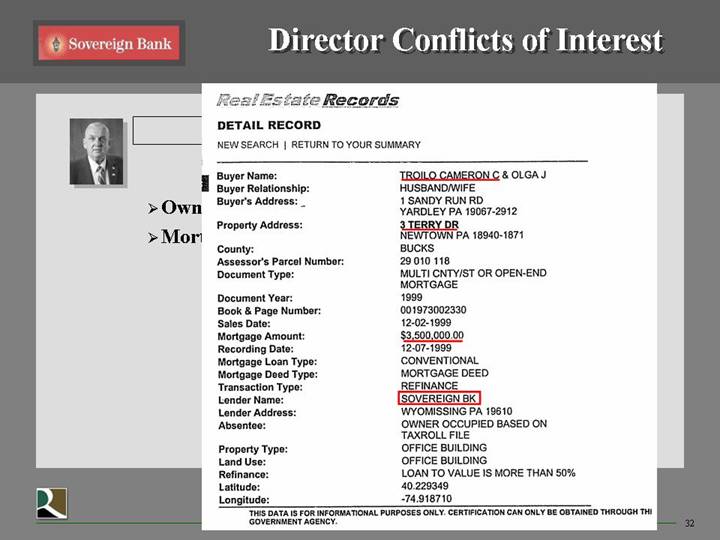
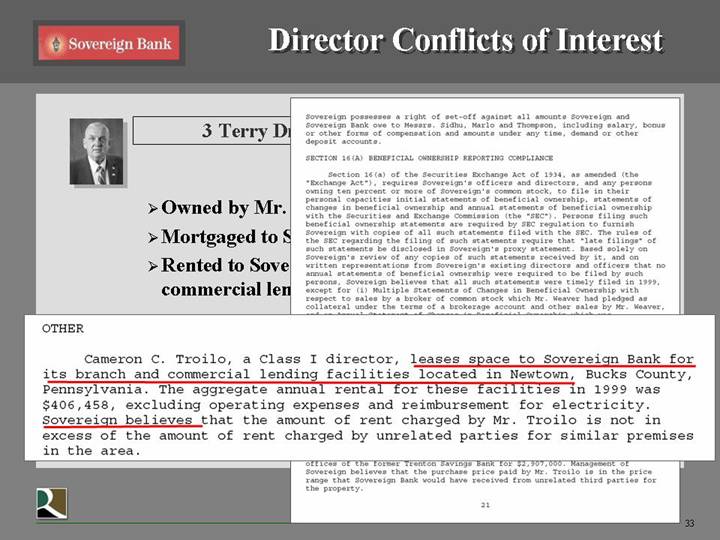
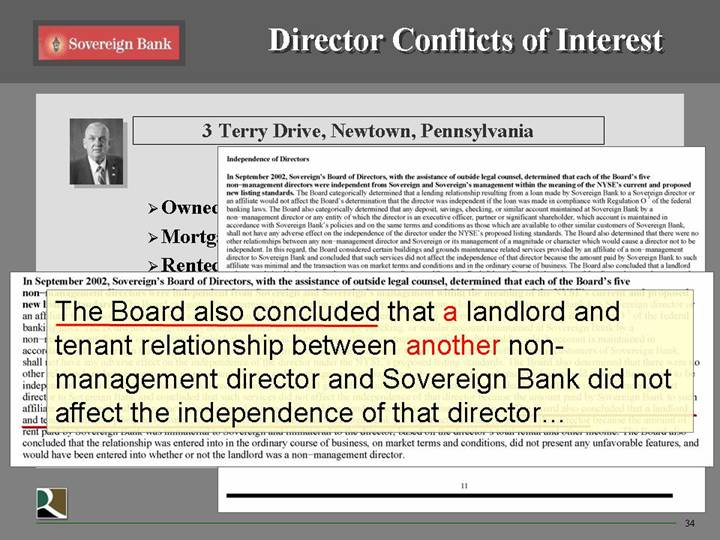
3 Terry Drive, Newtown, Pennsylvania
• Owned by Mr. Troilo
• Mortgaged to Sovereign to secure $3.5 Million loan
• Rented to Sovereign for use as a loan service center and a branch
• The proxy failed to mention that Sovereign also held a mortgage against the property
• In 2003 disclosure deteriorated
30
[GRAPHIC]
* INSTRUMENT | : | 1999 | | 128484 | | 0000 | | |
* PARCEL ID | | 29 | | 010 | | 118 | | |
BOOK PAGE 1 | : | 1973 2330 | | | | BOOK PAGE 2 | : | |
TYPE | : | MORTGAGE | | | | DATE | : | 12/07/1999 |
AMOUNT | : | 3500000.00 | | | | DESCRIPTION | : | |
MUNICIPALITY | : | NEWTOWN TWP | | | | MUNICIPAL TAX | : | 0.00 |
SCHOOL DIST | : | COUNCIL ROCK | | | | SCHOOL TAX | : | 0.00 |
LAST UPDATE | : | 01/03/2000 09 | | | | STATE TAX | : | 0.00 |
DIRECTS 1 TO 10 | | INDIRECTS 1 TO 10 |
TROILO, CAMERON C | | | | | | W | SOVEREIGN BK | |
TROILO, OLGA J | | | | | | H | | |
| | | | | | | | | | |
31
[GRAPHIC]
Real Estate Records
DETAIL RECORD
NEW SEARCH / RETURN TO YOUR SUMMARY
Buyer Name: | | TROILO CAMERON C & OLGA J |
Buyer Relationship: | | HUSBAND/WIFE |
Buyer’s Address: | | 1 SANDY RUN RD |
| | YARDLEY PA 19067-2912 |
| | |
Property Address: | | 3 TERRY DR |
| | NEWTOWN PA 18940-1871 |
County: | | BUCKS |
Assessor’s Parcel Number: | | 29 010 118 |
Document Type: | | MULTI CNTY/ST OR OPEN-END |
| | MORTGAGE |
Document Year: | | 1999 |
Book & Page Number: | | 001973002330 |
Sales Date: | | 12-02-1999 |
Mortgage Amount: | | $3,500,000.00 |
Recording Date: | | 12-07-1999 |
Mortgage Loan Type: | | CONVENTIONAL |
Mortgage Deed Type: | | MORTGAGE DEED |
Transaction Type: | | REFINANCE |
Lender Name: | | SOVEREIGN BK |
Lender Address: | | WYOMISSING PA 19610 |
Absentee: | | OWNER OCCUPIED BASED ON |
| | TAXROLL FILE |
Property Type: | | OFFICE BUILDING |
Land Use: | | OFFICE BUILDING |
Refinance: | | LOAN TO VALUE IS MORE THAN 50% |
Latitude: | | 40.229349 |
Longitude: | | -74.918710 |
THIS DATA IS FOR INFORMATIONAL PURPOSES ONLY. CERTIFICATION CAN ONLY BE OBTAINED THROUGH THIS GORVERNMENT AGENCY.
32
[GRAPHIC]
OTHER
Cameron C. Troilo, a Class I director, leases space to Sovereign Bank for its branch and commercial lending facilities located in Newtown, Bucks County, Pennsylvania. The aggregate annual rental for these facilities in 1999 was $406,458, excluding operating expenses and reimbursement for electricity. Sovereign believes that the amount of rent charged by Mr. Troilo is not in excess of the amount of rent charged by unrelated parties for similar premises in the area.
33
[GRAPHIC]
The Board also concluded that a landlord and tenant relationship between another non-management director and Sovereign Bank did not affect the independence of that director…
34
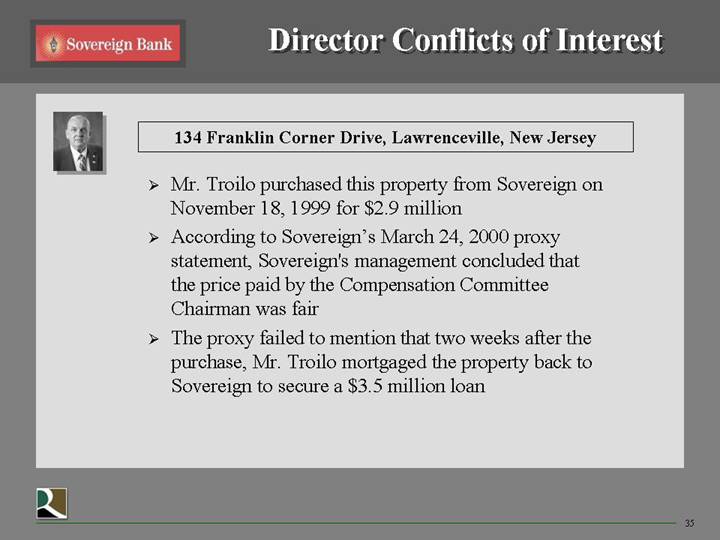
134 Franklin Corner Drive, Lawrenceville, New Jersey
• Mr. Troilo purchased this property from Sovereign on November 18, 1999 for $2.9 million
• According to Sovereign’s March 24, 2000 proxy statement, Sovereign’s management concluded that the price paid by the Compensation Committee Chairman was fair
• The proxy failed to mention that two weeks after the purchase, Mr. Troilo mortgaged the property back to Sovereign to secure a $3.5 million loan
35
[GRAPHIC]
DEED
THIS DEED is dated November 10, 1999,
BETWEEN | SOVEREIGN BANK (successor by merger to Trenton Savings Bank), a bank organized under the laws of the United States of America, having an address of 1130 Berkshire Boulevard, Wyomissing, Pennsylvania 19610 (the “Grantor”). |
| |
AND | CAMERON C. TROILO and OLGA JEAN TROILO, individuals, having an address of 1 Sandy Rim Road, Yardley, Pennsylvania 19067 (the “Grantee”). |
1. Transfer of Ownership. In consideration for the sum of Two Million Nine Hundered Seven Thousand ($2,907,000,00) Dollars, the receipt and sufficiency of which are hereby acknowledged, the Grantor hereby sells, grants and conveys the Property (as defined below) to the Grantee.
36
[GRAPHIC]
In December 1999, Mr. Troilo purchased from Sovereign Bank the corporate offices of the former Trenton Savings Bank for $2,907,000. Management of Sovereign believes that the purchase price paid by Mr. Troilo is in the price range that Sovereign Bank would have received from unrelated third parties for the property.
37
[GRAPHIC]
MORTGAGE AND SECURITY AGREEMENT
THIS MORTGAGE AND SECURITY AGREEMENT (the “Mortgage”) is made on December 2, 1999, by CAMERON C. TROILO AND OLGA J. TROILO, husband and wife (jointly and severally, the “Mortgagor”), in favor of SOVEREIGN BANK, a federal savings bank (the “Mortgage”). Intending To Mortgagor hereby agrees as follows:
ARTICLE I - OBLIGATIONS SECURED
1.01 Loan. Mortgagor has borrowed and is indebted to Mortgagee in the Principal Sum of THREE MILLION FIVE HUNDRED THOUSAND DOLLARS ($3,500,000,00) (the “Loan”) to be repaid to Mortgagee with interest thereon, pursuant to a promissory note of even [ILLEGIBLE] herewith, and any renewals, extensions or modifications thereof, the terms of which are hereby incorporated herein by reference thereto (the “Note”). The Loan has been, or will be, advanced to the Mortgagor by the Mortgagee in accordance with the terms of a loan agreement between Mortgagor and Mortgagee executed on or about the date hereof (the “Loan Agreement”). The Mortgagor has also executed and delivered to the Mortgagee other documents pertaining to the Loan and the repayment thereof, including, but not limited to assignments, certifications, indemnifications and other Loan Documents (as defined below).
38
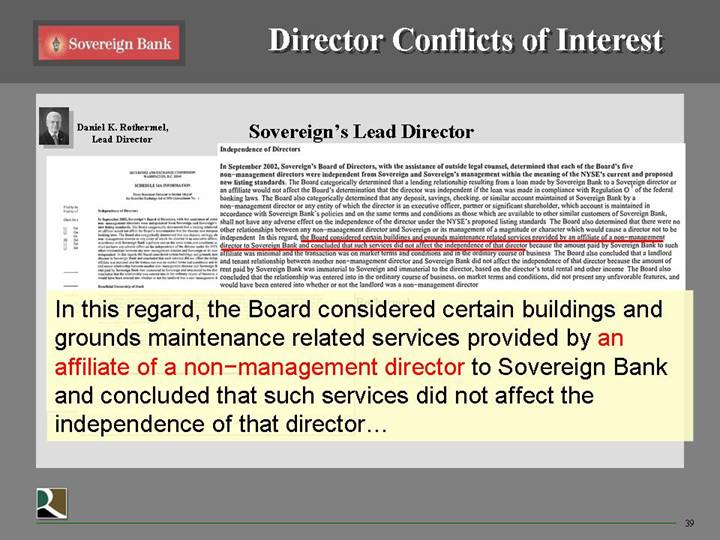
[GRAPHIC]
In this regard, the Board considered certain buildings and grounds maintenance related services provided by an affiliate of a non-management director to Sovereign Bank and concluded that such services did not affect the independence of that director…
39
[GRAPHIC]
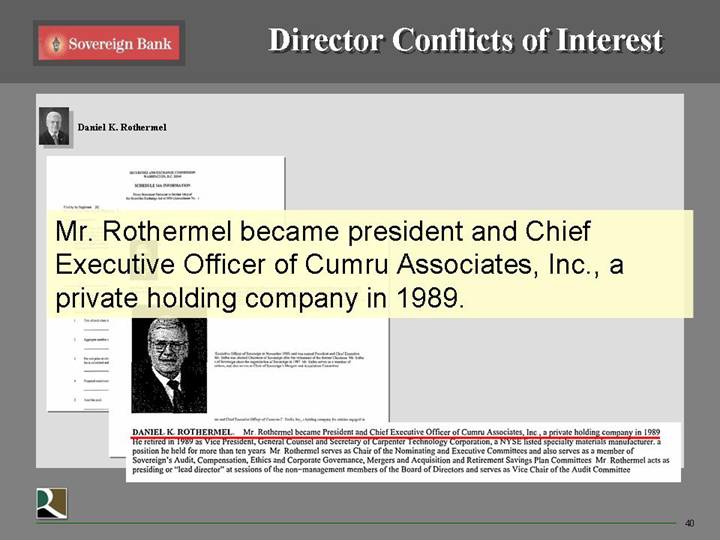
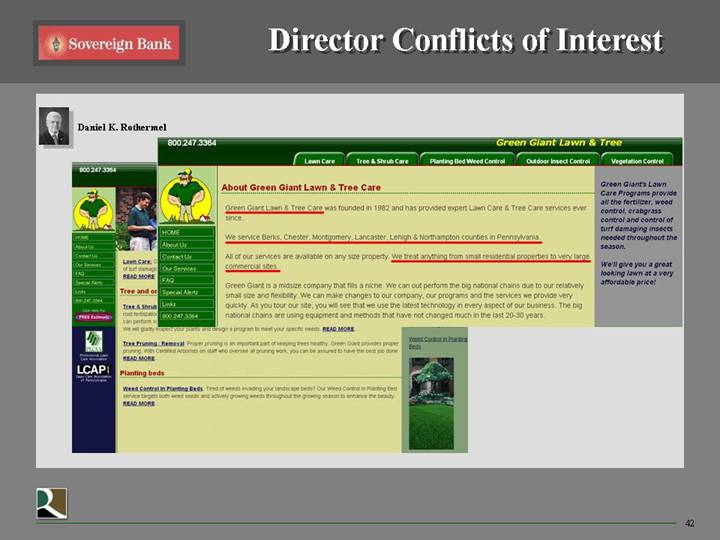
Mr. Rothermel became president and Chief Executive Officer of Cumru Associates, Inc., a private holding company in 1989.
40
[GRAPHIC]
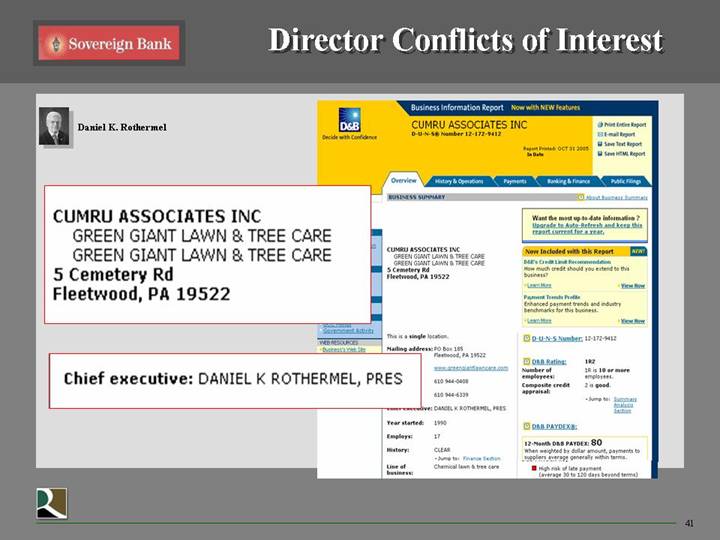
CUMRU ASSOCIATES INC
GREEN GIANT LAWN & TREE CARE
GREEN GIANT LAWN & TREE CARE
5 Cemetery Rd
Fleetwood, PA 19522
Chief executive: DANIEL K ROTHERMEL, PRES
41
[GRAPHIC]
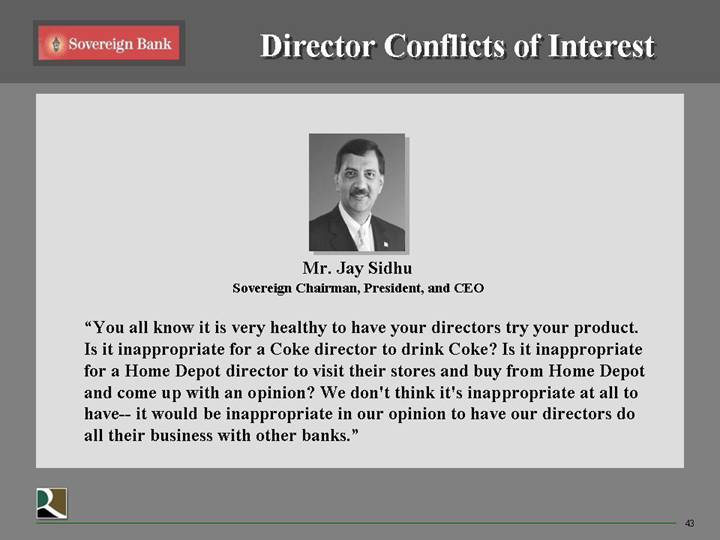
Mr. Jay Sidhu
Sovereign Chairman, President, and CEO
“You all know it is very healthy to have your directors try your product. Is it inappropriate for a Coke director to drink Coke? Is it inappropriate for a Home Depot director to visit their stores and buy from Home Depot and come up with an opinion? We don’t think it’s inappropriate at all to have— it would be inappropriate in our opinion to have our directors do all their business with other banks.”
43
[GRAPHIC]
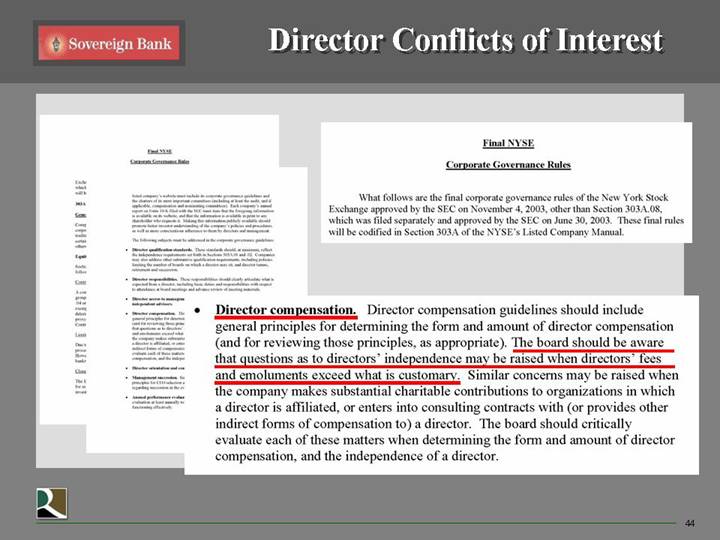
• Director compensation. Director compensation guidelines should include general principles for determining the form and amount of director compensation (and for reviewing those principles, as appropriate). The board should be aware that questions as to directors’ independence may be raised when directors’ fees and emoluments exceed what is customary. Similar concerns may be raised when the company makes substantial charitable contributions to organizations in which a director is affiliated, or enters into consulting contracts with (or provides other indirect forms of compensation to) a director. The board should critically evaluate each of these matters when determining the form and amount of director compensation, and the independence of a director.
44
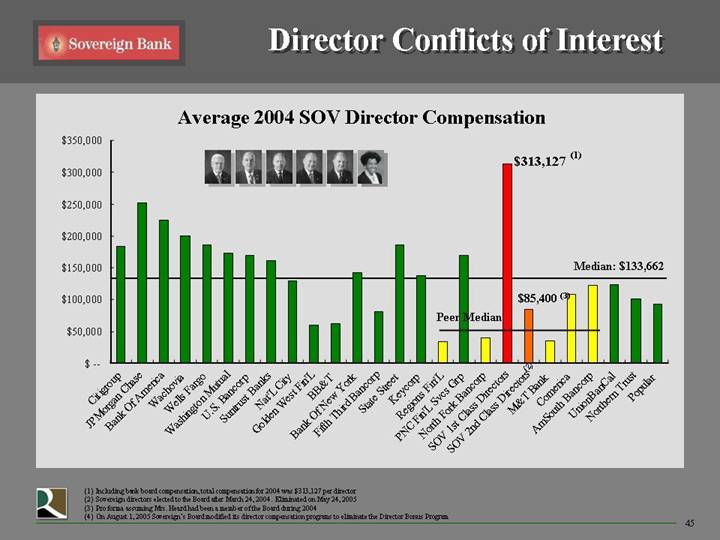
Average 2004 SOV Director Compensation
[CHART]
(1) Including bank board compensation, total compensation for 2004 was $313,127 per director
(2) Sovereign directors elected to the Board after March 24, 2004. Eliminated on May 24, 2005
(3) Pro forma assuming Mrs. Heard had been a member of the Board during 2004
(4) On August 1, 2005 Sovereign’s Board modified its director compensation programs to eliminate the Director Bonus Program
45
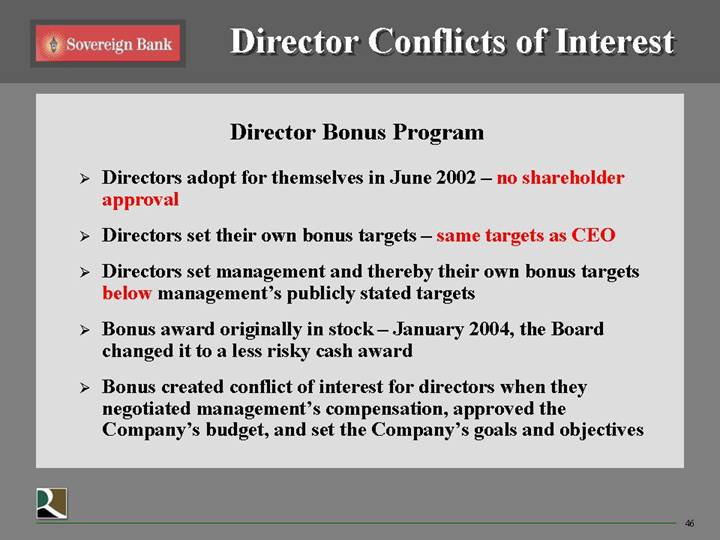
Director Bonus Program
• Directors adopt for themselves in June 2002 – no shareholder approval
• Directors set their own bonus targets – same targets as CEO
• Directors set management and thereby their own bonus targets below management’s publicly stated targets
• Bonus award originally in stock – January 2004, the Board changed it to a less risky cash award
• Bonus created conflict of interest for directors when they negotiated management’s compensation, approved the Company’s budget, and set the Company’s goals and objectives
46
2004 Director Compensation Compared to Peers
[CHART]
47
Sovereign and its Shareholders
Sovereign’s Approach To Shareholder Rights
• Mr. Sidhu’s response to shareholder questions:
• Mr. Sidhu was quoted in the May 2005 issue of Institutional Investor Magazine as having stated: “If [shareholders] don’t trust us, then they should sell the goddamned stock and never ask another question! We will always do what is right… And those who don’t believe that, they should…get the hell out of our stock!”
• Mr. Sidhu said at Ryan Beck Investor Conference on November 2, 2005: “…when you don’t require a shareholder vote, then you have to spend all the extra money, all the extra expense to make all the decisions that need to be made. You don’t have a shareholder vote.”
48
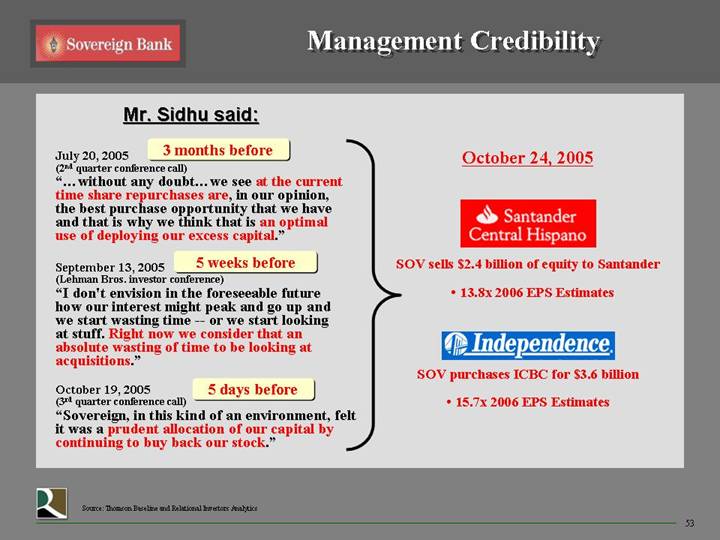
Management Credibility
[GRAPHIC]
Mr. Jay Sidhu
Sovereign Chairman, President, and CEO
Statements about Acquisitions
49
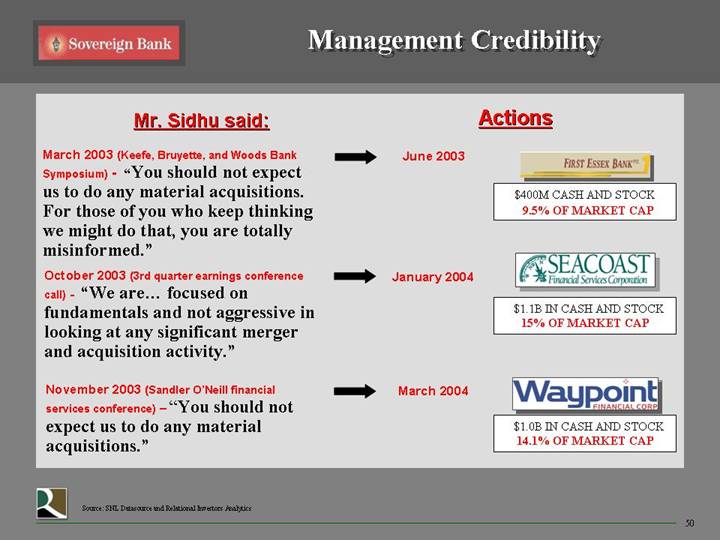
Mr. Sidhu said: | | Actions | |
| | | | | |
March 2003 (Keefe, Bruyette, and Woods Bank Symposium) - “You should not expect us to do any material acquisitions. For those of you who keep thinking we might do that, you are totally misinformed.” | | June 2003 | | [LOGO]
$400M CASH AND STOCK
9.5% OF MARKET CAP | |
| | | | | |
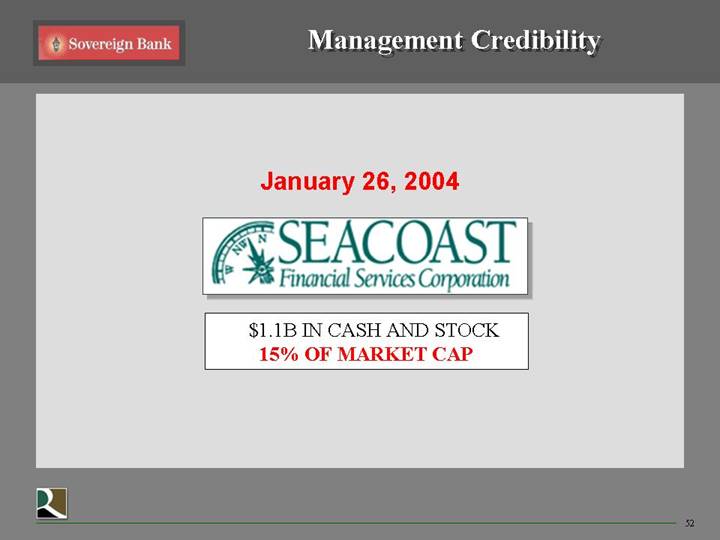
October 2003 (3rd quarter earnings conference call) - “We are… focused on fundamentals and not aggressive in looking at any significant merger and acquisition activity.” | | January 2004 | | [LOGO]
$1.1B IN CASH AND STOCK
15% OF MARKET CAP | |
| | | | | |
November 2003 (Sandler O’Neill financial services conference) - “You should not expect us to do any material acquisitions.” | | March 2004 | | [LOGO]
$1.0B IN CASH AND STOCK
14.1% OF MARKET CAP | |
Source: SNL Datasource and Relational Investors Analytics
50
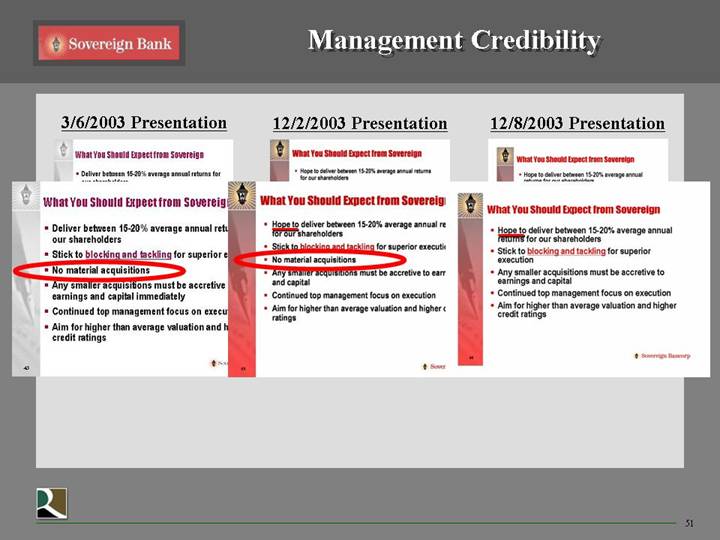
3/6/2003 Presentation | 12/2/2003 Presentation | 12/8/2003 Presentation |
[GRAPHIC] | [GRAPHIC] | [GRAPHIC] |
51
January 26, 2004
[LOGO]
$1.1B IN CASH AND STOCK
15% OF MARKET CAP
52
Mr. Sidhu said: | | |
| | |
3 months before | | October 24, 2005 [LOGO] SOV sells $2.4 billion of equity to Santander • 13.8x 2006 EPS Estimates [LOGO] SOV purchases ICBC for $3.6 billion • 15.7x 2006 EPS Estimates |
| |
July 20, 2005
(2nd quarter conference call)
“…without any doubt…we see at the current time share repurchases are, in our opinion, the best purchase opportunity that we have and that is why we think that is an optimal use of deploying our excess capital.” | |
| |
5 weeks before | |
| |
September 13, 2005
(Lehman Bros. investor conference)
“I don’t envision in the foreseeable future how our interest might peak and go up and we start wasting time — or we start looking at stuff. Right now we consider that an absolute wasting of time to be looking at acquisitions.” | |
| |
5 days before | |
| |
October 19, 2005
(3rd quarter conference call)
“Sovereign, in this kind of an environment, felt it was a prudent allocation of our capital by continuing to buy back our stock.” | |
Source: Thomson Baseline and Relational Investors Analytics
53
Mr. Sidhu said: | | |
| | |
1 day after | | October 24, 2005 [LOGO] SOV sells $2.4 billion of equity to Santander • 13.8x 2006 EPS Estimates [LOGO] SOV purchases ICBC for $3.6 billion • 15.7x 2006 EPS Estimates |
| |
October 25, 2005 | |
“The first serious discussion was in February or March, maybe January. Met with them [Santander] in London, met with them in New York, many, many, many times.” | |
| |
1 week after | |
| |
November 2, 2005 | |
“[On July 20, 2005] we were in the midst of some of the negotiations with [Santander].” | |
| |
| |
Source: Thomson Baseline and Relational Investors Analytics
54
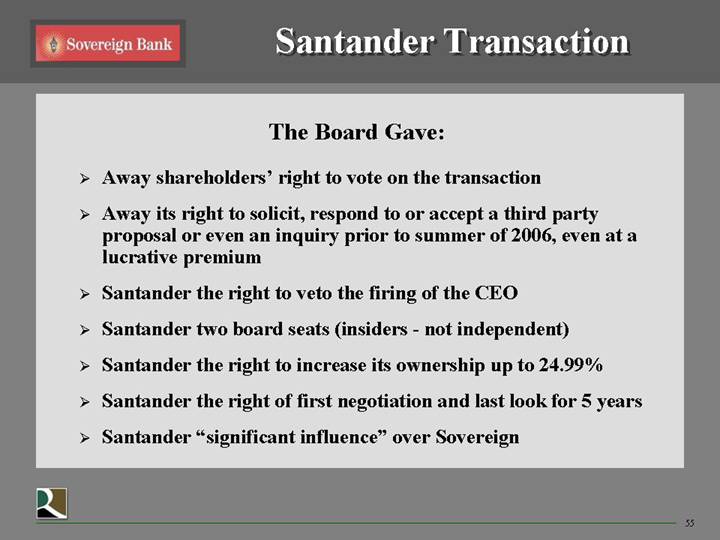
Santander Transaction
The Board Gave:
• Away shareholders’ right to vote on the transaction
• Away its right to solicit, respond to or accept a third party proposal or even an inquiry prior to summer of 2006, even at a lucrative premium
• Santander the right to veto the firing of the CEO
• Santander two board seats (insiders - not independent)
• Santander the right to increase its ownership up to 24.99%
• Santander the right of first negotiation and last look for 5 years
• Santander “significant influence” over Sovereign
55
The Board Got:
• In the Company’s October 25, 2005 investor presentation Mr. Sidhu said: “there are no benefits for any members of the Board of Directors of Sovereign.”
• Guaranteed board seats for 10 years in the event of a sale to Santander
• Based on Sovereign board members’ current compensation, approximately $1.5 Million of income per director over that 10 year period
• 24.99% of Sovereign’s stock in friendly hands (approximately 33% including management’s beneficial ownership)
Mr. Sidhu Got:
• Seat on Santander’s board
• Protection from being removed without Santander’s approval
56
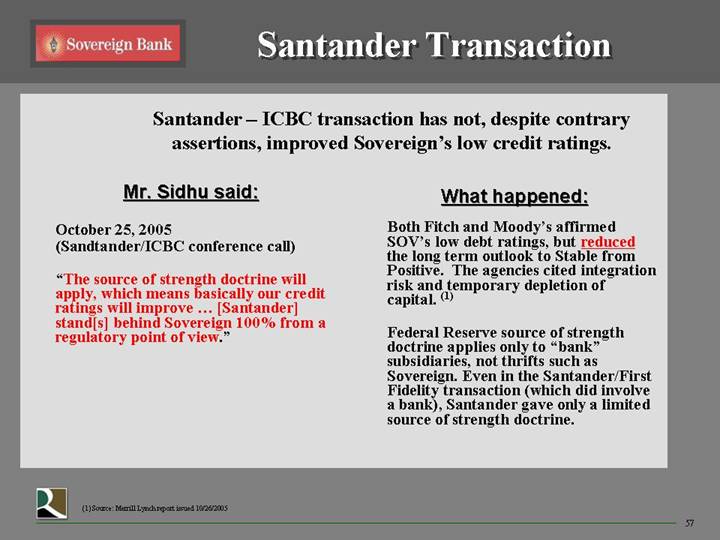
Santander – ICBC transaction has not, despite contrary assertions, improved Sovereign’s low credit ratings.
Mr. Sidhu said: | | What happened: |
| | |
October 25, 2005
(Sandtander/ICBC conference call)
“The source of strength doctrine will apply, which means basically our credit ratings will improve … [Santander] stand[s] behind Sovereign 100% from a regulatory point of view.” | | Both Fitch and Moody’s affirmed SOV’s low debt ratings, but reduced the long term outlook to Stable from Positive. The agencies cited integration risk and temporary depletion of capital. (1)
Federal Reserve source of strength doctrine applies only to “bank” subsidiaries, not thrifts such as Sovereign. Even in the Santander/First Fidelity transaction (which did involve a bank), Santander gave only a limited source of strength doctrine. |
(1) Source: Merrill Lynch report issued 10/26/2005
57
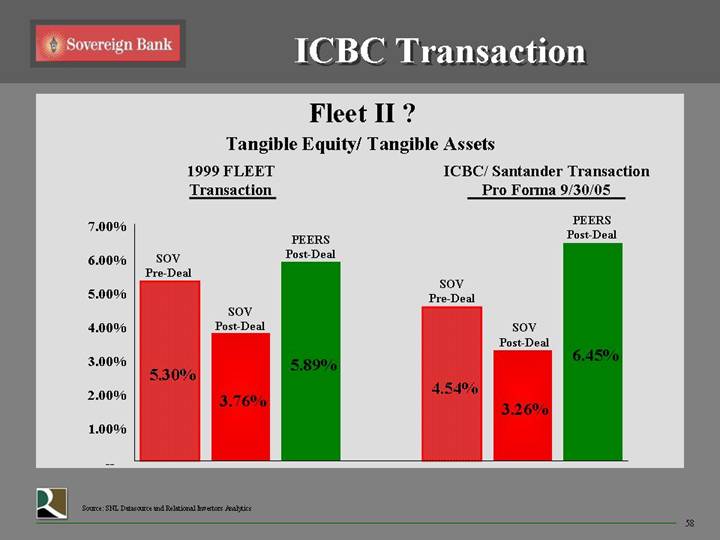
ICBC Transaction
Fleet II ?
Tangible Equity/ Tangible Assets
1999 FLEET
Transaction | ICBC/ Santander Transaction
Pro Forma 9/30/05 |
[CHART] | [CHART] |
Source: SNL Datasource and Relational Investors Analytics
58
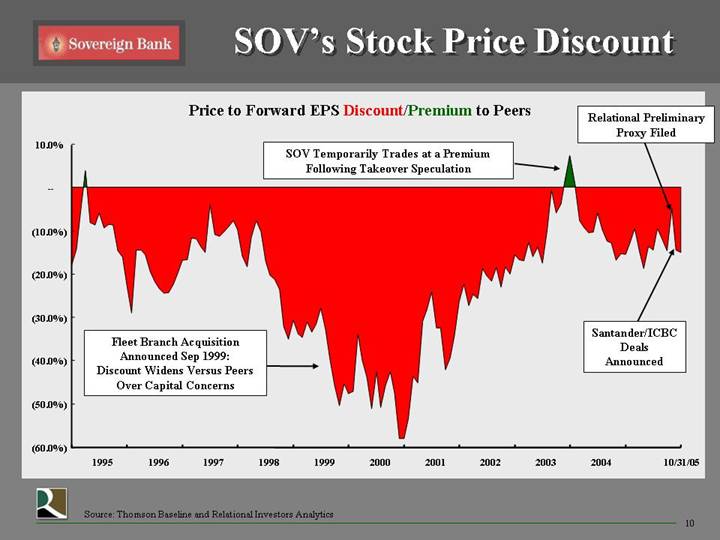
SOV’s Stock Price Discount
Price to Forward EPS Discount/Premium to Peers
[CHART]
Source: Thomson Baseline and Relational Investors Analytics
59
Santander Transaction
Sovereign’s View
[GRAPHIC]
60
Operating Performance
Sovereign is in the Bottom Quartile for 80% of Core Operating Metrics
ICBC is in the Bottom Quartile of 50% of Core Operating Metrics
[CHART]
Note: Based on 3Q05 results; ICBC Price/2006 EPS and Price/Book multiples are pre-acquisition announcement
Source: SNL Datasource and Relational Investors Analytics
62
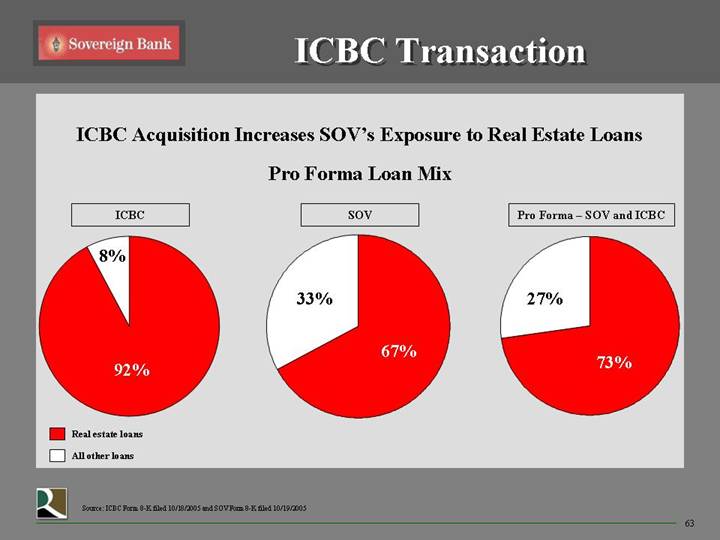
ICBC Transaction
ICBC Acquisition Increases SOV’s Exposure to Real Estate Loans
Pro Forma Loan Mix
ICBC | SOV | Pro Forma – SOV and ICBC |
| | |
[CHART] | [CHART] | [CHART] |
Source: ICBC Form 8-K filed 10/18/2005 and SOV Form 8-K filed 10/19/2005
63
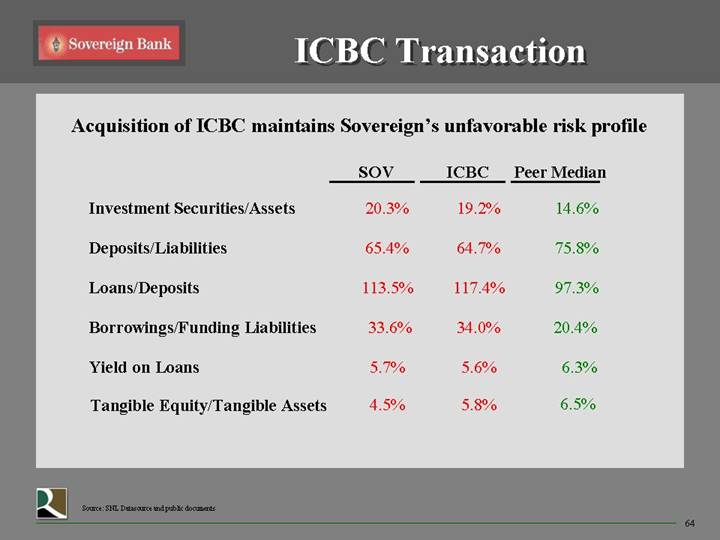
Acquisition of ICBC maintains Sovereign’s unfavorable risk profile
| | SOV | | ICBC | | Peer Median | |
| | | | | | | |
Investment Securities/Assets | | 20.3 | % | 19.2 | % | 14.6 | % |
| | | | | | | |
Deposits/Liabilities | | 65.4 | % | 64.7 | % | 75.8 | % |
| | | | | | | |
Loans/Deposits | | 113.5 | % | 117.4 | % | 97.3 | % |
| | | | | | | |
Borrowings/Funding Liabilities | | 33.6 | % | 34.0 | % | 20.4 | % |
| | | | | | | |
Yield on Loans | | 5.7 | % | 5.6 | % | 6.3 | % |
| | | | | | | |
Tangible Equity/Tangible Assets | | 4.5 | % | 5.8 | % | 6.5 | % |
Source: SNL Datasource and public documents
64
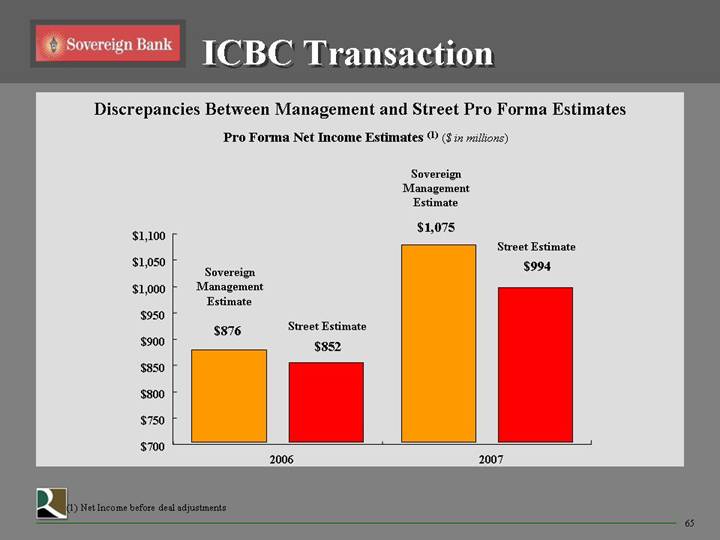
Discrepancies Between Management and Street Pro Forma Estimates
Pro Forma Net Income Estimates (1) ($ in millions)
[CHART]
(1) Net Income before deal adjustments
65
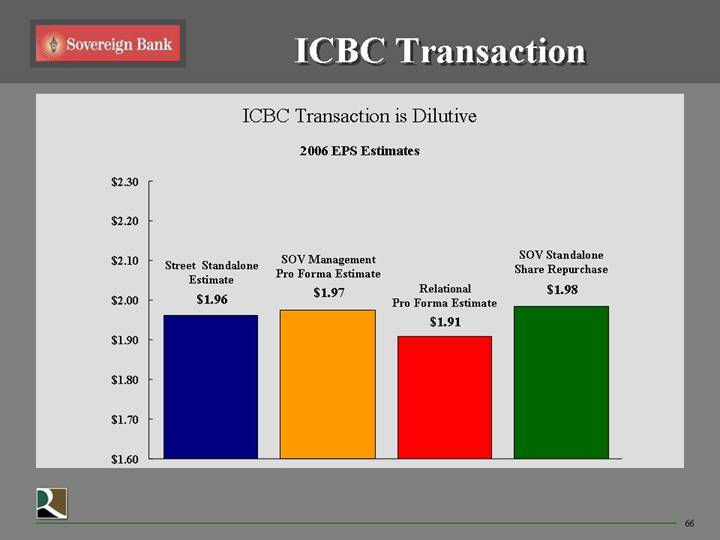
ICBC Transaction is Dilutive
2006 EPS Estimates
[CHART]
66
ICBC Transaction is Dilutive
2007 EPS Estimates
[CHART]
67
Relational’s Action Plan
• Shareholder vote request delivered to NYSE
• Submitted formal Books and Records demand to Sovereign
• Global campaign to bring investor awareness and scrutiny of the Santander transaction
• Appeal to regulatory authorities
• All other appropriate steps are under consideration with none having been ruled out
68
[LOGO] Relational Investors LLC
Q&A
Link to searchable text of slide shown above
Link to searchable text of slide shown above
Link to searchable text of slide shown above
Link to searchable text of slide shown above
Link to searchable text of slide shown above
Link to searchable text of slide shown above
Link to searchable text of slide shown above
Link to searchable text of slide shown above
Link to searchable text of slide shown above
Link to searchable text of slide shown above
Link to searchable text of slide shown above

Link to searchable text of slide shown above

Link to searchable text of slide shown above
Link to searchable text of slide shown above
Searchable text section of graphics shown above
Relational Investors LLC
Shareholder Value Forum Appendix
Pages 9-10, 59:
Forward EPS Discount Charts were constructed using data from Thomson Baseline
Discount Calculated as follows:
Time Period: Ending Day of Each Month from December 31, 1994 to October 31, 2005*
Historical Month End Forward Twelve Months EPS Forecast: Thomson Baseline
Month End Closing Price: Thomson Baseline
Price to Forward EPS Multiple: Month End Closing Price/ EPS Forecast (as calculated by Relational Investors Analytics)
Discount: SOV Price to Forward EPS/Peer Median Price to Forward EPS (as calculated by Relational Investors Analytics)
*Chart also includes two data points for weeks ending 10/21/2005 and 10/28/2005 to show effects of Relational Investors Preliminary Proxy Filing and SOV announcement of Santander/ICBC transaction
1
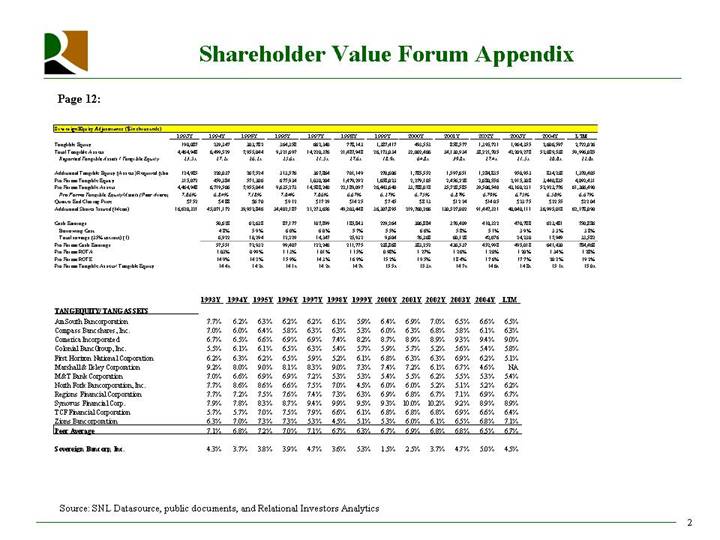
Page 12:
Sovereign Equity Adjustments ($ in thousands)
| | 1993Y | | 1994Y | | 1995Y | | 1996Y | | 1997Y | | 1998Y | | 1999Y | |
Tanglible Equity | | 190,087 | | 239,347 | | 303,782 | | 364,358 | | 662,340 | | 778,143 | | 1,387,417 | |
Total Tangible Assets | | 4,464,948 | | 6,499,529 | | 7,955,044 | | 9,321,697 | | 14,220,376 | | 21,487,948 | | 26,173,034 | |
Reported Tangible Assets / Tangible Equity | | 23.5 | x | 27.2 | x | 26.2 | x | 25.6 | x | 21.5 | x | 27.6 | x | 18.9 | x |
| | | | | | | | | | | | | | | |
Additional Tangible Equity (Assets) Required (tho | | 124,985 | | 220,037 | | 267,524 | | 313,576 | | 367,864 | | 701,149 | | 270,606 | |
Pro Forma Tangible Equity | | 315,072 | | 459,384 | | 571,306 | | 677,934 | | 1,030,204 | | 1,479,292 | | 1,658,023 | |
Pro Forma Tangible Assets | | 4,464,948 | | 6,719,566 | | 7,955,044 | | 9,635,273 | | 14,588,240 | | 22,189,097 | | 26,443,640 | |
Pro Forma Tangible Equity/Assets (Peer Avera | | 7.06 | % | 6.84 | % | 7.18 | % | 7.04 | % | 7.06 | % | 6.67 | % | 6.27 | % |
Quarter End Closing Price | | $ | 7.52 | | $ | 4.88 | | $ | 6.70 | | $ | 9.12 | | $ | 17.29 | | $ | 14.25 | | $ | 7.45 | |
Additional Shares Issued (Mean) | | 16,620,321 | | 45,071,172 | | 39,952,846 | | 34,402,187 | | 21,273,656 | | 49,203,448 | | 36,307,895 | |
| | | | | | | | | | | | | | | |
Cash Earnings | | | | 50,628 | | 62,638 | | 87,177 | | 107,899 | | 185,843 | | 229,264 | |
Borrowing Cost | | | | 4.8 | % | 5.9 | % | 6.0 | % | 6.0 | % | 5.7 | % | 5.5 | % |
Total savings (35% tax rate) (1) | | | | 6,922 | | 10,294 | | 12,229 | | 14,347 | | 25,932 | | 9,604 | |
Pro Forma Cash Earnings | | | | 57,551 | | 72,932 | | 99,407 | | 122,246 | | 211,775 | | 238,868 | |
Pro Forma ROTA | | | | 1.03 | % | 0.99 | % | 1.13 | % | 1.01 | % | 1.15 | % | 0.98 | % |
Pro Forma ROTE | | | | 14.9 | % | 14.2 | % | 15.9 | % | 14.3 | % | 16.9 | % | 15.2 | % |
Pro Forma Tangible Assets/ Tangible Equity | | | | 14.4 | x | 14.2 | x | 14.1 | x | 14.2 | x | 14.7 | x | 15.5 | x |
| | | | | | | | | | | | | | | | | | | | | | |
| | 2000Y | | 2001Y | | 2002Y | | 2003Y | | 2004Y | | LTM | |
Tanglible Equity | | 493,553 | | 858,577 | | 1,395,721 | | 1,964,355 | | 2,606,597 | | 2,722,026 | |
Total Tangible Assets | | 32,002,466 | | 34,130,934 | | 38,221,705 | | 42,209,278 | | 52,089,538 | | 59,996,085 | |
Reported Tangible Assets / Tangible Equity | | 64.8 | x | 39.8 | x | 27.4 | x | 21.5 | x | 20.0 | x | 22.0 | x |
| | | | | | | | | | | | | |
Additional Tangible Equity (Assets) Required (tho | | 1,785,552 | | 1,597,651 | | 1,284,835 | | 950,953 | | 834,238 | | 1,370,405 | |
Pro Forma Tangible Equity | | 2,279,105 | | 2,456,228 | | 2,680,556 | | 2,915,308 | | 3,440,835 | | 4,092,431 | |
Pro Forma Tangible Assets | | 33,788,018 | | 35,728,585 | | 39,506,540 | | 43,160,231 | | 52,923,776 | | 61,366,490 | |
Pro Forma Tangible Equity/Assets (Peer Avera | | 6.75 | % | 6.87 | % | 6.79 | % | 6.75 | % | 6.50 | % | 6.67 | % |
Quarter End Closing Price | | $ | 8.13 | | $ | 12.24 | | $ | 14.05 | | $ | 23.75 | | $ | 22.55 | | $ | 22.04 | |
Additional Shares Issued (Mean) | | 219,760,266 | | 130,527,002 | | 91,447,321 | | 40,040,111 | | 36,995,018 | | 62,178,090 | |
| | | | | | | | | | | | | |
Cash Earnings | | 306,884 | | 376,409 | | 410,322 | | 470,788 | | 623,481 | | 750,886 | |
Borrowing Cost | | 6.6 | % | 5.8 | % | 5.1 | % | 3.9 | % | 3.3 | % | 3.8 | % |
Total savings (35% tax rate) (1) | | 76,368 | | 60,128 | | 42,676 | | 24,230 | | 17,949 | | 33,582 | |
Pro Forma Cash Earnings | | 383,252 | | 436,537 | | 452,998 | | 495,018 | | 641,430 | | 784,468 | |
Pro Forma ROTA | | 1.27 | % | 1.26 | % | 1.20 | % | 1.20 | % | 1.34 | % | 1.28 | % |
Pro Forma ROTE | | 19.5 | % | 18.4 | % | 17.6 | % | 17.7 | % | 20.2 | % | 19.2 | % |
Pro Forma Tangible Assets/ Tangible Equity | | 15.3 | x | 14.7 | x | 14.6 | x | 14.8 | x | 15.1 | x | 15.0 | x |
| | | | | | | | | | | | | | | | | | | |
| | 1993Y | | 1994Y | | 1995Y | | 1996Y | | 1997Y | | 1998Y | | 1999Y | | 2000Y | | 2001Y | | 2002Y | | 2003Y | | 2004Y | | LTM | |
TANG EQUITY/ TANG ASSETS | | | | | | | | | | | | | | | | | | | | | | | | | | | |
AmSouth Bancorporation | | 7.7 | % | 6.2 | % | 6.3 | % | 6.2 | % | 6.2 | % | 6.1 | % | 5.9 | % | 6.4 | % | 6.9 | % | 7.0 | % | 6.5 | % | 6.6 | % | 6.5 | % |
Compass Bancshares, Inc. | | 7.0 | % | 6.0 | % | 6.4 | % | 5.8 | % | 6.3 | % | 6.3 | % | 5.3 | % | 6.0 | % | 6.3 | % | 6.8 | % | 5.8 | % | 6.1 | % | 6.3 | % |
Comerica Incorporated | | 6.7 | % | 6.5 | % | 6.6 | % | 6.9 | % | 6.9 | % | 7.4 | % | 8.2 | % | 8.7 | % | 8.9 | % | 8.9 | % | 9.3 | % | 9.4 | % | 9.0 | % |
Colonial BancGroup, Inc. | | 5.5 | % | 6.1 | % | 6.1 | % | 6.5 | % | 6.3 | % | 5.4 | % | 5.7 | % | 5.9 | % | 5.7 | % | 5.2 | % | 5.6 | % | 5.4 | % | 5.8 | % |
First Horizon National Corporation | | 6.2 | % | 6.3 | % | 6.2 | % | 6.5 | % | 5.9 | % | 5.2 | % | 6.1 | % | 6.8 | % | 6.3 | % | 6.3 | % | 6.9 | % | 6.2 | % | 5.1 | % |
Marshall & Ilsley Corporation | | 9.2 | % | 8.0 | % | 9.0 | % | 8.1 | % | 8.3 | % | 9.0 | % | 7.3 | % | 7.4 | % | 7.2 | % | 6.1 | % | 6.7 | % | 4.6 | % | NA | |
M&T Bank Corporation | | 7.0 | % | 6.6 | % | 6.9 | % | 6.9 | % | 7.2 | % | 5.3 | % | 5.3 | % | 5.4 | % | 5.5 | % | 6.2 | % | 5.5 | % | 5.3 | % | 5.4 | % |
North Fork Bancorporation, Inc. | | 7.7 | % | 8.6 | % | 8.6 | % | 6.6 | % | 7.5 | % | 7.0 | % | 4.5 | % | 6.0 | % | 6.0 | % | 5.2 | % | 5.1 | % | 5.2 | % | 6.2 | % |
Regions Financial Corporation | | 7.7 | % | 7.2 | % | 7.5 | % | 7.6 | % | 7.4 | % | 7.3 | % | 6.3 | % | 6.9 | % | 6.8 | % | 6.7 | % | 7.1 | % | 6.9 | % | 6.7 | % |
Synovus Financial Corp. | | 7.9 | % | 7.8 | % | 8.3 | % | 8.7 | % | 9.4 | % | 9.9 | % | 9.5 | % | 9.3 | % | 10.0 | % | 10.2 | % | 9.2 | % | 8.9 | % | 8.9 | % |
TCF Financial Corporation | | 5.7 | % | 5.7 | % | 7.0 | % | 7.5 | % | 7.9 | % | 6.6 | % | 6.1 | % | 6.8 | % | 6.8 | % | 6.8 | % | 6.9 | % | 6.6 | % | 6.4 | % |
Zions Bancorporation | | 6.3 | % | 7.0 | % | 7.3 | % | 7.3 | % | 5.3 | % | 4.5 | % | 5.1 | % | 5.3 | % | 6.0 | % | 6.1 | % | 6.5 | % | 6.8 | % | 7.1 | % |
Peer Average | | 7.1 | % | 6.8 | % | 7.2 | % | 7.0 | % | 7.1 | % | 6.7 | % | 6.3 | % | 6.7 | % | 6.9 | % | 6.8 | % | 6.8 | % | 6.5 | % | 6.7 | % |
| | | | | | | | | | | | | | | | | | | | | | | | | | | |
Sovereign Bancorp, Inc. | | 4.3 | % | 3.7 | % | 3.8 | % | 3.9 | % | 4.7 | % | 3.6 | % | 5.3 | % | 1.5 | % | 2.5 | % | 3.7 | % | 4.7 | % | 5.0 | % | 4.5 | % |
Source: SNL Datasource, public documents, and Relational Investors Analytics
2
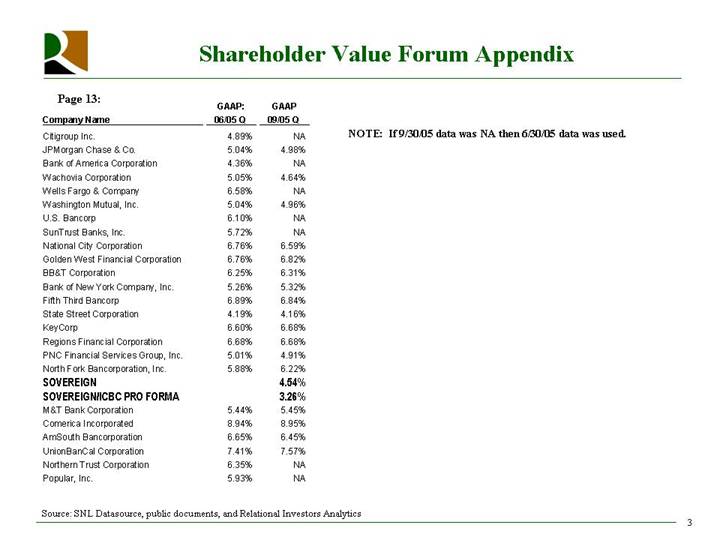
Page 13:
Company Name | | GAAP:
06/05 Q | | GAAP
09/05 Q | |
| | | | | |
Citigroup Inc. | | 4.89 | % | NA | |
JPMorgan Chase & Co. | | 5.04 | % | 4.98 | % |
Bank of America Corporation | | 4.36 | % | NA | |
Wachovia Corporation | | 5.05 | % | 4.64 | % |
Wells Fargo & Company | | 6.58 | % | NA | |
Washington Mutual, Inc. | | 5.04 | % | 4.96 | % |
U.S. Bancorp | | 6.10 | % | NA | |
SunTrust Banks, Inc. | | 5.72 | % | NA | |
National City Corporation | | 6.76 | % | 6.59 | % |
Golden West Financial Corporation | | 6.76 | % | 6.82 | % |
BB&T Corporation | | 6.25 | % | 6.31 | % |
Bank of New York Company, Inc. | | 5.26 | % | 5.32 | % |
Fifth Third Bancorp | | 6.89 | % | 6.84 | % |
State Street Corporation | | 4.19 | % | 4.16 | % |
KeyCorp | | 6.60 | % | 6.68 | % |
Regions Financial Corporation | | 6.68 | % | 6.68 | % |
PNC Financial Services Group, Inc. | | 5.01 | % | 4.91 | % |
North Fork Bancorporation, Inc. | | 5.88 | % | 6.22 | % |
SOVEREIGN | | | | 4.54 | % |
SOVEREIGN/ICBC PRO FORMA | | | | 3.26 | % |
M&T Bank Corporation | | 5.44 | % | 5.45 | % |
Comerica Incorporated | | 8.94 | % | 8.95 | % |
AmSouth Bancorporation | | 6.65 | % | 6.45 | % |
UnionBanCal Corporation | | 7.41 | % | 7.57 | % |
Northern Trust Corporation | | 6.35 | % | NA | |
Popular, Inc. | | 5.93 | % | NA | |
NOTE: If 9/30/05 data was NA then 6/30/05 data was used.
Source: SNL Datasource, public documents, and Relational Investors Analytics
3
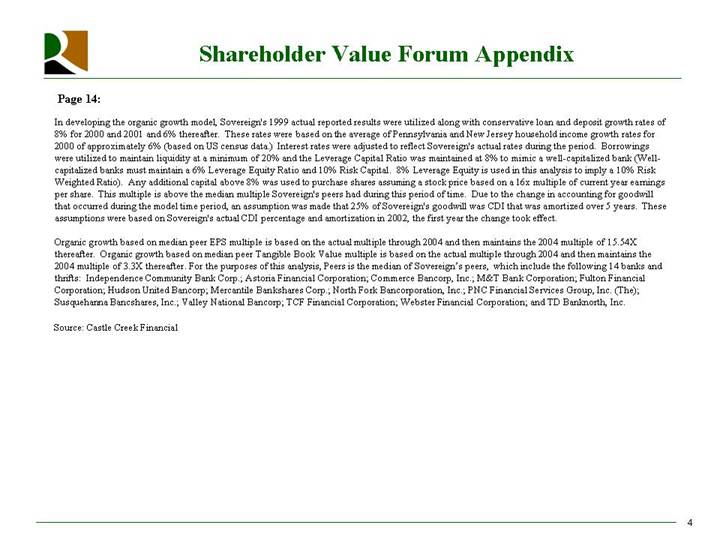
Page 14:
In developing the organic growth model, Sovereign’s 1999 actual reported results were utilized along with conservative loan and deposit growth rates of 8% for 2000 and 2001 and 6% thereafter. These rates were based on the average of Pennsylvania and New Jersey household income growth rates for 2000 of approximately 6% (based on US census data.) Interest rates were adjusted to reflect Sovereign’s actual rates during the period. Borrowings were utilized to maintain liquidity at a minimum of 20% and the Leverage Capital Ratio was maintained at 8% to mimic a well-capitalized bank (Well-capitalized banks must maintain a 6% Leverage Equity Ratio and 10% Risk Capital. 8% Leverage Equity is used in this analysis to imply a 10% Risk Weighted Ratio). Any additional capital above 8% was used to purchase shares assuming a stock price based on a 16x multiple of current year earnings per share. This multiple is above the median multiple Sovereign’s peers had during this period of time. Due to the change in accounting for goodwill that occurred during the model time period, an assumption was made that 25% of Sovereign’s goodwill was CDI that was amortized over 5 years. These assumptions were based on Sovereign’s actual CDI percentage and amortization in 2002, the first year the change took effect.
Organic growth based on median peer EPS multiple is based on the actual multiple through 2004 and then maintains the 2004 multiple of 15.54X thereafter. Organic growth based on median peer Tangible Book Value multiple is based on the actual multiple through 2004 and then maintains the 2004 multiple of 3.3X thereafter. For the purposes of this analysis, Peers is the median of Sovereign’s peers, which include the following 14 banks and thrifts: Independence Community Bank Corp.; Astoria Financial Corporation; Commerce Bancorp, Inc.; M&T Bank Corporation; Fulton Financial Corporation; Hudson United Bancorp; Mercantile Bankshares Corp.; North Fork Bancorporation, Inc.; PNC Financial Services Group, Inc. (The); Susquehanna Bancshares, Inc.; Valley National Bancorp; TCF Financial Corporation; Webster Financial Corporation; and TD Banknorth, Inc.
Source: Castle Creek Financial
4
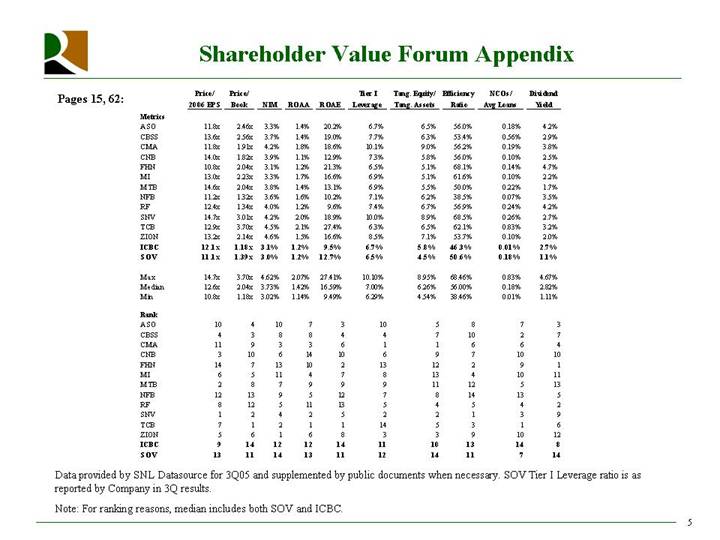
Pages 15, 62:
| | Price/
2006 EPS | | Price/
Book | | NIM | | ROAA | | ROAE | | Tier I
Leverage | | Tang. Equity/
Tang. Assets | | Efficiency
Ratio | | NCOs/
Avg Loans | | Dividend
Yield | |
Metrics | | | | | | | | | | | | | | | | | | | | | |
ASO | | 11.8 | x | 2.46 | x | 3.3 | % | 1.4 | % | 20.2 | % | 6.7 | % | 6.5 | % | 56.0 | % | 0.18 | % | 4.2 | % |
CBSS | | 13.6 | x | 2.56 | x | 3.7 | % | 1.4 | % | 19.0 | % | 7.7 | % | 6.3 | % | 53.4 | % | 0.56 | % | 2.9 | % |
CMA | | 11.8 | x | 1.91 | x | 4.2 | % | 1.8 | % | 18.6 | % | 10.1 | % | 9.0 | % | 56.2 | % | 0.19 | % | 3.8 | % |
CNB | | 14.0 | x | 1.82 | x | 3.9 | % | 1.1 | % | 12.9 | % | 7.3 | % | 5.8 | % | 56.0 | % | 0.10 | % | 2.5 | % |
FHN | | 10.8 | x | 2.04 | x | 3.1 | % | 1.2 | % | 21.3 | % | 6.5 | % | 5.1 | % | 68.1 | % | 0.14 | % | 4.7 | % |
MI | | 13.0 | x | 2.23 | x | 3.3 | % | 1.7 | % | 16.6 | % | 6.9 | % | 5.1 | % | 61.6 | % | 0.10 | % | 2.2 | % |
MTB | | 14.6 | x | 2.04 | x | 3.8 | % | 1.4 | % | 13.1 | % | 6.9 | % | 5.5 | % | 50.0 | % | 0.22 | % | 1.7 | % |
NFB | | 11.2 | x | 1.32 | x | 3.6 | % | 1.6 | % | 10.2 | % | 7.1 | % | 6.2 | % | 38.5 | % | 0.07 | % | 3.5 | % |
RF | | 12.4 | x | 1.34 | x | 4.0 | % | 1.2 | % | 9.6 | % | 7.4 | % | 6.7 | % | 56.9 | % | 0.24 | % | 4.2 | % |
SNV | | 14.7 | x | 3.01 | x | 4.2 | % | 2.0 | % | 18.9 | % | 10.0 | % | 8.9 | % | 68.5 | % | 0.26 | % | 2.7 | % |
TCB | | 12.9 | x | 3.70 | x | 4.5 | % | 2.1 | % | 27.4 | % | 6.3 | % | 6.5 | % | 62.1 | % | 0.83 | % | 3.2 | % |
ZION | | 13.2 | x | 2.14 | x | 4.6 | % | 1.5 | % | 16.6 | % | 8.5 | % | 7.1 | % | 53.7 | % | 0.10 | % | 2.0 | % |
ICBC | | 12.1 | x | 1.18 | x | 3.1 | % | 1.2 | % | 9.5 | % | 6.7 | % | 5.8 | % | 46.3 | % | 0.01 | % | 2.7 | % |
SOV | | 11.1 | x | 1.39 | x | 3.0 | % | 1.2 | % | 12.7 | % | 6.5 | % | 4.5 | % | 50.6 | % | 0.18 | % | 1.1 | % |
| | | | | | | | | | | | | | | | | | | | | |
Max | | 14.7 | x | 3.70 | x | 4.62 | % | 2.07 | % | 27.41 | % | 10.10 | % | 8.95 | % | 68.46 | % | 0.83 | % | 4.67 | % |
Median | | 12.6 | x | 2.04 | x | 3.73 | % | 1.42 | % | 16.59 | % | 7.00 | % | 6.26 | % | 56.00 | % | 0.18 | % | 2.82 | % |
Min | | 10.8 | x | 1.18 | x | 3.02 | % | 1.14 | % | 9.49 | % | 6.29 | % | 4.54 | % | 38.46 | % | 0.01 | % | 1.11 | % |
| | | | | | | | | | | | | | | | | | | | | |
Rank | | | | | | | | | | | | | | | | | | | | | |
ASO | | 10 | | 4 | | 10 | | 7 | | 3 | | 10 | | 5 | | 8 | | 7 | | 3 | |
CBSS | | 4 | | 3 | | 8 | | 8 | | 4 | | 4 | | 7 | | 10 | | 2 | | 7 | |
CMA | | 11 | | 9 | | 3 | | 3 | | 6 | | 1 | | 1 | | 6 | | 6 | | 4 | |
CNB | | 3 | | 10 | | 6 | | 14 | | 10 | | 6 | | 9 | | 7 | | 10 | | 10 | |
FHN | | 14 | | 7 | | 13 | | 10 | | 2 | | 13 | | 12 | | 2 | | 9 | | 1 | |
MI | | 6 | | 5 | | 11 | | 4 | | 7 | | 8 | | 13 | | 4 | | 10 | | 11 | |
MTB | | 2 | | 8 | | 7 | | 9 | | 9 | | 9 | | 11 | | 12 | | 5 | | 13 | |
NFB | | 12 | | 13 | | 9 | | 5 | | 12 | | 7 | | 8 | | 14 | | 13 | | 5 | |
RF | | 8 | | 12 | | 5 | | 11 | | 13 | | 5 | | 4 | | 5 | | 4 | | 2 | |
SNV | | 1 | | 2 | | 4 | | 2 | | 5 | | 2 | | 2 | | 1 | | 3 | | 9 | |
TCB | | 7 | | 1 | | 2 | | 1 | | 1 | | 14 | | 5 | | 3 | | 1 | | 6 | |
ZION | | 5 | | 6 | | 1 | | 6 | | 8 | | 3 | | 3 | | 9 | | 10 | | 12 | |
ICBC | | 9 | | 14 | | 12 | | 12 | | 14 | | 11 | | 10 | | 13 | | 14 | | 8 | |
SOV | | 13 | | 11 | | 14 | | 13 | | 11 | | 12 | | 14 | | 11 | | 7 | | 14 | |
Data provided by SNL Datasource for 3Q05 and supplemented by public documents when necessary. SOV Tier I Leverage ratio is as reported by Company in 3Q results.
Note: For ranking reasons, median includes both SOV and ICBC.
5
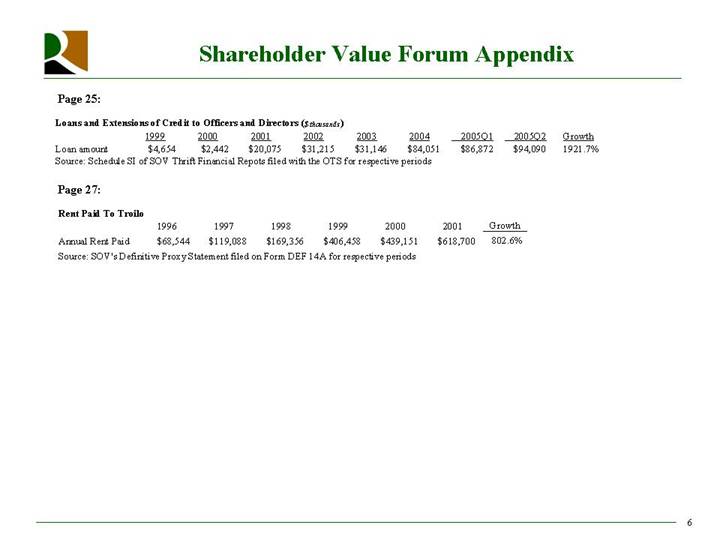
Page 25:
Loans and Extensions of Credit to Officers and Directors ($ thousands )
| | 1999 | | 2000 | | 2001 | | 2002 | | 2003 | | 2004 | | 2005Q1 | | 2005Q2 | | Growth | |
Loan amount | | $ | 4,654 | | $ | 2,442 | | $ | 20,075 | | $ | 31,215 | | $ | 31,146 | | $ | 84,051 | | $ | 86,872 | | $ | 94,090 | | 1921.7 | % |
| | | | | | | | | | | | | | | | | | | | | | | | | | | |
Source: Schedule SI of SOV Thrift Financial Repots filed with the OTS for respective periods
Page 27:
Rent Paid To Troilo
| | 1996 | | 1997 | | 1998 | | 1999 | | 2000 | | 2001 | | Growth | |
Annual Rent Paid | | $ | 68,544 | | $ | 119,088 | | $ | 169,356 | | $ | 406,458 | | $ | 439,151 | | $ | 618,700 | | 802.6 | % |
| | | | | | | | | | | | | | | | | | | | | |
Source: SOV’s Definitive Proxy Statement filed on Form DEF 14A for respective periods
6
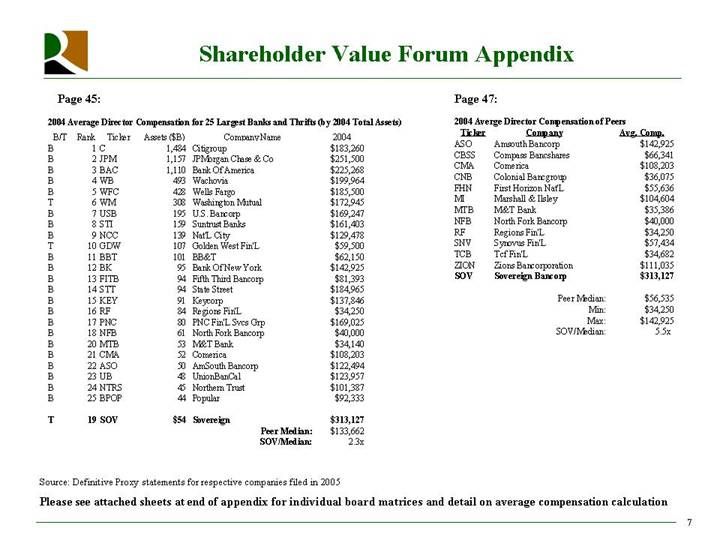
Page 45:
2004 Average Director Compensation for 25 Largest Banks and Thrifts (by 2004 Total Assets)
B/T | | Rank | | Ticker | | Assets ($B) | | Company Name | | 2004 | |
B | | 1 | | C | | 1,484 | | Citigroup | | $ | 183,260 | |
B | | 2 | | JPM | | 1,157 | | JPMorgan Chase & Co | | $ | 251,500 | |
B | | 3 | | BAC | | 1,110 | | Bank Of America | | $ | 225,268 | |
B | | 4 | | WB | | 493 | | Wachovia | | $ | 199,964 | |
B | | 5 | | WFC | | 428 | | Wells Fargo | | $ | 185,500 | |
T | | 6 | | WM | | 308 | | Washington Mutual | | $ | 172,945 | |
B | | 7 | | USB | | 195 | | U.S. Bancorp | | $ | 169,247 | |
B | | 8 | | STI | | 159 | | Suntrust Banks | | $ | 161,403 | |
B | | 9 | | NCC | | 139 | | Nat’L City | | $ | 129,478 | |
T | | 10 | | GDW | | 107 | | Golden West Fin’L | | $ | 59,500 | |
B | | 11 | | BBT | | 101 | | BB&T | | $ | 62,150 | |
B | | 12 | | BK | | 95 | | Bank Of New York | | $ | 142,925 | |
B | | 13 | | FITB | | 94 | | Fifth Third Bancorp | | $ | 81,393 | |
B | | 14 | | STT | | 94 | | State Street | | $ | 184,965 | |
B | | 15 | | KEY | | 91 | | Keycorp | | $ | 137,846 | |
B | | 16 | | RF | | 84 | | Regions Fin’L | | $ | 34,250 | |
B | | 17 | | PNC | | 80 | | PNC Fin’L Svcs Grp | | $ | 169,025 | |
B | | 18 | | NFB | | 61 | | North Fork Bancorp | | $ | 40,000 | |
B | | 20 | | MTB | | 53 | | M&T Bank | | $ | 34,140 | |
B | | 21 | | CMA | | 52 | | Comerica | | $ | 108,203 | |
B | | 22 | | ASO | | 50 | | AmSouth Bancorp | | $ | 122,494 | |
B | | 23 | | UB | | 48 | | UnionBanCal | | $ | 123,957 | |
B | | 24 | | NTRS | | 45 | | Northern Trust | | $ | 101,387 | |
B | | 25 | | BPOP | | 44 | | Popular | | $ | 92,333 | |
| | | | | | | | | | | |
T | | 19 | | SOV | | $ | 54 | | Sovereign | | $ | 313,127 | |
| | | | | | | | Peer Median: | | $ | 133,662 | |
| | | | | | | | SOV/Median: | | 2.3x | |
| | | | | | | | | | | | | |
Page 47:
2004 Averge Director Compensation of Peers
Ticker | | Company | | Avg. Comp. | |
ASO | | Amsouth Bancorp | | $ | 142,925 | |
CBSS | | Compass Bancshares | | $ | 66,341 | |
CMA | | Comerica | | $ | 108,203 | |
CNB | | Colonial Bancgroup | | $ | 36,075 | |
FHN | | First Horizon Nat’L | | $ | 55,636 | |
MI | | Marshall & Ilsley | | $ | 104,604 | |
MTB | | M&T Bank | | $ | 35,386 | |
NFB | | North Fork Bancorp | | $ | 40,000 | |
RF | | Regions Fin’L | | $ | 34,250 | |
SNV | | Synovus Fin’L | | $ | 57,434 | |
TCB | | Tcf Fin’L | | $ | 34,682 | |
ZION | | Zions Bancorporation | | $ | 111,035 | |
SOV | | Sovereign Bancorp | | $ | 313,127 | |
| | | | | |
| | Peer Median: | | $ | 56,535 | |
| | Min: | | $ | 34,250 | |
| | Max: | | $ | 142,925 | |
| | SOV/Median: | | 5.5 | x |
Source: Definitive Proxy statements for respective companies filed in 2005
Please see attached sheets at end of appendix for individual board matrices and detail on average compensation calculation
7
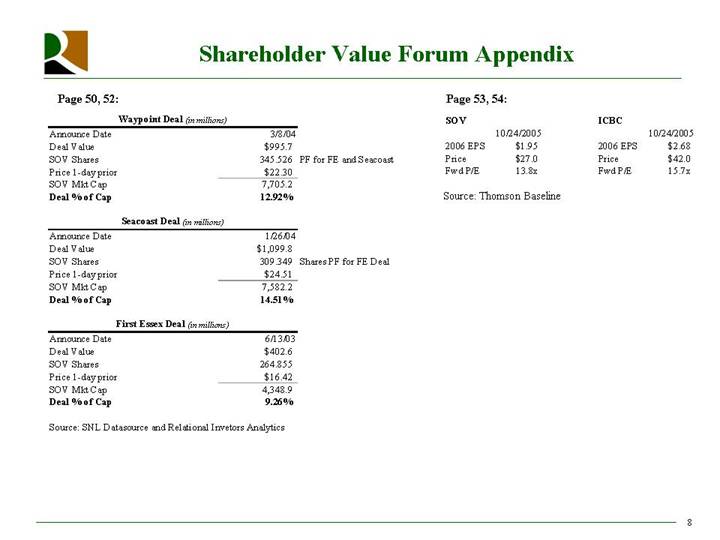
Page 50, 52:
Waypoint Deal (in millions)
Announce Date | | 3/8/04 | | | |
Deal Value | | $ | 995.7 | | | |
SOV Shares | | 345.526 | | PF for FE and Seacoast | |
Price 1-day prior | | $ | 22.30 | | | |
SOV Mkt Cap | | 7,705.2 | | | |
Deal % of Cap | | 12.92 | % | | |
Seacoast Deal (in millions)
Announce Date | | 1/26/04 | | | |
Deal Value | | $ | 1,099.8 | | | |
SOV Shares | | 309.349 | | Shares PF for FE Deal | |
Price 1-day prior | | $ | 24.51 | | | |
SOV Mkt Cap | | 7,582.2 | | | |
Deal % of Cap | | 14.51 | % | | |
First Essex Deal (in millions)
Announce Date | | 6/13/03 | | | |
Deal Value | | $ | 402.6 | | | |
SOV Shares | | 264.855 | | | |
Price 1-day prior | | $ | 16.42 | | | |
SOV Mkt Cap | | 4,348.9 | | | |
Deal % of Cap | | 9.26 | % | | |
Source: SNL Datasource and Relational Invetors Analytics
Page 53, 54:
SOV
| | 10/24/2005 | |
2006 EPS | | $ | 1.95 | |
Price | | $ | 27.0 | |
Fwd P/E | | 13.8 | x |
ICBC
| | 10/24/2005 | |
2006 EPS | | $ | 2.68 | |
Price | | $ | 42.0 | |
Fwd P/E | | 15.7 | x |
Source: Thomson Baseline
8
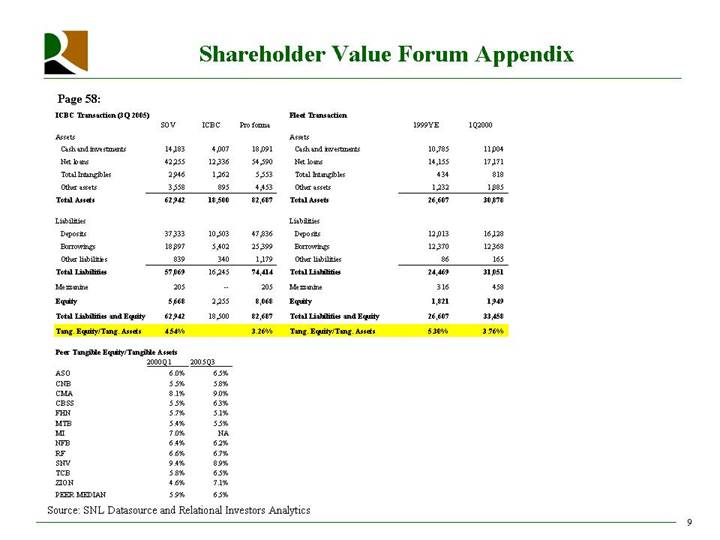
Page 58:
ICBC Transaction (3Q 2005)
| | SOV | | ICBC | | Pro forma | |
Assets | | | | | | | |
Cash and investments | | 14,183 | | 4,007 | | 18,091 | |
Net loans | | 42,255 | | 12,336 | | 54,590 | |
Total Intangibles | | 2,946 | | 1,262 | | 5,553 | |
Other assets | | 3,558 | | 895 | | 4,453 | |
Total Assets | | 62,942 | | 18,500 | | 82,687 | |
| | | | | | | |
Liabilities | | | | | | | |
Deposits | | 37,333 | | 10,503 | | 47,836 | |
Borrowings | | 18,897 | | 5,402 | | 25,399 | |
Other liabilities | | 839 | | 340 | | 1,179 | |
Total Liabilities | | 57,069 | | 16,245 | | 74,414 | |
Mezzanine | | 205 | | — | | 205 | |
Equity | | 5,668 | | 2,255 | | 8,068 | |
Total Liabilities and Equity | | 62,942 | | 18,500 | | 82,687 | |
Tang. Equity/Tang. Assets | | 4.54 | % | 3.26 | % | | |
Fleet Transaction
| | 1999YE | | 1Q2000 | |
Assets | | | | | |
Cash and investments | | 10,785 | | 11,004 | |
Net loans | | 14,155 | | 17,171 | |
Total Intangibles | | 434 | | 818 | |
Other assets | | 1,232 | | 1,885 | |
Total Assets | | 26,607 | | 30,878 | |
| | | | | |
Liabilities | | | | | |
Deposits | | 12,013 | | 16,128 | |
Borrowings | | 12,370 | | 12,368 | |
Other liabilities | | 86 | | 165 | |
Total Liabilities | | 24,469 | | 31,051 | |
Mezzanine | | 316 | | 458 | |
Equity | | 1,821 | | 1,949 | |
Total Liabilities and Equity | | 26,607 | | 33,458 | |
Tang. Equity/Tang. Assets | | 5.30 | % | 3.76 | % |
Peer Tangible Equity/Tangible Assets
| | 2000Q1 | | 2005Q3 | |
ASO | | 6.0 | % | 6.5 | % |
CNB | | 5.5 | % | 5.8 | % |
CMA | | 8.1 | % | 9.0 | % |
CBSS | | 5.5 | % | 6.3 | % |
FHN | | 5.7 | % | 5.1 | % |
MTB | | 5.4 | % | 5.5 | % |
MI | | 7.0 | % | NA | |
NFB | | 6.4 | % | 6.2 | % |
RF | | 6.6 | % | 6.7 | % |
SNV | | 9.4 | % | 8.9 | % |
TCB | | 5.8 | % | 6.5 | % |
ZION | | 4.6 | % | 7.1 | % |
PEER MEDIAN | | 5.9 | % | 6.5 | % |
Source: SNL Datasource and Relational Investors Analytics
9
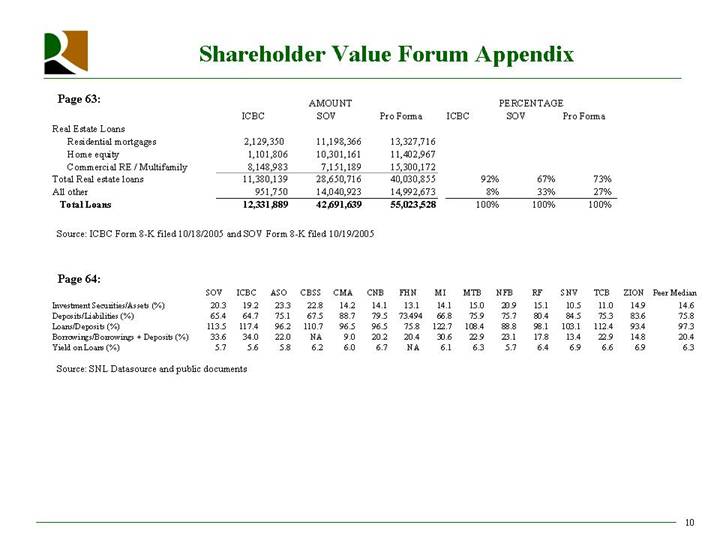
Page 63:
| | AMOUNT | | PERCENTAGE | |
| | ICBC | | SOV | | Pro Forma | | ICBC | | SOV | | Pro Forma | |
Real Estate Loans | | | | | | | | | | | | | |
Residential mortgages | | 2,129,350 | | 11,198,366 | | 13,327,716 | | | | | | | |
Home equity | | 1,101,806 | | 10,301,161 | | 11,402,967 | | | | | | | |
Commercial RE / Multifamily | | 8,148,983 | | 7,151,189 | | 15,300,172 | | | | | | | |
Total Real estate loans | | 11,380,139 | | 28,650,716 | | 40,030,855 | | 92 | % | 67 | % | 73 | % |
All other | | 951,750 | | 14,040,923 | | 14,992,673 | | 8 | % | 33 | % | 27 | % |
Total Loans | | 12,331,889 | | 42,691,639 | | 55,023,528 | | 100 | % | 100 | % | 100 | % |
Source: ICBC Form 8-K filed 10/18/2005 and SOV Form 8-K filed 10/19/2005
Page 64:
| | SOV | | ICBC | | ASO | | CBSS | | CMA | | CNB | | FHN | | MI | | MTB | | NFB | | RF | | SNV | | TCB | | ZION | | Peer Median | |
Investment Securities/Assets (%) | | 20.3 | | 19.2 | | 23.3 | | 22.8 | | 14.2 | | 14.1 | | 13.1 | | 14.1 | | 15.0 | | 20.9 | | 15.1 | | 10.5 | | 11.0 | | 14.9 | | 14.6 | |
Deposits/Liabilities (%) | | 65.4 | | 64.7 | | 75.1 | | 67.5 | | 88.7 | | 79.5 | | 73.494 | | 66.8 | | 75.9 | | 75.7 | | 80.4 | | 84.5 | | 75.3 | | 83.6 | | 75.8 | |
Loans/Deposits (%) | | 113.5 | | 117.4 | | 96.2 | | 110.7 | | 96.5 | | 96.5 | | 75.8 | | 122.7 | | 108.4 | | 88.8 | | 98.1 | | 103.1 | | 112.4 | | 93.4 | | 97.3 | |
Borrowings/Borrowings + Deposits (%) | | 33.6 | | 34.0 | | 22.0 | | NA | | 9.0 | | 20.2 | | 20.4 | | 30.6 | | 22.9 | | 23.1 | | 17.8 | | 13.4 | | 22.9 | | 14.8 | | 20.4 | |
Yield on Loans (%) | | 5.7 | | 5.6 | | 5.8 | | 6.2 | | 6.0 | | 6.7 | | NA | | 6.1 | | 6.3 | | 5.7 | | 6.4 | | 6.9 | | 6.6 | | 6.9 | | 6.3 | |
Source: SNL Datasource and public documents
10
Page 65-67:
ICBC Forecasts
| | Net Income | | Shares | | EPS | |
| | 2006 | | 2007 | | 2006 | | 2007 | | 2006 | | 2007 | |
Bear Stearns | | 205 | | No Estimate | | 77.1 | | No Estimate | | $ | 2.66 | | — | |
Keefe Bruyette Woods | | 202 | | No Estimate | | 80.1 | | No Estimate | | $ | 2.52 | | — | |
Sandler O’Neill | | 208 | | No Estimate | | 78.4 | | No Estimate | | $ | 2.65 | | — | |
Moors & Cabot | | 200 | | No Estimate | | 78.6 | | No Estimate | | $ | 2.55 | | — | |
Lehman Bros. | | 227 | | No Estimate | | 78.6 | | No Estimate | | $ | 2.89 | | — | |
Freidman Billings Ramsey | | 204 | | No Estimate | | 75.8 | | No Estimate | | $ | 2.69 | | — | |
RBC Capital | | NA | | No Estimate | | NA | | No Estimate | | NA | | — | |
Janney Montgomerey | | 210 | | No Estimate | | 76.4 | | No Estimate | | $ | 2.75 | | — | |
CL King | | NA | | No Estimate | | NA | | No Estimate | | NA | | — | |
FTN Midwest | | 203 | | 224 | | 77.0 | | 75.2 | | $ | 2.64 | | $ | 2.98 | |
Average | | 208 | | 224 | | 77.7 | | 75.2 | | $ | 2.67 | | $ | 2.98 | |
SOV Forecasts
| | Net Income | | Shares | | EPS | |
| | 2006 | | 2007 | | 2006 | | 2007 | | 2006 | | 2007 | |
Bear Stearns | | 748 | | No Estimate | | 392 | | No Estimate | | $ | 1.91 | | — | |
Cohen Bros. | | NA | | No Estimate | | NA | | No Estimate | | NA | | — | |
Ryan Beck | | 788 | | No Estimate | | 385 | | No Estimate | | $ | 2.05 | | — | |
JP Morgan | | 730 | | No Estimate | | 375 | | No Estimate | | $ | 1.95 | | — | |
Sandler O’Neill | | NA | | No Estimate | | NA | | No Estimate | | NA | | — | |
Banc of America | | 754 | | No Estimate | | 386 | | No Estimate | | $ | 1.95 | | — | |
Advest | | 752 | | No Estimate | | 389 | | No Estimate | | $ | 1.94 | | — | |
RBC Capital | | NA | | No Estimate | | NA | | No Estimate | | NA | | — | |
AG Edwards | | 767 | | No Estimate | | 393 | | No Estimate | | $ | 1.95 | | — | |
Susquehanna | | 735 | | No Estimate | | 375 | | No Estimate | | $ | 1.96 | | — | |
Keefe Bruyette Woods | | 739 | | No Estimate | | 379 | | No Estimate | | $ | 1.95 | | — | |
Moors & Cabot | | 714 | | No Estimate | | 375 | | No Estimate | | $ | 1.90 | | — | |
Freidman Billings Ramsey | | 741 | | No Estimate | | 385 | | No Estimate | | $ | 1.92 | | — | |
CL King | | NA | | No Estimate | | NA | | No Estimate | | NA | | — | |
Lehman Bros. | | 789 | | No Estimate | | 381 | | No Estimate | | $ | 2.07 | | �� | |
UBS | | 714 | | 736 | | 376 | | 368 | | $ | 1.90 | | $ | 2.00 | |
Citigroup | | 748 | | 804 | | 383 | | 374 | | $ | 1.95 | | $ | 2.15 | |
Average | | 748 | | 770 | | 383 | | 371 | | $ | 1.96 | | $ | 2.08 | |
Note: All forecasts are most recent forecasts prior to ICBC/Santander announcement. SOV I/B/E/S 2007 EPS forecast is $2.08 compared to $2.14 which SOV presented. Most recent I/B/E/S 2007 EPS estimate priorto ICBC/Santander announcement was $2.08 (updated 10/6/05). Although some estimates are missing due to limited availability, all average EPS match I/B/E/S EPS as presented by Sovereign, with the exception of SOV 2007 EPS.
Source: Thomson Baseline, Bloomberg I/B/E/S Estimates, analyst research reports and discussions with analysts
11
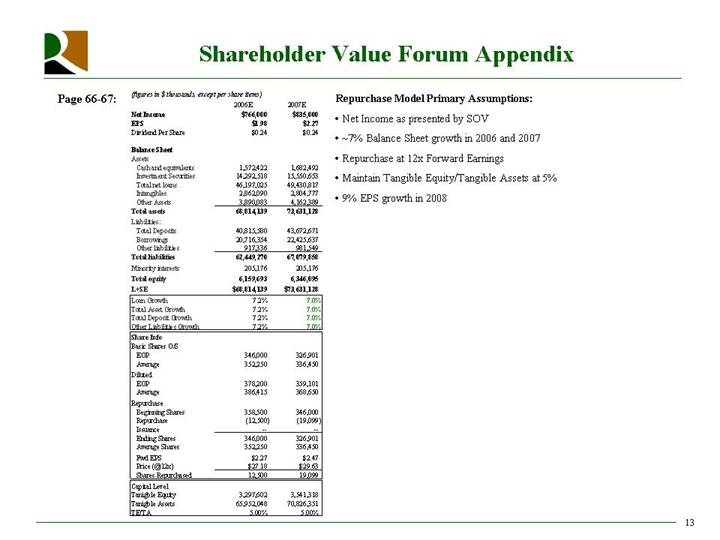
Page 66-67:
($ in millions, except per share amounts)
| | SOV Presentation | | Actual Analyst
Net Income Projections | |
| | Year Ended December 31, | | Year Ended December 31, | |
Earnings Projections | | 2006 | | 2007 | | 2006 | | 2007 | |
SOV Earnings | | 766 | | 835 | | 748 | | 770 | |
ICBC Earnings | | 109 | | 240 | | 104 | | 224 | |
ICBC Expected Costs Saves | | 11 | | 28 | | 11 | | 28 | |
SOV Financing Cost | | (19 | ) | (38 | ) | (19 | ) | (38 | ) |
ICBC Core Deposit Intangible Amortization | | (14 | ) | (26 | ) | (14 | ) | (26 | ) |
Elimination of ICBC CDI and Other Amortization | | 3 | | 6 | | 3 | | 6 | |
ICBC Opportunity Cost of Restructuring Charge | | (2 | ) | (5 | ) | (2 | ) | (5 | ) |
Cumulative Mark-to-Market Adjustments Impact | | (2 | ) | 4 | | (2 | ) | 4 | |
Impact of Exploding ESOP | | 1 | | 2 | | 1 | | 2 | |
| | | | | | | | | |
Pro forma Net Income | | 854 | | 1,046 | | 830 | | 965 | |
Pro forma Cash Net Income | | 904 | | 1,100 | | 880 | | 1,019 | |
| | | | | | | | | |
Sovereign Stand-alone EPS | | $ | 1.96 | | $ | 2.14 | | $ | 1.96 | | $ | 2.08 | |
Acquirer Pro forma EPS | | $ | 1.97 | | $ | 2.18 | | $ | 1.91 | | $ | 2.01 | |
GAAP Accretion / dilution to Sovereign shareholders | | 0.1 | % | 2.1 | % | (2.4 | )% | (3.1 | )% |
| | | | | | | | | |
Stand-alone cash EPS | | $ | 2.06 | | $ | 2.23 | | $ | 2.08 | | $ | 2.20 | |
Acquirer Pro forma Cash EPS | | $ | 2.08 | | $ | 2.30 | | $ | 2.03 | | $ | 2.13 | |
Cash Accretion / dilution to Sovereign shareholders | | 0.8 | % | 3.1 | % | (2.4 | )% | (3.1 | )% |
Note: SOV presented 2007 Consensus EPS of $2.14. The most recentI/B/E/S SOV 2007EPS estimate prior to announcement was $2.08 (as of 10/6/05). Although SOV states $2.14 is the I/B/E/S consensus, analysis has been done using corrected $2.08 EPS and associated consensus net income projections.
12
Page 66-67:
(figures in $ thousands, except per share items)
| | 2006E | | 2007E | |
Net Income | | $ | 766,000 | | $ | 835,000 | |
EPS | | $ | 1.98 | | $ | 2.27 | |
Dividend Per Share | | $ | 0.24 | | $ | 0.24 | |
| | | | | |
Balance Sheet | | | | | |
Assets | | | | | |
Cash and equivalents | | 1,572,422 | | 1,682,492 | |
Investment Securities | | 14,292,518 | | 15,550,653 | |
Total net loans | | 46,197,025 | | 49,430,817 | |
Intangibles | | 2,862,090 | | 2,804,777 | |
Other Assets | | 3,890,083 | | 4,162,389 | |
Total assets | | 68,814,139 | | 73,631,128 | |
Liabilities: | | | | | |
Total Deposits | | 40,815,580 | | 43,672,671 | |
Borrowings | | 20,716,354 | | 22,425,637 | |
Other liabilities | | 917,336 | | 981,549 | |
Total liabilities | | 62,449,270 | | 67,079,858 | |
Minority interests | | 205,176 | | 205,176 | |
Total equity | | 6,159,693 | | 6,346,095 | |
L+SE | | $ | 68,814,139 | | $ | 73,631,128 | |
Loan Growth | | 7.2 | % | 7.0 | % |
Total Asset Growth | | 7.2 | % | 7.0 | % |
Total Deposit Growth | | 7.2 | % | 7.0 | % |
Other Liabilities Growth | | 7.2 | % | 7.0 | % |
Share Info | | | | | |
Basic Shares O/S | | | | | |
EOP | | 346,000 | | 326,901 | |
Average | | 352,250 | | 336,450 | |
Diluted | | | | | |
EOP | | 378,200 | | 359,101 | |
Average | | 386,415 | | 368,650 | |
Repurchase | | | | | |
Beginning Shares | | 358,500 | | 346,000 | |
Repurchase | | (12,500 | ) | (19,099 | ) |
Issuance | | — | | — | |
Ending Shares | | 346,000 | | 326,901 | |
Average Shares | | 352,250 | | 336,450 | |
Fwd EPS | | $ | 2.27 | | $ | 2.47 | |
Price (@12x) | | $ | 27.18 | | $ | 29.63 | |
Shares Repurchased | | 12,500 | | 19,099 | |
Capital Level | | | | | |
Tanigble Equity | | 3,297,602 | | 3,541,318 | |
Tanigble Assets | | 65,952,048 | | 70,826,351 | |
TE/TA | | 5.00 | % | 5.00 | % |
Repurchase Model Primary Assumptions:
• Net Income as presented by SOV
• ~7% Balance Sheet growth in 2006 and 2007
• Repurchase at 12x Forward Earnings
• Maintain Tangible Equity/Tangible Assets at 5%
• 9% EPS growth in 2008
13
Sovereign Bancorp 2004 Compensation
Class | | | | Board Payment ($1000 per Board or Executive Cmte
Mtg) (1)(2) | | Bank Board Payment ($600 per Bank Board
Mtg) (1)(2) | | Chairman Comp (250 shares/Q per committee) (3) | | Audit and Lead Director Comp (250
Shares/Q) (3) | | Quarterly Comp (1,250
shares/Q) (3) | | Bank Director Quarterly Comp (375
shares/Q) (3) | | Non-Employee Directors Bonus Award | | Retainer | | Total | |
| | Non-Management Directors | | | | | | | | | | | | | | | | | | | |
III | | Michael P. Ehlerman | | $ | 14,000 | | $ | 8,400 | | $ | 21,973 | | | | $ | 109,863 | | $ | 32,959 | | $ | 112,750 | | | | $ | 299,944 | |
I | | Brian Hard | | $ | 14,000 | | $ | 8,400 | | $ | 21,973 | | $ | 21,973 | | $ | 109,863 | | $ | 32,959 | | $ | 112,750 | | | | $ | 321,916 | |
II | | Andrew C. Hove, Jr. | | $ | 14,000 | | $ | 8,400 | | $ | 21,973 | | | | $ | 109,863 | | $ | 32,959 | | $ | 112,750 | | | | $ | 299,944 | |
II | | Daniel K. Rothermel (lead director) | | $ | 14,000 | | $ | 8,400 | | $ | 43,945 | | $ | 21,973 | | $ | 109,863 | | $ | 32,959 | | $ | 112,750 | | | | $ | 343,889 | |
I | | Cameron C. Troilo | | $ | 14,000 | | $ | 8,400 | | $ | 21,973 | | | | $ | 109,863 | | $ | 32,959 | | $ | 112,750 | | | | $ | 299,944 | |
| | Average Non-Management Director Pay (4) | | | | | | | | | | | | | | | | | | $ | 313,127 | |
| | | | | | | | | | | | | | | | | | | | | |
| | Management Directors | | | | | | | | | | | | | | | | | | | |
| | | | | | | | | | | | | | | | | | | | | |
III | | Jay Sidhu (Chairman) | | | | | | | | | | | | | | | | | | | |
Class | | | | Audit
(met 12x) | | Nominating
(met 6x) | | Ethics & Corporate Governance
(met 5x) | | Compensation
(met 7x) | | Mergers & Acquisition
(met 1x) | | Retirment Savings Plan
(met 4x) | | Executive
(met 0x) | |
| | Non-Management Directors | | | | | | | | | | | | | | | |
III | | Michael P. Ehlerman | | X | | X | | | | X | | | | X | (C) | | |
I | | Brian Hard | | X | (C) | X | | X | | X | | X | | X | | X | |
II | | Andrew C. Hove, Jr. | | X | | X | | X | (C) | X | | | | | | X | |
II | | Daniel K. Rothermel (lead director) | | X | (VC) | X | (C) | X | | X | | X | | X | | X | (C) |
I | | Cameron C. Troilo | | | | X | | X | | X | (C) | X | | X | | X | |
| | Average Non-Management Director Pay (4) | | | | | | | | | | | | | | | |
| | | | | | | | | | | | | | | | | |
| | Management Directors | | | | | | | | | | | | | | | |
| | | | | | | | | | | | | | | | | |
III | | Jay Sidhu (Chairman) | | | | | | | | | | X | (C) | X | | X | |
(1) Assumes attendance to all meetings
(2) Assumes equal number of Sovereign Bancorp and Sovereign Bank Board Meetings
(3) Shares are priced at the end of each quarter, 1Q: $21.42, 2Q: $22.10, 3Q: $21.82, 4Q: $22.55
(4) Does not include Marian L. Heard who joined the Board in 2005
C = Chairperson
VC = Vice Chairperson
COMPENSATION PAID TO DIRECTORS
All non-employee directors of Sovereign elected or appointed prior to March 24, 2004, receive $1,000 cash for each Sovereign Board or Executive Committee meeting which the director attends and an additional $600 cash for which Sovereign Bank Board meeting which the director attends if the director is also a director of Sovereign Bank. Chairpersons for each committee of Sovereign’s Board receive 250 shares of Sovereign common stock per quarter per service as a committee chairperson. All non-employee directors elected or appointed prior to march 24, 2004, receive compensation in the amount of 1,250 shares of Sovereign common stock per quarter, plus an additional 375 shares per quarter if the director is also a director of Sovereign Bank. For the year ended December 31, 2004, each individual elected or appointed prior to March 24, 2004, who served as a non-employee director of Sovereign for the full year received 5,000 shares of Sovereign common stock, $1,000 for each Board and Executive Committee meeting attended and 1,000 shares of Sovereign common stock for each committee for which such person served as chairperson. In addition, the Chairperson of the Audit Committee and the presiding or “lead director” of the Board, each received an additional 250 shares of Sovereign common stock per quarter for their services.
A non-employee director appointed or elected after March 24, 2004 receives, as payment for services as a director, an annual cash retainer of $63,000, an additional cash payment of $1,000 for each Sovereign Board meeting attended and $600 for attendance at each Sovereign Bank Board meeting if the director is also director of Sovereign Bank. After completion of five years of service as a non-employee director, a director appointed or elected after March 24, 2004, is eligible to receive 100% of the amount of compensation payable to non-employee directors appointed or elected prior to March 24, 2004.
In June 2002, Sovereign’s Board of Directors adopted the Non-Employee Directors Bonus Award Program. The program was amended in January 2004 to provide that any bonus earned under the program will be determined and paid as hereinafter described. The program provides that each individual who is serving as a non-employee director of Sovereign as of December 31, 2003 will be entitled to participate and, therefore, be entitled to bonuses, payable in cash, if certain financial objectives are met or exceeded for calendar years 2004, 2005, 2006 or 2007 and the non-employee director satisfies the program’s continued services requirements.....The Compensation Committee determined, after review of all relevant information with respect to the 2004 cash earnings target and the additional financial objectives, that the specified cash earnings target for 2004 as well as the additional financial objectives for 2004 were achieved. Each non-employee director received a cash payment of $112,750 based on the value of 5,000 shares of Sovereign common stock on December 31, 2004. The program was further amended in February 2005 to limit the amount of a cash bonus that may be earned for each of 2005, 2006 and 2007 to $112,750.
Citigroup
2004 Director Compensation
Class | | | | Retainer | | Stock Options (5,000 shares)(1) | | Committee Chairs
($15,000/Y) | | Audit Committee Chair ($25,000/Y) | | Total | | Executive | | Audit & Risk Mgmt | | Personnel & Compensation | | Nomination & Governance | | Public Affairs | |
| | Non-Management Directors | | | | | | | | | | | | | | | | | | | | | |
| | C. Michael Armstrong | | $ | 125,000 | | $ | 51,177 | | | | $ | 25,000 | | $ | 201,177 | | | | x | (c) | | | x | | | |
| | Alain J.P. Belda | | $ | 125,000 | | $ | 51,177 | | $ | 15,000 | | | | $ | 191,177 | | x | | x | | x | | x | (c) | | |
| | George David | | $ | 125,000 | | $ | 51,177 | | | | | | $ | 176,177 | | | | x | | | | | | | |
| | Kenneth T. Derr | | $ | 125,000 | | $ | 51,177 | | | | | | $ | 176,177 | | x | | | | x | | x | | | |
| | John M. Deutch | | $ | 125,000 | | $ | 51,177 | | | | | | $ | 176,177 | | | | x | | | | x | | x | |
| | Ann Dibble Jordan | | $ | 125,000 | | $ | 51,177 | | $ | 15,000 | | | | $ | 191,177 | | | | | | | | | | x | (c) |
| | Dudley C. Mecum | | $ | 125,000 | | $ | 51,177 | | | | | | $ | 176,177 | | x | | | | | | | | x | |
| | Richard D. Parsons | | $ | 125,000 | | $ | 51,177 | | $ | 15,000 | | | | $ | 191,177 | | | | | | x | (c) | x | | | |
| | Andrall E. Pearson | | $ | 125,000 | | $ | 51,177 | | | | | | $ | 176,177 | | | | | | x | | | | | |
| | Robert E. Rubin | | $ | 125,000 | | $ | 51,177 | | $ | 15,000 | | | | $ | 191,177 | | x | (c) | | | | | | | | |
| | Franklin A. Thomas | | $ | 125,000 | | $ | 51,177 | | | | | | $ | 176,177 | | x | | | | | | | | x | |
| | Gerald R. Ford* | | $ | 125,000 | | $ | 51,177 | | | | | | $ | 176,177 | | | | | | | | | | | |
| | | | | | | | | | | | | | | | | | | | | | | |
| | Average Non-Management Director Pay | | | | | | | | | | $ | 183,260 | | | | | | | | | | | |
| | | | | | | | | | | | | | | | | | | | | | | | | | | | |
| | Management Directors | | | | | | | | | | | | | | | | | | | | | |
| | Charles Prince | | Chief Executive Officer, Citigroup Inc. | | | | | | | | | | | | | |
| | Sanford I. Weill | | Chairman, Citigroup Inc. | | | | | | | | | | | | | | | |
| | Robert B. Willumstad (COO) | | President and Chief Operating Officer, Citigroup Inc., President and Chief Executive Officer, Citicorp and Citibank, N.A. | | | | | |
| | Roberto Hernandez Ramirez | | Chairman of the Board, Banco Nacional de Mexico | | | | | | | | | | | | | |
*Honorary director. 0.02881
C = Chairperson 0.03004
(1) Option Assumptions and Source
Grant Date | | 1/20/04 | | Proxy (Executive Grant Date) | | | | | | | | | | | | |
Exercise Price | | $ | 49.50 | | Proxy (exercise price = market price) | | | | | | | | | | | |
Market Price | | $ | 49.50 | | Closing price one-day prior to grant date | | | | | | | | | | |
Volatility | | 25.98 | % | 10-K | | | | | | | | | | | | | | | | | |
Risk-free rate | | 2.84 | % | 10-K | | | | | | | | | | | | | | | | | |
Dividend Yield | | 2.96 | % | 10-K | | | | | | | | | | | | | | | | | |
Vest Period (days) | | 365 | | Proxy | | | | | | | | | | | | | | | | | |
Life (days) | | 2,190 | | Proxy | | | | | | | | | | | | | | | | | |
Value | | $ | 10.24 | | BSM | | | | | | | | | | | | | | | | | |
COMPENSATION PAID TO DIRECTORS
Directors’ compensation is determined by the board. Since its initial public offering in 1986, Citigroup has paid outside directors all or a portion of their compensation in common stock, to assure that the directors have an ownership interest in common with other stockholders. Non-employee directors, other than Roberto Hernández who, except as described below, has waived receipt of compensation for his services as a director, and the honorary director currently receive an annual retainer of $125,000, payable either 100% in common stock, receipt of which may be deferred at the director’s election, or up to 50% in cash to cover taxes and the remainder in common stock. Directors may elect to receive all or a portion of this compensation in the form of an option to purchase shares of Citigroup common stock. The number of shares in the option grant are calculated by dividing the dollar amount elected by one-quarter of the fair market value of Citigroup common stock on the grant date. The fair market value is defined as the closing price of Citigroup common stock on the NYSE on the trading day immediately preceding the grant date.
The options vest and become exercisable in two equal annual installments beginning one year from the grant date and expire six years after the grant date. In addition, the outside directors and the honorary director receive an annual option grant to purchase 5,000 shares of Citigroup common stock. The calculation of the exercise price and other terms of these options are identical to those described above.
Except as described below, directors receive no additional compensation for participation on board committees and subcommittees. Committee and subcommittee chairs receive additional compensation of $15,000, except for the chair of the audit and risk management committee, who receives $25,000.
JPMorgan Chase & Co.
2004 Director Compensation
| | Annual Retainer ($75,000) | | Common Stock Grant (valued at $170,000) | | Audit Committee Retainer ($10,000) | | Chairman Retainer ($15,000) | | TOTAL | | Audit Committee (met 12x) | | Comp & Mgmt Committee (met 6x) | | Corp Governance & Nominating Committee (met 3x) | | Public Responsibility Committee (met 3x) | | Risk Policy Committee (met 7x) | |
Non-Management Directors | | | | | | | | | | | | | | | | | | | | | |
Hans W. Becherer | | $ | 75,000 | | $ | 170,000 | | $ | 10,000 | | | | $ | 255,000 | | x | | | | | | x | | | |
Riley P. Bechtel | | $ | 75,000 | | $ | 170,000 | | | | | | $ | 245,000 | | | | | | | | | | | |
Frank A. Bennack, Jr. | | $ | 75,000 | | $ | 170,000 | | | | | | $ | 245,000 | | | | | | | | | | | |
John H. Biggs | | $ | 75,000 | | $ | 170,000 | | $ | 10,000 | | | | $ | 255,000 | | x | | | | x | | | | | |
Lawrence A. Bossidy | | $ | 75,000 | | $ | 170,000 | | | | $ | 15,000 | | $ | 260,000 | | | | | | | | x | | x | (c) |
M. Anthony Burns | | $ | 75,000 | | $ | 170,000 | | | | | | $ | 245,000 | | | | | | | | | | | |
Stephen B. Burke | | $ | 75,000 | | $ | 170,000 | | | | | | $ | 245,000 | | | | x | | x | | | | | |
James S. Crown | | $ | 75,000 | | $ | 170,000 | | | | $ | 15,000 | | $ | 260,000 | | | | | | | | x | (c) | x | |
James Dimon | | $ | 75,000 | | $ | 170,000 | | | | | | $ | 245,000 | | | | | | | | | | | |
H. Laurance Fuller | | $ | 75,000 | | $ | 170,000 | | | | | | $ | 245,000 | | | | | | | | | | | |
Ellen V. Futter | | $ | 75,000 | | $ | 170,000 | | | | | | $ | 245,000 | | | | | | | | x | | x | |
William H. Gray, III | | $ | 75,000 | | $ | 170,000 | | | | | | $ | 245,000 | | | | x | | | | x | | | |
Laban P. Jackson | | $ | 75,000 | | $ | 170,000 | | $ | 10,000 | | $ | 15,000 | | $ | 270,000 | | x | (c) | | | x | | | | | |
Helene L. Kaplan | | $ | 75,000 | | $ | 170,000 | | | | | | $ | 245,000 | | | | | | | | | | | |
John W. Kessler | | $ | 75,000 | | $ | 170,000 | | | | | | $ | 245,000 | | | | x | | | | x | | | |
Robert I. Lipp | | $ | 75,000 | | $ | 170,000 | | | | | | $ | 245,000 | | | | | | | | x | | x | |
Richard A. Manoogian | | $ | 75,000 | | $ | 170,000 | | $ | 10,000 | | | | $ | 255,000 | | x | | | | | | x | | | |
David C. Novak | | $ | 75,000 | | $ | 170,000 | | | | $ | 15,000 | | $ | 260,000 | | | | x | | x | (cc) | | | | |
Lee R. Raymond | | $ | 75,000 | | $ | 170,000 | | | | $ | 15,000 | | $ | 260,000 | | | | x | | x | (cc) | | | | |
John R. Stafford | | $ | 75,000 | | $ | 170,000 | | | | $ | 15,000 | | $ | 260,000 | | | | x | (c) | x | | | | | |
| | | | | | | | | | | | | | | | | | | | | |
Average Non-Management Director Pay | | | | | | | | | | $ | $251,500 | | | | | | | | | | | |
Management Directors | | | | | | | | | | | | | | | | | | | | | |
William B. Harrison, Jr. | | Chairman and Chief Executive Officer, JPMorgan Chase and Co. | | | | | | | | | | | | | |
C = Chairperson
CC = Co-Chairman
COMPENSATION PAID TO DIRECTORS
Directors who are officers of the Firm do not receive any fees for their service as directors. Each non-management director receives an annual cash retainer of $75,000 and an annual grant of common stock equivalents valued at $170,000 on the date of grant. Each director who is a member of the Audit Committee receives an additional annual cash retainer of $10,000. Each chairman of a Board committee receives an additional fee of $15,000 per year.
The annual grant of common stock equivalents earns dividend equivalents and remains indexed to the Firm’s common stock until a director’s termination of service, at which time it is paid in cash or reallocated in accordance with elections permitted for deferred cash compensation. As stated in the Corporate Governance Principles, directors pledge that, for as long as they serve, they will retain all shares of the Firm’s common stock purchased on the open market or received pursuant to their service as a Board member.
Each year non-management directors may elect to defer all or part of their cash compensation. A director’s right to receive future payments under any deferred compensation arrangement is an unsecured claim against JPMorgan Chase’s general assets. Cash amounts may be deferred into various investment equivalents, including a common stock equivalent, and will be paid and distributed in cash after the director retires from the Board. Compensation that was paid in common stock in prior years and which may have been deferred is distributable only in common stock when the director retires from the Board.
Bank of America Corp.
2004 Director Compensation
| | Annual Retainer ($100,000) | | Restricted Shares (Valued at $80,500) | | Chairperson Annual Retainer | | 9 Board Meetings ($1,500 per meeting) | | Committee Meetings ($1,500 per meeting) | | TOTAL | | Asset Quality Committee (met 9x) | | Audit Committee (met 15x) | | Compensation Committee (met 6x) | | Corporate Governance Committee (met 7x) | | Executive Committee (met 9x) | |
Non-Management Directors | | | | | | | | | | | | | | | | | | | | | | | |
William Barnet, III | | $ | 100,000 | | $ | 80,500 | | | | $ | 13,500 | | $ | 22,500 | | $ | 216,500 | | | | x | | | | | | | |
Charles W. Coker | | $ | 100,000 | | $ | 80,500 | | $ | 20,000 | | $ | 13,500 | | $ | 22,500 | | $ | 236,500 | | | | | | x | (c) | | | x | |
John T. Collins | | $ | 100,000 | | $ | 80,500 | | | | $ | 13,500 | | $ | 13,500 | | $ | 207,500 | | x | | | | | | | | | |
Gary L. Countryman | | $ | 100,000 | | $ | 80,500 | | | | $ | 13,500 | | $ | 9,000 | | $ | 203,000 | | | | | | x | | | | | |
Paul Fulton | | $ | 100,000 | | $ | 80,500 | | | | $ | 13,500 | | $ | 33,000 | | $ | 227,000 | | | | | | x | | x | | x | |
Donald E. Guinn | | $ | 100,000 | | $ | 80,500 | | $ | 20,000 | | $ | 13,500 | | $ | 22,500 | | $ | 236,500 | | | | x | (c) | | | | | | |
Walter E. Massey | | $ | 100,000 | | $ | 80,500 | | | | $ | 13,500 | | $ | 13,500 | | $ | 207,500 | | x | | | | | | | | | |
Thomas J. May | | $ | 100,000 | | $ | 80,500 | | | | $ | 13,500 | | $ | 22,500 | | $ | 216,500 | | | | x | | | | | | | |
C. Steven McMillan | | $ | 100,000 | | $ | 80,500 | | | | $ | 13,500 | | $ | 22,500 | | $ | 216,500 | | | | x | | | | | | | |
Patricia E. Mitchell | | $ | 100,000 | | $ | 80,500 | | | | $ | 13,500 | | $ | 13,500 | | $ | 207,500 | | x | | | | | | | | | |
Edward L. Romero | | $ | 100,000 | | $ | 80,500 | | | | $ | 13,500 | | $ | 10,500 | | $ | 204,500 | | | | | | | | x | | | |
Thomas M. Ryan | | $ | 100,000 | | $ | 80,500 | | $ | 10,000 | | $ | 13,500 | | $ | 10,500 | | $ | 214,500 | | | | | | | | x | (c) | | |
O. Temple Sloan, Jr. | | $ | 100,000 | | $ | 80,500 | | $ | 20,000 | | $ | 13,500 | | $ | 22,500 | | $ | 236,500 | | | | | | x | | | | x | (c) |
Meredith R. Spangler | | $ | 100,000 | | $ | 80,500 | | | | $ | 13,500 | | $ | 10,500 | | $ | 204,500 | | | | | | | | x | | | |
Jackie M. Ward | | $ | 100,000 | | $ | 80,500 | | $ | 20,000 | | $ | 13,500 | | $ | 13,500 | | $ | 227,500 | | x | (c) | | | | | | | | |
| | | | | | | | | | | | | | | | | | | | | | | |
Average Non-Management Director Pay | | | | | | | | | | | | $ | 217,500 | | | | | | | | | | | |
Total Compensation Paid as Reported in Proxy | | | | | | | | | | | | $ | 3,379,014 | | | | | | | | | | | |
Average Non-Management Director Pay | | | | | | | | | | | | $ | 225,268 | | | | | | | | | | | |
Management Directors | | | | | | | | | | | | | | | | | | | | | | | |
Charles K. Gifford | | Chairman, Bank of America | | | | | | | | | | | | | | | | | | |
James H. Hance, Jr. | | Vice Chairman, Bank of America | | | | | | | | | | | | | | | | | |
Kenneth D. Lewis | | Chief Executive Officer, Bank of America | | | | | | | | | | | | | | | | | |
Eugene M. McQuade | | President, Bank of America Corporation | | | | | | | | | | | | | | | | | |
C = Chairperson
COMPENSATION PAID TO DIRECTORS
Director Compensation. In 2004, the compensation for each director who was not an officer of the Corporation or of a subsidiary (“Non-employee Directors”) consisted of the following:
• An annual retainer in the amount of $100,000, of which $60,000 was paid in cash and $40,000 was paid in restricted shares of Common Stock under the Bank of America Corporation Directors’ Stock Plan (the “Directors’ Stock Plan”).
• An award of restricted shares of Common Stock under the Directors’ Stock Plan with a value set by the Board at $80,500.
• A chairperson annual retainer in the amount of $20,000 for the chairpersons of the asset quality, audit, compensation and executive committees, and $10,000 for the chairperson of the corporate governance committee. The chairperson retainer for the corporate governance committee has been increased to $20,000 effective at the Annual Meeting.
• An attendance fee of $1,500 for each meeting of the Board or committee of the Board.
Restricted shares of Common Stock delivered under the Directors’ Stock Plan (both the stock portion of the annual retainer and the stand-alone award described above) are subject to a one-year vesting requirement. The aggregate amount delivered by the Corporation to Non-employee Directors during 2004 under these arrangements was $3,379,014.
Non-employee Directors can elect to defer all or any portion of their compensation through the Bank of America Corporation Director Deferral Plan (the “Director Deferral Plan”). For any restricted shares of Common Stock that a director elects to defer, the Corporation credits a “stock account” with one “stock unit” for each such share deferred. These stock units are subject to the same one-year vesting requirement that applies under the Directors’ Stock Plan. Directors can choose to have the cash portion of the annual retainer, as well as any chairperson annual retainer and meeting fees, deferred either into the stock account or a “cash account.” The Corporation credits the stock account with dividend equivalents in the form of additional stock units and credits the cash account with interest at a long-term bond rate. Upon retirement from the Board, a Non-employee Director receives the balances of his or her stock account (to the extent vested) and cash account in a single lump sum cash payment (or in 5 or 10 annual installments if previously elected). Because stock units are not actual shares of Common Stock, they do not have any voting rights.
Wachovia Corp.
2004 Director Compensation
| | Quarterly Retainer ($15,000 per quarter) | | 8 Board Meetings ($2,000 per meeting past 6) | | Chair Quarterly Retainer | | Extra Committee Meetings ($1,500 per meeting past 6) | | Deferred Stock ($32,500 per quarter) | | TOTAL | | Executive Committee (met 0x) | | Risk Committee (met 6x) | | Mgmt Resources & Comp Committee (met 7x) | | Corporate Governance & Nominating Committee (met 5x) | | Audit Committee (met 13x) | |
Non-Management Directors | | | | | | | | | | | | | | | | | | | | | | | |
James S. Balloun | | $ | 60,000 | | $ | 4,000 | | | | $ | 10,500 | | $ | 130,000 | | $ | 204,500 | | | | | | | | | | x | |
John T. Casteen, III | | $ | 60,000 | | $ | 4,000 | | | | $ | 10,500 | | $ | 130,000 | | $ | 204,500 | | | | | | | | | | x | |
Joseph Neubauer | | $ | 60,000 | | $ | 4,000 | | $ | 20,000 | | $ | 10,500 | | $ | 130,000 | | $ | 224,500 | | x | | | | | | x | | x | (c) |
Lanty L. Smith | | $ | 60,000 | | $ | 4,000 | | $ | 10,000 | | $ | 10,500 | | $ | 130,000 | | $ | 214,500 | | x | (c) | | | | | x | | x | |
Dona Davis Young | | $ | 60,000 | | $ | 4,000 | | $ | 10,000 | | | | $ | 130,000 | | $ | 204,000 | | | | x | (c) | | | | | | |
John D. Baker, II | | $ | 60,000 | | $ | 4,000 | | | | | | $ | 130,000 | | $ | 194,000 | | | | x | | | | | | | |
Robert J. Brown | | $ | 60,000 | | $ | 4,000 | | | | $ | 1,500 | | $ | 130,000 | | $ | 195,500 | | | | | | x | | | | | |
Peter C. Browning | | $ | 60,000 | | $ | 4,000 | | | | | | $ | 130,000 | | $ | 194,000 | | x | | x | | | | x | | | |
John C. Whitaker, Jr. | | $ | 60,000 | | $ | 4,000 | | | | | | $ | 130,000 | | $ | 194,000 | | x | | x | | | | | | | |
William H. Goodwin, Jr. | | $ | 60,000 | | $ | 4,000 | | | | | | $ | 130,000 | | $ | 194,000 | | x | | x | | | | x | | | |
Robert A. Ingram | | $ | 60,000 | | $ | 4,000 | | $ | 10,000 | | $ | 1,500 | | $ | 130,000 | | $ | 205,500 | | x | | | | x | | x | (c) | | |
Mackey J. McDonald | | $ | 60,000 | | $ | 4,000 | | | | $ | 1,500 | | $ | 130,000 | | $ | 195,500 | | | | | | x | | x | | | |
Lloyd U. Noland, III | | $ | 60,000 | | $ | 4,000 | | | | $ | 10,500 | | $ | 130,000 | | $ | 204,500 | | | | | | | | | | x | |
Ruth G. Shaw | | $ | 60,000 | | $ | 4,000 | | $ | 10,000 | | $ | 1,500 | | $ | 130,000 | | $ | 205,500 | | | | | | x | (c) | | | | |
| | | | | | | | | | | | | | | | | | | | | | | |
Average Non-Management Director Pay (calculated) | | | | | | | | | | | | $ | 202,464 | | | | | | | | | | | |
Total Compensation Paid as Reported in Proxy | | | | | | | | | | | | $ | 2,799,500 | | | | | | | | | | | |
Average Non-Management Director Pay | | | | | | | | | | | | $ | 199,964 | | | | | | | | | | | |
| | | | | | | | | | | | | | | | | | | | | | | | | | | | | | |
Management Directors | | | | | | | | | | | | | | | | | | | | | | | |
G. Kennedy Thompson | | Chairman and Chief Executive Officer, Wachovia Corporation | | | | | | | | | | | | | |
C = Chairperson
COMPENSATION PAID TO DIRECTORS
Our non-employee directors receive a quarterly retainer. In 2004, this quarterly retainer was $15,000. If more than six board or committee meetings are held in an annual period, directors receive an additional $1,500 for each additional committee meeting attended and $2,000 for each additional board meeting attended. In 2004, the Chair of each committee received a quarterly fee of $2,500, except the Chair of the Audit Committee, who receives a quarterly fee of $5,000. In addition, each director was credited in 2004 under the Deferred Compensation Plan for Non-Employee Directors, which is described below, a quarterly amount equal to $32,500, in the director’s common stock equivalent deferred account. Wachovia reimburses directors for travel and accommodation expenses. Directors who are Wachovia employees do not receive any directors’ fees. Directors’ fees totaling $2,799,500 were either paid to the directors in 2004 or deferred under the terms of our Deferred Compensation Plan for Non-Employee Directors.
Under the Deferred Compensation Plan for Non-Employee Directors, directors who are not Wachovia employees may defer payment of all or any part of their directors’ fees. Deferred amounts are payable in cash after the end of the calendar year in which the director ceases to be a director, in annual installments over a ten-year period, unless otherwise determined by the Compensation Committee. In 2004, 14 directors deferred $2,562,200 of their 2004 directors’ fees. Deferred fees may either earn interest or be valued based on the market value of Wachovia common stock, at the director’s option.
Directors having their deferred fees valued based on the market value of Wachovia common stock are investing in common stock equivalents. This means that the value of their deferred account is based on the market value of Wachovia common stock and will rise and fall as if the account were actually invested in the stock. As of February 16, 2005, a total of 16 directors had an aggregate of $20,991,469 in their common stock equivalent deferred accounts, which would equate to an aggregate of approximately 384,882 shares of Wachovia common stock based on the market value of Wachovia common stock on that date. These common stock equivalent amounts include common stock equivalents credited to directors under predecessor companies’ deferred compensation plans. Common stock equivalents do not have voting rights.
Wells Fargo & Company
2004 Director Compensation
| | Annual Retainer ($50,000) | | 6 Board Meetings ($1500 per meeting) | | Committee Meetings ($1500 per meeting) | | Committee Chair Retainer | | Company Stock Award (887 shares valued at $50,000) | | Stock Option Grant (3,920 options valued at $57,000) | | TOTAL | | Audit and Examination Committee (met 8x) | | Governance and Nominating Committee (met 2x) | | Human Resources Committee (met 3x) | | Credit Committee (met 3x) | | Finance Committee (met 4x) | |
Non-Management Directors | | | | | | | | | | | | | | | | | | | | | | | | | |
J. A. Blanchard, III | | $ | 50,000 | | $ | 9,000 | | $ | 19,500 | | | | $ | 50,000 | | $ | 57,000 | | $ | 185,500 | | x | | x | | | | x | | | |
Susan E. Engel | | $ | 50,000 | | $ | 9,000 | | $ | 15,000 | | | | $ | 50,000 | | $ | 57,000 | | $ | 181,000 | | | | | | x | | x | | x | |
Enrique Hernandez, Jr. | | $ | 50,000 | | $ | 9,000 | | $ | 18,000 | | | | $ | 50,000 | | $ | 57,000 | | $ | 184,000 | | x | | | | | | | | x | |
Robert L. Joss | | $ | 50,000 | | $ | 9,000 | | $ | 10,500 | | $ | 10,000 | | $ | 50,000 | | $ | 57,000 | | $ | 186,500 | | | | | | | | x | (c) | x | |
Reatha Clark King | | $ | 50,000 | | $ | 9,000 | | $ | 18,000 | | | | $ | 50,000 | | $ | 57,000 | | $ | 184,000 | | x | | | | | | | | x | |
Richard D. McCormick | | $ | 50,000 | | $ | 9,000 | | $ | 10,500 | | $ | 10,000 | | $ | 50,000 | | $ | 57,000 | | $ | 186,500 | | | | | | x | | | | x | (c) |
Cynthia H. Milligan | | $ | 50,000 | | $ | 9,000 | | $ | 15,000 | | | | $ | 50,000 | | $ | 57,000 | | $ | 181,000 | | x | | x | | | | | | | |
Philip J. Quigley | | $ | 50,000 | | $ | 9,000 | | $ | 19,500 | | $ | 20,000 | | $ | 50,000 | | $ | 57,000 | | $ | 205,500 | | x | (c) | x | | | | x | | | |
Donald B. Rice | | $ | 50,000 | | $ | 9,000 | | $ | 7,500 | | $ | 10,000 | | $ | 50,000 | | $ | 57,000 | | $ | 183,500 | | | | x | (c) | x | | | | | |
Judith M. Runstad | | $ | 50,000 | | $ | 9,000 | | $ | 18,000 | | | | $ | 50,000 | | $ | 57,000 | | $ | 184,000 | | x | | | | | | | | x | |
Stephen W. Sanger | | $ | 50,000 | | $ | 9,000 | | $ | 10,500 | | | | $ | 50,000 | | $ | 57,000 | | $ | 176,500 | | | | | | x | | | | x | |
Susan G. Swenson | | $ | 50,000 | | $ | 9,000 | | $ | 19,500 | | | | $ | 50,000 | | $ | 57,000 | | $ | 185,500 | | x | | x | | | | x | | | |
Michael W. Wright | | $ | 50,000 | | $ | 9,000 | | $ | 12,000 | | $ | 10,000 | | $ | 50,000 | | $ | 57,000 | | $ | 188,000 | | | | x | | x | (c) | x | | | |
| | | | | | | | | | | | | | | | | | | | | | | | | |
Average Non-Management Director Pay | | | | | | | | | | | | | | $ | 185,500 | | | | | | | | | | | |
Management Directors | | | | | | | | | | | | | | | | | | | | | | | | | |
Richard M. Kovacevich | | President and Chief Executive Officer of Wells Fargo & Company | | | | | | | | | | | | | | | |
C = Chairperson
COMPENSATION PAID TO DIRECTORS
Non-employee directors receive an annual cash retainer and other compensation for service as directors in the form of a formula stock award and stock option grant under the Company’s Directors Stock Compensation and Deferral Plan (the “Directors Plan”).
Each non-employee director who served on the Board of the Company during 2004 received a cash retainer at an annual rate of $50,000 plus $1,500 for each Board or committee meeting attended. The Chairs of the Credit, Finance, Governance and Nominating, and Human Resources Committees were paid an additional annual fee of $10,000. The Chair of the Audit and Examination Committee was paid an additional fee of $20,000. Effective January 1, 2005, the annual cash retainer was increased to $65,000 plus $1,600 for each Board or committee meeting attended. The annual fee to be paid to each of the chairs of the Credit, Finance, and Governance and Nominating Committees was set at $15,000; the annual fee to be paid to the chair of the Human Resources Committee was set at $20,000; and the annual fee to be paid to the chair of the Audit and Examination Committee was set at $25,000.
Within five years after joining the Board, directors are expected to own Company common stock having a value equal to five times the cash portion of the annual retainer. Each director has met, or for any director who has served fewer than five years is on track to meet, these ownership requirements. Information with respect to the stock-based compensation paid to non-employee directors in 2004 under the formula stock award and stock option programs of, and the deferral program available under the Directors Plan, appears below.
Each non-employee director who has served on the Board for at least the month of April in any year and is re-elected as a director at the annual meeting of stockholders held that year or who is elected to the Board before September 30 in that year will receive, as of the date of the annual meeting or September 30, as the case may be, an award of shares of Company common stock. For 2004, the amount of this award was worth $50,000, and each current non-employee director received 887 shares of Company common stock. For 2005, this award was increased to $65,000. Non-employee directors who are elected to the Board after September 30 and before April 1 in any year will receive an award of Company stock worth, for 2005, $32,500.
Each non-employee director elected or re-elected at the annual meeting of stockholders receives an option, having a Black-Scholes value of $57,000, to purchase Company common stock at an option exercise price equal to the closing price per share of the common stock as of the trading day immediately preceding the date of the meeting. A non-employee director joining the Board at another time will receive a stock option with a pro-rated value and an option exercise price equal to the closing price per share of Company common stock as of the trading day immediately preceding the date of joining the Board. The options become exercisable six months after grant and remain exercisable for ten years. Directors who exercise an option granted under the plan before September 28, 2004 by delivering shares of previously owned Company common stock or shares purchased in the market, will be granted a reload option. No reload stock option will be granted with respect to an option granted on or after September 28, 2004.
A reload option allows the director to purchase the same number of whole shares of Company common stock, at the closing price per share as of the trading day immediately preceding the date the original option was exercised, as were used to pay the option exercise price. A reload option is exercisable at any time during the remaining term of the original option. Under this program, all current non-employee directors received options to purchase 3,920 shares of Company common stock at $56.39 per share as of April 27, 2004.
Washington Mutual, Inc.
2004 Director Compensation
| | Annual Retainer
($35,000) | | Annual Deferred Retainer ($35,000) | | 8 Board Meetings ($1,500 per meeting) | | Committee Chair Retainer | | Presiding Director | | Committee Meetings ($1,500 per meeting, except Corporate Dev.) | | Stock Option Grant (5,000 options) (1) | | Corporate Development Meeting Retainer | | TOTAL | |
Non-Management Directors | | | | | | | | | | | | | | | | | | | |
Anne V. Farrell | | $ | 35,000 | | $ | 35,000 | | $ | 12,000 | | $ | 7,500 | | | | $ | 12,000 | | $ | 59,154 | | | | $ | 160,654 | |
Stephen E. Frank | | $ | 35,000 | | $ | 35,000 | | $ | 12,000 | | $ | 15,000 | | | | $ | 34,500 | | $ | 59,154 | | $ | 6,000 | | $ | 196,654 | |
Margaret Osmer McQuade | | $ | 35,000 | | $ | 35,000 | | $ | 12,000 | | | | | | $ | 18,000 | | $ | 59,154 | | | | $ | 159,154 | |
William D. Schulte | | $ | 35,000 | | $ | 35,000 | | $ | 12,000 | | | | | | $ | 22,500 | | $ | 59,154 | | | | $ | 163,654 | |
Douglas P. Beighle (presiding director) | | $ | 35,000 | | $ | 35,000 | | $ | 12,000 | | $ | 7,500 | | $ | 5,000 | | $ | 27,000 | | $ | 59,154 | | $ | 6,000 | | $ | 186,654 | |
Philip D. Matthews | | $ | 35,000 | | $ | 35,000 | | $ | 12,000 | | | | | | $ | 33,000 | | $ | 59,154 | | | | $ | 174,154 | |
Michael K. Murphy | | $ | 35,000 | | $ | 35,000 | | $ | 12,000 | | | | | | $ | 27,000 | | $ | 59,154 | | | | $ | 168,154 | |
Mary E. Pugh | | $ | 35,000 | | $ | 35,000 | | $ | 12,000 | | $ | 10,000 | | | | $ | 12,000 | | $ | 59,154 | | | | $ | 163,154 | |
William G. Reed, Jr. | | $ | 35,000 | | $ | 35,000 | | $ | 12,000 | | $ | 10,000 | | | | $ | 28,500 | | $ | 59,154 | | | | $ | 179,654 | |
Elizabeth A. Sanders | | $ | 35,000 | | $ | 35,000 | | $ | 12,000 | | | | | | $ | 22,500 | | $ | 59,154 | | | | $ | 163,654 | |
James H. Stever | | $ | 35,000 | | $ | 35,000 | | $ | 12,000 | | $ | 10,000 | | | | $ | 22,500 | | $ | 59,154 | | $ | 6,000 | | $ | 179,654 | |
Willis B. Wood, Jr. | | $ | 35,000 | | $ | 35,000 | | $ | 12,000 | | | | | | $ | 33,000 | | $ | 59,154 | | $ | 6,000 | | $ | 180,154 | |
| | | | | | | | | | | | | | | | | | | |
Average Non-Management Director Pay | | | | | | | | | | | | | | | | | | $ | 172,945 | |
| | | | | | | | | | | | | | | | | | | | | | | | | | | | |
| | Audit
Committee (met 10x) | | Human Resources Committee (met 8x) | | Governance Committee (met 4x) | | Finance Committee (met 5x) | | Corporate Development Committee (met 1x) | | Corporate Relations Committee (met 3x) | |
Non-Management Directors | | | | | | | | | | | | | |
Anne V. Farrell | | | | | | | | x | | | | x | (c) |
Stephen E. Frank | | x | (c) | x | | | | x | | x | | | |
Margaret Osmer McQuade | | | | | | x | | x | | | | x | |
William D. Schulte | | x | | | | | | x | | | | | |
Douglas P. Beighle (presiding director) | | x | (vc) | x | | | | | | x | | | |
Philip D. Matthews | | x | | x | | x | | | | | | | |
Michael K. Murphy | | x | | | | | | x | | | | x | |
Mary E. Pugh | | | | | | | | x | (c) | | | x | |
William G. Reed, Jr. | | x | | | | x | (c) | x | | | | | |
Elizabeth A. Sanders | | | | x | | x | | | | | | x | |
James H. Stever | | | | x | (c) | x | | | | x | | x | |
Willis B. Wood, Jr. | | x | | x | | x | | | | x | | | |
| | | | | | | | | | | | | |
Average Non-Management Director Pay | | | | | | | | | | | | | |
Management Directors | | | | | | | | | | | | | |
Kerry K. Killinger | | Chairman, President and Chief Executive Officer of Washington Mutual | | | | | | | |
C = Chairperson
(1) Option Grant Assumptions and Sources
Grant Date | | Dec-04 | | Proxy | | | | | | | | |
Exercise Price | | $ | 41.31 | | Proxy (exercise price = market price) | | | | | |
Market Price | | $ | 41.31 | | Bloomberg (avg Dec. price) | | | | | | | |
Volatility | | 28.76 | % | 10-K | | | | | | | | | |
Risk-free rate | | 3.25 | % | 10-K | | | | | | | | | |
Dividend Yield | | 2.61 | % | 10-K | | | | | | | | | |
Vest Period (days) | | 365 | | 10-K | | | | | | | | | |
Life (days) | | 3,650 | | Assumption (no terms in filings) | | | | | | |
Value | | $ | 11.83 | | Bloomberg | | | | | | | | | |
COMPENSATION PAID TO DIRECTORS
Non-employee directors receive the following compensation for their service on the Board of Directors and its committees:
• an annual cash retainer of $35,000;
• an annual deferred retainer of $35,000, which is payable into the director’s phantom stock account in the Company’s Deferred Compensation Plan;
• $750 for attendance at each purely telephonic Board meeting or committee meeting;
• $1,500 for attendance in person or by telephone at each other Board meeting or committee meeting;
• an annual retainer of $10,000 to the chair of each of the Finance, Human Resources and Governance Committees;
• an annual retainer of $7,500 to the chair of the Corporate Relations Committee; and
• annual retainers of $15,000 and $7,500, respectively, to the chair and vice chair of the Audit Committee.
• Each Corporate Development Committee member receives an annual cash retainer of $6,000 in lieu of any fees for committee meeting attendance.
Directors who resign or retire from the Board receive a prorated portion of the applicable cash retainers based upon their service to the Board and committees during the year. The non-management director who is selected to be the presiding director at executive sessions of the Board receives an additional annual cash retainer of $5,000. All directors are reimbursed for travel and accommodation expenses in connection with attendance at Board and committee meetings. Spouses of Company directors may occasionally accompany the directors on flights to Company Board meetings on Company leased air transportation where there are no incremental costs to the Company.
Each non-employee director is eligible for an annual grant of either options to purchase Common Stock or shares of restricted stock issued from the Washington Mutual, Inc. 2003 Equity Incentive Plan, as recommended by the Governance Committee. In January 2005, the Company granted each non-employee director an option to purchase 5,000 shares of Common Stock. Director annual option grants have an exercise price equal to the fair market value of one share of Common Stock on the date of grant and vest on the first anniversary of the date of grant, subject to earlier vesting on termination of service in certain circumstances.
U.S. Bancorp
2004 Director Compensation
| | Annual
Retainer
($ 60,000) | | Annual
Retainer
for Audit
Committee | | Committee
Chair
Retainer | | Restricted
Stock
Award
(1,882
shares) (1) | | Stock
Option
Grants
(5,882
options) (2) | | TOTAL | | Audit
Committee
(met 8x) | | Governance
Committee
(met 5x) | | Compensation
Committee
(met 8x) | | Credit and
Finance
Committee
(met 6x) | | Community
Outreach
and Fair
Lending
Committee
(met 3x) | | Executive
Committee
(met 0x) | |
Non-Management Directors | | | | | | | | | | | | | | | | | | | | | | | | | |
Victoria Buyniski Gluckman | | $ | 60,000 | | | | | | $ | 48,612 | | $ | 55,278 | | $ | 163,890 | | | | | | | | x | | x | | | |
Arthur D. Collins, Jr. | | $ | 60,000 | | | | $ | 10,000 | | $ | 48,612 | | $ | 55,278 | | $ | 173,890 | | | | x | | | | x | (c) | | | x | |
Jerry W. Levin | | $ | 60,000 | | | | $ | 10,000 | | $ | 48,612 | | $ | 55,278 | | $ | 173,890 | | | | x | (c) | | | x | | | | | |
Thomas E. Petry | | $ | 60,000 | | | | | | $ | 48,612 | | $ | 55,278 | | $ | 163,890 | | | | x | | x | | | | | | x | |
Richard G. Reiten | | $ | 60,000 | | $ | 5,000 | | | | $ | 48,612 | | $ | 55,278 | | $ | 168,890 | | x | | | | | | x | | | | x | |
Linda L. Ahlers | | $ | 60,000 | | $ | 5,000 | | | | $ | 48,612 | | $ | 55,278 | | $ | 168,890 | | x | | | | x | | | | | | x | |
Joel W. Johnson | | $ | 60,000 | | | | | | $ | 48,612 | | $ | 55,278 | | $ | 163,890 | | | | x | | | | | | x | | | |
David B. O’Maley | | $ | 60,000 | | | | $ | 10,000 | | $ | 48,612 | | $ | 55,278 | | $ | 173,890 | | | | x | | x | (c) | | | | | x | |
O’Dell M. Owens, M.D., M.P.H. | | $ | 60,000 | | | | | | $ | 48,612 | | $ | 55,278 | | $ | 163,890 | | | | | | | | x | | x | | | |
Craig D. Schnuck | | $ | 60,000 | | $ | 5,000 | | | | $ | 48,612 | | $ | 55,278 | | $ | 168,890 | | x | | | | | | | | x | | | |
Warren R. Staley | | $ | 60,000 | | $ | 5,000 | | $ | 10,000 | | $ | 48,612 | | $ | 55,278 | | $ | 178,890 | | x | (c) | | | | | x | | | | x | |
Peter H. Coors | | $ | 60,000 | | | | $ | 10,000 | | $ | 48,612 | | $ | 55,278 | | $ | 173,890 | | | | | | x | | | | x | (c) | | |
Patrick T. Stokes | | $ | 60,000 | | | | | | $ | 48,612 | | $ | 55,278 | | $ | 163,890 | | | | x | | x | | | | | | x | |
John H. Stollenwork | | $ | 60,000 | | $ | 5,000 | | | | $ | 48,612 | | $ | 55,278 | | $ | 168,890 | | x | | | | x | | | | | | | |
| | | | | | | | | | | | | | | | | | | | | | | | | |
Average Non-Management Director Pay | | | | | | | | | | | | $ | 169,247 | | | | | | | | | | | | | |
Management Directors | | | | | | | | | | | | | | |
Jerry A. Grundhofer | | President and Chief Executive Officer of U.S. Bancorp and Chairman, President and Chief Executive Officer of U.S. Bank National Association |
C = Chairperson
(1) Shares valued as of 2004 Shareholder Meeting: 4/20/2004 ($25.83)
(2) Option Assumptions and Sources
Grant Date | | 1/20/2004 | | Proxy (exec. grant date) |
Exercise Price | | $ | 28.20 | | Proxy (exercise price = market price) |
Market Price | | $ | 28.20 | | Bloomberg |
Volatility | | 40.0% | | 10-K |
Risk-free rate | | 3.5% | | 10-K |
Dividend Yield | | 3.5% | | 10-K |
Vest Period (days) | | 365 | | Proxy |
Life (days) | | 3,650 | | Proxy |
Value | | $ | 9.40 | | BSM |
COMPENSATION PAID TO DIRECTORS
Fees for 2004. For 2004, directors who are not U.S. Bancorp employees will receive the following cash fees:
Annual retainer for service on the Board $ 60,000
Additional annual retainer for Committee Chairs $ 10,000
Additional annual retainer for Audit Committee members $ 5,000
In addition, for 2004, each non-employee director has been granted 1,882 restricted stock units and options to purchase 5,882 shares of our common stock. The restricted stock units are granted under our 2001 Stock Incentive Plan and vest in four equal, annual increments beginning one year from the date of grant. Restricted stock units are distributable in an equivalent number of shares of our common stock if (i) the director retires in accordance with our director retirement policy, (ii) the director’s service is terminated without cause, or (iii) the director leaves service on the Board for any reason after 10 years of service. Only vested units are distributable when the director’s board service ends under other circumstances. All of the stock options granted to our directors are granted under our 2001 Stock Incentive Plan, have a 10-year term, vest in four equal, annual increments beginning one year from the date of grant, and have an exercise price equal to the fair market value of our common stock on the
SunTrust Banks, Inc.
2004 Director Compensation
| | Annual
Retainer
($45,000) | | Committee
Chairs
Annual
Retainer
($10,000) | | 8 Board
Meetings
($1,500 per
meeting) | | Committee
Meetings
($1,500 per
meeting) | | Restricted
Stock Award
(1,200 shares)
(1) | | TOTAL | | Executive
Committee
(met 4x) | | Audit (met
19x) | | Governance
and
Nominating
Committee
(met 4x) | | Compensation
Committee
(met 5x) | |
Non-Management Directors | | | | | | | | | | | | | | | | | | | | | |
Robert M. Beall, II | | $ | 45,000 | | | | $ | 12,000 | | $ | 28,500 | | $ | 81,672 | | $ | 167,172 | | | | x | | | | | |
Jeffrey C. Crowe | | $ | 45,000 | | | | $ | 12,000 | | $ | 28,500 | | $ | 81,672 | | $ | 167,172 | | | | x | | | | | |
J. Hicks Lanier | | $ | 45,000 | | | | $ | 12,000 | | $ | 28,500 | | $ | 81,672 | | $ | 167,172 | | | | x | | | | | |
Larry L. Prince | | $ | 45,000 | | $ | 10,000 | | $ | 12,000 | | $ | 7,500 | | $ | 81,672 | | $ | 156,172 | | | | | | | | x | (c) |
Frank S. Royal, M.D. | | $ | 45,000 | | | | $ | 12,000 | | $ | 28,500 | | $ | 81,672 | | $ | 167,172 | | | | x | | | | | |
J. Hyatt Brown | | $ | 45,000 | | | | $ | 12,000 | | $ | 6,000 | | $ | 81,672 | | $ | 144,672 | | x | | | | | | | |
Alston D. Correll | | $ | 45,000 | | | | $ | 12,000 | | $ | 13,500 | | $ | 81,672 | | $ | 152,172 | | | | | | x | | x | |
Douglas N. Daft | | $ | 45,000 | | | | $ | 12,000 | | $ | 0 | | $ | 81,672 | | $ | 138,672 | | | | | | | | | |
David H. Hughes | | $ | 45,000 | | $ | 10,000 | | $ | 12,000 | | $ | 13,500 | | $ | 81,672 | | $ | 162,172 | | | | | | x | (c) | x | |
G. Gilmer Minor, III | | $ | 45,000 | | | | $ | 12,000 | | $ | 13,500 | | $ | 81,672 | | $ | 152,172 | | | | | | x | | x | |
Patricia C. Frist | | $ | 45,000 | | | | $ | 12,000 | | $ | 28,500 | | $ | 81,672 | | $ | 167,172 | | | | x | | | | | |
M. Douglas Ivester | | $ | 45,000 | | $ | 10,000 | | $ | 12,000 | | $ | 34,500 | | $ | 81,672 | | $ | 183,172 | | | | x | (c) | x | | | |
Karen Hastie Williams | | $ | 45,000 | | | | $ | 12,000 | | $ | 34,500 | | $ | 81,672 | | $ | 173,172 | | | | x | | x | | | |
| | | | | | | | | | | | | | | | | | | | | |
Average Non-Management Director Pay | | | | | | | | | | | | $ | 161,403 | | | | | | | | | |
Management Directors | | | | | | | | | | | | | |
L. Phillip Humann | | Chairman of the Board and Chief Executive Officer of SunTrust | | | | | | | | | | | |
C = Chairperson
(1) Shares priced as of 2004 Shareholder Meeting: 4/20/2004 ($68.06)
COMPENSATION PAID TO DIRECTORS
Compensation. Each director who is not also an employee of SunTrust or its subsidiaries received an annual retainer of $45,000 in 2004. The Chairs of the Governance and Nominating, Compensation, Risk and Audit Committees also each receive an additional retainer of $10,000. In addition, each director was paid a fee of $1,500 for each Board meeting and $1,500 for each committee meeting attended. Directors who were serving on the Board in February 2004 also received a grant of either 1,200 shares of restricted stock or 1,200 restricted stock units, at their election. Such restricted stock or restricted stock units vest after 1 year and each director has the option to defer receipt of the restricted stock or restricted stock units for various time periods after retirement from the Board. Directors serving as directors of SunTrust’s subsidiaries only receive meeting attendance fees for service on those Boards. Directors may defer fees payable to them under SunTrust’s Directors Deferred Compensation Plan.
The return on deferred amounts is determined, at the election of the director, as if such funds had been invested in SunTrust common stock or at a floating interest rate equal to the prime interest rate in effect at SunTrust Bank computed on a quarterly basis. Additional Information Regarding Former National Commerce Financial Corporation Directors. Former non-employee directors of NCF could elect to defer their retainers as well as their meeting fees pursuant to the NCF Director’s Fees Deferral Plan. Mr. Farnsworth, a director of SunTrust since the NCF merger in October 2004, participates in this plan, and his account balance is now measured in phantom shares of SunTrust common stock, to be distributed when he terminates service on the SunTrust Board. No new deferrals are made to this plan after September 30, 2004.
National City Corporation
2004 Director Compensation
| | Annual
Retainer | | Audit
Committee
Retainer | | Other
Committee
Retainer | | 1,200 Shares
Restricted
Stock (1) | | Deferred
Compensation (2) | | TOTAL | | Audit
Committee
(met 11x) | | Compensation
and
Organization
Committee
(met 6x) | | Nominating
and Board
of Directors
Governance
Committee
(met 4x) | | Executive
Committee
(met 1x) | | Risk and
Public
Policy
Committee
(met 3x) | |
Non-Management Directors | | | | | | | | | | | | | | | | | | | | | | | |
Jon E. Barfield | | $ | 40,000 | | $ | 15,000 | | $ | 5,000 | | $ | 41,940 | | $ | 30,720 | | $ | 132,660 | | x | | | | | | x | | | |
James S. Broadhurst | | $ | 40,000 | | $ | 25,000 | | $ | 5,000 | | $ | 41,940 | | $ | 30,720 | | $ | 142,660 | | x | (c) | | | | | | | x | |
John W. Brown | | $ | 40,000 | | | | $ | 20,000 | | $ | 41,940 | | $ | 30,720 | | $ | 132,660 | | | | x | | x | (c) | x | | | |
Christopher M. Connor | | $ | 40,000 | | | | $ | 15,000 | | $ | 41,940 | | $ | 30,720 | | $ | 127,660 | | | | x | | x | | x | | | |
Joseph T. Gorman | | $ | 40,000 | | | | $ | 10,000 | | $ | 41,940 | | $ | 30,720 | | $ | 122,660 | | | | x | | x | | | | | |
Bernadine P. Healy, M.D. | | $ | 40,000 | | | | $ | 5,000 | | $ | 41,940 | | $ | 30,720 | | $ | 117,660 | | | | | | | | | | x | |
Paul A. Ormond | | $ | 40,000 | | | | $ | 15,000 | | $ | 41,940 | | $ | 30,720 | | $ | 127,660 | | | | x | (c) | | | x | | | |
Robert A. Paul | | $ | 40,000 | | $ | 15,000 | | $ | 10,000 | | $ | 41,940 | | $ | 30,720 | | $ | 137,660 | | x | | | | | | x | | x | |
Gerald L. Shaheen | | $ | 40,000 | | | | $ | 10,000 | | $ | 41,940 | | $ | 30,720 | | $ | 122,660 | | | | x | | x | | | | | |
Jerry Sue Thornton, Ph.D. | | $ | 40,000 | | $ | 15,000 | | $ | 0 | | $ | 41,940 | | $ | 30,720 | | $ | 127,660 | | x | | | | | | | | | |
Morry Weiss | | $ | 40,000 | | $ | 15,000 | | $ | 5,000 | | $ | 41,940 | | $ | 30,720 | | $ | 132,660 | | x | | | | | | | | x | |
| | | | | | | | | | | | | | | | | | | | | | | |
Average Non-Management Director Pay | | | | | | | | | $ | 129,478 | | | | | | | | | | | |
| | | | | | | | | | | | | | | | | | | | | |
Management Directors | | | | | | | | | | | | | | | | | | | | | | | |
David A. Daberko | | Chairman of the Board and Chief Executive Officer of National City | | | | | | | | | | | | | |
C = Chairperson
(1) Shares priced as of 2004 Shareholder Meeting: 4/27/2004 ($34.95)
(2) invested in “phantom units” of NCC stock
COMPENSATION PAID TO DIRECTORS
Effective December 1, 2004, members of the board of directors of National City who are not employees of National City, or any of its subsidiaries, receive a yearly retainer of $40,000. An additional yearly retainer of $15,000 is paid to each Audit Committee member, and an additional yearly retainer of $10,000 is paid to the chairman of the Audit Committee. An additional yearly retainer of $5,000 is paid to each member of any other committee, and an additional yearly retainer of $5,000 is paid to the chairman of each other committee. All yearly retainers are payable in quarterly installments on December 1, March 1, June 1 and September 1. Under a plan for the deferred payment of directors’ fees, a director may elect to have the payment of fees deferred until later years. Prior to December 1, 2004, the level of director compensation was equivalent to the new level, but a portion of the compensation was based on meeting attendance.
Each member of the board of directors of National City upon becoming a director is awarded 2,000 shares of Common Stock, subject to transfer restrictions under National City’s Long-Term Cash and Equity Incentive Plan. For the year 2004, each director re-elected to the board of directors was awarded 1,200 shares of Common Stock subject to transfer restrictions under the Long-Term Cash and Equity Incentive Plan. The restrictions on such shares of Common Stock expire at the earlier of the individual director’s death or disability, a change in control or the date that is nine months after the date of the award.
The National City Board of Directors Long-Term Incentive Compensation Plan provides for an annual award for each non-employee director ranging from zero to a maximum of $48,000. The actual award is based on National City’s position, as of December 31 of each year, in the peer group for the 3-year plan cycle then ending under the National City Long-Term Incentive Compensation Plan for Senior Officers. The award is credited to a deferred compensation account for the benefit of the non-employee director and is “invested” in phantom units of Common Stock. The award credited to the non-employee director accounts for the 3-year plan cycle ending December 31, 2004 was $30,720 based on a 7 th place finish in the Peer Group (as defined on page 21) comparison.
Golden West Financial Corporation
2004 Director Compensation
| | Annual
Retainer
(prorated) | | 4 Board
Meetings
($4,000 per
meeting) | | Audit
Committee
($3,500 per
meeting, $4,000
if Chair) | | Other
Committees
($1,500 per
meeting, $2,500 if Chair) | | TOTAL | | Audit
Committee
(met 8x) | | Compensation and
Stock Committee
(met 3x) | | Nominating
and Corporate
Governance
Committee
(met 2x) | |
Non-Management Directors | | | | | | | | | | | | | | | | | |
Patricia A. King | | $ | 27,000 | | $ | 16,000 | | $ | 7,500 | | $ | 50,500 | | | | | | x | (c) | | |
Leslie Tang Schilling | | $ | 27,000 | | $ | 16,000 | | | | $ | 3,000 | | $ | 46,000 | | | | | | x | |
Louis J. Galen | | $ | 27,000 | | $ | 16,000 | | $ | 28,000 | | $ | 3,000 | | $ | 74,000 | | x | | | | x | |
Antonia Hernandez | | $ | 27,000 | | $ | 16,000 | | | | $ | 4,500 | | $ | 47,500 | | | | x | | | |
Maryellen C. Herringer | | $ | 27,000 | | $ | 16,000 | | $ | 28,000 | | $ | 5,000 | | $ | 76,000 | | x | | | | x | (c) |
Bernard A. Osher | | $ | 27,000 | | $ | 16,000 | | | | | | $ | 43,000 | | | | | | | |
Kenneth T. Rosen | | $ | 27,000 | | $ | 16,000 | | $ | 32,000 | | $ | 4,500 | | $ | 79,500 | | x | (c) | x | | | |
| | | | | | | | | | | | | | | | | |
Average Non-Management Director Pay | | | | | | | | | | $ | 59,500 | | | | | | | |
Management Directors | | | | | | | | | | | | | | | | | |
Herbert M. Sandler | | | | | | | | | | | | | | | | | |
Marion L. Sandler | | | | | | | | | | | | | | | | | |
C = Chairperson
COMPENSATION PAID TO DIRECTORS
The only compensation or renumeration that non-employee Directors receive from the Company are an annual retainer and fees for attending regular Board of Directors and committee meetings. Effective May 1, 2004, the non-employee Directors received an annual retainer of $28,000, paid monthly on a pro rata basis, and a fee of $4,000 for each regular Board of Directors meeting attended. In addition, for each regular committee meeting attended on or after May 1, 2004, the Chair of the Audit Committee received $4,000, each of the other members of the Audit Committee received $3,500, the Chairs of the Nominating and Corporate Governance Committee and the Compensation and Stock Option Committee received $2,500, and each of the other members of those committees received $1,500. In addition, Directors receive $250 per half hour for telephone meetings of the Board and committees.
Prior to May 1, 2004, the annual retainer was $25,000, and, for each regular committee meeting attended, the Chair of the Audit Committee received $3,000, each of the other members of the Audit Committee received $2,500, the Chairs of the Nominating and Corporate Governance Committee and the Compensation and Stock Option Committee received $1,500, and each of the other members of those committees received $1,000.
BB&T Corporation
2004 Director Compensation
Class | | | | Retainer | | Board Mtg Fees ($1,500/Mtg)
(met 9x) | | Committee Mtg
Fees
($1,500/Mtg) | | Total | | Executive
(met 4x) | | Audit (met 6x) | | Compensation
(met 4x) | | Nominating/
Corporate
Governance
(met 5x) | |
| | Non-Management Directors | | | | | | | | | | | | | | | | | |
II | | Ronald E. Deal | | $ | 39,650 | | $ | 13,500 | | $ | 13,500 | | $ | 66,650 | | | | | | X | | X | |
II | | Tom D. Efird | | $ | 39,650 | | $ | 13,500 | | $ | 9,000 | | $ | 62,150 | | | | X | | | | | |
II | | Albert O. McCauley | | $ | 39,650 | | $ | 13,500 | | $ | 13,500 | | $ | 66,650 | | | | | | X | | X | |
I | | Jennifer S. Banner | | $ | 39,650 | | $ | 13,500 | | $ | 9,000 | | $ | 62,150 | | | | X | | | | | |
III | | Albert F. Zettlemoyer | | $ | 39,650 | | $ | 13,500 | | $ | 6,000 | | $ | 59,150 | | | | | | X | | | |
III | | Alfred E. Cleveland | | $ | 39,650 | | $ | 13,500 | | $ | 6,000 | | $ | 59,150 | | | | | | X | (C) | | |
III | | J. Ernest Lathem | | $ | 39,650 | | $ | 13,500 | | $ | 9,000 | | $ | 62,150 | | | | X | | | | | |
III | | Richard L. Player | | $ | 39,650 | | $ | 13,500 | | $ | 13,500 | | $ | 66,650 | | | | | | X | | X | |
III | | Nido R. Qubein | | $ | 39,650 | | $ | 13,500 | | $ | 6,000 | | $ | 59,150 | | X | | | | | | | |
III | | Jack E Shaw | | $ | 39,650 | | $ | 13,500 | | $ | 6,000 | | $ | 59,150 | | X | | | | | | | |
I | | Nelle Ratrie Chilton | | $ | 39,650 | | $ | 13,500 | | $ | 13,500 | | $ | 66,650 | | | | | | X | | X | (C) |
I | | L. Vincent Hackley | | $ | 39,650 | | $ | 13,500 | | $ | 9,000 | | $ | 62,150 | | | | X | | | | | |
I | | Jane P. Helm | | $ | 39,650 | | $ | 13,500 | | $ | 9,000 | | $ | 62,150 | | | | X | (C) | | | | |
I | | James H. Maynard | | $ | 39,650 | | $ | 13,500 | | $ | 6,000 | | $ | 59,150 | | X | (C) | | | | | | |
I | | E. Rhone Sasser | | $ | 39,650 | | $ | 13,500 | | $ | 6,000 | | $ | 59,150 | | X | | | | | | | |
| | | | | | | | | | | | | | | | | | | |
| | Average Non-Management Director Pay | | | | | | | | $ | 62,150 | | | | | | | | | |
| | | | | | | | | | | | | | | | | | | |
| | Management Directors | | | | | | | | | | | | | | | | | |
II | | John A. Allison (Chairman/CEO) | | | | | | | | | | X | | | | | | | |
II | | Barry J. Fitzpatrick (Chrmn Branch Bank) | | | | | | | | | | X | | | | | | | |
II | | J. Holmes Morrison (EVP) | | | | | | | | | | X | | | | | | | |
C = Chairperson
In 2004, each nonmanagement director of the Corporation received an annual retainer of $39,650 and meeting fees in the amount of $1,500 for each Board meeting and each assigned committee meeting attended by the director in person or by teleconference. For board service in 2005, each non-employee director will receive a $50,000 annual retainer, $30,000 in nonqualified BB&T Common Stock options granted under the terms of the 2004 Stock Plan (see “Director Option Program” below), and $1,500 per board and assigned committee meeting attended by the director. Beginning 2005, a chair’s fee of $5,000 and $2,500, respectively, will be paid to the Chair of the Audit Committee and the Chair of the Compensation Committee. A director who is an employee of the Corporation or its subsidiaries is not eligible to receive any retainer or fees for service on the Board of Directors.
Bank of New York Co.
2004 Director Compensation
| | Annual
Retainer
($30,000) | | Stock
Shares
(2,400
shares) (1) | | 10 Board
Meetings
($1,800 per
meeting) | | Committee
Chair
Retainer | | Committee
Meetings
($1,800 per
meeting) | | TOTAL | | Nominating
and
Governance
Committee
(met 2x) | | Audit and
Examining
Committee
(met 7x) | | Compensation
and
Organization
Committee
(met 5x) | | Pension
Committee
(met 2x) | | Risk
Committee
(met 4x) | | Executive
Committee
(met 0x) | |
Non-Management Directors | | | | | | | | | | | | | | | | | | | | | | | | | |
Frank Biondi, Jr. | | $ | 30,000 | | $ | 76,992 | | $ | 18,000 | | | | $ | 9,000 | | $ | 133,992 | | | | | | x | | | | | | | |
Nicholas M. Donofrio | | $ | 30,000 | | $ | 76,992 | | $ | 18,000 | | $ | 7,000 | | $ | 19,800 | | $ | 151,792 | | | | x | | | | | | x | (c) | x | |
Richard J. Kogan | | $ | 30,000 | | $ | 76,992 | | $ | 18,000 | | $ | 5,000 | | $ | 9,000 | | $ | 138,992 | | | | | | x | (c) | | | | | x | |
Michael J. Kowalski | | $ | 30,000 | | $ | 76,992 | | $ | 18,000 | | | | $ | 23,400 | | $ | 148,392 | | x | | x | | | | | | x | | x | |
John A. Luke, Jr. | | $ | 30,000 | | $ | 76,992 | | $ | 18,000 | | $ | 3,000 | | $ | 12,600 | | $ | 140,592 | | x | (c) | | | x | | | | | | x | |
John C. Malone | | $ | 30,000 | | $ | 76,992 | | $ | 18,000 | | | | $ | 12,600 | | $ | 137,592 | | x | | | | x | | | | | | x | |
Paul Myners, CBE | | $ | 30,000 | | $ | 76,992 | | $ | 18,000 | | | | $ | 19,800 | | $ | 144,792 | | | | x | | | | | | x | | | |
Robert C. Pozen | | $ | 30,000 | | $ | 76,992 | | $ | 18,000 | | | | $ | 16,200 | | $ | 141,192 | | x | | x | | | | | | | | | |
Catherine A. Rein | | $ | 30,000 | | $ | 76,992 | | $ | 18,000 | | $ | 10,000 | | $ | 23,400 | | $ | 158,392 | | | | x | (c) | | | x | | x | | x | |
William C. Richardson | | $ | 30,000 | | $ | 76,992 | | $ | 18,000 | | $ | 3,000 | | $ | 23,400 | | $ | 151,392 | | | | x | | | | x | (c) | x | | x | |
Brian L. Roberts | | $ | 30,000 | | $ | 76,992 | | $ | 18,000 | | | | $ | 7,200 | | $ | 132,192 | | | | | | | | | | x | | x | |
Samuel C. Scott | | $ | 30,000 | | $ | 76,992 | | $ | 18,000 | | | | $ | 10,800 | | $ | 135,792 | | | | | | | | x | | x | | | |
| | | | | | | | | | | | | | | | | | | | | | | | | |
Average Non-Management Director Pay | | | | | | | | | | $ | 142,925 | | | | | | | | | | | | | |
| | | | | | | | | | | | | | | | | | | | | | | | | |
Management Directors | | | | | | | | | | | | | | | | | | | | | | | | | |
Alan R. Griffith | | Vice Chairman of the Bank of New York Company and The Bank of New York | | | | | | | | | | | | | |
Gerald L. Hassell | | President of the Bank of New York Company Inc., and The Bank of New York | | | | | | | | | | | | | |
Thomas A. Renyi | | Chairman and Chief Executive Officer of The Bank of New York Company, Inc. and The Bank of New York | | | | | | | | | |
C = Chairperson
(1) Shares priced as of 2004 Shareholder Meeting: 4/13/2004 ($32.08)
COMPENSATION PAID TO DIRECTORS
During 2004, each director who was not an officer of the Company or its subsidiaries received an annual retainer of $30,000 and 2,400 shares of Common Stock pursuant to the Directors’ Retainer Plan. In addition, each director who was not an officer of the Company or its subsidiaries received a fee of $1,800 for each meeting of the Board and of any committee which the director attended. The Chairman of the Audit Committee received an additional annual retainer of $10,000, the Chairman of the Risk Committee received an additional annual retainer of $7,000, the Chairman of the Compensation Committee received an additional annual retainer of $5,000, and the Chairmen of the other committees of the Board each received an additional annual retainer of $3,000. A director who serves on the boards of both the Company and the Bank receives only one retainer. If the boards of the Company and the Bank meet on the same day, only one meeting fee is paid for attendance at both meetings.
Fifth Third Bancorp
2004 Director Compensation
| | Annual
Retainer | | Committee
Chair
Annual
Retainer | | 8 Board
Meetings | | Committee
Meetings | | TOTAL | | Executive
Committee
(met 13x) | | Audit
Committee
(met 13x) | | Compensation
Committee
(met 2x) | | Nominating
and
Corporate
Governance
Committee
(met 2x) | | Risk and
Compliance Committee (met 6x) | | Trust Committee (met 4x) | |
Non-Management Directors | | | | | | | | | | | | | | | | | | | | | | | |
James P. Hackett | | $ | 50,000 | | | | $ | 12,000 | | $ | 19,500 | | $ | 81,500 | | | | x | | | | | | | | | |
Joan R. Herschede | | $ | 50,000 | | | | $ | 12,000 | | $ | 25,500 | | $ | 87,500 | | | | x | | | | | | | | x | |
Robert L. Koch, II | | $ | 50,000 | | | | $ | 12,000 | | $ | 22,500 | | $ | 84,500 | | x | | | | | | x | | | | | |
Kenneth W. Lowe | | $ | 50,000 | | | | $ | 12,000 | | $ | 9,000 | | $ | 71,000 | | | | | | x | | | | | | x | |
Thomas W. Traylor | | $ | 50,000 | | | | $ | 12,000 | | $ | 9,000 | | $ | 71,000 | | | | | | | | | | x | | | |
John F. Barrett | | $ | 50,000 | | | | $ | 12,000 | | $ | 28,500 | | $ | 90,500 | | | | x | | | | | | x | | | |
Robert B. Morgan | | $ | 50,000 | | $ | 7,500 | | $ | 12,000 | | $ | 32,500 | | $ | 102,000 | | | | x | (c) | | | | | | | | |
John J. Schiff, Jr. | | $ | 50,000 | | | | $ | 12,000 | | $ | 19,500 | | $ | 81,500 | | x | | | | | | | | | | | |
Dudley S. Taft | | $ | 50,000 | | | | $ | 12,000 | | $ | 22,500 | | $ | 84,500 | | x | | | | | | x | | | | | |
Darryl F. Allen | | $ | 50,000 | | | | $ | 12,000 | | $ | 22,500 | | $ | 84,500 | | | | x | (vc) | | | x | | | | | |
Allyn M. Hill | | $ | 50,000 | | $ | 7,500 | | $ | 12,000 | | $ | 24,500 | | $ | 94,000 | | x | | | | x | (c) | | | | | | |
Dr. Mitchel D. Livingston | | $ | 50,000 | | | | $ | 12,000 | | $ | 6,000 | | $ | 68,000 | | | | | | | | | | | | x | |
Hendrik G. Meijer | | $ | 50,000 | | | | $ | 12,000 | | $ | 9,000 | | $ | 71,000 | | | | | | | | | | x | | | |
James E. Rogers | | $ | 50,000 | | | | $ | 12,000 | | $ | 6,000 | | $ | 68,000 | | | | | | x | | x | | | | | |
| | | | | | | | | | | | | | | | | | | | | | | |
Average Non-Management Director Pay | | | | | | $ | 81,393 | | | | | | | | | | | | | |
| | | | | | | | | | | | | | | | | | | | | | | |
Management Directors | | | | | | | | | | | | | | | | | | | | | | | |
George A. Schaeffer, Jr. | | President and Chief Executive Officer of Fifth Third Bancorp and Fifth Third Bank | | | | | | | | | |
C = Chairperson
COMPENSATION PAID TO DIRECTORS
Non-employee Directors of the Company receive a single annual retainer of $50,000 (payable $25,000 in cash and approximately $25,000 in restricted stock granted under the Company’s Incentive Compensation Plan and vesting at the end of the year) and a fee of $1,500 per meeting attended. Non-employee Directors (other than committee chairs) receive a fee of $1,500 per committee meeting attended. Committee chairs receive an additional annual retainer of $7,500 and receive $2,500 per committee meeting. Pursuant to a Deferred Compensation Plan, Directors may annually defer from one-half to all of their compensation as Directors until age 65 or until they cease to serve on the Board, whichever occurs last. The deferred funds bear interest until paid at an annually adjusted rate equal to 1% over the U.S. treasury bill rate of Directors may elect to receive a return on deferred funds at a rate equal to the rate of return on the Company’s stock. Directors who are also employees receive no additional compensation for service on the Board.
State Street Corp.
2004 Director Compensation
| | Annual
Retainer
($50,000) | | 10 Board
Meetings
($1,500 per
meeting) | | Committee
Meetings
($1,500 per
meeting) | | Deferred Stock
Award (2,067
shares), (1) | | TOTAL | | Executive
Committee
(met 13x) | | Examining and
Audit
Committee
(met 12x) | | Executive
Compensation
Committee
(met 15x) | | Nominating
and
Corporate
Governance
Committee
(met 5x) | |
Non-Management Directors | | | | | | | | | | | | | | | | | | | |
Tenley E. Albright, M.D. | | $ | 50,000 | | $ | 15,000 | | $ | 18,000 | | $ | 99,195 | | $ | 182,195 | | | | x | | | | | |
Kennett F. Burnes | | $ | 50,000 | | $ | 15,000 | | $ | 19,500 | | $ | 99,195 | | $ | 183,695 | | x | | | | | | | |
Truman S. Casner | | $ | 50,000 | | $ | 15,000 | | $ | 19,500 | | $ | 99,195 | | $ | 183,695 | | x | (c) | | | | | | |
Nader F. Darehshori | | $ | 50,000 | | $ | 15,000 | | $ | 30,000 | | $ | 99,195 | | $ | 194,195 | | | | | | x | | x | |
Arthur L. Goldstein | | $ | 50,000 | | $ | 15,000 | | $ | 7,500 | | $ | 99,195 | | $ | 171,695 | | | | | | | | x | (c) |
David P. Gruber | | $ | 50,000 | | $ | 15,000 | | $ | 37,500 | | $ | 99,195 | | $ | 201,695 | | x | | x | | | | | |
Linda A. Hill | | $ | 50,000 | | $ | 15,000 | | $ | 22,500 | | $ | 99,195 | | $ | 186,695 | | | | | | x | | | |
Charles R. LaMantia | | $ | 50,000 | | $ | 15,000 | | $ | 37,500 | | $ | 99,195 | | $ | 201,695 | | x | | x | (c) | | | | |
Richard P. Sergel | | $ | 50,000 | | $ | 15,000 | | $ | 22,500 | | $ | 99,195 | | $ | 186,695 | | | | | | x | | | |
Ronald L. Skates | | $ | 50,000 | | $ | 15,000 | | $ | 18,000 | | $ | 99,195 | | $ | 182,195 | | | | x | | | | | |
Gregory L. Summe | | $ | 50,000 | | $ | 15,000 | | $ | 7,500 | | $ | 99,195 | | $ | 171,695 | | | | | | | | x | |
Diana Chapman Walsh | | $ | 50,000 | | $ | 15,000 | | $ | 7,500 | | $ | 99,195 | | $ | 171,695 | | | | | | | | x | |
Robert E. Weissman | | $ | 50,000 | | $ | 15,000 | | $ | 22,500 | | $ | 99,195 | | $ | 186,695 | | | | | | x | (c) | | |
| | | | | | | | | | | | | | | | | | | |
Average Non-Management Director Pay | | | | | | | | $ | 184,965 | | | | | | | | | |
| | | | | | | | | | | | | | | | | | | |
Management Directors | | | | | | | | | | | | | | | | | | | |
Ronald E. Logue | | President and Chief Operating Officer of State Street | | | | | | | | | | | |
David A. Spina | | Chairman and Chief Executive Officer of State Street | | | | | | | | | | | |
C = Chairperson
(1) Shares priced as of 2004 Shareholder Meeting: 4/21/2004 ($47.99)
COMPENSATION PAID TO DIRECTORS
Directors who are also employees of State Street or the Bank do not receive any compensation for serving as directors or as members of committees. The compensation for the non-management directors of State Street is reviewed and determined annually by the Executive Compensation Committee of the Board of Directors. For the period April 2004 through March 2005, directors who are not employees of State Street or the Bank received the following compensation:
annual retainer – $50,000, payable at their option in shares of common stock of State Street or in cash, meeting fees – $1,500 for each Board and committee meeting, and an award of 2,067 shares of deferred stock, payable (together with additional stock amounts to reflect dividend and distribution amounts paid during deferral) after the director leaves the Board.
For this period, one outside director elected to receive his annual retainer in cash, and all other outside directors elected to receive their annual retainer in shares of common stock. The directors may elect to defer either 50% or 100% of fees and compensation payable during any calendar year pursuant to State Street’s Deferred Compensation Plan for Directors, until after the director leaves the board or attains a specified age. Under the plan, deferred cash amounts accrue interest during deferral at a rate equal to the effective yield on 360-day Treasury bills, and deferred stock amounts are adjusted to reflect dividend and distribution amounts paid during deferral. Three directors have elected to defer compensation under the plan.
KeyCorp
2004 Director Compensation
Class | | | | Retainer | | Board
Mtg Fees
($1,500
/Mtg)
(met 6x) | | Committee
Mtg Fees
($1,500/Mtg) | | Committee
Chair
($2,500/Q) | | Deferred
Shares (1) | | Total | | Audit
(met 14x) | | Compensation
(met 9x) | | Executive
(met 2x) | | Finance
(met 6x) | | Nominating/
Corporate
Governance
(met 8x) | |
| | Non-Management Directors | | | | | | | | | | | | | | | | | | | | | | | |
II | | Alexander M. Cutler | | $ | 35,000 | | $ | 9,000 | | $ | 25,500 | | $ | 10,000 | | $ | 70,000 | | $ | 149,500 | | | | X | (C) | | | | | X | |
II | | Douglas J. McGregor | | $ | 35,000 | | $ | 9,000 | | $ | 16,500 | | | | $ | 70,000 | | $ | 130,500 | | | | X | | X | | | | | |
II | | Eduardo R. Menasce | | $ | 35,000 | | $ | 9,000 | | $ | 33,000 | | | | $ | 70,000 | | $ | 147,000 | | X | | | | | | | | X | |
II | | Peter G. Ten Eyck II | | $ | 35,000 | | $ | 9,000 | | $ | 24,000 | | | | $ | 70,000 | | $ | 138,000 | | X | | | | X | | | | | |
III | | Edward P. Campbell | | $ | 35,000 | | $ | 9,000 | | $ | 33,000 | | $ | 10,000 | | $ | 70,000 | | $ | 157,000 | | X | (C) | | | | | | | X | |
III | | Charles R. Hogan | | $ | 35,000 | | $ | 9,000 | | $ | 12,000 | | | | $ | 70,000 | | $ | 126,000 | | | | | | X | | X | | | |
III | | Lauralee E. Martin | | $ | 35,000 | | $ | 9,000 | | $ | 21,000 | | | | $ | 70,000 | | $ | 135,000 | | X | | | | | | | | | |
III | | Bill R. Sanford | | $ | 35,000 | | $ | 9,000 | | $ | 21,000 | | $ | 10,000 | | $ | 70,000 | | $ | 145,000 | | | | | | | | X | (C) | X | |
III | | Dennis W. Sullivan | | $ | 35,000 | | $ | 9,000 | | $ | 16,500 | | | | $ | 70,000 | | $ | 130,500 | | | | X | | X | | | | | |
I | | William G. Bares | | $ | 35,000 | | $ | 9,000 | | $ | 21,000 | | $ | 10,000 | | $ | 70,000 | | $ | 145,000 | | | | | | | | X | | X(C | ) |
I | | Dr. Carol A. Cartwright | | $ | 35,000 | | $ | 9,000 | | $ | 16,500 | | | | $ | 70,000 | | $ | 130,500 | | | | X | | X | | | | | |
I | | Henry S. Hemingway | | $ | 35,000 | | $ | 9,000 | | $ | 9,000 | | | | $ | 70,000 | | $ | 123,000 | | | | | | | | X | | | |
I | | Steven A. Minter | | $ | 35,000 | | $ | 9,000 | | $ | 21,000 | | | | $ | 70,000 | | $ | 135,000 | | X | | | | | | | | | |
| | | | | | | | | | | | | | | | | | | | | | | | | |
| | Average Non-Management Director Pay | | | | | | | | | | | | $ | 137,846 | | | | | | | | | | | |
| | | | | | | | | | | | | | | | | | | | | | | | | |
| | Management Directors | | | | | | | | | | | | | | | | | | | | | | | |
II | | Henry L. Meyer III (Chairman/CEO) | | | | | | | | | | | | | | | | | | X | (C) | | | | |
I | | Thomas C. Stevens (CAO) | | | | | | | | | | | | | | | | | | X | | X | | | |
C = Chairperson
(1) Deferred shares are “phantom” shares equal to 200% of the annual cash retainer payable to a director. Each share is deferred for 3 years.
Directors (other than Messrs. Meyer and Stevens who receive no director fees) receive fees consisting of a $35,000 annual retainer, payable in quarterly installments, and $1,500 for attendance at each Board or committee meeting except that fees for each scheduled Board or committee telephonic meeting are $1,000 for each meeting. Outside directors who serve as committee chairpersons receive additional compensation of $2,500 per quarter. Under KeyCorp’s Directors’ Deferred Share Plan (the “Directors’ Plan”), each of the non-employee directors is automatically granted, on an annual basis, “phantom” KeyCorp Common Shares (“Deferred Shares”) having an aggregate value equal to 200% of the annual cash retainer payable to a director. Each grant is subject to a minimum three-year deferral period which is accelerated upon a director’s retirement or death. The Deferred Shares are paid in Common Shares, cash, or a combination of Common Shares and cash, as determined annually by the Nominating and Corporate Governance Committee.
In 2004, each Director was granted 2,368 Deferred Shares, one-half of which are payable in Common Shares and the other one-half payable in cash. Messrs. Meyer and Stevens were not eligible to participate in the Directors’ Plan during 2004 because they were employees of KeyCorp.
Under the KeyCorp Director Deferred Compensation Plan, directors are given the opportunity to defer for future distribution payment of director fees and further defer payment of Deferred Shares. Deferred payments of director fees are invested in either an interest bearing account (at an interest rate equal to 1 / 2% higher than the effective annual yield of the Moody’s Average Corporate Bond Yield Index) or a KeyCorp Common Shares account (in which the directors’ deferred compensation is invested on a bookkeeping basis in “phantom” KeyCorp Common Shares which are accrued quarterly but cannot be voted or transferred during the deferral period). Deferred payments of Deferred Shares are invested solely in the Common Shares account. Distributions to the directors under the Director Deferred Compensation Plan in respect to the interest bearing account are in the form of cash and under the Common Shares account are in the form of KeyCorp Common Shares.
PNC Bank Corp
2004 Director Compensation
| | Annual
Retainer
($40,000) | | Committee
Chairman
Retainer
($10,000) | | Presiding
Director | | Board
Meeting
Fee-11
meetings
($1,500 per
meeting) | | Committee
Meeting
($1,500 per
meeting) | | Seventh
plus
committee
fee ($2,000
per meeting
after 7) | | Common
Stock
($5,013) | | Non-
statutory
Stock
Options
(2,000) (1) | | Value of
1,000
deferred
stock units | | TOTAL | |
Non-Management Directors | | | | | | | | | | | | | | | | | | | | | |
Paul W. Chellgren | | $ | 40,000 | | $ | 10,000 | | | | $ | 13,500 | | $ | 21,000 | | | | $ | 5,013 | | $ | 25,334 | | $ | 52,750 | | $ | 167,597 | |
Robert N. Clay | | $ | 40,000 | | $ | 0 | | | | $ | 13,500 | | $ | 18,000 | | $ | 2,000 | | $ | 5,013 | | $ | 25,334 | | $ | 52,750 | | $ | 156,597 | |
J. Gary Cooper | | $ | 40,000 | | $ | 0 | | | | $ | 13,500 | | $ | 15,000 | | $ | 20,000 | | $ | 5,013 | | $ | 25,334 | | $ | 52,750 | | $ | 171,597 | |
George A. Davidson, Jr. | | $ | 40,000 | | $ | 10,000 | | | | $ | 13,500 | | $ | 18,000 | | $ | 20,000 | | $ | 5,013 | | $ | 25,334 | | $ | 52,750 | | $ | 184,597 | |
Richard B. Kelson | | $ | 40,000 | | $ | 0 | | | | $ | 13,500 | | $ | 18,000 | | $ | 20,000 | | $ | 5,013 | | $ | 25,334 | | $ | 52,750 | | $ | 174,597 | |
Bruce C. Lindsay | | $ | 40,000 | | $ | 0 | | | | $ | 13,500 | | $ | 21,000 | | $ | 20,000 | | $ | 5,013 | | $ | 25,334 | | $ | 52,750 | | $ | 177,597 | |
Anthony A. Massaro | | $ | 40,000 | | $ | 0 | | | | $ | 13,500 | | $ | 27,000 | | $ | 2,000 | | $ | 5,013 | | $ | 25,334 | | $ | 52,750 | | $ | 165,597 | |
Jane G. Pepper | | $ | 40,000 | | $ | 0 | | | | $ | 13,500 | | $ | 12,000 | | | | $ | 5,013 | | $ | 25,334 | | $ | 52,750 | | $ | 148,597 | |
Lorene K. Steffes | | $ | 40,000 | | $ | 10,000 | | | | $ | 13,500 | | $ | 24,000 | | $ | 2,000 | | $ | 5,013 | | $ | 25,334 | | $ | 52,750 | | $ | 172,597 | |
Dennis F. Strigl | | $ | 40,000 | | $ | 10,000 | | | | $ | 13,500 | | $ | 18,000 | | | | $ | 5,013 | | $ | 25,334 | | $ | 52,750 | | $ | 164,597 | |
Stephen G. Thieke | | $ | 40,000 | | $ | 10,000 | | | | $ | 13,500 | | $ | 21,000 | | $ | 20,000 | | $ | 5,013 | | $ | 25,334 | | $ | 52,750 | | $ | 187,597 | |
Thomas J. Usher (Presiding Director) | | $ | 40,000 | | $ | 20,000 | | $ | 10,000 | | $ | 13,500 | | $ | 21,000 | | $ | 2,000 | | $ | 5,013 | | $ | 25,334 | | $ | 52,750 | | $ | 189,597 | |
Milton A. Washington | | $ | 40,000 | | $ | 0 | | | | $ | 13,500 | | $ | 15,000 | | | | $ | 5,013 | | $ | 25,334 | | $ | 52,750 | | $ | 151,597 | |
Helge H. Wehmeier | | $ | 40,000 | | $ | 0 | | | | $ | 13,500 | | $ | 15,000 | | $ | 2,000 | | $ | 5,013 | | $ | 25,334 | | $ | 52,750 | | $ | 153,597 | |
| | | | | | | | | | | | | | | | | | | | | |
Average Non-Management Director Pay | | | | | | | | | | | | | | | | | | | | $ | 169,025 | |
| | | | | | | | | | | | | | | | | | | | | |
Management Directors | | | | | | | | | | | | | | | | | | | | | |
Thomas H. O’Brien | | | | | | | | | | | | | | | | | | | | | |
James E. Rohr | | | | | | | | | | | | | | | | | | | | | |
| | | | | | | | | | | | | | | | | | | | | | | | | | | | | | | |
| | Audit Committee
(met 16x) | | Finance Committee
(met 6x) | | Credit Committee
(met 4x) | | Nominating and
Governance
Committee (met 7x) | | Personnel and
Compensation
Committee (met 6x) | | Operations and
Technology
Committee (met 4x) | | Executive
Committee
(met 2x) | |
Non-Management Directors | | | | | | | | | | | | | | | |
Paul W. Chellgren | | | | X | (C) | | | | | X | | | | X | |
Robert N. Clay | | | | X | | | | X | | | | | | | |
J. Gary Cooper | | X | | | | X | | | | | | | | | |
George A. Davidson, Jr. | | X | | | | X | (C) | | | | | | | X | |
Richard B. Kelson | | X | | X | | | | | | | | | | | |
Bruce C. Lindsay | | X | | | | X | | | | | | X | | | |
Anthony A. Massaro | | | | X | | | | X | | X | | | | | |
Jane G. Pepper | | | | | | X | | | | | | X | | | |
Lorene K. Steffes | | | | | | X | | X | | | | X | (C) | X | |
Dennis F. Strigl | | | | | | | | | | X | (C) | X | | X | |
Stephen G. Thieke | | X | (C) | X | | | | | | | | | | X | |
Thomas J. Usher (Presiding Director) | | | | | | | | X | (C) | X | | | | X | (C) |
Milton A. Washington | | | | | | X | | | | X | | | | | |
Helge H. Wehmeier | | | | | | | | X | | | | X | | | |
| | | | | | | | | | | | | | | |
Average Non-Management Director Pay | | | | | | | | | | | | | | | |
| | | | | | | | | | | | | | | |
Management Directors | | | | | | | | | | | | | | | |
Thomas H. O’Brien | | | | X | | | | | | | | | | | |
James E. Rohr | | | | | | X | | | | | | X | | X | |
C = Chairperson | |
(1) | Option Assumptions and Source | |
| | |
| Grant Date | | 4/27/04 | | Proxy (shareholder meeting date) | |
| Exercise Price | | $ | 53.02 | | Proxy (avg of stock high and low on grant date) | |
| Market Price | | $ | 52.75 | | Bloomberg | |
| Volatility | | 28.9 | % | 10-K | |
| Risk-free rate | | 3.4 | % | 10-K | |
| Dividend Yield | | 3.6 | % | 10-K | |
| Vest Period (days) | | 365 | | proxy | |
| Life (days) | | 3,650 | | proxy | |
| Value | | $ | 12.67 | | BSM | |
COMPENSATION PAID TO DIRECTORS
Retainer for each director $40,000
Committee chairman’s retainer, for each committee chaired $10,000
Presiding Director’s retainer $10,000
Each Board meeting, except quarterly telephonic dividend meetings $1,500
Each quarterly telephonic dividend meeting $750
For each of the first six meetings held annually by each committee or subcommittee on which the director serves $1,500
For the seventh and each succeeding meeting held annually by each committee or subcommittee on which the director serves $2,000
Value of January 2, 2004 annual grant of PNC common stock under the 1992 Director Share Incentive Plan $5,013
Number of non-statutory stock options granted on April 27, 2004 under the 1997 Long-Term Incentive Award Plan with an exercise price of $53.02, a one-year vesting period, and an expiration date of April 27, 2014: 2,000
Value of 1,000 deferred stock units awarded to each director’s account under the Outside Directors Deferred Stock Unit Plan as of April 27, 2004: $52,750
UnionBanCal
2004 Director Compensation
| | Annual Retainer | | Committee Chair
Retainer | | Presiding Director
Retainer | | 9 Board Meetings
($1,000 per
meeting) | | Committee
Meetings ($1,000
per meeting) | | Stock Option
Award (3,000
shares) (1) | | TOTAL | |
Non-Management Directors | | | | | | | | | | | | | | | |
Aida M. Alvarez | | $ | 30,000 | | | | | | $ | 9,000 | | $ | 10,000 | | $ | 60,957 | | $ | 109,957 | |
David R. Andrews | | $ | 30,000 | | | | | | $ | 9,000 | | $ | 18,000 | | $ | 60,957 | | $ | 117,957 | |
L. Dale Crandall (audit committee financial expert) | | $ | 30,000 | | $ | 10,000 | | | | $ | 9,000 | | $ | 31,000 | | $ | 60,957 | | $ | 140,957 | |
Richard D. Farman (Presiding Director) | | $ | 30,000 | | $ | 10,000 | | $ | 5,000 | | $ | 9,000 | | $ | 21,000 | | $ | 60,957 | | $ | 135,957 | |
Stanley F. Farrar | | $ | 30,000 | | $ | 5,000 | | | | $ | 9,000 | | $ | 18,000 | | $ | 60,957 | | $ | 122,957 | |
Michael J. Gillfillan | | $ | 30,000 | | | | | | $ | 9,000 | | $ | 31,000 | | $ | 60,957 | | $ | 130,957 | |
Ronald L. Havner, Jr. | | $ | 30,000 | | | | | | $ | 9,000 | | $ | 16,000 | | $ | 60,957 | | $ | 115,957 | |
Mary S. Metz | | $ | 30,000 | | | | | | $ | 9,000 | | $ | 20,000 | | $ | 60,957 | | $ | 119,957 | |
J. Fernando Niebla | | $ | 30,000 | | $ | 5,000 | | | | $ | 9,000 | | $ | 25,000 | | $ | 60,957 | | $ | 129,957 | |
Carl W. Robertson | | $ | 30,000 | | $ | 5,000 | | | | $ | 9,000 | | $ | 10,000 | | $ | 60,957 | | $ | 114,957 | |
| | | | | | | | | | | | | | | |
Average Non-Management Director Pay | | | | | | | | | | | | | | $ | 123,957 | |
| | | | | | | | | | | | | | | | | | | | | | |
| | Audit Committee
(met 15x) | | Corporate
Governance
Committee (met 5x) | | Executive Comp. &
Benefits Committee
(met 8x) | | Finance & Capital
Committee (met 8x) | | Public Policy
Committee (met 5x) | | Trust Committee
(met 5x) | |
Non-Management Directors | | | | | | | | | | | | | |
Aida M. Alvarez | | | | | | | | | | x | | x | |
David R. Andrews | | | | x | | | | x | | | | x | |
L. Dale Crandall (audit committee financial expert) | | x | (c) | | | x | | x | | | | | |
Richard D. Farman (Presiding Director) | | | | x | (c) | x | (c) | x | | | | | |
Stanley F. Farrar | | | | x | | | | x | (c) | | | x | |
Michael J. Gillfillan | | x | | | | x | | x | | | | | |
Ronald L. Havner, Jr. | | | | | | x | | x | | | | | |
Mary S. Metz | | x | | | | | | | | x | | | |
J. Fernando Niebla | | x | | x | | | | | | x | (c) | | |
Carl W. Robertson | | | | | | | | | | x | | x | (c) |
| | | | | | | | | | | | | |
Average Non-Management Director Pay | | | | | | | | | | | | | |
Management Directors | | | |
Philip B. Flynn | | Chief Operating Officer of UnionBanCal and Union Bank of California, Director | |
Norimichi Kanari | | President, Chief Executive Officer and Director of UnionBanCal | |
Tetsuo Shimura | | Chairman of the Board | |
Takashi Morimura | | Vice Chairman of the Board | |
Richard C. Hartnack | | Vice Chairman of the Board | |
C = Chairperson
(1) Option Assumptions and Source
| Grant Date: | | 5/1/04 | | Proxy | |
| Exercise Price: | | $ | 53.43 | | Proxy | |
| Market Price: | | $ | 53.43 | | Bloomberg | |
| Volatility: | | 40.0 | % | 10-K | |
| Risk-free rate: | | 2.8 | % | 10-K | |
| Dividend Yield: | | 2.4 | % | 10-K | |
| Vest Period (days): | | — | | Proxy | |
| Life (days): | | 3,650 | | Proxy | |
| Value: | | $ | 20.32 | | BSM | |
COMPENSATION PAID TO DIRECTORS
Directors who are not full-time officers of UnionBanCal or The Bank of Tokyo-Mitsubishi, Ltd. or its affiliates received an annual combined retainer for service on our Board of Directors or the Board of Directors of Union Bank of California, N.A., and meeting fees for attendance at board and committee meetings. The annual combined retainer for service on the Boards of UnionBanCal and Union Bank of California, N.A., is $30,000, pro-rated and payable quarterly in advance. In addition, the annual combined retainer for service on the Boards of UnionBanCal and Union Bank of California, N.A., for each non-officer committee chair is $5,000, pro-rated and payable quarterly in advance, except for the Audit Committee Chair, who receives an annual combined retainer of $10,000, pro-rated and payable quarterly in advance. The Presiding Director receives an additional annual retainer of $5,000, pro-rated and payable quarterly in advance. Directors who are not full-time officers of UnionBanCal or The Bank of Tokyo-Mitsubishi, Ltd., or its affiliates were also paid the following:
a fee of $1,000 for each board meeting attended, except that when board meetings of UnionBanCal and Union Bank of California, N.A., were held on the same day, the total fee was limited to $1,000; and a fee of $1,000 for each board committee meeting attended, except that when the same committees of UnionBanCal and Union Bank of California, N.A., had a combined meeting, the total fee was limited to $1,000.
[Options Grant:] May 1, 2004 3,000 $ 53.43 100% vested and immediately exercisable on the Grant Date Ten years from the Grant Date or three years after retirement.
Non-employee and non-expatriate Directors may defer all or any portion of their annual retainers or meeting fees either to stock units or into an interest bearing account. In 2003, the Compensation Committee adopted a program under the Year 2000 UnionBanCal Corporation Management Stock Plan pursuant to which non-employee Directors may irrevocably elect to defer all or a portion of the cash retainer and/or fees payable to them for services on the Board and its committees in the form of stock units. Stock units are a form of deferred compensation payable in shares of common stock of UnionBanCal. At the time of deferral, a bookkeeping account is established on behalf of the Director and credited with a number of fully vested stock units. The number of stock units equals the amount of the retainer or fees deferred divided by the fair market value of a share of common stock. The Director will receive a number of shares of common stock equal to the number of stock units when the deferred compensation is payable. Dividend equivalents are credited to the stock unit accounts. Stock units have no voting rights.
The above-described compensation constitutes the only compensation non-employee and non-expatriate Directors receive from UnionBanCal. It is subject to periodic review and adjustment by the Board of Directors. Members of the Audit Committee may not receive, directly or indirectly, any consulting, advisory or other compensatory fee from UnionBanCal or any of its subsidiaries, other than (1) Directors’ fees (which may be received in cash, stock options or other in-kind consideration ordinarily available to Directors); (2) a pension or other deferred compensation for prior service that is not contingent on future service; or (3) any other regular benefits that other Directors receive.
Northern Trust Corporation
2004 Director Compensation
| | Annual
Retainer
($40,000) | | 6 Board
Meetings
($1,500 per
meeting) | | Committee
Meetings
($1,500 per
meeting) | | Chairman
Retainer
($10,000) | | Audit
Committee
Retainer | | Average per
diem fee ($9,000
total) | | Stock Unit
Grant (800
units) (1) | | TOTAL | |
Non-Management Directors | | | | | | | | | | | | | | | | | |
Duane L. Burnham | | $ | 40,000 | | $ | 9,000 | | $ | 16,500 | | $ | 10,000 | | $ | 5,000 | | $ | 818 | | $ | 35,160 | | $ | 116,478 | |
Susan Crown | | $ | 40,000 | | $ | 9,000 | | $ | 9,000 | | | | $ | 5,000 | | $ | 818 | | $ | 35,160 | | $ | 98,978 | |
Robert S. Hamada | | $ | 40,000 | | $ | 9,000 | | $ | 9,000 | | | | | | $ | 818 | | $ | 35,160 | | $ | 93,978 | |
Robert A. Helman | | $ | 40,000 | | $ | 9,000 | | $ | 9,000 | | | | | | $ | 818 | | $ | 35,160 | | $ | 93,978 | |
Dipak C. Jain | | $ | 40,000 | | $ | 9,000 | | $ | 13,500 | | | | $ | 5,000 | | $ | 818 | | $ | 35,160 | | $ | 103,478 | |
Arthur L. Kelly | | $ | 40,000 | | $ | 9,000 | | $ | 4,500 | | $ | 10,000 | | | | $ | 818 | | $ | 35,160 | | $ | 99,478 | |
Robert C. McCormack | | $ | 40,000 | | $ | 9,000 | | $ | 9,000 | | | | | | $ | 818 | | $ | 35,160 | | $ | 93,978 | |
Edward J. Mooney | | $ | 40,000 | | $ | 9,000 | | $ | 9,000 | | | | $ | 5,000 | | $ | 818 | | $ | 35,160 | | $ | 98,978 | |
John W. Rowe | | $ | 40,000 | | $ | 9,000 | | $ | 16,500 | | | | $ | 5,000 | | $ | 818 | | $ | 35,160 | | $ | 106,478 | |
Harold B. Smith | | $ | 40,000 | | $ | 9,000 | | $ | 12,000 | | $ | 10,000 | | | | $ | 818 | | $ | 35,160 | | $ | 106,978 | |
William D. Smithburg | | $ | 40,000 | | $ | 9,000 | | $ | 7,500 | | $ | 10,000 | | | | $ | 818 | | $ | 35,160 | | $ | 102,478 | |
| | | | | | | | | | | | | | | | | |
Average Non-Management Director Pay | | | | | | | | | | | | | | | | $ | 101,387 | |
| | Audit Committee
(met 6x) | | Corporate Governance
Committee (met 5x) | | Business Strategy
Committee (met 3x) (2) | | Business Risk
Committee (met 3x) (3) | | Executive
Committee (4) | |
Non-Management Directors | | | | | | | | | | | |
Duane L. Burnham | | x | (c) | x | | | | | | | |
Susan Crown | | x | | | | | | | | | |
Robert S. Hamada | | | | | | x | | x | | | |
Robert A. Helman | | | | | | x | | x | | | |
Dipak C. Jain | | x | | | | x | | | | | |
Arthur L. Kelly | | | | | | x | (c) | | | x | |
Robert C. McCormack | | | | | | x | | x | | | |
Edward J. Mooney | | x | | | | | | | | x | |
John W. Rowe | | x | | x | | | | | | | |
Harold B. Smith | | | | x | | | | x | (c) | x | |
William D. Smithburg | | | | x(c | ) | | | | | x | |
| | | | | | | | | | | |
Average Non-Management Director Pay | | | | | | | | | | | |
Management Directors | | | | | |
William A. Osborn | | Chairman, Chief Executive Officer, President of the Corporation and the Bank | | | |
C = Chairperson
(1) Shares priced as of 2004 Shareholder Meeting: 4/20/2004 ($43.95)
(2) No. of meetings from Committee Charter, “The Committee shall meet…at least three times per year.” Actual number of meetings undisclosed
(3) No. of meetings from Committee Charter, “The Committee shall meet…at least three times per year.” Actual number of meetings undisclosed
(4) Company does not disclose Executive Committee Meetings
COMPENSATION PAID TO DIRECTORS
In 2004, non-employee directors received the following fees for their service on the board:
Annual Retainer $ 40,000
For Each Board and Committee Meeting Attended $ 1,500
The chairman of each committee other than the Executive Committee received an additional annual retainer of $10,000 in 2004. Each member of the Audit Committee (including the Audit Committee chairman) received an additional annual retainer of $5,000. All non-employee directors are also eligible to receive a per diem fee of $1,000 when required to attend orientation meetings or to perform specific services on behalf of the Corporation. The Corporation paid $9,000 for such services in 2004.
In January 2003, each non-employee director received a grant of 2,400 stock units under the Northern Trust Corporation 2002 Stock Plan (the “2002 Plan”), with 800 stock units vesting upon election or re-election as a director of the Corporation in each of the years 2003, 2004 and 2005. Any additional non-employee directors elected during this period will receive a similar award, prorated for time served on the board during the three-year time period. A non-employee director will receive one share of common stock for each stock unit upon vesting of the stock units. Dividend equivalents on the stock units are paid on a current basis unless, as described below, the non-employee director elects to defer the stock units.
Non-employee directors may elect to defer payment of their cash compensation and stock units until termination of their service as directors. Any deferred cash compensation is converted into stock units representing shares of common stock. The value of each stock unit is based upon the market price of the stock at the end of the calendar quarter for which the cash compensation would have been paid. Dividend equivalents on all deferred stock units are paid quarterly to a cash account and accrue interest at an interest rate determined from time to time by the Compensation and Benefits Committee. Deferred cash compensation and dividend equivalents will be paid out in cash, and deferred stock units will be distributed in stock, in each case in a lump sum or in up to ten annual installments at the election of the director.
In 2005, compensation for the non-employee directors will remain the same as in 2004, except that the non-employee directors will receive an annual retainer of $60,000, and a grant of stock units equal in value to $60,000 and comprised of (i) 800 stock units from an earlier grant that will vest in 2005 and (ii) stock units equal in value to $60,000 less the value of the 800 stock units, in each case with the value of the stock units determined by the average of the high and low sale prices of the common stock on the date of the 2005 annual meeting of stockholders. Directors who are also employees receive no additional compensation for serving on the board or its committees.
Popular, Inc.
2004 Director Compensation
| | Annual
Retainer,
see note
(b) | | 13 Board
Meetings
($1,000
per
meeting) | | Committee
Meetings
($750 per
meeting),
see note (c) | | Option
Grants,
see note
(a) | | Restricted
Stock
Grant | | TOTAL | | Compensation
Committee
(met 6x) | | Corporate
Governance
and
Nominating
Committee
(met 7x) | | Audit
Committee
(met 14x) | |
Non-Management Directors | | | | | | | | | | | | | | | | | | | |
Maria Luisa Ferre | | $ | 20,000 | | $ | 13,000 | | $ | 4,500 | | $ | 12,500 | | $ | 35,000 | | $ | 85,000 | | x | | | | | |
Frederic V. Salerno | | $ | 25,000 | | $ | 13,000 | | $ | 15,750 | | $ | 12,500 | | $ | 35,000 | | $ | 101,250 | | | | x | | x | |
William J. Teuber, Jr. | | $ | 20,000 | | $ | 13,000 | | $ | 10,500 | | $ | 12,500 | | $ | 35,000 | | $ | 91,000 | | | | | | x | |
Jose B. Carrion, Jr. | | $ | 20,000 | | $ | 13,000 | | $ | 0 | | $ | 12,500 | | $ | 35,000 | | $ | 80,500 | | | | | | | |
Manual Morales, Jr. | | $ | 20,000 | | $ | 13,000 | | $ | 0 | | $ | 12,500 | | $ | 35,000 | | $ | 80,500 | | | | | | | |
Jose R. Viscarrondo | | $ | 20,000 | | $ | 13,000 | | $ | 0 | | $ | 12,500 | | $ | 35,000 | | $ | 80,500 | | | | | | | |
Juan J. Bermudez | | $ | 20,000 | | $ | 13,000 | | $ | 20,250 | | $ | 12,500 | | $ | 35,000 | | $ | 100,750 | | x | | x | | x | |
Francisco M. Rexach, Jr. | | $ | 25,000 | | $ | 13,000 | | $ | 20,250 | | $ | 12,500 | | $ | 35,000 | | $ | 105,750 | | x | (c) | x | | x | |
Felix J. Serrales, Jr. | | $ | 25,000 | | $ | 13,000 | | $ | 20,250 | | $ | 12,500 | | $ | 35,000 | | $ | 105,750 | | x | | x | (c) | x | |
| | | | | | | | | | | | | | | | | | | |
Average Non-Management Director Pay | | | | | | | | | | | | $ | 92,333 | | | | | | | |
| | | | | | | | | | | | | | | | | | | |
Management Directors | | | | | | | | | | | | | | | | | | | |
Richard L. Carrion | | Chairman, President and CEO of the Corporation | | | | | |
| | | | | | | | | | | | | | | | | | | | | | | | | | |
C = Chairperson
COMPENSATION PAID TO DIRECTORS
(a). Outside directors of the Corporation were granted options to purchase Common Stock of the Corporation in February 2004 pursuant to the 2001 Stock Option Plan (“2001 Option Plan”) and in May 2004 under the Popular, Inc. 2004 Omnibus Incentive Plan (the “2004 Omnibus Plan”). The amount of stock options granted each month was equal to the quotient (rounded to the nearest whole share) of (x) 6,250 and (y) the value of the option based on the closing price of the Common Stock of the Corporation on the date granted. Option values on the grant dates were determined by using the Black-Scholes Option Valuation Model. The options granted shall become exercisable with respect to 20% of the shares on each anniversary of the date of grant and remain exercisable until the 10th anniversary of the grant.
(b). On July 14, 2004, the Board approved a new compensation package for the non-employee directors of the Corporation based on recommendations from Watson Wyatt, outside consultants. Under the terms of such package each director will receive an annual retainer of $20,000, while directors that are elected as chairman of any Board committee will receive an annual retainer of $25,000. The retainer is paid in either cash or restricted stock under the 2004 Omnibus Plan, at the director’s election. The directors will also receive an annual grant of $35,000 payable in restricted stock under the 2004 Omnibus Plan. The first retainer and restricted stock award payments were made on August 16, 2004 for all directors except William J. Teuber Jr., who received such payments on November 1, 2004. The amount paid to directors was prorated to compensate the director only for the months served from the date of payment to the next annual meeting of stockholders.
(c) From January to July 2004, non-employee directors received $1,000 for attending each Board meeting and $500 for attending each committee meeting. Thereafter, non-employee directors received $1,000 for each Board or committee meeting paid in either cash or restricted stock at the director’s election. All restricted stock awards are subject to risk of forfeiture and restrictions on transferability until retirement, when they become vested. Dividends are paid on the restricted stock during the vesting period with reinvestment into shares of Common Stock.
The Corporation reimburses directors for travel expenses incurred in connection with attending Board, committee and stockholder meetings and for other Corporation-related business expenses (including the travel expenses of spouses if they are specifically invited to attend the event for appropriate business purposes), which may include use of private aircraft, if available and approved in advance by the CEO.
AmSouth Bancorp
2004 Director Compensation
| | Retainer | | 8 Board
Meetings
($1,500 per
meeting) | | Committee
Meetings
($1,500 per
meeting) | | Option
Grants
(8,400 shares)
(1) | | TOTAL | | Audit
Committee
(met 9x) | | Human
Resources
Committee
(met 4x) | | Corporate
Governance
Committee
(met 3x) | | Executive
Committee
(met 0x) | |
Non-Management Directors | | | | | | | | | | | | | | | | | | | |
Earnest W. Deavenport, Jr. | | $ | 48,000 | | $ | 12,000 | | $ | 18,000 | | $ | 71,568 | | $ | 149,568 | | x | | | | x | (c) | x | |
James R. Malone | | $ | 40,000 | | $ | 12,000 | | $ | 6,000 | | $ | 71,568 | | $ | 129,568 | | | | x | | | | | |
Ronald L. Kuehn, Jr. | | $ | 40,000 | | $ | 12,000 | | $ | 18,000 | | $ | 71,568 | | $ | 141,568 | | x | | | | x | | | |
Martha R. Ingram | | $ | 40,000 | | $ | 12,000 | | $ | 6,000 | | $ | 71,568 | | $ | 129,568 | | | | x | | | | | |
Charles D. McCrary | | $ | 56,000 | | $ | 12,000 | | $ | 18,000 | | $ | 71,568 | | $ | 157,568 | | x | (c) | | | x | | x | |
Claude B. Nielsen | | $ | 48,000 | | $ | 12,000 | | $ | 19,500 | | $ | 71,568 | | $ | 151,068 | | x | | x | (c) | | | x | |
Cleophus Thomas, Jr. | | $ | 40,000 | | $ | 12,000 | | $ | 18,000 | | $ | 71,568 | | $ | 141,568 | | x | | | | x | | | |
| | | | | | | | | | | | | | | | | | | |
Average Non-Management Director Pay | | | | | | | | | | $ | 142,925 | | | | | | | | | |
Management Directors | | | |
C. Dowd Ritter | | President and Chief Executive Officer of AmSouth and AmSouth Bank and Chairman of the Board of AmSouth Bank. | |
C = Chairperson | |
(1) | Option Assumptions and Source | |
| | |
Grant Date | | 2/4/04 | | Proxy (Executive option grant date) | |
Exercise Price | | $ | 24.36 | | Proxy (exercise price = market price) | |
Market Price | | $ | 24.36 | | Bloomberg | |
Volatility | | 30.88 | % | 10-K | |
Risk-free rate | | 3.92 | % | 10-K | |
Dividend Yield | | 3.99 | % | 10-K | |
Vest Period (days) | | 365 | | Proxy | |
Life (days) | | 3,650 | | Assumption | |
Value | | $ | 6.09 | | BSM | |
COMPENSATION PAID TO DIRECTORS
Non-employee directors of AmSouth are paid a fee of $10,000 per calendar quarter ($14,000 for the Audit Committee Chairman and $12,000 for other committee chairmen) during which the director has served. In addition, each such director is paid a fee of $1,500 for each meeting of the Board and $1,500 for each committee meeting in which the director participates. Individual directors may, at their option, elect to defer the receipt of directors’ fees, and the deferred amounts are deemed invested in AmSouth common stock. All of the directors of AmSouth have elected to defer receipt of some or all of the retainer and meeting fees they are paid for service on the Board of Directors and to invest these fees in Deferred Stock of AmSouth.
Under AmSouth’s Director Stock Purchase Program, directors who own less than 5,000 shares of AmSouth stock and are not within three years of scheduled retirement from the Board are required to use at least one quarterly retainer each 15 months to purchase AmSouth stock. This requirement may also be fulfilled by the deferral of fees that are invested in Deferred Stock as described in “Fees” above.
Each non-employee director of AmSouth is eligible to be granted stock options under the Stock Option Plan for Outside Directors. The Plan provides that options will have an exercise price equal to the fair market value of AmSouth common stock on the date the options are granted. During 2004, each non-employee director was granted options to purchase 8,400 shares of AmSouth common stock. The options vest in three equal annual installments beginning in 2005.
Compass Bancshares
2004 Director Compensation
| | Retainer | | 6 Board
Meetings
($1,750 per
meeting) | | Committee
Meetings
($1,300 per
meeting) | | Chairman
Fees ($4,000
per year) | | Option
Grants
(2,000
shares) (1) | | TOTAL | | Audit
Committee
(met 10x) | | Compensation
Committee
(met 3x) | | Nominating &
Corporate
Governance
Committee
(met 1x) | | Credit
Committee
(met 6x) | | Executive
Committee
(met 0x) | |
Non-Management Directors | | | | | | | | | | | | | | | | | | | | | | | |
Carl J. Gessler | | $ | 25,000 | | $ | 10,500 | | $ | 14,300 | | | | $ | 16,341 | | $ | 66,141 | | x | | | | x | | | | | |
J. Terry Strange | | $ | 25,000 | | $ | 10,500 | | $ | 14,300 | | $ | 4,000 | | $ | 16,341 | | $ | 70,141 | | x | (c) | | | x | | | | | |
James H. Click | | $ | 25,000 | | $ | 10,500 | | $ | 9,100 | | | | $ | 16,341 | | $ | 60,941 | | | | | | x | | x | | | |
Tranum Fitzpatrick | | $ | 25,000 | | $ | 10,500 | | $ | 13,000 | | $ | 4,000 | | $ | 16,341 | | $ | 68,841 | | | | x | | x | | x | (c) | | |
John S. Stein | | $ | 25,000 | | $ | 10,500 | | $ | 14,300 | | | | $ | 16,341 | | $ | 66,141 | | x | | | | x | | | | | |
Charles W. Daniel | | $ | 25,000 | | $ | 10,500 | | $ | 18,200 | | | | $ | 16,341 | | $ | 70,041 | | x | | x | | x | | | | x | |
William E. Davenport | | $ | 25,000 | | $ | 10,500 | | $ | 13,000 | | $ | 4,000 | | $ | 16,341 | | $ | 68,841 | | | | x | (c) | x | | x | | x | |
Charles E. McMahen | | $ | 25,000 | | $ | 10,500 | | $ | 7,800 | | | | $ | 16,341 | | $ | 59,641 | | | | | | | | x | | | |
| | | | | | | | | | | | | | | | | | | | | | | |
Average Non-Management Director Pay | | | | | | | | | | | | $ | 66,341 | | | | | | | | | | | |
Management Directors | | | | | | | | | | | | | |
D. Paul Jones | | Chairman and CEO | | | | | | | | | | | |
C = Chairperson | |
(1) | Option Assumptions and Source | |
| | |
Grant Date | | 4/19/04 | | Proxy (Shareholder Meeting Date) | |
Exercise Price | | #NAME? | | Proxy (exercise price = market price) | |
Market Price | | #NAME? | | Baseline | |
Volatility | | 27.60 | % | 10-K | |
Risk-free rate | | 3.64 | % | 10-K | |
Dividend Yield | | 4.13 | % | 10-K | |
Vest Period (days) | | 365 | | Proxy | |
Life (days) | | 3,650 | | Assumption | |
Value | | $ | 8.17 | | BSM | |
| | | | | | |
During fiscal year 2004, Compass paid non-employee directors a monthly retainer of $2,083.33 and a fee of $1,750.00 for each meeting of the Board of Directors attended. In addition, members of all committees of the Board of Directors received $1,300.00 for each meeting of such committees attended. Chairmen of all committees of the Board of Directors received a monthly retainer of $333.33. Subsequent to the election of each director, these monthly retainers and fees are paid into an account for the purchase of Compass common stock under Compass’ Director & Executive Stock Purchase Plan (the “DESPP”), which includes provisions for an additional matching contribution from Compass of 45% and a “gross-up” to reimburse the directors for all federal income tax obligations attributable to these retainers, fees and matching contributions.
Each member of the Board of Directors receives an annual stock option grant of 2,000 shares, exercisable over 10 years at the closing price on the Annual Meeting date.
Comerica Inc.
2004 Director Compensation
Class | | | | Retainer
(2) | | Committee
Mtg Fees
($1,500/Mtg) | | Committee
Chair
($5,625/Y)
(3) | | Facilitating
Director
Fee
($7,500/Y)
(4) | | Stock
Options
(2,500 shares)
(5) | | Restricted
Stock
(319.44 shares)
(6) | | Total | |
| | Non-Management Directors | | | | | | | | | | | | | | | |
III | | J. Philip DiNapoli | | $ | 35,625 | | $ | 31,500 | | $ | 0 | | $ | 0 | | $ | 37,203 | | $ | 18,125 | | $ | 122,453 | |
III | | Roger Fridholm | | $ | 35,625 | | $ | 7,500 | | $ | 0 | | $ | 0 | | $ | 37,203 | | $ | 18,125 | | $ | 98,453 | |
III | | Alfred A. Piergallini | | $ | 35,625 | | $ | 9,000 | | $ | 0 | | $ | 0 | | $ | 37,203 | | $ | 18,125 | | $ | 99,953 | |
III | | Patricia M. Wallington | | $ | 35,625 | | $ | 9,000 | | $ | 0 | | $ | 0 | | $ | 37,203 | | $ | 18,125 | | $ | 99,953 | |
III | | Gail L. Warden | | $ | 35,625 | | $ | 4,500 | | $ | 5,625 | | $ | 0 | | $ | 37,203 | | $ | 18,125 | | $ | 101,078 | |
I | | Lillian Bauder | | $ | 35,625 | | $ | 31,500 | | $ | 5,625 | | $ | 0 | | $ | 37,203 | | $ | 18,125 | | $ | 128,078 | |
I | | Anthony F. Earley, Jr. | | $ | 35,625 | | $ | 18,000 | | $ | 0 | | $ | 0 | | $ | 37,203 | | $ | 18,125 | | $ | 108,953 | |
I | | Max M. Fisher | | $ | 35,625 | | $ | 9,000 | | $ | 0 | | $ | 0 | | $ | 37,203 | | $ | 18,125 | | $ | 99,953 | |
I | | Robert S. Taubman (1) | | $ | 35,625 | | $ | 10,500 | | $ | 0 | | $ | 0 | | $ | 37,203 | | $ | 18,125 | | $ | 101,453 | |
I | | David Baker Lewis | | $ | 35,625 | | $ | 3,000 | | $ | 5,625 | | $ | 0 | | $ | 37,203 | | $ | 18,125 | | $ | 99,578 | |
II | | James F. Cordes | | $ | 35,625 | | $ | 28,500 | | $ | 5,625 | | $ | 0 | | $ | 37,203 | | $ | 18,125 | | $ | 125,078 | |
II | | Peter D. Cummings | | $ | 35,625 | | $ | 12,000 | | $ | 0 | | $ | 0 | | $ | 37,203 | | $ | 18,125 | | $ | 102,953 | |
II | | Todd W. Herrick | | $ | 35,625 | | $ | 6,000 | | $ | 0 | | $ | 0 | | $ | 37,203 | | $ | 18,125 | | $ | 96,953 | |
II | | William P. Vititoe | | $ | 35,625 | | $ | 28,500 | | $ | 11,250 | | $ | 0 | | $ | 37,203 | | $ | 18,125 | | $ | 130,703 | |
II | | Kennth L. Way (Facilitating Director) | | $ | 35,625 | | $ | 9,000 | | $ | 5,625 | | $ | 1,875 | | $ | 37,203 | | $ | 18,125 | | $ | 107,453 | |
| | | | | | | | | | | | | | | | | |
| | Average Non-Management Director Pay | | | | | | | | | | | | | | $ | 108,203 | |
| | | | | | | | | | | | | | | | | |
| | Management Directors | | | | | | | | | | | | | | | |
III | | Joseph J. Buttigieg, III (V. Chrmn) | | | | | | | | | | | | | | | |
II | | Ralph W. Babb, Jr. (Chairman/CEO) | | | | | | | | | | | | | | | |
Class | | | | Audit &
Legal
(met 15x) | | Compensation
(met 6x) | | Corporate
Governance/
Nominating
(met 6x) | | Public
Responsibility
(met 3x) | | Qualified
Legal
Compliance
(met 0x) | | Rist
Asset
Quality
Review
(met 4x) | | Trust &
Investment
(met 2x) | |
| | Non-Management Directors | | | | | | | | | | | | | | | |
III | | J. Philip DiNapoli | | X | | | | X | | | | X | | | | | |
III | | Roger Fridholm | | | | | | | | X | | | | | | X | |
III | | Alfred A. Piergallini | | | | X | | | | | | | | | | | |
III | | Patricia M. Wallington | | | | | | | | | | | | X | | X | |
III | | Gail L. Warden | | | | | | | | X | (C) | | | | | | |
I | | Lillian Bauder | | X | | | | X | (C) | | | X | | | | | |
I | | Anthony F. Earley, Jr. | | | | X | | X | | | | | | | | | |
I | | Max M. Fisher | | | | X | | | | | | | | | | | |
I | | Robert S. Taubman (1) | | | | | | | | X | | | | X | | | |
I | | David Baker Lewis | | | | | | | | | | | | | | X | (C) |
II | | James F. Cordes | | X | | | | | | X | | | | X | (C) | | |
II | | Peter D. Cummings | | | | X | | | | | | | | | | X | |
II | | Todd W. Herrick | | | | | | | | | | | | X | | | |
II | | William P. Vititoe | | X | (C) | | | | | | | X | (C) | X | | | |
II | | Kennth L. Way (Facilitating Director) | | | | X( | C) | | | | | | | | | | |
| | | | | | | | | | | | | | | | | |
| | Average Non-Management Director Pay | | | | | | | | | | | | | | | |
| | | | | | | | | | | | | | | | | |
| | Management Directors | | | | | | | | | | | | | | | |
III | | Joseph J. Buttigieg, III (V. Chrmn) | | | | | | | | | | | | X | | | |
II | | Ralph W. Babb, Jr. (Chairman/CEO) | | | | | | | | | | | | | | | |
*Board members are not paid fees for regular board meetings.
** No board members are on boards of affilated Comerica banks.
C = Chairperson
(1) Mr. Taubman did not attend at least 75% of the meetings in 2004.
(2) Annual retainer was increased from $35,000 to $37,500 on October 1, 2004. Amounts are prorated accordingly.
(3) Board committee members received $1,500 for each committee meeting attended
(4) Committee Chair retainer was increased from $5,000 to $7,500 on October 1, 2004. Amounts are prorated accordingly.
(5) Beginning October 1, 2004, the faciliating director receives an annual fee of $7,500. Amounts are prorated accordingly.
(6) Option Assumptions and Source
Grant Date | | 5/18/04 | | Proxy |
Exercise Price | | $ | 53.87 | | Proxy |
Market Price | | $ | 53.87 | | Baseline |
Volatility | | 31.0 | % | 10-K |
Risk-free rate | | 3.5 | % | 10-K |
Dividend Yield | | 3.3 | % | 10-K |
Vest Period (days) | | 365 | | Proxy |
Life (days) | | 3,650 | | Proxy |
Value | | $ | 14.88 | | BSM |
(7) Restricted stock was granted on 8/9/04 ($56.74) and vest one year after grant date, contingent upon the director’s continued service for that year.
Colonial BancGroup
2004 Director Compensation
| | Retainer | | 4 Board Meetings
($1,000 per meeting) | | Committee Meetings
($500 per meeting) | | Chairman Fees
($1,000 per meeting) | | Asset/Liability
Chairman Fees ($750
per meeting) | | TOTAL | | Audit
Committee
(met 8x) | | Compensation
Committee
(met 6x) | | Nominating
& Corporate
Governance
Committee
(met 5x) | | Asset/Liability
Committee
(met 5x) | | Executive
Committee
(met 0x) | |
Non-Management Directors | | | | | | | | | | | | | | | | | | | | | | | |
Augustus K. Clements, III | | $ | 10,000 | | $ | 4,000 | | $ | 0 | | | | | | $ | 14,000 | | | | | | | | | | x | |
Patrick F. Dye | | $ | 10,000 | | $ | 4,000 | | $ | 2,500 | | | | | | $ | 16,500 | | | | | | | | x | | | |
Milton E. McGregor | | $ | 10,000 | | $ | 4,000 | | $ | 3,000 | | | | | | $ | 17,000 | | | | x | | | | | | | |
William E. Powell, III | | $ | 10,000 | | $ | 4,000 | | $ | 4,000 | | | | | | $ | 18,000 | | x | | | | | | | | | |
Simuel Sippial | | $ | 10,000 | | $ | 4,000 | | $ | 6,500 | | $ | 6,000 | | | | $ | 26,500 | | x | | x | (c) | x | | | | | |
Robert S. Craft | | $ | 10,000 | | $ | 4,000 | | $ | 0 | | $ | 5,000 | | | | $ | 19,000 | | | | | | x | (c) | | | x | |
Hubert L. Harris, Jr. | | $ | 10,000 | | $ | 4,000 | | $ | 4,000 | | | | | | $ | 18,000 | | x | | | | | | | | | |
Clinton O. Holdbrooks | | $ | 10,000 | | $ | 4,000 | | $ | 2,500 | | | | | | $ | 16,500 | | | | | | | | x | | | |
Harold D. King | | $ | 10,000 | | $ | 4,000 | | $ | 2,500 | | | | $ | 3,750 | | $ | 20,250 | | | | | | x | | x | (c) | x | |
John C.H. Miller, Jr. | | $ | 10,000 | | $ | 4,000 | | $ | 0 | | | | | | $ | 14,000 | | | | | | | | | | x | |
James W. Rane | | $ | 10,000 | | $ | 4,000 | | $ | 2,500 | | | | | | $ | 16,500 | | | | | | | | x | | | |
Lewis E. Beville | | $ | 10,000 | | $ | 4,000 | | $ | 2,500 | | $ | 8,000 | | | | $ | 24,500 | | x | (c) | | | x | | | | | |
Jerry J. Chesser | | $ | 10,000 | | $ | 4,000 | | $ | 0 | | | | | | $ | 14,000 | | | | | | | | | | | |
John Ed Mathison | | $ | 10,000 | | $ | 4,000 | | $ | 0 | | | | | | $ | 14,000 | | | | | | | | | | | |
Joe D. Mussafer | | $ | 10,000 | | $ | 4,000 | | $ | 5,500 | | | | | | $ | 19,500 | | | | x | | | | x | | | |
Frances E. Roper | | $ | 10,000 | | $ | 4,000 | | $ | 0 | | | | | | $ | 14,000 | | | | | | | | | | | |
Edward V. Welch | | $ | 10,000 | | $ | 4,000 | | $ | 2,500 | | | | | | $ | 16,500 | | | | | | | | x | | | |
| | | | | | | | | | | | | | | | | | | | | | | |
Average Non-Management Director Pay | | | | | | | | | | | | $ | 17,574 | | | | | | | | | | | |
Total Compensation paid to Holding Co. and Bank Directors | | | | | | | | | | | | $ | 613,270 | | | | | | | | | | | |
Average Non-Management Director Pay (including bank director pay) | | | | | | | | | | | | $ | 36,075 | | | | | | | | | | | |
| | | | | | | | | | | | | | | | | | | | | | | |
Management Directors | | | | | | | | | | | | | | | | | | | | | | | |
Robert E. Lowder | | Chairman and CEO | | | | | | | | | | | | | |
| | | | | | | | | | | | | | | | | | | | | | | | | | | | | |
C = Chairperson
During 2004, Directors of BancGroup received fees of $2,500 per quarter, plus $1,000 for each Board meeting attended. Members of BancGroup committees received fees of $500 for each BancGroup committee meeting attended. The Chairmen of the Audit Committee, the Personnel and Compensation Committee, and the Nominating and Corporate Governance Committee each received $1,000 for each meeting attended and Chairmen of other Committees each received $750 for each committee meeting attended. From time to time, BancGroup may form one or more special litigation committees. Members of such committees were due to receive $500 per meeting attended unless such meeting extends beyond four hours in length, in which such case the member would receive an additional $500 for each four hour period or any portion thereof. Certain directors of BancGroup also serve as directors of Colonial Bank or its regional boards and receive fees for services on those boards. Fees paid to BancGroup directors under the Directors’ Plan for service as directors of BancGroup and its subsidiaries in cash and stock in 2004 totaled $613,270.
In January 2005, BancGroup director fees were increased to $5,000 per quarter, plus $2,000 per meeting attended. The fees paid to Chairman of the Audit Committee increased to $2,000 per quarter and $1,000 per meeting attended. The fees paid to Chairman of any BancGroup committee other than Audit Committee increased to $1,500 per meeting attended and fees paid to members of any BancGroup Committee increased to $1,000 per meeting attended. Fees paid to Special Litigation Committee members increased to $1,000 per meeting attended.
First Horizon National
2004 Director Compensation
| | Retainer | | 4 Board
Meetings
($2,000 per
meeting) | | Committee
Meetings
($1,000 per
meeting) | | Chairman
Fees ($2,000
per meeting) | | TOTAL | | Audit
Committee
(met 8x) | | Compensation
Committee (5x) | | Executive
Committee
(met 9x) | | Nominating
and Corp
Gov
Committee
(met 9x) | |
Non-Management Directors | | | | | | | | | | | | | | | | | | | |
Robert C. Blatberg | | $ | 36,000 | | $ | 8,000 | | $ | 14,000 | | $ | 18,000 | | $ | 76,000 | | | | x | | | | x | (c) |
George E. Cates | | $ | 36,000 | | $ | 8,000 | | $ | 9,000 | | $ | 0 | | $ | 53,000 | | | | | | x | | | |
Simon F. Cooper | | $ | 36,000 | | $ | 8,000 | | $ | 0 | | $ | 0 | | $ | 44,000 | | | | | | | | | |
James A Haslam | | $ | 36,000 | | $ | 8,000 | | $ | 5,000 | | $ | 0 | | $ | 49,000 | | | | x | | | | | |
R. Brad Martin | | $ | 36,000 | | $ | 8,000 | | $ | 5,000 | | $ | 10,000 | | $ | 59,000 | | | | x | (c) | | | | |
Vicki R. Palmer | | $ | 36,000 | | $ | 8,000 | | $ | 8,000 | | $ | 16,000 | | $ | 68,000 | | x | (c) | | | | | | |
Michael D. Rose | | $ | 36,000 | | $ | 8,000 | | $ | 9,000 | | $ | 0 | | $ | 53,000 | | | | | | x | | | |
Mary F. Sammons | | $ | 36,000 | | $ | 8,000 | | $ | 8,000 | | $ | 0 | | $ | 52,000 | | x | | | | | | | |
William B. Sansom | | $ | 36,000 | | $ | 8,000 | | $ | 9,000 | | $ | 0 | | $ | 53,000 | | | | | | x | | | |
Jonathon P. Ward | | $ | 36,000 | | $ | 8,000 | | $ | 17,000 | | $ | 0 | | $ | 61,000 | | x | | | | | | x | |
Luke Yancy | | $ | 36,000 | | $ | 8,000 | | $ | 0 | | $ | 0 | | $ | 44,000 | | | | | | | | | |
| | | | | | | | | | | | | | | | | | | |
Average Non-Management Director Pay | | | | | | | | | | $ | 55,636 | | | | | | | | | |
| | | |
Management Directors | | | |
J. Kenneth Glass | | Chairman and CEO | |
C = Chairperson
*Assumes full year of attendance
Each non-employee director is paid a retainer quarterly at an annual rate of $36,000 plus a fee of $2,000 for each day of each Board meeting attended and $1,000 for each day of each committee meeting attended. The chairpersons of the Audit, Compensation, and Nominating and Corporate Governance Committees are paid an additional retainer of $2,000 per committee meeting (in addition to the regular attendance fees). Our practice is to hold our Board and committee meetings jointly with the Bank’s Board and committees. Directors are not separately compensated for Bank Board or committee meetings except for those infrequent meetings that do not occur jointly.
It is our practice to award all non-employee directors shares of restricted stock upon their initial election to the Board. Most recently, these awards have been made under our 2003 Equity Compensation Plan in the amount of 8,000 shares of restricted stock vesting in 10 equal annual installments. If the individual’s directorship terminates for any reason other than death, disability (defined as total and permanent disability), retirement (defined as any termination not caused by death or disability after the attainment of age 65 or 10 years of service as a director), or a change in control (as defined in the 2003 Equity Compensation Plan), all shares that at the time remain restricted shares will be forfeited.
Marshall & Ilsley
2004 Director Compensation
| | Annual
Retainer
($24,000) | | 7 Board
Meetings
($1,500 per
meeting) | | Committee
Meetings
($1,000 per
meeting) | | Chair and
Presiding
Director
Retainer
($5,000) | | Stock Options
(5,000
options
x years
of term
served) (1) | | TOTAL | | Compensation
and Human
Resources
Committee
(met 7x) | | Audit
Committee
(met 11x) | | Nominating
Committee
(met 3x) | | Retirement
Investment
Committee
(met 3x) | | Executive
Committee
(met 4x) | |
Non-Management Directors | | | | | | | | | | | | | | | | | | | | | | | |
Jon F. Chiat | | $ | 24,000 | | $ | 10,500 | | $ | 6,000 | | | | $ | 167,277 | | $ | 207,777 | | | | | | x | | x | | | |
Bruce E. Jacobs | | $ | 24,000 | | $ | 10,500 | | $ | 15,000 | | | | $ | 167,277 | | $ | 216,777 | | | | x | | | | | | x | |
Edward L. Meyer, Jr. | | $ | 24,000 | | $ | 10,500 | | $ | 0 | | | | $ | 167,277 | | $ | 201,777 | | | | | | | | | | | |
San W. Orr, Jr. | | $ | 24,000 | | $ | 10,500 | | $ | 11,000 | | $ | 5,000 | | $ | 167,277 | | $ | 217,777 | | | | x | (c) | | | | | | |
Debra S. Waller | | $ | 24,000 | | $ | 10,500 | | $ | 0 | | | | $ | 167,277 | | $ | 201,777 | | | | | | | | | | | |
George E. Wardeberg | | $ | 24,000 | | $ | 10,500 | | $ | 11,000 | | $ | 5,000 | | $ | 167,277 | | $ | 217,777 | | x | (c) | | | | | | | x | |
David L. Andreas | | $ | 24,000 | | $ | 10,500 | | $ | 0 | | | | | | $ | 34,500 | | | | | | | | | | | |
John A. Mellowes | | $ | 24,000 | | $ | 10,500 | | $ | 0 | | | | | | $ | 34,500 | | | | | | | | | | | |
Robert J. O’Toole | | $ | 24,000 | | $ | 10,500 | | $ | 7,000 | | | | | | $ | 41,500 | | x | | | | | | | | | |
Robert A. Schaefer | | $ | 24,000 | | $ | 10,500 | | $ | 7,000 | | | | | | $ | 41,500 | | x | | | | | | | | | |
John S. Shiely | | $ | 24,000 | | $ | 10,500 | | $ | 0 | | | | | | $ | 34,500 | | | | | | | | | | | |
Richard A. Abdoo | | $ | 24,000 | | $ | 10,500 | | $ | 7,000 | | | | | | $ | 41,500 | | | | | | | | x | | x | |
Ted D. Kellner | | $ | 24,000 | | $ | 10,500 | | $ | 3,000 | | $ | 5,000 | | | | $ | 42,500 | | | | | | | | x | (c) | | |
Katherine C. Lyall | | $ | 24,000 | | $ | 10,500 | | $ | 11,000 | | | | | | $ | 45,500 | | | | x | | | | | | | |
Peter M. Platten, III | | $ | 24,000 | | $ | 10,500 | | $ | 3,000 | | $ | 5,000 | | | | $ | 42,500 | | | | | | x | (c) | | | | |
James A. Urdan (presiding director)* | | $ | 29,000 | | $ | 10,500 | | $ | 7,000 | | $ | 5,000 | | | | $ | 51,500 | | | | | | x | | | | x | |
| | | | | | | | | | | | | | | | | | | | | | | |
Average Non-Management Director Pay | | | | | | | | | | | | $ | 104,604 | | | | | | | | | | | |
| | | | | | | | | | | | | | | | | | | | | | | |
Management Directors | | | | | | | | | | | | | |
Dennis J. Kuester | | President and Chief Executive Officer of the Company | | | | | | | | | | | | | |
James B. Wigdale | | Chairman | | | | | | | | | | | | | |
Andrew N. Baur | | Former CEO of Mississippi Valley Bancshares (employed by M&I) | | | | | | | | | | | | | |
C = Chairperson
* Presiding director receives additional yearly retainer of $5000
(1) Option Assumptions and Source
Grant Date | | 4/27/04 | | Proxy (Shareholder Meeting Date) |
Exercise Price | | #NAME? | | Proxy (exercise price = market price) |
Market Price | | #NAME? | | Baseline |
Volatility | | 24.17 | % | 10-K |
Risk-free rate | | 3.81 | % | 10-K |
Dividend Yield | | 1.93 | % | 10-K |
Vest Period (days) | | | | Proxy |
Life (days) | | 3,650 | | Assumption |
Value | | $ | 11.15 | | BSM Value |
| | | | | |
COMPENSATION PAID TO DIRECTORS
Directors of M&I who are not employees are paid a retainer fee of $24,000 per year. In addition, non-employee directors receive a fee of $1,500 for each Board meeting which they attend and $1,000 for each committee meeting which they attend. The chairs of the Audit, Compensation, Nominating, and Retirement Investment Committees are paid a retainer fee of $5,000 per year. Mr. Urdan is also paid $5,000 per year to act as presiding director at the non-management executive sessions of the Board.
Directors of M&I who are not employees of M&I or its subsidiaries also participate in the Company’s stock option plans. On the date of each Annual Meeting of Shareholders, each participant in the plan elected or re-elected as a director at such Annual Meeting receives an option for that number of shares of Common Stock equal to the multiple of 5,000 and the number of years in the term to which such participant has been elected. In addition, a participant who is appointed to fill a vacancy on the Board of Directors, or a director who becomes a participant because such director ceases to be employed by the Company or its subsidiaries, will receive, on the date of the next Annual Meeting, an option for that number of shares of Common Stock equal to a multiple of 5,000 and the number of years remaining in such participant’s term as a director of the Company. Under the terms of this plan, the option price per share will not be less than 100% of the fair market value of the shares on the date the option is granted, the options will not be exercisable more than 10 years after the date of grant, and the options will terminate no later than three years after the participant ceases to be a director of the Company for any reason. Such options may be exercised at any time after they are granted.
The exercise price of an option may, at the participant’s election, be paid in cash or previously owned shares of Common Stock or a combination thereof.
M&T Bancorp
2004 Director Compensation
| | Annual
Retainer
($20,000) | | Audit
Committee
Members
Annual
Retainer | | Option
Grant (1) | | 4 Board
Meetings
($2,000 per
meeting) | | Committee
Meetings | | Total | | Audit
($3,000 per
meeting)
(met 5x) | | Executive
($1,000 per
meeting)
(met 2x) | | Comp,
Nomination
and
Governance
($1,000 per
meeting)
(met 6x) | |
Non-Management Directors | | | | | | | | | | | | | | | | | | | |
William F. Allyn | | $ | 20,000 | | $ | 5,000 | | $ | 0 | | $ | 8,000 | | $ | 15,000 | | $ | 48,000 | | x | | | | | |
Brent D. Baird | | $ | 20,000 | | $ | 0 | | $ | 0 | | $ | 8,000 | | $ | 8,000 | | $ | 36,000 | | | | x | | x | |
Robert J. Bennett | | $ | 20,000 | | $ | 0 | | $ | 0 | | $ | 8,000 | | $ | 2,000 | | $ | 30,000 | | | | x | | | |
C. Angela Bontempo | | $ | 20,000 | | $ | 15,000 | | $ | 0 | | $ | 8,000 | | $ | 15,000 | | $ | 58,000 | | x | (c) | | | | |
Robert T. Brady | | $ | 20,000 | | $ | 0 | | $ | 0 | | $ | 8,000 | | $ | 6,000 | | $ | 34,000 | | | | | | x | |
Michael D. Buckley | | $ | 20,000 | | $ | 0 | | $ | 0 | | $ | 8,000 | | $ | 8,000 | | $ | 36,000 | | | | x | | x | |
Patrick J. Callan | | $ | 20,000 | | $ | 0 | | $ | 13,102 | | $ | 8,000 | | $ | 0 | | $ | 41,102 | | | | | | | |
R. Carlos Carballada | | $ | 20,000 | | $ | 0 | | $ | 0 | | $ | 8,000 | | $ | 0 | | $ | 28,000 | | | | | | | |
T. Jefferson Cunningham, III | | $ | 20,000 | | $ | 0 | | $ | 0 | | $ | 8,000 | | $ | 0 | | $ | 28,000 | | | | | | | |
Donald Devorris | | $ | 20,000 | | $ | 0 | | $ | 0 | | $ | 8,000 | | $ | 0 | | $ | 28,000 | | | | | | | |
Richard E. Garman | | $ | 20,000 | | $ | 0 | | $ | 0 | | $ | 8,000 | | $ | 2,000 | | $ | 30,000 | | | | x | | | |
James V. Glynn | | $ | 20,000 | | $ | 5,000 | | $ | 0 | | $ | 8,000 | | $ | 15,000 | | $ | 48,000 | | x | | | | | |
Derek C. Hathaway | | $ | 20,000 | | $ | 5,000 | | $ | 0 | | $ | 8,000 | | $ | 15,000 | | $ | 48,000 | | x | | | | | |
Daniel R. Hawbaker | | $ | 20,000 | | $ | 0 | | $ | 0 | | $ | 8,000 | | $ | 0 | | $ | 28,000 | | | | | | | |
Patrick W.E. Hodgson | | $ | 20,000 | | $ | 5,000 | | $ | 0 | | $ | 8,000 | | $ | 15,000 | | $ | 48,000 | | x | | | | | |
Gary Kennedy | | $ | 20,000 | | $ | 0 | | $ | 0 | | $ | 8,000 | | $ | 0 | | $ | 28,000 | | | | | | | |
Richard G. King | | $ | 20,000 | | $ | 0 | | $ | 0 | | $ | 8,000 | | $ | 0 | | $ | 28,000 | | | | | | | |
Reginald B. Newman, II | | $ | 20,000 | | $ | 0 | | $ | 0 | | $ | 8,000 | | $ | 0 | | $ | 28,000 | | | | | | | |
Jorge G. Pereira | | $ | 20,000 | | $ | 0 | | $ | 0 | | $ | 8,000 | | $ | 6,000 | | $ | 34,000 | | | | | | x | (c) |
Stephen G. Sheetz | | $ | 20,000 | | $ | 0 | | $ | 0 | | $ | 8,000 | | $ | 0 | | $ | 28,000 | | | | | | | |
Herbert L. Washington | | $ | 20,000 | | $ | 0 | | $ | 0 | | $ | 8,000 | | $ | 0 | | $ | 28,000 | | | | | | | |
| | | | | | | | | | | | | | | | | | | |
Average Non-Management Director Pay | | | | | | | | | | | | $ | 35,386 | | | | | | | |
| | | |
Management Directors | | | |
Emerson L. Brumback | | Executive Vice President of M&T Bank Corporation, President, Chief Operating Officer of M&T Bank and Executive Vice President of M&T Bank, N.A. | |
Michael P. Pinto | | Executive Vice President, Chief Financial Officer of M&T Bank Corporation, Vice Chairman, Chief Financial Officer of M&T Bank and Executive Vice President, Chief Financial Officer af M&T Bank, N.A. | |
Robert E. Sadler | | Executive Vice President of M&T Bank Corporation, Chairman of the Board of M&T Bank and President, Chief Executive Officer of M&T Bank, N.A. | |
Eugene Sheehy | | Chairman and Chief Executive Officer of M&T Bank’s Mid-Atlantic Division | |
Robert G. Wilmers | | Chairman of the Board, President and Chief Executive Officer of M&T Bank Corporation, Chief Executive Officer of M&T Bank and Chairman of the Board of M&T Bank, N.A. | |
C = Chairperson
(1). 435 options to Mr. Callan at exercise price of $91.75 per share, risk-free rate 3.53%, volatility 24%, dividend yield 1.31%, life 10 years, black scholes value $30.30
(1) Option Assumptions and Source
Grant Date | 2004 | | Proxy | |
Exercise Price | $ | 91.75 | | Proxy | |
Market Price | $ | 91.75 | | Proxy | |
Volatility | 24 | % | 10-K | |
Risk-free rate | 3.53 | % | 10-K | |
Dividend Yield | 1.31 | % | 10-K | |
Vest Period (days) | 0 | | Assumption | |
Life (days) | 3650 | | Assumption | |
Value | $ | 30.12 | | Bloomberg | |
COMPENSATION PAID TO DIRECTORS
M&T Bank Corporation Directors’ Fees. Effective April 1, 2004, the annual retainer for directors of M&T Bank Corporation who are not also salaried officers of M&T Bank Corporation or its subsidiaries was increased from $15,000 to $20,000, and the attendance fee for each meeting of the Board of Directors attended was increased from $1,000 to $2,000. Also effective April 1, 2004, the Board of Directors determined that members of the Audit Committee (other than the chair) should receive an additional annual retainer of $5,000, and that the chair of the Audit Committee should receive an additional annual retainer of $15,000. The attendance fee for committee meetings of the Board of Directors of M&T Bank Corporation was also increased as of April 1, 2004 from $750 to $1,000, except for the Audit Committee, for which its attendance fee was increased from $1,000 to $3,000. All directors of M&T Bank Corporation are entitled to reimbursement for travel expenses incidental to their attendance at meetings.
The Board of Directors determined, effective April 1, 2004, to eliminate its prior limitation on total compensation of $40,000 per year for services as a director or advisory director of M&T Bank Corporation and its subsidiaries. Pursuant to the terms of the Directors’ Stock Plan, each director must elect to have either 50 or 100 percent of his or her annual compensation for services as a director or advisory director of M&T Bank Corporation and its subsidiaries paid in the form of Common Stock. The number of shares of Common Stock paid is determined by dividing the amount of such compensation payable in shares of Common Stock by the closing price of a share of Common Stock on the New York Stock Exchange on the business day immediately preceding the day the compensation is payable.
North Fork Bancorp
2004 Director Compensation
| | Annual Retainer
($40,000) | | TOTAL | | Audit Committee (met
9x) | | Compensation
Committee (met 9x) | | Nominating and
Governance Committee
(met 7x) | |
Non-Management Directors | | | | | | | | | | | |
Katherine Heaviside | | $ | 40,000 | | $ | 40,000 | | X | | | | | |
Raymond A. Nielsen | | $ | 40,000 | | $ | 40,000 | | | | X | (C) | | |
William M. Jackson | | $ | 40,000 | | $ | 40,000 | | | | X | | | |
George H. Rowsom | | $ | 40,000 | | $ | 40,000 | | | | X | | X | (C) |
James F. Reeve | | $ | 40,000 | | $ | 40,000 | | | | | | | |
Dr. Kurt R. Schmeller | | $ | 40,000 | | $ | 40,000 | | X | (C) | | | X | |
| | | | | | | | | | | |
Average Non-Management Director Pay | | | | $ | 40,000 | | | | | | | |
| | | | | | | | | | | | |
Management Directors | | | | | | | | | | | | |
John Bohlsen | | Vice Chairman of North Fork and North Fork Bank | | | | | |
Daniel M. Healy | | Executive Vice President and Chief Financial Officer of North Fork | | | | | |
John Adam Kanas | | Chairman, President and Chief Executive Officer of North Fork and North Fork Bank | | | | | |
C = Chairperson
COMPENSATION PAID TO DIRECTORS
Each non-management member of North Fork’s Board of Directors receives an annual fee of $40,000. This fee is for all duties as a North Fork director, including any service as a member of one or more committees of North Fork’s Board. Each non-management member of the Board of Directors of North Fork Bank (currently, the same group that serves as the North Fork Board) receives a fee of $1,000 for each meeting of the Bank Board attended and $2,000 for each meeting of a committee of the Bank Board attended. Chairmen of Bank Board committees receive an additional $500 per committee meeting attended. As of January 1, 2005, those directors who are also executive officers of North Fork – that is, Directors Kanas, Bohlsen and Healy — do not receive any separate fees for their service as directors of North Fork or any of its subsidiaries.
Regions Financial
2004 Director Compensation
Class | | | | Retainer | | Committee Retainer
($5,000/Y)(1) | | Committee Chair
Retainer ($2,000/Y0 | | Total | | Audit (met 8x) | | Compensation (met 8x) | | Nominating/ Corporate
Governance (met 5x) | |
| | Non-Management Directors | | | | | | | | | | | | | | | |
I | | James S.M. French | | $ | 30,000 | | $ | 5,000 | | $ | 2,000 | | $ | 37,000 | | | | X | (C) | | |
II | | Margaret H. Greene | | $ | 30,000 | | $ | 5,000 | | $ | 0 | | $ | 35,000 | | | | | | X | |
II | | Susan W. Matlock | | $ | 30,000 | | $ | 5,000 | | $ | 0 | | $ | 35,000 | | | | X | | | |
III | | Jon W. Rotenstreich | | $ | 30,000 | | $ | 0 | | $ | 0 | | $ | 30,000 | | | | | | | |
I | | W. Woodrow Stewart | | $ | 30,000 | | $ | 0 | | $ | 0 | | $ | 30,000 | | | | | | | |
II | | John H. Watson | | $ | 30,000 | | $ | 5,000 | | $ | 0 | | $ | 35,000 | | | | | | X | |
III | | C. Kemmons Wilson, Jr. | | $ | 30,000 | | $ | 5,000 | | $ | 0 | | $ | 35,000 | | | | X | | | |
III | | Harry W. Witt | | $ | 30,000 | | $ | 5,000 | | $ | 2,000 | | $ | 37,000 | | X | (C) | | | | |
I | | Malcolm Portera | | $ | 30,000 | | $ | 5,000 | | $ | 0 | | $ | 35,000 | | | | | | X | |
I | | Lee J. Styslinger III | | $ | 30,000 | | $ | 5,000 | | $ | 0 | | $ | 35,000 | | X | | | | | |
| | Average Non-Management Director Pay | | | | | | | | $ | 34,250 | | | | | | | |
| | | | | | | | | | | | | | | | | |
| | Management Directors | | | | | | | | | | | | | | | |
I | | Richard D. Horsley (COO) | | | | | | | | | | | | | | | |
II | | Carl E. Jones (Chairman/CEO) | | | | | | | | | | | | | | | |
III | | Allen B. Morgan (CEO of Morgan Keegan) | | | | | | | | | | | | | | | |
*2004 data is pro forma to exclude the merger with Union Planters effective 7/1/04.
C = Chairperson
(1) Assumes committees met the same number of times as in 2003.
Audit committee met 6 times after the merger.
Nominating & Corporate Governance committee met 6 times after the merger.
Compensation committee met 5 times after the merger.
New comp: 32K retainer, $1.5K mtg fee, 6K chair retainer (10K for audit); 1,350 share stock grant.
Synovus Financial Corp.
2004 Director Compensation
| | Annual
Retainer
($ 35,000) | | Annual
Committee
Retainer | | Committee
Chair
Retainer | | Lead
Director | | 500 Shares
Restricted
Stock (1) | | TOTAL | | Executive
Committee
(met 5x) | | Audit
Committee
(met 12x) | | Corporate
Governance
and
Nominating
Committee
(met 3x) | | Compensation
Committee
(met 5x) | |
| | | | | | | | | | | | | | | | | | | | | |
Non-Management Directors | | | | | | | | | | | | | | | | | | | | | |
Daniel P. Amos | | $ | 35,000 | | $ | 5,000 | | | | | | $ | 12,140 | | $ | 52,140 | | | | | | x | | | |
James D. Yancey | | $ | 35,000 | | $ | 10,000 | | | | | | $ | 12,140 | | $ | 57,140 | | x | | | | | | | |
Richard Y. Bradley | | $ | 35,000 | | $ | 15,000 | | $ | 5,000 | | | | $ | 12,140 | | $ | 67,140 | | x | | | | x | (c) | | |
Frank W. Brumley | | $ | 35,000 | | $ | 5,000 | | | | | | $ | 12,140 | | $ | 52,140 | | | | | | x | | | |
Elizabeth W. Camp | | $ | 35,000 | | $ | 10,000 | | | | | | $ | 12,140 | | $ | 57,140 | | | | x | | | | | |
C. Edward Floyd | | $ | 35,000 | | $ | 5,000 | | | | | | $ | 12,140 | | $ | 52,140 | | | | | | x | | | |
Gardiner W. Garrard, Jr. | | $ | 35,000 | | $ | 10,000 | | | | | | $ | 12,140 | | $ | 57,140 | | x | | | | | | | |
T. Michael Goodrich | | $ | 35,000 | | $ | 5,000 | | | | | | $ | 12,140 | | $ | 52,140 | | | | | | | | x | |
V. Nathaniel Hansford | | $ | 35,000 | | $ | 15,000 | | $ | 5,000 | | $ | 5,000 | | $ | 12,140 | | $ | 72,140 | | x | (c) | | | | | x | (c) |
John P. Illges, III | | $ | 35,000 | | $ | 20,000 | | $ | 10,000 | | | | $ | 12,140 | | $ | 77,140 | | x | | x | (c) | | | | |
Alfred W. Jones, III | | $ | 35,000 | | | | | | | | $ | 12,140 | | $ | 47,140 | | | | | | | | | |
Mason H. Lampton | | $ | 35,000 | | $ | 15,000 | | | | | | $ | 12,140 | | $ | 62,140 | | x | | | | | | x | |
Elizabeth C. Ogie | | $ | 35,000 | | $ | 5,000 | | | | | | $ | 12,140 | | $ | 52,140 | | | | | | x | | | |
H. Lynn Page | | $ | 35,000 | | $ | 10,000 | | | | | | $ | 12,140 | | $ | 57,140 | | | | x | | | | | |
J. Neal Purcell | | $ | 35,000 | | $ | 10,000 | | | | | | $ | 12,140 | | $ | 57,140 | | | | x | | | | | |
Melvin T. Stith | | $ | 35,000 | | $ | 10,000 | | | | | | $ | 12,140 | | $ | 57,140 | | | | x | | | | | |
William B. Turner, Jr. | | $ | 35,000 | | | | | | | | $ | 12,140 | | $ | 47,140 | | | | | | | | | |
| | | | | | | | | | | | | | | | | | | | | |
Average Non-Management Director Pay | | | | | | | | | | | | $ | 57,434 | | | | | | | | | |
| | | | | | | | | | | | | | | | | | | | | |
Management Directors | | | |
Richard E. Anthony | | President and Chief Operating Officer | |
James H. Blanchard | | Chief Executive Officer | |
| | | | | | | | | | | | | | | | | | | | | | | | | | | |
C = Chairperson
(1) Price as of Shareholder Meeting: 4/22/04 ($24.28)
COMPENSATION PAID TO DIRECTORS
Annual retainer | | $ | 35,000 | |
Committee member retainer (Comp. and Corp. Gov. and Nominating) | | $ | 5,000 | |
Committee member retainer (Audit and Executive) | | $ | 10,000 | |
Committee chair retainer (Comp. and Corp. Gov. and Nominating) | | $ | 5,000 | |
Annual Audit Committee chair retainer | | $ | 10,000 | |
Annual Lead Director retainer | | $ | 5,000 | |
Non-management directors also receive an annual award of 500 shares of restricted Synovus stock in the form of a grant from the Synovus 2002 Long-Term Incentive Plan which vests as to 100% after three years.
TCF Financial Corporation
2004 Director Compensation
| | Annual
Retainer | | 4 Board
Meetings | | Committee
Meetings | | TOTAL | | Audit
Committee
(met 4x) | | Shareholder
Relations/
DeNovo
Expansion
Committee
(met 5x) | | Compensation/
Nominating/
Corporate
Governance
Committee
(met 5x) | |
Non-Management Directors | | | | | | | | | | | | | | | |
Luella G. Goldberg | | $ | 20,000 | | $ | 4,000 | | $ | 9,000 | | $ | 33,000 | | x | | x | | x | |
George G. Johnson | | $ | 40,000 | | $ | 4,000 | | $ | 4,000 | | $ | 48,000 | | x | (c) | | | | |
Ralph Strangis | | $ | 40,000 | | $ | 4,000 | | $ | 2,500 | | $ | 46,500 | | | | x | (c) | | |
Rodney P. Burwell | | $ | 20,000 | | $ | 4,000 | | $ | 5,000 | | $ | 29,000 | | | | x | | x | |
Thomas A. Cusick | | $ | 20,000 | | $ | 4,000 | | $ | 2,500 | | $ | 26,500 | | | | x | | | |
Thomas J. McGough | | $ | 40,000 | | $ | 4,000 | | $ | 5,000 | | $ | 49,000 | | | | x | | x | (c) |
William F. Bieber | | $ | 20,000 | | $ | 4,000 | | $ | 5,000 | | $ | 29,000 | | | | x | | x | |
John M. Eggermeyer, III | | $ | 20,000 | | $ | 4,000 | | $ | 5,000 | | $ | 29,000 | | | | x | | x | |
Robert E. Evans | | $ | 20,000 | | $ | 4,000 | | $ | 4,000 | | $ | 28,000 | | x | | | | | |
Peter L. Scherer | | $ | 20,000 | | $ | 4,000 | | $ | 6,500 | | $ | 30,500 | | x | | x | | | |
Gerald A. Schwalbach | | $ | 20,000 | | $ | 4,000 | | $ | 9,000 | | $ | 33,000 | | x | | x | | x | |
| | | | | | | | | | | | | | | |
Average Non-Management Director Pay | | | | | | | | $ | 34,682 | | | | | | | |
| | |
Management Directors | | |
Lynn A. Nagorske | | Director and President |
William A. Cooper | | Director, Chairman and Chief Executive Officer |
C = Chairperson
COMPENSATION PAID TO DIRECTORS
Cash compensation (which may be deferred and invested in TCF Stock):
• Annual Retainer – $20,000; Committee Chairs receive an additional $20,000 annual retainer fee
• Board Meetings – $1,000/meeting
• Committee Meetings – $500/meeting ($1,000/meeting for Audit Committee members)
(1) Stock Grant Program (as proposed for renewal at this Meeting):
• Periodically, but not more often than every three years, Directors receive TCF Stock grants equal to three times their annual base retainer: (excludes higher retainer for committee chairpersons) ($20,000 x 3 = $60,000).
• The number of shares granted is determined by dividing three times the annual retainer fee by the price of TCF Stock on the grant date
• The stock vests over a minimum of three years.
• One-third of the shares will vest in each year that TCF Financial’s return on tangible equity exceeds 20%.
• Dividends are paid on unvested shares at the same rate as regular dividends to TCF stockholders.
• Once all shares vest, new grants are made.
• Unvested shares will vest if a change in control occurs
No mention of Stock Grant Program vesting in 2004
Zions Bancorporation
2004 Director Compensation
| | Annual
Retainer
($ 20,000) | | 8 Board
Meetings
($ 1,250
per
meeting) | | Committee
Meetings
($ 1,000
per
meeting) | | Stock
Options (1) | | Audit
Committee
Retainer | | TOTAL | | Audit
Committee
(met 13x) | | Executive
Committee
(met 0x) | | Executive
Compensation
Committee
(met 5x) | | Credit
Review
Committee
(met 3x) | | Nominating
and
Corporate
Governance
Committee
(met 3x) | |
| | | | | | | | | | | | | | | | | | | | | | | |
Non-Management Directors | | | | | | | | | | | | | | | | | | | | | | | |
Roger B. Porter | | $ | 20,000 | | $ | 10,000 | | $ | 18,000 | | $ | 68,257 | | $ | 10,000 | | $ | 126,257 | | x | (c) | x | | x | | | | | |
L.E. Simmons | | $ | 20,000 | | $ | 10,000 | | $ | 3,000 | | $ | 68,257 | | | | $ | 101,257 | | | | x | | | | x | | | |
Steven C. Wheelwright | | $ | 20,000 | | $ | 10,000 | | $ | 8,000 | | $ | 68,257 | | | | $ | 106,257 | | | | | | x | | x | | | |
Jerry C. Atkin | | $ | 20,000 | | $ | 10,000 | | $ | 18,000 | | $ | 68,257 | | $ | 3,000 | | $ | 119,257 | | x | | x | (c) | x | | | | | |
R.D. Cash | | $ | 20,000 | | $ | 10,000 | | $ | 8,000 | | $ | 68,257 | | | | $ | 106,257 | | | | x | | x | (c) | | | x | |
Patricia Frobes | | $ | 20,000 | | $ | 10,000 | | $ | 6,000 | | $ | 68,257 | | | | $ | 104,257 | | | | | | | | x | | x | |
Richard H. Madsen | | $ | 20,000 | | $ | 10,000 | | $ | 13,000 | | $ | 68,257 | | $ | 3,000 | | $ | 114,257 | | x | | | | | | | | | |
Stephen D. Quinn | | $ | 20,000 | | $ | 10,000 | | $ | 16,000 | | $ | 68,257 | | $ | 3,000 | | $ | 117,257 | | x | | | | | | | | x | |
Shelley Thomas Williams | | $ | 20,000 | | $ | 10,000 | | $ | 6,000 | | $ | 68,257 | | | | $ | 104,257 | | | | x | | | | x | | x | |
| | | | | | | | | | | | | | | | | | | | | | | |
Average Non-Management Director Pay | | | | | | | | | | | | $ | 111,035 | | | | | | | | | | | |
| | |
Management Directors | | |
Harry S. Simmons | | Chairman, President, and Chief Executive Officer of the Company |
C = Chairperson
* No disclosure of committee chairs
(1) Option Assumptions and Source
Grant Date | | 5/3/04 | | Proxy |
Exercise Price | | $ | 56.94 | | Proxy |
Market Price | | #NAME? | | Baseline |
Volatility | | 26.80 | % | 10-K |
Risk-free rate | | 3.11 | % | 10-K |
Dividend Yield | | 2.00 | % | 10-K |
Vest Period (days) | | | | Proxy |
Life (days) | | 3,650 | | Assumption |
Value | | $ | 17.06 | | BSM Value |
| | | | | | |
COMPENSATION PAID TO DIRECTORS
During 2004, each of the Company’s outside directors received a $20,000 annual retainer and $1,250 for each regular and special meeting attended. Members of the committees received $1,000 for each committee meeting attended. The Chairman of the Audit Committee received an additional $10,000 annual retainer and the other members of the Audit Committee received an additional $3,000 annual retainer. Each of the retainer and meeting fees are paid in cash unless the director elects to defer his or her compensation as described below. Non-employee directors are also granted non-qualified stock options annually. Directors who are full-time compensated employees of the Company do not receive either the retainer or any other compensation for attendance at meetings of the Board of Directors or its committees.
In accordance with the terms of the Non-Employee Directors Stock Option Plan, nonqualified options were granted to each non-employee director as of May 2004. Each grant is an option to purchase 4,000 shares at $56.94 per share. The options vest and become exercisable in four equal installments of 1,000 shares beginning six months after the date of grant and continuing at one-year intervals thereafter. The 2004 options expire on May 2, 2014.