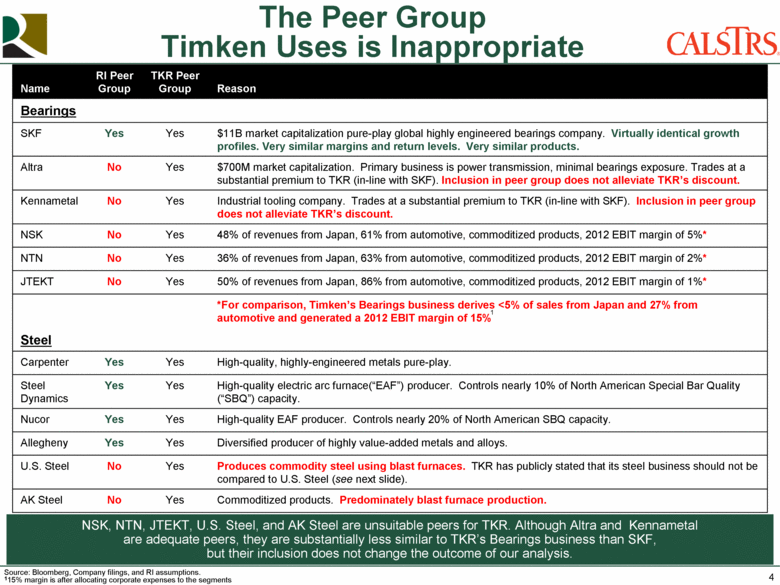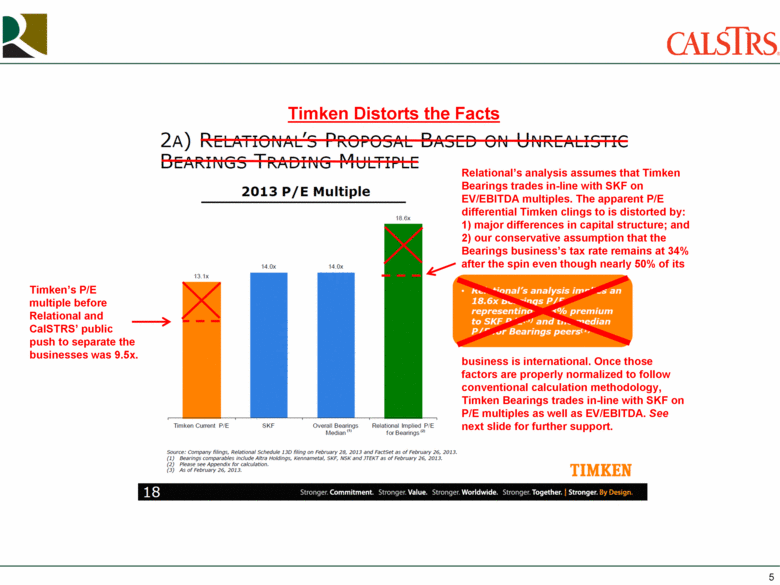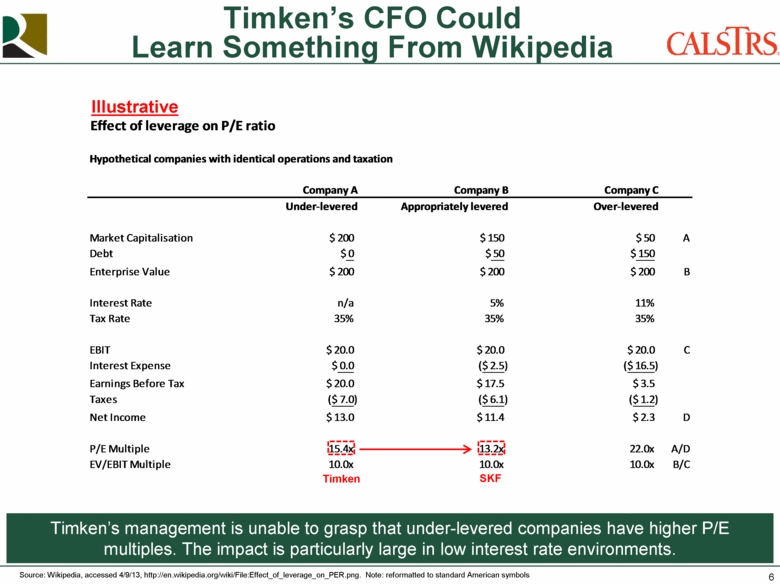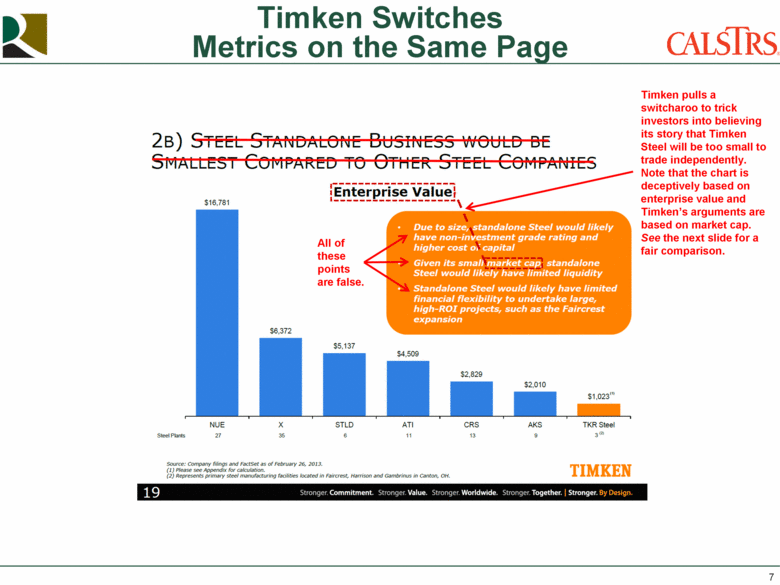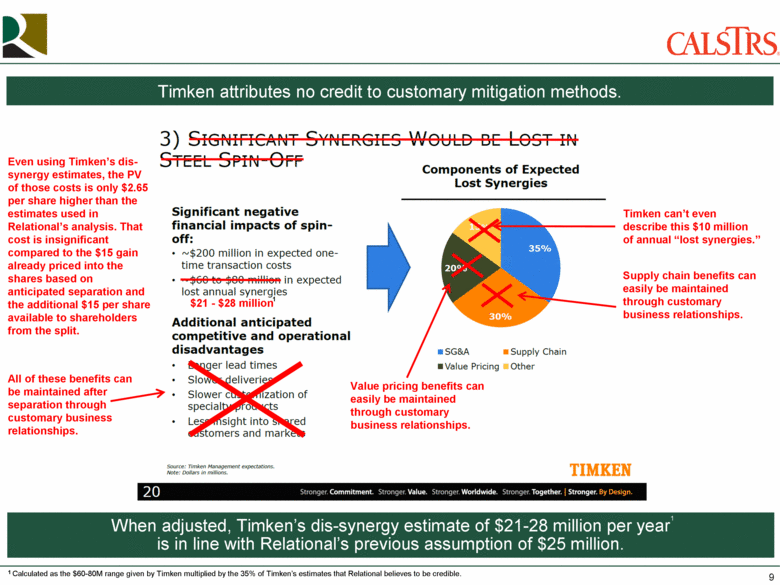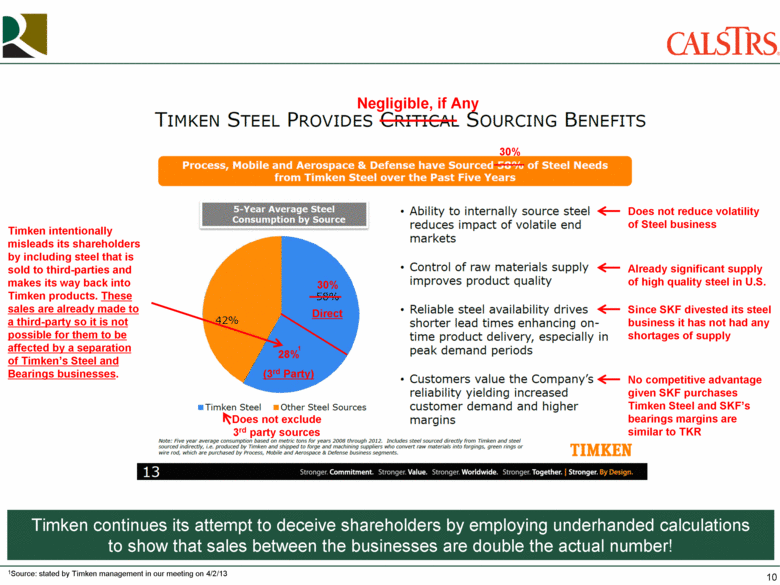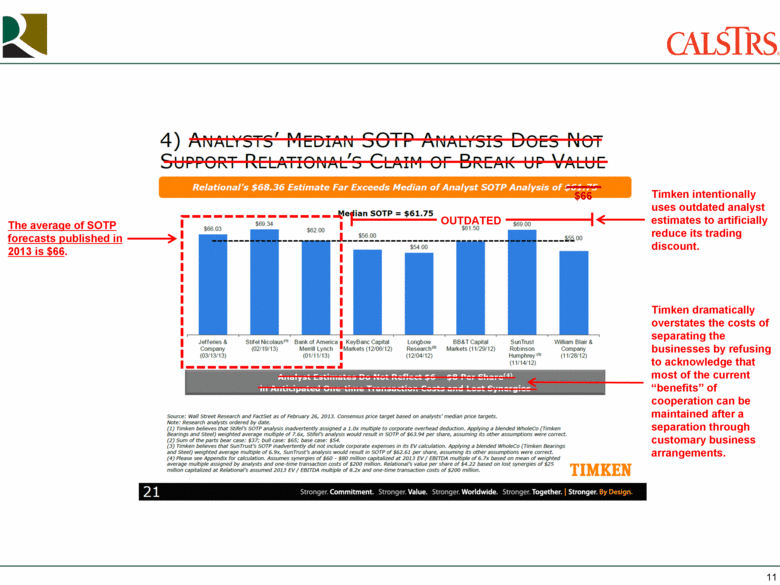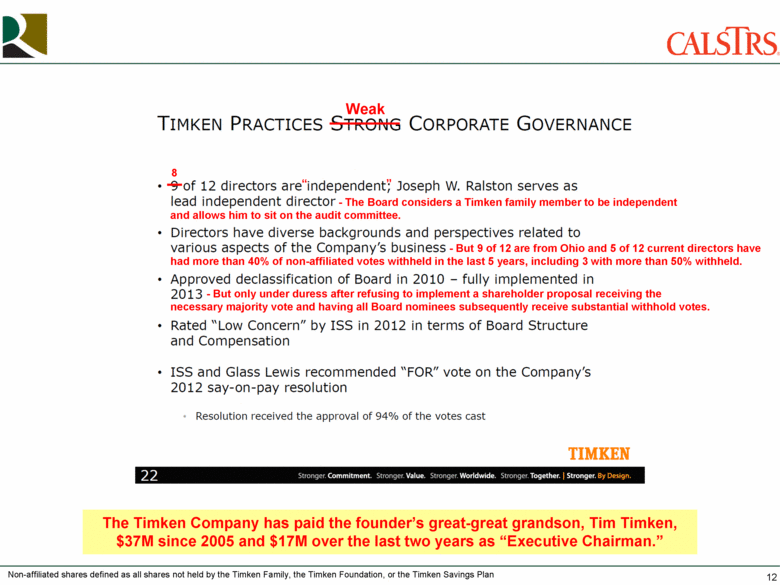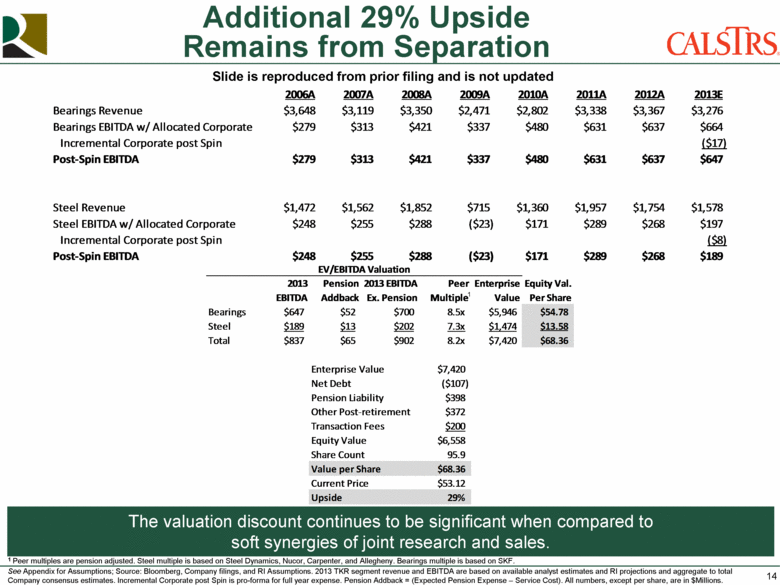
| 14 See Appendix for Assumptions; Source: Bloomberg, Company filings, and RI Assumptions. 2013 TKR segment revenue and EBITDA are based on available analyst estimates and RI projections and aggregate to total Company consensus estimates. Incremental Corporate post Spin is pro-forma for full year expense. Pension Addback = (Expected Pension Expense – Service Cost). All numbers, except per share, are in $Millions. The valuation discount continues to be significant when compared to soft synergies of joint research and sales. 1 Additional 29% Upside Remains from Separation 1 Peer multiples are pension adjusted. Steel multiple is based on Steel Dynamics, Nucor, Carpenter, and Allegheny. Bearings multiple is based on SKF. Slide is reproduced from prior filing and is not updated EV/EBITDA Valuation 2013 Pension 2013 EBITDA Peer Enterprise Equity Val. EBITDA Addback Ex. Pension Multiple Value Per Share Bearings $647 $52 $700 8.5x $5,946 $54.78 Steel $189 $13 $202 7.3x $1,474 $13.58 Total $837 $65 $902 8.2x $7,420 $68.36 Enterprise Value $7,420 Net Debt ($107) Pension Liability $398 Other Post-retirement $372 Transaction Fees $200 Equity Value $6,558 Steel Share Count 95.9 Value per Share $68.36 Current Price $53.12 Upside 29% 2006A 2007A 2008A 2009A 2010A 2011A 2012A 2013E Bearings Revenue $3,648 $3,119 $3,350 $2,471 $2,802 $3,338 $3,367 $3,276 Bearings EBITDA w/ Allocated Corporate $279 $313 $421 $337 $480 $631 $637 $664 Incremental Corporate post Spin ($17) Post-Spin EBITDA $279 $313 $421 $337 $480 $631 $637 $647 Steel Revenue $1,472 $1,562 $1,852 $715 $1,360 $1,957 $1,754 $1,578 Steel EBITDA w/ Allocated Corporate $248 $255 $288 ($23) $171 $289 $268 $197 Incremental Corporate post Spin ($8) Post-Spin EBITDA $248 $255 $288 ($23) $171 $289 $268 $189 |
