Table of Contents
UNITED STATES
SECURITIES AND EXCHANGE COMMISSION
Washington, D.C. 20549
FORM N-CSR
CERTIFIED SHAREHOLDER REPORT OF REGISTERED
MANAGEMENT INVESTMENT COMPANIES
Investment Company Act file number: 811-08437
Undiscovered Managers Funds
(Exact name of registrant as specified in charter)
277 Park Avenue
New York, NY 10172
(Address of principal executive offices) (Zip code)
Gregory S. Samuels
277 Park Avenue
New York, NY 10172
(Name and Address of Agent for Service)
Registrant’s telephone number, including area code: (800) 480-4111
Date of fiscal year end: Last Day of February
Date of reporting period: March 1, 2020 through February 28, 2021
Form N-CSR is to be used by management investment companies to file reports with the Commission not later than 10 days after the transmission to stockholders of any report that is required to be transmitted to stockholders under Rule 30e-1 under the Investment Company Act of 1940 (17 CFR 270.30e-1). The Commission may use the information provided on Form N-CSR in its regulatory, disclosure review, inspection, and policymaking roles.
A registrant is required to disclose the information specified by Form N-CSR, and the Commission will make this information public. A registrant is not required to respond to the collection of information contained in Form N-CSR unless the Form displays a currently valid Office of Management and Budget (“OMB”) control number. Please direct comments concerning the accuracy of the information collection burden estimate and any suggestions for reducing the burden to Secretary, Securities and Exchange Commission, 450 Fifth Street, NW, Washington, DC 20549-0609. The OMB has reviewed this collection of information under the clearance requirements of 44 U.S.C. Section 3507.
Table of Contents
ITEM 1. REPORTS TO STOCKHOLDERS.
a.) The following is a copy of the report transmitted to shareholders pursuant to Rule 30e-1 under the Investment Company Act of 1940 (17 CFR 270.30e-1).
b.) A copy of the notice transmitted to shareholders in reliance on Rule 30e-3 under the 1940 Act that contains disclosures specified by paragraph (c)(3) of that rule is included in the Annual Report. Not Applicable. Notices do not incorporate disclosures from the
shareholder report.
Table of Contents
Annual Report
Undiscovered Managers Funds
February 28, 2021
JPMorgan Realty Income Fund

Table of Contents
Investments in the Fund are not deposits or obligations of, or guaranteed or endorsed by, any bank and are not insured or guaranteed by the FDIC, the Federal Reserve Board or any other government agency. You could lose money if you sell when the Fund’s share price is lower than when you invested.
Past performance is no guarantee of future performance. The general market views expressed in this report are opinions based on market and other conditions through the end of the reporting period and are subject to change without notice. These views are not intended to predict the future performance of the Fund or the securities markets. References to specific securities and their issuers are for illustrative purposes only and are not intended to be, and should not be interpreted as, recommendations to purchase or sell such securities. Such views are not meant as investment advice and may not be relied on as an indication of trading intent on behalf of the Fund.
Prospective investors should refer to the Fund’s prospectuses for a discussion of the Fund’s investment objective, strategies and risks. Call J.P. Morgan Funds Service Center at 1-800-480-4111 for a prospectus containing more complete information about the Fund, including management fees and other expenses. Please read it carefully before investing.
Table of Contents
April 10, 2021 (Unaudited)
Dear Shareholders,
The dual advents of mass vaccinations and an exponential increase in U.S. government spending for pandemic relief and recovery have combined to accelerate an upward trend in financial markets that largely began in the second half of last year. The prospect of fully reopened economies and the expected surge in economic activity at the local, national and global scales has fueled broad investor demand for financial assets.
 |
“It’s instructive that those who remained fully invested in the face of unprecedented uncertainty in 2020 were likely rewarded for their resilience and resolve in 2021.” — Andrea L. Lisher |
Equity markets generally led the long rebound in financial markets from the initial sell-off at the declaration of the pandemic in March 2020. For the twelve months ended February 28, 2021, the S&P 500 Index returned 31.3% and the Bloomberg Barclays U.S. Aggregate returned 1.4%.
Subsequent to the end of the twelve month period, the $1.9 trillion American Rescue Plan was signed into law and early debate began on the proposed $2 trillion American Jobs Plan. Investors responded in early April by pushing the S&P 500 to close above 4,000 points for the first time.
While the uncertainty and turbulence of 2020 has receded and this year has begun with broad expectations for a robust economic recovery, investor concerns have evolved with the
changing investment environment. The threat from new variants of COVID-19 and a late resurgence in infections across the globe serve as reminders that the pandemic remains a present danger. Additionally, the anticipated impact of unprecedented federal stimulus spending has led to more conventional investor worries about potential supply/demand imbalances in certain sectors of the economy as well as inflationary pressure and rising long-term interest rates.
It’s instructive that those who remained fully invested in the face of unprecedented uncertainty in 2020 were likely rewarded for their resilience and resolve in 2021. At the same time, J.P. Morgan Asset Management also has adapted to the challenges and opportunities presented over the past year to continually seek to deliver innovative and durable investment solutions grounded by our deep experience in risk management. We will continue to operate under the same fundamental practices and principles that have driven our success for more than a century and focus on the financial needs of our clients.
On behalf of J.P. Morgan Asset Management, thank you for entrusting us to manage your investment. Should you have any questions, please visit www.jpmorganfunds.com or contact the J.P. Morgan Funds Service Center at 1-800-480-4111.
Sincerely yours,

Andrea L. Lisher
Head of Americas, Client
J.P. Morgan Asset Management
| FEBRUARY 28, 2021 | UNDISCOVERED MANAGERS FUNDS | 1 | ||||||||
Table of Contents
JPMorgan Realty Income Fund
TWELVE MONTHS ENDED FEBRUARY 28, 2021 (Unaudited)
| REPORTING PERIOD RETURN: | ||||
| Fund (Class L Shares)* | 5.27% | |||
| MSCI US REIT Index | 3.36% | |||
| Net Assets as of 2/28/2021 (In Thousands) | $ | 1,909,121 | ||
INVESTMENT OBJECTIVE**
The JPMorgan Realty Income Fund (the “Fund”) seeks to provide high total investment return through a combination of capital appreciation and current income.
HOW DID THE MARKET PERFORM?
Overall, the real estate sector provided positive returns but underperformed the broader equity market during the period, which was marked by wide dispersion in share price performance within real estate subsectors. The pandemic forced the closure of retail, office, lodging and entertainment properties, which led to a steep sell-off in real estate investment trusts (REITs) operating in those subsectors. While new vaccines against Covid-19 bolstered investor expectations that the economy could fully reopen in 2021, uncertainty remained regarding the prospects for commercial real estate, shopping malls, retail outlets and stores.
Notably, demand for communications and technology led to market gains in REITs operating in the data center and communications infrastructure businesses. Shares of industrial property REITs also benefitted, as many of those properties serve as distribution hubs for e-commerce retailers. Demand for single-family homes and home renovations surged during the period, largely driven by the pandemic and ultra-low interest rates. For the twelve months ended February 28, 2021, the S&P 500 Index returned 31.29% and the MSCI US REIT Index returned 3.36%.
WHAT WERE THE MAIN DRIVERS OF THE FUND’S PERFORMANCE?
For the twelve months ended February 28, 2021, the Fund’s Class L Shares outperformed the MSCI US REIT Index (the “Benchmark”). The Fund’s overweight position in the retail sector and its security selection in the health care sector were leading contributors to performance relative to the Benchmark. The Fund’s security selection in the office sector and its underweight position in the self-storage sector were leading detractors from relative performance.
Leading individual contributors to the Fund’s relative performance included its overweight positions in Ventas Inc., Welltower
Inc. and American Homes 4 Rent. Shares of Ventas and Welltower, both senior housing and health care property REITs, rebounded from a selloff early in the period as the development and distribution of Covid-19 vaccines led to an improved business outlook for nursing homes and other senior care facilities. Shares of American Homes 4 Rent, a single-family rental properties REIT, rose amid demand for long-term rentals in response to the pandemic.
Leading individual detractors from the Fund’s relative performance included its underweight positions in Alexandria Real Estate Equities Inc. and VICI Properties Inc., and its overweight position in Rexford Industrial Realty Inc. Shares of Alexandria Real Estate Equities, an urban office REIT, rose amid a decline in interest rates during the period. Shares of VICI Properties, a gaming, hospitality and entertainment REIT, rose amid investor expectations that the business is positioned to benefit from a potential easing of social distancing guidelines in the U.S. Shares of Rexford Industrial Realty, an industrial properties REIT, fell early in the period amid investor concerns about the impact of the pandemic on the industrial and logistics sectors.
HOW WAS THE FUND POSITIONED?
The Fund’s portfolio managers used bottom-up fundamental research to construct, in their view, a portfolio of attractively valued real estate securities. They projected long-term cash flow for each portfolio holding and valued the holdings using a proprietary dividend discount model. During the period, the portfolio managers sold hotel sector and office sector stocks to fund investments in the net lease and retail sectors. The managers sought companies that they believed would benefit from economic recovery and low interest rates, especially within the residential and data center sectors.
| * | The return shown is based on net asset values calculated for shareholder transactions and may differ from the return shown in the financial highlights, which reflects adjustments made to the net asset values in accordance with accounting principles generally accepted in the United States of America. |
| ** | The adviser seeks to achieve the Fund’s objective. There can be no guarantee that it will be achieved. |
| 2 | UNDISCOVERED MANAGERS FUNDS | FEBRUARY 28, 2021 | ||||
Table of Contents
| TOP TEN EQUITY HOLDINGS OF THE PORTFOLIO* | ||||||||
| 1. | Equinix, Inc. | 7.8 | % | |||||
| 2. | Prologis, Inc. | 6.9 | ||||||
| 3. | UDR, Inc. | 4.9 | ||||||
| 4. | Public Storage | 4.6 | ||||||
| 5. | Invitation Homes, Inc. | 4.1 | ||||||
| 6. | Sun Communities, Inc. | 3.8 | ||||||
| 7. | Welltower, Inc. | 3.8 | ||||||
| 8. | Mid-America Apartment Communities, Inc. | 3.8 | ||||||
| 9. | WP Carey, Inc. | 3.7 | ||||||
| 10. | Host Hotels & Resorts, Inc. | 3.6 | ||||||
PORTFOLIO COMPOSITION BY SECTOR* | ||||
| Apartments | 28.8 | % | ||
| Diversified | 15.7 | |||
| Shopping Centers | 11.2 | |||
| Health Care | 10.3 | |||
| Industrial | 10.0 | |||
| Office | 9.3 | |||
| Hotels | 8.0 | |||
| Storage | 4.6 | |||
| Regional Malls | 1.0 | |||
| Short-Term Investments | 1.1 | |||
| * | Percentages indicated are based on total investments as of February 28, 2021. The Fund’s portfolio composition is subject to change. |
| FEBRUARY 28, 2021 | UNDISCOVERED MANAGERS FUNDS | 3 | ||||||||
Table of Contents
JPMorgan Realty Income Fund
FUND COMMENTARY
TWELVE MONTHS ENDED FEBRUARY 28, 2021 (Unaudited) (continued)
AVERAGE ANNUAL TOTAL RETURNS AS OF FEBRUARY 28, 2021 | ||||||||||||||
| INCEPTION DATE OF CLASS | 1 YEAR | 5 YEAR | 10 YEAR | |||||||||||
CLASS A SHARES | June 4, 2004 | |||||||||||||
With Sales Charge* | (0.68 | )% | 5.00 | % | 6.69 | % | ||||||||
Without Sales Charge | 4.81 | 6.14 | 7.27 | |||||||||||
CLASS C SHARES | June 4, 2004 | |||||||||||||
With CDSC** | 3.29 | 5.61 | 6.83 | |||||||||||
Without CDSC | 4.29 | 5.61 | 6.83 | |||||||||||
CLASS I SHARES | March 1, 2017 | 5.12 | 6.47 | 7.64 | ||||||||||
CLASS L SHARES | January 1, 1998 | 5.27 | 6.58 | 7.70 | ||||||||||
CLASS R5 SHARES | May 15, 2006 | 5.23 | 6.61 | 7.75 | ||||||||||
CLASS R6 SHARES | November 2, 2015 | 5.38 | 6.68 | 7.79 | ||||||||||
| * | Sales Charge for Class A Shares is 5.25%. |
| ** | Assumes a 1% CDSC (contingent deferred sales charge) for the one year period and 0% CDSC thereafter. |
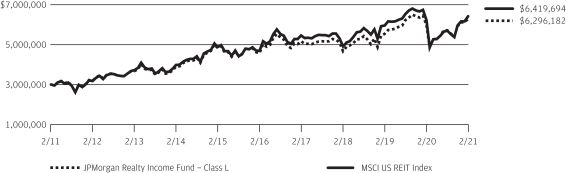
TEN YEAR PERFORMANCE (2/28/11 TO 2/28/21)
The performance quoted is past performance and is not a guarantee of future results. Mutual funds are subject to certain market risks. Investment returns and principal value of an investment will fluctuate so that an investor’s shares, when redeemed, may be worth more or less than their original cost. Current performance may be higher or lower than the performance data shown. For up-to-date month-end performance information please call 1-800-480-4111.
Returns for Class R6 Shares prior to its inception date are based on the performance of Class R5 Shares. The actual returns of Class R6 Shares would have been different than those shown because Class R6 Shares have different expenses than Class R5 Shares. Returns for Class I Shares prior to their inception date are based on the performance of the Class L Shares. The actual returns for Class I Shares would have been lower than those shown because Class I Shares have higher expenses than Class L Shares.
The graph illustrates comparative performance for $3,000,000 invested in Class L Shares of the JPMorgan Realty Income Fund and the MSCI US REIT Index from February 28, 2011 to February 28, 2021. The performance of the Fund assumes reinvestment of all dividends and capital gain distributions, if any, and does not include a sales charge. The performance of the MSCI US REIT Index does not reflect the deduction of expenses or a sales charge associated with a mutual fund and has been adjusted to reflect reinvestment of all dividends and capital gain distributions of securities included in the benchmark, if applicable.
The MSCI US REIT Index is a free float-adjusted market capitalization weighted index that is comprised of equity REITs that are included in the MSCI US Investable Market 2500 Index, with the exception of specialty equity REITs that do not generate a majority of their revenue and income from real estate rental and leasing operations. The index represents approximately 85% of the US REIT universe.
Class L Shares have a $3,000,000 minimum initial investment.
Fund performance may reflect the waiver of the Fund’s fees and reimbursement of expenses for certain periods. Without these waivers and reimbursements, performance would have been lower. Also, performance shown in this section does not reflect the deduction of taxes that a shareholder would pay on Fund distributions or on gains resulting from redemptions of Fund shares.
Because Class C Shares automatically convert to Class A Shares after 8 years, the 10 year average annual total return shown above for Class C reflects Class A performance for the period after conversion.
The returns shown are based on net asset values calculated for shareholder transactions and may differ from the returns shown in the financial highlights, which reflect adjustments made to the net asset values in accordance with accounting principles generally accepted in the United States of America.
| 4 | UNDISCOVERED MANAGERS FUNDS | FEBRUARY 28, 2021 | ||||||||
Table of Contents
JPMorgan Realty Income Fund
SCHEDULE OF PORTFOLIO INVESTMENTS
AS OF FEBRUARY 28, 2021
| INVESTMENTS | SHARES (000) | VALUE ($000) | ||||||
Common Stocks — 101.5% |
| |||||||
Apartments — 29.6% |
| |||||||
American Homes 4 Rent, Class A, REIT | 1,196 | 37,257 | ||||||
Camden Property Trust, REIT | 403 | 42,022 | ||||||
Equity LifeStyle Properties, Inc., REIT | 974 | 60,029 | ||||||
Equity Residential, REIT | 177 | 11,567 | ||||||
Essex Property Trust, Inc., REIT | 159 | 40,512 | ||||||
Invitation Homes, Inc., REIT | 2,730 | 79,557 | ||||||
Mid-America Apartment Communities, Inc., REIT | 550 | 74,128 | ||||||
Realty Income Corp., REIT | 807 | 48,629 | ||||||
Sun Communities, Inc., REIT | 496 | 75,335 | ||||||
UDR, Inc., REIT | 2,322 | 95,596 | ||||||
|
| |||||||
| 564,632 | ||||||||
|
| |||||||
Diversified — 16.1% | ||||||||
Cushman & Wakefield plc * | 379 | 5,863 | ||||||
Digital Realty Trust, Inc., REIT | 430 | 57,961 | ||||||
Equinix, Inc., REIT | 236 | 152,702 | ||||||
Weyerhaeuser Co., REIT | 508 | 17,216 | ||||||
WP Carey, Inc., REIT | 1,067 | 73,165 | ||||||
|
| |||||||
| 306,907 | ||||||||
|
| |||||||
Health Care — 10.6% | ||||||||
Healthcare Realty Trust, Inc., REIT | 555 | 16,018 | ||||||
Healthpeak Properties, Inc., REIT | 1,582 | 46,009 | ||||||
Ventas, Inc., REIT | 1,220 | 64,543 | ||||||
Welltower, Inc., REIT | 1,109 | 75,310 | ||||||
|
| |||||||
| 201,880 | ||||||||
|
| |||||||
Hotels — 8.2% | ||||||||
DiamondRock Hospitality Co., REIT * | 4,295 | 43,465 | ||||||
Host Hotels & Resorts, Inc., REIT | 4,281 | 71,018 | ||||||
Pebblebrook Hotel Trust, REIT | 1,882 | 42,646 | ||||||
|
| |||||||
| 157,129 | ||||||||
|
| |||||||
Industrial — 10.3% | ||||||||
Americold Realty Trust, REIT | 801 | 28,054 | ||||||
Prologis, Inc., REIT | 1,359 | 134,667 | ||||||
Rexford Industrial Realty, Inc., REIT | 697 | 33,252 | ||||||
|
| |||||||
| 195,973 | ||||||||
|
| |||||||
Office — 9.5% | ||||||||
Alexandria Real Estate Equities, Inc., REIT | 170 | 27,147 | ||||||
Columbia Property Trust, Inc., REIT | 579 | 8,180 | ||||||
Corporate Office Properties Trust, REIT | 823 | 21,392 | ||||||
Cousins Properties, Inc., REIT | 1,317 | 44,175 | ||||||
JBG SMITH Properties, REIT | 1,462 | 46,426 | ||||||
Kilroy Realty Corp., REIT | 555 | 35,220 | ||||||
|
| |||||||
| 182,540 | ||||||||
|
| |||||||
| INVESTMENTS | SHARES (000) | VALUE ($000) | ||||||
Regional Malls — 1.0% | ||||||||
Simon Property Group, Inc., REIT | 173 | 19,529 | ||||||
|
| |||||||
Shopping Centers — 11.5% | ||||||||
Brixmor Property Group, Inc., REIT | 2,997 | 58,986 | ||||||
Federal Realty Investment Trust, REIT | 378 | 38,242 | ||||||
Kimco Realty Corp., REIT | 2,961 | 54,267 | ||||||
Weingarten Realty Investors, REIT | 2,699 | 68,519 | ||||||
|
| |||||||
| 220,014 | ||||||||
|
| |||||||
Storage — 4.7% | ||||||||
Public Storage, REIT | 384 | 89,798 | ||||||
|
| |||||||
Total Common Stocks | 1,938,402 | |||||||
|
| |||||||
Short-Term Investments — 1.1% |
| |||||||
Investment Companies — 1.1% |
| |||||||
JPMorgan Prime Money Market Fund Class IM Shares, 0.10% (a) (b) | 21,022 | 21,034 | ||||||
|
| |||||||
Total Investments — 102.6% | 1,959,436 | |||||||
Liabilities in Excess of Other Assets — (2.6)% | (50,315 | ) | ||||||
|
| |||||||
NET ASSETS — 100.0% | 1,909,121 | |||||||
|
| |||||||
Percentages indicated are based on net assets.
| Abbreviations | ||
| REIT | Real Estate Investment Trust | |
| (a) | Investment in an affiliated fund, which is registered under the Investment Company Act of 1940, as amended, and is advised by J.P. Morgan Investment Management Inc. | |
| (b) | The rate shown is the current yield as of February 28, 2021. | |
| * | Non-income producing security. | |
SEE NOTES TO FINANCIAL STATEMENTS.
| FEBRUARY 28, 2021 | UNDISCOVERED MANAGERS FUNDS | 5 | ||||||||
Table of Contents
STATEMENT OF ASSETS AND LIABILITIES
AS OF FEBRUARY 28, 2021
(Amounts in thousands, except per share amounts)
| JPMorgan Realty Income Fund | ||||
ASSETS: | ||||
Investments in non-affiliates, at value | $ | 1,938,402 | ||
Investments in affiliates, at value | 21,034 | |||
Cash | 5 | |||
Receivables: | ||||
Investment securities sold | 19,236 | |||
Fund shares sold | 7,647 | |||
Dividends from non-affiliates | 1,725 | |||
|
| |||
Total Assets | 1,988,049 | |||
|
| |||
LIABILITIES: | ||||
Payables: | ||||
Investment securities purchased | 22,574 | |||
Fund shares redeemed | 55,170 | |||
Accrued liabilities: | ||||
Investment advisory fees | 893 | |||
Administration fees | 108 | |||
Distribution fees | 5 | |||
Service fees | 36 | |||
Custodian and accounting fees | 12 | |||
Other | 130 | |||
|
| |||
Total Liabilities | 78,928 | |||
|
| |||
Net Assets | $ | 1,909,121 | ||
|
| |||
SEE NOTES TO FINANCIAL STATEMENTS.
| 6 | UNDISCOVERED MANAGERS FUNDS | FEBRUARY 28, 2021 | ||||||||
Table of Contents
| JPMorgan Realty Income Fund | ||||
NET ASSETS: |
| |||
Paid-in-Capital | $ | 1,624,890 | ||
Total distributable earnings (loss) | 284,231 | |||
|
| |||
Total Net Assets | $ | 1,909,121 | ||
|
| |||
Net Assets: | ||||
Class A | $ | 18,339 | ||
Class C | 2,106 | |||
Class I | 178,416 | |||
Class L | 36,803 | |||
Class R5 | 9,756 | |||
Class R6 | 1,663,701 | |||
|
| |||
Total | $ | 1,909,121 | ||
|
| |||
Outstanding units of beneficial interest (shares) | ||||
($0.0001 par value; unlimited number of shares authorized): | ||||
Class A | 1,365 | |||
Class C | 163 | |||
Class I | 13,121 | |||
Class L | 2,702 | |||
Class R5 | 712 | |||
Class R6 | 122,017 | |||
Net Asset Value (a): | ||||
Class A — Redemption price per share | $ | 13.44 | ||
Class C — Offering price per share (b) | 12.88 | |||
Class I — Offering and redemption price per share | 13.60 | |||
Class L — Offering and redemption price per share | 13.62 | |||
Class R5 — Offering and redemption price per share | 13.70 | |||
Class R6 — Offering and redemption price per share | 13.64 | |||
Class A maximum sales charge | 5.25 | % | ||
Class A maximum public offering price per share | $ | 14.18 | ||
|
| |||
Cost of investments in non-affiliates | $ | 1,589,687 | ||
Cost of investments in affiliates | 21,034 | |||
| (a) | Per share amounts may not recalculate due to rounding of net assets and/or shares outstanding. |
| (b) | Redemption price for Class C Shares varies based upon length of time the shares are held. |
SEE NOTES TO FINANCIAL STATEMENTS.
| FEBRUARY 28, 2021 | UNDISCOVERED MANAGERS FUNDS | 7 | ||||||||
Table of Contents
STATEMENT OF OPERATIONS
FOR THE YEAR ENDED FEBRUARY 28, 2021
(Amounts in thousands)
| JPMorgan Realty Income Fund | ||||
INVESTMENT INCOME: | ||||
Interest income from non-affiliates | $ | 1 | ||
Dividend income from non-affiliates | 35,335 | |||
Dividend income from affiliates | 96 | |||
|
| |||
Total investment income | 35,432 | |||
|
| |||
EXPENSES: | ||||
Investment advisory fees | 9,054 | |||
Administration fees | 1,132 | |||
Distribution fees: | ||||
Class A | 49 | |||
Class C | 17 | |||
Service fees: | ||||
Class A | 49 | |||
Class C | 6 | |||
Class I | 175 | |||
Class L | 34 | |||
Class R5 | 10 | |||
Custodian and accounting fees | 48 | |||
Professional fees | 70 | |||
Trustees’ and Chief Compliance Officer’s fees | 29 | |||
Printing and mailing costs | 16 | |||
Registration and filing fees | 173 | |||
Transfer agency fees (See Note 2.E.) | 35 | |||
Other | 40 | |||
|
| |||
Total expenses | 10,937 | |||
|
| |||
Less fees waived | (372 | ) | ||
Less expense reimbursements | (4 | ) | ||
|
| |||
Net expenses | 10,561 | |||
|
| |||
Net investment income (loss) | 24,871 | |||
|
| |||
REALIZED/UNREALIZED GAINS (LOSSES): | ||||
Net realized gain (loss) on transactions from: | ||||
Investments in non-affiliates | (60,486 | ) | ||
Investments in affiliates | 6 | |||
|
| |||
Net realized gain (loss) | (60,480 | ) | ||
|
| |||
Change in net unrealized appreciation/depreciation on: | ||||
Investments in non-affiliates | 159,878 | |||
Investments in affiliates | (10 | ) | ||
|
| |||
Change in net unrealized appreciation/depreciation | 159,868 | |||
|
| |||
Net realized/unrealized gains (losses) | 99,388 | |||
|
| |||
Change in net assets resulting from operations | $ | 124,259 | ||
|
| |||
SEE NOTES TO FINANCIAL STATEMENTS.
| 8 | UNDISCOVERED MANAGERS FUNDS | FEBRUARY 28, 2021 | ||||||||
Table of Contents
STATEMENTS OF CHANGES IN NET ASSETS
FOR THE PERIODS INDICATED
(Amounts in thousands)
| JPMorgan Realty Income Fund | ||||||||
| Year Ended February 28, 2021 | Year Ended February 29, 2020 | |||||||
CHANGE IN NET ASSETS RESULTING FROM OPERATIONS: |
| |||||||
Net investment income (loss) | $ | 24,871 | $ | 39,437 | ||||
Net realized gain (loss) | (60,480 | ) | 356,232 | |||||
Change in net unrealized appreciation/depreciation | 159,868 | (148,792 | ) | |||||
|
|
|
| |||||
Change in net assets resulting from operations | 124,259 | 246,877 | ||||||
|
|
|
| |||||
DISTRIBUTIONS TO SHAREHOLDERS: | ||||||||
Class A | (751 | ) | (3,850 | ) | ||||
Class C | (71 | ) | (327 | ) | ||||
Class I | (5,790 | ) | (965 | ) | ||||
Class L | (1,510 | ) | (3,685 | ) | ||||
Class R5 | (429 | ) | (1,236 | ) | ||||
Class R6 | (71,071 | ) | (124,566 | ) | ||||
|
|
|
| |||||
Total distributions to shareholders | (79,622 | ) | (134,629 | ) | ||||
|
|
|
| |||||
CAPITAL TRANSACTIONS: |
| |||||||
Change in net assets resulting from capital transactions | 486,014 | (1,238,356 | ) | |||||
|
|
|
| |||||
NET ASSETS: |
| |||||||
Change in net assets | 530,651 | (1,126,108 | ) | |||||
Beginning of period | 1,378,470 | 2,504,578 | ||||||
|
|
|
| |||||
End of period | $ | 1,909,121 | $ | 1,378,470 | ||||
|
|
|
| |||||
SEE NOTES TO FINANCIAL STATEMENTS.
| FEBRUARY 28, 2021 | UNDISCOVERED MANAGERS FUNDS | 9 | ||||||||
Table of Contents
STATEMENTS OF CHANGES IN NET ASSETS
FOR THE PERIODS INDICATED (continued)
(Amounts in thousands)
| JPMorgan Realty Income Fund | ||||||||
| Year Ended February 28, 2021 | Year Ended February 29, 2020 | |||||||
CAPITAL TRANSACTIONS: | ||||||||
Class A | ||||||||
Proceeds from shares issued | $ | 8,525 | $ | 18,830 | ||||
Distributions reinvested | 746 | 3,682 | ||||||
Cost of shares redeemed | (18,117 | ) | (154,714 | ) | ||||
|
|
|
| |||||
Change in net assets resulting from Class A capital transactions | (8,846 | ) | (132,202 | ) | ||||
|
|
|
| |||||
Class C | ||||||||
Proceeds from shares issued | 398 | 1,244 | ||||||
Distributions reinvested | 70 | 321 | ||||||
Cost of shares redeemed | (1,880 | ) | (833 | ) | ||||
|
|
|
| |||||
Change in net assets resulting from Class C capital transactions | (1,412 | ) | 732 | |||||
|
|
|
| |||||
Class I | ||||||||
Proceeds from shares issued | 178,785 | 21,806 | ||||||
Distributions reinvested | 5,790 | 965 | ||||||
Cost of shares redeemed | (19,149 | ) | (75,266 | ) | ||||
|
|
|
| |||||
Change in net assets resulting from Class I capital transactions | 165,426 | (52,495 | ) | |||||
|
|
|
| |||||
Class L | ||||||||
Proceeds from shares issued | 3,858 | 2,728 | ||||||
Distributions reinvested | 1,499 | 3,620 | ||||||
Cost of shares redeemed | (7,797 | ) | (18,897 | ) | ||||
|
|
|
| |||||
Change in net assets resulting from Class L capital transactions | (2,440 | ) | (12,549 | ) | ||||
|
|
|
| |||||
Class R5 | ||||||||
Proceeds from shares issued | 1,068 | 2,022 | ||||||
Distributions reinvested | 419 | 1,141 | ||||||
Cost of shares redeemed | (4,662 | ) | (3,042 | ) | ||||
|
|
|
| |||||
Change in net assets resulting from Class R5 capital transactions | (3,175 | ) | 121 | |||||
|
|
|
| |||||
Class R6 | ||||||||
Proceeds from shares issued | 472,375 | 70,497 | ||||||
Distributions reinvested | 71,071 | 124,564 | ||||||
Cost of shares redeemed | (206,985 | ) | (803,435 | ) | ||||
Redemptions in-kind (See Note 8) | — | (433,589 | ) | |||||
|
|
|
| |||||
Change in net assets resulting from Class R6 capital transactions | 336,461 | (1,041,963 | ) | |||||
|
|
|
| |||||
Total change in net assets resulting from capital transactions | $ | 486,014 | $ | (1,238,356 | ) | |||
|
|
|
| |||||
SEE NOTES TO FINANCIAL STATEMENTS.
| 10 | UNDISCOVERED MANAGERS FUNDS | FEBRUARY 28, 2021 | ||||||||
Table of Contents
| JPMorgan Realty Income Fund | ||||||||
| Year Ended February 28, 2021 | Year Ended February 29, 2020 | |||||||
SHARE TRANSACTIONS: |
| |||||||
Class A |
| |||||||
Issued | 682 | 1,285 | ||||||
Reinvested | 60 | 263 | ||||||
Redeemed | (1,458 | ) | (10,348 | ) | ||||
|
|
|
| |||||
Change in Class A Shares | (716 | ) | (8,800 | ) | ||||
|
|
|
| |||||
Class C |
| |||||||
Issued | 31 | 88 | ||||||
Reinvested | 6 | 24 | ||||||
Redeemed | (169 | ) | (60 | ) | ||||
|
|
|
| |||||
Change in Class C Shares | (132 | ) | 52 | |||||
|
|
|
| |||||
Class I |
| |||||||
Issued | 13,857 | 1,460 | ||||||
Reinvested | 449 | 68 | ||||||
Redeemed | (1,545 | ) | (5,021 | ) | ||||
|
|
|
| |||||
Change in Class I Shares | 12,761 | (3,493 | ) | |||||
|
|
|
| |||||
Class L |
| |||||||
Issued | 298 | 187 | ||||||
Reinvested | 118 | 255 | ||||||
Redeemed | (628 | ) | (1,247 | ) | ||||
|
|
|
| |||||
Change in Class L Shares | (212 | ) | (805 | ) | ||||
|
|
|
| |||||
Class R5 |
| |||||||
Issued | 86 | 135 | ||||||
Reinvested | 33 | 80 | ||||||
Redeemed | (383 | ) | (206 | ) | ||||
|
|
|
| |||||
Change in Class R5 Shares | (264 | ) | 9 | |||||
|
|
|
| |||||
Class R6 |
| |||||||
Issued | 36,972 | 4,836 | ||||||
Reinvested | 5,579 | 8,770 | ||||||
Redeemed | (15,686 | ) | (54,044 | ) | ||||
Redemptions in-kind (See Note 8) | — | (28,010 | ) | |||||
|
|
|
| |||||
Change in Class R6 Shares | 26,865 | (68,448 | ) | |||||
|
|
|
| |||||
SEE NOTES TO FINANCIAL STATEMENTS.
| FEBRUARY 28, 2021 | UNDISCOVERED MANAGERS FUNDS | 11 | ||||||||
Table of Contents
FOR THE PERIODS INDICATED
| Per share operating performance |
| ||||||||||||||||||||||||||
| Investment operations | Distributions | |||||||||||||||||||||||||||
| Net asset value, beginning of period | Net investment income (loss) (b) | Net realized and unrealized gains (losses) on investments | Total from investment operations | Net investment income | Net realized gain | Total distributions | ||||||||||||||||||||||
JPMorgan Realty Income Fund | ||||||||||||||||||||||||||||
Class A | ||||||||||||||||||||||||||||
Year Ended February 28, 2021 | $ | 13.37 | $ | 0.16 | $ | 0.44 | $ | 0.60 | $ | (0.12 | ) | $ | (0.41 | ) | $ | (0.53 | ) | |||||||||||
Year Ended February 29, 2020 | 13.48 | 0.20 | 0.87 | 1.07 | (0.19 | ) | (0.99 | ) | (1.18 | ) | ||||||||||||||||||
September 1, 2018 through February 28, 2019 (f) | 13.38 | 0.09 | 0.14 | 0.23 | (0.13 | ) | — | (0.13 | ) | |||||||||||||||||||
Year Ended August 31, 2018 | 13.05 | 0.24 | 0.31 | 0.55 | (0.22 | ) | — | (0.22 | ) | |||||||||||||||||||
Year Ended August 31, 2017 | 14.67 | 0.19 | (0.82 | ) | (0.63 | ) | (0.24 | ) | (0.75 | ) | (0.99 | ) | ||||||||||||||||
Year Ended August 31, 2016 | 12.95 | 0.20 | 2.42 | 2.62 | (0.17 | ) | (0.73 | ) | (0.90 | ) | ||||||||||||||||||
Class C | ||||||||||||||||||||||||||||
Year Ended February 28, 2021 | 12.82 | 0.10 | 0.42 | 0.52 | (0.05 | ) | (0.41 | ) | (0.46 | ) | ||||||||||||||||||
Year Ended February 29, 2020 | 13.01 | 0.12 | 0.85 | 0.97 | (0.17 | ) | (0.99 | ) | (1.16 | ) | ||||||||||||||||||
September 1, 2018 through February 28, 2019 (f) | 12.93 | 0.06 | 0.13 | 0.19 | (0.11 | ) | — | (0.11 | ) | |||||||||||||||||||
Year Ended August 31, 2018 | 12.61 | 0.18 | 0.30 | 0.48 | (0.16 | ) | — | (0.16 | ) | |||||||||||||||||||
Year Ended August 31, 2017 | 14.27 | 0.13 | (0.82 | ) | (0.69 | ) | (0.22 | ) | (0.75 | ) | (0.97 | ) | ||||||||||||||||
Year Ended August 31, 2016 | 12.64 | 0.12 | 2.36 | 2.48 | (0.12 | ) | (0.73 | ) | (0.85 | ) | ||||||||||||||||||
Class I | ||||||||||||||||||||||||||||
Year Ended February 28, 2021 | 13.53 | 0.17 | 0.48 | 0.65 | (0.17 | ) | (0.41 | ) | (0.58 | ) | ||||||||||||||||||
Year Ended February 29, 2020 | 13.64 | 0.24 | 0.87 | 1.11 | (0.23 | ) | (0.99 | ) | (1.22 | ) | ||||||||||||||||||
September 1, 2018 through February 28, 2019 (f) | 13.53 | 0.11 | 0.15 | 0.26 | (0.15 | ) | — | (0.15 | ) | |||||||||||||||||||
Year Ended August 31, 2018 | 13.23 | 0.28 | 0.31 | 0.59 | (0.29 | ) | — | (0.29 | ) | |||||||||||||||||||
March 1, 2017 (g) through August 31, 2017 | 13.22 | 0.07 | (0.06 | ) | 0.01 | — | — | — | ||||||||||||||||||||
Class L | ||||||||||||||||||||||||||||
Year Ended February 28, 2021 | 13.53 | 0.20 | 0.47 | 0.67 | (0.17 | ) | (0.41 | ) | (0.58 | ) | ||||||||||||||||||
Year Ended February 29, 2020 | 13.67 | 0.27 | 0.86 | 1.13 | (0.28 | ) | (0.99 | ) | (1.27 | ) | ||||||||||||||||||
September 1, 2018 through February 28, 2019 (f) | 13.55 | 0.12 | 0.15 | 0.27 | (0.15 | ) | — | (0.15 | ) | |||||||||||||||||||
Year Ended August 31, 2018 | 13.23 | 0.30 | 0.31 | 0.61 | (0.29 | ) | — | (0.29 | ) | |||||||||||||||||||
Year Ended August 31, 2017 | 14.82 | 0.25 | (0.83 | ) | (0.58 | ) | (0.26 | ) | (0.75 | ) | (1.01 | ) | ||||||||||||||||
Year Ended August 31, 2016 | 13.07 | 0.25 | 2.44 | 2.69 | (0.21 | ) | (0.73 | ) | (0.94 | ) | ||||||||||||||||||
Class R5 | ||||||||||||||||||||||||||||
Year Ended February 28, 2021 | 13.61 | 0.21 | 0.46 | 0.67 | (0.17 | ) | (0.41 | ) | (0.58 | ) | ||||||||||||||||||
Year Ended February 29, 2020 | 13.73 | 0.27 | 0.89 | 1.16 | (0.29 | ) | (0.99 | ) | (1.28 | ) | ||||||||||||||||||
September 1, 2018 through February 28, 2019 (f) | 13.62 | 0.13 | 0.13 | 0.26 | (0.15 | ) | — | (0.15 | ) | |||||||||||||||||||
Year Ended August 31, 2018 | 13.30 | 0.30 | 0.32 | 0.62 | (0.30 | ) | — | (0.30 | ) | |||||||||||||||||||
Year Ended August 31, 2017 | 14.89 | 0.26 | (0.84 | ) | (0.58 | ) | (0.26 | ) | (0.75 | ) | (1.01 | ) | ||||||||||||||||
Year Ended August 31, 2016 | 13.08 | 0.24 | 2.47 | 2.71 | (0.17 | ) | (0.73 | ) | (0.90 | ) | ||||||||||||||||||
Class R6 | ||||||||||||||||||||||||||||
Year Ended February 28, 2021 | 13.55 | 0.21 | 0.47 | 0.68 | (0.18 | ) | (0.41 | ) | (0.59 | ) | ||||||||||||||||||
Year Ended February 29, 2020 | 13.68 | 0.28 | 0.88 | 1.16 | (0.30 | ) | (0.99 | ) | (1.29 | ) | ||||||||||||||||||
September 1, 2018 through February 28, 2019 (f) | 13.56 | 0.13 | 0.15 | 0.28 | (0.16 | ) | — | (0.16 | ) | |||||||||||||||||||
Year Ended August 31, 2018 | 13.26 | 0.30 | 0.31 | 0.61 | (0.31 | ) | — | (0.31 | ) | |||||||||||||||||||
Year Ended August 31, 2017 | 14.84 | 0.26 | (0.83 | ) | (0.57 | ) | (0.26 | ) | (0.75 | ) | (1.01 | ) | ||||||||||||||||
November 2, 2015 (g) through August 31, 2016 | 14.55 | 0.23 | 0.96 | 1.19 | (0.17 | ) | (0.73 | ) | (0.90 | ) | ||||||||||||||||||
| (a) | Annualized for periods less than one year, unless otherwise noted. |
| (b) | Calculated based upon average shares outstanding. |
| (c) | Not annualized for periods less than one year. |
| (d) | Includes adjustments in accordance with accounting principles generally accepted in the United States of America and as such, the net asset values for financial reporting purposes and the returns based upon those net asset values may differ from the net asset values and returns for shareholder transactions. |
| (e) | Includes earnings credits and interest expense, if applicable, each of which is less than 0.005% unless otherwise noted. |
| (f) | The Fund changed its fiscal year end from August 31st to the last day of February. |
| (g) | Commencement of offering of class of shares. |
SEE NOTES TO FINANCIAL STATEMENTS.
| 12 | UNDISCOVERED MANAGERS FUNDS | FEBRUARY 28, 2021 | ||||||||
Table of Contents
| Ratios/Supplemental data | |||||||||||||||||||||||||
| Ratios to average net assets (a) | ||||||||||||||||||||||||||
| Net asset value, end of period | Total return (excludes sales charge) (c)(d) | Net assets, end of period (000’s) | Net expenses (e) | Net investment income (loss) | Expenses without waivers, reimbursements and earnings credits | Portfolio turnover rate (c) | ||||||||||||||||||||
| $ | 13.44 | 4.81 | % | $ | 18,339 | 1.17 | % | 1.28 | % | 1.29 | % | 90 | % | |||||||||||||
| 13.37 | 7.70 | 27,818 | 1.18 | 1.36 | 1.29 | 71 | ||||||||||||||||||||
| 13.48 | 1.83 | 146,677 | 1.17 | 1.50 | 1.36 | 50 | ||||||||||||||||||||
| 13.38 | 4.31 | 167,082 | 1.18 | 1.87 | 1.36 | 107 | ||||||||||||||||||||
| 13.05 | (3.99 | ) | 170,609 | 1.18 | 1.46 | 1.41 | 116 | |||||||||||||||||||
| 14.67 | 21.23 | 183,703 | 1.18 | 1.45 | 1.47 | 141 | ||||||||||||||||||||
| 12.88 | 4.29 | 2,106 | 1.67 | 0.84 | 1.77 | 90 | ||||||||||||||||||||
| 12.82 | 7.15 | 3,786 | 1.68 | 0.84 | 1.77 | 71 | ||||||||||||||||||||
| 13.01 | 1.55 | 3,165 | 1.68 | 1.00 | 1.87 | 50 | ||||||||||||||||||||
| 12.93 | 3.85 | 3,873 | 1.68 | 1.42 | 1.91 | 107 | ||||||||||||||||||||
| 12.61 | (4.53 | ) | 6,180 | 1.67 | 1.05 | 1.96 | 116 | |||||||||||||||||||
| 14.27 | 20.56 | 10,842 | 1.68 | 0.93 | 1.98 | 141 | ||||||||||||||||||||
| 13.60 | 5.12 | 178,416 | 0.93 | 1.29 | 0.95 | 90 | ||||||||||||||||||||
| 13.53 | 7.86 | 4,866 | 0.93 | 1.64 | 1.03 | 71 | ||||||||||||||||||||
| 13.64 | 1.98 | 52,540 | 0.92 | 1.70 | 1.10 | 50 | ||||||||||||||||||||
| 13.53 | 4.63 | 25,725 | 0.92 | 2.21 | 1.10 | 107 | ||||||||||||||||||||
| 13.23 | 0.08 | 272 | 0.78 | 1.11 | 0.97 | 116 | ||||||||||||||||||||
| 13.62 | 5.27 | 36,803 | 0.78 | 1.61 | 0.80 | 90 | ||||||||||||||||||||
| 13.53 | 8.05 | 39,435 | 0.78 | 1.80 | 0.86 | 71 | ||||||||||||||||||||
| 13.67 | 2.09 | 50,819 | 0.78 | 1.92 | 0.96 | 50 | ||||||||||||||||||||
| 13.55 | 4.74 | 60,464 | 0.78 | 2.29 | 0.97 | 107 | ||||||||||||||||||||
| 13.23 | (3.62 | ) | 59,320 | 0.78 | 1.92 | 0.98 | 116 | |||||||||||||||||||
| 14.82 | 21.64 | 124,676 | 0.78 | 1.84 | 0.98 | 141 | ||||||||||||||||||||
| 13.70 | 5.23 | 9,756 | 0.78 | 1.63 | 0.81 | 90 | ||||||||||||||||||||
| 13.61 | 8.22 | 13,284 | 0.74 | 1.81 | 0.86 | 71 | ||||||||||||||||||||
| 13.73 | 2.03 | 13,280 | 0.72 | 1.94 | 0.96 | 50 | ||||||||||||||||||||
| 13.62 | 4.81 | 13,167 | 0.73 | 2.31 | 0.95 | 107 | ||||||||||||||||||||
| 13.30 | (3.59 | ) | 24,380 | 0.73 | 1.93 | 0.97 | 116 | |||||||||||||||||||
| 14.89 | 21.71 | 30,288 | 0.73 | 1.73 | 0.91 | 141 | ||||||||||||||||||||
| 13.64 | 5.38 | 1,663,701 | 0.68 | 1.67 | 0.70 | 90 | ||||||||||||||||||||
| 13.55 | 8.23 | 1,289,281 | 0.68 | 1.92 | 0.76 | 71 | ||||||||||||||||||||
| 13.68 | 2.13 | 2,238,097 | 0.67 | 1.99 | 0.85 | 50 | ||||||||||||||||||||
| 13.56 | 4.79 | 2,325,640 | 0.68 | 2.34 | 0.85 | 107 | ||||||||||||||||||||
| 13.26 | (3.51 | ) | 2,307,377 | 0.68 | 1.94 | 0.86 | 116 | |||||||||||||||||||
| 14.84 | 9.09 | 1,949,770 | 0.68 | 2.00 | 0.86 | 141 | ||||||||||||||||||||
SEE NOTES TO FINANCIAL STATEMENTS.
| FEBRUARY 28, 2021 | UNDISCOVERED MANAGERS FUNDS | 13 | ||||||||
Table of Contents
AS OF FEBRUARY 28, 2021
(Dollar values in thousands)
1. Organization
Undiscovered Managers Funds (the “Trust”) was organized on September 29, 1997, as a Massachusetts business trust and is registered under the Investment Company Act of 1940, as amended (the “1940 Act”), as an open-end management investment company.
The following is a separate fund of the Trust (the “Fund”) covered by this report:
| Classes Offered | Diversification Classification | |||
| JPMorgan Realty Income Fund | Class A, Class C, Class I, Class L, Class R5 and Class R6 | Non-Diversified |
The investment objective of the Fund is high total investment return through a combination of capital appreciation and current income.
Class L Shares of the Fund are publicly offered on a limited basis. Investors are not eligible to purchase Class L Shares of the Fund unless they meet certain requirements as described in the Fund’s prospectuses.
Class A Shares generally provide for a front-end sales charge while Class C Shares provide for a contingent deferred sales charge (“CDSC”). No sales charges are assessed with respect to Class I, Class L, Class R5 and Class R6 Shares. Certain Class A Shares, for which front-end sales charges have been waived, may be subject to a CDSC as described in the Fund’s prospectus. Effective October 1, 2020, Class C Shares automatically convert to Class A Shares after eight years. Prior to October 1, 2020, Class C Shares automatically converted to Class A Shares after ten years. All classes of shares have equal rights as to earnings, assets and voting privileges, except that each class may bear different transfer agency, distribution and service fees and each class has exclusive voting rights with respect to its distribution plan and shareholder servicing agreements.
J.P. Morgan Investment Management Inc. (“JPMIM”), an indirect, wholly-owned subsidiary of JPMorgan Chase & Co. (“JPMorgan”), acts as Adviser (the “Adviser”) and Administrator (the “Administrator”) to the Fund.
2. Significant Accounting Policies
The following is a summary of significant accounting policies followed by the Fund in the preparation of its financial statements. The Fund is an investment company and, accordingly, follows the investment company accounting and reporting guidance of the Financial Accounting Standards Board (“FASB”) Accounting Standards Codification Topic 946 — Investment Companies, which is part of U.S. generally accepted accounting principles (“GAAP”). The preparation of financial statements in conformity with GAAP requires management to make estimates and assumptions that affect (i) the reported amounts of assets and liabilities, (ii) disclosure of contingent assets and liabilities at the date of the financial statements, and (iii) the reported amounts of increases and decreases in net assets from operations during the reporting period. Actual results could differ from those estimates.
A. Valuation of Investments — Investments are valued in accordance with GAAP and the Fund’s valuation policies set forth by, and under the supervision and responsibility of, the Board of Trustees of the Trust (the “Board”), which established the following approach to valuation, as described more fully below: (i) investments for which market quotations are readily available shall be valued at their market value and (ii) all other investments for which market quotations are not readily available shall be valued at their fair value as determined in good faith by the Board.
The Administrator has established the J.P. Morgan Asset Management Americas Valuation Committee (“AVC”) to assist the Board with the oversight and monitoring of the valuation of the Fund’s investments. The Administrator implements the valuation policies of the Fund’s investments, as directed by the Board. The AVC oversees and carries out the policies for the valuation of investments held in the Fund. This includes monitoring the appropriateness of fair values based on results of ongoing valuation oversight including, but not limited to, consideration of macro or security specific events, market events, and pricing vendor and broker due diligence. The Administrator is responsible for discussing and assessing the potential impacts to the fair values on an ongoing basis, and, at least on a quarterly basis, with the AVC and the Board.
Equities and other exchange-traded instruments are valued at the last sale price or official market closing price on the primary exchange on which the instrument is traded before the net asset values (“NAV”) of the Fund are calculated on a valuation date.
Investments in open-end investment companies (“Underlying Funds”) are valued at each Underlying Fund’s NAV per share as of the report date.
Valuations reflected in this report are as of the report date. As a result, changes in valuation due to market events and/or issuer-related events after the report date and prior to issuance of the report are not reflected herein.
The various inputs that are used in determining the valuation of the Fund’s investments are summarized into the three broad levels listed below.
| • | Level 1 — Unadjusted inputs using quoted prices in active markets for identical investments. |
| • | Level 2 — Other significant observable inputs including, but not limited to, quoted prices for similar investments, inputs other than quoted prices that are observable for investments (such as interest rates, prepayment speeds, credit risk, etc.) or other market corroborated inputs. |
| • | Level 3 — Significant inputs based on the best information available in the circumstances, to the extent observable inputs are not available (including the Fund’s assumptions in determining the fair value of investments). |
A financial instrument’s level within the fair value hierarchy is based on the lowest level of any input, both individually and in the aggregate, that is significant to the fair value measurement. The inputs or methodology used for valuing instruments are not necessarily an indication of the risk associated with investing in those instruments.
| 14 | UNDISCOVERED MANAGERS FUNDS | FEBRUARY 28, 2021 | ||||||||
Table of Contents
The following table represents each valuation input as presented on the Schedule of Portfolio Investments (“SOI”):
| Level 1 Quoted prices | Level 2 observable inputs | Level 3 unobservable inputs | Total | |||||||||||||
Total Investments in Securities (a) | $ | 1,959,436 | $ | — | $ | — | $ | 1,959,436 | ||||||||
|
|
|
|
|
|
|
| |||||||||
| (a) | Please refer to the SOI for specifics of portfolio holdings. |
B. Securities Lending — The Fund is authorized to engage in securities lending in order to generate additional income. The Fund is able to lend to approved borrowers. Citibank N.A. (“Citibank”) serves as lending agent for the Fund, pursuant to a Securities Lending Agency Agreement (the “Securities Lending Agency Agreement”). Securities loaned are collateralized by cash equal to at least 100% of the market value plus accrued interest on the securities lent, which is invested in an affiliated money market fund. The Fund retains loan fees and the interest on cash collateral investments but is required to pay the borrower a rebate for the use of cash collateral. In cases where the lent security is of high value to borrowers, there may be a negative rebate (i.e., a net payment from the borrower to the Fund). Upon termination of a loan, the Fund is required to return to the borrower an amount equal to the cash collateral, plus any rebate owed to the borrowers. The remaining maturities of the securities lending transactions are considered overnight and continuous. Loans are subject to termination by the Fund or the borrower at any time.
The net income earned on the securities lending (after payment of rebates and Citibank’s fee) is included on the Statement of Operations as Income from securities lending (net). The Fund also receives payments from the borrower during the period of the loan, equivalent to dividends and interest earned on the securities loaned, which are recorded as Dividend or Interest income, respectively, on the Statement of Operations.
Under the Securities Lending Agency Agreement, Citibank marks to market the loaned securities on a daily basis. In the event the cash received from the borrower is less than 102% of the value of the loaned securities (105% for loans of non-U.S. securities), Citibank requests additional cash from the borrower so as to maintain a collateralization level of at least 102% of the value of the loaned securities plus accrued interest (105% for loans of non-U.S. securities), subject to certain de minimis amounts.
The value of securities out on loan is recorded as an asset on the Statement of Assets and Liabilities. The value of the cash collateral received is recorded as a liability on the Statement of Assets and Liabilities and details of collateral investments are disclosed on the SOI.
The Fund bears the risk of loss associated with the collateral investments and is not entitled to additional collateral from the borrower to cover any such losses. To the extent that the value of the collateral investments declines below the amount owed to a borrower, the Fund may incur losses that exceed the amount it earned on lending the security. Upon termination of a loan, the Fund may use leverage (borrow money) to repay the borrower for cash collateral posted if the Adviser does not believe that it is prudent to sell the collateral investments to fund the payment of this liability. Securities lending activity is subject to master netting arrangements.
Securities lending also involves counterparty risks, including the risk that the loaned securities may not be returned in a timely manner or at all. Subject to certain conditions, Citibank has agreed to indemnify the Fund from losses resulting from a borrower’s failure to return a loaned security.
The Fund did not lend out any securities during the year ended February 28, 2021.
C. Investment Transactions with Affiliates — The Fund invested in an Underlying Fund which is advised by the Adviser. An issuer which is under common control with the Fund may be considered an affiliate. For the purposes of the financial statements, the Fund assumes the issuer listed in the table below to be an affiliated issuer. Underlying Fund’s distributions may be reinvested into the Underlying Fund. Reinvestment amounts are included in the purchase cost amounts in the table below.
| For the year ended February 28, 2021 | ||||||||||||||||||||||||||||||||||||
| Security Description | Value at February 29, 2020 | Purchases at Cost | Proceeds from Sales | Net Realized Gain (Loss) | Change in Unrealized Appreciation/ (Depreciation) | Value at February 28, 2021 | Shares at February 28, 2021 | Dividend Income | Capital Gain Distributions | |||||||||||||||||||||||||||
JPMorgan Prime Money Market Fund Class IM Shares, 0.10% (a) (b) | $ | 47,563 | $ | 928,882 | $ | 955,407 | $ | 6 | $ | (10 | ) | $ | 21,034 | 21,022 | $ | 96 | $ | — | ||||||||||||||||||
|
|
|
|
|
|
|
|
|
|
|
|
|
|
|
| |||||||||||||||||||||
| (a) | Investment in an affiliated fund, which is registered under the Investment Company Act of 1940, as amended, and is advised by J.P. Morgan Investment Management Inc. |
| (b) | The rate shown is the current yield as of February 28, 2021. |
D. Security Transactions and Investment Income — Investment transactions are accounted for on the trade date (the date the order to buy or sell is executed). Securities gains and losses are calculated on a specifically identified cost basis. Dividend income, net of foreign taxes withheld, if any, is recorded on the ex-dividend date or when the Fund first learns of the dividend.
| FEBRUARY 28, 2021 | UNDISCOVERED MANAGERS FUNDS | 15 | ||||||||
Table of Contents
NOTES TO FINANCIAL STATEMENTS
AS OF FEBRUARY 28, 2021 (continued)
(Dollar values in thousands)
To the extent such information is publicly available, the Fund records distributions received in excess of income earned from underlying investments as a reduction of cost of investments and/or realized gain. Such amounts are based on estimates if actual amounts are not available and actual amounts of income, realized gain and return of capital may differ from the estimated amounts. The Fund adjusts the estimated amounts of the components of distributions (and consequently its net investment income) as necessary, once the issuers provide information about the actual composition of the distributions.
E. Allocation of Income and Expenses — Expenses directly attributable to the Fund are charged directly to the Fund, while the expenses attributable to more than one fund of the Trust are allocated among the applicable funds. Investment income, realized and unrealized gains and losses and expenses, other than class-specific expenses, are allocated daily to each class of shares based upon the proportion of net assets of each class at the beginning of each day.
Transfer agency fees are class-specific expenses. The amount of the transfer agency fees charged to each share class of the Fund for the year ended February 28, 2021 are as follows:
| Class A | Class C | Class I | Class L | Class R5 | Class R6 | Total | ||||||||||||||||||||||
Transfer agency fees | $ | 18 | $ | 2 | $ | 4 | $ | 2 | $ | 1 | $ | 8 | $ | 35 | ||||||||||||||
F. Federal Income Taxes — The Fund is treated as a separate taxable entity for Federal income tax purposes. The Fund’s policy is to comply with the provisions of the Internal Revenue Code (the “Code”) applicable to regulated investment companies and to distribute to shareholders all of its distributable net investment income and net realized capital gains on investments. Accordingly, no provision for Federal income tax is necessary. Management has reviewed the Fund’s tax positions for all open tax years and has determined that as of February 28, 2021, no liability for Federal income tax is required in the Fund’s financial statements for net unrecognized tax benefits. However, management’s conclusions may be subject to future review based on changes in, or the interpretation of, the accounting standards or tax laws and regulations. The Fund’s Federal tax returns for the prior three fiscal years remain subject to examination by the Internal Revenue Service.
G. Distributions to Shareholders — Distributions from net investment income, if any, are generally declared and paid at least quarterly and are declared separately for each class. No class has preferential dividend rights; differences in per share rates are due to differences in separate class expenses. Net realized capital gains, if any, are distributed at least annually. The amount of distributions from net investment income and net realized capital gains is determined in accordance with Federal income tax regulations, which may differ from GAAP. To the extent these “book/tax” differences are permanent in nature (i.e., that they result from other than timing of recognition — “temporary differences”), such amounts are reclassified within the capital accounts based on their Federal tax basis treatment.
The following amounts were reclassified within the capital accounts:
| Paid-in-Capital | Accumulated undistributed (distributions in excess of) net investment income | Accumulated net realized gains (losses) | ||||||||||
| $ | (53 | ) | $ | (1 | ) | $ | 54 | |||||
The reclassifications for the Fund relate primarily to tax equalization.
H. Recent Accounting Pronouncement — In March 2020, the FASB issued Accounting Standards Update No. 2020-04 (“ASU 2020-04”), Reference Rate Reform (Topic 848) — Facilitation of the Effects of Reference Rate Reform on Financial Reporting. ASU 2020-04 provides optional temporary financial reporting relief from the effect of certain types of contract modifications due to the planned discontinuation of the London Interbank Offered Rate (“LIBOR”) and other interbank-offered based reference rates as of the end of 2021. ASU 2020-04 became effective upon the issuance and its optional relief can be applied through December 31, 2022. Management is currently evaluating the impact, if any, to the Fund’s financial statements of applying ASU 2020-04.
3. Fees and Other Transactions with Affiliates
A. Investment Advisory Fee — Pursuant to an Investment Advisory Agreement, the Adviser manages the investments of the Fund and for such services is paid a fee. The investment advisory fee is accrued daily and paid monthly at an annual rate of 0.60% of the Fund’s average daily net assets.
The Adviser waived investment advisory fees and/or reimbursed expenses as outlined in Note 3.F.
B. Administration Fee — Pursuant to an Administration Agreement, the Administrator provides certain administration services to the Fund. In consideration of these services, the Administrator receives a fee accrued daily and paid monthly at an annual rate of 0.075% of the first $10 billion of the Fund’s average daily net assets, plus 0.050% of the Fund’s average daily net assets between $10 billion and $20 billion, plus 0.025% of the Fund’s average daily net assets between $20 billion and $25 billion, plus 0.01% of the Fund’s average daily net assets in excess of $25 billion. For the year ended February 28, 2021, the effective rate was 0.07% of the Fund’s average daily net assets, notwithstanding any fee waivers and/or expense reimbursements.
The Administrator waived administration fees as outlined in Note 3.F.
| 16 | UNDISCOVERED MANAGERS FUNDS | FEBRUARY 28, 2021 | ||||||||
Table of Contents
JPMorgan Chase Bank, N.A. (“JPMCB”), a wholly-owned subsidiary of JPMorgan, serves as the Fund’s sub-administrator (the “Sub-administrator”). For its services as Sub-administrator, JPMCB receives a portion of the fees payable to the Administrator.
C. Distribution Fees — Pursuant to a Distribution Agreement, JPMorgan Distribution Services, Inc. (“JPMDS”), an indirect, wholly-owned subsidiary of JPMorgan, serves as the Fund’s principal underwriter and promotes and arranges for the sale of the Fund’s shares.
The Board has adopted a Distribution Plan (the “Distribution Plan”) for Class A and Class C Shares of the Fund pursuant to Rule 12b-1 under the 1940 Act. Class I, Class L, Class R5 and Class R6 Shares of the Fund do not charge a distribution fee. The Distribution Plan provides that the Fund shall pay, with respect to the applicable share classes, distribution fees, including payments to JPMDS, at annual rates of the average daily net assets as shown in the table below:
| Class A | Class C | |||||
| 0.25% | 0.75 | % | ||||
In addition, JPMDS is entitled to receive the front-end sales charges from purchases of Class A Shares and the CDSC from redemptions of Class C Shares and certain Class A Shares for which front-end sales charges have been waived. For the year ended February 28, 2021, JPMDS retained the following:
| Front-End Sales Charge | CDSC | |||||
| $1 | $ | — | ||||
D. Service Fees — The Trust, on behalf of the Fund, has entered into a Shareholder Servicing Agreement with JPMDS under which JPMDS provides certain support services to fund shareholders. For performing these services, JPMDS receives a fee with respect to all share classes, except Class R6 Shares which do not charge a service fee, that is accrued daily and paid monthly equal to a percentage of the average daily net assets as shown in the table below:
| Class A | Class C | Class I | Class L | Class R5 | ||||||||||||||||
| 0.25 | % | 0.25 | % | 0.25 | % | 0.10 | % | 0.10 | % | |||||||||||
JPMDS has entered into shareholder services contracts with affiliated and unaffiliated financial intermediaries who provide shareholder services and other related services to their clients or customers who invest in the Fund. Pursuant to such contracts, JPMDS will pay all or a portion of such fees earned to financial intermediaries for performing such services.
JPMDS waived service fees as outlined in Note 3.F.
E. Custodian and Accounting Fees — JPMCB provides portfolio custody and accounting services to the Fund. For performing these services, the Fund pays JPMCB transaction and asset-based fees that vary according to the number of transactions and positions, plus out-of-pocket expenses. The amounts paid directly to JPMCB by the Fund for custody and accounting services are included in Custodian and accounting fees on the Statement of Operations.
Interest income earned on cash balances at the custodian, if any, is included in Interest income from affiliates on the Statement of Operations.
Interest expense paid to the custodian related to cash overdrafts, if any, is included in Interest expense to affiliates on the Statement of Operations.
F. Waivers and Reimbursements — The Adviser, Administrator and/or JPMDS have contractually agreed to waive fees and/or reimburse the Fund to the extent that total annual operating expenses (excluding acquired fund fees and expenses other than certain money market fund fees as described below, dividend and interest expenses related to short sales, interest, taxes, expenses related to litigation and potential litigation, expenses related to trustee elections and extraordinary expenses) exceed the percentages of the Fund’s respective average daily net assets as shown in the table below:
| Class A | Class C | Class I | Class L | Class R5 | Class R6 | |||||||||||||||||||
| 1.18 | % | 1.68 | % | 0.93 | % | 0.78 | % | 0.78 | % | 0.68 | % | |||||||||||||
The expense limitation agreement was in effect for the year ended February 28, 2021 and the contractual expense limitation percentages in the table above are in place until at least June 30, 2021.
For the year ended February 28, 2021, the Fund’s service providers waived fees and/or reimbursed expenses for the Fund as follows. None of these parties expect the Fund to repay any such waived fees and/or reimbursed expenses in future years.
| Contractual Waivers | ||||||||||||||||||||
| Investment Advisory Fees | Administration Fees | Service Fees | Total | Contractual Reimbursements | ||||||||||||||||
| $ | 183 | $ | 123 | $ | 24 | $ | 330 | $ | 4 | |||||||||||
Additionally, the Fund may invest in one or more money market funds advised by the Adviser (affiliated money market funds). The Adviser, Administrator and/or JPMDS, as shareholder servicing agent, have contractually agreed to waive fees and/or reimburse expenses in an amount sufficient
| FEBRUARY 28, 2021 | UNDISCOVERED MANAGERS FUNDS | 17 | ||||||||
Table of Contents
NOTES TO FINANCIAL STATEMENTS
AS OF FEBRUARY 28, 2021 (continued)
(Dollar values in thousands)
to offset the respective net fees each collects from the affiliated money market fund on the Fund’s investment in such affiliated money market fund, except for investments of securities lending cash collateral. None of these parties expect the Fund to repay any such waived fees and/or reimbursed expenses in future years.
The amount of these waivers resulting from investments in these money market funds for the year ended February 28, 2021 was $42.
G. Other — Certain officers of the Trust are affiliated with the Adviser, the Administrator and JPMDS. Such officers, with the exception of the Chief Compliance Officer, receive no compensation from the Fund for serving in their respective roles.
The Board designated and appointed a Chief Compliance Officer to the Fund pursuant to Rule 38a-1 under the 1940 Act. The Fund, along with affiliated funds, makes reimbursement payments, on a pro-rata basis, to the Administrator for a portion of the fees associated with the office of the Chief Compliance Officer. Such fees are included in Trustees’ and Chief Compliance Officer’s fees on the Statement of Operations.
The Trust adopted a Trustee Deferred Compensation Plan (the “Plan”) which allows the independent Trustees to defer the receipt of all or a portion of compensation related to performance of their duties as Trustees. The deferred fees are invested in various J.P. Morgan Funds until distribution in accordance with the Plan.
During the year ended February 28, 2021, the Fund purchased securities from an underwriting syndicate in which the principal underwriter or members of the syndicate were affiliated with the Adviser.
The Securities and Exchange Commission (“SEC”) has granted an exemptive order permitting the Fund to engage in principal transactions with J.P. Morgan Securities LLC, an affiliated broker, involving taxable money market instruments, subject to certain conditions.
4. Investment Transactions
During the year ended February 28, 2021, purchases and sales of investments (excluding short-term investments) were as follows:
| Purchases (excluding U.S. Government) | Sales (excluding U.S. Government) | |||||||
| $ | 1,837,659 | $ | 1,351,601 | |||||
During the year ended February 28, 2021, there were no purchases or sales of U.S. Government securities.
5. Federal Income Tax Matters
For Federal income tax purposes, the estimated cost and unrealized appreciation (depreciation) in value of investments held at February 28, 2021 were as follows:
| Aggregate Cost | Gross Unrealized Appreciation | Gross Unrealized Depreciation | Net Unrealized | |||||||||||||
| $ | 1,645,551 | $ | 328,489 | $ | 14,604 | $ | 313,885 | |||||||||
The difference between book and tax basis appreciation (depreciation) on investments is primarily attributed to wash sale loss deferrals.
The tax character of distributions paid during the year ended February 28, 2021 was as follows:
| Ordinary Income* | Net Long-Term Capital Gains | Total Distributions Paid | ||||||||||
| $ | 32,819 | $ | 46,803 | $ | 79,622 | |||||||
| * | Short-term gain distributions are treated as ordinary income for income tax purposes. |
The tax character of distributions paid during the year ended February 29, 2020 was as follows:
| Ordinary Income* | Net Long-Term | Total Distributions Paid | ||||||||||
| $ | 74,563 | $ | 60,066 | $ | 134,629 | |||||||
| * | Short-term gain distributions are treated as ordinary income for income tax purposes. |
| 18 | UNDISCOVERED MANAGERS FUNDS | FEBRUARY 28, 2021 | ||||||||
Table of Contents
As of February 28, 2021, the estimated components of net assets (excluding paid-in-capital) on a tax basis were as follows:
| Current Distributable Ordinary Income | Current Distributable Long-Term Capital Gain (Tax Basis Capital Loss Carryover) | Unrealized Appreciation (Depreciation) | ||||||||||
| $ | 5,328 | $ | (34,937 | ) | $ | 313,885 | ||||||
The cumulative timing differences primarily consist of wash sale loss deferrals.
As of February 28, 2021, the Fund had net capital loss carryforwards which are available to offset future realized gains:
| Capital Loss Carryforward Character | ||||||||
| Short-Term | Long-Term | |||||||
| $ | 30,822 | $ | 4,115 | |||||
6. Borrowings
The Fund relies upon an exemptive order granted by the SEC (the “Order”) permitting the establishment and operation of an Interfund Lending Facility (the “Facility”). The Facility allows the Fund to directly lend and borrow money to or from any other fund relying upon the Order at rates beneficial to both the borrowing and lending funds. Advances under the Facility are taken primarily for temporary or emergency purposes, including the meeting of redemption requests that otherwise might require the untimely disposition of securities, and are subject to the Fund’s borrowing restrictions. The Interfund loan rate is determined, as specified in the Order, by averaging the current repurchase agreement rate and the current bank loan rate. The Order was granted to JPMorgan Trust II and may be relied upon by the Fund because the Fund and the series of JPMorgan Trust II are all investment companies in the same “group of investment companies” (as defined in Section 12(d)(1)(G) of the 1940 Act).
The Fund had no borrowings outstanding from another fund during the year ended February 28, 2021.
The Trust and JPMCB have entered into a financing arrangement. Under this arrangement, JPMCB provides an unsecured, uncommitted credit facility in the aggregate amount of $100 million to certain of the J.P. Morgan Funds, including the Fund. Advances under the arrangement are taken primarily for temporary or emergency purposes, including the meeting of redemption requests that otherwise might require the untimely disposition of securities, and are subject to the Fund’s borrowing restrictions. Interest on borrowings is payable at a rate determined by JPMCB at the time of borrowing. This agreement has been extended until November 1, 2021.
The Fund had no borrowings outstanding from the unsecured, uncommitted credit facility during the year ended February 28, 2021.
The Trust, along with certain other trusts for J.P. Morgan Funds (“Borrowers”), has entered into a joint syndicated senior unsecured revolving credit facility totaling $1.5 billion (“Credit Facility”) with various lenders and The Bank of New York Mellon, as administrative agent for the lenders. This Credit Facility provides a source of funds to the Borrowers for temporary and emergency purposes, including the meeting of redemption requests that otherwise might require the untimely disposition of securities. Under the terms of the Credit Facility, a borrowing fund must have a minimum of $25,000,000 in adjusted net asset value and not exceed certain adjusted net asset coverage ratios prior to and during the time in which any borrowings are outstanding. If a fund does not comply with the aforementioned requirements, the fund must remediate within three business days with respect to the $25,000,000 minimum adjusted net asset value or within one business day with respect to certain asset coverage ratios or the administrative agent at the request of, or with the consent of, the lenders may terminate the Credit Facility and declare any outstanding borrowings to be due and payable immediately.
Interest associated with any borrowing under the Credit Facility is charged to the borrowing fund at a rate of interest equal to 1.00%, which has increased to 1.25% pursuant to the amendment referenced below, plus the greater of the federal funds effective rate or one month LIBOR. The annual commitment fee to maintain the Credit Facility is 0.15% and is incurred on the unused portion of the Credit Facility and is allocated to all participating funds pro rata based on their respective net assets. Effective August 11, 2020, this agreement has been amended and restated for a term of 364 days, unless extended, and to include the change to the interest rate charged for borrowing from the Credit Facility to 1.25%, as noted above, and an upfront fee of 0.075% of the Credit Facility to be charged and paid by all participating funds of the Credit Facility.
The Fund did not utilize the Credit Facility during the year ended February 28, 2021.
7. Risks, Concentrations and Indemnifications
In the normal course of business, the Fund enters into contracts that contain a variety of representations which provide general indemnifications. The Fund’s maximum exposure under these arrangements is unknown. The amount of exposure would depend on future claims that may be brought against the Fund. However, based on experience, the Fund expects the risk of loss to be remote.
As of February 28, 2021, the Fund had one individual shareholder and/or affiliated omnibus account, which owned 10.9% of the Fund’s outstanding shares.
| FEBRUARY 28, 2021 | UNDISCOVERED MANAGERS FUNDS | 19 | ||||||||
Table of Contents
NOTES TO FINANCIAL STATEMENTS
AS OF FEBRUARY 28, 2021 (continued)
(Dollar values in thousands)
As of February 28, 2021, J.P. Morgan Investor Funds and JPMorgan SmartRetirement Funds, which are affiliated funds of funds, owned in the aggregate, shares representing more than 10% of the net assets of the Fund as follows:
| J.P. Morgan Investor Funds | JPMorgan SmartRetirement Blend Funds | |||||||
| 14.80 | % | 63.0 | % | |||||
Significant shareholder transactions by these shareholders may impact the Fund’s performance and liquidity.
Because the Fund may invest a significant portion of its assets in real estate investment trusts (“REITs”), the Fund may be subject to certain risks similar to those associated with direct investments in real estate. REITs may be affected by changes in the value of their underlying properties and by defaults by tenants. REITs depend generally on their ability to generate cash flow to make distributions to shareholders, and certain REITs have self-liquidation provisions by which mortgages held may be paid in full and distributions of capital returns may be made at any time.
The Fund invests in companies with relatively small market capitalizations. Investments in companies with relatively small market capitalizations may involve greater risk than is usually associated with stocks of larger companies. These securities may have limited marketability and may be subject to more abrupt or erratic movements in price than securities of companies with larger capitalizations.
LIBOR is intended to represent the rate at which contributing banks may obtain short-term borrowings from each other in the London interbank market. On March 5, 2021, the U.K. Financial Conduct Authority (“FCA”) publicly announced that (i) immediately after December 31, 2021, publication of the 1-week and 2-month U.S. Dollar LIBOR settings will permanently cease; (ii) immediately after June 30, 2023, publication of the overnight and 12-month U.S. Dollar LIBOR settings will permanently cease; and (iii) immediately after June 30, 2023, the 1-month, 3-month and 6-month U.S. Dollar LIBOR settings will cease to be provided or, subject to the FCA’s consideration of the case, be provided on a synthetic basis and no longer be representative of the underlying market and economic reality they are intended to measure and that representativeness will not be restored. There is no assurance that the dates announced by the FCA will not change or that the administrator of LIBOR and/or regulators will not take further action that could impact the availability, composition or characteristics of LIBOR or the currencies and/or tenors for which LIBOR is published. Public and private sector industry initiatives are currently underway to implement new or alternative reference rates to be used in place of LIBOR. There is no assurance that any such alternative reference rate will be similar to or produce the same value or economic equivalence as LIBOR or that it will have the same volume or liquidity as did LIBOR prior to its discontinuance or unavailability, which may affect the value or liquidity or return on certain of the Fund’s instruments or investments comprising some or all of the Fund’s investments and result in costs incurred in connection with closing out positions and entering into new trades. These risks may also apply with respect to changes in connection with other interbank offering rates (e.g., Euribor) and a wide range of other index levels, rates and values that are treated as “benchmarks” and are the subject of recent regulatory reform.
The Fund is subject to infectious disease epidemics/pandemics risk. The worldwide outbreak of COVID-19, a novel coronavirus disease, has negatively affected economies, markets and individual companies throughout the world. The effects of this COVID-19 pandemic to public health, and business and market conditions, including exchange trading suspensions and closures may continue to have a significant negative impact on the performance of the Fund’s investments, increase the Fund’s volatility, exacerbate other pre-existing political, social and economic risks to the Fund and negatively impact broad segments of businesses and populations. The Fund’s operations may be interrupted as a result, which may have a significant negative impact on investment performance. In addition, governments, their regulatory agencies, or self-regulatory organizations may take actions in response to the pandemic that affect the instruments in which the Fund invests, or the issuers of such instruments, in ways that could also have a significant negative impact on the Fund’s investment performance. The full impact of this COVID-19 pandemic, or other future epidemics/pandemics, is currently unknown.
8. Redemptions in-kind
On November 7, 2019, certain shareholders sold Class R6 Shares of Realty Income Fund. The portfolio securities were delivered primarily by means of a redemption in-kind in exchange for shares of the Fund. Cash and portfolio securities were transferred as detailed below:
| Value | Realized Gains (Losses) | Type | ||||||||||
Realty Income Fund | $ | 433,589 | * | $ | 135,606 | Redemption in-kind | ||||||
| * | This amount includes cash of $11,487 associated with the redemption in-kind. |
| 20 | UNDISCOVERED MANAGERS FUNDS | FEBRUARY 28, 2021 | ||||||||
Table of Contents
REPORT OF INDEPENDENT REGISTERED PUBLIC ACCOUNTING FIRM
To the Board of Trustees of Undiscovered Managers Funds and Shareholders of JPMorgan Realty Income Fund
Opinion on the Financial Statements
We have audited the accompanying statement of assets and liabilities, including the schedule of portfolio investments, of JPMorgan Realty Income Fund (one of the funds constituting Undiscovered Managers Funds, referred to hereafter as the “Fund”) as of February 28, 2021, the related statement of operations for the year ended February 28, 2021, the statements of changes in net assets for each of the two years in the period ended February 28, 2021, including the related notes, and the financial highlights for each of the periods indicated therein (collectively referred to as the “financial statements”). In our opinion, the financial statements present fairly, in all material respects, the financial position of the Fund as of February 28, 2021, the results of its operations for the year then ended, the changes in its net assets for each of the two years in the period ended February 28, 2021 and the financial highlights for each of the periods indicated therein in conformity with accounting principles generally accepted in the United States of America.
Basis for Opinion
These financial statements are the responsibility of the Fund’s management. Our responsibility is to express an opinion on the Fund’s financial statements based on our audits. We are a public accounting firm registered with the Public Company Accounting Oversight Board (United States) (PCAOB) and are required to be independent with respect to the Fund in accordance with the U.S. federal securities laws and the applicable rules and regulations of the Securities and Exchange Commission and the PCAOB.
We conducted our audits of these financial statements in accordance with the standards of the PCAOB. Those standards require that we plan and perform the audit to obtain reasonable assurance about whether the financial statements are free of material misstatement, whether due to error or fraud.
Our audits included performing procedures to assess the risks of material misstatement of the financial statements, whether due to error or fraud, and performing procedures that respond to those risks. Such procedures included examining, on a test basis, evidence regarding the amounts and disclosures in the financial statements. Our audits also included evaluating the accounting principles used and significant estimates made by management, as well as evaluating the overall presentation of the financial statements. Our procedures included confirmation of securities owned as of February 28, 2021 by correspondence with the custodian, transfer agent and brokers; when replies were not received from brokers, we performed other auditing procedures. We believe that our audits provide a reasonable basis for our opinion.
/s/PricewaterhouseCoopers LLP
New York, New York
April 26, 2021
We have served as the auditor of one or more investment companies in the JPMorgan Funds complex since 1993.
| FEBRUARY 28, 2021 | UNDISCOVERED MANAGERS FUNDS | 21 | ||||||||
Table of Contents
(Unaudited)
The Fund’s Statement of Additional Information includes additional information about the Fund’s Trustees and is available, without charge, upon request by calling 1-800-480-4111 or on the J.P. Morgan Funds’ website at www.jpmorganfunds.com.
Name (Year of Birth); Positions With the Fund (1) | Principal Occupation During Past 5 Years | Number of Funds in Fund Complex Overseen by Trustee (2) | Other Directorships Held During the Past 5 Years | |||
Independent Trustees | ||||||
| John F. Finn (1947); Chair since 2020; Trustee of Trust since 2005; Trustee of heritage One Group Mutual Funds since 1998. | Chairman, Gardner, Inc. (supply chain management company serving industrial and consumer markets) (serving in various roles 1974-present). | 127 | Director, Greif, Inc. (GEF) (industrial package products and services) (2007-present); Trustee, Columbus Association for the Performing Arts (1988-present); Director, Cardinal Health, Inc. (CAH) (1994-2014). | |||
| Stephen P. Fisher (1959); Trustee of Trust since 2018. | Retired; Chairman and Chief Executive Officer, NYLIFE Distributors LLC (registered broker-dealer) (serving in various roles 2008-2013); Chairman, NYLIM Service Company LLC (transfer agent) (2008-2017); New York Life Investment Management LLC (registered investment adviser) (serving in various roles 2005-2017); Chairman, IndexIQ Advisors LLC (registered investment adviser for ETFs) (2014-2017); President, MainStay VP Funds Trust (2007-2017), MainStay DefinedTerm Municipal Opportunities Fund (2011-2017) and MainStay Funds Trust (2007-2017) (registered investment companies). | 127 | Honors Program Advisory Board Member, The Zicklin School of Business, Baruch College, The City University of New York (2017-present). | |||
| Kathleen M. Gallagher (1958); Trustee of Trust since 2018. | Retired; Chief Investment Officer — Benefit Plans, Ford Motor Company (serving in various roles 1985-2016). | 127 | Non-Executive Director, Legal & General Investment Management (Holdings) (2018-present); Non-Executive Director, Legal & General Investment Management America (financial services and insurance) (2017-present); Advisory Board Member, Fiduciary Solutions, State Street Global Advisors (2017-present); Member, Client Advisory Council, Financial Engines, LLC (registered investment adviser) (2011-2016); Director, Ford Pension Funds Investment Management Ltd. (2007-2016). | |||
| Dennis P. Harrington* (1950); Trustee of Trust since 2017. | Retired; Partner, Deloitte LLP (accounting firm) (serving in various roles 1984-2012). | 127 | None | |||
| Frankie D. Hughes (1952); Trustee of Trust since 2008. | President, Ashland Hughes Properties (property management) (2014-present); President and Chief Investment Officer, Hughes Capital Management, Inc. (fixed income asset management) (1993-2014). | 127 | None | |||
| 22 | UNDISCOVERED MANAGERS FUNDS | FEBRUARY 28, 2021 | ||||||||
Table of Contents
TRUSTEES
(Unaudited) (continued)
Name (Year of Birth); Positions With the Fund (1) | Principal Occupation During Past 5 Years | Number of Funds in Fund Complex Overseen by Trustee (2) | Other Directorships Held During the Past 5 Years | |||
Independent Trustees (continued) | ||||||
Raymond Kanner** (1953); Trustee of Trust since 2017. | Retired; Managing Director & Chief Investment Officer, IBM Retirement Funds (2007-2016). | 127 | Advisory Board Member, Penso Advisors LLC (2020-present); Advisory Board Member, Los Angeles Capital (2018-present); Advisory Board Member, State Street Global Advisors Global Fiduciary Solutions Board (2017-present); Acting Executive Director, Committee on Investment of Employee Benefit Assets (CIEBA) (2016-2017); Advisory Board Member, Betterment for Business (robo advisor) (2016-2017); Advisory Board Member, BlueStar Indexes (index creator) (2013-2017); Director, Emerging Markets Growth Fund (registered investment company) (1997-2016); Member, Russell Index Client Advisory Board (2001-2015). | |||
| Mary E. Martinez (1960); Vice Chair since 2021; Trustee of Trust since 2013. | Associate, Special Properties, a Christie’s International Real Estate Affiliate (2010-present); Managing Director, Bank of America (Asset Management) (2007-2008); Chief Operating Officer, U.S. Trust Asset Management, U.S. Trust Company (asset management) (2003-2007); President, Excelsior Funds (registered investment companies) (2004-2005). | 127 | None | |||
| Marilyn McCoy (1948); Trustee of Trust since 2005; Trustee of heritage One Group Mutual Funds since 1999. | Vice President, Administration and Planning, Northwestern University (1985-present). | 127 | None | |||
| Dr. Robert A. Oden, Jr. (1946); Trustee of Trust since 2005; Trustee of heritage One Group Mutual Funds since 1997. | Retired; President, Carleton College (2002-2010); President, Kenyon College (1995-2002). | 127 | Trustee and Vice Chair, Trout Unlimited (2017-present); Trustee, American Museum of Fly Fishing (2013-present); Trustee, Dartmouth-Hitchcock Medical Center (2011-present); Trustee, American University in Cairo (1999-2014). | |||
| Marian U. Pardo*** (1946); Trustee of Trust since 2013. | Managing Director and Founder, Virtual Capital Management LLC (investment consulting) (2007-present); Managing Director, Credit Suisse Asset Management (portfolio manager) (2003-2006). | 127 | President and Member, Board of Governors, Columbus Citizens Foundation (not-for-profit supporting philanthropic and cultural programs) (2006-present). | |||
| FEBRUARY 28, 2021 | UNDISCOVERED MANAGERS FUNDS | 23 | ||||||||
Table of Contents
TRUSTEES
(Unaudited) (continued)
| (1) | The Trustees serve for an indefinite term, subject to the Trust’s current retirement policy, which is age 78 for all Trustees. |
| (2) | A Fund Complex means two or more registered investment companies that hold themselves out to investors as related companies for purposes of investment and investor services or have a common investment adviser or have an investment adviser that is an affiliated person of the investment adviser of any of the other registered investment companies. The J.P. Morgan Funds Complex for which the Board of Trustees serves currently includes ten registered investment companies (127 funds). |
| * | Two family members of Mr. Harrington are employed as a partner and managing director, respectively, of the Fund’s independent registered public accounting firm. Such firm has represented to the Board that those family members are not involved in the audit of the Fund’s financial statements and do not provide other services to the Fund. The Board has concluded that such association does not interfere with Mr. Harrington’s exercise of independent judgment as an Independent Trustee. |
| ** | A family member of Mr. Kanner is employed by JPMorgan Chase Bank, which is affiliated with JPMIM and JPMDS. In that capacity, this employee provides services to various JPMorgan affiliates including JPMIM and JPMDS and for which JPMIM and JPMDS bear some portion of the expense thereof. |
| *** | In connection with prior employment with JPMorgan Chase, Ms. Pardo was the recipient of non-qualified pension plan payments from JPMorgan Chase in the amount of approximately $2,055 per month, which she irrevocably waived effective January 1, 2013, and deferred compensation payments from JPMorgan Chase in the amount of approximately $7,294 per year, which ended in January 2013. In addition, Ms. Pardo receives payments from a fully-funded qualified plan, which is not an obligation of JPMorgan Chase. |
The contact address for each of the Trustees is 277 Park Avenue, New York, NY 10172.
| 24 | UNDISCOVERED MANAGERS FUNDS | FEBRUARY 28, 2021 | ||||||||
Table of Contents
(Unaudited)
Name (Year of Birth), Positions Held with the Trust (Since) | Principal Occupations During Past 5 Years | |
| Brian S. Shlissel (1964), President and Principal Executive Officer (2016)* | Managing Director and Chief Administrative Officer for J.P. Morgan pooled vehicles, J.P. Morgan Investment Management Inc. (formerly JPMorgan Funds Management, Inc.) since 2014. | |
Timothy J. Clemens (1975), Treasurer and Principal Financial Officer (2018) | Executive Director, J.P. Morgan Investment Management Inc. (formerly JPMorgan Funds Management, Inc.) since February 2016. Mr. Clemens has been with J.P. Morgan Investment Management Inc. since 2013. | |
Gregory S. Samuels (1980), | Executive Director and Assistant General Counsel, JPMorgan Chase. Mr. Samuels has been with JPMorgan Chase since 2010. | |
| Stephen M. Ungerman (1953), Chief Compliance Officer (2005) | Managing Director, JPMorgan Chase & Co.; Mr. Ungerman has been with JPMorgan Chase & Co. since 2000. | |
Elizabeth A. Davin (1964), Assistant Secretary (2005)*** | Executive Director and Assistant General Counsel. Ms. Davin has been with JPMorgan Chase (formerly Bank One Corporation) since 2004. | |
| Jessica K. Ditullio (1962), Assistant Secretary (2005)*** | Executive Director and Assistant General Counsel, JPMorgan Chase. Ms. Ditullio has been with JPMorgan Chase (formerly Bank One Corporation) since 1990. | |
Anthony Geron (1971), Assistant Secretary (2018)** | Vice President and Assistant General Counsel, JPMorgan Chase since September 2018; Lead Director and Counsel, AXA Equitable Life Insurance Company from 2015 to 2018 and Senior Director and Counsel, AXA Equitable Life Insurance Company from 2014 to 2015. | |
| Carmine Lekstutis (1980), Assistant Secretary (2011)** | Executive Director and Assistant General Counsel, JPMorgan Chase. Mr. Lekstutis has been with JPMorgan Chase since 2011. | |
Zachary E. Vonnegut-Gabovitch (1986), Assistant Secretary (2017)** | Vice President and Assistant General Counsel, JPMorgan Chase since September 2016; Associate, Morgan, Lewis & Bockius (law firm) from 2012 to 2016. | |
Michael M. D’Ambrosio (1969), Assistant Treasurer (2012) | Managing Director, J.P. Morgan Investment Management Inc. (formerly JPMorgan Funds Management, Inc.). Mr. D’Ambrosio has been with J.P. Morgan Investment Management Inc. since 2012. | |
Aleksandr Fleytekh (1972), Assistant Treasurer (2019) | Vice President, J.P. Morgan Investment Management Inc. (formerly JPMorgan Funds Management, Inc.) since February 2012. | |
Shannon Gaines (1977), Assistant Treasurer (2018)*** | Vice President, J.P. Morgan Investment Management Inc. (formerly JPMorgan Funds Management, Inc.) since January 2014. | |
Jeffrey D. House (1972), Assistant Treasurer (2017)*** | Vice President, J.P. Morgan Investment Management Inc. (formerly JPMorgan Funds Management, Inc.) since July 2006. | |
| Michael Mannarino (1985), Assistant Treasurer (2020) | Vice President, J.P. Morgan Investment Management Inc. (formerly JPMorgan Funds Management, Inc.) since 2014. | |
| Joseph Parascondola (1963), Assistant Treasurer (2011)* | Executive Director, J.P. Morgan Investment Management Inc. since February 2020, formerly Vice President, J.P. Morgan Investment Management Inc. (formerly JPMorgan Funds Management, Inc.) from August 2006 to January 2020. | |
Gillian I. Sands (1969), Assistant Treasurer (2012) | Vice President, J.P. Morgan Investment Management Inc. (formerly JPMorgan Funds Management, Inc.) since September 2012. | |
The contact address for each of the officers, unless otherwise noted, is 277 Park Avenue, New York, NY 10172.
| * | The contact address for the officer is 575 Washington Boulevard, Jersey City, NJ 07310. |
| ** | The contact address for the officer is 4 New York Plaza, New York, NY 10004. |
| *** | The contact address for the officer is 1111 Polaris Parkway, Columbus, OH 43240. |
| FEBRUARY 28, 2021 | UNDISCOVERED MANAGERS FUNDS | 25 | ||||||||
Table of Contents
SCHEDULE OF SHAREHOLDER EXPENSES
(Unaudited)
Hypothetical $1,000 Investment
As a shareholder of the Fund, you incur two types of costs: (1) transaction costs, including sales charges (loads) on purchase payments and (2) ongoing costs, including investment advisory fees, administration fees, distribution fees and other Fund expenses. The examples below are intended to help you understand your ongoing costs (in dollars) of investing in the Fund and to compare these ongoing costs with the ongoing costs of investing in other mutual funds. The examples assume that you had a $1,000 investment in each Class at the beginning of the reporting period, September 1, 2020, and continued to hold your shares at the end of the reporting period, February 28, 2021.
Actual Expenses
For each Class of the Fund in the table below, the first line provides information about actual account values and actual expenses. You may use the information in this line, together with the amount you invested, to estimate the expenses that you paid over the period. Simply divide your account value by $1,000 (for example, an $8,600 account value divided by $1,000 = 8.6), then multiply the result by the number in the first line of each Class under the heading titled “Expenses Paid During the Period” to estimate the expenses you paid on your account during this period.
Hypothetical Example for Comparison Purposes
The second line of each Class in the table below provides information about hypothetical account values and hypothetical expenses based on the Class’ actual expense ratio and an assumed rate of return of 5% per year before expenses, which is not the Class’ actual return. The hypothetical account values and expenses may not be used to estimate the actual ending account balance or expenses you paid for the period. You may use this information to compare the ongoing costs of investing in the Class of the Fund and other funds. To do so, compare this 5% hypothetical example with the 5% hypothetical examples that appear in the shareholder reports of the other funds. Please note that the expenses shown in the table are meant to highlight your ongoing costs only and do not reflect any transaction costs, such as sales charges (loads) or redemption fees. Therefore, the second line for each Class in the table is useful in comparing ongoing costs only, and will not help you determine the relative total costs of owning different funds. In addition, if these transaction costs were included, your costs would have been higher. The examples also assume all dividends and distributions have been reinvested.
| Beginning Account Value September 1, 2020 | Ending Account Value February 28, 2021 | Expenses Paid During the Period* | Annualized Expense Ratio | |||||||||||||
JPMorgan Realty Income Fund | ||||||||||||||||
Class A | ||||||||||||||||
Actual | $ | 1,000.00 | $ | 1,099.30 | $ | 6.09 | 1.17 | % | ||||||||
Hypothetical | 1,000.00 | 1,018.99 | 5.86 | 1.17 | ||||||||||||
Class C | ||||||||||||||||
Actual | 1,000.00 | 1,096.40 | 8.68 | 1.67 | ||||||||||||
Hypothetical | 1,000.00 | 1,016.51 | 8.35 | 1.67 | ||||||||||||
Class I | ||||||||||||||||
Actual | 1,000.00 | 1,100.80 | 4.84 | 0.93 | ||||||||||||
Hypothetical | 1,000.00 | 1,020.18 | 4.66 | 0.93 | ||||||||||||
Class L | ||||||||||||||||
Actual | 1,000.00 | 1,100.90 | 4.06 | 0.78 | ||||||||||||
Hypothetical | 1,000.00 | 1,020.93 | 3.91 | 0.78 | ||||||||||||
Class R5 | ||||||||||||||||
Actual | 1,000.00 | 1,101.10 | 4.06 | 0.78 | ||||||||||||
Hypothetical | 1,000.00 | 1,020.93 | 3.91 | 0.78 | ||||||||||||
Class R6 | ||||||||||||||||
Actual | 1,000.00 | 1,102.20 | 3.54 | 0.68 | ||||||||||||
Hypothetical | 1,000.00 | 1,021.42 | 3.41 | 0.68 | ||||||||||||
| * | Expenses are equal to each Class’ respective annualized expense ratio, multiplied by the average account value over the period, multiplied by 181/365 (to reflect the one-half year period). |
| 26 | UNDISCOVERED MANAGERS FUNDS | FEBRUARY 28, 2021 | ||||||||
Table of Contents
LIQUIDITY RISK MANAGEMENT PROGRAM
(Unaudited)
The Fund has adopted the J.P. Morgan Funds Liquidity Risk Management Program (the “Program”) under Rule 22e-4 under the 1940 Act (the “Liquidity Rule”). The Program seeks to assess, manage and review the Fund’s Liquidity Risk. “Liquidity Risk” is defined as the risk that a fund could not meet requests to redeem shares issued by the fund without significant dilution of remaining investors’ interests in the fund. Among other things, the Liquidity Rule requires that a written report be provided to the Board of Trustees (the “Board”) on an annual basis that addresses the operation of the Program and assesses the adequacy and effectiveness of its implementation, including the operation of any Highly Liquid Investment Minimum (“HLIM”) established for a J.P. Morgan Fund and any material changes to the Program.
The Board has appointed J.P. Morgan Asset Management’s Liquidity Risk Forum to be the program administrator for the Program (the “Program Administrator”). In addition to regular reporting at each of its quarterly meetings, on February 8, 2021, the Board reviewed the Program Administrator’s annual report (the “Report”) concerning the operation of the Program for the period from January 1, 2020 through December 31, 2020 (the “Program Reporting Period”). The Report addressed the operation of the Program and assessed its adequacy and effectiveness of implementation, including, where applicable, the operation of a J.P. Morgan Fund’s HLIM. There were no material changes to the Program during the Program Reporting Period.
The Report summarized the operation of the Program and the information and factors considered by the Program Administrator in assessing whether the Program has been adequately and effectively implemented with respect to the Fund. Such information and factors included, among other things: (1) the liquidity risk framework used to assess, manage, and periodically review the Fund’s Liquidity Risk and the results of this
assessment; (2) the methodology and inputs for classifying the investments of the Fund into one of four liquidity categories that reflect an estimate of the liquidity of those investments under current market conditions, including additional focus on particular asset classes and securities impacted by the COVID-19 pandemic; (3) whether the Fund invested primarily in “Highly Liquid Investments” (as defined under the Liquidity Rule), as well as whether an HLIM should be established for the Fund (and, for J.P. Morgan Funds that have adopted an HLIM, whether the HLIM continues to be appropriate or whether the J.P. Morgan Fund has invested below its HLIM) and the procedures for monitoring for any HLIM; (4) whether the Fund invested more than 15% of its assets in “Illiquid Investments” (as defined under the Liquidity Rule) and the procedures for monitoring for this limit; (5) the oversight of the liquidity vendor retained to perform liquidity classifications for the Program including during the COVID-19 pandemic; and (6) specific liquidity events arising during the Program Reporting Period, including the impact on Fund liquidity caused by the significant market volatility created in March 2020 by the COVID-19 pandemic. The Report further summarized that the Program Administrator instituted a stressed market protocol in March 2020 to: (1) review the results of the liquidity risk framework and daily liquidity classifications of the Fund’s investments; and (2) perform additional stress testing. The Report noted that the Fund was able to meet redemption requests without significant dilution to remaining shareholders during the Program Reporting Period, including during March 2020.
Based on this review, the Report concluded that: (1) the Program continues to be reasonably designed to effectively assess and manage the Fund’s Liquidity Risk; and (2) the Program has been adequately and effectively implemented with respect to the Fund during the Program Reporting Period.
| FEBRUARY 28, 2021 | UNDISCOVERED MANAGERS FUNDS | 27 | ||||||||
Table of Contents
(Unaudited)
(Dollar values in thousands)
Certain tax information for the J.P. Morgan Funds is required to be provided to shareholders based upon the Fund’s income and distributions for the taxable year ended February 28, 2021. The information and distributions reported in this letter may differ from the information and taxable distributions reported to the shareholders for the calendar year ending December 31, 2021. The information necessary to complete your income tax returns for the calendar year ending December 31, 2021 will be provided under separate cover.
Section 199A Income
The Fund had $21,415, or maximum allowable amount, of ordinary income distributions treated as section 199A dividends for the year ended February 28, 2021.
Long-Term Capital Gain
The Fund distributed $46,803, or maximum allowable amount, of long-term capital gain dividends for the fiscal year ended February 28, 2021.
| 28 | UNDISCOVERED MANAGERS FUNDS | FEBRUARY 28, 2021 | ||||||||
Table of Contents

Rev. January 2011
| FACTS | WHAT DOES J.P. MORGAN FUNDS DO WITH YOUR PERSONAL INFORMATION? | |
| Why? | Financial companies choose how they share your personal information. Federal law gives consumers the right to limit some but not all sharing. Federal law also requires us to tell you how we collect, share, and protect your personal information. Please read this notice carefully to understand what we do. |
| What? | The types of personal information we collect and share depend on the product or service you have with us. This information can include:
◾ Social Security number and account balances
◾ transaction history and account transactions
◾ checking account information and wire transfer instructions
When you are no longer our customer, we continue to share your information as described in this notice. |
| How? | All financial companies need to share customers’ personal information to run their everyday business. In the section below, we list the reasons financial companies can share their customers’ personal information; the reasons J.P. Morgan Funds chooses to share; and whether you can limit this sharing. |
| Reasons we can share your personal information | Does J.P. Morgan Funds share? | Can you limit this sharing? | ||
For our everyday business purposes — such as to process your transactions, maintain your account(s), respond to court orders and legal investigations, or report to credit bureaus | Yes | No | ||
For marketing purposes — to offer our products and services to you | Yes | No | ||
| For joint marketing with other financial companies | No | We don’t share | ||
For our affiliates’ everyday business purposes — information about your transactions and experiences | No | We don’t share | ||
For our affiliates’ everyday business purposes — information about your creditworthiness | No | We don’t share | ||
| For nonaffiliates to market to you | No | We don’t share | ||
| Questions? | Call 1-800-480-4111 or go to www.jpmorganfunds.com | |

Table of Contents
Page 2 | ||
| Who we are | ||
| Who is providing this notice? | J.P. Morgan Funds | |
| What we do | ||
| How does J.P. Morgan Funds protect my personal information? | To protect your personal information from unauthorized access and use, we use security measures that comply with federal law. These measures include computer safeguards and secured files and buildings. We authorize our employees to access your information only when they need it to do their work and we require companies that work for us to protect your information. | |
How does J.P. Morgan Funds collect my personal information? | We collect your personal information, for example, when you:
◾ open an account or provide contact information
◾ give us your account information or pay us by check
◾ make a wire transfer
We also collect your personal information from others, such as credit bureaus, affiliates and other companies. | |
| Why can’t I limit all sharing? | Federal law gives you the right to limit only
◾ sharing for affiliates’ everyday business purposes – information about your creditworthiness
◾ affiliates from using your information to market to you
◾ sharing for nonaffiliates to market to you
State laws and individual companies may give you additional rights to limit sharing. | |
| Definitions | ||
| Affiliates | Companies related by common ownership or control. They can be financial and nonfinancial companies.
◾ J.P. Morgan Funds does not share with our affiliates. | |
| Nonaffiliates | Companies not related by common ownership or control. They can be financial and nonfinancial companies.
◾ J.P. Morgan Funds does not share with nonaffiliates so they can market to you. | |
| Joint Marketing | A formal agreement between nonaffiliated financial companies that together market financial products or services to you.
◾ J.P. Morgan Funds doesn’t jointly market. | |
Table of Contents
J.P. Morgan Funds are distributed by JPMorgan Distribution Services, Inc., which is an affiliate of JPMorgan Chase & Co. Affiliates of JPMorgan Chase & Co. receive fees for providing various services to the funds.
Contact JPMorgan Distribution Services, Inc. at 1-800-480-4111 for a fund prospectus. You can also visit us at www.jpmorganfunds.com. Investors should carefully consider the investment objectives and risk as well as charges and expenses of the mutual fund before investing. The prospectus contains this and other information about the mutual fund. Read the prospectus carefully before investing.
Investors may obtain information about the Securities Investor Protection Corporation (SIPC), including the SIPC brochure, by visiting www.sipc.org or by calling SIPC at 202-371-8300.
The Fund files a complete schedule of its fund holdings for the first and third quarters of its fiscal year with the SEC as an exhibit to its report on Form N-PORT. The Fund’s Form N-PORT reports are available on the SEC’s website at http://www.sec.gov. The Fund’s quarterly holdings can be found by visiting the J.P. Morgan Funds’ website at www.jpmorganfunds.com.
A description of the Fund’s policies and procedures with respect to the disclosure of the Fund’s holdings is available in the prospectuses and Statement of Additional Information.
A copy of proxy policies and procedures is available without charge upon request by calling 1-800-480-4111 and on the Fund’s website at www.jpmorganfunds.com. A description of such policies and procedures is on the SEC’s website at www.sec.gov. The Trustees have delegated the authority to vote proxies for securities owned by the Fund to the Adviser. A copy of the Fund’s voting record for the most recent 12-month period ended June 30 is available on the SEC’s website at www.sec.gov or at the Fund’s website at www.jpmorganfunds.com no later than August 31 of each year. The Fund’s proxy voting record will include, among other things, a brief description of the matter voted on for each fund security, and will state how each vote was cast, for example, for or against the proposal.

Table of Contents

J.P. Morgan Asset Management is the brand name for the asset management business of JPMorgan Chase & Co. and its affiliates worldwide.
| © JPMorgan Chase & Co., 2021. All rights reserved. February 2021. | AN-RI-221 |
Table of Contents
ITEM 2. CODE OF ETHICS.
Disclose whether, as of the end of the period covered by the report, the registrant has adopted a code of ethics that applies to the registrant’s principal executive officer, principal financial officer, principal accounting officer or controller, or persons performing similar functions, regardless of whether these individuals are employed by the registrant or a third party. If the registrant has not adopted such a code of ethics, explain why it has not done so.
The registrant must briefly describe the nature of any amendment, during the period covered by the report, to a provision of its code of ethics that applies to the registrant’s principal executive officer, principal financial officer, principal accounting officer or controller, or persons performing similar functions, regardless of whether these individuals are employed by the registrant or a third party, and that relates to any element of the code of ethics definition enumerated in paragraph (b) of this Item. The registrant must file a copy of any such amendment as an exhibit pursuant to Item 13(a)(1), unless the registrant has elected to satisfy paragraph (f) of this Item by positing its code of ethics on its website pursuant to paragraph (f)(2) of this Item, or by undertaking to provide its code of ethics to any person without charge, upon request, pursuant to paragraph (f)(3) of this Item.
If the registrant has, during the period covered by the report, granted a waiver, including an implicit waiver, from a provision of the code of ethics that applies to the registrant’s principal executive officer, principal financial officer, principal accounting officer or controller, or persons performing similar functions, regardless of whether these individuals are employed by the registrant or third party, that relates to one or more items set forth in paragraph (b) of this Item, the registrant must briefly describe the nature of the waiver, the name of the person to whom the waiver was granted, and the date of the waiver.
The Registrant has adopted a code of ethics that applies to the Registrant’s principal executive officer and principal financial officer. There were no amendments to the code of ethics or waivers granted with respect to the code of ethics in the period covered by the report.
ITEM 3. AUDIT COMMITTEE FINANCIAL EXPERT.
(a) (1) Disclose that the registrant’s board of directors has determined that the registrant either:
(i) Has at least one audit committee financial expert serving on its audit committee; or
(ii) Does not have an audit committee financial expert serving on its audit committee.
The Registrant’s Board of Trustees has determined that the Registrant has at least one audit committee financial expert serving on its audit committee. The Securities and Exchange Commission has stated that the designation or identification of a person as an audit committee financial expert pursuant to this Item 3 of Form N-CSR does not impose on such person any duties, obligations or liabilities that are greater than the duties, obligations and liabilities imposed on such person as a member of the Audit Committee and the Board of Trustees in the absence of such designation or identification.
(2) If the registrant provides the disclosure required by paragraph (a)(1)(i) of this Item, it must disclose the name of the audit committee financial expert and whether that person is “independent.” In order to be considered “independent” for purposes of this Item, a member of an audit committee may not, other than in his or her capacity as a member of the audit committee, the board of directors, or any other board committee:
(i) Accept directly or indirectly any consulting, advisory, or other compensatory fee from the issuer; or
(ii) Be an “interested person” of the investment company as defined in Section 2(a)(19) of the Act (15 U.S.C. 80a-2(a)(19)).
The audit committee financial expert is Dennis P. Harrington. He is not an “interested person” of the Registrant and is also “independent” as defined by the U.S. Securities and Exchange Commission for purposes of audit committee financial expert determinations.
On April 1, 2021, Kathleen M. Gallagher replaced Dennis P. Harrington as the audit committee financial expert. Ms. Gallagher is not an “interested person” of the Registrant and is also “independent” as defined by the U.S. Securities and Exchange Commission for the purposes of the audit committee financial expert determination.
(3) If the registrant provides the disclosure required by paragraph (a)(1)(ii) of this Item, it must explain why it does not have an audit committee financial expert.
Not applicable.
Table of Contents
ITEM 4. PRINCIPAL ACCOUNTANT FEES AND SERVICES.
(a) Disclose, under the caption Audit Fees, the aggregate fees billed for each of the last two fiscal years for professional services rendered by the principal accountant for the audit of the registrant’s annual financial statements or services that are normally provided by the accountant in connection with statutory and regulatory filings or engagements for those fiscal years.
AUDIT FEES
2021 – $43,181
2020 – $34,352
(b) Disclose, under the caption Audit-Related Fees, the aggregate fees billed in each of the last two fiscal years for assurance and related services by the principal accountant that are reasonably related to the performance of the audit of the registrant’s financial statements and are not reported under paragraph (a) of this Item. Registrants shall describe the nature of the services comprising the fees disclosed under this category.
AUDIT-RELATED FEES
2021 – $5,495
2020 – $5,940
Audit-related fees consists of semi-annual financial statement reviews and security count procedures performed as required under Rule 17f-2 of the Investment Company Act of 1940 during the Registrant’s fiscal year.
(c) Disclose, under the caption Tax Fees, the aggregate fees billed in each of the last two fiscal years for professional services rendered by the principal accountant for tax compliance, tax advice, and tax planning. Registrants shall describe the nature of the services comprising the fees disclosed under this category.
TAX FEES
2021 – $10,746
2020 – $11,595
The tax fees consist of fees billed in connection with preparing the federal regulated investment company income tax returns for the Registrant for the tax years ended February 28, 2021 and 2020, respectively.
For the last fiscal year, no tax fees were required to be approved pursuant to paragraph (c)(7)(ii) of Rule 2-01 of Regulation S-X.
(d) Disclose, under the caption All Other Fees, the aggregate fees billed in each of the last two fiscal years for products and services provided by the principal accountant, other than the services reported in paragraphs (a) through (c) of this Item. Registrants shall describe the nature of the services comprising the fees disclosed under this category.
ALL OTHER FEES
2021 – Not applicable
2020 – Not applicable
(e) (1) Disclose the audit committee’s pre-approval policies and procedures described in paragraph (c)(7) of Rule 2-01 of Regulation S-X.
Pursuant to the Registrant’s Audit Committee Charter and written policies and procedures for the pre-approval of audit and non-audit services (the “Pre-approval Policy”), the Audit Committee pre-approves all audit and non-audit services performed by the Registrant’s independent public registered accounting firm for the Registrant. In addition, the Audit Committee pre-approves the auditor’s engagement for non-audit services with the Registrant’s investment adviser (not including a sub-adviser whose role is primarily portfolio management and is sub-contracted or overseen by another investment adviser) and any Service Affiliate in accordance with paragraph (c)(7)(ii) of Rule 2-01 of Regulation S-X, if the engagement relates directly to the operations and financial reporting of the Registrant. Proposed services may be pre-approved either 1) without consideration of specific case-by-case services or 2) require the specific pre-approval of the Audit Committee. Therefore, initially the Pre-approval Policy listed a number of audit and non-audit services that have been approved by the Audit Committee, or which were not subject to pre-approval under the transition provisions of Sarbanes-Oxley Act of 2002 (the
Table of Contents
“Pre-approval List”). The Audit Committee annually reviews and pre-approves the services included on the Pre-approval List that may be provided by the independent public registered accounting firm without obtaining additional specific pre-approval of individual services from the Audit Committee. The Audit Committee adds to, or subtracts from, the list of general pre-approved services from time to time, based on subsequent determinations. All other audit and non-audit services not on the Pre-approval List must be specifically pre-approved by the Audit Committee.
One or more members of the Audit Committee may be appointed as the Committee’s delegate for the purposes of considering whether to approve such services. Any pre-approvals granted by the delegate will be reported, for informational purposes only, to the Audit Committee at its next scheduled meeting. The Audit Committee’s responsibilities to pre-approve services performed by the independent public registered accounting firm are not delegated to management.
(2) Disclose the percentage of services described in each of paragraphs (b) through (d) of this Item that were approved by the audit committee pursuant to paragraph (c)(7)(i)(C) of Rule 2-01 of Regulation S-X.
2021 – 0.0%
2020 – 0.0%
(f) If greater than 50 percent, disclose the percentage of hours expended on the principal accountant’s engagement to audit the registrant’s financial statements for the most recent fiscal year that were attributed to work performed by persons other than the principal accountant’s full-time, permanent employees.
Not applicable - Less than 50%.
(g) Disclose the aggregate non-audit fees billed by the registrant’s accountant for services rendered to the registrant, and rendered to the registrant’s investment adviser (not including any sub-adviser whose role is primarily portfolio management and is subcontracted with or overseen by another investment adviser), and any entity controlling, controlled by, or under common control with the adviser that provides ongoing services to the registrant for each of the last two fiscal years of the registrant.
The aggregate non-audit fees billed by the independent registered public accounting firm for services rendered to the Registrant, and rendered to Service Affiliates, for the last two calendar year ends were:
2020 - $30.0 million
2019 - $24.7 million
(h) Disclose whether the registrant’s audit committee of the board of directors has considered whether the provision of non-audit services that were rendered to the registrant’s investment adviser (not including any subadviser whose role is primarily portfolio management and is subcontracted with or overseen by another investment adviser), and any entity controlling, controlled by, or under common control with the investment adviser that provides ongoing services to the registrant that were not pre-approved pursuant to paragraph (c)(7)(ii) of Rule 2-01 of Regulation S-X is compatible with maintaining the principal accountant’s independence.
The Registrant’s Audit Committee has considered whether the provision of the non-audit services that were rendered to Service Affiliates that were not pre-approved (not requiring pre-approval) is compatible with maintaining the independent public registered accounting firm’s independence. All services provided by the independent public registered accounting firm to the Registrant or to Service Affiliates that were required to be pre-approved were pre-approved as required.
ITEM 5. AUDIT COMMITTEE OF LISTED REGISTRANTS.
(a) If the registrant is a listed issuer as defined in Rule 10A-3 under the Exchange Act (17CFR 240.10A-3), state whether or not the registrant has a separately-designated standing audit committee established in accordance with Section 3(a)(58)(A) of the Exchange Act (15 U.S.C. 78c(a)(58)(A)). If the registrant has such a committee, however designated, identify each committee member. If the entire board of directors is acting as the registrant’s audit committee as specified in Section 3(a)(58)(B) of the Exchange Act (15 U.S.C. 78c(a)(58)(B)), so state.
(b) If applicable, provide the disclosure required by Rule 10A-3(d) under the Exchange Act (17CFR 240.10A-3(d)) regarding an exemption from the listing standards for all audit committees.
Not applicable.
Table of Contents
ITEM 6. INVESTMENTS.
File Schedule I – Investments in securities of unaffiliated issuers as of the close of the reporting period as set forth in Section 210.12-12 of Regulation S-X, unless the schedule is included as part of the report to shareholders filed under Item 1 of this Form.
Included in Item 1.
ITEM 7. DISCLOSURE OF PROXY VOTING POLICIES AND PROCEDURES FOR CLOSED-END MANAGEMENT INVESTMENT COMPANIES.
Not applicable.
ITEM 8. PORTFOLIO MANAGERS OF CLOSED-END MANAGEMENT INVESTMENT COMPANIES.
Not applicable.
ITEM 9. PURCHASE OF EQUITY SECURITIES BY CLOSED-END MANAGEMENT INVESTMENT COMPANY AND AFFILIATED PURCHASERS.
Not applicable.
ITEM 10. SUBMISSION OF MATTERS TO A VOTE OF SECURITY HOLDERS.
Describe any material changes to the procedures by which shareholders may recommend nominees to the registrant’s board of directors, where those changes were implemented after the registrant last provided disclosure in response to the requirements of Item 7(d)(2)(ii)(G) of Schedule 14A (17 CFR 240.14a-101), or this Item.
No material changes to report.
ITEM 11. CONTROLS AND PROCEDURES.
(a) Disclose the conclusions of the registrant’s principal executive and principal financial officers, or persons performing similar functions, regarding the effectiveness of the registrant’s disclosure controls and procedures (as defined in Rule 30a-3(c) under the Act (17 CFR 270.30a-3(c))) as of a date within 90 days of the filing date of the report that includes the disclosure required by this paragraph, based on the evaluation of these controls and procedures required by Rule 30a-3(b) under the Act (17 CFR 270.30a-3(b)) and Rules 13a-15(b) or 15d-15(b) under the Exchange Act (17 CFR 240.13a-15(b) or 240.15d-15(b)).
The Registrant’s principal executive and principal financial officers have concluded, based on their evaluation of the Registrant’s disclosure controls and procedures as of a date within 90 days of the filing date of this report, that the Registrant’s disclosure controls and procedures are reasonably designed to ensure that information required to be disclosed by the Registrant on Form N-CSR is recorded, processed, summarized and reported within the required time periods and that information required to be disclosed by the Registrant in the reports that it files or submits on Form N-CSR is accumulated and communicated to the Registrant’s management, including its principal executive and principal financial officers, as appropriate to allow timely decisions regarding required disclosure.
(b) Disclose any change in the registrant’s internal control over financial reporting (as defined in Rule 30a-3(d) under the Act (17 CFR 270.30a-3(d)) that occurred during the registrant’s second fiscal quarter of the period covered by this report that has materially affected, or is reasonably likely to materially affect, the registrant’s internal control over financial reporting.
There were no changes in the Registrant’s internal control over financial reporting that occurred during the last fiscal quarter covered by this report that have materially affected, or are reasonably likely to materially affect, the Registrant’s internal control over financial reporting.
Table of Contents
ITEM 12. DISCLOSURE OF SECURITIES LENDING ACTIVITIES FOR CLOSED-END MANAGEMENT INVESTMENT COMPANIES.
Not applicable.
ITEM 13. EXHIBITS.
| (a) | File the exhibits listed below as part of this Form. Letter or number the exhibits in the sequence indicated. |
(1) Any code of ethics, or amendment thereto, that is the subject of the disclosure required by Item 2, to the extent that the registrant intends to satisfy the Item 2 requirements through filing of an exhibit.
(2) A separate certification for each principal executive officer and principal financial officer of the registrant as required by Rule 30a-2(a) under the Act (17 CFR 270.30a-2).
(3) Any written solicitation to purchase securities under Rule 23c-1 under the Act (17 CFR 270.23c-1) sent or given during the period covered by the report by or on behalf of the registrant to 10 or more persons.
Not applicable.
| (b) | A separate or combined certification for each principal executive officer and principal officer of the registrant as required by Rule 30a-2(b) under the Act of 1940. |
Table of Contents
SIGNATURES
Pursuant to the requirements of the Securities Exchange Act of 1934 and the Investment Company Act of 1940, the registrant has duly caused this report to be signed on its behalf by the undersigned, thereunto duly authorized.
| Undiscovered Managers Funds | ||
| By: | /s/ Brian S. Shlissel | |
| Brian S. Shlissel | ||
| President and Principal Executive Officer | ||
| May 3, 2021 | ||
Pursuant to the requirements of the Securities Exchange Act of 1934 and the Investment Company Act of 1940, this report has been signed below by the following persons on behalf of the registrant and in the capacities and on the dates indicated.
| By: | /s/ Brian S. Shlissel | |
| Brian S. Shlissel | ||
| President and Principal Executive Officer | ||
May 3, 2021 | ||
| By: | /s/ Timothy J. Clemens | |
| Timothy J. Clemens | ||
| Treasurer and Principal Financial Officer | ||
May 3, 2021 | ||