Filed by Lan Airlines S.A.
pursuant to Rule 425 under the
Securities Act of 1933, as amended.
Subject of the offer: TAM S.A.
(Commission File No.:333-177984)
EXPERT REPORT ON THE MERGER BY ABSORPTION INTO LAN AIRLINES S.A.
OF SISTER HOLDCO S.A. AND HOLDCO II S.A.
Free translation of the original in Spanish.
Santiago, December 1, 2011
To the Directors and Shareholders of
LAN Airlines S.A., Sister Holdco S.A. y Holdco II S.A.
| I. | PURPOSE OF THE REPORT |
As requested by the Boards of LAN Airlines S.A., Sister Holdco S.A. and Holdco II S.A., this report is issued regarding the proposed merger between LAN Airlines S.A., Sister Holdco S.A. and Holdco II S.A. according to the requirements set out within article 99 of Law No. 18.046 related to Stock Corporations (Ley de Sociedades Anónimas).
This expert report will present the financial position of the surviving entity as a result of the merger of Sister Holdco S.A. and Holdco II S.A. with and into LAN Airlines S.A., as set out within International Financial Reporting Standard No. 3 (revised in 2008), IFRS 3, if all the conditions the merger is limited by are met.
For these purposes, this expert will take into consideration the equity position that Holdco II S.A. and Sister Holdco S.A. would have if the conditions necessary for the completion of the merger are met, so that this report can adequately show the equity position of LAN Airlines S.A. in the event the merger is completed.
| II. | OUTLINE OF THE TRANSACTION |
According to the Implementation Agreement and the Exchange Offer Agreement, both signed on January 18, 2011, reviewed by this expert and that will serve as the base of the merger proposition that will be presented for approval at the Shareholders’ meeting, the merger can only be completed if each and all of the following conditions are met:
1. That the Shareholders’ meetings of LAN Airlines S.A., Sister Holdco S.A. and Holdco II S.A. approve the merger, with Holdco II S.A. and Sister Holdco S.A. merging with and into LAN Airlines S.A.;
1
2. That no more than 2.5% of LAN Airlines S.A. shareholders exercise their appraisal rights (derecho a retiro) after the merger is approved, not withstanding LAN Airlines S.A.´s right to waive this condition;
3. That once the merger has been approved, Holdco II S.A. will make a tender offer to acquire up to 85,557,560 TAM S.A. shares, this is, 83,368,921 subscribed and paid shares at September 30, 2011, and 2,188,639 shares that can be issued under stock option programs that at the same date have not been subscribed and paid, if before the merger is completed they are subscribed and paid, that will be paid by exchanging Holdco II S.A. shares on a 1:1 ratio.
This expert observes that these shares represent 14.6264% of TAM S.A.´s voting shares and 74.9127% of TAM S.A.´s non voting shares.
4. That as a result of the tender offer, Holdco II S.A. acquires sufficient shares that, after the consummation of the merger and together with TEP Chile S.A. and its related entities, LAN Airlines S.A. will control at least 95% of TAM S.A.´s shares.
It must be noted that, as was informed to this expert, according to Brazilian legislation LAN Airlines S.A. would have the right to acquire, after consummation of the mergers, the 5% of TAM S.A. shares that were not tendered into the exchange, paying for them an amount in cash equivalent to the product of a) the number of LAN Airlines S.A. shares that would have been delivered had the exchange been accepted, and b) the closing price of LAN Airlines S.A. shares published by the Santiago Stock Exchange (Bolsa de Comercio de Santiago) on the transaction closing date.
This expert reminds the shareholders that in the event LAN Airlines S.A. does not exercise the aforementioned right, the financial statements of the merged entity will need to reflect the non-controlling interest that relates to the TAM S.A. shares that were not tendered into the exchange.
Similarly, and exceptionally, LAN Airlines S.A. can waive the condition mentioned in this section, accepting the consummation of the merger, if the exchange offer was accepted by a percentage that is equal or higher than two thirds of the shares subject to the tender offer and that, according to Brazilian legislation, TAM S.A.´s delisting from the Bovespa has been approved, reflecting the corresponding non-controlling interest; and,
5. That once the exchange offer conditions mentioned previously have been met by Holdco II S.A., the shareholders of Sister Holdco S.A. subscribe and pay the statutory capital of the entity by contributing 47,652,705 non voting shares of the Chilean open stock entity Holdco I S.A., equivalent to 99.999996% of the non voting shares, 62 voting shares of Holdco I S.A., equivalent to 6.2% of the voting shares, and 25,185,155 non voting shares of TAM S.A., equivalent to 25.0873% of the non voting shares.
This expert notes that according to the agreements and other documents reviewed, the entity Holdco I S.A. will receive as a capital contribution 47,652,705 voting shares of TAM S.A., equivalent to 85.3736% of the voting shares.
Once each and all of the conditions described have been met, and under the assumption that none of the TAM S.A. shares pending subscription and payment under stock options were issued, and that no shareholder of any of the participating entities exercised his appraisal rights (derecho a retiro), the situation of the participating entities immediately before the consummation of the merger would be the following:
2
Situation immediately before the merger of Sister Holdco S.A. and Holdco II S.A.
with and into Lan Airlines S.A.
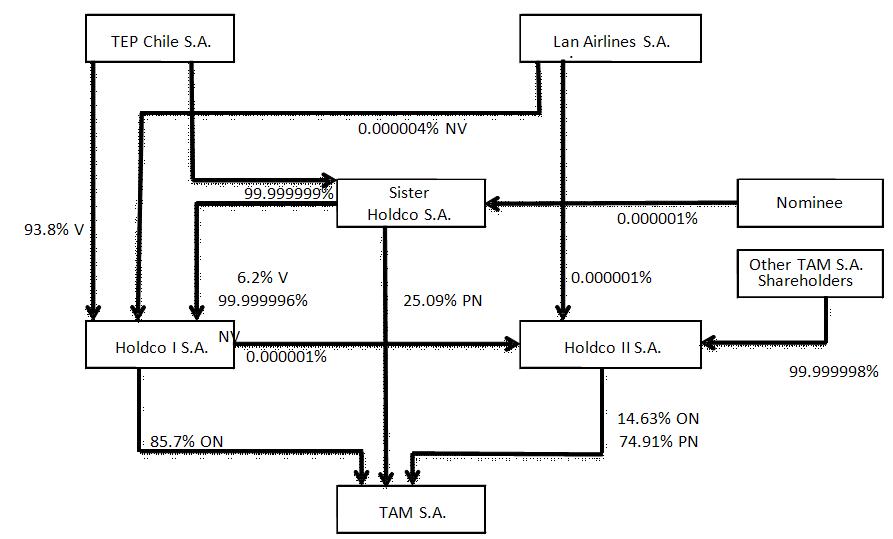
Notes:
V: Voting shares of Holdco I S.A.
NV: Non voting shares of Holdco I S.A.
ON: Voting shares of TAM S.A.
PN: Non voting shares of TAM S.A.
It was assumed for the purposes of this diagram that Holdco II S.A.´s exchange offer was accepted by 100% of the shareholders.
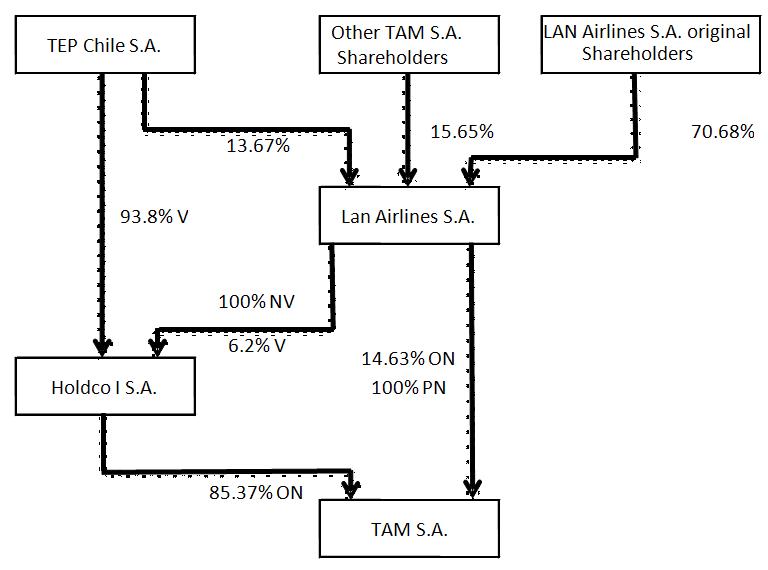
Once the merger approved by the Shareholders’ meetings is consummated, the result of the transaction would be the following:
Situation immediately after the mergers
According to what was previously presented, this expert report is issued assuming that each and all of the conditions necessary for the consummation of the merger have been met and that once merged, 100% of TAM S.A.´s subscribed and paid shares offered to be acquired by Holdco II S.A. will be owned by LAN Airlines S.A.
3
Therefore, to determine the equity position of the participating entities, the following financial statements will be used: the audited financial statements of LAN Airlines S.A. at September 30, 2011, presented within Appendix 2 of this report, the audited financial statements of Sister Holdco S.A. at September 30, 2011, presented within Appendix 3 of this report, the proforma financial statements of Sister Holdco S.A. at September 30, 2011, presented within Appendix 3.1 of this report, the audited financial statements of Holdco II S.A. at September 30, 2011, presented within Appendix 4 of this report, and the proforma financial statements of Holdco II S.A. at September 30, 2011, presented within Appendix 4.1 of this report.
The proforma financial statements of Sister Holdco S.A. and Holdco II S.A. mentioned in the previous paragraph have been prepared considering that the contributions described in this section have been made and that none of the participating entities prior to the merger will consolidate their balance sheet with TAM S.A. because neither Holdco II S.A. or Sister Holdco S.A. would control, individually, that entity.
However, once the merger is complete, LAN Airlines S.A. will consolidate TAM S.A. Because of this, and for a better understanding of the shareholders, the audited financial statements of TAM S.A. at September 30, 2011 have been included within Appendix 5 of this report. Further, Appendix 5.1. to this report presents certain reclassifications made to the TAM S.A. balance sheet so that it conforms to LAN Airlines S.A.´s balance sheet, and Appendix 5.2 to this report presents the fair value adjustments of TAM S.A.´s assets and liabilities.
Lastly, this expert report has been issued considering the proposals made by the Boards of the participating entities and that will be presented to the respective Shareholder’s meetings, the Implementation Agreement and the Exchange Offer Agreement, both signed on January 18, 2011, and each and all of the conditions required for the consummation of the proposed merger.
To determine the proforma financial situation of the merger at September 30, 2011, the method described within IFRS 3 will be used, performing the adjustments to the financial statements and balances of the participating entities described within Appendix 1 of this report.
It must be noted that according to the information reviewed, after the merger has been completed, LAN Airlines S.A. will subscribe and pay enough voting shares in Holdco I S.A. to enable it to own up to 20% of the voting shares of that entity. Those shares shall be paid through the contribution of all TAM S.A.´s voting shares that LAN Airlines S.A. will own as a result of the consummation of the merger. Such situation is shown in the following diagram:
Situation by the End of the Merger
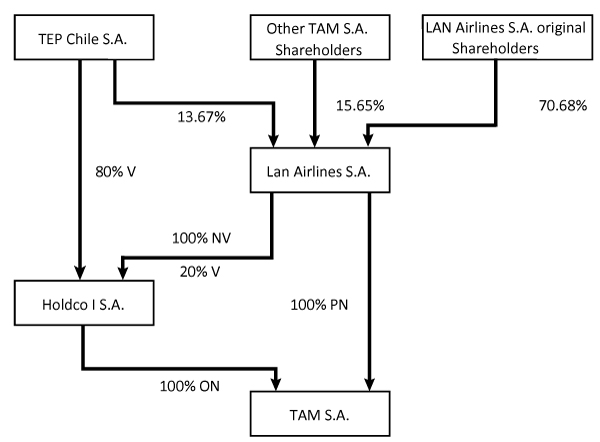
Notes:
V: Voting shares of Holdco I S.A.
NV: Non voting shares of Holdco I S.A.
ON: Voting shares of TAM S.A.
PN: Non voting shares of TAM S.A.
It was assumed for the purposes of this diagram that Holdco II S.A.´s exchange offer was accepted by 100% of the shareholders.
Situation immediately after the mergers


APPENDIX 3.1

APPENDIX 4.1
For a complete understanding of the assumptions used by this expert, Appendix 6 to this report contains a summary of the transaction prepared by the management of the participating entities.
| III. | EXCHANGE RATIO |
The consummation of the merger will occur through the incorporation of all the shareholders of Sister Holdco S.A. and Holdco II S.A. into LAN Airlines S.A., with the corresponding incorporation of all the equity of those entities into the surviving entity.
According to the information reviewed by this expert, the Boards of the participating entities have agreed to an exchange ratio of 0.90 LAN Airlines S.A. shares for each Sister Holdco S.A. and Holdco II S.A. share involved in the transaction. As has been informed to this expert, said exchange ratio was determined using the economic and market values of the participating entities, as was set forth in a report issued by JP Morgan, which has been made available for the understanding of the shareholders and public in general, on LAN Airlines S.A.´s web page www.lan.com, investor relations section.
4
According to the above, and under the assumption that each and all the conditions mentioned previously have been met and, especially, that the exchange offer made by Holdco II S.A. was accepted by 100% of its addressees, LAN Airlines S.A. will show an equity increase in the amount of ThUS$ 2,963,366 issuing 140,586,107 shares, incorporating the assets and liabilities, and all the shareholders of Sister Holdco S.A. and Holdco II S.A. into the surviving entity. To determine the number of shares to be issued, only subscribed and paid shares of TAM S.A. at September 30, 2011, were considered, excluding for these purposes shares pending subscription and payment under stock option programs of that entity. In the event that at the closing date of the merger these shares are subscribed and paid, and that they accept the exchange offer made by Holdco II S.A., the number of shares to be issued by LAN Airlines S.A. will need to increase up to a total of 142,555,882. Finally, the increase in the number of LAN Airlines S.A. shares considers the 2 shares already subscribed and paid at September 30, 2011 of Sister Holdco S.A. and the 2 shares already subscribed and paid at September 30, 2011, of Holdco II S.A.
Therefore, after the consummation of the merger, the shareholders of Sister Holdco S.A. will exchange their shares for 0.90 new shares of LAN Airlines S.A., acquiring a total of 65,554,076 new shares of LAN Airlines S.A. representing 13.67% of the total shares into which the equity is divided.
On the other hand, after the consummation of the merger, the shareholders of Holdco II S.A. will exchange their shares for 0.90 new shares of LAN Airlines S.A., acquiring a total of 75,032,031 new shares of LAN Airlines S.A. representing 15.65% of the total shares into which the equity is divided.
Notwithstanding the above, this expert notes that the total number of shares that will be delivered will depend on the total number of Holdco II S.A. shares that are subscribed and paid as a result of the exchange offer. Therefore, once the total number of shares involved in the transaction is known, the real equity effect for the merged LAN Airlines S.A. will be determined, as will the number of shares to be issued as a result of the merger.
| IV. | ACCOUNTING FRAMEWORK |
This expert report has been issued using the accounting framework within IFRS 3. This accounting framework requires, firstly, the identification of the acquiring entity, the remaining entities deemed the acquired ones. In this case it has been determined that LAN Airlines S.A. will be the acquiring entity and Sister Holdco S.A. and Holdco II S.A. the acquired ones.
According to IFRS 3, the acquiring entity must incorporate the acquired entities at the fair values of their assets and liabilities.
The assets and liabilities of Sister Holdco S.A. and Holdco II S.A. are comprised exclusively of the investment they would hold in TAM S.A. as has been mentioned previously within this report. At the consummation of the merger, those assets will become part of LAN Airlines S.A.´s assets, as the surviving entity, therefore, it is necessary to determine if the investment in TAM S.A. should be registered using the equity method, in case LAN Airlines S.A. holds significant influence, or if LAN Airlines S.A. should consolidate TAM S.A., in the case it has control.
According to the information that this technical expert has considered, and only from the perspective of accounting, there are technical factors that determine LAN Airlines S.A’s consolidation of TAM S.A. based on the following criteria (both due to direct investment in TAM S.A. shares as well as indirectly via Holdco I S.A.):
| · | LAN Airlines S.A. will receive 100% of the economic benefits generated by TAM S.A., meaning that it is substantially exposed to the totality of risks and benefits associated with ownership. This is the case because LAN Airlines S.A. will substantially receive - either directly as a shareholder in TAM S.A. or as owner of nonvoting stock in Holdco I S.A. (the company that will concentrate the TAM S.A. shares with voting rights) - the totality of dividends paid by TAM S.A., in addition to any future distribution or reduction in assents that said institution might undertake. |
| · | Existence of shareholder agreements to develop the activities of TAM S.A., in particular the pacts on corporate governance of (i) Holdco I S.A., between LAN Airlines S.A., TEP Chile S.A. and Holdco I S.A., and (ii) TAM S.A., between LAN Airlines S.A., TAM S.A., TEP Chile S.A. and Holdco I S.A., which establish special quorums on the board level (5 of 6 board members) and for shareholders meetings (95% in Holdco I S.A. and 85% in TAM S.A.), which provide effective protection to LAN Airlines S.A. in the operative and financial decisions of Holdco I S.A. and TAM S.A., respectively. The contents of this paragraph are consistent with the consolidation requirements presented in NIC 27 “Consolidated Financial Statements”. |
| · | The intention to operatively combine the two companies’ operations, as can be inferred from the aforementioned pacts. |
In addition, this technical expert notes that LAN Airlines S.A. retains the option of swapping its nonvoting stock in Holdco I S.A. for voting stock in the same company, an option that can be exercised at any time on the condition that Brazilian legislation allows it.
5
According to the above, and that once the merger is completed LAN Airlines S.A. will be in a position to consolidate its accounting records with TAM S.A., the fair value adjustments mentioned previously will be performed on the assets and liabilities of TAM S.A. and not Sister Holdco S.A. and Holdco II S.A. as the only asset these entities have is their direct or indirect investment in TAM S.A.
Therefore, Appendix 1 to this report has been prepared as follows:
| a. | The audited financial statements of LAN Airlines S.A. at September 30, 2011, presented within Appendix 2 to this report, have been used; |
| b. | The proforma financial statements at September 30, 2011, of Sister Holdco S.A. have also been used. These represent the investment in TAM S.A. and Holdco I S.A. immediately before the consummation of the merger, using as a reference the average market price of the TAM S.A. shares at September 30, 2011, and the market price of the Holdco I S.A. shares at the same date using as a reference the average market price of TAM S.A. shares at the same date as these are the main asset of that entity. These financial statements are included within Appendix 3.1 to this report; |
| c. | The proforma financial statements at September 30, 2011, of Holdco II S.A. have also been used. These represent the investment in TAM S.A. immediately before the consummation of the merger, using as a reference the average market price of the TAM S.A. shares at September 30, 2011. These financial statements are included within Appendix 4.1 to this report; |
| d. | The following adjustments have been included to determine the merged balance sheet: |
| i. | The equity of Sister Holdco S.A. and Holdco II S.A. have been eliminated; |
| ii. | LAN Airlines S.A.´s share issuance and other equity adjustments that reflect the number of shares to be issued has been included; and |
| iii. | As a result of the accounting consolidation of TAM S.A., the investments in TAM S.A. recorded by Sister Holdco S.A. and Holdco II S.A. have been eliminated, incorporating, on a line by line basis, the assets and liabilities of TAM S.A. at their fair values, recording goodwill appropriately and also other consolidation adjustments. |
In order to reflect the acquisition under IFRS 3, the purchase price has been estimated at ThUS$ 2,963,366 in accordance with the information contained in all the documents reviewed by this expert, especially considering that the exchange ratio is 0.90 LAN Airlines S.A. shares for each Holdco II S.A. or Sister Holdco S.A. share involved in the merger.
6
| i. | Holdco II S.A. shares involved in the merger at September 30, 2011: 83,368,923. This number of shares represents 100% of the subscribed and paid shares of TAM S.A. at September 30, 2011, that would be exchanged through the tender, excluding for these calculations the shares pending subscription and payment under stock option programs. It also considers the 2 shares already subscribed and paid at September 30, 2011 of Holdco II S.A. |
| ii. | Sister Holdco S.A. shares involved in the merger at September 30, 2011: 72,837,862. This number of shares considers the number of shares issued by Sister Holdco S.A. as a result of the contribution of 47,652,705 non voting shares in Holdco I S.A., the contribution of 62 voting shares of Holdco I S.A. and the contribution of 25,185,155 non voting shares of TAM S.A. It also considers 2 shares already subscribed and paid at September 30, 2011 of Sister Holdco S.A. |
| iii. | Exchange ratio: 0.9 LAN Airlines S.A. shares for each Holdco II S.A. and Sister Holdco S.A. share. |
| iv. | Number of LAN Airlines S.A. shares to be issued: 140,586,107 |
| v. | Price per share: US$ 21.07866 |
| vi. | Purchase price: ThUS$ 2,963,366 |
Based on the above, the financial position of the entities to be merged, after the consummation of the merger, is the consolidated balance sheet and corresponding adjustments presented within Appendix 1 to this report.
| V. | DOCUMENTS REVIEWED |
The following documents have been reviewed and have served to prepare the proforma financial situation at September 30, 2011 of the merger of Sister Holdco S.A. and Holdco II S.A. with and into LAN Airlines S.A.:
| · | Extraordinary Board meeting of LAN Airlines S.A. dated August 13, 2010, and the communication sent to the Superintendencia de Valores y Seguros, regarding such Extraordinary Board meeting, in the form of an Hecho Esencial, dated August 13, 2010. |
| · | Extraordinary Board meeting of LAN Airlines S.A. dated January 18, 2011, and the communication sent to the Superintendencia de Valores y Seguros, regarding such Extraordinary Board meeting, in the form of an Hecho Esencial, dated January 19, 2010. |
| · | The consolidated financial statements of LAN Airlines S.A. audited by PricewaterhouseCoopers Consultores, Auditores y Compañía Limitada at September 30, 2011. |
| · | The consolidated financial statements of TAM S.A. audited by PricewaterhouseCoopers Auditores Independentes at September 30, 2011. |
| · | The financial statements of Sister Holdco S.A. audited by PricewaterhouseCoopers Consultores, Auditores y Compañía Limitada at September 30, 2011. |
| · | The proforma financial statements at September 30, 2011, of Sister Holdco S.A. |
| · | The financial statements of Holdco II S.A. audited by PricewaterhouseCoopers Consultores, Auditores y Compañía Limitada at September 30, 2011 and the shareholders agreements annexed to the Implementation Agreement. |
| · | The proforma financial statements at September 30, 2011, of Holdco II S.A. |
| · | Implementation Agreement dated January 18, 2011. |
| · | Exchange Offer Agreement dated January 18, 2011. |
7
| · | Consolidated proforma balance sheet prepared by the participating entities at September 30, 2011. |
This expert declares that he has reviewed the balance sheet for the merger prepared by management of the participating entities, agreeing on the notes and criteria used, and that he has performed such other procedures deemed reasonable under the circumstances, considering that these reasonably represent the accounting principles used by LAN Airlines S.A.
| VI. | LEGAL TAX AND ACCOUNTING CONSIDERATIONS |
The merger by incorporation with and into LAN Airlines S.A., RUT N° 89.862.200-2 (continuing entity) of Sister Holdco S.A. RUT N° 76.153.047-K and Holdco II S.A. RUT N° 76.153.208-1 (entities that will dissolve), will be completed once they are approved by the Shareholders’ meeting of each of the participating entities and only if each and all of the conditions of the mergers are met.
Once the merger is completed, the asset and liability accounts of Sister Holdco S.A. and Holdco II S.A., that will represent the TAM S.A. shares, will be incorporated into LAN Airlines S.A.´s equity at their fair values, having to control the tax values of the assets and liabilities according to article 64, fourth paragraph, of the Tax Code and administrative jurisprudence of the Internal Revenue Service (Servicio de Impuestos Internos).
Taking into consideration that the final amount of assets to be incorporated as a result of Holdco II S.A. will only be known at the completion of the merger, LAN Airlines S.A. will have to perform the necessary adjustments to reflect the real equity and stock position.
| VII. | CONCLUSION |
In the opinion of the signatory, the financial situation of the entities that are intended to merge presented within Appendix 1 to this report, reflects the equity situation of the entities according to IFRS 3, in the event that each and all the conditions necessary for the completion of the merger described in this report are met. Therefore, if the assumptions are not met, the conclusions of this report could vary substantially.
As was informed to this expert, the exchange ratio was determined by agreement of the Boards of the participating entities according to the economic value of the entities involved.
Therefore, if the assumptions used to prepare this report are met, that is that the conditions necessary for the completion of the merger are achieved, that the contributions described are made, and that Holdco II S.A.´s exchange offer is accepted by 100% of the currently subscribed and paid shares, in the opinion of the signatory, LAN Airlines S.A. would need to issue 140.586.107 new shares to incorporate as new shareholders the shareholders of Sister Holdco S.A. and Holdco II S.A., delivering 0,9 LAN Airlines S.A. shares for each share they owned in the absorbed entities.
However, this expert notes that given the characteristics of the merger, the final number of shares to be issued and delivered in exchange will be determined once the conditions are met and the merger is consummated.
For this reason, only once the merger is consummated, will the equity absorbed, the adjustments and, consequently, the consolidated equity of LAN Airlines S.A. reflecting the exact increase in capital and other equity adjustments in the merged LAN Airlines S.A., the total number of shares delivered in exchange and their value and goodwill, and any non-controlling interest that could arise as a consequence of not acquiring 100% of the TAM S.A. shares through the exchange offer made by Holdco II S.A., will be known.
8
| VIII. | STATEMENT OF THE EXPERT |
The signatory declares that he has reviewed all the information referred to in this report, and presents it to the shareholders of LAN Airlines S.A., Sister Holdco S.A. and Holdco II S.A. with the sole purpose of helping them in the definition of the terms and conditions of the merger.
This report is for the exclusive use and knowledge of the management, board and shareholders of LAN Airlines S.A., Sister Holdco S.A. and Holdco II S.A., and has been prepared with the sole purpose mentioned previously and, therefore, should not be used for any other purpose without the express knowledge of the signatory.
Finally, as required by article N° 22 of the Rules of the Corporation Law, this expert declares he is responsible for the statements contained within this report.
Enrique Cid Corral
RUT N° 12.290.415-6
R. Aud. Ext. SVS N° 663
This technical report is issued on 1 December 2011 and complemented on 20 December 2011 according to the requirements of the Securities and Insurance Superintendence
***********
Forward-Looking Statements
This document contains forward-looking statements, including with respect to the negotiation, implementation and effects of the proposed combination. Such statements may include words such as “anticipate,” “estimate,” “expect,” “project,” “intend,” “plan,” “believe,” “would” or other similar expressions. Forward-looking statements are statements that are not historical facts, including statements about our beliefs and expectations.
These statements are based on current plans, estimates and projections, and, therefore, you should not place undue reliance on them. Forward-looking statements involve inherent risks and uncertainties. We caution you that a number of important factors could cause actual results to differ materially from those contained in any forward-looking statement. These factors and uncertainties include in particular those described in the documents we have filed with the U.S. Securities and Exchange Commission. Forward-looking statements speak only as of the date they are made, and we undertake no obligation to update publicly any of them, whether in light of new information, future events or otherwise.
9
ADDITIONAL INFORMATION ABOUT THE PROPOSED BUSINESS COMBINATION AND WHERE TO FIND IT:
This document relates to a proposed business combination between Lan Airlines S.A. (“LAN”) and TAM S.A. (“TAM”), which is the subject of a registration statement and prospectus filed with the SEC by LAN and a new entity formed in connection with the combination. This document is not a substitute for the registration statement, prospectus and offering materials that LAN and the new entity filed with the SEC or any other documents that they may file with the SEC or send to shareholders in connection with the proposed combination. INVESTORS AND SECURITY HOLDERS ARE URGED TO READ THE REGISTRATION STATEMENT, PROSPECTUS, EXCHANGE OFFER DOCUMENTS AND ALL OTHER RELEVANT DOCUMENTS FILED OR THAT WILL BE FILED WITH THE SEC AS THEY BECOME AVAILABLE BECAUSE THEY WILL CONTAIN IMPORTANT INFORMATION ABOUT THE PROPOSED BUSINESS COMBINATION. All such documents, if filed, would be available free of charge at the SEC’s website (www.sec.gov) or by directing a request to LAN Investor Relations, at 56-2-565-8785 or by e-mail at investor.relations@lan.com, or to TAM Investor Relations, at 55-11-5582-9715 or by e-mail at invest@tam.com.br.
10
APPENDIX 1
PROFORMA CONSOLIDATED FINANCIAL STATEMENTS
| Holdco II S.A. | Sister Holdco | Elimination of the | Proforma | Proforma | ||||||||||||||||||||
| LAN Airlines S.A. | Proforma | S.A. Proforma | investment | Adjustments | Combined | |||||||||||||||||||
| THUS$ | THUS$ | THUS$ | THUS$ | THUS$ | THUS$ | |||||||||||||||||||
| CURRENT ASSETS: | ||||||||||||||||||||||||
| Cash and cash equivalents | 233,461 | - | - | 277,741 | 511,202 | |||||||||||||||||||
| Other financial assets | 228,527 | 763,820 | 992,347 | |||||||||||||||||||||
| Other non-financial assets | 33,275 | 16,987 | 50,262 | |||||||||||||||||||||
| Trade and other accounts receivable | 527,315 | 1,098,850 | 1,626,165 | |||||||||||||||||||||
| Accounts receivable from related entities | 1,324 | - | 1,324 | |||||||||||||||||||||
| Inventories | 66,211 | 91,431 | 157,642 | |||||||||||||||||||||
| Tax Assets | 115,416 | 326,452 | 441,868 | |||||||||||||||||||||
| Total current assets | 1,205,529 | - | - | - | 2,575,281 | 3,780,810 | ||||||||||||||||||
| Current assets held for sale | 4,398 | 10,534 | 14,932 | |||||||||||||||||||||
| Total current assets | 1,209,927 | - | - | - | 2,585,815 | 3,795,742 | ||||||||||||||||||
| NON-CURRENT ASSETS: | ||||||||||||||||||||||||
| Other financial assets | 21,876 | 152,860 | 174,736 | |||||||||||||||||||||
| Other non-financial assets | 36,337 | 321,474 | 357,811 | |||||||||||||||||||||
| Rights receivable | 7,533 | 1,753 | 9,286 | |||||||||||||||||||||
| Equity accounted investments | 1,118 | - | 1,118 | |||||||||||||||||||||
| Other investments | - | 1,314,260 | 1,121,096 | (2,435,356 | ) | - | - | |||||||||||||||||
| Intangible assets other than goodwill | 59,263 | 1,578,858 | 1,638,121 | |||||||||||||||||||||
| Goodwill | 164,721 | 1,160,898 | 1,325,619 | |||||||||||||||||||||
| Property, plant and equipment | 5,513,256 | 4,848,504 | 10,361,760 | |||||||||||||||||||||
| Deferred tax assets | 58,470 | 115,120 | 173,590 | |||||||||||||||||||||
| Total non-current assets | 5,862,574 | 1,314,260 | 1,121,096 | (2,435,356 | ) | 8,179,467 | 14,042,041 | |||||||||||||||||
| Total Assets | 7,072,501 | 1,314,260 | 1,121,096 | (2,435,356 | ) | 10,765,282 | 17,837,783 | |||||||||||||||||
| Holdco II S.A. | Sister Holdco | Elimination of the | Proforma | Proforma | ||||||||||||||||||||
| LAN Airlines S.A. | Proforma | S.A. Proforma | investment | Adjustments | Combined | |||||||||||||||||||
| THUS$ | THUS$ | THUS$ | THUS$ | THUS$ | THUS$ | |||||||||||||||||||
| LIABILITIES: | ||||||||||||||||||||||||
| Other financial liabilities | 604,853 | 1,025,980 | 1,630,833 | |||||||||||||||||||||
| Trade and other accounts payable | 593,356 | 776,206 | 1,369,562 | |||||||||||||||||||||
| Accounts payable to related entities | 444 | - | 444 | |||||||||||||||||||||
| Other provisions | 1,116 | - | 1,116 | |||||||||||||||||||||
| Tax liabilities | 27,067 | 81,098 | 108,165 | |||||||||||||||||||||
| Other non-financial liabilities | 878,230 | 845,515 | 1,723,745 | |||||||||||||||||||||
| Total current liabilities | 2,105,066 | - | - | - | 2,728,799 | 4,833,865 | ||||||||||||||||||
| NON-CURRENT LIABILITIES: | ||||||||||||||||||||||||
| Other financial liabilities | 2,823,334 | 3,848,325 | 6,671,659 | |||||||||||||||||||||
| Other accounts payable | 416,735 | 255,659 | 672,394 | |||||||||||||||||||||
| Other provisions | 34,507 | 209,561 | 244,068 | |||||||||||||||||||||
| Deferred tax liabilities | 343,370 | 489,861 | 833,231 | |||||||||||||||||||||
| Employee benefits | 12,145 | - | 12,145 | |||||||||||||||||||||
| Other non-current liabilities | - | 231,283 | 231,283 | |||||||||||||||||||||
| Total non-current liabilities | 3,630,091 | - | - | - | 5,034,689 | 8,664,780 | ||||||||||||||||||
| - | - | |||||||||||||||||||||||
| Total liabilities | 5,735,157 | - | - | - | 7,763,488 | 13,498,645 | ||||||||||||||||||
| EQUITY: | ||||||||||||||||||||||||
| Share capital | 461,975 | 765,740 | 651,899 | (1,417,639 | ) | 1,417,639 | 1,879,614 | |||||||||||||||||
| Share premium | - | 548,520 | 469,197 | (1,017,717 | ) | - | ||||||||||||||||||
| Other reserves | 1,083,584 | - | 1,083,584 | |||||||||||||||||||||
| Other equity interests | 2,886 | 1,545,727 | 1,548,613 | |||||||||||||||||||||
| Other reserves | (215,227 | ) | - | (215,227 | ) | |||||||||||||||||||
| Equity attributable to owners of parent | 1,333,218 | 1,314,260 | 1,121,096 | (2,435,356 | ) | 2,963,366 | 4,296,584 | |||||||||||||||||
| Non-controlling interest | 4,126 | 38,428 | 42,554 | |||||||||||||||||||||
| Total equity | 1,337,344 | 1,314,260 | 1,121,096 | (2,435,356 | ) | 3,001,794 | 4,339,138 | |||||||||||||||||
| - | - | |||||||||||||||||||||||
| Total liabilities and equity | 7,072,501 | 1,314,260 | 1,121,096 | (2,435,356 | ) | 10,765,282 | 17,837,783 | |||||||||||||||||
NOTES TO THE PREPARATION OF THE PROFORMA BALANCE SHEET
The proforma balance sheet gives effect to the merger of Sister Holdco S.A. and Holdco II S.A. with and into LAN Airlines S.A. according to IFRS 3, in the event each and all the conditions and assumptions used to prepare this report are met.
The consolidated merger balance sheet presented in the previous table is constructed as follows:
| 1. | The LAN Airlines S.A. consolidated balance sheet at September 30, 2011 is presented in the first column, as obtained from its financial statements presented within Appendix 2 to this report. |
| 2. | The Holdco II S.A. proforma balance sheet at September 30, 2011 is presented in the second column, as obtained from its proforma financial statements presented within Appendix 4.1 to this report. |
| 3. | The Sister Holdco S.A. proforma balance sheet at September 30, 2011 is presented in the third column, as obtained from its proforma financial statements presented within Appendix 3.1 to this report. |
| 4. | The fourth column reflects the elimination of Sister Holdco S.A. and Holdco II S.A.´s investment in TAM S.A. and Holdco I S.A. against the equity accounts. As has been described within this report, once the merger is completed and in accordance with International Financial Reporting Standards (IFRS), LAN Airlines S.A. will begin consolidating TAM S.A., therefore, it is necessary to eliminate the financial investment and begin recognising the assets and liabilities, adjustment that will be incorporated in the next column of the table. |
| 5. | According to the aforementioned N° 4, the next column incorporates, on a line by line basis, the assets and liabilities of TAM S.A. at their fair values, which have been determined as described within Appendix 5.2 to this report. Additionally, the same column incorporates the capital and other equity accounts increase that LAN Airlines S.A. records as a result of the issuance of shares to deliver in order to complete the merger. Lastly, it incorporates the goodwill generated by the merger. |
| 6. | The last column shows the financial position resulting from the merger. |
The purchase price, equivalent to the capital and other equity accounts increase registered by LAN Airlines S.A. referred to in the aforementioned number 5, is determined as follows:
| i. | Holdco II S.A. shares involved in the merger at September 30, 2011: 83,368,923. This number of shares represents 100% of the subscribed and paid shares of TAM S.A. at September 30, 2011, that would be exchanged through the tender, excluding for these calculations the shares pending subscription and payment under stock option programs. It also considers the 2 shares already subscribed and paid at September 30, 2011 of Holdco II S.A. |
| ii. | Sister Holdco S.A. shares involved in the merger at September 30, 2011: 72,837,862. This number of shares considers the number of shares issued by Sister Holdco S.A. as a result of the contribution of 47,652,705 non voting shares in Holdco I S.A., the contribution of 62 voting shares of Holdco I S.A. and the contribution of 25,185,155 non-voting shares of TAM S.A. It also considers 2 shares already subscribed and paid at September 30, 2011 of Sister Holdco S.A. |
| iii. | Exchange ratio: 0.9 LAN Airlines S.A. shares for each Holdco II S.A. and Sister Holdco S.A. share. |
| iv. | Number of LAN Airlines S.A. shares to be issued: 140,586,107 |
| v. | Price per share: US$ 21.07866 |
| vi. | Purchase price: ThUS$ 2,963,366 |
As has been informed to this expert, it will be proposed to the Shareholders’ meeting that LAN Airlines S.A. increase its capital in the amount of ThUS$ 1,417,639, which equals the sum of the statutory capital of Sister Holdco S.A. and Holdco II S.A.
Therefore, the purchase price will be distributed as follows:
| i. | As a capital increase in the amount of ThUS$ 1,417,639; |
| ii. | As an adjustment to the equity reserve denominated “Other equity interests” in the amount of ThUS$ 1,545,727. |
The goodwill that is generated and referred to in the aforementioned number 5 is obtained the following way:
Purchase price: ThUS$ 2,963,366
(Less) Fair value of assets and liabilities acquired: ThUS$ 1,861,529
(Plus) TAM S.A.´s non-controlling interest: ThUS$ 38,428
Goodwill: ThUS$ 1,140,265
A description of certain reclassifications of asset and liability accounts made to TAM S.A.´s balance sheet so that it conforms to LAN Airlines S.A.´s balance sheet can be found within Appendix 5.1 to this report.
In order to prepare the proforma consolidated balance sheet presented in the previous table, Holdco II S.A.´s exchange offer has been assumed 100% successful. The following table presents, for illustrative purposes only, the equity, non-controlling interest and goodwill that would arise if only 95% accept the exchange, minimum condition to complete the merger.
| Acceptance percentage | ||||||||
| Effect on | 100 | % | 95 | % | ||||
| ThUS$ | ThUS$ | |||||||
| Goodwill generated by the transaction | 1,140,265 | 1,085,174 | ||||||
| Purchase price | 2,963,366 | 2,815,198 | ||||||
| Non-controlling interest | 38,428 | 131,504 | ||||||
APPENDIX 2
AUDITED FINANCIAL STATEMENTS OF LAN AIRLINES S.A. AT SEPTEMBER 30, 2011
LAN AIRLINES S.A. AND SUBSIDIARIES
INTERIM CONSOLIDATED FINANCIAL STATEMENTS
SEPTEMBER 30, 2011
| CONTENTS | |
| Interim Consolidated Statement of Financial Position | 5 |
| Interim Consolidated Statement of Income by Function | 7 |
| Interim Consolidated Statement of Comprehensive Income | 8 |
| Interim Consolidated Statement of Changes in Equity | 9 |
| Interim Consolidated Statement of Cash Flows - Direct Method | 11 |
| Notes to the Consolidated Financial Statements | 12 |
| CLP | - CHILEAN PESO |
| ARS | - ARGENTINE PESO |
| US$ | - UNITED STATES DOLLAR |
| THUS$ | - THOUSANDS OF UNITED STATES DOLLARS |
1
REPORT OF INDEPENDENT AUDITORS
Santiago, November 11, 2011
To the Board of Directors and Shareholders of Lan Airlines S.A.
| 1 | We have reviewed the accompanying interim consolidated statement of financial position of Lan Airlines S.A. and its subsidiaries as of September 30, 2011, and the related interim consolidated statements of income by function and comprehensive income for the nine and three-month periods ended September 30, 2011 and 2010, and the changes in equity and cash flows for the nine month periods ended on those dates. Management of Lan Airlines S.A. is responsible for the preparation and fair presentation of these interim consolidated financial statements and related notes in accordance with IAS 34 “Interim Financial Reporting” incorporated in the International Financial Reporting Standards (IFRS). Our responsibility is to issue a report on these consolidated interim financial statements based on our review. |
| 2 | We conducted our review in accordance with audit standards established in Chile for a review of interim financial statements. A review of interim financial statements consists of making inquiries, primarily of persons responsible for financial and accounting matters, and applying analytical and other review procedures. A review is substantially less in scope than an audit conducted in accordance with generally accepted auditing standards in Chile, for which the objective is to express an opinion on the consolidated financial statements. Accordingly, we do not express an audit opinion. |
| 3 | Based on our review, we have no knowledge of any significant modification that should be made to the interim consolidated financial statements referred to above for them to be in accordance with IAS 34 incorporated in the International Financial Reporting Standards. |
| 4 | On March 1, 2011, we issued an unqualified opinion on the consolidated financial statements as of December 31, 2010 and 2009 of Lan Airlines S.A. and its subsidiaries, which include the statement of financial position as of December 31, 2010 presented in the accompanying consolidated financial statements, in addition to the corresponding notes. |
Renzo Corona Spedaliere
RUT: 6.373.028-9
2
Contents of the notes to the consolidated financial statements of Lan Airlines S.A. and Subsidiaries.
| Notes | Page | |
| 1 | General information | 12 |
| 2 | Summary of significant accounting policies | 16 |
| 2.1. | Preparation | 16 |
| 2.2. | Consolidation | 17 |
| 2.3. | Foreign currency transactions | 18 |
| 2.4. | Property, plant and equipment | 19 |
| 2.5. | Intangible assets | 20 |
| 2.6. | Goodwill | 20 |
| 2.7. | Borrowing costs | 20 |
| 2.8. | Losses for impairment of non-financial assets | 20 |
| 2.9. | Financial assets | 20 |
| 2.10. | Derivative financial instruments and hedging activities | 22 |
| 2.11. | Inventories | 23 |
| 2.12. | Trade and other accounts receivable | 23 |
| 2.13. | Cash and cash equivalents | 23 |
| 2.14. | Capital | 23 |
| 2.15. | Trade and other accounts payable | 23 |
| 2.16. | Interest-bearing loans | 24 |
| 2.17. | Deferred taxes | 24 |
| 2.18. | Employee benefits | 24 |
| 2.19. | Provisions | 25 |
| 2.20. | Revenue recognition | 25 |
| 2.21. | Leases | 26 |
| 2.22. | Non-current assets (or disposal groups) classified as held for sale | 26 |
| 2.23. | Maintenance | 26 |
| 2.24. | Environment costs | 26 |
| 3 | Financial risk management | 27 |
| 3.1. | Financial risk factors | 27 |
| 3.2. | Capital risk management | 34 |
| 3.3. | Estimates of fair value | 35 |
| 4 | Accounting estimates and judgments | 38 |
| 5 | Segmental Information | 39 |
| 6 | Cash and cash equivalents | 41 |
| 7 | Financial instruments | 42 |
| 7.1. | Financial instruments by category | 42 |
| 7.2. | Financial instruments by currency | 44 |
| 8 | Trade, other accounts receivable and non-current rights receivable | 45 |
| 9 | Accounts receivable from/payable to related entities | 48 |
| 10 | Inventories | 50 |
| 11 | Other financial assets | 51 |
| 12 | Other non financial assets | 53 |
| 13 | Non-current assets (or disposal groups) classified as held for sale | 55 |
| 14 | Investments in subsidiaries | 56 |
| 15 | Equity accounted investments | 59 |
3
| Notes | Page | |
| 16 | Intangible assets other than goodwill | 61 |
| 17 | Goodwill | 63 |
| 18 | Property, plant and equipment | 64 |
| 19 | Income taxes | 73 |
| 20 | Other financial liabilities | 80 |
| 21 | Trade and other current accounts payable | 85 |
| 22 | Other provisions | 88 |
| 23 | Other current non-financial liabilities | 91 |
| 24 | Employee benefits | 92 |
| 25 | Other non-current accounts payable | 94 |
| 26 | Equity | 95 |
| 27 | Revenue | 101 |
| 28 | Costs and expenses by nature | 102 |
| 29 | Gains (losses) on the sale of non-current assets not classified as held for sale | 104 |
| 30 | Other income, by function | 105 |
| 31 | Foreign currency and exhange rate differences | 106 |
| 32 | Earnings per share | 113 |
| 33 | Contingencies | 114 |
| 34 | Commitments | 120 |
| 35 | Transactions with related parties | 124 |
| 36 | Share-based payments | 127 |
| 37 | The environment | 128 |
| 38 | Subsequent events | 129 |
| 39 | Business combinations | 130 |
4
LAN AIRLINES S.A. AND SUBSIDIARIES
CONSOLIDATED STATEMENT OF FINANCIAL POSITION
ASSETS | As of | As of | ||||||||||
| September 30, | December 31, | |||||||||||
| Note | 2011 | 2010 | ||||||||||
| ThUS$ | ThUS$ | |||||||||||
| Current Assets | ||||||||||||
| Cash and cash equivalents | 6 - 7 | 233,461 | 631,052 | |||||||||
| Other financial assets | 7 - 11 | 228,527 | 245,451 | |||||||||
| Other non-financial assets | 12 | 33,275 | 18,820 | |||||||||
| Trade and other accounts receivable | 7 - 8 | 527,315 | 481,350 | |||||||||
| Accounts receivable from related entities | 7 - 9 | 1,324 | 50 | |||||||||
| Inventories | 10 | 66,211 | 53,193 | |||||||||
| Tax assets | 115,416 | 97,656 | ||||||||||
| Total current assets other than non-current assets (or disposal groups) classified as held for sale | 1,205,529 | 1,527,572 | ||||||||||
| Non-current assets (or disposal groups) classified as held for sale | 13 | 4,398 | 5,497 | |||||||||
| Total current assets | 1,209,927 | 1,533,069 | ||||||||||
| Non-current Assets | ||||||||||||
| Other financial assets | 7 - 11 | 21,876 | 21,587 | |||||||||
| Other non-financial assets | 12 | 36,337 | 32,508 | |||||||||
| Rights receivable | 7 - 8 | 7,533 | 7,883 | |||||||||
| Equity accounted investments | 15 | 1,118 | 593 | |||||||||
| Intangible assets other than goodwill | 16 | 59,263 | 45,749 | |||||||||
| Goodwill | 17 | 164,721 | 157,994 | |||||||||
| Property, plant and equipment | 18 | 5,513,256 | 4,948,430 | |||||||||
| Deferred tax assets | 19 | 58,470 | 38,084 | |||||||||
| Total non-current assets | 5,862,574 | 5,252,828 | ||||||||||
| Total assets | 7,072,501 | 6,785,897 | ||||||||||
The accompanying Notes 1 to 39 form an integral part of these consolidated financial statements.
5
LAN AIRLINES S.A. AND SUBSIDIARIES
CONSOLIDATED STATEMENT OF FINANCIAL POSITION
| LIABILITIES AND EQUITY | As of | As of | ||||||||||
| September 30, | December 31, | |||||||||||
| Note | 2011 | 2010 | ||||||||||
| ThUS$ | ThUS$ | |||||||||||
| LIABILITIES | ||||||||||||
| Current liabilities | ||||||||||||
| Other financial liabilities | 7 - 20 | 604,853 | 542,624 | |||||||||
| Trade and other accounts payable | 7 - 21 | 593,356 | 645,571 | |||||||||
| Accounts payable to related entities | 7 - 9 | 444 | 184 | |||||||||
| Other provisions | 22 | 1,116 | 753 | |||||||||
| Tax liabilities | 27,067 | 15,736 | ||||||||||
| Other non-financial liabilities | 23 | 878,230 | 939,151 | |||||||||
| Total current liabilities | 2,105,066 | 2,144,019 | ||||||||||
| Non-current liabilities | ||||||||||||
| Other financial liabilities | 7 - 20 | 2,823,334 | 2,562,348 | |||||||||
| Other accounts payable | 7 - 25 | 416,735 | 425,681 | |||||||||
| Other provisions | 22 | 34,507 | 32,120 | |||||||||
| Deferred tax liabilities | 19 | 343,370 | 312,012 | |||||||||
| Employee benefits | 24 | 12,145 | 9,657 | |||||||||
| Total non-current liabilities | 3,630,091 | 3,341,818 | ||||||||||
| Total liabilities | 5,735,157 | 5,485,837 | ||||||||||
| EQUITY | ||||||||||||
| Share capital | 26 | 461,975 | 453,444 | |||||||||
| Retained earnings | 26 | 1,083,584 | 949,214 | |||||||||
| Other equity interests | 26 | 2,886 | 5,463 | |||||||||
| Other reserves | 26 | (215,227 | ) | (111,307 | ) | |||||||
| Equity attributable to owners of the parent | 1,333,218 | 1,296,814 | ||||||||||
| Non-controlling interests | 4,126 | 3,246 | ||||||||||
| Total equity | 1,337,344 | 1,300,060 | ||||||||||
| Total liabilities and equity | 7,072,501 | 6,785,897 | ||||||||||
The accompanying Notes 1 to 39 form an integral part of these consolidated financial statements.
6
LAN AIRLINES S.A. AND SUBSIDIARIES
CONSOLIDATED STATEMENT OF INCOME BY FUNCTION
| For the nine months ended | For the three months ended | |||||||||||||||||||
| September 30, | September 30, | |||||||||||||||||||
| Note | 2011 | 2010 | 2011 | 2010 | ||||||||||||||||
| ThUS$ | ThUS$ | ThUS$ | ThUS$ | |||||||||||||||||
| Revenue | 27 | 4,083,462 | 3,131,924 | 1,455,443 | 1,122,292 | |||||||||||||||
| Cost of sales | (3,017,929 | ) | (2,171,413 | ) | (1,044,289 | ) | (766,176 | ) | ||||||||||||
| Gross margin | 1,065,533 | 960,511 | 411,154 | 356,116 | ||||||||||||||||
| Other income | 30 | 99,473 | 88,926 | 31,077 | 30,038 | |||||||||||||||
| Distribution costs | (347,768 | ) | (276,144 | ) | (121,667 | ) | (97,335 | ) | ||||||||||||
| Administrative expenses | (289,117 | ) | (233,339 | ) | (99,741 | ) | (87,192 | ) | ||||||||||||
| Other expenses | (157,872 | ) | (127,832 | ) | (59,619 | ) | (45,012 | ) | ||||||||||||
| Other gains/(losses) | (36,868 | ) | (6,172 | ) | (11,484 | ) | (3,788 | ) | ||||||||||||
| Financial income | 9,687 | 10,390 | 1,063 | 5,284 | ||||||||||||||||
| Financial costs | 28 | (104,610 | ) | (116,545 | ) | (34,398 | ) | (38,045 | ) | |||||||||||
| Equity accounted earnings | 15 | 471 | 153 | 508 | 34 | |||||||||||||||
| Foreign exchange gains/(losses) | 31 | 6,184 | 6,731 | (1,927 | ) | 9,117 | ||||||||||||||
| Result of indexation units | 52 | 22 | 2 | 36 | ||||||||||||||||
| Income before taxes | 245,165 | 306,701 | 114,968 | 129,253 | ||||||||||||||||
| Income tax expense | 19 | (40,941 | ) | (50,227 | ) | (17,661 | ) | (20,157 | ) | |||||||||||
| NET INCOME FOR THE PERIOD | 204,224 | 256,474 | 97,307 | 109,096 | ||||||||||||||||
Income attributable to owners of the parent | 207,697 | 255,143 | 94,513 | 106,214 | ||||||||||||||||
Income attributable to non-controlling interests | (3,473 | ) | 1,331 | 2,794 | 2,882 | |||||||||||||||
| Net income for the period | 204,224 | 256,474 | 97,307 | 109,096 | ||||||||||||||||
| EARNINGS PER SHARE | ||||||||||||||||||||
| Basic earnings per share (US$) | 32 | 0.61218 | 0.75310 | 0.27852 | 0.31351 | |||||||||||||||
| Diluted earnings per share (US$) | 32 | 0.61099 | 0.75137 | 0.27802 | 0.31268 | |||||||||||||||
The accompanying Notes 1 to 39 form an integral part of these consolidated financial statements.
7
LAN AIRLINES S.A. AND SUBSIDIARIES
CONSOLIDATED STATEMENT OF COMPREHENSIVE INCOME
| For the nine months ended | For the three months ended | ||||||||||||||||||
| September 30, | September 30, | ||||||||||||||||||
| Note | 2011 | 2010 | 2011 | 2010 | |||||||||||||||
| ThUS$ | ThUS$ | ThUS$ | ThUS$ | ||||||||||||||||
| NET INCOME | 204,224 | 256,474 | 97,307 | 109,096 | |||||||||||||||
| Components of other comprehensive income, before taxes | |||||||||||||||||||
| Currency translation differences | |||||||||||||||||||
| Gains (losses) on currency translation, before tax | 31 | (9,507 | ) | (150 | ) | (610 | ) | 2,619 | |||||||||||
| Other comprehensive income, before taxes, currency translation differences | (9,507 | ) | (150 | ) | (610 | ) | 2,619 | ||||||||||||
| Cash flow hedges | |||||||||||||||||||
| Gains (losses) on cash flow hedges before tax | 20 | (115,913 | ) | (76,973 | ) | (80,948 | ) | 2,827 | |||||||||||
| Other comprehensive income, before taxes, cash flow hedges | (115,913 | ) | (76,973 | ) | (80,948 | ) | 2,827 | ||||||||||||
| Other components of other comprehensive income, before taxes | (125,420 | ) | (77,123 | ) | (81,558 | ) | 5,446 | ||||||||||||
| Income tax relating to components of other comprehensive income | |||||||||||||||||||
| Income tax related to currency translation differences in other comprehensive income | 19 | 1,615 | 26 | 103 | (445 | ) | |||||||||||||
| Income tax related to cash flow hedges in other comprehensive income | 19 | 19,705 | 13,085 | 13,761 | (481 | ) | |||||||||||||
| Amount of income taxes related to components of other comprehensive income | 21,320 | 13,111 | 13,864 | (926 | ) | ||||||||||||||
| Other comprehensive income | (104,100 | ) | (64,012 | ) | (67,694 | ) | 4,520 | ||||||||||||
| Total comprehensive income | 100,124 | 192,462 | 29,613 | 113,616 | |||||||||||||||
| Comprehensive income attributable to owners of the parent | 103,777 | 191,167 | 26,822 | 110,742 | |||||||||||||||
| Comprehensive income attributable to non-controlling interests | (3,653 | ) | 1,295 | 2,791 | 2,874 | ||||||||||||||
| TOTAL COMPREHENSIVE INCOME | 100,124 | 192,462 | 29,613 | 113,616 | |||||||||||||||
The accompanying Notes 1 to 39 form an integral part of these consolidated financial statements.
8
LAN AIRLINES S.A. AND SUBSIDIARIES
CONSOLIDATED STATEMENT OF CHANGES IN EQUITY
| Attributable to owners of the parent | |||||||||||||||||||||||||||||||||||
| Other reserves | Equity | ||||||||||||||||||||||||||||||||||
| Other | Currency | Cash flow | attributable to | Non- | |||||||||||||||||||||||||||||||
| Share | equity | translation | hedging | Retained | owners | controlling | Total | ||||||||||||||||||||||||||||
| Note | capital | interests | reserve | reserve | earnings | of the parent | interests | equity | |||||||||||||||||||||||||||
| ThUS$ | ThUS$ | ThUS$ | ThUS$ | ThUS$ | ThUS$ | ThUS$ | ThUS$ | ||||||||||||||||||||||||||||
| Opening balance as of January 01, 2011 | 453,444 | 5,463 | (4,257 | ) | (107,050 | ) | 949,214 | 1,296,814 | 3,246 | 1,300,060 | |||||||||||||||||||||||||
| Changes in equity | |||||||||||||||||||||||||||||||||||
Comprehensive income | |||||||||||||||||||||||||||||||||||
| Gain (losses) | 26 | - | - | - | - | 207,697 | 207,697 | (3,473 | ) | 204,224 | |||||||||||||||||||||||||
| Other comprehensive income | - | - | (7,712 | ) | (96,208 | ) | - | (103,920 | ) | (180 | ) | (104,100 | ) | ||||||||||||||||||||||
| Total comprehensive income | - | - | (7,712 | ) | (96,208 | ) | 207,697 | 103,777 | (3,653 | ) | 100,124 | ||||||||||||||||||||||||
| Transactions with shareholders | |||||||||||||||||||||||||||||||||||
| Equity issuance | 26-36 | 8,531 | - | - | - | - | 8,531 | - | 8,531 | ||||||||||||||||||||||||||
| Dividends | 26 | - | - | - | - | (72,696 | ) | (72,696 | ) | - | (72,696 | ) | |||||||||||||||||||||||
| Increase (decrease) for transfers and other changes | 26-36 | - | (2,577 | ) | - | - | (631 | ) | (3,208 | ) | 4,533 | 1,325 | |||||||||||||||||||||||
| Total transactions with shareholders | 8,531 | (2,577 | ) | - | - | (73,327 | ) | (67,373 | ) | 4,533 | (62,840 | ) | |||||||||||||||||||||||
| Closing balance as of September 30, 2011 | 461,975 | 2,886 | (11,969 | ) | (203,258 | ) | 1,083,584 | 1,333,218 | 4,126 | 1,337,344 | |||||||||||||||||||||||||
The accompanying Notes 1 to 39 form an integral part of these consolidated financial statements.
9
LAN AIRLINES S.A. AND SUBSIDIARIES
CONSOLIDATED STATEMENT OF CHANGES IN EQUITY
| Attributable to owners of the parent | |||||||||||||||||||||||||||||||||||
| Other reserves | Equity | ||||||||||||||||||||||||||||||||||
| Other | Currency | Cash flow | attributable to | Non- | |||||||||||||||||||||||||||||||
| Share | equity | translation | hedging | Retained | owners | controlling | Total | ||||||||||||||||||||||||||||
| Note | capital | interests | reserve | reserve | earnings | of the parent | interests | equity | |||||||||||||||||||||||||||
| ThUS$ | ThUS$ | ThUS$ | ThUS$ | ThUS$ | ThUS$ | ThUS$ | ThUS$ | ||||||||||||||||||||||||||||
| Opening balance as of January 01, 2010 | 453,444 | 2,490 | (4,924 | ) | (92,230 | ) | 740,047 | 1,098,827 | 7,099 | 1,105,926 | |||||||||||||||||||||||||
| Changes in equity | |||||||||||||||||||||||||||||||||||
| Comprehensive income | |||||||||||||||||||||||||||||||||||
| Net income | 26 | - | - | - | - | 255,143 | 255,143 | 1,331 | 256,474 | ||||||||||||||||||||||||||
| Other comprehensive income | - | - | (88 | ) | (63,888 | ) | - | (63,976 | ) | (36 | ) | (64,012 | ) | ||||||||||||||||||||||
| Total comprehensive income | - | - | (88 | ) | (63,888 | ) | 255,143 | 191,167 | 1,295 | 192,462 | |||||||||||||||||||||||||
| Transactions with shareholders | |||||||||||||||||||||||||||||||||||
| Dividends | 26 | - | - | - | - | (87,482 | ) | (87,482 | ) | - | (87,482 | ) | |||||||||||||||||||||||
| Increase (decrease) for transfers and other changes | 26-36 | - | 2,264 | - | - | (129 | ) | 2,135 | (32 | ) | 2,103 | ||||||||||||||||||||||||
| Total transactions with shareholders | - | 2,264 | - | - | (87,611 | ) | (85,347 | ) | (32 | ) | (85,379 | ) | |||||||||||||||||||||||
| Closing balance as of September 30, 2010 | 453,444 | 4,754 | (5,012 | ) | (156,118 | ) | 907,579 | 1,204,647 | 8,362 | 1,213,009 | |||||||||||||||||||||||||
The accompanying Notes 1 to 39 form an integral part of these consolidated financial statements.
10
LAN AIRLINES S.A. AND SUBSIDIARIES
CONSOLIDATED STATEMENT OF CASH FLOWS DIRECT – METHOD
| For the nine months ended | ||||||||||||
| September 30, | ||||||||||||
| Note | 2011 | 2010 | ||||||||||
| ThUS$ | ThUS$ | |||||||||||
| Cash flows from operating activities | ||||||||||||
| Cash collection from operating activities | ||||||||||||
| Proceeds from sales of goods and services | 4,276,530 | 3,302,635 | ||||||||||
| Other cash receipts from operating activities | 40,375 | 33,816 | ||||||||||
| Payments for operating activities | ||||||||||||
| Payments to suppliers for goods and services | (3,172,799 | ) | (2,178,869 | ) | ||||||||
| Payments to and on behalf of employees | (683,142 | ) | (461,157 | ) | ||||||||
| Other payments for operating activities | (84,133 | ) | (18,000 | ) | ||||||||
| Interest paid | (4,679 | ) | (387 | ) | ||||||||
| Interest received | 7,140 | 6,291 | ||||||||||
| Income taxes refunded (paid) | 2,836 | (7,074 | ) | |||||||||
| Other cash inflows (outflows) | (4,982 | ) | (94,773 | ) | ||||||||
| Net cash flows from operating activities | 377,146 | 582,482 | ||||||||||
| Cash flows used in investing activities | ||||||||||||
| Cash flows from disposal of subsidiaries | 47,337 | 1,491 | ||||||||||
| Cash flows used for acquisition of subsidiaries | (3,541 | ) | - | |||||||||
| Other cash receipts from sales of equity or debt instruments of other entities | 8,159 | 11,134 | ||||||||||
| Amounts raised from sale of property, plant and equipment | 87,888 | 45 | ||||||||||
| Purchases of property, plant and equipment | (868,886 | ) | (633,256 | ) | ||||||||
| Amounts raised from sale of intangible assets | 6,189 | - | ||||||||||
| Purchases of intangible assets | (19,338 | ) | (11,373 | ) | ||||||||
| Dividends received | 79 | 111 | ||||||||||
| Interest received | 2,223 | 3,632 | ||||||||||
| Other cash inflows (outflows) | (19,155 | ) | (15,999 | ) | ||||||||
| Net cash flow used in investing activities | (759,045 | ) | (644,215 | ) | ||||||||
| Cash flows from (used in) financing activities | ||||||||||||
| Amounts raised from issuance of shares | 8,532 | - | ||||||||||
| Amounts raised from long-term loans | 591,592 | 472,906 | ||||||||||
| Amounts raised from short-term loans | 284,500 | - | ||||||||||
| Loan Payments | (690,334 | ) | (350,856 | ) | ||||||||
| Payments of finance lease liabilities | (43,247 | ) | (43,988 | ) | ||||||||
| Dividends paid | (192,118 | ) | (155,407 | ) | ||||||||
| Interest paid | (93,301 | ) | (94,444 | ) | ||||||||
| Other cash inflows (outflows) | 118,730 | 39,785 | ||||||||||
| Net cash flows from (used in) financing activities | (15,646 | ) | (132,004 | ) | ||||||||
| Net increase (decrease) in cash and cash equivalents before the effect of changes in the exchange rate | (397,545 | ) | (193,737 | ) | ||||||||
| Effects of variation in the exchange rate on cash and cash equivalents | (46 | ) | 66 | |||||||||
| Net increase (decrease) in cash and cash equivalents | (397,591 | ) | (193,671 | ) | ||||||||
| CASH AND CASH EQUIVALENTS AT BEGINNING OF PERIOD | 6 | 631,052 | 731,497 | |||||||||
| CASH AND CASH EQUIVALENTS AT END OF PERIOD | 6 | 233,461 | 537,826 | |||||||||
The accompanying Notes 1 to 39 form an integral part of these consolidated financial statements.
11
LAN AIRLINES S.A. AND SUBSIDIARIES
NOTES TO THE INTERIM CONSOLIDATED FINANCIAL STATEMENTS
AS OF SEPTEMBER 30, 2011
NOTE 1 - GENERAL INFORMATION
Lan Airlines S.A. (the “Company” or “LAN”) is a public company registered with the Chilean Superintendency of Securities and Insurance (SVS), under No.306, whose shares are quoted in Chile on the Valparaíso Stock Exchange, the Chilean Electronic Exchange and the Santiago Stock Exchange; it is also quoted on the New York Stock Exchange (NYSE) in the form of American Depositary Receipts (ADRs). Its principal business is passenger and cargo air transportation, both in the domestic markets of Chile, Peru, Argentina, Colombia and Ecuador and a series of regional and international routes in America, Europe and Oceania. These businesses are performed directly or through its subsidiaries in different countries. In addition, the company has subsidiaries operating in the freight business in Mexico, Brazil and Colombia.
On August 13, 2010, LAN Airlines S.A. and TAM S.A. (TAM) announced they have signed a non-binding Memorandum of Understanding (MOU) in which the companies agree to proceed with their intention of carrying out their operations jointly under one parent company, to be named LATAM Airlines Group. The proposed partnership of LAN with TAM would be within the world’s 10 largest airline groups. LATAM will provide transport services for passengers and cargo to more than 115 destinations in 23 countries, operating with a fleet of over 280 aircraft, with over 40,000 employees. Both airlines will continue operating independently with their current operating licenses and brands. Within the group, TAM will continue operating as a Brazilian company with its own structure. The current holding of LAN Airlines S.A. will operate as an independent business unit within the group. On October 20, 2010, LAN Airlines and TAM announced that the operating subsidiaries of TAM had presented the structure of the transaction to the Brazilian Civil Aviation Agency (ANAC), which was approved by this agency on March 01, 2011.
On January 18, 2011 the parties of the MOU (1) and Mrs. Maria Cláudia Oliveira Amaro, Maurício Rolim Amaro, Noemy Almeida Olivera Amaro and Joao Francisco Amaro (“Amaro Family”), as the only shareholders of TEP, signed (a) an Implementation Agreement and (b) a binding Exchange Offer Agreement ("Contracts Signed") containing the final terms and conditions of the proposed partnership between LAN and TAM.
(1) On August 13, 2010 LAN reported as a significant matter to the Superintendency of Securities and Insurance that LAN, Costa Verde Aeronáutica S.A. and Inversiones Mineras del Cantábrico S.A. (the last two, "Cueto subsidiaries”), TAM S.A. (“TAM”) and TAM Empreendimentos e Participacoes S.A. (“TEP”) signed a non-binding Memorandum of Understanding ("MOU") for which the primary terms were outlined.
On September 21, 2011, the Court of Defense of Free Competition ("TDLC") approved the merger between LAN and TAM, establishing fourteen mitigation measures. On October 3, LAN and TAM filed an appeal to the Supreme Court objecting three of the mitigation measures.
The Company is located in Santiago, Chile, at Avenida Américo Vespucio Sur 901, Renca.
12
Corporate Governance practices of the Company are set in accordance with Securities Market Law 18,045 the Corporations Law 18,046 and its regulations, and the regulations of the SVS and the laws and regulations of the United States of America and the U.S. Securities and Exchange Commission (SEC) with respect to the issuance of ADRs, and the Federal Republic of Brazil and the Comissão de Valores Mobiliários (“CVM) of that country, as it pertains to the issuance of Brazilian Depositary Receipts (“BDRs”).
The Board of the Company is composed of nine members who are elected every two years by the ordinary shareholders meeting. The Board meets in regular monthly sessions and in extraordinary sessions as the corporate needs demand. Of the nine board members, three form part of its Directors’ Committee which fulfills both the role foreseen in the Corporations Law and the functions of the Audit Committee required by the Sarbanes Oxley Act of the United States of America and the respective regulations of the SEC.
The majority shareholder of the Company is the Cueto Group, which through Costa Verde Aeronáutica S.A. and Inversiones Mineras del Cantábrico S.A. owns 34.01% of the shares issued by the Company, as is the controller of the Company in accordance with the provisions of the letter b) of Article 97 and Article 99 of the Securities Market Law, attended that despite not meeting the majority of votes at shareholder meetings and to elect the majority of the directors of the Company, has a decisive influence in its administration.
As of September 30, 2011, the Company had a total of 1,672 registered shareholders, and 3.69% of the Company’s share capital was in the form of ADRs.
For the period ended September 30, 2011 the Company had an average of 21,046 employees, ending the period with a total of 21,216 people, with 3,725 in administration, 2,843 in maintenance, 6,150 in operations, 3,759 flight personnel, 1,958 cabin crew, and 2,781 in sales.
13
The significant operating subsidiaries included in these consolidated financial statements are as follows:
| As of September 30, 2011 | As of December 31, 2010 | |||||||||||||||||||||||||||||
| Direct | Indirect | Total | Direct | Indirect | Total | |||||||||||||||||||||||||
| Country | Functional | ownership | ownership | ownership | ownership | ownership | ownership | |||||||||||||||||||||||
| Tax No. | Company | of origin | Currency | interest | interest | interest | interest | interest | interest | |||||||||||||||||||||
| % | % | % | % | % | % | |||||||||||||||||||||||||
| 96.518.860-6 | Lantours Division de Servicios Terrestres S.A. (*) | Chile | US$ | 99.9900 | 0.0100 | 100.0000 | 99.9900 | 0.0100 | 100.0000 | |||||||||||||||||||||
| 96.763.900-1 | Inmobiliaria Aeronáutica S.A. | Chile | US$ | 99.0100 | 0.9900 | 100.0000 | 99.0100 | 0.9900 | 100.0000 | |||||||||||||||||||||
| 96.969.680-0 | Lan Pax Group S.A. and Subsidiaries | Chile | US$ | 99.8361 | 0.1639 | 100.0000 | 99.8361 | 0.1639 | 100.0000 | |||||||||||||||||||||
| Foreign | Lan Perú S.A. | Perú | US$ | 49.0000 | 21.0000 | 70.0000 | 49.0000 | 21.0000 | 70.0000 | |||||||||||||||||||||
| Foreign | Lan Chile Investments Limited and Subsidiaries | Caymán Island | US$ | 99.9900 | 0.0100 | 100.0000 | 99.9900 | 0.0100 | 100.0000 | |||||||||||||||||||||
| 93.383.000-4 | Lan Cargo S.A. | Chile | US$ | 99.8939 | 0.0041 | 99.8980 | 99.8939 | 0.0041 | 99.8980 | |||||||||||||||||||||
| Foreign | Connecta Corporation | U.S.A | US$ | 0.0000 | 100.0000 | 100.0000 | 0.0000 | 100.0000 | 100.0000 | |||||||||||||||||||||
| Foreign | Prime Airport Services Inc. and Subsidiary | U.S.A | US$ | 0.0000 | 100.0000 | 100.0000 | 0.0000 | 100.0000 | 100.0000 | |||||||||||||||||||||
| 96.951.280-7 | Transporte Aéreo S.A. | Chile | US$ | 0.0000 | 100.0000 | 100.0000 | 0.0000 | 100.0000 | 100.0000 | |||||||||||||||||||||
| 96.634.020-7 | Ediciones Ladeco América S.A. | Chile | CLP | 0.0000 | 100.0000 | 100.0000 | 0.0000 | 100.0000 | 100.0000 | |||||||||||||||||||||
| Foreign | Aircraft International Leasing Limited | U.S.A | US$ | 0.0000 | 100.0000 | 100.0000 | 0.0000 | 100.0000 | 100.0000 | |||||||||||||||||||||
| 96.631.520-2 | Fast Air Almacenes de Carga S.A. | Chile | CLP | 0.0000 | 100.0000 | 100.0000 | 0.0000 | 100.0000 | 100.0000 | |||||||||||||||||||||
| 96.631.410-9 | Ladeco Cargo S.A. | Chile | CLP | 0.0000 | 100.0000 | 100.0000 | 0.0000 | 100.0000 | 100.0000 | |||||||||||||||||||||
| Foreign | Laser Cargo S.R.L. | Argentina | ARS | 0.0000 | 100.0000 | 100.0000 | 0.0000 | 100.0000 | 100.0000 | |||||||||||||||||||||
| Foreign | Lan Cargo Overseas Limited and Subsidiaries | U.S.A | US$ | 0.0000 | 100.0000 | 100.0000 | 0.0000 | 100.0000 | 100.0000 | |||||||||||||||||||||
| 96.969.690-8 | Lan Cargo Inversiones S.A. and Subsidiary | Chile | CLP | 0.0000 | 100.0000 | 100.0000 | 0.0000 | 100.0000 | 100.0000 | |||||||||||||||||||||
| 96.575.810-0 | Inversiones Lan S.A. and Subsidiaries | Chile | CLP | 99.7100 | 0.0000 | 99.7100 | 99.7100 | 0.0000 | 99.7100 | |||||||||||||||||||||
(*) Comercial Masterhouse S.A., in July 2010, changed name to Lantours División de Servicios Terrestres S.A.
Additionally, the Company has proceeded to consolidate certain special purpose entities according to standards issued by the Standing Interpretations Committee of the International Accounting Standards: Consolidation - Special Purpose Entities (“SIC 12”) and private investment funds in which the parent company and subsidiaries are contributors.
All the entities controlled have been included in the consolidation.
14
Changes in the scope of consolidation from January 01, 2010 and September 30, 2011, are detailed below:
| (1) | Incorporation or acquisition of companies |
| - | Florida West Technical Services LLC., direct subsidiary of Prime Airport Services S.A., in April 2010, changed name to Lan Cargo Repair Station, LLC. |
| - | Aerovías de Integración Regional, AIRES S.A., indirect subsidiary of Lan Pax Group S.A., in November 2010, acquired through the purchase of companies Akemi Holdings S.A. and Saipan Holdings S.A. (See Note 39) |
| - | AEROASIS S.A., direct subsidiary of Lan Pax Group S.A, acquired in February 2011. (See Note 39) |
| (2) | Disposal of companies |
| - | Blue Express INTL Ltda. and subsidiary, direct subsidiary of Lan Pax Cargo S.A., were sold according to purchase agreement signed on April 6, 2011. |
15
NOTE 2 - SUMMARY OF SIGNIFICANT ACCOUNTING POLICIES
The following describes the principal accounting policies adopted in the preparation of these consolidated financial statements.
| 2.1. | Preparation |
The consolidated financial statements of Lan Airlines S.A. are for the period ended September 30, 2011 and have been prepared in accordance with International Financial Reporting Standards (IFRS), and IFRIC interpretations.
The consolidated financial statements have been prepared under the historic-cost criterion, although modified by the valuation at fair value of certain financial instruments.
The preparation of the consolidated financial statements in accordance with IFRS requires the use of certain critical accounting estimates. It also requires management to use its judgment in applying the Company’s accounting policies. Note 4 shows the areas that imply a greater degree of judgment or complexity or the areas where the assumptions and estimates are significant to the consolidated financial statements. These consolidated interim financial statements have been prepared under IAS 34.
a) At the date of these consolidated financial statements, the following accounting pronouncements were adopted by the Company, with application effective as of January 1, 2011:
| Mandatory application: | ||
| annual periods | ||
| Standards and amendments | beginning on or after | |
| Amendment to IFRS 7: Financial Instruments: Disclosures | 01/01/2011 | |
| Amendment to IAS 34: Interim financial reporting | 01/01/2011 | |
| Amendment to IAS 1: Presentation of financial statements | 01/01/2011 | |
| IAS 24 revised: Related party disclosures | 01/01/2011 |
| Mandatory application: | ||
| annual periods | ||
| Interpretation | beginning on or after | |
| Amendment to IFRIC 14: Pre-payments of a minimum funding requirement | 01/01/2011 | |
| Amendment to IFRIC 13: Customer loyalty programs | 01/01/2011 |
16
The adoption of the standards, amendments and interpretations described above have not had a significant impact on the Company’s consolidated financial statements.
b) Accounting pronouncements with applications effective as of January 01, 2012 and following:
| Mandatory application: | ||
| annual periods | ||
| Standards and amendments | beginning on or after | |
| Amendment to IAS 1: Presentation of financial statements | 01/07/2012 | |
| IFRS 9: Financial instruments | 01/01/2013 | |
| IAS 28 revised: Investments in associates and joint ventures | 01/01/2013 | |
| IAS 27 revised: Separate financial statements | 01/01/2013 | |
| IFRS 10: Consolidated financial statements | 01/01/2013 | |
| IFRS 11: Joint arrangements | 01/01/2013 | |
| IFRS 12: Disclosures of interests in other entities | 01/01/2013 | |
| IFRS 13: Fair value measurement | 01/01/2013 | |
| Amendment to IAS 19: Employee benefits | 01/01/2013 |
The Company’s management believes that the adoption of the standards, amendments and interpretations described above would not have had a significant impact on the Company’s consolidated financial statements in the period of their first application. The Company has not early adopted any of the above standards.
| 2.2. | Consolidation |
| (a) | Subsidiaries |
Subsidiaries are all the entities (including special-purpose entities) over which the Company has the power to control the financial and operating policies, which are generally accompanied by a holding of more than half of the voting rights. In evaluating whether the Company controls another entity, the existence and effect of potential voting rights that are currently exercisable or convertible are considered. The subsidiaries are consolidated from the date on which control is passed to the Company and they are excluded from the consolidation on the date they cease to be so controlled.
The Company uses the acquisition-cost method or purchase accounting for the purchase of subsidiaries. The cost of acquisition is the fair value of the assets delivered, the equity instruments issued and the liabilities incurred or assumed on the exchange date. The identifiable assets acquired and the liabilities and contingent liabilities assumed in a business combination are initially valued at their fair value on the date of acquisition, regardless of the extent of the non-controlling interests. The excess of the acquisition cost over the fair value of the Company’s holding in the net identifiable assets acquired is shown as goodwill. If the cost is less than the fair value of the net assets of the acquired subsidiary, the difference is recorded directly in the consolidated statement of income (Note 2.6).
17
Inter-company transactions, balances and unrealized gains on transactions between the Company’s entities are eliminated. Unrealized losses are also eliminated unless the transaction provides evidence of an impairment loss of the asset transferred. When necessary in order to ensure uniformity with the policies adopted by the Company, the accounting policies of the subsidiaries are modified.
| (b) | Transactions with non-controlling interests |
The Company applies the policy of considering transactions with non-controlling interests, when not related to loss of control, as equity transactions without an effect on income.
| (c) | Investees or associates |
Investees or associates are all entities over which Lan Airlines S.A. and Subsidiaries have a significant influence but has no control, this usually arises from a holding of between 20% and 50% of the voting rights. Investments in associates are booked using the equity method and are initially recorded at their cost.
The participation of Lan Airlines S.A. and Subsidiaries in the losses or gains after the acquisition of its investees or associates is shown in results, and its participation in post acquisition movements in reserves of investees or associates are shown in reserves.
Post-acquisition movement is adjusted against the carrying amount of the investment. When the participation of Lan Airlines S.A. and Subsidiaries in the losses of an investee or associate is equal to or more than its holding in it, including any other non guaranteed account receivable, Lan Airlines S.A. and Subsidiaries will not show the additional losses unless it has incurred obligations or made payments on behalf of the investee or associate.
Gains or losses for dilution in investees or associates are shown in the consolidated statement of income.
| 2.3. | Foreign currency transactions |
| (a) | Presentation and functional currencies |
The items included in the financial statements of each of the entities of Lan Airlines S.A. and Subsidiaries are valued using the currency of the main economic environment in which the entity operates (the functional currency). The functional currency of Lan Airlines S.A. is the United States dollar which is also the presentation currency of the consolidated financial statements of Lan Airlines S.A. and Subsidiaries.
| (b) | Transactions and balances |
Foreign currency transactions are translated to the functional currency using the exchange rates on the transaction dates. Foreign currency gains and losses resulting from the liquidation of these transactions and from the translation at the closing exchange rates of the monetary assets and liabilities denominated in foreign currency are shown in the consolidated statement of income.
18
| (c) | Group entities |
The results and financial position of all the Group entities (none of which has the currency of a hyper-inflationary economy) that have a functional currency other than the presentation currency are translated to the presentation currency as follows:
| (i) | Assets and liabilities of each consolidated statement of financial position presented are translated at the closing exchange rate on the consolidated statement of financial position date; |
| (ii) | The revenues and expenses of each income statement account are translated at the exchange rates prevailing on the transaction dates, |
| (iii) | All the resultant exchange differences are shown as a separate component in net equity. |
In the consolidation, exchange differences arising from the translation of a net investment in foreign entities (or local with a functional currency different to that of the parent), and of loans and other foreign currency instruments designated as hedges for these investments, are recorded within net equity. When the investment is sold, these exchange differences are shown in the consolidated statement of income as part of the loss or gain on the sale.
Adjustments to the goodwill and fair value arising from the acquisition of a foreign entity are treated as assets and liabilities of the foreign entity and are translated at the period-end exchange rate.
| 2.4. | Property, plant and equipment |
The land of Lan Airlines S.A. and Subsidiaries is recognized at cost less any accumulated impairment loss. The rest of the property, plant and equipment is shown, initially and subsequently, at historic cost less the corresponding depreciation and any impairment loss, except for certain land and minor equipment that are reassessed at first adoption, according to IFRS.
The amounts of advance payments to aircraft manufacturers are capitalized by the Company under Construction in progress until receipt of the aircraft.
Subsequent costs (replacement of components, improvements, extensions, etc.) are included in the value of the initial asset or shown as a separate asset only when it is probable that the future economic benefits associated with the elements of property, plant and equipment are going to flow to the Company and the cost of the element can be determined reliably. The value of the component replaced is written off in the books at the time of replacement. The rest of the repairs and maintenance are charged to the result of the year in which they are incurred.
Depreciation of property, plant and equipment is calculated using the straight-line method over their estimated technical useful lives; except in the case of certain technical components which are depreciated on the basis of cycles and hours flown.
The residual value and useful life of assets is revised, and adjusted if necessary, once per year.
When the carrying amount of an asset is higher than its estimated recoverable amount, its value is reduced immediately to its recoverable amount (Note 2.8).
Losses and gains on the sale of property, plant and equipment are calculated by comparing the proceeds obtained with the book value and are included in the consolidated statement of income.
19
| 2.5. | Intangible assets |
Computer software
Licenses for computer software acquired are capitalized on the basis of the costs incurred in acquiring them and preparing them for using the specific software. These costs are amortized over their estimated useful lives.
Expenses related to the development or maintenance of computer software which do not qualify for capitalization, are shown as an expense when incurred. Certain costs directly related to the production of unique and identifiable computer software controlled by the Company, are shown as intangible assets when they have met all the criteria for capitalization. The direct costs include the expenses of the personnel who develop the computer software and other costs directly associated.
Development costs of computer software shown as assets are amortized over their estimated useful lives.
| 2.6. | Goodwill |
Goodwill represents the excess of acquisition cost over the fair value of the Company’s participation in the net identifiable assets of the subsidiary on the acquisition date. Goodwill related to acquisition of subsidiaries is not amortized but tested for impairment annually and when there are indications that the carrying value may not be recoverable. Gains and losses on the sale of an entity include the book amount of the goodwill related to the entity sold.
| 2.7. | Borrowing costs |
Interest costs incurred for the construction of any qualified asset are capitalized over the time necessary for completing and preparing the asset for its intended use. Other interest costs are charged to income and expenses.
| 2.8. | Losses for impairment of non-financial assets |
Intangible assets that have an indefinite useful life, and developing IT projects, are not subject to amortization and are subject to annual testing for impairment losses. Assets subject to amortization are subjected to impairment tests whenever any event or change in circumstances indicates that the book value of the assets may not be recoverable. An impairment loss is recorded when the book value is greater than the recoverable amount. The recoverable amount of an asset is the higher of its fair value less costs to sell and its value in use. In evaluating the impairment, the assets are grouped at the lowest level for which cash flows are separately identifiable (CGUs). Non-financial assets other than goodwill that have suffered an impairment loss are subjected to a test once per year to check that there has been no reversal of the loss.
| 2.9. | Financial assets |
The Company classifies its financial instruments in the following categories: financial assets at fair value through profit and loss, loans and accounts receivable and financial assets held to maturity. The classification depends on the purpose for which the financial instruments were acquired. Management determines the classification of its financial instruments at the time of initial recognition, which occurs on the date of transition.
20
| (a) | Financial assets at fair value through profit and loss |
Financial assets at fair value through profit and loss are financial instruments held for trading and those in their initial classification has been designated as at fair value through profit or loss. A financial asset is classified in this category if acquired mainly for the purpose of being sold in the near future or when these assets are managed and measured using fair value. Derivatives are also classified as acquired for trading unless they are designated as hedges. Assets in this category are classified as cash and cash equivalents, held for trading, and other financial assets, designated on initial recognition.
| (b) | Loans and accounts receivable |
Loans and accounts receivable are non-derivative financial instruments with fixed or determinable payments not traded on an active market. These items are classified in current assets except for those with maturity over 12 months from the date of the consolidated statement of financial position, which are classified as non-current assets. Loans and accounts receivable are included in trade and other accounts receivable in the consolidated statement of financial position (Note 2.12).
| (c) | Financial assets held to maturity |
Financial assets held to maturity are non-derivative financial instruments with fixed or determinable payments and fixed maturities that the Company’s management has the positive intention and capacity to hold until their maturity. Should the Company sell a not-insignificant amount of the financial assets held to their maturity, the whole category is reclassified as available for sale. These financial instruments held to maturity are included in non-current assets, except for those maturity equal to or less than 12 months from the consolidated statement of financial position, which are classified as other current financial assets.
Regular purchases and sales of financial assets are recognized on the trade-date – the date on which the group commits to purchase or sell the asset. Investments are initially recognized at fair value plus transaction costs for all financial assets not carried at fair value through profit or loss. Financial assets carried at fair value through profit or loss are initially recognized at fair value, and transaction costs are expensed in the income statement. Financial assets are derecognized when the rights to receive cash flows from the investments have expired or have been transferred and the group has transferred substantially all risks and rewards of ownership. Financial assets and financial assets at fair value through profit or loss are subsequently carried at fair value. Loans and receivables are subsequently carried at amortized cost using the effective interest method. Held to maturity investments are carried at amortized cost using the effective interest rate.
At the date of each consolidated statement of financial position, the Company assesses if there is objective evidence that a financial asset or group of financial assets may have suffered an impairment loss. For the case of financial assets held to maturity, if there is any evidence of impairment, the amount of the provision is the difference between the book value of the assets and the present value of the estimated future cash flows, discounted at the original effective interest rate.
21
| 2.10. | Derivative financial instruments and hedging activities |
Derivatives are booked initially at fair value on the date the derivative contracts are signed and later they continue to be valued at their fair value. The method for booking the resultant loss or gain depends on whether the derivative has been designated as a hedging instrument and if so, the nature of the item hedged. The Company designates certain derivatives as:
| (a) | Hedge of the fair value of recognized assets (fair value hedge); |
| (b) | Hedge of an identified risk associated with a recognized liability or an expected highly-probable transaction (cash-flow hedge), or |
| (c) | Derivatives that do not qualify for hedge accounting. |
The Company documents, at the inception of each transaction, the relationship between the hedging instrument and the hedged item, as well as its objectives for managing risk and the strategy for carrying out various hedging transactions. The Company also documents its assessment, both at the beginning and on an ongoing basis, as to whether the derivatives used in the hedging transactions are highly effective in offsetting the changes in the fair value or cash flows of the items being hedged.
The total fair value of the hedging derivatives is booked as an other non-current financial asset or liability if the remaining maturity of the item hedged is over 12 months, and as an other current financial asset or liability if the remaining term of the item hedged is less than 12 months.
Derivatives not booked as hedges are classified as other financial assets or liabilities, current in the case that their remaining maturity is less than 12 months and non-current in the case that it is more than 12 months.
| (a) | Fair value hedges |
Changes in the fair value of designated derivatives that qualify as fair value hedges are shown in the consolidated statement of income, together with any change in the fair value of the asset or liability hedged that is attributable to the risk being hedged.
| (b) | Cash flow hedges |
The effective portion of changes in the fair value of derivatives that are designated and qualify as cash flow hedges is shown in the statement of other comprehensive income. The loss or gain relating to the ineffective portion is recognized immediately in the consolidated statement of income under Other gains (losses).
In the case of variable interest-rate hedges, the amounts recognized in the statement of other comprehensive income are reclassified to results within financial costs at the same time the associated debts accrue interest.
For fuel price hedges, the amounts shown in the statement of other comprehensive income are reclassified to income as Cost of sales to the extent that the fuel subject to the hedge is used.
22
When hedging instruments mature or are sold or when they do not meet the requirements to be accounted for as hedges, any gain or loss accumulated in the statement of other comprehensive income until that moment remains in the statement of other comprehensive income and is reclassified to the consolidated statement of income when the hedged transaction is finally recognized. When it is expected that the hedged transaction is no longer going to occur, the gain or loss accumulated in the statement of other comprehensive income is taken immediately to the consolidated statement of income as Other gains (losses).
| (c) | Derivatives not booked as a hedge |
Certain derivatives are not booked as a hedge. The changes in fair value of any derivative instrument that is not booked as a hedge are shown immediately in the consolidated statement of income in Other gains (losses).
| 2.11. | Inventories |
Inventories, detailed in note 10, are shown at the lower of cost and their net realizable value. The cost is determined on the basis of the weighted average cost method. The net realizable value is the estimated selling price in the normal course of business, less estimated costs of completion and the estimated costs necessary to make the sale.
| 2.12. | Trade and other accounts receivable |
Trade accounts receivable are shown initially at their fair value and later at their amortized cost in accordance with the effective interest rate method, less the allowance for impairment losses. An allowance for impairment loss of trade accounts receivable is made when there is objective evidence that the Company will not be able to recover all the amounts due according to the original terms of the accounts receivable. The existence of significant financial difficulties on the part of the debtor, the probability that the debtor is entering bankruptcy or financial reorganization and the default or delay in making payments are considered indicators that the receivable has been impaired. The amount of the provision is the difference between the book value of the assets and the present value of the estimated future cash flows, discounted at the original effective interest rate. The book value of the asset is reduced by the amount of the allowance and the loss is shown in the consolidated statement of income in Cost of sales. When an account receivable is written off, it is charged to the allowance account for accounts receivable.
| 2.13. | Cash and cash equivalents |
Cash and cash equivalents include cash and bank balances, time deposits in financial institutions, and other short-term and easily-liquidated investments.
| 2.14. | Capital |
The common shares are classified as net equity.
Incremental costs directly attributable to the issuance of new shares or options are shown in net equity as a deduction from the proceeds obtained.
| 2.15. | Trade and other accounts payable |
Trade payables and other accounts payable are initially recognized at fair value and subsequently at amortized cost and are valued according to the method of the effective interest rate.
23
| 2.16. | Interest-bearing loans |
Financial liabilities are shown initially at their fair value, net of the costs incurred in the transaction. Later, these financial liabilities are valued at their amortized cost; any difference between the proceeds obtained (net of the necessary arrangement costs) and the repayment value, is shown in the consolidated statement of income during the term of the debt, according to the effective interest rate method.
Financial liabilities are classified in current and non-current liabilities according to the contractual payment dates of the nominal principal.
| 2.17. | Deferred taxes |
Deferred taxes are calculated on the temporary differences arising between the tax bases of assets and liabilities and their book values. However, if the temporary differences arise from the initial recognition of a liability or an asset in a transaction different from a business combination that at the time of the transaction does not affect the accounting result or the tax gain or loss, they are not booked. The deferred tax is determined using the tax rates (and laws) that have been enacted or substantially enacted at the end of the reporting period, and are expected to apply when the related deferred tax asset is realized or the deferred tax liability discharged.
Deferred tax assets are recognised when it is probable that there will be sufficient future tax earnings with which to compensate the temporary differences.
Deferred income tax is provided on temporary differences arising on investments in subsidiaries and associates, as long as except for deferred income tax liability where the timing of the reversal of the temporary difference is controlled by the group and it is probable that the temporary difference will not reverse in the foreseeable future.
| 2.18. | Employee benefits |
| (a) | Personnel vacations |
The Company recognizes the expense for personnel vacations on an accrual basis.
| (b) | Share-based compensation |
The compensation plans implemented by the granting of options for the subscription and payment of shares are shown in the consolidated financial statements in accordance with IFRS 2: Share based payments, showing the effect of the fair value of the options granted as a charge to remuneration on a straight-line basis between the date of granting such options and the date on which these become vested.
| (c) | Post-employment and other long-term benefits |
Provisions are made for these obligations by applying the actuarial value of the accrued cost of the benefit method, and taking into account estimates of future permanence, mortality rates and future wage increases determined on the basis of actuarial calculations. The discount rates are determined by reference to market interest-rate curves. Actuarial gains or losses are shown in results for the period when they occur.
24
| (d) | Incentives |
The Company has an annual incentives plan for its personnel for compliance with objectives and individual contribution to the results. The incentives eventually granted consist of a given number or portion of monthly remuneration and the provision is made on the basis of the amount estimated for distribution.
| 2.19. | Provisions |
Provisions are recognised when:
| (i) | The Company has a present legal or implicit obligation as a result of past events. |
| (ii) | It is probable that some payment is going to be necessary to settle an obligation, and |
| (iii) | The amount has been reliably estimated. |
Provisions are shown at the present value of the disbursements expected to be necessary for settling the obligation using the Company’s best estimates. The pre-tax discount rate used for determining the present value reflects current market evaluations on the date of the financial statements of the time value of money, plus the specific risks related to the liability in question.
| 2.20. | Revenue recognition |
Revenues include the fair value of the proceeds received or to be received on sales of goods and rendering services in the ordinary course of the Company’s business. Revenues are shown net of refunds, rebates and discounts.
| (a) | Rendering of services |
| a.1 | Passenger and cargo transport |
The Company shows revenue from the transportation of passengers and cargo once the service has been provided.
| a.2 | Frequent flyer program |
The Company currently has a frequent flyer program called Lan Pass, whose objective is customer loyalty through the delivery of kilometers every time that members fly with the Company or its alliance partners, use the services of entities registered with the program or make purchases with an associated credit card. The kilometers earned can be exchanged for flight tickets or other services of associated entities. The consolidated financial statements include liabilities for this concept (deferred income), according to the estimate of the valuation established for the kilometers accumulated pending use at that date, in accordance with IFRIC 13: Customer loyalty programs.
| a.3 | Other revenues |
The Company records revenues for other services when these have been provided.
25
| (b) | Interest income |
Interest income is booked using the effective interest rate method.
| (c) | Dividend income |
Dividend income is booked when the right to receive the payment is established.
| 2.21. | Leases |
| (a) | When the Company is the lessee – financial lease |
The Company leases certain property, plant and equipment in which it has substantially all the risk and benefits deriving from the ownership; they are therefore classified as financial leases. Financial leases are capitalized at the start of the lease at the lower of the fair value of the asset leased and the present value of the minimum lease payments.
Every lease payment is separated between the liability component and the financial expenses so as to obtain a constant interest rate over the outstanding amount of the debt. The corresponding leasing obligations, net of financial charges, are included in Interest-bearing loans. The element of interest in the financial cost is charged to the consolidated statement of income over the lease period so that it produces a constant periodic rate of interest on the remaining balance of the liability for each period. The asset acquired under a financial lease is depreciated over the shorter of its useful life and the lease term and is included in Property, plant and equipment.
| (b) | When the Company is the lessee – operating lease |
Leases, in which the lessor retains an important part of the risks and benefits deriving from ownership, are classified as operating leases. Payments with respect to operating leases (net of any incentive received from the lessor) are charged in the consolidated statement of income on a straight-line basis over the term of the lease.
| 2.22. | Non-current assets (or disposal groups) classified as held for sale |
Non-current assets (or disposal groups) are classified as assets held for sale and are shown at the lesser of their book value and the fair value less costs to sell.
| 2.23. | Maintenance |
The costs incurred for scheduled major maintenance of the aircraft’s fuselage and engines are capitalized and depreciated until the next maintenance. The depreciation rate is determined on technical grounds, according to its use expressed based on cycles and flight hours.
The unscheduled maintenance of aircraft and engines, as well as minor maintenance, are charged to income as incurred.
| 2.24. | Environmental costs |
Disbursements related to environmental protection are charged to income when incurred.
26
NOTE 3 - FINANCIAL RISK MANAGEMENT
| 3.1. | Financial risk factors |
The Company’s activities are exposed to different financial risks: (a) market risk, (b) credit risk, and (c) liquidity risk. The Company’s global risk management program is focused on uncertainty in the financial markets and tries to minimize the potential adverse effects on the net margin. The Company uses derivatives to hedge part of these risks.
| (a) | Market risk |
Due to the nature of its operations, the Company is exposed to market risks such as:
(i) fuel-price risk, (ii) interest-rate risk, and (iii) local exchange-rate risk. In order to fully or partially hedge all these risks, the Company operates with derivative instruments to fix or limit rises in the underlying assets.
| (i) | Fuel-price risk: |
Fluctuations in fuel prices largely depend on the global supply and demand for oil, decisions taken by Organization of Petroleum Exporting Countries (“OPEC”), global refining capacity, stock levels maintained, and weather and geopolitical factors.
The Company purchases an aircraft fuel called Jet Fuel grade 54. There is a benchmark price in the international market for this underlying asset, which is US Gulf Coast Jet 54. However, the futures market for this asset has a low liquidity index and as a result the Company hedges its exposure using West Texas Intermediate (“WTI”) crude and distillate Heating Oil (“HO”), which have a high correlation with Jet Fuel and are highly liquid assets and therefore have advantages in comparison to the use of the U.S. Gulf Coast Jet 54 index.
For the nine months ended September 30, 2011, the Company booked gains of US$ 39.7 million on fuel hedging. During the same period 2010, the Company recognized losses of US$ 5.9 million for the same reason.
As of September 30, 2011, the market value of its fuel positions amounted to US$ 36.7 million (negative). At December 31, 2010, this market value was US$ 45.8 million (positive). The following tables show the notional value of the purchase positions together with the derivatives contracted for the different periods:
| Positions as of September 30, 2011 (*) | Maturities | |||||||||||||||||||
| Q411 | Q112 | Q212 | Q312 | Total | ||||||||||||||||
| Volume (thousands of barrels WTI) | 2,448 | 1,710 | 1,134 | 693 | 5,985 | |||||||||||||||
| Contracted future price (US$ per barrel)(**) | 94 | 95 | 85 | 86 | 92 | |||||||||||||||
| Total (ThUS$) | 230,112 | 162,450 | 96,390 | 59,598 | 550,620 | |||||||||||||||
| Approximate percentage of hedge | ||||||||||||||||||||
| (of expected consumption value) | 68 | % | 47 | % | 32 | % | 20 | % | 32 | % | ||||||||||
27
(*)The volume shown in the table considers all the hedging instruments (swaps and options). The contracted future price considers the volume covered with swaps in addition to options that are expected to be exercised.
(**)Weighted average between collars and asset options
| Positions as of December 31, 2010 | Maturities | |||||||||||||||||||
| Q111 | Q211 | Q311 | Q411 | Total | ||||||||||||||||
| Volume (thousands of barrels WTI) | 1,848 | 918 | 687 | 324 | 3,777 | |||||||||||||||
| Contracted future price (US$ per barrel)(*) | 82 | 81 | 84 | 90 | 83 | |||||||||||||||
| Total (ThUS$) | 151,536 | 74,358 | 57,708 | 29,160 | 313,491 | |||||||||||||||
| Approximate percentage of hedge | ||||||||||||||||||||
| (of expected consumption value) | 54 | % | 27 | % | 19 | % | 8 | % | 26 | % | ||||||||||
(*)Weighted average between collars and asset options
Sensitivity analysis
A drop in fuel price positively affects the Company through a reduction in costs. However, this drop negatively affects contracted positions as these are acquired to protect the Company against the risk of a rise in price. The policy therefore is to maintain a hedge-free percentage in order to be competitive in the event of a drop in price.
As the current positions do not represent changes in cash flows, but a variation in the exposure to the market value, the current hedge positions have no impact on income (they are booked as cash flow hedge contracts, so a variation in the fuel price has an impact on the Company’s net equity).
The following table shows the sensitivity analysis of the financial instruments according to reasonable changes in the fuel price and their effect on equity. The term of the projection was defined until the end of the last current fuel hedge contract, being the last business day of the third quarter of 2012. The calculations were made considering a parallel movement of US$ 5 per barrel in the curve of the WTI and HO crude futures benchmark price at September 30, 2011 and the end of December 2010.
| Positions as of September 30, 2011 | Positions as of December 31, 2010 | |||
| Benchmarck price | effect on equity | effect on equity | ||
| WTI (US$ per barrel) | (millions of US$) | (millions of US$) | ||
| + 5 | +20.6 | + 16.7 | ||
| -5 | -20.3 | -15.7 |
The Company seeks to reduce the risk of fuel price rises to ensure it is not left at a disadvantage compared to its competitors in the event of a sharp price fall. The Company therefore uses hedge instruments like swaps, call options and collars to partially hedge the fuel volumes consumed.
According to the requirements of IAS 39, during the periods presented, the Company has not recorded amounts for ineffectiveness in the consolidated income statement.
Given the fuel hedge structure during the nine months ended September 30, 2011, which considers a hedge-free portion, a vertical fall by US$ 5 in the WTI benchmark price (the monthly daily average), would have meant a decrease of approximately US$ 30.1 million in the cost of total fuel consumption for the same period. For the same period, a vertical rise by US$ 5 in the WTI benchmark price (the monthly daily average) would have meant an impact of approximately US$ 27.1 million of increased fuel costs for the same period.
28
| (ii) | Cash flow interest-rate risk: |
The fluctuation in interest rates depends heavily on the state of the global economy. An improvement in long-term economic prospects moves long-term rates upward while a drop causes a decline through market effects. However, if we consider government intervention in periods of economic recession, it is usual to reduce interest rates to stimulate aggregate demand by making credit more accessible and increasing production (in the same way interest rates are raised at times of economic expansion). The present uncertainty about how the market and governments will react, and thus how interest rates will change, creates a risk related to the Company’s debt at floating interest rates and its investments.
Cash flow interest rate risk equates to the risk of future cash flows of the financial instruments due to the fluctuation in interest rates on the market. The Company’s exposure to risks of changes in market interest rates is mainly related to long-term obligations which accrued interest at a floating rate.
In order to reduce the risk of an eventual rise in interest rates, the Company has signed interest-rate swap and call option contracts in order to eliminate more than 84% of its exposure to interest-rate fluctuations. The Company is therefore exposed to a small portion of the fluctuations in the 90 days, 180 days and 360 days London Inter Bank Offer Rate (LIBOR).
The following table shows the sensitivity of changes in financial obligations that are not hedged against interest-rate variations. These changes are considered reasonably possible based on current market conditions.
| Positions as of September 30, 2011 | Positions as of December 31, 2010 | |||
| Increase (decrease) | effect on pre-tax earnings | effect on pre-tax earnings | ||
| in libor 3 months | (millions of US$) | (millions of US$) | ||
| +100 basis points | -2.40 | -1.18 | ||
| -100 basis points | +2.40 | +1.18 |
Changes in market conditions produce a change in the valuation of current financial instruments hedging interest rates, causing an effect on the Company’s equity (because they are booked as cash-flow hedges). These changes are considered reasonably possible based on current market conditions. The calculations were made increasing (decreasing) vertically 100 basis points of the three-month Libor futures curve.
| Increase | Positions as of September 30, 2011 | Positions as of December 31, 2010 | ||
| futures curve | effect on equity | effect on equity | ||
| months | (millions of US$) | (millions of US$) | ||
| +100 basis points | 40.62 | 42.39 | ||
| -100 basis points | (43.16) | (45.35) |
29
There are limitations in the method used for the sensitivity analysis and relate to those provided by the market because the levels indicated by the futures curves are not necessarily met and will change in each period.
According to that required by IAS 39, during the periods presented, the Company has not recorded amounts for ineffectiveness in the consolidated income statement.
| (iii) | Local exchange-rate risk: |
The functional currency used by the parent Company is the US dollar in terms of setting prices for its services, the composition of its classified statements of financial position and effects on its operating income. The Company sells most of its services in US dollars or prices equivalent to the US dollar, and a large part of its expenses are denominated in US dollars or equivalents to the US dollar, particularly fuel costs, aeronautic charges, aircraft leases, insurance and aircraft components and accessories. Remuneration expenses are denominated in local currencies.
The Company maintains its cargo and passenger business tariffs in US dollars. There is a mix in the domestic markets as sales in Peru are in local currency but the prices are indexed to the US dollar. In Chile and Argentina, tariffs are in local currency without any kind of indexation. In the case of the domestic business in Ecuador, both tariffs and sales are in dollars. The Company is therefore exposed to fluctuations in the different currencies, mainly: Chilean peso, Argentine peso, Uruguayan peso, Euro, Peruvian sol, Brazilian real, Colombian peso, Australian dollar and New Zealand dollar; of these, the largest exposure is in Chilean pesos.
The Company manages its exposure to foreign currency risk through hedging selected balances using forward exchange contracts and cross currency swaps.
| (b) | Credit risk |
Credit risk occurs when the counterparty to a financial agreement or instrument fails to discharge an obligation due or financial instrument, leading to a loss in market value of a financial instrument (only financial assets, not liabilities).
The Company is exposed to credit risk due to its operative and financial activities, including deposits with banks and financial institutions, investments in other kinds of instruments, exchange-rate transactions and the contracting of derivative instruments or options.
| (i) | Financial activities |
Cash surpluses that remain after the financing of assets necessary for the operation are invested according to credit limits approved by the Company’s Board, mainly in time deposits with different financial institutions, short-term mutual funds, and easily-liquidated corporate and sovereign bonds with short remaining maturities. These investments are booked as cash and cash equivalents and as investments held to maturity.
In order to reduce counterparty risk and to ensure that the risk assumed is known and managed by the Company, investments are diversified among different banking institutions (both local and international). The Company evaluates the credit standing of each counterparty and the levels of investment, based on (i) their credit rating, (ii) the equity size of the counterparty, and (iii) investment limits according to the Company’s level of liquidity. According to these three parameters, the Company chooses the most restrictive parameter of the previous three and based on this, establishes limits for operations with each counterparty.
30
The Company has no guarantees to mitigate this exposure.
| (ii) | Operational activities |
The Company has four large sales “clusters”: travel agencies, cargo agents, airlines and credit-card administrators. The first three are governed by IATA (International Air Transport Association), international organization comprising most of the airlines that represent over 90% of scheduled commercial traffic and one of its main objectives is to regulate the financial transactions between airlines and travel agents and cargo. When an agency or airline does not pay their debt, they are excluded from operating with IATA’s member airlines. In the case of credit-card administrators, they are fully guaranteed by the issuing institutions.
The exposure consists of the term granted, which fluctuates between 1 and 45 days.
One of the tools the Company uses for reducing credit risk is to participate in global entities related to the industry, such as IATA, Business Sales Processing (BSP), Cargo Account Settlement Systems (“CASS”), IATA Clearing House (“ICH”) and banks (credit cards). These institutions fulfill the role of collectors and distributors between airlines and travel and cargo agencies. In the case of the Clearing House, it acts as an offsetting entity between airlines for the services provided between them. A reduction in term and implementation of guarantees has been achieved through these entities.
Credit quality of financial assets
The external credit evaluation system used by the Company is provided by IATA. Internal systems are also used for particular evaluations or specific markets based on trade reports available on the local market. The internal classification system is complementary to the external one, i.e. for agencies or airlines not members of IATA, the internal demands are greater. The bad-debt rate in the principal countries where the Company has a presence is insignificant.
| (c) | Liquidity risk |
Liquidity risk represents the risk that the Company has no funds to meet its obligations.
Because of the cyclical nature of the business, the operation, and its investment and financing needs related to the acquisition of new aircraft and renewal of its fleet, plus the financing needs related to market-risk hedges, the Company requires liquid funds to meet its payment obligations.
The Company therefore manages its cash and cash equivalents and its financial assets, matching the term of investments with those of its obligations. The Company’s policy is that the average term of its investments may not exceed the average term of its obligations. This cash and cash equivalents position is invested in highly-liquid short-term instruments through first-class financial entities.
The Company has future obligations related to financial leases, operating leases, maturities of other bank borrowings, derivative contracts and aircraft purchase contracts.
31
Class of liability for the analysis of liquidity risk ordered by date of maturity as of September 30, 2011
| More than | More than | More than | |||||||||||||||||||||||||||||||||||||||||||||||||||
| Up to | 90days | one to | three to | More than | |||||||||||||||||||||||||||||||||||||||||||||||||
| Class of | Debtor | Debtor | Creditor | Creditor | 90 | to one | three | five | five | Effective | Nominal | Nominal | |||||||||||||||||||||||||||||||||||||||||
| Liability | Tax No. | Debtor | country | Tax No. | Creditor | country | Currency | days | year | years | years | years | Total | Amortization | rate | value | rate | ||||||||||||||||||||||||||||||||||||
| ThUS$ | ThUS$ | ThUS$ | ThUS$ | ThUS$ | ThUS$ | % | ThUS$ | % | |||||||||||||||||||||||||||||||||||||||||||||
Guaranteed obligations | 89.862.200- 2 | Lan Airlines S.A. | Chile | 0- E | ING | U.S.A. | US $ | 4,025 | 12,076 | 32,197 | 32,208 | 64,463 | 144,969 | Quarterly | 5.69 | % | 115,721 | 5.01 | % | ||||||||||||||||||||||||||||||||||
| Lan Airlines S .A. | Chile | 0- E | CREDITE AGRICOLE | France | US $ | 21,160 | 63,781 | 107,463 | 67,281 | 13,363 | 273,048 | Quarterly | 4.13 | % | 258,969 | 4.13 | % | ||||||||||||||||||||||||||||||||||||
| Lan Airlines S .A. | Chile | 0- E | PEFCO | U.S.A. | US $ | 15,633 | 46,900 | 125,054 | 109,118 | 137,762 | 434,467 | Quarterly | 5.17 | % | 365,752 | 4.60 | % | ||||||||||||||||||||||||||||||||||||
| Lan Airlines S .A. | Chile | 0- E | BNP PARIBAS | U.S.A. | US $ | 19,517 | 58,911 | 158,566 | 160,819 | 272,782 | 670,595 | Quarterly | 4.23 | % | 571,552 | 3.77 | % | ||||||||||||||||||||||||||||||||||||
| Lan Airlines S .A. | Chile | 0- E | WELLS FARGO | U.S.A. | US $ | 5,617 | 16,832 | 44,848 | 44,761 | 118,942 | 231,000 | Quarterly | 3.64 | % | 192,855 | 3.53 | % | ||||||||||||||||||||||||||||||||||||
| Lan Airlines S .A. | Chile | 0- E | CITIBANK | U.S.A. | US $ | 11,898 | 35,908 | 96,427 | 97,408 | 253,787 | 495,428 | Quarterly | 3.08 | % | 433,217 | 2.72 | % | ||||||||||||||||||||||||||||||||||||
| Lan Airlines S .A. | Chile | 97.036.000-K | SANTANDER | Spa in | US $ | 5,311 | 16,174 | 43,758 | 44,663 | 148,383 | 258,289 | Quarterly | 0.96 | % | 244,672 | 0.83 | % | ||||||||||||||||||||||||||||||||||||
| Lan Airlines S .A. | Chile | 0- E | J P MORGAN | U.S.A. | US $ | 1,562 | 4,715 | 12,762 | 13,046 | 48,012 | 80,097 | Quarterly | 0.95 | % | 76,099 | 0.80 | % | ||||||||||||||||||||||||||||||||||||
Financial leases | 89.862.200- 2 | Lan Airlines S .A. | Chile | 0- E | ING | U.S.A. | US $ | 7,320 | 22,018 | 44,833 | 41,166 | 12,862 | 128,199 | Quarterly | 3.94 | % | 116,764 | 3.72 | % | ||||||||||||||||||||||||||||||||||
| Lan Airlines S .A. | Chile | 0- E | CREDITE AGRICOLE | France | US $ | 2,270 | 6,883 | 18,633 | 22,071 | 37,095 | 86,952 | Quarterly | 1.28 | % | 81,424 | 1.28 | % | ||||||||||||||||||||||||||||||||||||
| Lan Airlines S .A. | Chile | 0- E | CITIBANK | U.S.A. | US $ | 1,770 | 6,193 | 21,203 | - | - | 29,166 | Quarterly | 1.56 | % | 28,084 | 1.53 | % | ||||||||||||||||||||||||||||||||||||
| Lan Airlines S .A. | Chile | 0- E | S .CHARTERED | U.S.A. | US $ | 3,995 | 5,356 | 9,356 | - | - | 18,707 | Quarterly | 1.26 | % | 18,418 | 4.68 | % | ||||||||||||||||||||||||||||||||||||
| Lan Airlines S .A. | Chile | 0- E | PEFCO | U.S.A. | US $ | 4,204 | 12,613 | 33,634 | 33,636 | 18,940 | 103,027 | Quarterly | 5.22 | % | 89,102 | 4.68 | % | ||||||||||||||||||||||||||||||||||||
| Bank loans | 89.862.200- 2 | Lan Airlines S .A. | Chile | 97.036.000-K | SANTANDER | Chile | US $ | 12,533 | 12,704 | - | - | - | 25,237 | Semiannual | 1.91 | % | 25,000 | 1.91 | % | ||||||||||||||||||||||||||||||||||
| Lan Airlines S .A. | Chile | 97.004.000-5 | BANCO DE CHILE | Chile | US $ | - | 614 | 30,596 | - | - | 31,210 | Semiannual | 2.01 | % | 30,000 | 2.01 | % | ||||||||||||||||||||||||||||||||||||
| Lan Airlines S .A. | Chile | 76.645.030-K | ITAU | Chile | US $ | 49,578 | - | - | - | - | 49,578 | 60 days | 0.94 | % | 49,500 | 0.94 | % | ||||||||||||||||||||||||||||||||||||
| Lan Airlines S .A. | Chile | 97.030.000-7 | ESTADO | Chile | US $ | 168 | 401 | 45,852 | - | - | 46,421 | Semiannual | 1.46 | % | 44,848 | 1.46 | % | ||||||||||||||||||||||||||||||||||||
| Lan Airlines S .A. | Chile | 97.032.000-8 | BBVA | Chile | US $ | - | 1,164 | 60,878 | - | - | 62,042 | Semiannual | 1.99 | % | 60,000 | 1.91 | % | ||||||||||||||||||||||||||||||||||||
| Other loans | 89.862.200- 2 | Lan Airlines S .A. | Chile | 97.036.000-K | SANTANDER | Chile | US $ | 1,212 | 2,491 | 246,864 | - | - | 250,567 | - | 2.34 | % | 245,790 | 2.34 | % | ||||||||||||||||||||||||||||||||||
| Lan Airlines S .A. | Chile | 0- E | BOEING | U.S.A. | US $ | 952 | 2,208 | 241,810 | - | - | 244,970 | - | 1.75 | % | 240,902 | 1.75 | % | ||||||||||||||||||||||||||||||||||||
| Derivatives | 89.862.200- 2 | Lan Airlines S .A. | Chile | - | OTHERS | - | US $ | 7,727 | 29,336 | 74,413 | 41,748 | 8,641 | 161,865 | - | - | 157,594 | - | ||||||||||||||||||||||||||||||||||||
Non-hedging Derivatives | 89.862.200- 2 | Lan Airlines S .A. | Chile | - | OTHERS | - | US $ | 2,015 | 5,900 | 13,969 | 4,389 | - | 26,273 | - | - | 25,816 | - | ||||||||||||||||||||||||||||||||||||
Accounts payable other accounts payable | Lan Airlines S .A. and subsidiaries | Several | - | sundry | - | US $ | 373,632 | 23,744 | - | - | - | 397,376 | - | - | 397,376 | - | |||||||||||||||||||||||||||||||||||||
| - | CLP | 8,662 | - | - | - | - | 8,662 | - | - | 8,662 | - | ||||||||||||||||||||||||||||||||||||||||||
| - | Others | 61,454 | - | - | - | - | 61,454 | - | - | 61,454 | - | ||||||||||||||||||||||||||||||||||||||||||
Other accounts payable, non-current | Lan Airlines S.A. and subsidiaries | Several | - | sundry | - | US $ | - | - | 36,000 | - | - | 36,000 | - | - | 36,000 | - | |||||||||||||||||||||||||||||||||||||
Accounts payable related parties | Lan Airlines S.A. and subsidiaries | Several | 96.847.880-K | Lufthansa Lan Technical Training S.A. | - | US $ | 37 | - | - | - | - | 37 | - | - | 37 | - | |||||||||||||||||||||||||||||||||||||
| Several | 96.921.070- 3 | Austral sociedad | - | ||||||||||||||||||||||||||||||||||||||||||||||||||
| Concesionaria S.A. | - | US $ | 2 | - | - | - | - | 2 | - | - | 2 | - | |||||||||||||||||||||||||||||||||||||||||
| Several | 78.591.370- 1 | Bethia S.A. and subsidiaries | - | CLP | 202 | - | - | - | - | 202 | - | - | 202 | - | |||||||||||||||||||||||||||||||||||||||
| Several | Foreing | Inversora Aeronaútica Argentina | - | US $ | 203 | - | - | - | - | 203 | - | - | 203 | - | |||||||||||||||||||||||||||||||||||||||
| Total | 622,659 | 386,922 | 1,499,116 | 712,314 | 1,135,032 | 4,356,043 | 3,976,015 | ||||||||||||||||||||||||||||||||||||||||||||||
32
Class of liability for the analysis of liquidity risk ordered by date of maturity as of December 31, 2010
| More than | More tha n | More than | |||||||||||||||||||||||||||||||||||||||||||||||||||
| Up to | 90 days | one to | three to | More than | |||||||||||||||||||||||||||||||||||||||||||||||||
| Class of | Debtor | Debtor | Creditor | Creditor | 90 | to one | three | five | five | Effective | Nominal | Nominal | |||||||||||||||||||||||||||||||||||||||||
| liability | Tax No. | Debtor | country | Tax No. | Creditor | country | Currency | days | year | years | years | years | Total | Amortization | rate | value | rate | ||||||||||||||||||||||||||||||||||||
| ThUS $ | ThUS $ | ThUS $ | ThUS $ | ThUS $ | ThUS $ | % | ThUS $ | % | |||||||||||||||||||||||||||||||||||||||||||||
Guaranteed obligations | 89.862.200-2 | Lan Airlines S.A. | Chile | 0-E | ING | U.S.A. | US$ | 7,425 | 22,305 | 53,471 | 47,128 | 93,325 | 223,654 | Quarterly | 5.19 | % | 181,029 | 4.69 | % | ||||||||||||||||||||||||||||||||||
| Lan Airlines S.A. | Chile | 0-E | CALYON | France | US$ | 21,045 | 63,352 | 130,785 | 39,186 | 20,916 | 275,284 | Quarterly | 4.47 | % | 256,417 | 4.47 | % | ||||||||||||||||||||||||||||||||||||
| Lan Airlines S.A. | Chile | 0-E | PEFCO | U.S.A. | US$ | 19,838 | 59,513 | 158,688 | 149,595 | 209,374 | 597,008 | Quarterly | 5.16 | % | 497,692 | 4.60 | % | ||||||||||||||||||||||||||||||||||||
| Lan Airlines S.A. | Chile | 0-E | BNP PARIBAS | U.S.A. | US$ | 22,831 | 68,726 | 184,673 | 186,931 | 385,438 | 848,599 | Quarterly | 4.49 | % | 707,306 | 4.00 | % | ||||||||||||||||||||||||||||||||||||
| Lan Airlines S.A. | Chile | 0-E | WELLS FARGO | U.S.A. | US$ | 5,626 | 16,842 | 44,872 | 44,796 | 135,714 | 247,850 | Quarterly | 3.64 | % | 204,392 | 3.53 | % | ||||||||||||||||||||||||||||||||||||
| Lan Airlines S.A. | Chile | 0-E | CITIBANK | U.S.A. | US$ | 8,984 | 27,039 | 72,767 | 73,806 | 206,771 | 389,367 | Quarterly | 3.93 | % | 326,235 | 3.48 | % | ||||||||||||||||||||||||||||||||||||
| Lan Airlines S.A. | Chile | 0-E | SANTANDER | Spain | US$ | 2,919 | 8,859 | 24,242 | 25,206 | 95,708 | 156,934 | Quarterly | 0.95 | % | 148,741 | 0.83 | % | ||||||||||||||||||||||||||||||||||||
Financial leases | 89.862.200-2 | Lan Airlines S.A. | Chile | 0-E | ING | U.S.A. | US$ | 3,899 | 11,685 | 30,440 | 25,695 | 11,675 | 83,394 | Quarterly | 4.08 | % | 77,096 | 3.71 | % | ||||||||||||||||||||||||||||||||||
| Lan Airlines S.A. | Chile | 0-E | CALYON | France | US$ | 2,249 | 6,786 | 18,376 | 22,613 | 43,431 | 93,455 | Quarterly | 1.27 | % | 87,337 | 1.27 | % | ||||||||||||||||||||||||||||||||||||
| Lan Airlines S.A. | Chile | 0-E | CITIBANK | U.S.A. | US$ | 1,692 | 5,249 | 26,758 | - | - | 33,699 | Quarterly | 1.32 | % | 32,921 | 1.27 | % | ||||||||||||||||||||||||||||||||||||
| Lan Airlines S.A. | Chile | 0-E | S.CHARTERED | U.S.A. | US$ | 3,858 | 11,873 | 14,628 | - | - | 30,359 | Quarterly | 1.28 | % | 29,864 | 1.25 | % | ||||||||||||||||||||||||||||||||||||
| Bank loans | 89.862.200-2 | Lan Airlines S.A. | Chile | 0-E | SANTANDER MADRID | Spain | US$ | - | 26,125 | 12,726 | - | - | 38,851 | Semiannual | 3.64 | % | 37,500 | 3.55 | % | ||||||||||||||||||||||||||||||||||
| Bank loans | 89.862.200-2 | Lan Airlines S.A. | Chile | 97.023.000-9 | CORPBANCA | Chile | CLP | 13,479 | 13,158 | 12,713 | - | - | 39,350 | Semiannual | 6.53 | % | 36,858 | 6.44 | % | ||||||||||||||||||||||||||||||||||
| Lan Airlines S.A. | Chile | 76.645.030-K | ITAU | Chile | CLP | - | 21,653 | 10,332 | - | - | 31,985 | Semiannual | 6.67 | % | 29,967 | 6.60 | % | ||||||||||||||||||||||||||||||||||||
| Lan Airlines S.A. | Chile | 97.006.000-6 | BCI | Chile | CLP | - | 38,144 | 18,188 | - | - | 56,332 | Semiannual | 6.71 | % | 52,723 | 6.63 | % | ||||||||||||||||||||||||||||||||||||
| Lan Airlines S.A. | Chile | 97.030.000-7 | ESTADO | Chile | CLP | - | 47,521 | 22,666 | - | - | 70,187 | Semiannual | 6.65 | % | 65,704 | 6.59 | % | ||||||||||||||||||||||||||||||||||||
| Aires S.A. | Colombia | 0-E | HELM | Colombia | COP | 3,944 | - | - | - | - | 3,944 | 30 days | 3.37 | % | 3,936 | 3.37 | % | ||||||||||||||||||||||||||||||||||||
| Other loans | 89.862.200-2 | Lan Airlines S.A. | Chile | 0-E | SANTANDER MADRID | Spain | US$ | 586 | 1,587 | 72,962 | - | - | 75,135 | - | 3.29 | % | 72,962 | 3.29 | % | ||||||||||||||||||||||||||||||||||
| Lan Airlines S.A. | Chile | 0-E | BOEING | U.S.A. | US$ | 1,862 | 1,207 | 106,665 | - | - | 109,734 | - | 2.04 | % | 106,209 | 2.04 | % | ||||||||||||||||||||||||||||||||||||
| Derivatives | 89.862.200-2 | Lan Airlines S.A. | Chile | - | OTHERS | - | US$ | 6,018 | 22,331 | 61,273 | 24,643 | 4,751 | 119,016 | - | - | 115,189 | - | ||||||||||||||||||||||||||||||||||||
Non-hedging Derivatives | 89.862.200-2 | Lan Airlines S.A. | Chile | - | OTHERS | - | US$ | 1,461 | 4,239 | 9,891 | 5,608 | - | 21,199 | - | - | 20,703 | - | ||||||||||||||||||||||||||||||||||||
| Accounts payable other accounts payable | Lan Airlines S.A. and subsidiaries | Varios | - | Varios | - | US$ | 277,327 | 26,002 | - | - | - | 303,329 | - | - | 303,329 | - | |||||||||||||||||||||||||||||||||||||
| - | CLP | 28,058 | - | - | - | - | 28,058 | - | - | 28,058 | - | ||||||||||||||||||||||||||||||||||||||||||
| - | Others | 169,307 | - | - | - | - | 169,307 | - | - | 169,307 | - | ||||||||||||||||||||||||||||||||||||||||||
| Other accounts payable, non-current | Lan Airlines S.A. and subsidiaries | Varios | - | Varios | - | US$ | - | - | 54,000 | - | - | 54,000 | - | - | 54,000 | - | |||||||||||||||||||||||||||||||||||||
| Accounts payable related parties | Lan Airlines S.A. and subsidiaries | Varios | 96.847.880-k | Lufthansa Lan Technical trainingS. | - | US$ | 110 | - | - | - | - | 110 | - | - | 110 | - | |||||||||||||||||||||||||||||||||||||
| - | CLP | 74 | - | - | - | - | 74 | - | - | 74 | - | ||||||||||||||||||||||||||||||||||||||||||
| Total | 602,592 | 504,196 | 1,141,116 | 645,207 | 1,207,103 | 4,100,214 | 3,645,659 | ||||||||||||||||||||||||||||||||||||||||||||||
33
The Company has fuel and interest rate hedging strategies involving derivatives contracts with different financial institutions. The Company has margin facilities with each financial institution in order to regulate the mutual exposure produced by changes in the market valuation of the derivatives.
At the end of 2010, the Company had provided US$ 78.5 million in derivative margin guarantees, for cash and stand-by letters of credit. At the end of September 30, 2011, the Company had provided US$ 125.0 million in guarantees for cash and stand-by letters of credit. The increase was due to maturity and acquisition of fuel contracts and rates, rising fuel prices and falling interest rates.
3.2. Capital risk management
The Company’s objectives, with respect to the management of capital, are (i) to safeguard it in order to continue as an on-going business, (ii) to seek a return for its shareholders, and (iii) to maintain an optimum capital structure and reduce its costs.
In order to maintain or adjust the capital structure, the Company may adjust the amount of the dividends payable to shareholders, return capital to shareholders, issue new shares or sell assets to reduce debt.
The Company monitors the adjusted leverage ratio, in line with industry practice. This index is calculated as net adjusted debt divided by the sum between adjusted equity and net adjusted debt. Net adjusted debt is total financial debt plus 8 times the operating lease payments of the last 12 months, less total cash (measured as the sum of cash and cash equivalents plus marketable securities). Capital is the amount of net equity without the impact of the market value of derivatives, plus net adjusted debt.
Currently the Company's strategy, which has not changed since 2007, has consisted of maintaining a leverage ratio of between 70% and 80% and an international credit rating of higher than BBB- (the minimum required for being considered investment grade).
34
The leverage ratios as of September 30, 2011, and December 31, 2010, were as follows:
| As of | As of | |||||||
| September 30, | December 31, | |||||||
| 2011 | 2010 | |||||||
| ThUS$ | ThUS$ | |||||||
| Total financial loans | 3,539,142 | 3,259,666 | ||||||
| Last twelve months Operating lease payment x 8 | 1,251,200 | 788,704 | ||||||
| Less: | ||||||||
| Cash and marketable securities | (331,951 | ) | (737,093 | ) | ||||
| Total net adjusted debt | 4,458,391 | 3,311,277 | ||||||
| Net Equity | 1,333,218 | 1,296,814 | ||||||
| Net coverage reserves | 203,258 | 107,050 | ||||||
| Adjusted equity | 1,536,476 | 1,403,864 | ||||||
| Total adjusted debt and equity | 5,994,867 | 4,715,141 | ||||||
| Adjusted leverage | 74.4 | % | 70.2 | % | ||||
3.3. Estimates of fair value
At September 30, 2011, the Company maintained financial instruments that should be recorded at fair value. These include:
Investments in short-term Mutual Funds (cash equivalent),
Interest rate derivative contracts,
Fuel derivative contracts,
Currency derivative contracts, and
Investment funds.
The Company has classified the fair value measurement using a hierarchy that reflects the level of information used in the assessment. This hierarchy consists of 3 levels (I) fair value based on quoted prices in active markets for identical assets or liabilities, (II) fair value based on inputs other than quoted prices included within level 1 that are observable for the asset or liability, either directly (that is, as prices) or indirectly (that is, derived from prices) and (III) fair value based on inputs for the asset or liability that are not based on observable market data.
The fair value of financial instruments traded in active markets, such as investments acquired for trading, is based on quoted market prices at the close of the period using the current price of the buyer. The fair value of financial assets not traded in active markets (derivative contracts) is determined using valuation techniques that maximize use of available market information. Valuation techniques generally used by the Company are quoted market prices of similar instruments and / or estimating the present value of future cash flows using forward price curves of the market at the close of the period.
35
The following table shows the classification of financial instruments at fair value at September 30, 2011 depending on the level of information used in the assessment:
| Fair value | Fair value measurements using values | |||||||||||||||
| At September 30, | considered as | |||||||||||||||
| 2011 | Level I | Level II | Level III | |||||||||||||
| ThUS$ | ThUS$ | ThUS$ | ThUS$ | |||||||||||||
| Assets | ||||||||||||||||
| Short-term mutual funds | 101,561 | 101,561 | - | - | ||||||||||||
| Fair value of interest rate derivatives | 122 | - | 122 | - | ||||||||||||
| Fair value of fuel derivatives | - | - | - | - | ||||||||||||
| Fair value of foreign currency derivatives | 821 | - | 821 | |||||||||||||
| Fair value of investment funds | 59,201 | 59,201 | - | - | ||||||||||||
| Liabilities | ||||||||||||||||
| Fair value of interest rate derivatives | 161,863 | - | 161,863 | - | ||||||||||||
| Fair value of fuel derivatives | 36,719 | - | 36,719 | - | ||||||||||||
| Fair value of foreign currency derivatives | 62 | - | 62 | - | ||||||||||||
| Interest rate derivatives not accounted for as hedging instruments | 16,052 | - | 16,052 | - | ||||||||||||
36
Additionally, at September 30, 2011, the Company has financial instruments which are not recorded at fair value. In order to meet the disclosure requirements of fair values the Company has valued these instruments as shown in the table below:
| As of September 30, 2011 | As of December 31, 2010 | |||||||||||||||
| Book | Fair | Book | Fair | |||||||||||||
| value | value | value | value | |||||||||||||
| ThUS$ | ThUS$ | ThUS$ | ThUS$ | |||||||||||||
| Cash and cash equivalents | ||||||||||||||||
| Cash and cash equivalents | 4,283 | 4,283 | 3,857 | 3,857 | ||||||||||||
| Bank balance | 23,501 | 23,501 | 24,432 | 24,432 | ||||||||||||
| Time Deposits | 54,271 | 54,271 | 406,143 | 406,143 | ||||||||||||
| Repurchase agreements | 49,845 | 49,845 | - | - | ||||||||||||
| Other financial assets | ||||||||||||||||
| Domestic and foreign bonds | 39,289 | 41,297 | 47,184 | 50,294 | ||||||||||||
| Other financial assets | 150,970 | 150,970 | 80,836 | 80,836 | ||||||||||||
| Trade and other accounts receivable and right receivable, non-current | 534,848 | 534,848 | 489,233 | 489,233 | ||||||||||||
| Accounts receivable from related entities | 1,324 | 1,324 | 50 | 50 | ||||||||||||
| Other financial liabilities | 3,213,491 | 3,300,317 | 2,945,294 | 2,969,939 | ||||||||||||
| Trade and other accounts payable, current | 467,492 | 467,492 | 500,694 | 500,694 | ||||||||||||
| Accounts payable to related entities | 444 | 444 | 184 | 184 | ||||||||||||
| Other accounts payable, non-current | 361,651 | 361,651 | 368,372 | 368,372 | ||||||||||||
The book values of accounts receivable and payable are assumed to approximate their fair values, due to their short-term nature. In the case of cash on hand, bank balances, deposits and others accounts payable, non-current, fair value approximates their carrying values.
The fair value of other financial liabilities is estimated by discounting the future contractual cash flows at the current market interest rate for similar financial instruments. In the case of other financial assets, the valuation was performed according to market prices at year end.
37
NOTE 4 - ACCOUNTING ESTIMATES AND JUDGMENTS
The Company has used estimates to value and book some of the assets, liabilities, revenues, expenses and commitments; these relate principally to:
| 1. | The evaluation of possible impairment losses for certain assets. |
| 2. | The useful lives and residual values of fixed and intangible assets. |
| 3. | The criteria employed in the valuation of certain assets. |
| 4. | Air tickets sold that are not actually used. |
| 5. | The calculation of deferred income at the period-end, corresponding to the valuation of kilometers credited to holders of the Lan Pass loyalty card which have not yet been used. |
| 6. | The need for provisions and where required, the determination of their values. |
| 7. | The recoverability of deferred tax assets. |
These estimates are made on the basis of the best information available on the matters analyzed.
In any case, it is possible that events will require modification of the estimates in the future, in which case the effects would be accounted for prospectively.
38
NOTE 5 – SEGMENTAL INFORMATION
The Company reports information by segments as established in IFRS 8 “Operating segments”. This standard sets rules for the reporting of information by segments in the financial statements, plus reporting about products and services, geographical areas and principal customers.
An operating segment is defined as a component of an entity on which financial information is held separately and which is evaluated regularly by the senior management in making decisions with respect to the assignment of resources and evaluation of results. The Company believes that it has only one operating segment: air transportation.
| Air transport segment | ||||||||||||||||
| For the nine months ended | For the three months ended | |||||||||||||||
| September 30, | September 30, | |||||||||||||||
| 2011 | 2010 | 2011 | 2010 | |||||||||||||
| ThUS$ | ThUS$ | ThUS$ | ThUS$ | |||||||||||||
| Income from ordinary activities and other operating income | 4,182,935 | 3,220,850 | 1,486,520 | 1,152,330 | ||||||||||||
| Interest income | 9,687 | 10,390 | 1,063 | 5,284 | ||||||||||||
| Interest expense | (104,610 | ) | (116,545 | ) | (34,398 | ) | (38,045 | ) | ||||||||
| Total net interest expense | (94,923 | ) | (106,155 | ) | (33,335 | ) | (32,761 | ) | ||||||||
| Depreciation and amortization | (290,816 | ) | (244,894 | ) | (96,694 | ) | (81,625 | ) | ||||||||
| Segment profit | 207,697 | 255,143 | 94,513 | 106,214 | ||||||||||||
| Earnings on investments | 471 | 153 | 508 | 34 | ||||||||||||
| Expenses for income tax | (40,941 | ) | (50,227 | ) | (17,661 | ) | (20,157 | ) | ||||||||
| Assets of segment | 7,072,501 | 6,186,533 | 7,072,501 | 6,186,533 | ||||||||||||
| Investments in associates | 1,118 | 1,279 | 1,118 | 1,279 | ||||||||||||
| Purchase of non-monetary assets | 888,224 | 510,171 | 184,339 | 173,161 | ||||||||||||
39
The Company’s revenues by geographic area are as follows:
| For the nine months ended | For the three months ended | |||||||||||||||
| September 30, | September 30, | |||||||||||||||
| 2011 | 2010 | 2011 | 2010 | |||||||||||||
| ThUS$ | ThUS$ | ThUS$ | ThUS$ | |||||||||||||
| Peru | 393,345 | 401,810 | 158,807 | 143,878 | ||||||||||||
| Argentina | 435,477 | 355,443 | 164,893 | 136,836 | ||||||||||||
| USA | 835,608 | 614,969 | 292,508 | 211,755 | ||||||||||||
| Europe | 378,429 | 320,174 | 139,571 | 110,858 | ||||||||||||
| Colombia | 291,153 | 57,660 | 95,109 | 20,902 | ||||||||||||
| Chile | 1,050,238 | 878,987 | 369,143 | 306,289 | ||||||||||||
| Others* | 798,685 | 591,807 | 266,489 | 221,812 | ||||||||||||
| Total (**) | 4,182,935 | 3,220,850 | 1,486,520 | 1,152,330 | ||||||||||||
The Company allocates revenues by geographic area based on the point of sale of the passenger ticket or cargo. Assets are primarily composed of aircraft and aeronautical equipment, which are used throughout the different countries, so it is not possible to assign a geographic area.
(*) Includes the rest of Latin America and Asia Pacific.
(**) Includes operating revenues and other operating income.
40
NOTE 6 – CASH AND CASH EQUIVALENTS
| As of | As of | |||||||
| September 30, | December 31, | |||||||
| 2011 | 2010 | |||||||
| ThUS$ | ThUS$ | |||||||
| Cash | 4,283 | 3,857 | ||||||
| Bank balances | 23,501 | 24,432 | ||||||
| Time deposits | 54,271 | 406,143 | ||||||
| Repurchase agreements | 49,845 | - | ||||||
| Others | 101,561 | 196,620 | ||||||
| Total | 233,461 | 631,052 | ||||||
Cash and cash equivalents are denominated in the following currencies at September 30, 2011, and December 31, 2010, are as follows:
| As of | As of | |||||||
| September 30, | December 31, | |||||||
| Currency | 2011 | 2010 | ||||||
| ThUS$ | ThUS$ | |||||||
| US Dollar | 114,753 | 194,212 | ||||||
| Chilean peso (*) | 74,094 | 368,360 | ||||||
| Euro | 4,093 | 7,844 | ||||||
| Argentine peso | 6,960 | 11,230 | ||||||
| Brazilian real | 719 | 4,759 | ||||||
| Other currencies | 32,842 | 44,647 | ||||||
| Total | 233,461 | 631,052 | ||||||
(*) The Company entered into currency derivative contracts (forward exchange controls) for ThUS $ 10,069 at September 30, 2011 (ThUS $ 169,357 at December 31, 2010), for conversion into dollars of investments in Chilean pesos, currency derivative contracts (cross currency swaps) for ThUS $ 0 at September 30, 2011 (ThUS $ 30,258 at December 31, 2010), for conversion into dollars of investment in Unidades de Fomento (“UF”) and currency derivative contracts (forward exchange controls) for ThUS$ 10,069 at September 30, 2011 (ThUS $ 0 at December 31, 2010), for conversion into dollars of investment in Unidades de Fomento (“UF”).
In Venezuela, effective 2003, the authorities decreed that all remittances abroad should be approved by the Currency Management Commission (CADIVI). Despite having free availability of bolivars in Venezuela, the Company has certain restrictions for freely remitting these funds outside Venezuela. At September 30, 2011 the amount subject to such restrictions in dollar terms is ThUS$ 16,925 (ThUS$ 26,738 at December 31, 2010).
The Company has no significant non-monetary transactions that should be reported.
41
NOTE 7 - FINANCIAL INSTRUMENTS
7.1. Financial instruments by category
As of September 30, 2011
| Assets | Designated as | |||||||||||||||||||||||
| at fair value | ||||||||||||||||||||||||
| Loans and | through profit | |||||||||||||||||||||||
| Held to | accounts | Hedging | Held to | and loss on initial | ||||||||||||||||||||
| maturity | receivable | derivatives | trading | recognition | Total | |||||||||||||||||||
| ThUS$ | ThUS$ | ThUS$ | ThUS$ | ThUS$ | ThUS$ | |||||||||||||||||||
| Cash and cash equivalents | - | 131,900 | - | 101,561 | - | 233,461 | ||||||||||||||||||
| Other financial assets (*) | 39,795 | 150,464 | 943 | - | 59,201 | 250,403 | ||||||||||||||||||
| Trade and other current accounts receivable | - | 527,315 | - | - | - | 527,315 | ||||||||||||||||||
| Current accounts receivable from related parties | - | 1,324 | - | - | - | 1,324 | ||||||||||||||||||
| Non-current rights receivable | - | 7,533 | - | - | - | 7,533 | ||||||||||||||||||
| Total | 39,795 | 818,536 | 943 | 101,561 | 59,201 | 1,020,036 | ||||||||||||||||||
| Liabilities | Other | |||||||||||||||
| Financial | Hedging | Held to | ||||||||||||||
| liabilities | derivatives | trading | Total | |||||||||||||
| ThUS$ | ThUS$ | ThUS$ | ThUS$ | |||||||||||||
| Other financial liabilities | 3,213,491 | 198,644 | 16,052 | 3,428,187 | ||||||||||||
| Trade and other current accounts payable | 467,492 | - | - | 467,492 | ||||||||||||
| Current accounts payable to related parties | 444 | - | - | 444 | ||||||||||||
| Other non-current accounts payable | 361,651 | - | - | 361,651 | ||||||||||||
| Total | 4,043,078 | 198,644 | 16,052 | 4,257,774 | ||||||||||||
(*)The value submitted in held to maturity corresponds, mainly, to domestic and foreign bonds; and designated as at fair value through profit and loss on initial recognition, to investment funds; and loans and accounts receivable related to guarantees given.
42
As of December 31, 2010
| Assets | Designated as | |||||||||||||||||||||||
| at fair value | ||||||||||||||||||||||||
| Loans and | through profit | |||||||||||||||||||||||
| Held to | accounts | Hedging | Held to | and loss on initial | ||||||||||||||||||||
| maturity | receivable | derivatives | trading | recognition | Total | |||||||||||||||||||
| ThUS$ | ThUS$ | ThUS$ | ThUS$ | ThUS$ | ThUS$ | |||||||||||||||||||
| Cash and cash equivalents | - | 434,432 | - | 196,620 | - | 631,052 | ||||||||||||||||||
| Other financial assets (*) | 47,691 | 80,329 | 80,161 | - | 58,857 | 267,038 | ||||||||||||||||||
| Trade and other current accounts receivable | - | 481,350 | - | - | - | 481,350 | ||||||||||||||||||
| Current accounts receivable from related parties | - | 50 | - | - | - | 50 | ||||||||||||||||||
| Non-current rights receivable | - | 7,883 | - | - | - | 7,883 | ||||||||||||||||||
| Total | 47,691 | 1,004,044 | 80,161 | 196,620 | 58,857 | 1,387,373 | ||||||||||||||||||
| Liabilities | Other | |||||||||||||||
| Financial | Hedging | Held to | ||||||||||||||
| liabilities | derivatives | trading | Total | |||||||||||||
| ThUS$ | ThUS$ | ThUS$ | ThUS$ | |||||||||||||
| Other financial liabilities | 2,945,294 | 139,930 | 19,748 | 3,104,972 | ||||||||||||
| Trade and other current accounts payable | 500,694 | - | - | 500,694 | ||||||||||||
| Current accounts payable to related parties | 184 | - | - | 184 | ||||||||||||
| Other non-current accounts payable | 368,372 | - | - | 368,372 | ||||||||||||
| Total | 3,814,544 | 139,930 | 19,748 | 3,974,222 | ||||||||||||
(*) The value submitted in held to maturity corresponds mainly to domestic and foreign bonds; and designated as at fair value through profit and loss on initial recognition, to investment funds; and loans and accounts receivable related to guarantees given.
43
7.2. Financial instruments by currency
| As of | As of | |||||||
| September 30, | December 31, | |||||||
| a) Assets | 2011 | 2010 | ||||||
| ThUS$ | ThUS$ | |||||||
| Cash and cash equivalents | 233,461 | 631,052 | ||||||
| US Dollar | 114,753 | 194,212 | ||||||
| Chilean Peso | 74,094 | 368,360 | ||||||
| Euro | 4,093 | 7,844 | ||||||
| Argentine Peso | 6,960 | 11,230 | ||||||
| Brazilian Real | 719 | 4,759 | ||||||
| Others | 32,842 | 44,647 | ||||||
| Other financial Assets | 250,403 | 267,038 | ||||||
| US Dollar | 238,139 | 255,808 | ||||||
| Brazilian Real | 6,717 | 6,731 | ||||||
| Others | 5,547 | 4,499 | ||||||
| Trade and other current accounts receivable | 527,315 | 481,350 | ||||||
| US Dollar | 343,279 | 354,702 | ||||||
| Chilean Peso | 52,239 | 28,606 | ||||||
| Euro | 11,513 | 8,429 | ||||||
| Argentine Peso | 42,660 | 6,702 | ||||||
| Brazilian Real | 42,664 | 31,329 | ||||||
| Australian Dollar | 7,740 | 12,456 | ||||||
| Others | 27,220 | 39,126 | ||||||
| Non-current rights receivable | 7,533 | 7,883 | ||||||
| US Dollar | 9 | 9 | ||||||
| Chilean Peso | 7,306 | 7,864 | ||||||
| Others | 218 | 10 | ||||||
| Current accounts receivable from related parties | 1,324 | 50 | ||||||
| US Dollar | 29 | 29 | ||||||
| Chilean Peso | 1,295 | 21 | ||||||
| Total financial assets | 1,020,036 | 1,387,373 | ||||||
| US Dollar | 696,209 | 804,760 | ||||||
| Chilean Peso | 134,934 | 404,851 | ||||||
| Euro | 15,606 | 16,273 | ||||||
| Argentine Peso | 49,620 | 17,932 | ||||||
| Brazilian Real | 50,100 | 42,819 | ||||||
| Australian Dollar | 7,740 | 12,456 | ||||||
| Others | 65,827 | 88,282 | ||||||
44
b) Liabilities
Liabilities information is detailed in the table within Note 3 section (c) Liquidity risk.
NOTE 8 – TRADE, OTHER ACCOUNTS RECEIVABLE AND NON-CURRENT RIGHTS RECEIVABLE
| As of | As of | |||||||
| September 30, | December 31, | |||||||
| 2011 | 2010 | |||||||
| ThUS$ | ThUS$ | |||||||
| Trade accounts receivable | 449,759 | 435,576 | ||||||
| Other accounts receivable and rights receivable | 107,720 | 75,734 | ||||||
| Total trade and other accounts receivable | 557,479 | 511,310 | ||||||
| Less: Allowance for impairment loss | (22,631 | ) | (22,077 | ) | ||||
| Total net trade and other accounts receivable | 534,848 | 489,233 | ||||||
| Less: non-current portion – rights receivable | (7,533 | ) | (7,883 | ) | ||||
| Trade and other accounts receivable, current | 527,315 | 481,350 | ||||||
The fair value of trade and other accounts receivable does not differ significantly from the book value.
There are overdue accounts receivable which are not impaired. Maturity of these accounts is as follows:
| As of | As of | |||||||
| September 30, | December 31, | |||||||
| 2011 | 2010 | |||||||
| ThUS$ | ThUS$ | |||||||
| Up to 3 months | 7,513 | 12,506 | ||||||
| Between 3 and 6 months | 6,541 | 11,114 | ||||||
| Total | 14,054 | 23,620 | ||||||
The amounts of impaired trade and other accounts receivable are as follows:
| As of | As of | |||||||
| September 30, | December 31, | |||||||
| 2011 | 2010 | |||||||
| ThUS$ | ThUS$ | |||||||
| Judicial and extra-judicial collection | 10,031 | 10,586 | ||||||
| Debtors under extra-judicial collection process | 3,559 | 5,259 | ||||||
| Total | 13,590 | 15,845 | ||||||
45
Currency balances that make up the trade receivables, other non-current accounts receivable and rights receivables at September 30, 2011 and December 31, 2010, are as follows:
| As of | As of | |||||||
| September 30, | December 31, | |||||||
| 2011 | 2010 | |||||||
| Currency | ThUS$ | ThUS$ | ||||||
| US Dollar | 343,288 | 354,711 | ||||||
| Chilean Peso | 59,545 | 36,470 | ||||||
| Euro | 11,513 | 8,429 | ||||||
| Argentine Peso | 42,660 | 6,702 | ||||||
| Brazilian Real | 42,664 | 31,329 | ||||||
| Australian Dollar | 7,740 | 12,456 | ||||||
| Other | 27,438 | 39,136 | ||||||
| Total | 534,848 | 489,233 | ||||||
The Company records allowances when there is evidence of impairment of trade receivables. The criteria used to determine that there is objective evidence of impairment losses are the maturity of the portfolio, specific acts of damage (default) and specific market signals.
| Maturity | Impairment | |||
| Judicial and extra-judicial collection Assets | 100 | % | ||
| Over 1 year | 100 | % | ||
| Between 6 and 12 months | 50 | % | ||
46
The movement in the allowance for impairment loss of trade accounts and other accounts receivables between January 01, 2010 and September 30, 2011 is as follows:
| ThUS$ | ||||
| As of January 01, 2010 | (23,817 | ) | ||
| Write-offs | 2,411 | |||
| Increase in allowance | (3,352 | ) | ||
| Balance as of September 30, 2010 | (24,758 | ) | ||
| As of October 01, 2010 | (24,758 | ) | ||
| Write-offs | 2,628 | |||
| Decrease in allowance | 53 | |||
| Balance as of December 31, 2010 | (22,077 | ) | ||
| As of January 01, 2011 | (22,077 | ) | ||
| Write-offs | 660 | |||
| Increase in allowance | (1,214 | ) | ||
| Balance as of September 30, 2011 | (22,631 | ) | ||
Once extra-judicial and judicial collection efforts are exhausted, the assets are written off against the allowance. The Company only uses the allowance method rather than direct write-off, to ensure control.
Historic and current re-negotiations are not relevant and the policy is to analyze case by case in order to classify them according to the existence of risk, determining whether it is appropriate to re-classify accounts as in pre-judicial recovery. If such re-classification is justified, an allowance is made for the account, whether overdue or falling due.
The maximum credit-risk exposure at the date of presentation of the information is the fair value of each one of the categories of accounts receivable indicated above.
| As of September 30, 2011 | As of December 31, 2010 | |||||||||||||||||||||||
| Gross | Exposure net | Gross | Exposure net | |||||||||||||||||||||
| Gross | Impaired | of risk | Gross | Impaired | of risk | |||||||||||||||||||
| exposure | exposure | concentrations | exposure | exposure | concentrations | |||||||||||||||||||
| ThUS$ | ThUS$ | ThUS$ | ThUS$ | ThUS$ | ThUS$ | |||||||||||||||||||
| Trade accounts receivable | 449,759 | (22,631 | ) | 427,128 | 435,576 | (22,077 | ) | 413,499 | ||||||||||||||||
| Other accounts receivable | 107,720 | - | 107,720 | 75,734 | - | 75,734 | ||||||||||||||||||
There are no relevant guarantees covering credit risk and these are valued when they are settled; no materially important direct guarantees exist. Existing guarantees, if appropriate, are made through IATA.
47
NOTE 9 - ACCOUNTS RECEIVABLE FROM/PAYABLE TO RELATED ENTITIES
The accounts receivable from and payable to related entities as of September 30, 2011 and December 31, 2010, respectively, are as follows:
a) Accounts Receivable
| Country | As of | As of | |||||||||||||||||
| of | September 30, | December 31, | Transaction | Nature of | |||||||||||||||
| Tax No. | Related party | Relationship | origin | 2011 | 2010 | Currency | deadlines | transaction | |||||||||||
| ThUS$ | ThUS$ | ||||||||||||||||||
| 96.810.370-9 | Inversiones Costa Verde Ltda y CPA | Controlling shareholder | Chile | 18 | - | CLP | 30 to 45 Days | Monetary | |||||||||||
| 96.778.310-2 | Concesionaria Chucumata S.A. | Associate | Chile | - | 4 | CLP | 30 to 45 Days | Monetary | |||||||||||
| 96.921.070-3 | Austral Sociedad Concesionaria S.A. | Associate | Chile | - | 2 | CLP | 30 to 45 Days | Monetary | |||||||||||
78.591.370-1-2 | Bethia S.A. y Filiales | Others related parties | Chile | 1,236 | - | CLP | 30 to 45 Days | Monetary | |||||||||||
| 87.752.000-5 | Granja Marina T ornagaleones S.A. | Others related parties | Chile | 41 | 15 | CLP | 30 to 45 Days | Monetary | |||||||||||
| 96.812.280-0 | San Alberto S.A. y Filiales | Others related parties | Chile | 29 | 29 | US$ | 30 to 45 Days | Monetary | |||||||||||
| Total current assets | 1,324 | 50 | |||||||||||||||||
At September 30, 2011 and December 31, 2010, there have been no loan loss provisions.
48
b) Accounts payable
| Country | As of | As of | |||||||||||||||||
| of | September 30, | December 31, | Transaction | Nature of | |||||||||||||||
| Tax No. | Related party | Relationship | origin | 2011 | 2010 | Currency | deadlines | transaction | |||||||||||
| ThUS$ | ThUS$ | ||||||||||||||||||
| 96.847.880-K | Lufthansa Lan Technical Training S.A. | Associate | Chile | - | 74 | CLP | 30 to 45 Days | Monetary | |||||||||||
| 96.847.880-K | Lufthansa Lan Technical Training S.A. | Associate | Chile | 37 | 110 | US$ | 30 to 45 Days | Monetary | |||||||||||
| 96.921.070-3 | Austral Sociedad Concesionaria S.A. | Associate | Chile | 2 | - | CLP | 30 to 45 Days | Monetary | |||||||||||
| 78.591.370-1 | Bethia S.A. y Filiales | Other related parties | Chile | 202 | - | CLP | 30 to 45 Days | Monetary | |||||||||||
| Foreign | Inversora Aeronaútica Argentina | Other related parties | Argentina | 203 | - | US$ | 30 to 45 Days | Monetary | |||||||||||
| Total current liabilities | 444 | 184 | |||||||||||||||||
Transactions between related parties have been carried out on free-trade conditions between interested and duly-informed parties.
49
NOTE 10 – INVENTORIES
The inventories at September 30, 2011 and December 31, 2010 respectively, are detailed below:
| As of | As of | |||||||
| September 30, | December 31, | |||||||
| 2011 | 2010 | |||||||
| ThUS$ | ThUS$ | |||||||
| Technical stock | 50,489 | 40,625 | ||||||
| Non-technical stock | 15,722 | 12,568 | ||||||
| 66,211 | 53,193 | |||||||
The items included in this heading are spare parts and materials that will be used mainly in consumption in in-flight and maintenance services, which are valued at average cost, net of provision for obsolescence that as of September 30, 2011 amounts to ThUS$ 3,487 (ThUS$ 3,705 as of December 31, 2010). The resulting amounts do not exceed the respective net realizable values.
As of September 30, 2011, the Company recorded ThUS$ 27,496 (ThUS$ 23,961 as of September 30, 2010) within the income statement, mainly due to in-flight consumption and maintenance, which forms part of cost of sales.
50
NOTE 11 – OTHER FINANCIAL ASSETS
The composition of other financial assets is as follows:
| As of | As of | |||||||
| September 30, | December 31, | |||||||
| 2011 | 2010 | |||||||
| ThUS$ | ThUS$ | |||||||
| Current | ||||||||
| a) Other financial assets | 227,584 | 165,712 | ||||||
| b) Hedging asset | 943 | 79,739 | ||||||
| Total Current | 228,527 | 245,451 | ||||||
| Non-current | ||||||||
| a) Other financial assets | 21,876 | 21,165 | ||||||
| b) Hedging assets | - | 422 | ||||||
| Total non-current | 21,876 | 21,587 | ||||||
| a) | Other financial assets |
Other financial assets as of September 30, 2011 and December 31, 2010, respectively, are as follows:
| As of | As of | |||||||
| September 30, | December 31, | |||||||
| 2011 | 2010 | |||||||
| ThUS$ | ThUS$ | |||||||
| Current | ||||||||
| Investment Funds | 59,201 | 58,857 | ||||||
| Domestic and Foreign bonds | 39,289 | 47,184 | ||||||
| Guarantees for margins of derivatives | 86,948 | 39,868 | ||||||
| Financing guarantees | 19,700 | - | ||||||
| Deposits in guarantee (aircraft) | 11,782 | 12,030 | ||||||
| Other guarantees given | 10,664 | 7,773 | ||||||
| Total current | 227,584 | 165,712 | ||||||
| Non-current | ||||||||
| Deposits in guarantee (aircraft) | 15,498 | 15,000 | ||||||
| Other guarantees given | 5,872 | 5,658 | ||||||
| Other investments | 506 | 507 | ||||||
| Total non-current | 21,876 | 21,165 | ||||||
| Total other financial assets | 249,460 | 186,877 | ||||||
51
b) Hedging assets
Hedging assets as of September 30, 2011 and December 31, 2010, are as follows:
| As of | As of | |||||||
| September 30, | December 31, | |||||||
| 2011 | 2010 | |||||||
| ThUS$ | ThUS$ | |||||||
| Current | ||||||||
| Interest accrued since last payment date of currency Swap | - | 3,691 | ||||||
| Cash-flow hedge of currency risk | 122 | 30,234 | ||||||
| Cash-flow hedge of fuel-price risk | 821 | 45,814 | ||||||
| Total current | 943 | 79,739 | ||||||
| Non-current | ||||||||
| Cash-flow hedge of interest-rate risk | - | 422 | ||||||
| Total non-current | - | 422 | ||||||
| Total hedging assets | 943 | 80,161 | ||||||
Foreign currency derivatives include the fair value of Cross Currency Swap contracts.
The types of derivative hedging contracts maintained by the Company at the end of each period are presented in Note 20.
52
NOTE 12 – OTHER NON-FINANCIAL ASSETS
The composition of other non-financial assets is as follows:
| As of | As of | |||||||
| September 30, | December 31, | |||||||
| 2011 | 2010 | |||||||
| ThUS$ | ThUS$ | |||||||
| Current | ||||||||
| a) Advance Payments | 32,123 | 17,648 | ||||||
| b) Other assets | 1,152 | 1,172 | ||||||
| Total current | 33,275 | 18,820 | ||||||
| Non-Current | ||||||||
| a) Advance Payments | - | 3,768 | ||||||
| b) Other assets | 36,337 | 28,740 | ||||||
| Total non-current | 36,337 | 32,508 | ||||||
a) Advance payments
Advance payments as of September 30, 2011 as of December 31, 2010 are as follows:
| As of | As of | |||||||
| September 30, | December 31, | |||||||
| 2011 | 2010 | |||||||
| ThUS$ | ThUS$ | |||||||
| Current | ||||||||
| Aircraft insurance and other | 14,200 | 6,459 | ||||||
| Aircraft leases | 9,626 | 7,343 | ||||||
| Handling and ground handling services | 2,941 | - | ||||||
| Others | 5,356 | 3,846 | ||||||
| Total current | 32,123 | 17,648 | ||||||
| Non-Current | ||||||||
| Handling and ground handling services | - | 2,971 | ||||||
| Others | - | 797 | ||||||
| Total non-current | - | 3,768 | ||||||
| Total advance payments | 32,123 | 21,416 | ||||||
53
| b) | Other assets |
Other assets as of September 30, 2011, and December 31, 2010 are as follows:
| As of | As of | |||||||
| September 30, | December 31, | |||||||
| 2011 | 2010 | |||||||
| ThUS$ | ThUS$ | |||||||
| Current | ||||||||
| Others | 1,152 | 1,172 | ||||||
| Total current | 1,152 | 1,172 | ||||||
| Non-current | ||||||||
| Recoverable taxes | 23,343 | 23,343 | ||||||
| Deferred expense for aircraft rental | 11,914 | 4,984 | ||||||
| Others | 1,080 | 413 | ||||||
| Total non-current | 36,337 | 28,740 | ||||||
| Total other assets | 37,489 | 29,912 | ||||||
54
NOTE 13 – NON-CURRENT ASSETS (OR DISPOSAL GROUPS) CLASSIFIED AS HELD FOR SALE
Non-current assets and disposal groups held for sale as of September 30, 2011, and December 31, 2010 are as follows:
| As of | As of | |||||||
| September 30, | December 31, | |||||||
| 2011 | 2010 | |||||||
| ThUS$ | ThUS$ | |||||||
| Assets | ||||||||
| Engines | 2,204 | 2,204 | ||||||
| Inventories on consignment | 265 | 748 | ||||||
| Aircraft | 1,537 | 1,537 | ||||||
| Scrapped aircraft | 365 | 970 | ||||||
| Rotables | 27 | 38 | ||||||
| Total | 4,398 | 5,497 | ||||||
During the 2011 period, sales were made of inventories held on consignment of the Boeing 737-200 fleet.
During the financial year 2010, sales were made of rotables, inventories held on consignment and three engines, all from the Boeing 737-200 fleet.
Item balances are shown net of provision, which as of September 30, 2011 amounted to ThUS$ 6,022 (ThUS$ 5,212 at December 31, 2010).
The Company has no discontinued operations as of September 30, 2011.
55
NOTE 14 - INVESTMENTS IN SUBSIDIARIES
The Company has investments in companies recognized as investments in subsidiaries. All the companies defined as subsidiaries have been consolidated within the financial statements of Lan Airlines S.A. and Subsidiaries. The consolidation also includes special-purpose entities and investment funds.
The following is a summary of financial information with respect to the sum of the financial statements of subsidiary companies, special-purpose entities and investment funds that have been consolidated:
| As of September 30, 2011 | ||||||||
| Assets | Liabilities | |||||||
| ThUS$ | ThUS$ | |||||||
| Current | 486,292 | 610,899 | ||||||
| Non-current | 1,550,117 | 995,787 | ||||||
| Total | 2,036,409 | 1,606,686 | ||||||
| As of December 31, 2010 | ||||||||
| Assets | Liabilities | |||||||
| ThUS$ | ThUS$ | |||||||
| Current | 442,743 | 565,606 | ||||||
| Non-current | 1,388,194 | 773,927 | ||||||
| Total | 1,830,937 | 1,339,533 | ||||||
| For the nine months ended | For the three months ended | |||||||||||||||
| September 30, | September 30, | |||||||||||||||
| 2011 | 2010 | 2011 | 2010 | |||||||||||||
| ThUS$ | ThUS$ | ThUS$ | ThUS$ | |||||||||||||
| Total operating revenues | 1,914,204 | 1,391,066 | 702,010 | 518,767 | ||||||||||||
| Total expenses | (1,894,556 | ) | (1,331,964 | ) | (679,881 | ) | (481,616 | ) | ||||||||
| Total net income | 19,648 | 59,102 | 22,129 | 37,151 | ||||||||||||
56
Significant subsidiaries detailed as of September 30, 2011
| Nature and scope of | |||||||||
| Country | significant restrictions | ||||||||
| of | Functional | % | on transferring funds | ||||||
| Name of significant subsidiary | incorporation | currency | Ownership | to controller | |||||
| Lan Perú S.A. | Perú | US$ | 70.00000 | Without significant restrictions | |||||
| Lan Cargo S.A. | Chile | US$ | 99.89804 | Without significant restrictions | |||||
| Lan Argentina S.A. | Argentina | ARS | 99.00000 | Without significant restrictions | |||||
| Transporte Aéreo S.A. | Chile | US$ | 100.00000 | Without significant restrictions | |||||
| Aerolane Líneas Aéreas Nacionales del Ecuador S.A. | Ecuador | US$ | 71.91673 | Without significant restrictions | |||||
Summary financial information of significant subsidiaries
| For the nine months | ||||||||||||||||||||||||||||||||
| Statement of financial position as of September 30, 2011 | ended September 30, 2011 | |||||||||||||||||||||||||||||||
| Total | Current | Non-current | Total | Current | Non-current | Net | ||||||||||||||||||||||||||
| Name of significant subsidiary | Assets | Assets | Assets | Liabilities | Liabilities | Liabilities | Revenue | Income | ||||||||||||||||||||||||
| ThUS$ | ThUS$ | ThUS$ | ThUS$ | ThUS$ | ThUS$ | ThUS$ | ThUS$ | |||||||||||||||||||||||||
| Lan Perú S.A. | 146,423 | 133,139 | 13,284 | 139,266 | 138,221 | 1,045 | 670,375 | (2,833 | ) | |||||||||||||||||||||||
| Lan Cargo S.A. | 777,537 | 198,665 | 578,872 | 369,909 | 137,569 | 232,340 | 176,914 | 29,738 | ||||||||||||||||||||||||
| Lan Argentina S.A. | 106,156 | 72,519 | 33,637 | 93,798 | 92,584 | 1,214 | 308,300 | (12,902 | ) | |||||||||||||||||||||||
| Transporte Aéreo S.A. | 339,797 | 228,523 | 111,274 | 118,123 | 27,744 | 90,379 | 267,018 | 15,540 | ||||||||||||||||||||||||
| Aerolane Líneas Aéreas Nacionales del Ecuador S.A. | 56,774 | 30,359 | 26,415 | 56,947 | 48,137 | 8,810 | 204,867 | 3,134 | ||||||||||||||||||||||||
57
Significant subsidiaries detailed as of December 31, 2010
| Nature and scope of | |||||||||
| Country | significant restrictions | ||||||||
| of | Functional | % | on transferring funds | ||||||
| Name of significant subsidiary | incorporation | currency | Ownership | to controller | |||||
| Lan Perú S.A. | Perú | US$ | 70.00000 | Without significant restrictions | |||||
| Lan Cargo S.A. | Chile | US$ | 99.89804 | Without significant restrictions | |||||
| Lan Argentina S.A. | Argentina | ARS | 99.00000 | Without significant restrictions | |||||
| Transporte Aéreo S.A. | Chile | US$ | 100.00000 | Without significant restrictions | |||||
| Aerolane Líneas Aéreas Nacionales del Ecuador S.A. | Ecuador | US$ | 71.91673 | Without significant restrictions | |||||
Summary financial information of significant subsidiaries
| For the nine months | ||||||||||||||||||||||||||||||||
| Statement of financial position as of December 31, 2010 | ended September 30, 2010 | |||||||||||||||||||||||||||||||
| Total | Current | Non-current | Total | Current | Non-current | Net | ||||||||||||||||||||||||||
| Name of significant subsidiary | Assets | Assets | Assets | Liabilities | Liabilities | Liabilities | Revenue | Income | ||||||||||||||||||||||||
| ThUS$ | ThUS$ | ThUS$ | ThUS$ | ThUS$ | ThUS$ | ThUS$ | ThUS$ | |||||||||||||||||||||||||
| Lan Perú S.A. | 124,761 | 113,579 | 11,182 | 114,771 | 113,750 | 1,021 | 548,120 | 559 | ||||||||||||||||||||||||
| Lan Cargo S.A. | 737,550 | 183,877 | 553,673 | 340,082 | 103,018 | 237,064 | 141,890 | 22,014 | ||||||||||||||||||||||||
| Lan Argentina S.A. | 113,168 | 84,751 | 28,417 | 88,286 | 87,420 | 866 | 271,578 | (4,933 | ) | |||||||||||||||||||||||
| Transporte Aéreo S.A. | 329,190 | 215,575 | 113,615 | 123,056 | 28,777 | 94,279 | 208,132 | 20,982 | ||||||||||||||||||||||||
| Aerolane Líneas Aéreas Nacionales del Ecuador S.A. | 48,416 | 24,561 | 23,855 | 51,723 | 38,299 | 13,424 | 174,816 | 2,543 | ||||||||||||||||||||||||
58
NOTE 15 - EQUITY ACCOUNTED INVESTMENTS
The following summarized financial information is the sum of the financial statements of the investees, corresponding to the statements of financial position as of September 30, 2011 and December 31, 2010, and the statements of income for the period ended September 30, 2011, and the period ended September 30, 2010:
| As of September 30, 2011 | ||||||||
| Assets | Liabilities | |||||||
| ThUS$ | ThUS$ | |||||||
| Current | 2,440 | 1,018 | ||||||
| Non-current | 319 | 122 | ||||||
| Total | 2,759 | 1,140 | ||||||
| As of December 31, 2010 | ||||||||
| Assets | Liabilities | |||||||
| ThUS$ | ThUS$ | |||||||
| Current | 1,865 | 301 | ||||||
| Non-current | 382 | 562 | ||||||
| Total | 2,247 | 863 | ||||||
| For the nine months ended | For the three months ended | |||||||||||||||
| September 30, | September 30, | |||||||||||||||
| 2011 | 2010 | 2011 | 2010 | |||||||||||||
| ThUS$ | ThUS$ | ThUS$ | ThUS$ | |||||||||||||
| Total operating revenues | 2,147 | 2,131 | 1,439 | 809 | ||||||||||||
| Total expenses | (1,793 | ) | (1,631 | ) | (989 | ) | (666 | ) | ||||||||
| Sum of net income | 354 | 500 | 450 | 143 | ||||||||||||
The Company has shown, as an investment in associates, its holdings in the following companies: Austral Sociedad Concesionaria S.A., Lufthansa Lan Technical Training S.A. and Concesionaria Chucumata S.A. The Company made no investments in associates during the period January to September 2011.
59
| Percentage of ownership | Cost of invest ment | |||||||||||||||||||
| As of | As of | As of | As of | |||||||||||||||||
| Country of | Functional | September 30, | December 31, | September 30, | December 31, | |||||||||||||||
| Company | incorporation | currency | 2011 | 2010 | 2011 | 2010 | ||||||||||||||
| % | % | ThUS$ | ThUS$ | |||||||||||||||||
Austral Sociedad Concesionaria S.A. | Chile | CLP | 20.00 | 20.00 | 661 | 661 | ||||||||||||||
Lufthansa Lan Technical Training S.A. | Chile | CLP | 50.00 | 50.00 | 702 | 702 | ||||||||||||||
| Concesionaria Chucumata S.A. (*) | Chile | CLP | - | 16.70 | - | 119 | ||||||||||||||
(*) In the extraordinary session of the Board on September 22, 2011, the Board proceeded the dissolution of the company Concesionaria Chucumata S.A.
These companies do not have significant restrictions on the ability to transfer funds.
The movement of investments in associates between January 01, 2010 and September 30, 2011 is as follows:
| ThUS$ | ||||
| Opening balance as of January 01, 2010 | 1,236 | |||
| Equity accounted earnings | 153 | |||
| Dividends received | (110 | ) | ||
| Total changes in investments in associated entities | 43 | |||
| Closing balance as of September 30, 2010 | 1,279 | |||
| Opening balance as of October 01, 2010 | 1,279 | |||
| Equity accounted earnings | (21 | ) | ||
| Other reductions, investments in associated entities | (665 | ) | ||
| Total changes in investments in associated entities | (686 | ) | ||
| Closing balance as of December 31, 2010 | 593 | |||
| Opening balance as of January 01, 2011 | 593 | |||
| Equity accounted earnings | 604 | |||
| Dividends received | (79 | ) | ||
| Total changes in investments in associated entities | 525 | |||
| Closing balance as of September 30, 2011 | 1,118 | |||
The Company records the gain or loss on its investments in associates on a monthly basis in the consolidated statement of income, using the equity method. The Company has no investments in associates which are not accounted for using the equity method.
60
NOTE 16 - INTANGIBLE ASSETS OTHER THAN GOODWILL
The details of intangible assets are as follows:
| Classes of intangible assets (net) | As of | As of | ||||||
| September 30, | December 31, | |||||||
| 2011 | 2010 | |||||||
| ThUS$ | ThUS$ | |||||||
| Computer software | 58,819 | 45,183 | ||||||
| Other assets | 444 | 566 | ||||||
| Total | 59,263 | 45,749 | ||||||
| Classes of intangible assets (gross) | As of | As of | ||||||
| September 30, | December 31, | |||||||
| 2011 | 2010 | |||||||
| ThUS$ | ThUS$ | |||||||
| Computer software | 104,628 | 83,875 | ||||||
| Other assets | 808 | 808 | ||||||
| Total | 105,436 | 84,683 | ||||||
61
The movement in software and other assets between January 01, 2010 and September 30, 2011 is as follows:
| Other | ||||||||||||
| Software | assets | |||||||||||
| Net | Net | Total | ||||||||||
| ThUS$ | ThUS$ | ThUS$ | ||||||||||
| Opening balance as of January 01, 2010 | 34,087 | 727 | 34,814 | |||||||||
| Additions | 11,760 | - | 11,760 | |||||||||
| Withdrawals | (779 | ) | - | (779 | ) | |||||||
| Amortization | (6,820 | ) | (121 | ) | (6,941 | ) | ||||||
| Balance as of September 30, 2010 | 38,248 | 606 | 38,854 | |||||||||
| Opening balance as of October 01, 2010 | 38,248 | 606 | 38,854 | |||||||||
| Additions | 9,155 | - | 9,155 | |||||||||
| Additions by business combination | 154 | - | 154 | |||||||||
| Amortization | (2,374 | ) | (40 | ) | (2,414 | ) | ||||||
| Balance as of December 31, 2010 | 45,183 | 566 | 45,749 | |||||||||
| Opening balance as of January 01, 2011 | 45,183 | 566 | 45,749 | |||||||||
| Additions | 20,886 | - | 20,886 | |||||||||
| Withdrawals | (133 | ) | - | (133 | ) | |||||||
| Amortization | (7,117 | ) | (122 | ) | (7,239 | ) | ||||||
| Balance as of September 30, 2011 | 58,819 | 444 | 59,263 | |||||||||
Intangible assets with defined useful lives consist primarily of licensing and computer software, for which the Company has established useful lives of between 4 and 7 years.
The Company shows its intangible assets at cost, except for acquisitions by business combination, which are at fair value; and amortization is made on a straight-line basis over their estimated useful lives.
The amortization of each period is shown in the consolidated statement of income in administrative expenses. The accumulated amortization of computer programs as of September 30, 2011 amounts to ThUS$ 45,809 (ThUS$ 38,692 as of December 31, 2010). The accumulated amortization of other identifiable intangible assets as of September 30, 2011 amounts to ThUS$ 364 (ThUS$ 242 as of December 31, 2010).
62
NOTE 17 – GOODWILL
The goodwill represents the excess of cost of acquisition over the fair value of the participation of the Company in the identifiable net assets of the subsidiary at the acquisition date. Goodwill at September 30, 2011 amounted to ThUS$ 164,721 (ThUS$ 157,994 at December 31, 2010)
At December 31, 2010, the Company performed an impairment test based on the value in use and no impairment was identified. The testing is done at least once per year.
The value in use of those cash generating units to which goodwill has been assigned has been determined assuming that yields, occupation factors and fleet capacity are maintained at current obtainable levels. The Company projects cash flows for the initial periods based on internal budgets and extrapolates the final value of these periods based on a growth factor consistent with the long-term economic projections in the markets in which the units operate. The determined cash flows are discounted at a rate which takes into account the time value of money and risks related to those cash generating units which have not been taken into account in estimation of the units’ future cash flows.
The movement of goodwill from January 01, 2010 to September 30, 2011, is as follows:
| ThUS$ | ||||
| Opening balance as of January 01, 2010 | 63,793 | |||
| Decrease due to exchange rate differences | (24 | ) | ||
| Closing balance as of September 30, 2010 | 63,769 | |||
| Opening balance as of October 01, 2010 | 63,769 | |||
| Additions (1) | 94,224 | |||
| Increase due to exchange rate differences | 1 | |||
| Closing balance as of December 31, 2010 | 157,994 | |||
| Opening balance as of January 01, 2011 | 157,994 | |||
| Additions (2) | 6,736 | |||
| Amendment initial recognition (3) | (607 | ) | ||
| Increase due to exchange rate differences | 598 | |||
| Closing balance as of September 30, 2011 | 164,721 | |||
(1) Corresponds to the goodwill generated by the purchase of Aerovías de Integración Regional, AIRES S.A. (see Note 39).
(2) Corresponds to the goodwill generated by the purchase of Aeroasis S.A. (see Note 39).
(3) Correspond to change of initial recognition goodwill generated by the purchase of the company Aerovías de Integración Regional, AIRES S.A.
63
NOTE 18 - PROPERTY, PLANT AND EQUIPMENT
The composition by category of property, plant and equipment is as follows:
| Gross Book Value | Acumulated depreciation | Net Book Value | ||||||||||||||||||||||
| As of | As of | As of | As of | As of | As of | |||||||||||||||||||
| September 30, | December 31, | September 30, | December 31, | September 30, | December 31, | |||||||||||||||||||
| 2011 | 2010 | 2011 | 2010 | 2011 | 2010 | |||||||||||||||||||
| ThUS$ | ThUS$ | ThUS$ | ThUS$ | ThUS$ | ThUS$ | |||||||||||||||||||
| Construction in progress | 1,095,743 | 715,603 | - | - | 1,095,743 | 715,603 | ||||||||||||||||||
| Land | 35,633 | 35,538 | - | - | 35,633 | 35,538 | ||||||||||||||||||
| Buildings | 103,827 | 101,181 | (22,901 | ) | (21,060 | ) | 80,926 | 80,121 | ||||||||||||||||
| Plant and equipment | 4,798,869 | 4,816,723 | (1,138,720 | ) | (1,153,587 | ) | 3,660,149 | 3,663,136 | ||||||||||||||||
| Information technology equipment | 87,762 | 83,711 | (65,857 | ) | (65,112 | ) | 21,905 | 18,599 | ||||||||||||||||
| Fixed installations and accessories | 57,619 | 52,954 | (28,623 | ) | (25,951 | ) | 28,996 | 27,003 | ||||||||||||||||
| Motor vehicles | 3,605 | 3,269 | (2,049 | ) | (1,979 | ) | 1,556 | 1,290 | ||||||||||||||||
| Leasehold improvements | 94,041 | 87,168 | (57,836 | ) | (43,048 | ) | 36,205 | 44,120 | ||||||||||||||||
| Other property, plants and equipment | 933,045 | 646,236 | (380,902 | ) | (283,216 | ) | 552,143 | 363,020 | ||||||||||||||||
| Total | 7,210,144 | 6,542,383 | (1,696,888 | ) | (1,593,953 | ) | 5,513,256 | 4,948,430 | ||||||||||||||||
64
The movement in the different categories of property, plant and equipment from January 01, 2010 to September 30, 2011 is shown below:
| a) As of September 30, 2010 | Other | |||||||||||||||||||||||||||||||||||||
| Information | Fixed | property, | Property, | |||||||||||||||||||||||||||||||||||
| Plant and | technology | installations | Motor | Leasehold | plant and | Plant and | ||||||||||||||||||||||||||||||||
| Construction | Buildings | equipment | equipment | & accessories | vehicles | improvements | equipment | equipment | ||||||||||||||||||||||||||||||
| in progress | Land | Net | Net | Net | Net | Net | Net | Net | Net | |||||||||||||||||||||||||||||
| ThUS$ | ThUS$ | ThUS$ | ThUS$ | ThUS$ | ThUS$ | ThUS$ | ThUS$ | ThUS$ | ThUS$ | |||||||||||||||||||||||||||||
| Opening balance as of January 01, 2010 | 264,259 | 35,538 | 81,966 | 3,231,682 | 15,043 | 23,659 | 951 | 50,286 | 493,172 | 4,196,556 | ||||||||||||||||||||||||||||
| Additions | 9,096 | - | 20 | 313,087 | 4,453 | 1,581 | 285 | 1,160 | 3,994 | 333,676 | ||||||||||||||||||||||||||||
| Disposals | - | - | - | (190 | ) | - | - | (7 | ) | - | - | (197 | ) | |||||||||||||||||||||||||
| Transfers to (from) non-current | ||||||||||||||||||||||||||||||||||||||
| assets (or disposal groups) | ||||||||||||||||||||||||||||||||||||||
| classified as Held for Sale | - | - | - | 2,552 | - | - | - | - | - | 2,552 | ||||||||||||||||||||||||||||
| Retirements | - | - | - | (3,325 | ) | (21 | ) | - | (3 | ) | - | (2,448 | ) | (5,797 | ) | |||||||||||||||||||||||
| Depreciation | - | - | (1,726 | ) | (163,596 | ) | (3,922 | ) | (2,970 | ) | (141 | ) | (12,268 | ) | (29,983 | ) | (214,606 | ) | ||||||||||||||||||||
| Increases (decreases) due to | ||||||||||||||||||||||||||||||||||||||
| exchanges differences | (7 | ) | - | - | (804 | ) | (18 | ) | (1 | ) | (4 | ) | - | (27 | ) | (861 | ) | |||||||||||||||||||||
| Other increases (decreases) | 305,500 | - | (654 | ) | 98,064 | (344 | ) | 4,701 | 6 | 5,745 | (101,216 | ) | 311,802 | |||||||||||||||||||||||||
| Changes, total | 314,589 | - | (2,360 | ) | 245,788 | 148 | 3,311 | 136 | (5,363 | ) | (129,680 | ) | 426,569 | |||||||||||||||||||||||||
| Closing balance as of September 30, 2010 | 578,848 | 35,538 | 79,606 | 3,477,470 | 15,191 | 26,970 | 1,087 | 44,923 | 363,492 | 4,623,125 | ||||||||||||||||||||||||||||
65
b) As of December 31, 2010 | Other | |||||||||||||||||||||||||||||||||||||||
| Information | Fixed | property, | Property, | |||||||||||||||||||||||||||||||||||||
| Plant and | technology | installations | Motor | Leasehold | plant and | Plant and | ||||||||||||||||||||||||||||||||||
| Construction | Buildings | equipment | equipment | & accessories | vehicles | improvements | equipment | equipment | ||||||||||||||||||||||||||||||||
| in progress | Land | Net | Net | Net | Net | Net | Net | Net | Net | |||||||||||||||||||||||||||||||
| ThUS$ | ThUS$ | ThUS$ | ThUS$ | ThUS$ | ThUS$ | ThUS$ | ThUS$ | ThUS$ | ThUS$ | |||||||||||||||||||||||||||||||
| Opening balance as of October 01, 2010 | 578,848 | 35,538 | 79,606 | 3,477,470 | 15,191 | 26,970 | 1,087 | 44,923 | 363,492 | 4,623,125 | ||||||||||||||||||||||||||||||
| Additions | 1,133 | - | 95 | 258,335 | 5,063 | 760 | 135 | 1,250 | 2,679 | 269,450 | ||||||||||||||||||||||||||||||
| Acquisitions through business combination | - | - | 1,006 | 490 | 137 | 335 | 107 | - | 480 | 2,555 | ||||||||||||||||||||||||||||||
| Disposals | - | - | - | - | - | - | - | - | (2 | ) | (2 | ) | ||||||||||||||||||||||||||||
| Retirements | - | - | - | (3,308 | ) | (515 | ) | (2 | ) | (9 | ) | - | (102 | ) | (3,936 | ) | ||||||||||||||||||||||||
| Depreciation | - | - | (589 | ) | (72,204 | ) | (1,295 | ) | (1,027 | ) | (31 | ) | (4,529 | ) | (2,332 | ) | (82,007 | ) | ||||||||||||||||||||||
Increases (decreases) due to exchanges differences | (55 | ) | - | - | (53 | ) | 34 | (12 | ) | 1 | - | - | (85 | ) | ||||||||||||||||||||||||||
| Other increases (decreases) | 135,677 | - | 3 | 2,406 | (16 | ) | (21 | ) | - | 2,476 | (1,195 | ) | 139,330 | |||||||||||||||||||||||||||
| Changes, total | 136,755 | - | 515 | 185,666 | 3,408 | 33 | 203 | (803 | ) | (472 | ) | 325,305 | ||||||||||||||||||||||||||||
| Closing balance as of December 31, 2010 | 715,603 | 35,538 | 80,121 | 3,663,136 | 18,599 | 27,003 | 1,290 | 44,120 | 363,020 | 4,948,430 | ||||||||||||||||||||||||||||||
| c) As of September 30, 2011 | Other | |||||||||||||||||||||||||||||||||||||||
| Information | Fixed | property, | Property, | |||||||||||||||||||||||||||||||||||||
| Plant and | technology | installations | Motor | Leasehold | plant and | Plant and | ||||||||||||||||||||||||||||||||||
| Construction | Buildings | equipment | equipment | & accessories | vehicles | improvements | equipment | equipment | ||||||||||||||||||||||||||||||||
| in progress | Land | Net | Net | Net | Net | Net | Net | Net | Net | |||||||||||||||||||||||||||||||
| ThUS$ | ThUS$ | ThUS$ | ThUS$ | ThUS$ | ThUS$ | ThUS$ | ThUS$ | ThUS$ | ThUS$ | |||||||||||||||||||||||||||||||
| Opening balance as of January 01, 2011 | 715,603 | 35,538 | 80,121 | 3,663,136 | 18,599 | 27,003 | 1,290 | 44,120 | 363,020 | 4,948,430 | ||||||||||||||||||||||||||||||
| Additions | 19,912 | - | 1,288 | 492,964 | 9,340 | 1,678 | 394 | 6,111 | 16,492 | 548,179 | ||||||||||||||||||||||||||||||
| Acquisitions through business combination | - | - | - | - | - | - | - | - | 16 | 16 | ||||||||||||||||||||||||||||||
| Disposals | - | - | - | (106,505 | ) | - | - | - | - | - | (106,505 | ) | ||||||||||||||||||||||||||||
T ransfers to (from) non-current assets (or disposal groups) classified as Held for Sale | (127 | ) | - | - | (112 | ) | (1,195 | ) | (588 | ) | (1 | ) | - | (115 | ) | (2,138 | ) | |||||||||||||||||||||||
| Retirements | - | - | (4 | ) | (1,564 | ) | (83 | ) | (13 | ) | (12 | ) | - | (285 | ) | (1,961 | ) | |||||||||||||||||||||||
| Depreciation | - | - | (1,844 | ) | (184,489 | ) | (4,758 | ) | (3,195 | ) | (160 | ) | (14,788 | ) | (30,211 | ) | (239,445 | ) | ||||||||||||||||||||||
| Increases (decreases) due to | ||||||||||||||||||||||||||||||||||||||||
| exchanges differences | (491 | ) | - | (95 | ) | (579 | ) | (29 | ) | (223 | ) | 18 | - | (95 | ) | (1,494 | ) | |||||||||||||||||||||||
| Other increases (decreases) | 360,846 | 95 | 1,460 | (202,702 | ) | 31 | 4,334 | 27 | 762 | 203,321 | 368,174 | |||||||||||||||||||||||||||||
| Changes, total | 380,140 | 95 | 805 | (2,987 | ) | 3,306 | 1,993 | 266 | (7,915 | ) | 189,123 | 564,826 | ||||||||||||||||||||||||||||
| Closing balance as of September 30, 2011 | 1,095,743 | 35,633 | 80,926 | 3,660,149 | 21,905 | 28,996 | 1,556 | 36,205 | 552,143 | 5,513,256 | ||||||||||||||||||||||||||||||
66
| d) | Composition of the fleet |
Aircraft included in the Company´s property, plant and equipment:
| As of | As of | ||||||||||
| Aircraft | Model | September 30, | December 31, | ||||||||
| 2011 | 2010 | ||||||||||
| Boeing 767 | 300ER | 19 | 18 | ||||||||
| Boeing 767 | 300F | 8 | 8 | ||||||||
| Boeing 767 | 200ER (1) | 1 | 1 | ||||||||
| Airbus A318 | 100 | 10 | 15 | ||||||||
| Airbus A319 | 100 | 23 | 20 | ||||||||
| Airbus A320 | 200 | 28 | 24 | ||||||||
| Airbus A340 | 300 | 4 | 4 | ||||||||
| Total | 93 | 90 | |||||||||
(1) Leased to Aerovías de México S.A.
Operating leases:
| As of | As of | ||||||||||
| Aircraft | Model | September 30, | December 31, | ||||||||
| 2011 | 2010 | ||||||||||
| Boeing 767 | 300ER | 10 | 10 | ||||||||
| Boeing 767 | 300F | 4 | 3 | ||||||||
| Boeing 777 | Freighter | 2 | 2 | ||||||||
| Airbus A320 | 200 | 9 | 5 | ||||||||
| Airbus A340 | 300 | 1 | 1 | ||||||||
| Boeing 737 | 700 | 9 | 9 | ||||||||
| Bombardier | Dhc8-200 | 10 | 11 | ||||||||
| Bombardier | Dhc8-400 | 4 | 4 | ||||||||
| Total | 49 | 45 | |||||||||
| Total fleet | 142 | 135 | |||||||||
67
| e) | Method used for the depreciation of property, plant and equipment: |
| Method | Useful life | ||||||||
| minimum | maximum | ||||||||
| Buildings | Straight line without residual value | 20 | 50 | ||||||
| Plant and equipment | Straight line with residual value of 20% in the | ||||||||
| short-haul fleet and 36% in the long-haul fleet (*) | 5 | 20 | |||||||
Information technology Equipment | Straight line without residual value | 5 | 10 | ||||||
| Fixed installations and accessories | Straight line without residual value | 10 | 10 | ||||||
| Motor vehicle | Straight line without residual value | 10 | 10 | ||||||
| Leasehold improvements | Straight line without residual value | 5 | 5 | ||||||
| Other property, plant | |||||||||
| and equipment | Straight line with residual value of 20% in the | 3 | 20 | ||||||
| short-haul fleet and 36% in the long-haul fleet (*) | |||||||||
(*) Except for certain technical components, which are depreciated on the basis of cycles and flight hours.
The depreciation charged to income in the period, which is included in the consolidated statement of income, amounts to ThUS$ 239,445 (ThUS$ 214,606 for the period ended September 30, 2010). Depreciation charges for the year are recognized in Cost of Sales and Administrative Expenses in the consolidated statement of income.
f) Additional information regarding property, plant and equipment:
| i) | Property, plant and equipment pledged as guarantee: |
In the period ended September 30, 2011 direct guarantees were added for eight aircraft, four of them corresponding to the Airbus A320-200 fleet, three to the Airbus A319-100 fleet and one to Boeing B767-300 fleet. Moreover, in the second quarter of 2011 The Company sold three aircraft Airbus A318-100 fleet and in the third quarter two more of the same aircraft A318-100 fleet. Additionally, during the first quarter 2011, the Company sold its participation in the permanent establishments Cernicalo Leasing LLC and Petrel Leasing LLC. Therefore the Company eliminated direct guarantees associated with five aircraft Airbus A318-100 and three aircraft Boeing 767-300 (two freighter and one passenger aircrafts).
68
Description of property, plant and equipment pledged as guarantee:
| As of | As of | |||||||||||||||||||
| September 30, 2011 | December 31,2010 | |||||||||||||||||||
| Creditor of | Assets | Existing | Book | Existing | Book | |||||||||||||||
| guarantee | committed | Fleet | Debt | Value | Debt | Value | ||||||||||||||
| ThUS$ | ThUS$ | ThUS$ | ThUS$ | |||||||||||||||||
| Wilmington | Aircraft and | Boeing 767 | 903,108 | 1,139,157 | 1,043,290 | 1,304,699 | ||||||||||||||
| Trust Company | engines | Boeing 777 | 14,847 | 25,357 | 18,088 | 25,915 | ||||||||||||||
| BNP Paribas | Aircraft and | Airbus A318 | 192,077 | 242,408 | 299,422 | 359,944 | ||||||||||||||
| engines | Airbus A319 | 367,164 | 486,362 | 297,320 | 370,476 | |||||||||||||||
| Airbus A320 | 522,671 | 638,718 | 407,275 | 478,082 | ||||||||||||||||
| Credite Agricole (*) | Aircraft and | Airbus A319 | 97,039 | 170,510 | 108,803 | 178,342 | ||||||||||||||
| engines | Airbus A320 | 40,607 | 164,234 | 58,236 | 172,426 | |||||||||||||||
| Airbus A340 | 63,443 | 221,485 | 89,378 | 234,892 | ||||||||||||||||
| Total direct guarantee | 2,200,956 | 3,088,231 | 2,321,812 | 3,124,776 | ||||||||||||||||
(*) Calyon creditor of guarantee renamed Credite Agricole.
The amounts of existing debt are presented at nominal value. Book value corresponds to the carrying value of the goods provided as guarantees.
Additionally, there are indirect guarantees related to assets recorded in property, plant and equipment whose total debt at September 30, 2011 amounted to ThUS $ 333,791 (ThUS $ 227,218 at December 31, 2010). The book value of assets with indirect guarantees as of September 30, 2011 amounts to ThUS$ 511,618 (ThUS $ 328,838 as of December 31, 2010).
| ii) | Commitments and others |
Fully depreciated assets and commitments for future purchases are as follows:
| As of | As of | |||||||
| September 30, | December 31, | |||||||
| 2011 | 2010 | |||||||
| ThUS$ | ThUS$ | |||||||
Gross book value of fully depreciated property, plant and equipment still in use (1) | 59,649 | 57,612 | ||||||
| Commitments for the acquisition of aircraft | 15,000,000 | 12,350,000 | ||||||
(1) The amounts shown relate primarily to land support equipment, computer equipment and tools.
69
In December 2009, the Company signed a purchase commitment with Airbus for the purchase of 30 aircraft of the A320 family with deliveries between 2011 and 2016. Later, in December 2010 the Company made another commitment to the manufacturer for the purchase of 50 A320 family aircraft with deliveries between 2012 and 2016. Additionally, in June 2011, the Company signed a contract for 20 additional aircraft of the A320 NEO family.
With the above, as of September 30, 2011, and as a result of different aircraft purchase contracts signed with Airbus S.A.S., there remain 96 Airbus aircraft of the A320 family to be delivered between 2011 and 2018. The approximate amount is ThUS$ 7,500,000, according to the manufacturer’s price list.
Otherwise, purchase contracts were signed with The Boeing Company in February and May 2011 for three and five B767-300 aircraft, respectively. As of September 30, 2011 and a result of different aircraft contracts signed with The Boeing Company, 13 B767-300 aircraft remain to be delivered between 2011 and 2013, 2 B77-Freighter aircraft for delivery in 2012 and 26 B787 Dreamliner aircraft with delivery dates from 2012. The approximate amount is ThUS$ 7,500,000, according to the manufacturer’s price list. In addition, the Company has purchase options over 1 B777- Freighter aircraft and 15 B787 Dreamliner aircraft.
The acquisition of the aircraft is part of the strategic plan for long haul fleet. This plan also means the sale of 15 aircraft model Airbus A318 between 2011 and 2013. It is estimated that this sale will have no significant impact on results. During the third quarter of 2011 the Company sold the last 2 aircraft planned to be sold during 2011, thus completing the planned sale of 5 aircraft this year.
| iii) | Capitalized interest costs with respect to property, plant and equipment. |
| For the periods ended | |||||||||
| September 30, | |||||||||
| 2011 | 2010 | ||||||||
| Average rate of capitalization of capitalized interest cost | % | 3.62 | 4.13 | ||||||
| Costs of capitalized interest | ThUS$ | 27,109 | 11,827 | ||||||
70
| iv) | Financial leases |
The detail of the main financial leases is as follows:
| As of | As of | ||||||||
| September 30, | December 31, | ||||||||
| Lessor | Aircraft | 2011 | 2010 | ||||||
| Bluebird Leasing LLC | Boeing 767 | 2 | 2 | ||||||
| Eagle Leasing LLC | Boeing 767 | 2 | 2 | ||||||
| Seagull Leasing LLC | Boeing 767 | 1 | 1 | ||||||
| Cernicalo Leasing LLC | Boeing 767 | 2 | - | ||||||
| Petrel Leasing LLC | Boeing 767 | 1 | - | ||||||
| Linnet Leasing Limited | Airbus A320 | 4 | 4 | ||||||
| Total | 12 | 9 | |||||||
Leasing contracts where the parent Company acts as the lessee of aircrafts set a duration of 12 years and quarterly payments of obligations.
Additionally, the lessee will have the obligations to contract and maintain active the insurance coverage for the aircraft, perform maintenance on the aircraft and update the airworthiness certificates at their own cost.
Fixed assets acquired under financial leases are classified as Other fixed assets in Property, plant and equipment. As of September 30, 2011, the Company had twelve aircraft and one spare engine recorded as financial leases (9 aircraft and 1 spare engine as of December 31, 2010).
In the period ended September 30, 2011, due to the sale of its participation in the permanent establishments Cernicalo Leasing LLC and Petrel Leasing LLC, the Company increased its number of aircraft on lease by three Boeing 767-300 (two freighter and one aircrafts). Therefore, these aircraft were reclassified from the Plant and equipment category to the category Other property plant and equipment.
The book value of assets under financial leases as of September 30, 2011 amounts to ThUS$ 511,618
(ThUS$ 328,838 as of December 31, 2010).
71
The minimum payments under financial leases are as follows:
As of September 30, 2011
| Gross | Present | |||||||||||
| Value | Interest | Value | ||||||||||
| ThUS$ | ThUS$ | ThUS$ | ||||||||||
| No later than one year | 82,943 | (7,737 | ) | 75,206 | ||||||||
| Between one and five years | 210,708 | (19,051 | ) | 191,657 | ||||||||
| Over five years | 68,792 | (2,303 | ) | 66,489 | ||||||||
| Total | 362,443 | (29,091 | ) | 333,352 | ||||||||
As of December 31, 2010
| Gross | Present | |||||||||||
| Value | Interest | Value | ||||||||||
| ThUS$ | ThUS$ | ThUS$ | ||||||||||
| No later than one year | 57,976 | (3,679 | ) | 54,297 | ||||||||
| Between one and five years | 127,370 | (7,421 | ) | 119,949 | ||||||||
| Over five years | 55,106 | (1,781 | ) | 53,325 | ||||||||
| Total | 240,452 | (12,881 | ) | 227,571 | ||||||||
72
NOTE 19 – INCOME TAXES
Deferred tax assets and liabilities are offset if there is a legal right to offset assets and liabilities for income taxes relating to the same tax authority. The balances of deferred taxes are as follows:
| Assets | Liabilities | |||||||||||||||
| As of | As of | As of | As of | |||||||||||||
| Concept | September 30, | December 31, | September 30, | December 31, | ||||||||||||
| 2011 | 2010 | 2011 | 2010 | |||||||||||||
| ThUS$ | ThUS$ | ThUS$ | ThUS$ | |||||||||||||
| Depreciation | (458 | ) | (415 | ) | 322,541 | 290,254 | ||||||||||
| Amortization | 14,202 | 12,286 | 35,578 | 29,606 | ||||||||||||
| Provisions | 7,147 | 8,128 | 43,810 | 23,017 | ||||||||||||
| Post-employment benefit obligations | 876 | 622 | (925 | ) | (982 | ) | ||||||||||
Revaluation of financial instruments | - | - | (41,631 | ) | (21,926 | ) | ||||||||||
| Tax losses | 35,163 | 13,229 | - | - | ||||||||||||
| Others | 1,540 | 4,234 | (16,003 | ) | (7,957 | ) | ||||||||||
| Total | 58,470 | 38,084 | 343,370 | 312,012 | ||||||||||||
73
Movements of deferred tax assets and liabilities from January 01, 2010 to September 30, 2011 are as follows:
| a) From January 01 to September 30, 2010 |
| Beginning | Recognized in | Recognized in | Incorporation by | Ending | ||||||||||||||||||||
| balance | consolidated | comprehensive | business | balance | ||||||||||||||||||||
| asset (liability) | income | income | combinations | Others | asset (liability) | |||||||||||||||||||
| ThUS$ | ThUS$ | ThUS$ | ThUS$ | ThUS$ | ThUS$ | |||||||||||||||||||
| Depreciation | (222,188 | ) | (45,731 | ) | - | - | - | (267,919 | ) | |||||||||||||||
| Amortization | (22,453 | ) | (4,318 | ) | - | - | - | (26,771 | ) | |||||||||||||||
| Provisions | (2,102 | ) | (28,272 | ) | - | - | - | (30,374 | ) | |||||||||||||||
| Post-employment benefit obligations | 1,183 | (476 | ) | - | - | - | 707 | |||||||||||||||||
| Revaluation of financial | 18,891 | - | 13,085 | - | - | 31,976 | ||||||||||||||||||
| Tax losses | 5,013 | 2,655 | - | - | 7,668 | |||||||||||||||||||
| Others | (8,311 | ) | 28,037 | 26 | - | 474 | 20,226 | |||||||||||||||||
| Total | (229,967 | ) | (48,105 | ) | 13,111 | - | 474 | (264,487 | ) | |||||||||||||||
| b) From October 01 to December 31, 2010 |
| Beginning | Recognized in | Recognized in | Incorporation by | Ending | ||||||||||||||||||||
| balance | consolidated | comprehensive | business | balance | ||||||||||||||||||||
| asset (liability) | income | income | combinations | Others | asset (liability) | |||||||||||||||||||
| ThUS$ | ThUS$ | ThUS$ | ThUS$ | ThUS$ | ThUS$ | |||||||||||||||||||
| Depreciation | (267,919 | ) | (22,750 | ) | - | - | - | (290,669 | ) | |||||||||||||||
| Amortization | (26,771 | ) | (1,630 | ) | - | 11,081 | - | (17,320 | ) | |||||||||||||||
| Provisions | (30,374 | ) | 10,304 | - | 5,181 | - | (14,889 | ) | ||||||||||||||||
| Post-employment benefit obligations | 707 | 280 | - | 617 | - | 1,604 | ||||||||||||||||||
| Revaluation of financial | 31,976 | - | (10,050 | ) | - | - | 21,926 | |||||||||||||||||
| Tax losses | 7,668 | (3,958 | ) | - | 9,519 | - | 13,229 | |||||||||||||||||
| Others | 20,226 | (11,392 | ) | (146 | ) | 2,545 | 958 | 12,191 | ||||||||||||||||
| Total | (264,487 | ) | (29,146 | ) | (10,196 | ) | 28,943 | 958 | (273,928 | ) | ||||||||||||||
74
| c) From January 01 to September 30, 2011 |
| Beginning | Recognized in | Recognized in | Incorporation by | Ending | ||||||||||||||||||||||||||||
| balance | consolidated | comprehensive | business | Assets | balance | |||||||||||||||||||||||||||
| asset (liability) | income | income | combinations | Reclassification | Others | for sale | asset (liability) | |||||||||||||||||||||||||
| ThUS$ | ThUS$ | ThUS$ | ThUS$ | ThUS$ | ThUS$ | ThUS$ | ||||||||||||||||||||||||||
| Depreciation | (290,669 | ) | (32,325 | ) | - | - | - | - | (5 | ) | (322,999 | ) | ||||||||||||||||||||
| Amortization | (17,320 | ) | (7,642 | ) | - | 3,586 | - | - | - | (21,376 | ) | |||||||||||||||||||||
| Provisions | (14,889 | ) | (21,386 | ) | - | - | - | - | (388 | ) | (36,663 | ) | ||||||||||||||||||||
| Post-employment benefit obligations | 1,604 | 197 | - | - | - | - | - | 1,801 | ||||||||||||||||||||||||
| Revaluation of financial | 21,926 | - | 19,705 | - | - | - | - | 41,631 | ||||||||||||||||||||||||
| Tax losses | 13,229 | 28,579 | - | - | (6,645 | ) | - | - | 35,163 | |||||||||||||||||||||||
| Others | 12,191 | 5,518 | 1,615 | - | - | (1,714 | ) | (67 | ) | 17,543 | ||||||||||||||||||||||
| Total | (273,928 | ) | (27,059 | ) | 21,320 | 3,586 | (6,645 | ) | (1,714 | ) | (460 | ) | (284,900 | ) | ||||||||||||||||||
75
| Deferred tax assets not recognized: | As of | As of | ||||||
| September 30, | December 31, | |||||||
| 2011 | 2010 | |||||||
| ThUS$ | ThUS$ | |||||||
| Temporary differences | 2,152 | 2,152 | ||||||
| Tax losses | 1,728 | 1,662 | ||||||
| Total Deferred tax assets not recognized | 3,880 | 3,814 | ||||||
Deferred income tax assets are recognized for tax loss carry-forwards to the extent that the realization of the related tax benefit through future taxable profits is probable. The Company did not recognize deferred income tax assets of ThUS$ 1,728 (ThUS$ 1,662 at December 31, 2010) in respect of losses amounting to ThUS$ 6,631 (ThUS$ 5,992 at December 31, 2010) that can be carried against future taxable income.
Expense (income) for deferred and current income taxes for the years ended at September 30, 2011 and September 30, 2010, respectively, are as follows:
| For the nine months ended | For the three months ended | |||||||||||||||
| September 30, | September 30, | |||||||||||||||
| 2011 | 2010 | 2011 | 2010 | |||||||||||||
| ThUS$ | ThUS$ | ThUS$ | ThUS$ | |||||||||||||
| Expense for current income tax | ||||||||||||||||
| Current tax expense | 10,036 | 5,522 | 2,201 | 2,881 | ||||||||||||
| Adjustment to previous year’s current tax | 3,846 | (2,577 | ) | 1,665 | 361 | |||||||||||
| Other current tax expense (income) | - | (823 | ) | - | (551 | ) | ||||||||||
| Total current tax expense, net | 13,882 | 2,122 | 3,866 | 2,691 | ||||||||||||
| Expense for deferred income taxes | ||||||||||||||||
| Deferred expense (income) for taxes related to the creation and reversal of temporary differences | 26,993 | 47,229 | 13,979 | 14,272 | ||||||||||||
| Reduction (increase) in value of deferred tax assets | 66 | 876 | (184 | ) | 3,194 | |||||||||||
| Total deferred tax expense, net | 27,059 | 48,105 | 13,795 | 17,466 | ||||||||||||
| Income tax expense | 40,941 | 50,227 | 17,661 | 20,157 | ||||||||||||
76
Composition of income tax expense (income):
| For the nine months ended | For the three months ended | |||||||||||||||
| September 30, | September 30, | |||||||||||||||
| 2011 | 2010 | 2011 | 2010 | |||||||||||||
| ThUS$ | ThUS$ | ThUS$ | ThUS$ | |||||||||||||
| Current tax expense, net, foreign | 4,617 | 350 | 3,899 | 76 | ||||||||||||
| Current tax expense, net, Chile | 9,265 | 1,772 | (33 | ) | 2,615 | |||||||||||
| Total current tax expense, net | 13,882 | 2,122 | 3,866 | 2,691 | ||||||||||||
| Deferred tax expense, net, foreign | (18,705 | ) | (1,661 | ) | (2,607 | ) | (2,150 | ) | ||||||||
| Deferred tax expense, net, Chile | 45,764 | 49,766 | 16,402 | 19,616 | ||||||||||||
| Deferred tax expense, net, total | 27,059 | 48,105 | 13,795 | 17,466 | ||||||||||||
| Income tax expense | 40,941 | 50,227 | 17,661 | 20,157 | ||||||||||||
Reconciliation of tax expense using the legal rate to the tax expense using the effective rate:
| For the periods ended | ||||||||
| September 30, | ||||||||
| 2011 | 2010 | |||||||
| ThUS$ | ThUS$ | |||||||
| Tax expense using the legal rate | 49,728 | 51,913 | ||||||
| Tax effect of legal rate change | (7,938 | ) | - | |||||
| Tax effect of rates in other jurisdictions | 2,150 | (399 | ) | |||||
| Tax effect of non-taxable operating revenues | (8,152 | ) | (3,307 | ) | ||||
| Tax effect of disallowable expenses | 5,112 | 796 | ||||||
| Tax effect of current period tax losses not recognized | - | 876 | ||||||
| Other increases (decreases) | 41 | 348 | ||||||
| Total adjustments to tax expense using the legal rate | (8,787 | ) | (1,686 | ) | ||||
| Tax expense using the effective rate | 40,941 | 50,227 | ||||||
77
Reconciliation of legal tax rate to effective tax rate:
| For the periods ended | ||||||||
| September 30, | ||||||||
| 2011 | 2010 | |||||||
| % | % | |||||||
| Legal tax rate | 20.00 | 17.00 | ||||||
| Effect of tax rates for legal rate change | (3.19 | ) | - | |||||
| Effect of tax rates in other jurisdictions | 0.86 | (0.13 | ) | |||||
| Effect of tax rate on non-taxable operating revenues | (3.28 | ) | (1.08 | ) | ||||
| Effect of tax rate on disallowable expenses | 2.06 | 0.26 | ||||||
| Effect of tax rate on use of not-previously recognized tax losses | - | 0.29 | ||||||
| Other increase (decrease) | 0.02 | 0.11 | ||||||
| Total adjustment to the legal tax rate | (3.53 | ) | (0.55 | ) | ||||
| Total effective tax rate | 16.47 | 16.45 | ||||||
Deferred taxes related to items charged to net equity:
| For the nine months ended | For the three months ended | |||||||||||||||
| September 30, | September 30, | |||||||||||||||
| 2011 | 2010 | 2011 | 2010 | |||||||||||||
| ThUS$ | ThUS$ | ThUS$ | ThUS$ | |||||||||||||
| Aggregate deferred taxation of components of other comprehensive income | 21,320 | 13,111 | 13,864 | (926 | ) | |||||||||||
| Aggregate deferred taxation related to items charged to net equity | (324 | ) | (454 | ) | (96 | ) | (207 | ) | ||||||||
Total deferred taxes related to items charged to net equity | 20,996 | 12,657 | 13,768 | (1,133 | ) | |||||||||||
78
Effects on deferred taxes of the components of other comprehensive income:
| As of September 30, 2011 | ||||||||||||
| Income tax | Amount | |||||||||||
| Amount before | expense | after | ||||||||||
| Taxes | (income) | Taxes | ||||||||||
| ThUS$ | ThUS$ | ThUS$ | ||||||||||
| Cash-flow hedges | 115,913 | (19,705 | ) | 96,208 | ||||||||
| Translation adjustment | 9,507 | (1,615 | ) | 7,892 | ||||||||
| (21,320 | ) | |||||||||||
| As of September 30, 2010 | ||||||||||||
| Income tax | Amount | |||||||||||
| Amount before | expense | after | ||||||||||
| Taxes | (income) | Taxes | ||||||||||
| ThUS$ | ThUS$ | ThUS$ | ||||||||||
| Cash-flow hedges | 76,973 | (13,085 | ) | 63,888 | ||||||||
| Translation adjustment | 150 | (26 | ) | 124 | ||||||||
| (13,111 | ) | |||||||||||
79
NOTE 20 – OTHER FINANCIAL LIABILITIES
The composition of other financial liabilities is as follows:
| As of | As of | |||||||
| September 30, | December 31, | |||||||
| 2011 | 2010 | |||||||
| MUS$ | MUS$ | |||||||
| Current | ||||||||
| a) Bank loans | 525,993 | 495,261 | ||||||
| b) Other financial liabilities | 5,017 | 5,321 | ||||||
| c) Hedge liabilities | 73,843 | 42,042 | ||||||
| Total Current | 604,853 | 542,624 | ||||||
| Non-current | ||||||||
| a) Bank loans | 2,687,498 | 2,450,033 | ||||||
| b) Other financial liabilities | 11,035 | 14,427 | ||||||
| c) Hedge liabilities | 124,801 | 97,888 | ||||||
| Total Non-current | 2,823,334 | 2,562,348 | ||||||
| a) | Interest bearing loans |
Obligations with credit institutions and debt instruments:
| As of | As of | |||||||
| September 30, | December 31, | |||||||
| 2011 | 2010 | |||||||
| ThUS$ | ThUS$ | |||||||
| Current | ||||||||
| Bank loans | 165,229 | 151,417 | ||||||
| Guaranteed obligations | 282,215 | 283,637 | ||||||
| Financial leases | 75,206 | 54,297 | ||||||
| Other loans | 3,343 | 5,910 | ||||||
| Total current | 525,993 | 495,261 | ||||||
| Non-current | ||||||||
| Bank loans | 290,614 | 146,884 | ||||||
| Guaranteed obligations | 1,897,836 | 2,023,666 | ||||||
| Financial leases | 258,146 | 173,274 | ||||||
| Other loans | 240,902 | 106,209 | ||||||
| Total non-current | 2,687,498 | 2,450,033 | ||||||
| Total obligations with financial institutions | 3,213,491 | 2,945,294 | ||||||
80
All interest-bearing liabilities are recorded using the effective interest rate method. Under IFRS, the effective interest rate for loans with a fixed interest rate does not vary throughout the loan, while in the case of loans with variable interest rates, the effective rate changes on each date of repricing of the loan.
Currency balances that make the interest bearing loans at September 30, 2011 and December 31, 2010, are as follows:
| As of | As of | |||||||
| September 30, | December 31, | |||||||
| 2011 | 2010 | |||||||
| ThUS$ | ThUS$ | |||||||
| US Dollar | 3,213,491 | 2,753,788 | ||||||
| Chilean Peso (*) | - | 187,101 | ||||||
| Other currency | - | 4,405 | ||||||
| Total | 3,213,491 | 2,945,294 | ||||||
(*) At December 2010, the Company maintained cross currency swaps, securing the payment of ThU$ 128.056 of debt in dollars. At September 2011, these contracts were closed because the loans in Chilean pesos were paid and one of them converted to U.S. dollar.
| b) | Other financial liabilities |
The detail of other financial liabilities as of September 30, 2011 and December 31, 2010, respectively, is as follows:
| As of | As of | |||||||
| September 30, | December 31, | |||||||
| 2011 | 2010 | |||||||
| ThUS$ | ThUS$ | |||||||
| Current | ||||||||
| Interest rate derivative not recognized as a hedge | 5,017 | 5,321 | ||||||
| Total current | 5,017 | 5,321 | ||||||
| Non-current | ||||||||
| Interest rate derivative not recognized as a hedge | 11,035 | 14,427 | ||||||
| Total non-current | 11,035 | 14,427 | ||||||
| Total other financial liabilities | 16,052 | 19,748 | ||||||
81
| c) | Hedging liabilities |
Hedging liabilities as of September 30, 2011 and December 31, 2010 are as follows:
| As of | As of | |||||||
| September 30, | December 31, | |||||||
| 2011 | 2010 | |||||||
| ThUS$ | ThUS$ | |||||||
| Current | ||||||||
| Interest accrued since last payment date swap rates | 4,270 | 3,826 | ||||||
| Fair value interest rate derivatives | 32,792 | 24,522 | ||||||
| Fair value of fuel derivatives | 36,719 | - | ||||||
| Fair value of foreign currency derivatives | 62 | 13,694 | ||||||
| Total current | 73,843 | 42,042 | ||||||
| Non-current | ||||||||
| Fair value interest rate derivatives | 124,801 | 90,666 | ||||||
| Fair value of foreign currency derivatives | - | 7,222 | ||||||
| Total non-current | 124,801 | 97,888 | ||||||
| Total hedging liabilities | 198,644 | 139,930 | ||||||
The foreign currency derivatives correspond to forward contracts and cross currency swaps.
82
Hedging operation
The fair values by type of derivative contracts held as hedging instruments are presented below:
| As of | As of | |||||||
| September 30, | December 31, | |||||||
| 2011 | 2010 | |||||||
| ThUS$ | ThUS$ | |||||||
| Forward starting swaps (FSS) (1) | (6,306 | ) | (54,670 | ) | ||||
| Interest rate options (2) | 122 | 422 | ||||||
| Interest rate swaps (3) | (98,801 | ) | (64,344 | ) | ||||
| Cross currency swaps (CCIRS) (4) | - | 26,703 | ||||||
| Fuel collars (5) | (7,092 | ) | 17,782 | |||||
| Fuel swap (6) | (29,627 | ) | 28,032 | |||||
| Currency forward (7) | 759 | (13,694 | ) | |||||
| (1) | Covers the significant variations in cash flows associated with market risk implicit in the changes in the 3-month Libor interest rate for long-term loans incurred in the acquisition of aircraft to be produced from the future contract date. These contracts are recorded as cash flow hedges. |
| (2) | Covers the significant variations in cash flows associated with market risk implicit in the changes in the 3-month Libor interest rate for long-term loans incurred in the acquisition of aircraft. These contracts are recorded as cash flow hedges. |
| (3) | Covers the significant variations in cash flows associated with market risk implicit in the increases in the 3 and 6 months Libor interest rates for long-term loans incurred in the acquisition of aircraft and bank loans. These contracts are recorded as cash flow hedges. |
| (4) | Covers the significant variations in cash flows associated with market risk implicit in the changes in the TAB 180 days interest rate and the dollar exchange rate. These contracts are recorded as cash flow hedges. |
| (5) | Covers significant variations in cash flows associated with market risk implicit in the changes in the price of future fuel purchases. |
| (6) | Covers the significant variations in cash flows associated with market risk implicit in the changes in the price of future fuel purchases. |
| (7) | Covers investments denominated in Chilean pesos to changes in the US Dollar - Chilean Peso exchange rate, with the aim of ensuring investment in dollars. |
During the periods presented, the Company only maintains cash flow hedges. In the case of fuel hedges, the cash flows subject to said hedges will impact results between 1 to 12 months from the consolidated statement of financial position date, whereas in the case of interest rate hedging, the hedges will impact results over the life of the related loans, which are valid for 12 years. With respect to interest and currency hedges, the impact on results will occur continuously throughout the life of the contract (3 years), while cash flows will occur quarterly. Finally, the hedges on investments will impact results continuously throughout the life of the investment (up to 3 months), while the cash flows occur at the maturity of the investment.
83
During the periods presented, all hedged highly probable forecast transactions have occurred.
During the periods presented, there has been no hedge ineffectiveness recognized in the consolidated statement of income.
Since none of the coverage resulted in the recognition of a non-financial asset, no portion of the result of the derivatives recognized in equity was transferred to the initial value of such assets.
The amounts recognized in comprehensive income during the period and transferred from net equity to income are as follows:
| For the nine months ended | For the three months ended | |||||||||||||||
| September 30, | September 30, | |||||||||||||||
| 2011 | 2010 | 2011 | 2010 | |||||||||||||
| ThUS$ | ThUS$ | ThUS$ | ThUS$ | |||||||||||||
| Debit (credit) recognized in comprehensive income during the period | (115,913 | ) | (76,973 | ) | (80,948 | ) | 2,827 | |||||||||
| Debit (credit) transferred from net equity to income during the period | 11,440 | (32,872 | ) | (12,381 | ) | (13,337 | ) | |||||||||
84
NOTE 21 - TRADE AND OTHER CURRENT ACCOUNTS PAYABLE
The composition of trade and other current accounts payable is as follows:
| As of | As of | |||||||
| September 30, | December 31, | |||||||
| 2011 | 2010 | |||||||
| ThUS$ | ThUS$ | |||||||
| Current | ||||||||
| a) Trade and other accounts payable | 467,492 | 500,694 | ||||||
| b) Accrued liabilities at the reporting date | 125,864 | 144,877 | ||||||
| Total trade and other accounts payable | 593,356 | 645,571 | ||||||
| a) | Trade and other current accounts payable as of September 30, 2011 and December 31, 2010 are as follows: |
| As of | As of | |||||||
| September 30, | December 31, | |||||||
| 2011 | 2010 | |||||||
| ThUS$ | ThUS$ | |||||||
| Trade creditors | 355,411 | 389,568 | ||||||
| Leasing obligations | 17,003 | 26,474 | ||||||
| Other accounts payable (*) | 95,078 | 84,652 | ||||||
| Total | 467,492 | 500,694 | ||||||
(*) Includes agreement entitled "Plea Agreement" with the Department of Justice of the United States of America. See detail in Note 22.
85
Trade and other current payables by concept:
| As of | As of | |||||||
| September 30, | December 31, | |||||||
| 2011 | 2010 | |||||||
| ThUS$ | ThUS$ | |||||||
| Aircraft fuel | 114,460 | 104,404 | ||||||
| Boarding Fee | 70,865 | 72,864 | ||||||
| Landing fees | 45,282 | 43,941 | ||||||
| Handling and ground handling | 27,679 | 39,915 | ||||||
| Suppliers technical purchases | 27,701 | 29,594 | ||||||
| Other personal expenses | 24,865 | 21,275 | ||||||
| Professional service and advisory | 18,410 | 22,445 | ||||||
| U.S.A. Department of Justice (*) | 18,290 | 18,387 | ||||||
| Marketing | 17,111 | 21,041 | ||||||
| Aircraft and engines leasing | 17,003 | 26,474 | ||||||
| Crew | 10,697 | 8,188 | ||||||
| In-flight services | 10,008 | 11,761 | ||||||
| Aviation insurance | 10,439 | 5,931 | ||||||
| Airline companies | 7,342 | - | ||||||
| Achievement of objectives | 7,203 | 15,263 | ||||||
| Maintenance | 10,154 | 28,658 | ||||||
| Others (**) | 29,983 | 30,553 | ||||||
| Total trade and other accounts payable | 467,492 | 500,694 | ||||||
(*) Includes agreement entitled "Plea Agreement" with the Department of Justice of the United States of America. See detail in Note 22.
(**) Includes an amount payable of US$ 5 million as a result of the extrajudicial agreement reached with Chilean Airline PAL regarding PAL’s claim, in the Supreme Court, against the consultation process undertaken with the Court of Defense of Free Competition ("TDLC") regarding the merger between LAN and TAM.
| b) | The liabilities accrued at September 30, 2011 and December 31, 2010, are as follows: |
86
| As of | As of | |||||||
| September 30, | December 31, | |||||||
| 2011 | 2010 | |||||||
| ThUS$ | ThUS$ | |||||||
| Aircraft and engine maintenance | 23,953 | 26,133 | ||||||
| Accounts payable to personnel | 36,389 | 52,441 | ||||||
| Accrued personnel expenses | 51,327 | 40,974 | ||||||
| Others accrued liabilities | 14,195 | 25,329 | ||||||
| Total accrued liabilities | 125,864 | 144,877 | ||||||
87
NOTE 22 - OTHER PROVISIONS
The detail of other provisions as of September 30, 2011 and December 31, 2010 is as follows:
| As of | As of | |||||||
| September 30, | December 31, | |||||||
| 2011 | 2010 | |||||||
| ThUS$ | ThUS$ | |||||||
| Current | ||||||||
| Provision legal claims (1) | 1,116 | 753 | ||||||
| Total other provisions, current | 1,116 | 753 | ||||||
| Non-current | ||||||||
| Provision legal claims (1) | 23,469 | 21,204 | ||||||
| Provision for European Commision investigation (2) | 11,038 | 10,916 | ||||||
| Total other provisions, non-current | 34,507 | 32,120 | ||||||
| Total other provisions | 35,623 | 32,873 | ||||||
(1) The amount represents a provision for certain demands made against the Company by former employees, regulatory agencies and others. The charge for the provision is shown in the consolidated statement of income in Administrative expenses. It is expected that the current balance as of September 30, 2011 will be applied during the next 12 months.
(2) Provision made for proceedings brought by the European Commission for possible breaches of free competition in the freight market.
The movement of provisions between January 01, 2010 and September 30, 2011 is as follows:
| European | ||||||||||||
| Legal | Commission | |||||||||||
| claims | Investigation | Total | ||||||||||
| ThUS$ | ThUS$ | ThUS$ | ||||||||||
| Opening balance as of January 01, 2010 | 2,804 | 25,000 | 27,804 | |||||||||
| Increase in provisions | 316 | - | 316 | |||||||||
| Provision used | (377 | ) | - | (377 | ) | |||||||
| Exchange difference | (227 | ) | - | (227 | ) | |||||||
| Balance as of September 30, 2010 | 2,516 | 25,000 | 27,516 | |||||||||
88
| European | ||||||||||||
| Legal | Commission | |||||||||||
| claims | Investigation | Total | ||||||||||
| ThUS$ | ThUS$ | ThUS$ | ||||||||||
| Opening balance as of October 01, 2010 | 2,516 | 25,000 | 27,516 | |||||||||
| Increase in provisions | 2,556 | - | 2,556 | |||||||||
| Acquisition through business combination | 17,174 | - | 17,174 | |||||||||
| Provision used | (304 | ) | - | (304 | ) | |||||||
| Reversal of unused provision | - | (14,084 | ) | (14,084 | ) | |||||||
| Exchange difference | 15 | - | 15 | |||||||||
| Balance as of December 31, 2010 | 21,957 | 10,916 | 32,873 | |||||||||
| European | ||||||||||||
| Legal | Commission | |||||||||||
| claims | Investigation | Total | ||||||||||
| ThUS$ | ThUS$ | ThUS$ | ||||||||||
| Opening balance as of January 01, 2011 | 21,957 | 10,916 | 32,873 | |||||||||
| Increase in provisions | 4,316 | - | 4,316 | |||||||||
| Provision used | (1,507 | ) | - | (1,507 | ) | |||||||
| Reversal of unused provision | (66 | ) | - | (66 | ) | |||||||
| Exchange difference | (115 | ) | 122 | 7 | ||||||||
| Balance as of September 30, 2011 | 24,585 | 11,038 | 35,623 | |||||||||
European Commission Provision:
(a) This provision was established because of the investigation brought by the Directorate General for Competition of the European Commission against more than 25 cargo airlines, including Lan Cargo S.A., as part of a global investigation begun in 2006 regarding possible unfair competition on the air cargo market. This was a joint investigation by the European and U.S.A. authorities. The start of the investigation was disclosed through a significant matter report dated December 27, 2007. The U.S.A. portion of the global investigation concluded when Lan Cargo S.A. and its subsidiary, Aerolíneas Brasileiras S.A. (“ABSA”) signed a Plea Agreement with the U.S.A. Department of Justice, as disclosed in a significant matter report notice on January 21, 2009.
(b) A significant matter report dated November 9, 2010, reported that the General Direction of Competition had issued its decision on this case (the "decision"), under which it imposed fines totaling € 799,445,000 (seven hundred and ninety nine million four hundred and forty-five thousand Euro) for infringement of European Union regulations on free competition against eleven (11) airlines, among which are Lan Airlines S.A. and Lan Cargo S.A., Air Canada, Air France, KLM, British Airways, Cargolux, Cathay Pacific, Japan Airlines, Qantas Airways, SAS and Singapore Airlines.
89
(c) Jointly, Lan Airlines S.A. and Lan Cargo S.A., have been fined in the amount of € 8,220,000 (eight million two hundred twenty thousand Euros) for said infractions, which was provisioned in the financial statements of LAN. This is a minor fine in comparison to the original decision, as there was a significant reduction in fine because LAN cooperated during the investigation.
(d) On January 24, 2011, Lan Airlines S.A. and Lan Cargo S.A. appealed the decision before the Court of Justice of the European Union. At September 30, 2011, the provision reached the amount of ThUS$ 11,038 (ThUS$ 10,916 at December 30, 2011)
90
NOTE 23 – OTHER CURRENT NON-FINANCIAL LIABILITIES
Other current non-financial liabilities as of September 30, 2011 and December 31, 2010 are as follows:
| As of | As of | |||||||
| September 30, | December 31, | |||||||
| 2011 | 2010 | |||||||
| ThUS$ | ThUS$ | |||||||
| Deferred revenues | 867,705 | 810,524 | ||||||
| Dividends payable | 6,491 | 125,435 | ||||||
| Other sundry liabilities | 4,034 | 3,192 | ||||||
| Total other non-financial liabilities, current | 878,230 | 939,151 | ||||||
91
NOTE 24 - EMPLOYEE BENEFITS
Provisions for employee benefits as of September 30, 2011 and December 31, 2010, respectively, are as follows:
| As of | As of | |||||||
| September 30, | December 31, | |||||||
| 2011 | 2010 | |||||||
| ThUS$ | ThUS$ | |||||||
| Pension payments | 3,598 | 3,164 | ||||||
| Termination payments | 284 | 1,161 | ||||||
| Other obligations | 8,263 | 5,332 | ||||||
| Total provisions for employee benefits, non-current | 12,145 | 9,657 | ||||||
(a) The movement in payments for termination indemnities and other obligations between January 01, 2010 and September 30, 2011 is as follows:
| ThUS$ | ||||
| Opening balance as of January 01, 2010 | 5,555 | |||
| Increase (decrease) current service provision | 1,531 | |||
| Benefits paid | (556 | ) | ||
| Balance as of September 30, 2010 | 6,530 | |||
| Opening balance as of October 01, 2010 | 6,530 | |||
| Increase (decrease) current service provision | 3,294 | |||
| Benefits paid | (167 | ) | ||
| Balance as of December 31, 2010 | 9,657 | |||
| Opening balance as of January 01, 2011 | 9,657 | |||
| Increase (decrease) current service provision | 3,537 | |||
| Benefits paid | (1,049 | ) | ||
| Balance as of September 30, 2011 | 12,145 | |||
92
(b) The provision for short-term benefits as of September 30, 2011 and December 31, 2010 respectively, is detailed below:
| As of | As of | |||||||
| September 30, | December 31, | |||||||
| 2011 | 2010 | |||||||
| ThUS$ | ThUS$ | |||||||
| Profit-sharing and bonuses | 36,389 | 52,441 | ||||||
The participation in profits and bonuses corresponds to an annual incentives plan for achievement of objectives.
Employment expenses are detailed below:
| For the nine months ended | For the three months ended | |||||||||||||||
| September 30, | September 30, | |||||||||||||||
| 2011 | 2010 | 2011 | 2010 | |||||||||||||
| ThUS$ | ThUS$ | ThUS$ | ThUS$ | |||||||||||||
| Salaries and wages | 569,831 | 426,284 | 196,636 | 149,728 | ||||||||||||
| Short-term employee benefits | 72,398 | 48,178 | 30,543 | 18,458 | ||||||||||||
| Termination benefits | 14,303 | 9,114 | 4,152 | 3,969 | ||||||||||||
| Other personnel expenses | 104,781 | 81,439 | 36,694 | 31,213 | ||||||||||||
| Total | 761,313 | 565,015 | 268,025 | 203,368 | ||||||||||||
93
NOTE 25 – OTHER NON-CURRENT ACCOUNTS PAYABLE
Other non-current accounts payable as of September 30, 2011 and December 31, 2010 are as follows:
| As of | As of | |||||||
| September 30, | December 31, | |||||||
| 2011 | 2010 | |||||||
| ThUS$ | ThUS$ | |||||||
| Fleet financing (JOL) | 325,651 | 314,372 | ||||||
| Other accounts payable (*) | 36,000 | 54,000 | ||||||
| Aircraft and engine maintenance | 45,763 | 47,607 | ||||||
| Provision for vacations and bonuses | 7,664 | 7,949 | ||||||
| Other sundry liabilities | 1,657 | 1,753 | ||||||
| Total non-current liabilities | 416,735 | 425,681 | ||||||
(*) Agreement entitled "Plea Agreement" with the Department of Justice of United States of America; its short-term part is in trade and other payables. See details in Note 22.
94
NOTE 26 - EQUITY
| a) | Capital |
The capital of the Company is managed and composed of the following:
The Company’s objective is to maintain an appropriate level of capitalization that enables it to ensure access to the financial markets for carrying out its medium and long-term objectives, optimizing the return for its shareholders and maintaining a solid financial position.
The capital of the Company at September 30, 2011 amounts to ThUS$ 461,975, divided into 339,358,209 common stock of a same series (ThUS$ 453,444 divided into 338,790,909 shares as of December 31, 2010), no par value. There are no special series of shares and no privileges. The form of its stock certificates and their issuance, exchange, disablement, loss, replacement and other circumstances, as well as the transfer of the shares, is governed by the provisions of Corporations Law and its regulations.
| b) | Subscribed and paid shares |
As of September 30, 2011 the total number of authorized common shares is 341 million shares of no par value. At the end of this period, of the total shares subscribed, 339,358,209 shares have been fully paid, leaving 1,641,791 shares reserved for issuance under option contracts. Between January 1 and September 30, 2011, options for 567,300 shares have been exercised.
At December 31, 2010, of the total subscribed shares 338,790,909 were fully paid, with 2,209,091 stock option contracts reserved for issuance.
95
| c) | Other equity interests |
The movement of other equity interest between January 01, 2010 and September 30, 2011 is as follows:
| Stock | ||||||||||||
| options | Other | |||||||||||
| plans | reserves | Total | ||||||||||
| ThUS$ | ThUS$ | ThUS$ | ||||||||||
| Opening balance as of January 01, 2010 | 2,477 | 13 | 2,490 | |||||||||
| Stock option plans | 2,669 | - | 2,669 | |||||||||
| Deferred tax | (454 | ) | - | (454 | ) | |||||||
| Legal reserves | - | 49 | 49 | |||||||||
| Balance as of September 30, 2010 | 4,692 | 62 | 4,754 | |||||||||
| Opening balance as of October 01, 2010 | 4,692 | 62 | 4,754 | |||||||||
| Stock option plans | 854 | - | 854 | |||||||||
| Deferred tax | (145 | ) | - | (145 | ) | |||||||
| Balance as of December 31, 2010 | 5,401 | 62 | 5,463 | |||||||||
| Opening balance as of January 01, 2011 | 5,401 | 62 | 5,463 | |||||||||
| Stock option plans | 1,902 | - | 1,902 | |||||||||
| Deferred tax | (324 | ) | - | (324 | ) | |||||||
| Transactions with minority interests | - | (4,488 | ) | (4,488 | ) | |||||||
| Legal reserves | - | 333 | 333 | |||||||||
| Balance as of September 30, 2011 | 6,979 | (4,093 | ) | 2,886 | ||||||||
| (c.1) | Reserves for stock option plans |
These reserves are related to the share-based payments explained in Note 36.
96
| (c.2) | Other sundry reserves |
The balance of other sundry reserves comprises the following:
| As of | As of | |||||||
| September 30, | December 31, | |||||||
| 2011 | 2010 | |||||||
| ThUS$ | ThUS$ | |||||||
| Reserve for the adjustment of the value of fixed assets (1) | 2,620 | 2,620 | ||||||
| Transactions with minority interests (2) | (4,488 | ) | - | |||||
| Share issuance and placement costs (3) | (2,672 | ) | (2,672 | ) | ||||
| Others | 447 | 114 | ||||||
| Total | (4,093 | ) | 62 | |||||
(1) Corresponds to the technical revaluation of fixed assets authorized by the Superintendence of Securities and Insurance in 1979, in Circular No. 1,529. The revaluation was optional and could be taken only once, the reserve is not distributable and can only be capitalized.
(2) Corresponds to the loss generated by the participation of Lan Pax Group S.A., in the capital increase for Aerovías de Integración Regional, AIRES S.A.
(3) As established in Circular 1,736 of the Superintendence of Securities and Insurance, the next extraordinary shareholders meeting to be held by the parent Company should approve the share issuance and placement costs account to be deducted from the capital paid.
97
| d) | Other reserves |
The movement of other reserves between January 01, 2010 and September 30, 2011 is as follows:
| Currency | Cash flow | |||||||||||
| translation | hedging | |||||||||||
| reserve | reserve | Total | ||||||||||
| ThUS$ | ThUS$ | ThUS$ | ||||||||||
| Opening balance as of January 01, 2010 | (4,924 | ) | (92,230 | ) | (97,154 | ) | ||||||
| Derivatives valuation gains | - | (76,973 | ) | (76,973 | ) | |||||||
| Deferred tax | 18 | 13,085 | 13,103 | |||||||||
| Currency translation differences | (106 | ) | - | (106 | ) | |||||||
| Balance as of September 30, 2010 | (5,012 | ) | (156,118 | ) | (161,130 | ) | ||||||
| Opening balance as of October 01, 2010 | (5,012 | ) | (156,118 | ) | (165,658 | ) | ||||||
| Derivatives valuation losses | - | 59,118 | 59,118 | |||||||||
| Deferred tax | (155 | ) | (10,050 | ) | (10,205 | ) | ||||||
| Currency translation differences | 910 | - | 910 | |||||||||
| Balance as of December 31, 2010 | (4,257 | ) | (107,050 | ) | (111,307 | ) | ||||||
| Opening balance as of January 01, 2011 | (4,257 | ) | (107,050 | ) | (111,307 | ) | ||||||
| Derivatives valuation gains | - | (115,913 | ) | (115,913 | ) | |||||||
| Deferred tax | 1,579 | 19,705 | 21,284 | |||||||||
| Currency translation differences | (9,291 | ) | - | (9,291 | ) | |||||||
| Balance as of September 30, 2011 | (11,969 | ) | (203,258 | ) | (215,227 | ) | ||||||
| (d.1) | Currency translation reserve |
These originate from exchange differences arising from the translation of any investment in foreign entities (or Chilean investment with a functional currency different to that of the parent), and from loans and other instruments in foreign currency designated as hedges for such investments. When the investment (all or part) is sold or disposed, and loss of control occurs, these reserves are shown in the consolidated statement of income as part of the loss or gain on the sale or disposal. If the sale does not involve loss of control, these reserves are transferred to non-controlling interests.
| (d.2) | Cash flow hedging reserve |
These originate from the fair value valuation at the end of each period of the outstanding derivative contracts that have been defined as cash flow hedges. When these contracts expire, these reserves should be adjusted and the corresponding results recognized.
98
| e) | Retained earnings |
The movement of retained earnings between January 01, 2010 and September 30, 2011 is as follows:
| ThUS$ | ||||
| Opening balance as of January 01, 2010 | 740,047 | |||
| Result for the period | 255,143 | |||
| Other decreases | (129 | ) | ||
| Dividends | (87,482 | ) | ||
| Balance as of September 30, 2010 | 907,579 | |||
| ThUS$ | ||||
| Opening balance as of October 01, 2010 | 907,579 | |||
| Result for the period | 164,559 | |||
| Dividends | (122,924 | ) | ||
| Balance as of December 31, 2010 | 949,214 | |||
| ThUS$ | ||||
| Opening balance as of January 01, 2011 | 949,214 | |||
| Result for the period | 207,697 | |||
| Other decreases | (631 | ) | ||
| Dividends | (72,696 | ) | ||
| Balance as of September 30, 2011 | 1,083,584 | |||
99
| f) | Dividends per share |
| As of September 30, 2011 | ||||||||||||
| Mandatory | ||||||||||||
| Final | Interim | minimum | ||||||||||
| dividend | dividend | dividend | ||||||||||
| Description | 2010 | 2011 | 2011 | |||||||||
| Date of dividend | 4/29/2011 | 8/30/2011 | 9/30/2011 | |||||||||
| Amount of the dividend (ThUS$) | 10,386 | 56,595 | 5,715 | |||||||||
| Number of shares among which the dividend is distributed | 339,310,509 | 339,358,209 | 339,358,209 | |||||||||
| Dividend per share (US$) | 0.03061 | 0.16677 | 0.01684 | |||||||||
| As of December 31, 2010 | ||||||||||||
| Final | Interim | Interim | ||||||||||
| dividend | dividend | dividend | ||||||||||
| Description | 2009 | 2010 | 2010 | |||||||||
| Date of dividend | 4/29/2010 | 7/27/2010 | 12/23/2010 | |||||||||
| Amount of the dividend (ThUS$) | 10,940 | 74,466 | 125,000 | |||||||||
| Number of shares among which the dividend is distributed | 338,790,909 | 338,790,909 | 338,790,909 | |||||||||
| Dividend per share (US$) | 0.03229 | 0.21980 | 0.36896 | |||||||||
The Company’s dividend policy is that dividends distributed will be equal to the minimum required by law, i.e. 30% of the net income according to current regulations. This policy does not preclude the Company from distributing dividends in excess of this obligatory minimum, based on the events and circumstances that may occur during the course of the year.
At September 30, 2011 interim dividends were declared for 26.7% of earnings for the period, as well as a provision of 3.3% for mandatory minimum dividends, recorded under other current non-financial liabilities.
100
NOTE 27 - REVENUE
The detail of revenues is as follows:
| For the nine months ended | For the three months ended | |||||||||||||||
| September 30, | September 30, | |||||||||||||||
| 2011 | 2010 | 2011 | 2010 | |||||||||||||
| ThUS$ | ThUS$ | ThUS$ | ThUS$ | |||||||||||||
| Passengers | 2,935,390 | 2,221,369 | 1,060,254 | 799,700 | ||||||||||||
| Cargo | 1,148,072 | 910,555 | 395,189 | 322,592 | ||||||||||||
| Total | 4,083,462 | 3,131,924 | 1,455,443 | 1,122,292 | ||||||||||||
101
NOTE 28 - COSTS AND EXPENSES BY NATURE
| a) | Costs and operating expenses |
The main operating costs and administrative expenses are detailed below:
| For the nine months ended | For the three months ended | |||||||||||||||
| September 30, | September 30, | |||||||||||||||
| 2011 | 2010 | 2011 | 2010 | |||||||||||||
| ThUS$ | ThUS$ | ThUS$ | ThUS$ | |||||||||||||
| Other rentals and landing fees | 495,793 | 421,900 | 165,911 | 155,468 | ||||||||||||
| Aircraft fuel | 1,282,305 | 843,131 | 461,524 | 294,013 | ||||||||||||
| Comissions | 153,779 | 124,850 | 55,499 | 45,269 | ||||||||||||
| Other operating expenses | 457,128 | 363,958 | 149,454 | 129,367 | ||||||||||||
| Aircraft rentals | 129,458 | 71,646 | 42,861 | 24,166 | ||||||||||||
| Aircraft maintenance | 139,424 | 91,118 | 50,619 | 31,600 | ||||||||||||
| Passenger service | 102,670 | 82,216 | 34,729 | 30,839 | ||||||||||||
| Total | 2,760,557 | 1,998,819 | 960,597 | 710,722 | ||||||||||||
| b) | Depreciation and amortization |
Depreciation and amortization are detailed below:
| For the nine months ended | For the three months ended | |||||||||||||||
| September 30, | September 30, | |||||||||||||||
| 2011 | 2010 | 2011 | 2010 | |||||||||||||
| ThUS$ | ThUS$ | ThUS$ | ThUS$ | |||||||||||||
| Depreciation (*) | 283,577 | 237,953 | 94,293 | 79,300 | ||||||||||||
| Amortization | 7,239 | 6,941 | 2,401 | 2,325 | ||||||||||||
| Total | 290,816 | 244,894 | 96,694 | 81,625 | ||||||||||||
(*) Includes the depreciation of property, plant and equipment and the maintenance cost of aircraft held under operating leases.
| c) | Personnel expenses |
The costs for personnel expenses are disclosed in provisions for employee benefits (See Note 24).
102
| d) | Financial costs |
The detail of financial costs is as follows:
| For the nine months ended | For the three months ended | |||||||||||||||
| September 30, | September 30, | |||||||||||||||
| 2011 | 2010 | 2011 | 2010 | |||||||||||||
| ThUS$ | ThUS$ | ThUS$ | ThUS$ | |||||||||||||
| Bank loan interest | 77,114 | 88,579 | 23,928 | 29,479 | ||||||||||||
| Financial leases | 7,195 | 4,549 | 2,841 | 1,488 | ||||||||||||
| Other financial instruments | 20,301 | 23,417 | 7,629 | 7,078 | ||||||||||||
| Total | 104,610 | 116,545 | 34,398 | 38,045 | ||||||||||||
Costs and expenses by nature presented in this note are equivalent to the sum of cost of sales, distribution costs, administrative expenses, other expenses and financing costs presented in the consolidated statement of income by function.
103
NOTE 29 - GAINS (LOSSES) ON THE SALE OF NON-CURRENT ASSETS NOT CLASSIFIED AS HELD FOR SALE
The gains (losses) on sales of non-current assets not classified as Held for Sale as of September 30, 2011 and 2010 are as follows:
| For the nine months ended | For the three months ended | |||||||||||||||
| September 30, | September 30, | |||||||||||||||
| 2011 | 2010 | 2011 | 2010 | |||||||||||||
| ThUS$ | ThUS$ | ThUS$ | ThUS$ | |||||||||||||
| Property, plant and equipment | (1,078 | ) | (1,050 | ) | (348 | ) | (350 | ) | ||||||||
| Total | (1,078 | ) | (1,050 | ) | (348 | ) | (350 | ) | ||||||||
The gain (loss) on sales of the period is presented in other operating income by function and cost of sales.
104
NOTE 30 - OTHER INCOME, BY FUNCTION
Other income by function is as follows:
| For the nine months ended | For the three months ended | |||||||||||||||
| September 30, | September 30, | |||||||||||||||
| 2011 | 2010 | 2011 | 2010 | |||||||||||||
| ThUS$ | ThUS$ | ThUS$ | ThUS$ | |||||||||||||
| Duty free | 12,252 | 8,325 | 4,245 | 2,731 | ||||||||||||
| Aircraft leasing | 9,725 | 7,907 | 2,283 | 2,086 | ||||||||||||
| Logistics and courier | 10,958 | 27,031 | - | 8,814 | ||||||||||||
| Customs and warehousing | 17,823 | 17,643 | 6,202 | 6,579 | ||||||||||||
| Tours | 31,547 | 16,065 | 10,756 | 6,215 | ||||||||||||
| Other miscellaneous income | 17,168 | 11,955 | 7,591 | 3,613 | ||||||||||||
| Total | 99,473 | 88,926 | 31,077 | 30,038 | ||||||||||||
105
NOTE 31 – FOREIGN CURRENCY AND EXHANGE RATE DIFFERENCES
| a) | Foreign currency |
The foreign currency detail of current and non-current assets is as follows:
| As of | As of | |||||||
| September 30, | December 31, | |||||||
| 2011 | 2010 | |||||||
| ThUS$ | ThUS$ | |||||||
| Current assets | ||||||||
| Cash and cash equivalents | 118,708 | 436,840 | ||||||
| Chilean peso | 74,094 | 368,360 | ||||||
| Euro | 4,093 | 7,844 | ||||||
| Argentine peso | 6,960 | 11,230 | ||||||
| Brazilian real | 719 | 4,759 | ||||||
| Other currency | 32,842 | 44,647 | ||||||
| Other current financial assets | 7,827 | 6,726 | ||||||
| Brazilian real | 4,629 | 4,740 | ||||||
| Other currency | 3,198 | 1,986 | ||||||
| Other current non-financial assets | 7,610 | 2,692 | ||||||
| Chilean peso | 2,563 | 1,247 | ||||||
| Argentine peso | 1,961 | 419 | ||||||
| Brazilian real | 139 | 96 | ||||||
| Other currency | 2,947 | 930 | ||||||
| Trade and other current accounts receivable | 184,036 | 126,648 | ||||||
| Chilean peso | 52,239 | 28,606 | ||||||
| Euro | 11,513 | 8,429 | ||||||
| Argentine peso | 42,660 | 6,702 | ||||||
| Brazilian real | 42,664 | 31,329 | ||||||
| Australian dollar | 7,740 | 12,456 | ||||||
| Other currency | 27,220 | 39,126 | ||||||
| Current accounts receivable from related entities | 1,295 | 21 | ||||||
| Chilean peso | 1,295 | 21 | ||||||
106
| As of | As of | |||||||
| September 30, | December 31, | |||||||
| 2011 | 2010 | |||||||
| ThUS$ | ThUS$ | |||||||
Current assets | ||||||||
| Current tax assets | 65,865 | 62,455 | ||||||
| Chilean peso | 13,782 | 16,805 | ||||||
| Argentine peso | 21,656 | 14,477 | ||||||
| Brazilian real | 7,495 | 6,735 | ||||||
| Mexican peso | 16,626 | 17,477 | ||||||
| Other currency | 6,306 | 6,961 | ||||||
| Total current assets | 385,341 | 635,382 | ||||||
| Chilean peso | 143,973 | 415,039 | ||||||
| Euro | 15,606 | 16,273 | ||||||
| Argentine peso | 73,237 | 32,828 | ||||||
| Brazilian real | 55,646 | 47,659 | ||||||
| Mexican peso | 16,626 | 17,477 | ||||||
| Australian dollar | 7,740 | 12,456 | ||||||
| Other currency | 72,513 | 93,650 | ||||||
107
| As of | As of | |||||||
| September 30, | December 31, | |||||||
| 2011 | 2010 | |||||||
| ThUS$ | ThUS$ | |||||||
Non-current assets | ||||||||
| Other non-current financial assets | 4,855 | 4,504 | ||||||
| Brazilian real | 2,088 | 1,991 | ||||||
| Other currency | 2,349 | 2,513 | ||||||
| Other non-current non-financial assets | 40 | 1,681 | ||||||
| Argentine peso | - | 1,681 | ||||||
| Other currency | 37 | 0 | ||||||
| Non-current rights receivable | 7,524 | 7,874 | ||||||
| Chilean peso | 7,306 | 7,864 | ||||||
| Other currency | 218 | 10 | ||||||
| Investment recorded using the method of participation | 1,118 | 593 | ||||||
| Chilean peso | 1,118 | 593 | ||||||
| Deferred tax assets | 51,663 | 28,493 | ||||||
| Other currency | 51,663 | 28,943 | ||||||
| Total non-current assets | 64,779 | 43,595 | ||||||
| Chilean peso | 8,424 | 8,457 | ||||||
| Argentine peso | - | 1,681 | ||||||
| Brazilian real | 2,088 | 1,991 | ||||||
| Other currency | 54,267 | 31,466 | ||||||
108
The foreign currency detail of current and non-current liabilities is as follows:
| Up to 90 days | 91 days to 1 year | |||||||||||||||
| As of | As of | As of | As of | |||||||||||||
| September 30, | December 31, | September 30, | December 31, | |||||||||||||
| 2011 | 2010 | 2011 | 2010 | |||||||||||||
| ThUS$ | ThUS$ | ThUS$ | ThUS$ | |||||||||||||
| Current liabilities | ||||||||||||||||
| Other current financial liabilities | 36,143 | 46,043 | - | 112,672 | ||||||||||||
| Chilean peso | 36,143 | 41,638 | - | 112,672 | ||||||||||||
| Other currency | - | 4,405 | - | - | ||||||||||||
| Trade and other current accounts payable | 253,508 | 240,419 | 29,511 | 14,012 | ||||||||||||
| Chilean peso | 54,768 | 52,779 | 9,722 | 9,559 | ||||||||||||
| Euro | 10,041 | 9,438 | 102 | 14 | ||||||||||||
| Argentine peso | 25,687 | 43,214 | 2,704 | 3,725 | ||||||||||||
| Brazilian real | 33,602 | 22,633 | 2,148 | - | ||||||||||||
| Other currency | 129,410 | 112,355 | 14,835 | 714 | ||||||||||||
| Current accounts payable from related entities | 204 | 74 | - | - | ||||||||||||
| Chilean peso | 204 | 74 | - | - | ||||||||||||
| Current tax liabilities | 8,250 | 9,700 | 2,245 | 2,621 | ||||||||||||
| Chilean peso | 3,942 | 3,007 | 209 | 1,064 | ||||||||||||
| Argentine peso | 896 | 240 | 909 | 1,202 | ||||||||||||
| Brazilian real | 1,485 | 1,994 | - | - | ||||||||||||
| Other currency | 1,927 | 4,459 | 1,127 | 355 | ||||||||||||
| Other current non-financial liabilities | 26,065 | 27,729 | 3,936 | 1,071 | ||||||||||||
| Brazilian real | 1,539 | - | 663 | 1,041 | ||||||||||||
| Other currency | 24,526 | 27,729 | 3,273 | 30 | ||||||||||||
| Total current liabilities | 324,170 | 323,891 | 35,692 | 130,376 | ||||||||||||
| Chilean peso | 95,057 | 97,424 | 9,931 | 123,295 | ||||||||||||
| Euro | 10,041 | 9,438 | 102 | 14 | ||||||||||||
| Argentine peso | 26,583 | 43,454 | 3,613 | 4,927 | ||||||||||||
| Brazilian real | 36,626 | 24,627 | 2,811 | 1,041 | ||||||||||||
| Other currency | 155,863 | 148,948 | 19,235 | 1,099 | ||||||||||||
109
| More than 1 to 3 years | More than 3 to 5 years | More than 5 years | ||||||||||||||||||||||
| As of | As of | As of | As of | As of | As of | |||||||||||||||||||
| September 30, | December 31, | September 30, | December 31, | September 30, | December 31, | |||||||||||||||||||
| 2011 | 2010 | 2011 | 2010 | 2011 | 2010 | |||||||||||||||||||
| ThUS$ | ThUS$ | ThUS$ | ThUS$ | ThUS$ | ThUS$ | |||||||||||||||||||
| Non-current liabilities | ||||||||||||||||||||||||
| Other non-current financial liabilities | - | 61,477 | - | - | - | - | ||||||||||||||||||
| Chilean peso | - | 61,477 | - | - | - | - | ||||||||||||||||||
| Other non-current accounts payable | 7,328 | 7,696 | 71 | 71 | 7 | 5 | ||||||||||||||||||
| Chilean peso | 6,297 | 6,721 | 77 | 71 | 9 | 5 | ||||||||||||||||||
| Other currency | 1,031 | 975 | - | - | - | - | ||||||||||||||||||
| Other long-term provisions | 12,719 | - | - | 1,554 | - | - | ||||||||||||||||||
| Brazilian real | 1,681 | - | - | 1,401 | - | - | ||||||||||||||||||
| Other currency | 11,038 | - | - | 153 | - | - | ||||||||||||||||||
Non-current provisions for employee benefits | 4,257 | 3,153 | 935 | - | 863 | 698 | ||||||||||||||||||
| Argentine peso | - | - | 935 | - | - | 698 | ||||||||||||||||||
| Other currency | 4,257 | 3,153 | - | - | - | - | ||||||||||||||||||
| Total non-current liabilities | 24,304 | 72,326 | 1,012 | 1,625 | 9 | 703 | ||||||||||||||||||
| Chilean peso | 6,297 | 68,198 | 77 | 71 | 9 | 5 | ||||||||||||||||||
| Argentine peso | - | - | 935 | - | - | 698 | ||||||||||||||||||
| Brazilian real | 1,681 | - | - | 1,401 | - | - | ||||||||||||||||||
| Other currency | 16,326 | 4,128 | - | 153 | - | - | ||||||||||||||||||
110
| As of | As of | |||||||
| September 30, | December 31, | |||||||
| 2011 | 2010 | |||||||
| ThUS$ | ThUS$ | |||||||
General summary of foreign currency: | ||||||||
| Total assets | 450,120 | 678,977 | ||||||
| Chilean peso | 152,397 | 423,496 | ||||||
| Euro | 15,606 | 16,273 | ||||||
| Argentine peso | 73,237 | 34,509 | ||||||
| Brazilian real | 57,734 | 49,650 | ||||||
| Mexican peso | 16,626 | 17,477 | ||||||
| Australian dollar | 7,740 | 12,456 | ||||||
| Other currency | 126,780 | 125,116 | ||||||
| Total liabilities | 385,187 | 528,921 | ||||||
| Chilean peso | 111,371 | 288,993 | ||||||
| Euro | 10,143 | 9,452 | ||||||
| Argentine peso | 31,131 | 49,079 | ||||||
| Brazilian real | 41,118 | 27,069 | ||||||
| Other currency | 191,424 | 154,328 | ||||||
| Net position | 64,933 | 150,056 | ||||||
| Chilean peso | 41,026 | 134,503 | ||||||
| Euro | 5,463 | 6,821 | ||||||
| Argentine peso | 42,106 | (14,570 | ) | |||||
| Brazilian real | 16,616 | 22,581 | ||||||
| Mexican peso | 16,626 | 17,477 | ||||||
| Australian dollar | 7,740 | 12,456 | ||||||
| Other currency | (64,644 | ) | (29,212 | ) | ||||
111
b) Exchange differences
Exchange rate differences recognized in income, other than those relating to financial instruments at fair value through profit and loss, accumulated at September 30, 2011 and 2010 generated a gain of ThUS$ 6,184 and ThUS$ 6,731, respectively. In the third quarter of 2011 and 2010 a charge of ThUS$ 1,927 and a gain of ThUS$ 9,117 were represented, respectively.
Exchange rate differences shown in equity as translation reserves for the nine months ended September 30, 2011 and 2010 represented a charge of ThUS$ 9,507 and ThUS$ 150, respectively. In the third quarter of 2011 and 2010 a charge of ThUS$ 610 and a gain of ThUS$ 2,619 were represented, respectively.
The following shows the current exchange rates for the US dollar at the end of each period:
| As of | As of | |||||||
| September 30, | December 31, | |||||||
| 2011 | 2010 | |||||||
| Chilean peso | 521.76 | 468.01 | ||||||
| Argentine peso | 4.20 | 3.97 | ||||||
| Brazilian real | 1.88 | 1.66 | ||||||
| Peruvian Sol | 2.77 | 2.81 | ||||||
| Australian dollar | 1.03 | 0.99 | ||||||
| Strong Bolivar | 4.30 | 4.30 | ||||||
| Boliviano | 6.87 | 6.94 | ||||||
| Uruguayan peso | 19.75 | 19.80 | ||||||
| Mexican peso | 13.88 | 12.38 | ||||||
| Colombian peso | 1,930.50 | 1,905.10 | ||||||
| New Zealand dollar | 1.31 | 1.30 | ||||||
| Euro | 0.74 | 0.75 | ||||||
112
NOTE 32 - EARNINGS PER SHARE
| For the nine months ended | For the three months ended | |||||||||||||||
| September 30, | September 30, | |||||||||||||||
| Basic earnings | 2011 | 2010 | 2011 | 2010 | ||||||||||||
| Earnings attributable to controlling company’s equity holders (ThUS$) | 207,697 | 255,143 | 94,513 | 106,214 | ||||||||||||
| Weighted average number of shares, basic | 339,272,376 | 338,790,909 | 339,342,209 | 338,790,909 | ||||||||||||
| Basic earnings per share (US$) | 0.61218 | 0.75310 | 0.27852 | 0.31351 | ||||||||||||
| For the nine months ended | For the three months ended | |||||||||||||||
| September 30, | September 30, | |||||||||||||||
| Diluted earnings | 2011 | 2010 | 2011 | 2010 | ||||||||||||
| Earnings attributable to controlling company’s equity holders (ThUS$) | 207,697 | 255,143 | 94,513 | 106,214 | ||||||||||||
| Weighted average number of shares, basic | 339,272,376 | 338,790,909 | 339,342,209 | 338,790,909 | ||||||||||||
| Adjustment diluted weighted average shares Stock options | 664,964 | 780,688 | 606,621 | 900,772 | ||||||||||||
| Weighted average number of shares, diluted | 339,937,340 | 339,571,597 | 339,948,830 | 339,691,681 | ||||||||||||
| Diluted earnings per share (US$) | 0.61099 | 0.75137 | 0.27802 | 0.31268 | ||||||||||||
113
NOTE 33 - CONTINGENCIES
a) Lawsuits
a1) Actions brought by Lan Airlines S.A. and Subsidiaries.
| Stage and level | Amounts | |||||||||
| Company | Court | Case No. | Origin | of proceeding | involved | |||||
| ThUS$ | ||||||||||
| Atlantic Aviation Investments LLC (AAI) | Supreme Court of the State of New York County of New York | 07-6022920 | Atlantic Aviation Investments LLC., an indirect subsidiary of Lan Airlines S.A. constituted under the laws of the state of Delaware, sued Varig Logística S.A. (“Variglog”) for the non-payment of four loans under loan agreements governed by the law of New York. These agreements provide for the acceleration of the loans in the event of sale of the original debtor, VRG Linhas Aéreas S.A. | Stage of execution in Switzerland of judgment condemning Variglog to repay the principal, interest and costs in favor of AAI. An embargo is held over the bank account of Variglog in Switzerland by AAI. Variglog is in the process of judicial recovery in Brazil and requested on Switzerland to recognize the judgment that declared the state of judicial recovery. | 17,100 plus interest and costs | |||||
| Atlantic Aviation Investments LLC | Supreme Court of the State of New York, County of New York | 602286-09 | Atlantic Aviation Investments LLC. sued Matlin Patterson Global Advisers LLC, Matlin Patterson Global Opportunities Partners II LP, Matlin Patterson Global Opportunities Partners (Cayman) II LP and Volo Logistics LLC (a) as representative for Variglog, for failure to pay the four loans indicated in the previous note; and (b) for a default on their obligations of guarantors and other obligations under the Memorandum of Understanding signed by the parties on September 29, 2006. | The court dismissed in part and upheld in part the motion to dismiss counterclaims brought by defendants in the case. Both parties appealed this decision. AAI filed a request for summary Judgement (short trial) that the court ruled favorably. The defendants appealed from this decision that was granted suspensive effect. | 17,100 plus interest costs and damages |
114
| Stage and level | Amounts | |||||||||
| Company | Court | Case No. | Origin | of proceeding | involved | |||||
| ThUS$ | ||||||||||
| Aerolane, Líneas Aéreas Nacionales del Ecuador S.A. | Tax Court of Guayaquil | 6319-4064-05 | Against the regional director of the Guayaquil Internal Revenue Service for overpayment of VAT . | Favorable sentence at first intance, appeal pending against them. | 4,210 | |||||
| Lan Airlines S.A. | Tax Tribunal of Quito | 23493-A | Against the regional director of the Quito Internal Revenue Service for overpayment of VAT . | Requested sentence. | 3,958 | |||||
| Lan Perú S.A. | Administrative Tribunal of Perú | 2011 | Lan Peru is suing L.A.P. for wrong amounts charged by the use of hoses at the airport in Lima. These amounts are intended to supplement what has already been obtained in a ruling that ordered Ositran LAP wrong amounts charged back. | First intances. | 740 | |||||
| Aerotransportes Mas de Carga S.A. de C.V. | Federal Court of Fiscal and Administrative Justice | 24611/08 | Judgement of invalidity against the tax authority's refusal to restore a balance in favor of VAT . | At the stage of offer of proof. | 1,000 |
115
| Stage and level | Amounts | |||||||||
| Company | Court | Case No. | Origin | of proceeding | involved | |||||
| ThUS$ | ||||||||||
| Aerolane, Líneas Aéreas Nacionales del Ecuador S.A. | Distric Tax Court No. 2 (Guayaquil) | 09504-2010-0114 | Against the regional director of the Guayaquil Internal Revenue Service to determine tax credit decreased for the year 2006. | Test | 4,565 | |||||
| Aerolane, Líneas Aéreas Nacionales del Ecuador S.A. | Distric Tax Court No. 2 (Guayaquil) | 09503-2010-0172 | Against the regional director of the Guayaquil Internal Revenue Service for non- payment of advance income tax, 2010. | Calling for evidence | 696 | |||||
| Aerolane, Líneas Aéreas Nacionales del Ecuador S.A. | Distric Tax Court No. 2 (Guayaquil) | 6886-4499-06 | Against the regional director of the Guayaquil Internal Revenue Service for rectification of tax return for 2003. | Sentence pending. | Undetermined | |||||
| Aerovías de Integración Regional S.A. AIRES S.A. | Section One, Subsection A, the Administrative Tribunal of Cundinamarca | AEROVIAS DE INTEGRACION REGIONAL S.A AIRES S.A. seeks that Act 043 Session of October 20, 2008 of Grupo Evaluador de Proyectos Aerocomerciales GEPA be declared invalid. This relates to the decision of the Director of the UAEAC and Enrique Olaya Herrera airport in Medellin to order the suspension of operations of the company to and from that airport. | On June 17, 2010 a decree was issued by which evidence was presented, the status of which was notified on June 22 of that year. On March 8, 2011 the preliminary stages were completed. On July 6, 2011 per state order, Aerocivil was ordered to pay the fees of the expert witness. An appeal was registered against this judgement on July 22. | US$ 2,032,624. The estimated amount of damages that were caused to AIRES SA as a result of the suspension of operations at the Enrique Olaya Herrera airport |
116
a2) Lawsuits against Lan Airlines S.A. and Subsidiaries
| Stage and level | Amounts | |||||||||
| Company | Court | Cause No. | Origin | of proceeding | involved | |||||
| ThUS$ | ||||||||||
| Aerolinhas Brasileiras S.A. | Secretary of Finance of State of Río de Janeiro | 2003 | The administrative authority of Río de Janeiro, Brazil, notified breach action or fine for alleged non-payment of ICMS (VAT) on import of Boeing-767 aircraft registered No. PR-ABB. | Pending resolution of the review group to annul the fine. | 3,000 | |||||
| Lan Cargo S.A. | Civil Court of Asunción, Paraguay | 78-362 | Request of indemnification for damages brought by the prior general agent in Paraguay. | Pending appeal of the decision to reject one of the exceptions to lack of overt action, made by lawyers for the defendant. | 437 | |||||
| Lan Airlines S.A. y Lan Cargo S.A. | European commission | - | Investigation of possible breaches of free competition of cargo airlines, especially the fuel surcharge. | On 14 April 2008, the Company answered the European Commission's notification. | 11,038 | |||||
| On December 26, 2007, the Director General for Competition of the European Commission notified Lan Cargo S.A.and Lan Airlines S.A. of the instruction of a process against twenty-five cargo airlines, including Lan Cargo S.A., for alleged breaches of free competition in the European air cargo market, especially the intended fixing of a surcharge for fuel and cargo. Dated November 09, 2010 the Direction General for Competition of the European Commission notified Lan Cargo S.A. and Lan Airlines S.A. the imposition of fines in the amount of ThUS$ 11,038. This fine is being appealed by Lan Cargo SA and Lan Airlines S.A. We can not predict the outcome of the appeal process. | The appeal was presented on January 24, 2011. |
117
| Stage and level | Amounts | |||||||||
| Company | Court | Case No. | Origin | of proceeding | involved | |||||
| ThUS$ | ||||||||||
| Lan Airlines S.A. and Lan Cargo S.A. | Competition Bureau Canada | - | Investigation for possible infractions of competition from airlines cargo flights, especially fuel surcharges. | Investigation pending. | Undetermined | |||||
| Lan Cargo S.A. and Lan Airlines S.A. | Canada- Superior Court of Quebec, Supreme Court of British Columbia, Superior Court of Ontario | - | For class actions, as a result of the investigation for possible breaches of competition from airlines cargo flights, especially fuel surcharges. They have filed three lawsuits in Canada (Quebec, British Columbia and Ontario). | Case is in the process of discovery and class certification tests. | Undetermined | |||||
| Lan Cargo S.A. and Lan Airlines S.A. | In the High Court of Justice Chancery Division (England) and Directie Juridische Zaken Afdeling Ceveil Recht (Netherlands). | - | Lawsuit filed against European Airlines by users of freight services in private prosecutions as a consequence of the investigation into alleged breaches of free competition of cargo airlines, especially fuel surcharges. Lan Airlines S.A. and Lan Cargo S.A. have been third- party defendants in such prosecutions in England and the Netherlands. | Case is in the process of discovery tests. | Undetermined | |||||
| Lan Logistics, Corp. | Federal Court, Florida, U.S.A. | - | In mid June 2008 a demand was presented for purchase option right for sale of LanBox. | Failed against Lanlogistics, Corp. for $ 5 million plus interest, which is appealing to the court of appeals. | Undetermined |
118
| Stage and level | Amounts | |||||||||
| Company | Court | Case No. | Origin | of proceeding | involved | |||||
| ThUS$ | ||||||||||
| Aerolinhas Brasileiras S.A. | Conselho Administrativo de Defesa Econômica, Brasil | - | Investigation of alleged breaches of free competition of cargo airlines, especially fuel surcharges. | Investigation pending. CADE and Federal Attorney not yet issued final decisions. | Undetermined | |||||
| Lan Airlines S.A. "Brazil" | Instituto de Defesa do Consumidor de Sao Paulo | - | The Department of Consumer Protection and Defense ("PROCON") has applied a fine to Lan Airlines S.A. in the amount of R$ 1,688,240 equivalent to approximately ThUS$ 896. This penalty relates to the cancellation of flights to Chile as a product of the 2010 earthquake, holding that Lan Airlines S.A. did not act in accordance with the rules applicable to the facilities and offered no compensation to passengers who could not travel as a result of this extraordinary circumstance. | Fine imposed by the consumer entity Sao Paulo. | 896 | |||||
| Lan Perú S.A. | Administrative Tribunal of Peru | 2011 | LAP (Lima Airport concession) is questioning before an administrative tribunal's decision to the administrative authority Ositran, which in due course LAP stated that it had to give certain amounts uncollected by Lan Peru for the use of hoses in the Lima Airport. | First instance. | 2,109 | |||||
| Lan Cargo S.A | Tribunal of Arbitration, Frankfurt/ Germany | Aerohandling Airport Assistance GmbH (Handling company in Frankfurt/ Airport) is claiming additional payment for Lan Cargo S.A. services offered over the years 2007 to 2010. | Single instance. | 820 |
Considering the stage of process for each of the cases mentioned above and/or the improbable event of obtaining an adverse sentence, as of September 30, 2011 the Company has estimated that is not necessary to make a provision for any case, with the exception of the significant matter relating to the European Commission which was reported to the SVS. A provision of US$ 11 million has been recorded for the decision issued by the European Commission on November 9, 2010.
On May 6 2011, the Directors of Lan Cargo S.A. and Aerolinhas Brasileiras S.A. approved a judicial agreement with the defenders of the civil class action case that was in process before the United States District Court for the Eastern District of New York. From the agreement, Lan Cargo S.A. and Aerolinhas Brasileiras S.A. committed to pay the amount of US$ 59.7 million and US$ 6.3 million, respectively, payments that were already made as of September 30, 2011. This agreement terminates the companies´ obligations with regards to all plaintiffs who will not choose to file a suit in an individual capacity against the companies. The terms of the judgment have not yet been set for the plaintiffs who are considering opting for a separate suit.
119
NOTE 34 - COMMITMENTS
(a) Loan covenants
With respect to various loans signed by the Company for the financing of Boeing 767 aircraft, which carry the guarantee of the United States Export–Import Bank, limits have been set on some of the parent company’s financial indicators on a consolidated basis. Moreover, and related to these same contracts, restrictions are also in place on the Company’s management in terms of its ownership and disposal of assets.
Additionally, with respect to various loans signed by its subsidiary Lan Cargo S.A. for the financing of Boeing 767 aircraft, which carry the guarantee of the United States Export–Import Bank, restrictions have been established to the Company´s management and its subsidiary Lan Cargo S.A. in terms of shareholder composition and disposal of assets.
Regarding the various contracts of the Company for the financing of Airbus A320 aircraft, which are guaranteed by the European Export Credit Agencies, limits have been established on some of the Company’s financial indicators. Moreover, and related to these same contracts, restrictions are also in place on the Company’s management in terms of its ownership and disposal of assets.
In connection with the financing of spare engines for its fleet Boeing 767 and 777, which are guaranteed by the Export - Import Bank of the United States, restrictions have been placed on the shareholding of its guarantors and their legal successor in case of merger.
In relation to credit agreements entered into by the Company, for the present period local banks have set limits to some financial indicators of the parent company on a consolidated basis.
At September 30, 2011, the Company is in compliance with these covenants.
120
(b) Commitments under operating leases as lessee
Details of the main operating leases are as follows:
| As of | As of | |||||||||
| September 30, | December 31, | |||||||||
| Lessor | Aircraft | 2011 | 2010 | |||||||
| Delaware Trust Company, National Association (CRAFT) | Bombardier Dhc8-200 | 9 | 9 | |||||||
| International Lease Finance Corp. (ILFC) | Boeing 767 | 1 | 8 | |||||||
| KN Operating Limited (NAC) | Bombardier Dhc8-400 | 4 | 4 | |||||||
| Orix Aviation Systems Limited | Airbus A320 | 2 | 2 | |||||||
| Pembroke B737-7006 Leasing Limited | Boeing 737 | 2 | 2 | |||||||
| International Lease Finance Corp. (ILFC) | Boeing 737 | 2 | 2 | |||||||
| Sunflower Aircraft Leasing Limited - AerCap | Airbus A320 | 2 | 2 | |||||||
| Celestial Aviation Trading 35 Ltd. (GECAS) | Boeing 767 | 1 | 1 | |||||||
| MSN 167 Leasing Limited | Airbus A340 | 1 | 1 | |||||||
| Celestial Aviation Trading 16 Ltd. GECAS (WFBN) | Boeing 767 | 1 | 1 | |||||||
| CIT Aerospace International | Boeing 767 | 1 | 1 | |||||||
| Celestial Aviation Trading 39 Ltd. GECAS (WFBN) | Boeing 777 | 1 | 1 | |||||||
| Celestial Aviation Trading 23 Ltd. GECAS (WFBN) | Boeing 777 | 1 | 1 | |||||||
| Celestial Aviation Trading 47 Ltd. GECAS (WFBN) | Boeing 767 | 1 | 1 | |||||||
| Celestial Aviation Trading 51 Ltd. GECAS (WFBN) | Boeing 767 | 1 | 1 | |||||||
| Celestial Aviation Trading 48 Ltd. GECAS (WFBN) | Boeing 767 | 1 | - | |||||||
| AerCap (WFBN) | Airbus A320 | - | 1 | |||||||
| BOC Aviation Pte. Ltd. | Airbus A320 | 1 | - | |||||||
| MSN 32415, LLC - AWAS | Boeing 737 | 1 | 1 | |||||||
| JB 30244, Inc. - AWAS | Boeing 737 | 1 | 1 | |||||||
| NorthStar AvLease Ltd. | Bombardier Dhc8-200 | 1 | 1 | |||||||
| JB 30249, Inc. - AWAS | Boeing 737 | 1 | 1 | |||||||
| TIC Trust (AVM AX) | Bombardier Dhc 8-200 | - | 1 | |||||||
| ACS Aircraft Finance Bermuda Ltd. - Aircastle (WFBN) | Boeing 737 | 1 | 1 | |||||||
| MCAP Europe Limited - Mitsubishi (WTC) | Boeing 737 | 1 | 1 | |||||||
| Avolon Aerospace AOE 6 Limited | Airbus A320 | 1 | - | |||||||
| AWAS 4839 Trust | Airbus A320 | 1 | - | |||||||
| Avolon Aerospace AOE 19 Limited | Airbus A320 | 1 | - | |||||||
| Avolon Aerospace AOE 20 Limited | Airbus A320 | 1 | - | |||||||
| Aircraft 76B-27613 Inc. (ILFC) | Boeing 767 | 1 | - | |||||||
| Aircraft 76B-26327 Inc. (ILFC) | Boeing 767 | 1 | - | |||||||
| Aircraft 76B-27597 Inc. (ILFC) | Boeing 767 | 1 | - | |||||||
| Aircraft 76B-26261 Inc. (ILFC) | Boeing 767 | 1 | - | |||||||
| Aircraft 76B-28206 Inc. (ILFC) | Boeing 767 | 1 | - | |||||||
| Aircraft 76B-26329 Inc. (ILFC) | Boeing 767 | 1 | - | |||||||
| Aircraft 76B-27615 Inc. (ILFC) | Boeing 767 | 1 | - | |||||||
| Total | 49 | 45 | ||||||||
The rentals are shown in results for the period as they are incurred.
121
The minimum future lease payments not yet payable are the following:
| As of | As of | |||||||
| September 30, | December 31, | |||||||
| 2011 | 2010 | |||||||
| ThUS$ | ThUS$ | |||||||
| Up to a year | 171,672 | 151,781 | ||||||
| More than one year and up to five years | 467,339 | 440,632 | ||||||
| More than five years | 110,154 | 107,593 | ||||||
| Total | 749,165 | 700,006 | ||||||
The minimum lease payments charged to income are the following:
| For the periods ended | ||||||||
| September 30, | ||||||||
| 2011 | 2010 | |||||||
| ThUS$ | ThUS$ | |||||||
| Minimum operating lease payments (*) | 125,065 | 67,598 | ||||||
| Total | 125,065 | 67,598 | ||||||
In September 2010, the Company added one Airbus A320-200 aircraft for a period of eight months, the latter finally returned in May 2011. Additionally, in November and December 2010, the Company added two Boeing 767-300F aircraft, with terms of contract for seven and six years respectively.
In January 2011 the Company added to the fleet three aircraft, a Boeing 767-300F with a contract term of five years, one Airbus A320-200 for periods of seven years and one Airbus A319-100 for a period of four months which was returned in May 2011. In July 2011 the Company added two Airbus A320-200 aircrafts for a period of eight years, while in August and September 2011, the Company received an Airbus A320-200 aircraft for a period of eight years. Moreover, in September 2011 an Bombardier Dash 8-200 aircraft was returned due to termination of the lease term.
(*) At September 30, 2011, includes an amount of ThUS$ 34,111 as a result of the incorporation of AIRES S.A. as a subsidiary from December 2010.
The operating lease agreements signed by the Company and its subsidiaries state that maintenance of the aircraft should be done according to the manufacturer’s technical instructions and within the margins agreed in the leasing agreements, a cost that must be assumed by the lessee. The lessee should also contract insurance for each aircraft to cover associated risks and the amounts of these assets. Regarding rental payments, these are unrestricted and may not be netted against other accounts receivable or payable between the lessor and lessee.
122
(c) Oher commitments
At September 30, 2011 the Company has existing letters of credit, guarantee ballots and guarantee insurance policies as follows:
| Value | Release | ||||||||
| Creditor Guarantee | Debtor | Type | ThUS$ | date | |||||
| Deutsche Bank A.G. | Lan Airlines S.A. | Two letters of credit | 20,000 | 31/01/2012 | |||||
| The Royal Bank of Scotland plc | Lan Airlines S.A | Two letters of credit | 18,000 | 08/01/2012 | |||||
| European Commission | Lan Airlines S.A | One letters of credit | 11,343 | 18/02/2012 | |||||
| Dirección General de Aviación Civil de Chile | Lan Airlines S.A. | Fifty-six guarantee ballots | 6,245 | 31/10/2011 | |||||
| Washington International Insurance | Lan Airlines S.A. | Seven letter of credit | 3,040 | 10/12/2011 | |||||
| Dirección Seccional de Aduanas de Bogota | Línea Aérea Carguera de Colombia S.A. | Two guarantee insurance policies | 2,702 | 07/04/2014 | |||||
| Metropolitan Dade County | Lan Airlines S.A. | Five letters of credit | 1,675 | 31/05/2012 | |||||
123
NOTE 35 – TRANSACTIONS WITH RELATED PARTIES
| a) | Transactions with related parties for the period ended September 30, 2011 |
| Country | Other information on | Amount of | ||||||||||||||
| Tax No. | Related parties | Relationship | of origin | related party | Transaction | Currency | transactions | |||||||||
| ThUS$ | ||||||||||||||||
| 96.810.370-9 | Inversiones Costa | Controlling | Chile | Investments | Property rental granted | CLP | 52 | |||||||||
| Verde Ltda. y CPA | shareholder | Passenger services provided | CLP | 12 | ||||||||||||
| 96.847.880-K | Lufthansa Lan Technical | Associate | Chile | Training center | Building rental granted | CLP | 12 | |||||||||
| Training S.A. | Assignment of debt granted | CLP | 12 | |||||||||||||
| Other prepayments received | CLP | (268 | ) | |||||||||||||
| Training received | CLP | (104 | ) | |||||||||||||
| Other prepayments received | US$ | (82 | ) | |||||||||||||
| Training received | US$ | (227 | ) | |||||||||||||
| 78.591.370-1 | Bethia S.A. y Filiales (1) | Other related | Chile | Investments | Cession of rights | CLP | 4,461 | |||||||||
| parties | Property rental granted | CLP | 187 | |||||||||||||
| Professional advice granted | CLP | 108 | ||||||||||||||
| Transport services provided | CLP | 470 | ||||||||||||||
| Other prepayments received | CLP | (212 | ) | |||||||||||||
| Sale of subsidiary | US$ | 53,386 | ||||||||||||||
| 87.752.000-5 | Granja Marina | Other related | Chile | Fish farming | Passenger services provided | CLP | 150 | |||||||||
| Tornagaleones S.A. | parties | |||||||||||||||
| Foreign | Inversora Aeronáutica | Other related | Argentina | Investments | Building rental received | US$ | (310 | ) | ||||||||
| Argentina | parties | |||||||||||||||
(1) On April 06, 2011 Lan Cargo S.A. e Inversiones Lan S.A., subsidiaries of Lan Airlines S.A. as sellers, and Servicios de Transporte Limitada and Inversiones Betmin SpA, subsidiaries of Bethia S.A. company, as purchasers, entered into a contract of sale compared to 100% the social capital of societies Blue Express Intl Ltda. and Blue Express S.A. The sale value of Blue Express Intl. Ltda and subsidiary was for ThUS $ 53,386.
124
| b) | Transactions with related parties for the period ended December 31, 2010 |
| Country | Other information on | Amount of | ||||||||||||||
| Tax No. | Related parties | Relationship | of origin | related party | Transaction | Currency | transactions | |||||||||
| ThUS$ | ||||||||||||||||
| 96.810.370-9 | Inversiones Costa | Controlling | Chile | Investments | Property rental granted | CLP | 39 | |||||||||
| Verde Ltda. y CPA | shareholder | Passenger services provided | CLP | 7 | ||||||||||||
| 96.847.880-K | Lufthansa Lan Technical | Associate | Chile | Training center | Building rental granted | CLP | 13 | |||||||||
| Training S.A. | Assignment of debt granted | CLP | 13 | |||||||||||||
| Other prepayments received | CLP | (328 | ) | |||||||||||||
| Other prepayments received | US$ | (25 | ) | |||||||||||||
| Training received | US$ | (208 | ) | |||||||||||||
| 96.921.070-3 | Austral Sociedad | Associate | Chile | Concessionaire | Aviation rates received | CLP | (35 | ) | ||||||||
| Concesionaria S.A. | Basic consumptions received | CLP | (8 | ) | ||||||||||||
| Aeronautical concession received | CLP | (153 | ) | |||||||||||||
| Dividend distribution | CLP | 73 | ||||||||||||||
| 87.752.000-5 | Granja Marina | Other related | Chile | Fish farming | Passenger services provided | CLP | 39 | |||||||||
| Tornagaleones S.A. | parties | |||||||||||||||
| 96.669.520-K | Red de Televisión | Other related | Chile | Television | Passenger services provided | CLP | 65 | |||||||||
| Chilevisión S.A. | parties | Publicity services received | CLP | (100 | ) | |||||||||||
| 96.894.180-1 | Bancard Inversiones Ltda. | Other related | Chile | Professional advice | Professional advice received | CLP | (7 | ) | ||||||||
| parties | ||||||||||||||||
| Foreign | Inversora Aeronáutica | Other related | Argentina | Investments | Building rental received | US$ | (237 | ) | ||||||||
| Argentina | parties | Other services provided | US$ | 13 | ||||||||||||
125
c) Compensation of key management
The Company has defined for these purposes that key management personnel are the executives who define the Company’s policies and major guidelines and who directly affect the results of the business, considering the levels of vice-presidents, chief executives and directors.
| For the nine months ended | For the three months ended | |||||||||||||||
| September 30, | September 30, | |||||||||||||||
| 2011 | 2010 | 2011 | 2010 | |||||||||||||
| ThUS$ | ThUS$ | ThUS$ | ThUS$ | |||||||||||||
| Remuneration | 7,061 | 5,456 | 2,532 | 1,980 | ||||||||||||
| Management fees | 141 | 104 | 47 | 44 | ||||||||||||
| Corrections of value and non-monetary benefits | 587 | 258 | 393 | 90 | ||||||||||||
| Short-term benefits | 4,861 | 4,134 | 7 | 715 | ||||||||||||
| Share-based payments | 1,901 | 2,669 | 564 | 1,217 | ||||||||||||
| Total | 14,551 | 12,621 | 3,543 | 4,046 | ||||||||||||
126
NOTE 36 - SHARE-BASED PAYMENTS
The compensation plans implemented through the granting of options to subscribe and pay for shares, which have been granted since the last quarter of 2007, are shown in the consolidated statements of financial position in accordance with IFRS 2 “Share-based payments”, booking the effect of the fair value of the options granted as a charge to remuneration on a straight-line basis between the date of granting the options and the date on which these become vested.
During the last quarter of 2009, the original terms of the plan were amended regarding subscription and payment options. These modifications were carried out during the first quarter of 2010 and established a new term and exercise price.
The original grant and subsequent amendments have been formalized through the signing of option contracts for the subscription of shares according to the proportions shown in the accrual schedule and which are related to the permanence of the executive on those dates for exercising the options:
| Percentage | Period | ||
| 30% | From October 29, 2010 until December 31, 2011 | ||
| 70% | From October 30, 2011 until December 31, 2011 |
These options have been valued and booked at their fair value on the grant date, determined using the “Black-Scholes-Merton” method.
All options expire on December 31, 2011.
| Number of share | ||||
| options | ||||
| Stock options under a share-based payment agreement balance as of January 1, 2011 | 2,209,091 | |||
| Stock options granted | - | |||
| Stock options annulled | - | |||
| Stock options exercised | (567,300 | ) | ||
| Stock options under a share-based payment agreement balance as of September 30, 2011 | 1,641,791 | |||
Entry data for valuation model of options used for stock options conceded during the period.
| Weighted average | Exercise | Expected | Life of | Dividends | Risk-free | |||||||||||||||
| share price | price | volatility | option | expected | interest | |||||||||||||||
| $ | US 17.3 | $ | US 14.5 | 33.20 | % | 1.9 years | 50 | % | 0.0348 | |||||||||||
127
NOTE 37 - THE ENVIRONMENT
In accordance with the General Environment Bases Law issued in Chile and its complementary regulations, there are no provisions that affect the operation of air transport services.
128
NOTE 38 – SUBSEQUENT EVENTS
The consolidated financial statements of Lan Airlines S.A. and Subsidiaries as of September 30, 2011 have been approved in extraordinary session of the Board *****, 2011, which was attended by the following directors:
| 1. | Jorge Awad Mehech, |
| 2. | Darío Calderón González, |
| 3. | José Cox Donoso, |
| 4. | Juan José Cueto Plaza, |
| 5. | Juan José Cueto Sierra, |
| 6. | Ramón Eblen Kadis, |
| 7. | Bernardo Fontaine Talavera, |
| 8. | Carlos Alberto Heller Solari, and |
| 9. | Juan Gerardo Jofré Miranda. |
Chilean Airline PAL abandons its rejection of the merger between LAN and TAM
As a result of analyzing the complaint lodged by LAN with the Supreme Court and confirming that the objections of LAN only partially affect the mitigation measures, PAL believes that the merger is in compliance with Chilean Law No211 and adequately maintains free competition.
LAN agreed to reimburse PAL for the costs incurred by PAL during the consultation process and its Supreme Court complaint and PAL agreed to retract all the objections lodged by it against the merger in both Chile and Brazil.
The approval of the CADE in Brazil is the next regulatory step in the forming of the LATAM group.
Except as mentioned above, subsequent to September 30, 2011 until the date of issuance of these financial statements, the Company has no knowledge of any other subsequent events that may significantly affect the balances or their interpretation.
129
NOTE 39 – BUSINESS COMBINATIONS
a) Aerovías de Integración Regional, AIRES S.A.
On November 26, 2010 Lan Pax Group S.A., a subsidiary of Lan Airlines S.A., acquired 98.942% of the Colombian company Aerovías de Integración Regional, AIRES S.A.
This acquisition was made through the purchase of 100% of the shares of the Panamanian corporations AKEMI Holdings S.A. and SAIPAN Holding S.A., which owned the aforementioned percentage of AIRES S.A. The purchase price was ThUS$ 12,000.
Aerovías de Integración Regional, AIRES S.A., founded in 1980, at the date of acquisition is the second largest operator within the Colombian domestic market with a market share of 22%. AIRES S.A. offers regular service to 27 domestic destinations within Colombia as well as 3 international destinations. Synergies are expected between the combination of AIRES S.A. in the Colombian market and efficiency of the business model of LAN Airlines S.A. Additionally, better performance is expected by the business of Lan Airlines S.A. (passengers and cargo) through an increase in coverage in Latin America.
The Company has measured the non-controlling interest in AIRES S.A. using the proportionate share of the non-controlling interest in net identifiable assets acquired.
The business combination is recognized in the statement of financial position of Lan Airlines S.A. and Subsidiaries as goodwill of ThUS$ 94,224.
Summary statement of financial position at acquisition date:
| ThUS$ | ThUS$ | ||||||||
| Current assets | 27,315 | Current liabilities | 125,193 | ||||||
| Non-current assets | 31,652 | Non-current liabilities | 20,327 | ||||||
| Equity | (86,553 | ) | |||||||
| Total assets | 58,967 | Total liabilities | 58,967 | ||||||
| Controlling interest | (82,224 | ) | |||||||
| Goodwill determination | |||||||||
| ThUS$ | |||||||||
| Controlling interest | 82,224 | ||||||||
| Purchase price | 12,000 | ||||||||
| Goodwill | 94,224 | ||||||||
In accordance with IFRS 3, the determined value of goodwill is provisional.
130
b) AEROASIS S.A.
Dated February 15, 2011, Lan Pax Group S.A. subsidiary of Lan Airlines S.A. acquired 100% of Colombian society AEROASIS S.A. The purchase price was ThUS$ 3,541.
AEROASIS S.A. is a corporation incorporated under the laws of the Republic of Colombia through Public Deed No. 1206 dated May 02, 2006.
The business combination is recognized in the statement of financial position of Lan Airlines S.A. and Subsidiaries as goodwill of ThUS$ 6,736.
Summary statement of financial position at acquisition date:
| ThUS$ | ThUS$ | ||||||||
| Current assets | 1,802 | Current liabilities | 8,007 | ||||||
| Non-current assets | 3,010 | Non-current liabilities | - | ||||||
| Equity | (3,195 | ) | |||||||
| Total assets | 4,812 | Total liabilities & equity | 4,812 | ||||||
| Controlling interest | (3,195 | ) | |||||||
| Goodwill determination: | |||||||||
| ThUS$ | |||||||||
| Controlling interest | 3,195 | ||||||||
| Purchase price | 3,541 | ||||||||
| Goodwill | 6,736 | ||||||||
In accordance with IFRS 3, the determined value of goodwill is provisional.
131
APPENDIX 3
AUDITED FINANCIAL STATEMENTS OF SISTER HOLDCO S.A. AT SEPTEMBER 30, 2011
SISTER HOLDCO S.A.
Financial statements
September 30, 2011
(A free translation from the original prepared in Spanish)
CONTENTS
| Statement of financial position | 3 |
| Statement of comprehensive income | 4 |
| Statement of cash flows - direct method | 5 |
| Statement of changes in net equity | 6 |
| Notes to the financial statements | 7 |
US$ - US dollars
ThUS$ - Thousands of US dollars
1
REPORT OF THE INDEPENDENT AUDITORS
Santiago, November 9, 2011
To the Shareholders and Directors
Sister Holdco S.A.
(A free translation from the original prepared in Spanish)
We have audited the statement of financial position of Sister Holdco S.A. as of September 30, 2011 and the related statements of comprehensive income, changes in net equity and cash flows for the period between June 28 and September 30, 2011. The preparation of these financial statements (including the notes thereto) is the responsibility of the Sister Holdco S.A.’s management. Our responsibility is to express an opinion on these financial statements, based on our audit.
We conducted our audit in accordance with auditing standards generally accepted in Chile. Those standards require that we plan and perform the audit to obtain reasonable assurance about whether the financial statements are free of material misstatements. An audit includes examining, on a test basis, evidence supporting the amounts and disclosures in the financial statements. An audit also includes assessing the accounting principles used and significant estimates made by management, as well as evaluating the overall financial statement presentation. We believe that our audit provides a reasonable basis of our opinion.
In our opinion, the financial statements referred to above present fairly, in all material respects, the financial position of Sister Holdco S.A. as of September 30, 2011, the comprehensive results of its operations and the cash flows for the period between June 28 and September 30, 2011, in accordance with the International Financial Reporting Standards.
Renzo Corona Spedaliere
RUT: 6.373.028-9
2
SISTER HOLDCO S.A.
STATEMENT OF FINANCIAL POSITION
AS OF SEPTEMBER 30, 2011
(A free translation from the original prepared in Spanish)
| ThUS$ | ||||
ASSETS | ||||
| CURRENT ASSETS | ||||
| Cash & cash equivalents | 0.02 | |||
| Total current assets | 0.02 | |||
| Total assets | 0.02 | |||
| LIABILITIES y SHAREHOLDERS’ EQUITY | ||||
| SHAREHOLDERS’ EQUITY | ||||
| Paid-in capital | 0.02 | |||
| Total shareholders’ equity | 0.02 | |||
| Total liabilities y shareholders’ equity | 0.02 | |||
The accompanying Notes 1 to 8 are an integral part of these financial statements.
3
SISTER HOLDCO S.A.
STATEMENT OF COMPREHENSIVE INCOME
For the period between June 28 and September 30, 2011
(A free translation from the original prepared in Spanish)
| ThUS$ | ||||
| ORDINARY INCOME | ||||
| Gain (Loss) | 0.0 | |||
| Profit (loss) before income tax | 0.0 | |||
| Income tax | 0.0 | |||
| INCOME (LOSS) FOR THE YEAR | 0.0 | |||
| Other comprehensive income | 0.0 | |||
| Comprehensive gain (loss) | 0.0 | |||
| Total other comprehensive income | 0.0 | |||
| Total comprehensive income for the period | 0.0 | |||
The accompanying Notes 1 to 8 are an integral part of these financial statements.
4
SISTER HOLDCO S.A.
STATEMENT OF CASH FLOWS - DIRECT METHOD
For the period between June 28 and September 30, 2011
(A free translation from the original prepared in Spanish)
| ThUS$ | ||||
| CASH FLOWS FROM OPERATING ACTIVITIES | ||||
| Net cash flows from operating activities | 0.00 | |||
| CASH FLOWS FROM INVESTING ACTIVITIES | ||||
| Net cash flows from investing activities | 0.00 | |||
| CASH FLOWS FROM FINANCING ACTIVITIES | ||||
| Net cash flows from financing activities | 0.02 | |||
| Effect of changes in the exchange rate on cash and cash equivalents | 0.00 | |||
| OPENING BALANCE OF CASH AND CASH EQUIVALENTS | 0.00 | |||
| CLOSING BALANCE OF CASH AND CASH EQUIVALENTS | 0.02 | |||
The accompanying Notes 1 to 8 are an integral part of these financial statements.
5
SISTER HOLDCO S.A.
STATEMENT OF CHANGES IN NET EQUITY
For the period between June 28 and September 30, 2011
(A free translation from the original prepared in Spanish)
| Share | Share | Retained | Total | |||||||||||||
| capital | premium | earnings | net equity | |||||||||||||
| ThUS$ | ThUS$ | ThUS$ | ThUS$ | |||||||||||||
| Opening balance as of June 28, 2011 | 0.00 | 0.00 | 0.00 | 0.00 | ||||||||||||
| Changes in Equity | ||||||||||||||||
| Payment of subscribed shares | 0.02 | 0.00 | 0.00 | 0.02 | ||||||||||||
| Income for the period | 0.00 | 0.00 | 0.00 | 0.00 | ||||||||||||
| Closing balance as of September 30, 2011 | 0.02 | 0.00 | 0.00 | 0.02 | ||||||||||||
The accompanying Notes 1 to 8 are an integral part of these financial statements.
6
SISTER HOLDCO S.A.
NOTES TO THE FINANCIAL STATEMENTS
AS OF SEPTEMBER 30, 2011
(A free translation from the original prepared in Spanish)
NOTE 1 – GENERAL INFORMATION
Sister Holdco S.A. (from hereon "the Company") was established in Chile as recorded in public deed on June 28, 2011, under number 13.109-2011, sighted by the Notary Mr. Eduardo Avello Concha, under the name Sister Holdco S.A. The Company is a closely held corporation, entered in the Trade Register of Santiago in page 36,706 Nº 27,949 of year 2011, and advertised in the digital edition of the Official Gazette in its issue number 40,003 of July 6, 2011.
The Company's address is the city of Santiago.
The Company's main business is investing in tangible or intangible goods, either in Chile or abroad.
On June 30, 2011, the Company obtained from the Chilean Internal Revenue Service its Unique Tax Number, 76.153.047-K. According the supporting information filed by the Company, Sister Holdco S.A. has been classified as a first category contributor, and in addition, as a contributor not subject to the Value Added Tax.
On August 11, 2011, through the exempt resolution number 7595, the Regional Metropolitan Direction - East Santiago - of the Chilean Internal Revenue Service, the Company was authorized to maintain its accounting records in US dollars, with exception of purchases and sales ledgers, payroll records and professional fees withholdings ledgers which must be maintained in Chilean Pesos.
As of September 30, 2011, and as of the issue date of these financial statements, the Company has not begun operations.
The present financial statements have been prepared to be presented in the extraordinary shareholders meeting that is set to decide on the merger between Sister Holdco S.A. and Lan Airlines S.A.
NOTE 2 – SUMMARY OF SIGNIFICANT ACCOUNTING POLICIES
2.1 Accounting period
The financial statements herein cover the following periods:
| - | Statement of financial position | Period between June 28 and September 30, 2011 | |
| - | Statement of comprehensive income and Statement of cash flows | Period between June 28 and September 30, 2011 | |
| - | Statement of changes in net equity | Period between June 28 and September 30, 2011 |
7
2.2 Basis of preparation
These financial statements that cover the accounting period between June 28 and September 30, 2011 have been prepared according to the International Financial Reporting Standards (IFRS) as adopted for their use in Chile.
2.2.1 Existing standards that are not effective as of the date of these financial statements
As of the issue date of these financial statements, the following standards are not yet effective.
| Standard | Name | Applicable to financial statement periods beginning on or after: | ||
| Amendment to IAS 1 | Presentation of Financial Statements | July 1, 2012 | ||
| IFRS 9 | Financial Instruments | January 1, 2013 | ||
| IAS 28 reviewed | Investments in associates and joint ventures | January 1, 2013 | ||
| IAS 27 reviewed | Separate financial statements | January 1, 2013 | ||
| IFRS 10 | Consolidated financial statements | January 1, 2013 | ||
| IFRS 11 | Joint arrangements | January 1, 2013 | ||
| IFRS 12 | Disclosure of Interests in Other Entities | January 1, 2013 | ||
| IFRS 13 | Fair Value Measurement | January 1, 2013 | ||
| Amendment to IAS 19 | Employee benefits | January 1, 2013 |
The Company has not elected to adopt any of these interpretations or amendments early.
2.3 Operational segment
As the Company has not yet entered operations, there is no segment financial information that is required to be disclosed.
2.4 Foreign currency transactions
a) Presentation and functional currency
The accounting items included in the Company's financial statements are valued using the currency of the main economic environment in which the entity operates (the "functional currency"). As the Company currently does not have operations, and its capital is denominated in US dollars, the functional currency as of September 30, 2011, is the US dollar. Once operations begin, the functional currency will be reevaluated.
b) Transactions and balances
Foreign currency transactions are converted to the functional currency using the exchange rate prevailing as of the transaction date.
Gains and losses in foreign currency arising from the settlement of transactions and the conversion at the closing exchange rate of monetary assets and liabilities denominated in foreign currency are recognized in the statement of comprehensive income.
8
2.5 Current and deferred income taxes
The Company recognizes its tax rights and obligations based on currently effective legislation.
Income tax expense is recognize in the statement of gains and losses, and corresponds to the expected tax payable on the income for the year using tax rates applicable as of the date of the statement of financial position, any adjustment to prior year income taxes and, the effect of the movement in deferred tax assets and liabilities.
The effects of deferred taxes are recorded for temporary differences that arise between the tax base of assets and liabilities and their corresponding values as disclosed in the financial statements. Deferred tax assets and liabilities are calculated using the tax rates enacted at the date of the statement of financial position which are expected to be applicable when the deferred tax asset or liability will be realized.
Deferred tax assets are recognized when it is probable that there will be future tax benefits that enable the Company to utilize those assets.
2.6 Cash and cash equivalents
The Company considers as cash and cash equivalents cash, cash deposited in banks, and where applicable investments in high-liquidity, short-term, financial instruments with original maturities of three months or less.
As of the date of these financial statements the Company recognized a balance of cash and cash equivalents of ThUS$ 0.02, which corresponds to the payment in cash in US dollars for two shares subscribed for by the shareholders.
2.7 Dividend distribution
The distribution of dividends to the Company's shareholders is recorded as a liability in the financial statements in the period when they are declared and approved by the shareholders, or when the corresponding obligation is triggered according to current Law or the distribution policy as set by the Shareholders' Meeting.
NOTE 3 – FINANCIAL RISK MANAGEMENT
The Company’s future actions may be exposed to various financial risks, specifically market, credit and liquidity risks.
As the Company has been recently established and its operations have not begun, risks that may significantly affect the Company have not yet been identified.
Capital risk management
The Company's aim in managing capital is to safeguard its capability to continue as a going concern, to provide its shareholders with returns and its other stakeholders with benefits, and to sustain an optimal capital structure to reduce the cost of capital.
In line with other participants in the industry in which the Company operates, its capital is monitored based on its debt-to-equity ratio.
9
NOTE 4 – ACCOUNTING ESTIMATES AND JUDGMENTS
Estimates and judgments are continuously evaluated and are based on prior experience and other factors, including expectations of future events that are considered reasonable in light of current circumstances.
There are no accounting judgments or estimates that represent a significant risk of a material adjustment to the Company's financial statements.
NOTE 5 – CONTINGENCIES
a) Direct commitments
As of the date of these financial statements, the Company does not have direct commitments.
b) Indirect commitments
As of the date of these financial statements, the Company does not have indirect commitments.
c) Legal proceedings and contingencies
As of the date of these financial statements, the Company is not engaged in legal proceedings, either in its favor or otherwise.
NOTE 6 – SHAREHOLDERS’ EQUITY
As set forth in the first temporary statute of the constitution of Sister Holdco S.A., the subscription and payment of the Company's capital has been performed and will be performed in the following manner:
| i. | Tep Chile S.A. subscribes for one share at US$ 8.95, which was paid on September 30, 2011 for which the Company received US$ 8.95 in cash. |
| ii. | Guillermo Ureta Larraín subscribes for one share at US$ 8.95, which was paid on September 30, 2011 for which the Company received US$ 8.95 in cash. |
| iii. | A total of 72,837,924 shares pending subscription and payment will be freely issued by the Board of Directors, to be paid in cash or through the contribution in ownership of 62 Series A shares issued by Holdco I S.A.; 47,652,707 Series B shares issued by Holdco I S.A. and 25,185,155 preferential shares of the company TAM S.A. The abovementioned shares will be issued, subscribed and paid in the way described within one year counted from the date of the public deed of the Company's constitution. In case that the shares are not subscribed or that the shares are not paid, in whole or in part, within the term set forth in the constitution, the Company's capital will be legally and automatically reduced to the amount effectively paid in and divided among the paid-in shares corresponding to that amount. In this way Sister Holdco S.A.'s Board of Directors will be completely and absolutely exempt of the requirement to collect the outstanding balances corresponding to the subscribed, not-yet-paid shares. |
NOTE 7 – TRANSACTIONS WITH RELATED PARTIES
No transactions with related parties have occurred.
10
NOTE 8 – SUBSEQUENT EVENTS
On November 7, 2011, the first extraordinary Shareholders Meeting took place, where it was unanimously agreed to amend the fifth article of the Company’s by-laws, relating to the amount of shares in which its capital is divided, of 72,837,926 shares, in order that it be as from then 72,837,926 shares. In addition, during that extraordinary shareholders meeting it was unanimously agreed to modify the first temporary article regarding the number of shares of Holdco I S.A. and/or of TAM S.A. that will be contributed to pay for the Company's capital, proposing to the shareholders to reduce the number of Series B shares issued by Holdco I S.A. to be contributed for those not-yet-paid in shares, from 47,652,707 Series B shares to 47,652,705 Series B shares.
11
APPENDIX 3.1
PROFORMA FINANCIAL STATEMENTS OF SISTER HOLDCO S.A. AT SEPTEMBER 30, 2011
| SISTER | SISTER HOLDCO | |||||||||||
| HOLDCO S.A. | ADJUSTMENTS | S.A. PROFORMA | ||||||||||
| THUS$ | THUS$ | THUS$ | ||||||||||
ASSETS | ||||||||||||
| CURRENT ASSETS | ||||||||||||
| Cash | - | - | ||||||||||
| TOTAL CURRENT ASSETS | - | - | - | |||||||||
| NON CURRENT ASSETS | ||||||||||||
| Investment in Holdco I | 722,415 | 722,415 | ||||||||||
| Investment in Tam | 398,681 | 398,681 | ||||||||||
| TOTAL NON CURRENT ASSETS | - | 1,121,096 | 1,121,096 | |||||||||
| TOTAL ASSETS | - | 1,121,096 | 1,121,096 | |||||||||
| LIABILITIES AND EQUITY | ||||||||||||
| EQUITY | ||||||||||||
| Share capital | - | 651,899 | 651,899 | |||||||||
| Share premium | - | 469,197 | 469,197 | |||||||||
| TOTAL EQUITY | - | 1,121,096 | 1,121,096 | |||||||||
Considerations to build the Proforma Adjustments
In order to determine the proforma situation of the company to be merged -Sister Holdco S.A.-, the following conditions required for the accomplishment of the merger subject of this proposal have been taken into account:
| a. | That the shareholders subscribe and pay the share capital by the contribution of 25,185,155 TAM S.A. non-voting Stock; |
| b. | That, besides, the shareholders subscribe and pay Sister Holdco S.A. share capital by the contribution of 47,652,705 non-voting stock of the Chilean company Holdco I S.A. and 62 Voting Stock of the same company; |
| c. | That Holdco I S.A. contributed shares represent a 99.999996% of Holdco I S.A. non-voting stock and a 6.2% of its voting stock; and |
| d. | That Holdco I S.A. owns the 47,652,705 voting stock issued by TAM S.A. |
According to the abovementioned, the following table shows how Sister Holdco S.A. investment in TAM S.A. shares was valued at September 30th 2011:
NO. OF SHARES HELD BY SISTER HOLDCO S.A | PRICE | TOTAL | ||||||||||
| SHARES | NO. | US$ | ThUS$ | |||||||||
| Holdco I S.A. | 47,652,705 | 15.16 | 722,415 | |||||||||
| TAM S.A. | 25,185,155 | 15.83 | 398,681 | |||||||||
| TOTAL SISTER HOLDCO | 72,837,860 | 1,121,096 | ||||||||||
The unit value of the non-voting stock issued by TAM S.A., was determined considering its listing value informed by Bovepsa at September 30th 2011.
On the other hand, the unit value of Holdco I S.A. shares was determined considering the listing price of its underlying asset corresponding to voting stock issued by TAM S.A., according to the information provided by Bovepsa at September 30th 2011.
| Price | Price | |||||||
| Shares | Real | US$ | ||||||
| TAM ON | 28.12 | 15.16 | ||||||
| TAM PN | 29.36 | 15.83 | ||||||
The foreign exchange rate used corresponds to a 1.8544 Brazilian Real per United States Dollar.
For the purpose of this Proforma Balance, the 62 voting stock in Holdco I S.A. that Sister Holdco S.A. would have up to this date, have not been taken into account since these shares would not have any economic value as they have no right to distributions of Holdco S.A.
APPENDIX 4
AUDITED FINANCIAL STATEMENTS OF HOLDCO II S.A. AT SEPTEMBER 30, 2011
HOLDCO II S.A.
Financial statements
September 30, 2011
(A free translation from the original prepared in Spanish)
CONTENIDO
| Statement of financial position | 3 |
| Statement of comprehensive income | 4 |
| Statement of cash flows - direct method | 5 |
| Statement of changes in net equity | 6 |
| Notes to the financial statements | 7 |
US$ - US dollars
ThUS$ - Thousands of US dollars
1
Santiago, November 9, 2011
To the Shareholders and Directors
Holdco II S.A.
(A free translation from the original prepared in Spanish)
We have audited the statement of financial position of Holdco II S.A. as of September 30, 2011 and the related statements of comprehensive income, changes in net equity and cash flows for the period between June 28 and September 30, 2011. The preparation of these financial statements (including the notes thereto) is the responsibility of Holdco II S.A.’s Management. Our responsibility is to express an opinion on these financial statements, based on our audit.
We conducted our audit in accordance with auditing standards generally accepted in Chile. Those standards require that we plan and perform the audit to obtain reasonable assurance about whether the financial statements are free of material misstatements. An audit includes examining, on a test basis, evidence supporting the amounts and disclosures in the financial statements. An audit also includes assessing the accounting principles used and significant estimates made by management, as well as evaluating the overall financial statement presentation. We believe that our audit provides a reasonable basis of our opinion.
In our opinion, the financial statements referred to above present fairly, in all material respects, the financial position of Holdco II S.A. as of September 30, 2011, the comprehensive results of its operations and the cash flows for the period between June 28 and September 30, 2011, in accordance with the International Financial Reporting Standards.
Renzo Corona Spedaliere
RUT: 6.373.028-9
2
HOLDCO II S.A.
STATEMENT OF FINANCIAL POSITION
AS OF SEPTEMBER 30, 2011
(A free translation from the original prepared in Spanish)
| ThUS$ | ||||
| ASSETS | ||||
| CURRENT ASSETS | ||||
| Cash & cash equivalents | 0.02 | |||
| Total current assets | 0.02 | |||
| Total assets | 0.02 | |||
| LIABILITIES y SHAREHOLDERS’ EQUITY | ||||
| SHAREHOLDERS’ EQUITY | ||||
| Paid-in capital | 0.02 | |||
| Total shareholders’ equity | 0.02 | |||
| Total liabilities y shareholders’ equity | 0.02 | |||
The accompanying Notes 1 to 8 are an integral part of these financial statements.
3
HOLDCO II S.A.
STATEMENT OF COMPREHENSIVE INCOME
For the period between June 28 and September 30, 2011
(A free translation from the original prepared in Spanish)
| ThUS$ | ||||
| ORDINARY INCOME | ||||
| Gain (Loss) | 0.0 | |||
| Profit (loss) before income tax | 0.0 | |||
| Income tax | 0.0 | |||
| INCOME (LOSS) FOR THE YEAR | ||||
| Other comprehensive income | 0.0 | |||
| Comprehensive gain (loss) | 0.0 | |||
| Total comprehensive income for the period | 0.0 | |||
The accompanying Notes 1 to 8 are an integral part of these financial statements.
4
HOLDCO II S.A.
STATEMENT OF CASH FLOWS - DIRECT METHOD
For the period between June 28 and September 30, 2011
(A free translation from the original prepared in Spanish)
| ThUS$ | ||||
| CASH FLOWS FROM OPERATING ACTIVITIES | ||||
| Net cash flows from operating activities | 0.00 | |||
| CASH FLOWS FROM INVESTING ACTIVITIES | ||||
| Net cash flows from investing activities | 0.00 | |||
| CASH FLOWS FROM FINANCING ACTIVITIES | ||||
| Net cash flows from financing activities | 0.02 | |||
| Effect of changes of the exchange rate on cash and cash equivalents | 0.00 | |||
OPENING BALANCE OF CASH AND CASH EQUIVALENTS | 0.00 | |||
| CLOSING BALANCE OF CASH AND CASH EQUIVALENTS | 0.02 | |||
The accompanying Notes 1 to 8 are an integral part of these financial statements.
5
HOLDCO II S.A.
STATEMENT OF CHANGES IN NET EQUITY
For the period between June 28 and September 30, 2011
(A free translation from the original prepared in Spanish)
| Share | Share | Retained | Total | |||||||||||||
| capital | premium | earnings | net equity | |||||||||||||
| ThUS$ | ThUS$ | ThUS$ | ThUS$ | |||||||||||||
| Opening balance as of June 28, 2011 | 0.00 | 0.00 | 0.00 | 0.00 | ||||||||||||
| Changes in Equity | ||||||||||||||||
| Payment of subscribed shares | 0.02 | 0.00 | 0.00 | 0.02 | ||||||||||||
| Income for the period | 0.00 | 0.00 | 0.00 | 0.00 | ||||||||||||
| Closing balance as of September 30, 2011 | 0.02 | 0.00 | 0.00 | 0.02 | ||||||||||||
The accompanying Notes 1 to 8 are an integral part of these financial statements.
6
HOLDCO II S.A.
NOTES TO THE FINANCIAL STATEMENTS
AS OF SEPTEMBER 30, 2011
(A free translation from the original prepared in Spanish)
NOTE 1 – GENERAL INFORMATION
Holdco II S.A. (from hereon "the Company") was established in Chile as recorded in public deed on June 28, 2011, under number 13.112-2011 sighted by the Notary Mr. Eduardo Avello Concha, under the name Holdco II S.A. The Company is a closely held corporation, entered in the Trade Register of Santiago in page 36.741 N° 27.499 of year 2011, and advertised in the digital edition of the Official Gazette in its issue number 40,003 of July 6, 2011.
The Company's address is the city of Santiago.
The Company's main business is investing in tangible or intangible goods, either in Chile or abroad.
On July 1, 2011, the Company obtained from the Chilean Internal Revenue Service its Unique Tax Number, 76.153.208-1. According the supporting information filed by the Company, Holdco II S.A. has been classified as a first category contributor, and in addition, as a contributor not subject to the Value Added Tax.
On August 11, 2011, through the exempt resolution number 7594, the Regional Metropolitan Direction - East Santiago - of the Chilean Internal Revenue Service, the Company was authorized to maintain its accounting records in US dollars, with exception of purchases and sales ledgers, payroll records and professional fees withholdings ledgers which must be maintained in Chilean Pesos.
As of September 30, 2011, and as of the issue date of these financial statements, the Company has not begun operations.
The present financial statements have been prepared to be presented in the extraordinary shareholders meeting that is set to decide on the merger between Holdco II S.A. and Lan Airlines S.A., and to be filed with the Superintendence of Securities and Insurance (SVS), as part of registering with said institution.
These financial statements have been approved by the Board of Directors of the Company in a meeting held on November 9, 2011.
NOTE 2 – SUMMARY OF SIGNIFICANT ACCOUNTING POLICIES
2.1 Accounting period
The financial statements herein cover the following periods:
| - | Statement of financial position | Period between June 28 and September 30, 2011 | |
| - | Statement of comprehensive income | ||
| and Statement of cash flows | Period between June 28 and September 30, 2011 | ||
| - | Statement of changes in net equity | Period between June 28 and September 30, 2011 |
7
2.2 Basis of preparation
These financial statements that cover the period ended on September 30, 2011 have been prepared according to the International Financial Reporting Standards (IFRS) as adopted for their use in Chile.
2.2.1 Existing standards that are not effective as of the date of these financial statements
As of the issue date of these financial statements, the following standards are not yet effective.
| Standard | Name | Applicable to financial statement periods beginning on or after: | ||
| Amendment to IAS 1 | Presentation of Financial Statements | July 1, 2012 | ||
| IFRS 9 | Financial Instruments | January 1, 2013 | ||
| IAS 28 reviewed | Investments in associates and joint ventures | January 1, 2013 | ||
| IAS 27 reviewed | Separate financial statements | January 1, 2013 | ||
| IFRS 10 | Consolidated financial statements | January 1, 2013 | ||
| IFRS 11 | Joint arrangements | January 1, 2013 | ||
| IFRS 12 | Disclosure of Interests in Other Entities | January 1, 2013 | ||
| IFRS 13 | Fair Value Measurement | January 1, 2013 | ||
| Amendment to IAS 19 | Employee benefits | January 1, 2013 |
The Company has not elected to adopt any of these interpretations and amendments early.
2.3 Operational segment
As the Company has not yet entered operations, there is no segment financial information that is required to be disclosed.
2.4 Foreign currency transactions
a) Presentation and functional currency
The accounting items included in the Company's financial statements are valued using the currency of the main economic environment in which the entity operates (the "functional currency"). As the Company does not have operations, and its capital is denominated in US dollars, the functional currency as of September 30, 2011, is the US dollar. Once operations begin, the functional currency will be reevaluated.
b) Transactions and balances
Foreign currency transactions are converted to the functional currency using the exchange rate prevailing as of the transaction date.
Gains and losses in foreign currency arising from the settlement of the transactions and the conversion at the closing exchange rate of monetary assets and liabilities denominated in foreign currency are recognized in the statement of comprehensive income.
8
2.5 Current and deferred income taxes
The Company recognizes its tax rights and obligations based on currently effective legislation.
Income tax expense is recognized in the statement of gains and losses, and corresponds to the expected tax payable on the income for the year using tax rates applicable as of the date of the statement of financial position, any adjustment to prior year income taxes and, the effect of the movement in deferred tax assets and liabilities.
The effects of deferred taxes are recorded for temporary differences that arise between the tax base of assets and liabilities and their corresponding values as disclosed in the financial statements. Deferred tax assets and liabilities are calculated using the tax rates enacted as of the date of the statement of financial position which are expected to be applicable when the deferred tax asset or liability will be realized.
Deferred tax assets are recognized when it is probable that there will be future tax benefits that enable the Company to utilize these assets.
2.6 Cash and cash equivalents
The Company considers as cash and cash equivalents cash, cash deposited in banks, and where applicable investments in high-liquidity, short-term, financial instruments with original maturities of three months or less.
As of the date of these financial statements the Company recognized a balance of cash and cash equivalents of ThUS$ 0.02, which corresponds to the payment in cash in US dollars for two shares subscribed for by the shareholders.
2.7 Dividend distribution
The distribution of dividends to the Company's shareholders is recorded as a liability in the financial statements in the period when they are declared and approved by the shareholders, or when the corresponding obligation is triggered according to current Law or the distribution policy as set by the Shareholders' Meeting.
NOTE 3 – FINANCIAL RISK MANAGEMENT
The Company’s future actions may be exposed to various financial risks, specifically market, credit and liquidity risks.
As the Company has been recently established and its operations have not begun, risks that may significantly affect the Company have not yet been identified.
Capital risk management
The Company's aim in managing capital is to safeguard its capability to continue as a going concern, to provide its shareholders with returns and benefits to it’s other stakeholders, and to sustain an optimal capital structure to reduce the cost of capital.
In line with other participants in the industry in which the Company operates, it’s capital is monitored based on its debt-to-equity ratio.
9
NOTE 4 – ACCOUNTING ESTIMATES AND JUDGMENTS
Estimates and judgments are continuously evaluated and are based on prior experience and other factors, including expectations of future events that are considered reasonable in light of current circumstances.
There are no accounting judgments or estimates that represent a significant risk of a material adjustment to the Company's financial statements.
NOTE 5 – CONTINGENCIES
a) Direct commitments
As of the date of these financial statements, the Company does not have direct commitments.
b) Indirect commitments
As of the date of these financial statements, the Company does not have indirect commitments.
c) Legal proceedings and contingencies
As of the date of these financial statements, the Company is not engaged in legal proceedings, either in its favor or otherwise.
NOTE 6 – SHAREHOLDERS’ EQUITY
As set forth in the first temporary statute of the constitution of HOLDCO II S.A., the subscription and payment of the Company's capital has been performed and will be performed in the following manner:
| i. | Holdco I S.A. subscribes for one share at US$ 8.95, which was paid on September 30, 2011 for which the Company recovered US$ 8.95 in cash. |
| ii. | Guillermo Ureta Larraín subscribes for one share at US$ 8.95, which was paid on September 30, 2011 for which the Company recovered US$ 8.95 in cash. |
| iii. | A total of 85,557,560 shares pending subscription and payment will be freely issued by the Board of Directors, to be paid in cash or through the contribution in ownership of the same number of shares of the Brazilian company TAM S.A. The abovementioned shares will be issued, subscribed and paid in the manner described within one year from the date of the public deed of the Company's constitution. In case that the shares are not subscribed or paid, in whole or in part, within the term set out in that constitution, the Company's capital will be legally and automatically reduced to the amount effectively paid, and divided among the paid-in shares corresponding to that amount. In this way, Holdco II S.A.’s Board of Directors will be completely and absolutely exempt of the requirement to collect the outstanding balances for the subscribed, not-yet-paid in shares. |
NOTE 7 – TRANSACTIONS WITH RELATED PARTIES
No transactions with related parties have occurred.
10
NOTE 8 – SUBSEQUENT EVENTS
Between September 30, 2011 and the date of issue of these financial statements, no subsequent events have occurred that may significantly affect their interpretation.
11
APPENDIX 4.1
PROFORMA FINANCIAL STATEMENTS OF HOLDCO II S.A. AT SEPTEMBER 30, 2011
| HOLDCO II S.A. | ||||||||||||
| HOLDCO II S.A. | ADJUSTMENTS | PROFORMA | ||||||||||
| THUS$ | THUS$ | THUS$ | ||||||||||
| ASSETS | ||||||||||||
| CURRENT ASSETS | ||||||||||||
| Cash | - | - | ||||||||||
| TOTAL CURRENT ASSETS | - | - | - | |||||||||
| NON CURRENT ASSETS | ||||||||||||
| Investment in Tam | 1,314,260 | 1,314,260 | ||||||||||
| TOTAL NON CURRENT ASSETS | - | 1,314,260 | 1,314,260 | |||||||||
| TOTAL ASSETS | - | 1,314,260 | 1,314,260 | |||||||||
| LIABILITIES AND EQUITY | ||||||||||||
| EQUITY | ||||||||||||
| Share capital | - | 765,740 | 765,740 | |||||||||
| Share premium | - | 548,520 | 548,520 | |||||||||
| TOTAL EQUITY | - | 1,314,260 | 1,314,260 | |||||||||
Considerations to build the Proforma Adjustments
In order to determine the Proforma situation of the company to be merged- Holdco II S.A.-, the following conditions required for the accomplishment of the merger subject of this proposal, have been taken into account:
| a. | That the company performs a public offer for the acquisition of shares for 8.163.978 voting stock issued by the Brazilian company TAM S.A. and for 75.204.943 non-voting stock issued by the Brazilian company TAM S.A., considering for this purpose the total of subscribed and paid shares of this company at September 30th 2011; and |
| b. | That the abovementioned public offer will be accepted for at least 95% of the shares that were offered to be acquired. |
For purposes of elaborating the following Holdco II S.A. Pro forma Balance, it has been assumed that 100% of the shares intended to be acquired in the public offer accepted the offer. However, it must be noted that in case the public offer to acquire is accepted by a different number of shares, the Holdco II S.A. pro forma adjustment amount should vary proportionally.
Accordingly, the following table shows how Holdco II S.A. investment in TAM S.A. shares was valued at September 30th 2011.
NO. OF SHARES HELD BY HOLDCO II | PRICE | TOTAL | ||||||||||
SHARES | NO. | US$ | ThUS$ | |||||||||
| TAM ON | 8,163,978 | 15,16 | 123,766 | |||||||||
| TAM PN | 75,204,943 | 15,83 | 1,190,494 | |||||||||
| TOTAL HOLDCO II | 83,368,921 | 1,314,260 | ||||||||||
The unit value of the voting stock and the non-voting stock issued by TAM S.A., was determined considering its listing value informed by Bovepsa up to September 30th 2011.
| Price | Price | |||||||
| Shares | Real | US$ | ||||||
| TAM ON | 28,12 | 15,16 | ||||||
| TAM PN | 29,36 | 15,83 | ||||||
The foreign exchange rate used corresponds to a 1.8544 Brazilian Real per United States Dollar.
APPENDIX 5
AUDITED FINANCIAL STATEMENTS OF TAM S.A. AT SEPTEMBER 30, 2011
(A free translation of the original version in Spanish)
TAM S.A.
Condensed Consolidated Interim Financial Information
at September 30, 2011
and report of independent accountants
F-1
(A free translation of the original version in Spanish)
Independent Auditor’s Report
To the Board of Directors and Shareholders
TAM S.A.
We have audited the accompanying condensed consolidated interim financial information of TAM S.A. and its subsidiaries (the “Company”), which comprise the condensed consolidated interim balance sheet as at September 30, 2011 and the condensed consolidated interim statements of income, comprehensive income, changes in equity and cash flows for the quarter and nine- month period then ended.
Management’s responsibility
for the consolidated financial statements
Management is responsible for the preparation and fair presentation of this condensed consolidates interim financial information in accordance with International Accounting Standard (IAS) 34 – “Interim Financial Reporting”, and for such internal control as management determines is necessary to enable the preparation of consolidated financial statements that are free from material misstatement, whether due to fraud or error.
Auditor’s responsibility
Our responsibility is to express an opinion on this condensed consolidated interim financial information based on our audit. We conducted our audit in accordance with International Standards on Auditing. Those standards require that we comply with ethical requirements and plan and perform the audit to obtain reasonable assurance about whether the financial information is free from material misstatement.
An audit involves performing procedures to obtain audit evidence about the amounts and disclosures in the financial statements. The procedures selected depend on the auditor’s judgment, including the assessment of the risks of material misstatement of the consolidated financial information, whether due to fraud or error.
In making those risk assessments, the auditor considers internal control relevant to the entity’s preparation and fair presentation of the financial information in order to design audit procedures that are appropriate in the circumstances, but not for the purpose of expressing an opinion on the effectiveness of the entity’s internal control. An audit also includes evaluating the appropriateness of accounting policies used and the reasonableness of accounting estimates made by management, as well as evaluating the overall presentation of the financial statements.
We believe that the audit evidence we have obtained is sufficient and appropriate to provide a basis for our audit opinion.
F-2
Opinion
In our opinion, the referred condensed consolidated interim financial information is prepared in all material respects, in accordance with IAS 34 – “Interim Financial Reporting”.
Other matters
Condensed consolidated interim financial
information for the quarter and nine-month period
ended as at September 30, 2011
The condensed consolidated interim financial information for the quarter and nine-month period ended as at September 30, 2010, presented for comparative purposes was not audited.
São Paulo, November 10, 2011
| PricewaterhouseCoopers | Carlos Alberto de Sousa |
| Auditores Independentes | Contador CRC 1RJ056561/O-0 “S” SP |
| CRC 2SP000160/O-5 |
F-3
| TAM S.A. | |
| Condensed consolidated balance sheet | |
| (In thousands of Dollar) | A free translation of the original version in Spanish |
| Note | September 30, 2011 | December 31, 2010 | Note | September 30, 2011 | December 31, 2010 | ||||||||||||||||||||
| Assets | Liabilities | ||||||||||||||||||||||||
| Current | Current | ||||||||||||||||||||||||
| Cash and cash equivalents | 7 | 277,741 | 607,502 | Accounts payable | 262,496 | 313,506 | |||||||||||||||||||
| Financial assets at fair value through profit and loss | 749,024 | 844,855 | Financial liabilities | 14 | 1,005,977 | 943,520 | |||||||||||||||||||
| Trade accounts receivable | 8 | 1,060,932 | 934,330 | Salaries and social charges | 277,710 | 280,177 | |||||||||||||||||||
| Inventories | 118,516 | 119,289 | Deferred income | 15 | 890,108 | 1,081,011 | |||||||||||||||||||
| Taxes recoverable | 9 | 326,452 | 34,544 | Taxes, charges and contributions | 228,766 | 184,965 | |||||||||||||||||||
| Income tax and social contribution recoverable | 11,057 | Income tax and social contribution payable | 2,540 | 8,606 | |||||||||||||||||||||
| Prepaid expenses | 67,141 | 97,700 | Interest on own capital and dividends | 466 | 91,401 | ||||||||||||||||||||
| Derivative financial instruments | 10 | 14,796 | 5,939 | Derivative financial instruments | 10 | 46,672 | 12,348 | ||||||||||||||||||
| Other receivables | 46,311 | 48,754 | Other current liabilities | 17 | 87,760 | 81,419 | |||||||||||||||||||
| 2,660,913 | 2,703,970 | 2,802,495 | 2,996,953 | ||||||||||||||||||||||
| Non-current | Non-current | ||||||||||||||||||||||||
| Restricted cash | 32,927 | 59,000 | Financial liabilities | 14 | 3,839,234 | 3,473,081 | |||||||||||||||||||
| Financial assets – Bank deposits | 11 | 86,590 | 30,176 | Derivative financial instruments | 10 | 42,863 | 9,174 | ||||||||||||||||||
| Deposits in guarantee | 29,731 | 31,076 | Deferred income | 15 | 23,993 | 39,863 | |||||||||||||||||||
| Deferred income tax and social contribution | 19 | 18,482 | Provisions | 18 | 132,944 | 122,597 | |||||||||||||||||||
| Prepaid aircraft maintenance | 293,075 | 246,253 | Refinanced taxes payable under Fiscal Recovery Program | 16 | 229,508 | 250,075 | |||||||||||||||||||
| Other non-current assets | 14,083 | 12,360 | Deferred income tax and social contribution | 19 | 89,689 | ||||||||||||||||||||
| Derivative financial instruments | 10 | 3,612 | 3,942 | Other non-current liabilities | 17 | 219,671 | 142,523 | ||||||||||||||||||
| Property, plant and equipment | 12 | 4,919,659 | 5,228,574 | ||||||||||||||||||||||
| Intangible assets | 13 | 326,616 | 385,480 | 4,488,213 | 4,127,002 | ||||||||||||||||||||
| 5,724,775 | 5,996,861 | Total liabilities | 7,290,708 | 7,123,955 | |||||||||||||||||||||
| Equity | |||||||||||||||||||||||||
| Share capital | 20 | 442,133 | 492,073 | ||||||||||||||||||||||
| Other reserves | 21 | 846,008 | 961,482 | ||||||||||||||||||||||
| Accumulated losses | (231,589 | ) | |||||||||||||||||||||||
| 1,056,552 | 1,453,555 | ||||||||||||||||||||||||
| Non-controlling interest | 38,428 | 123,321 | |||||||||||||||||||||||
| Total equity | 1,094,980 | 1,576,876 | |||||||||||||||||||||||
| Total assets | 8,385,688 | 8,700,831 | Total liabilities and equity | 8,385,688 | 8,700,831 | ||||||||||||||||||||
The accompanying notes are an integral part of this condensed consolidated interim financial information.
F-4
| TAM S.A. | |
| Condensed consolidated Statement of operations | |
| Three and nine months periods ended September 30, 2011 and 2010 | |
| (In thousand of Dollar) | A free translation of the original version in Spanish |
| Quarter ended | Nine months ended | ||||||||||||||||||
| Note | September 30, 2011 | September 30, 2010 | September 30,2011 | September 30, 2010 | |||||||||||||||
(Adjusted(*)) (Unaudited) | (Adjusted(*)) (Unaudited) | ||||||||||||||||||
| Revenue | 22 | 2,029,401 | 1,679,535 | 5,766,943 | 4,582,587 | ||||||||||||||
| Operating expenses | 23 | (1,691,111 | ) | (1,290,575 | ) | (5,352,789 | ) | (4,150,180 | ) | ||||||||||
| Operating profit before movements in fair value of fuel derivatives | 338,290 | 388,960 | 414,154 | 432,407 | |||||||||||||||
| Movements in fair value of fuel derivatives | (57,071 | ) | 7,278 | (31,675 | ) | (18,734 | ) | ||||||||||||
| Operating profit | 281,219 | 396,238 | 382,479 | 413,673 | |||||||||||||||
| Finance income | 25 | 339,097 | 372,726 | 992,144 | 856,467 | ||||||||||||||
| Finance costs | 25 | (1,114,982 | ) | (118,522 | ) | (1,609,195 | ) | (790,389 | ) | ||||||||||
| Derivatives designated as cash flow hedge | 25 | (11,828 | ) | (11,828 | ) | ||||||||||||||
| Profit / (loss) before income tax and social contribution | (506,494 | ) | 650,442 | (246,400 | ) | 479,751 | |||||||||||||
| Income tax and social contribution | 19(a) | 135,910 | (224,409 | ) | 15,857 | (186,446 | ) | ||||||||||||
| Profit / (loss) for the period | (370,584 | ) | 426,033 | (230,543 | ) | 293,305 | |||||||||||||
| Attributable to | |||||||||||||||||||
| Equity shareholders of TAM S.A. | (378,888 | ) | 419,192 | (263,822 | ) | 282,055 | |||||||||||||
| Non-controlling interest | 8,304 | 6,841 | 33,279 | 11,250 | |||||||||||||||
| Earnings per share (common and preferred) – in US$ | |||||||||||||||||||
| Basic | 26 | (2.43 | ) | 2.79 | (1.69 | ) | 1.88 | ||||||||||||
| Diluted | 26 | (2.43 | ) | 2.78 | (1.69 | ) | 1.87 | ||||||||||||
The accompanying notes are an integral part of this condensed consolidated interim financial information.
(*) See Note 3.
F-5
| TAM S.A. | |
Condensed consolidated statements of comprehensive income/ (loss) | |
Three and nine months periods ended September 30, 2011 and 2010 | |
| (In thousand of Dollar) | A free translation of the original version in Spanish |
| Quarter ended | Nine months ended | |||||||||||||||
September 30, 2011 | September 30, 2010 | September 30, 2011 | September 30, 2010 | |||||||||||||
(Adjusted (*)) (Unaudited) | (Adjusted (*)) (Unaudited) | |||||||||||||||
| Profit / (loss) for the period | (370,584 | ) | 426,033 | (230,543 | ) | 293,305 | ||||||||||
| Other comprehensive income | ||||||||||||||||
| Currency translation gains / (losses) on foreign operations, net of tax | 799 | (790 | ) | 1,778 | (32 | ) | ||||||||||
| Result of the convertion of functional currecy to presentation currency | (224,348 | ) | 79,942 | (113,533 | ) | 58,423 | ||||||||||
| Cash flow hedge, net of tax | (16,635 | ) | (16,635 | ) | ||||||||||||
| Other comprehensive losses for the period | (240,184 | ) | 79,152 | (128,390 | ) | 58,391 | ||||||||||
| Total comprehensive income / (loss) for the period | (610,768 | ) | 505,185 | (358,933 | ) | 58,391 | ||||||||||
| Attributable to | ||||||||||||||||
| Equity shareholders of TAM S.A. | (607,631 | ) | 491,304 | (387,451 | ) | 330,178 | ||||||||||
| Non-controlling interest | (3,137 | ) | 13,881 | 28,518 | 21,518 | |||||||||||
The accompanying notes are an integral part of this condensed consolidated interim financial information.
(*) See Note 3.
F-6
| TAM S.A. | |
| Condensed consolidated statement of changes in equity (unaudited) | |
| Nine month periods ended September 30 | |
| (In thousand of Dollar) | A free translation of the original version in Spanish |
Attributable to equity shareholders of TAM | ||||||||||||||||||||||||||||
Share capital | Revaluation reserve | Other reserves (Note 20) | Retained earnings/ (Accumulated deficit) | Total | Non-controlling interest | Total | ||||||||||||||||||||||
| At January 1, 2010 - As originally presented | 391,820 | 67,578 | 76,324 | (248,595 | ) | 287,127 | 1,977 | 289,104 | ||||||||||||||||||||
| Changes of accounting practices – Note 3 | (67,578 | ) | 280,481 | 248,595 | 461,498 | 461,498 | ||||||||||||||||||||||
| At January 1, 2010 – Adjusted | 391,820 | 356,805 | 748,625 | 1,977 | 750,602 | |||||||||||||||||||||||
| Profit for the period | 282,055 | 282,055 | 11,250 | 293,305 | ||||||||||||||||||||||||
| Other comprehensive income | ||||||||||||||||||||||||||||
| Foreign exchange gain on foreign operations, net of tax | (32 | ) | (32 | ) | (32 | ) | ||||||||||||||||||||||
| Result of conversion of functional currency to presentation currency | 6,892 | 35,561 | 5,702 | 48,155 | 10,268 | 58,423 | ||||||||||||||||||||||
| Total comprehensive income | 6,892 | 35,529 | 287,757 | 330,178 | 21,518 | 351,696 | ||||||||||||||||||||||
| Transactions with owners | ||||||||||||||||||||||||||||
| Advance for future capital increase | 82,551 | 82,551 | 82,551 | |||||||||||||||||||||||||
| Realization of deemed cost | (5,119 | ) | 5,119 | |||||||||||||||||||||||||
Dividends and interest on own capital to non-controlling interest of Multiplus S.A. and Mercosur | (5,158 | ) | (5,158 | ) | ||||||||||||||||||||||||
| Stock option plan | 6,446 | 6,446 | 6,446 | |||||||||||||||||||||||||
| Treasury shares | 2,818 | (1,062 | ) | 1,756 | 1,756 | |||||||||||||||||||||||
| Transfer to non-controlling shareholders: | ||||||||||||||||||||||||||||
| Effect on equity of the issuance and sale of new shares of Multiplus S.A. | 262,528 | 262,528 | 96,264 | 358,792 | ||||||||||||||||||||||||
| Total transactions with owners | 349,224 | 4,057 | 353,281 | 91,106 | 444,387 | |||||||||||||||||||||||
| At September 30, 2010 | 398,712 | 741,558 | 291,814 | 1,432,084 | 114,601 | 1,546,685 | ||||||||||||||||||||||
The accompanying notes are an integral part of this condensed consolidated interim financial information.
F-7
| TAM S.A. | |
| Condensed consolidated statement of changes in equity (unaudited) | |
| Nine month periods ended September 30 | |
| (In thousand of Dollar) | A free translation of the original version in Spanish |
Attributable to equity shareholders of TAM | ||||||||||||||||||||||||
Share capital | Other reserves (Note 21) | Retained earnings / (Accumulated deficit) | Total | Non-controlling interest | Total | |||||||||||||||||||
| At January 1, 2011 | 492,073 | 961,482 | 1,453,555 | 123,321 | 1,576,876 | |||||||||||||||||||
| Loss for the period | (263,822 | ) | (263,822 | ) | 33,279 | (230,543 | ) | |||||||||||||||||
| Other comprehensive income / (loss) | ||||||||||||||||||||||||
| Foreign exchange loss on foreign operations, net of tax | 1,689 | 1,689 | 89 | 1,778 | ||||||||||||||||||||
| Result of conversion of functional currency to presentation currency | (49,940 | ) | (94,761 | ) | 31,555 | (113,146 | ) | (387 | ) | (113,533 | ) | |||||||||||||
| Cash flow hedge, net of tax | (12,172 | ) | (12,172 | ) | (4,463 | ) | (16,635 | ) | ||||||||||||||||
| Total comprehensive income / (loss) | (49,940 | ) | (105,244 | ) | (232,267 | ) | (387,451 | ) | 28,518 | (358,933 | ) | |||||||||||||
| Transactions with owners | ||||||||||||||||||||||||
| Capital reduction of Multiplus - Cash paid to non-controlling interests | (101,394 | ) | (101,394 | ) | ||||||||||||||||||||
| Realization of deemed cost | (678 | ) | 678 | |||||||||||||||||||||
| Dividends by TAM | (18,972 | ) | (18,972 | ) | (18,972 | ) | ||||||||||||||||||
| Dividends of Multiplus paid to non-controlling interests | (13,062 | ) | (13,062 | ) | ||||||||||||||||||||
| Dividends of Mercosur paid to non-controlling interests | (197 | ) | (197 | ) | ||||||||||||||||||||
| Stock option plan | 7,484 | 7,484 | 1,241 | 8,725 | ||||||||||||||||||||
| Sale of treasury shares | 1,937 | 1,937 | 1,937 | |||||||||||||||||||||
| Total transactions with owners | (10,229 | ) | 678 | (9,551 | ) | (113,412 | ) | (122,963 | ) | |||||||||||||||
| At September 30, 2011 | 442,133 | 846,008 | (231,589 | ) | 1,056,553 | 38,427 | 1,094,980 | |||||||||||||||||
The accompanying notes are an integral part of this condensed consolidated interim financial information.
F-8
| TAM S.A. | |
| Condensed consolidated statement of cash flows | |
| Nine months periods ended September 30 | |
| (In thousand of Dollar, unless otherwise indicated) | A free translation of the original version in Spanish |
| Nine months ended | |||||||||||
| Note | September 30, 2011 | September 30, 2010 | |||||||||
| (Unaudited) | |||||||||||
| Cash flows generated from operating activities | 27 | 274,935 | 381,072 | ||||||||
| Taxes paid | (53,161 | ) | (15,248 | ) | |||||||
| Interest paid | (164,518 | ) | (130,642 | ) | |||||||
| Net cash generated by operating activities | 57,256 | 235,182 | |||||||||
| Cash flows from investing activities | |||||||||||
| Capital reduction of Multiplus – Cash paid to non-controlling interests | (101,394 | ) | |||||||||
| Investment in restricted cash | 22,133 | (16,634 | ) | ||||||||
| Cash paid on acquisition of Pantanal, net of cash acquired | (5,015 | ) | |||||||||
| Proceeds from sale of property, plant and equipment (PPE) | 1,656 | 13,056 | |||||||||
| Purchases of property, plant and equipment | (53,081 | ) | (55,936 | ) | |||||||
| Purchases of assets of TAM Milor including TAM Brands | (56,255 | ) | |||||||||
| Purchases of intangible assets | (29,790 | ) | (54,017 | ) | |||||||
| Deposits in guarantee | |||||||||||
| Reimbursements | 4,935 | 10,453 | |||||||||
| Deposits made | (4,089 | ) | (5,271 | ) | |||||||
| Pre delivery payment | |||||||||||
| Reimbursements | 67,595 | 63,042 | |||||||||
| Payments | (216,764 | ) | (74,160 | ) | |||||||
| Net cash used in investing activities | (308,799 | ) | (180,737 | ) | |||||||
| Cash flow from financing activities | |||||||||||
| Sale of treasury shares | 1,937 | 1,756 | |||||||||
| Net cash received in a public offering of shares of Multiplus | 364,959 | ||||||||||
| Cash proceeds from issuance of shares in connection with acquisition of assets of TAM Milor | 41,700 | ||||||||||
| Dividends paid – TAM S.A. | 20(e) | (113,679 | ) | (130,096 | ) | ||||||
| Dividends and interest on capital paid to non-controlling shareholders of Multiplus | (13,414 | ) | (4,453 | ) | |||||||
| Dividends paid to non-controlling shareholders of Mercosur | (197 | ) | (736 | ) | |||||||
| Short and long-term borrowings | |||||||||||
| Issuance | 63,207 | ||||||||||
| Payments | (58,593 | ) | (80,703 | ) | |||||||
| Debentures | |||||||||||
| Payments | (101,895 | ) | (95,251 | ) | |||||||
| Senior notes | |||||||||||
| Issuance | 493,670 | ||||||||||
| Capital element of finance leases | (307,665 | ) | (221,110 | ) | |||||||
| Net cash used in financing activities | (36,629 | ) | (123,934 | ) | |||||||
| Effect of conversion on cash and cash equivalents | (41,589 | ) | 12,965 | ||||||||
| Net decrease in cash and cash equivalents | (329,761 | ) | (56,524 | ) | |||||||
| Cash and cash equivalents at the beginning of the period | 607,502 | 617,489 | |||||||||
| Cash and cash equivalents at the end of the period | 277,741 | 560,965 | |||||||||
| Supplementary information on cash flows: | |||||||||||
| Non cash investing and financing activities | |||||||||||
| Acquisition of aircraft under finance leases | 281,413 | 459,135 | |||||||||
| Acquisition of assets of TAM Milor through issuance of shares | 40,841 | ||||||||||
| Acquisition of other PPE under financial leases | 56,026 | ||||||||||
| Financing obtained for direct payment to suppliers | 57,537 | ||||||||||
The accompanying notes are an integral part of this condensed consolidated interim financial information.
F-9
| A free translation of the original version in Spanish |
| TAM S.A. |
| Notes to the condensed consolidated interim financial information |
(In thousands of Dollar, unless otherwise indicated) |
| 1. | General information |
TAM S.A. (“TAM” or the “Company”) was incorporated on May 12, 1997, to invest in companies which carry out air transportation activities. The Company wholly owns TAM Linhas Aéreas S.A. ("TLA"), a company that operates in the transportation of passengers and cargo in Brazil and on international routes, and also owns 94.98% of Transportes Aéreos del Mercosur S.A. (TAM Airlines or Mercosur), an airline headquartered in Asunción, Paraguay, which operates in Paraguay, Argentina, Brazil, Chile, Uruguay and Bolivia. TAM is incorporated and domiciled in Brazil and its registered office is in Av. Jurandir, 856, Lote 4, 1st floor, São Paulo, SP.
On July 15, 2005, the Company concluded a public offering of shares on the São Paulo Stock Exchange – BOVESPA. On March 10, 2006 the Company made an additional public offering – this time on the BM&F – Bolsa de Valores, Mercadorias e Futuros (BM&F Bovespa) and the New York Stock Exchange – NYSE (in the form of American Depositary Shares – ADS), which was concluded on April 6, 2006.
The Company, through its subsidiary TLA, controls the companies TAM Capital Inc, (TAM Capital), TAM Capital Inc, 2 (TAM Capital 2), TAM Financial Services 1 Limited (TAM Financial 1), TAM Financial Services 2 Limited (TAM Financial 2) and as from May 2011 also TAM Capital Inc, 3 (TAM Capital 3) and Financial Services 3 Limited (TAM Financial 3 – was established in August 2011) all headquartered in the Cayman Islands, whose main activities involve aircraft acquisition and financing and issuance of debt. Debt issued by these wholly-owned companies is wholly and unconditionally guaranteed by TAM. TLA also controls the company TAM Viagens e Turismo Ltda. (TAM Viagens), whose corporate purpose is to carry out the activities of a travel and tourism agency, under the name TAM Viagens.
The Company controls TP Participações Ltda. which on July 20, 2009, changed its name to TP Franchising Ltda. (TP Franchising) and modified its corporate purpose to the development of franchises.
In the Extraordinary General Meeting (AGE) held on October 28, 2009, it was approved the change of the name of Q.X.S.P.E. Empreendimentos e Participações S.A. to Multiplus S.A. (Multiplus). Multiplus’s main activity is the development and management of customer loyalty programs. A public offering of shares of this subsidiary was concluded on February 5, 2010.
Since March 15, 2010, the date on which its purchase was approved, the Company controls Pantanal Linhas Aéreas S.A. – “Pantanal”, which was the date ANAC – the National Agency of Civil Aviation approved the purchase. Pantanal is currently under bankruptcy protection.
On July 13, 2010, TLA acquired TAM Milor which was the holder of the brand “TAM” and other related brands (TAM Brands) which are used by the Company, by TLA and other related companies. On March 1, 2011, the Company legally merged its subsidiary TAM Milor into the Company.
On January 18, 2011, the Company published a significant event, informing that TAM and LAN Airlines S.A. had signed two agreements named Implementation Agreement and Exchange Offer Agreement, regulating the final terms and conditions for the association contemplated in the Memorandum of Understanding entered into on August 13, 2010. The agreements define the new structure that will be formed by the association of the two companies for formation of the Group LATAM Airlines S.A., as well as the form of corporate management that will coordinate this new structure. The operation agreed between the parties was approved by ANAC, Brazilian authority, and Tribunal de Defensa de la Libre Competencia (TDLC), Chile authority, on Mach 3, 2011 and September 21, 2011, respectively.
F-10
| TAM S.A. |
| Notes to the condensed consolidated interim financial information |
(In thousands of Dollar, unless otherwise indicated) |
On March 29, 2011, the Company and TRIP Linhas Aéreas S/A. (“TRIP”) signed a Term Sheet, with no binding effect, in order to identify possible opportunities for strengthening and expanding their businesses through the development of a strategic alliance complementary to the existing Codeshare Agreement. Pursuant to the Term Sheet signed, if and when binding documents are executed, and after meeting conditions precedents that may be mutually agreed (including the approval by the applicable authorities), TAM may ultimately acquire a non-controlling interest in TRIP representing 31% of its total capital comprised by 25% of its voting capital and the remaining interest through non-voting preferred shares.
On May 3, 2011, TLA incorporated TAM Capital 3 for the purpose of issuing US$ 500,000 8.375% senior guaranteed notes due 2021 as further described in Note 14.2, and TAM Financial 3, whose main activities are involved aircraft acquisition and financing.
This condensed consolidated interim financial information, of TAM and its subsidiaries was approved by the Board of Executive Officers on November 9, 2011.
| 2. | Basis of preparation and significant accounting policies |
The condensed consolidated interim financial information for the three and nine months ended September 30, 2011 and 2010 has been prepared in accordance with IAS 34 – Interim financial reporting.
The accounting policies applied in the preparation of this condensed consolidated interim financial information are consistent with those of the annual financial statements for the year ended December 31, 2010 and have been applied consistently, except that as described in Note 4 as from the quarter ended September 30, 2011 the Company applies cash flow hedge accounting with respect to certain transactions entered into by its subsidiary Multiplus. The consolidated interim financial information should be read in conjunction with the annual financial statements for the year ended December 31, 2010, which have been prepared in accordance with International Financial Reporting Standards (IFRS) issued by the International Accounting Standards Board (IASB).
Presentation currency of the financial statements
The annual financial statements for the year ended December 31, 2010 prepared in accordance with IFRS previously mentioned are presented using the Brazilian Real as presentation currency. The functional currency of TAM and its subsidiaries, except for TAM Airlines is the Brazilian Real. The functional currency of TAM Mercosur is the Guaraní.
This condensed consolidated interim financial information is presented using the U.S. dollar as its presentation currency exclusively to meet a specific requirement related to Chilean regulatory process in the proposed merger between TAM and LAN Airlines S.A. The Company as required by Brazilian corporate legislation will continue to present its financial statements for legal and statutory purposes using Brazilian Real as presentation currency.
The conversion of Brazilian real functional currency for U.S. dollars was made using the methodology described in IAS 21 - Effects of changes in exchange rates, summarized below:
(I) the assets and liabilities were translated at the closing exchange rate prevailing on the balance sheet date,
(Ii) the income statement accounts were converted using quarterly average exchange rates
(Iii) in relation to equity balances at the end of each period for which IAS 21 does not establish a methodology for converting the Company opted to convert the closing exchange rate prevailing on the balance sheet date, and
F-11
| TAM S.A. |
| Notes to the condensed consolidated interim financial information |
(In thousands of Dollar, unless otherwise indicated) |
(Iv) other changes in equity were converted by quarterly average exchange rates except those that correspond to specific transactions with shareholders who were converted at the exchange rate of the date of the transaction
All resulting translation differences are recognized directly in equity in the cumulative translation adjustment, except for differences arising from the change in account balances of assets that are recognized in the respective account.
For presentation purposes the changes of the balance sheet accounts are presented in the explanatory notes, and the values presented in the statement of cash flows are translated using average exchange rates quarterly.
Hedge accounting cash flow
In accordance with the detailed in Note 4 from the quarter ended September 30, 2011 the Company applies hedge accounting in connection with certain transactions of its subsidiary Multiplus.
| 2.1. | Basis of consolidation and investments in subsidiaries |
| (a) | Consolidated financial information |
(i) Subsidiaries
The consolidated interim financial information includes the financial statements of TAM and its subsidiaries, including special purpose entities. Control is obtained when the Company has the power to govern the financial and operating policies, as a result of holding more than half of the voting rights. The existence and the effect of potential voting rights, currently exercisable or convertible, are taken into account to assess whether TAM controls another entity. Subsidiaries are fully consolidated as from the date when control is transferred to TAM and are no longer consolidated as from the date when such control ceases.
The results of subsidiaries acquired during the year are included in the consolidated statements of operations and of comprehensive income/loss as from the actual acquisition date. The comprehensive/loss income balance is attributable to the Company’s owners and to non-controlling interests, even if results in a negative balance of these interests. When necessary, the financial statements of subsidiaries are adjusted to conform their accounting policies to those established by the Company. Intercompany transactions and balances and unrealized gains are eliminated. Unrealized losses are also eliminated, although they are considered as an indicator of impairment of the transferred asset.
(ii) Transactions and non-controlling interests
In the consolidated interim financial information, any changes in the Company’s interests in subsidiaries that do not result in loss of the Company’s control over subsidiaries are recorded as capital transactions. The account balances of the Company’s interests and non-controlling interests are adjusted to reflect changes in their interests in subsidiaries. The difference between the fair value of consideration paid or received is recorded directly in equity and attributed to the Company's owners.
F-12
| TAM S.A. |
| Notes to the condensed consolidated interim financial information |
(In thousands of Dollar, unless otherwise indicated) |
When the Company ceases to have control, any retained interest in the entity is remeasured to its fair value, and any change in the carrying amount is recognized in profit or loss. The fair value is the initial carrying amount for subsequent recognition of the retained interest in an associate, a joint venture or a financial asset. Also, any amounts previously recognized in other comprehensive income related to that entity are recorded as if TAM had directly disposed of the related assets or liabilities. This means that the amounts previously recognized in other comprehensive income are reclassified to profit or loss.
Non-controlling interests represent the portion of profit or loss and of equity of subsidiaries that is not held by TAM, and is recorded in a separate line item in the consolidated balance sheet.
| (iii) | Companies included in the consolidated interim financial information |
Ownership and voting power % | |||||||||||||||||||
Reporting date | Ownership | September 30, 2011 | December 31, 2010 | September 30, 2010 (unaudited) | |||||||||||||||
| TLA | 09.30.2011 | Direct | 100.00 | 100.00 | 100.00 | ||||||||||||||
TAM Viagens (i) | 09.30.2011 | Indirect | 99.99 | 99.99 | 99.99 | ||||||||||||||
TAM Capital (i) | 09.30.2011 | Indirect | 100.00 | 100.00 | 100.00 | ||||||||||||||
TAM Capital 2 (i) | 09.30.2011 | Indirect | 100.00 | 100.00 | 100.00 | ||||||||||||||
| TAM Capital 3 (i) | 09.30.2011 | Indirect | 100.00 | ||||||||||||||||
TAM Financial 1 (i) | 09.30.2011 | Indirect | 100.00 | 100.00 | 100.00 | ||||||||||||||
TAM Financial 2 (i) | 09.30.2011 | Indirect | 100.00 | 100.00 | 100.00 | ||||||||||||||
TAM Financial 3 (i) | 09.30.2011 | Indirect | 100.00 | ||||||||||||||||
Fundo Spitfire II (Fundo exclusivo) (ii) | 09.30.2011 | Indirect | 100.00 | 100.00 | 100.00 | ||||||||||||||
| TP Franchising | 09.30.2011 | Direct | 100.00 | 100.00 | 100.00 | ||||||||||||||
| Mercosur | 08.31.2011 | Direct | 94.98 | 94.98 | 94.98 | ||||||||||||||
| Multiplus | 09.30.2011 | Direct | 73.17 | 73.17 | 73.17 | ||||||||||||||
| Pantanal | 09.30.2011 | Direct | 100.00 | 100.00 | 100.00 | ||||||||||||||
| TAM Milor (iii) | 09.30.2011 | 100.00 | |||||||||||||||||
| (i) | TAM's investments are held indirectly through TLA. |
| (ii) | TAM's investment is held 27% directly, 42% through TLA and 31% through Multiplus, respectively. |
| (iii) | TAM Milor was acquired in July 2010. On March 1, 2011, the Company merged its subsidiary TAM Milor into the Company. |
| 2.2. | New and revised standards and interpretations and amendments to existing standards and interpretations |
| (a) | The following accounting standard are mandatory for the year beginning in January 2011 and have been applied by TAM: |
| · | IFRIC 13 - "Customer Loyalty Programmes". The meaning of “fair value” is clarified in the context of measurement of award credits in customer loyalty programmes effective January 1, 2011. The application of the clarified guidance did not result in any impact on the financial position and results of operations since the Company was measuring the fair value of its award credits. |
| · | IAS 34 ammendment effective January 1, 2011 provides guidance to illustrate how to apply disclosure principles in IAS 34 and add disclosure requirements around: |
| a) | The circumstances likely to affect fair value of financial instruments and their classification; |
| b) | Transfers of financial instruments between different levels of the fair value hierarchy; |
| c) | Changes in classification of financial assets; and |
| d) | Changes in contingent liabilities and assets |
F-13
| TAM S.A. |
| Notes to the condensed consolidated interim financial information |
(In thousands of Dollar, unless otherwise indicated) |
The applicable additional disclosures are included in this interim financial information.
| 3. | Adjustments applied retroactively to prior period interim financial information |
In the annual financial statements for the year ended December 31, 2010, the Company changed its accounting policy related to revaluation of flight equipment at revalued amounts, in order that the consolidated profit and equity are equal to those presented in the parent company’s individual financial statements since the Brazilian corporate law does not permit the revaluation of property, plant and equipment.
The comparative information as of September 30, 2010 and for the quarter ended and the nine months ended September 30, 2010 presented herewith is being retroactively adjusted to reflect such change in accounting polices.
The effects of the retroactive adjustments at January 1, 2010 and for the quarter and for the the nine months ended September 30, 2010 are as follows:
| January 1, 2010 | ||||||||||||
As originally presented | Retrospective adjustment | Adjusted | ||||||||||
| Effects on equity | ||||||||||||
| Revaluation reserve | 67,578 | (67,578 | ) | |||||||||
| Accumulated deficit and other reserves | (172,271 | ) | 529,076 | 356,805 | ||||||||
| Total | (104,693 | ) | 461,498 | 356,805 | ||||||||
| Quarter ended | ||||||||||||
September 30, 2010 (Unaudited) | ||||||||||||
As originally presented | Retrospective adjustment | Adjusted | ||||||||||
| Effects on profit or loss | ||||||||||||
| Operating expenses | (1,284,917 | ) | (5,658 | ) | (1,290,575 | ) | ||||||
| Profit before income tax and social contribution | 656,100 | (5,658 | ) | 650,442 | ||||||||
| Income tax and social contribution | (226,333 | ) | 1,924 | (224,409 | ) | |||||||
| Profit for the period | 429,767 | (3,734 | ) | 426,033 | ||||||||
| Earnings per share - Basic | 2.81 | 2.79 | ||||||||||
| Earnings per share - Diluted | 2.81 | 2.78 | ||||||||||
| Effects on Statements of Comprehensive Income | ||||||||||||
| Profit for the period | 429,767 | (3,734 | ) | 426,033 | ||||||||
The only effect on all of the results is observed in the results for the period
F-14
| TAM S.A. |
| Notes to the condensed consolidated interim financial information |
(In thousands of Dollar, unless otherwise indicated) |
| Nine months ended | ||||||||||||
September 30, 2010 (Unaudited) | ||||||||||||
As originally presented | Retrospective adjustment | Adjusted | ||||||||||
| Effects on profit or loss | ||||||||||||
| Operating expenses | (4,116,267 | ) | (33,913 | ) | (4,150,180 | ) | ||||||
| Profit before income tax and social contribution | 513,664 | (33,913 | ) | 479,751 | ||||||||
| Income tax and social contribution | (197,977 | ) | 11,531 | (186,446 | ) | |||||||
| Profit for the period | 315,687 | (22,382 | ) | 293,305 | ||||||||
| Loss per share - Basic | 2.02 | 1.88 | ||||||||||
| Loss per share - Diluted | 2.02 | 1.87 | ||||||||||
| Effects on Statements of Comprehensive Income | ||||||||||||
| Profit for the period | 315,687 | (22,382 | ) | 293,305 | ||||||||
The only effect on all of the results is observed in the results for the period
| 4. | Derivative financial instruments and hedging operations |
The Company uses derivative instruments to manage its financial risks in order to economically hedge against these risks. The Company does not enter into transactions involving derivative instruments with speculative purposes.
As from August 31, 2011, Multiplus has designated the change in intrinsic value of all derivative financial instruments (which consist exclusively of zero cost collars, a combination of a purchase and a sale of options) as hedging instruments to hedge against the risk of changes in the cash flows (of certain highly probable future sales of points) caused by changes in the exchange rate between the Brazilian real and the U.S dollar. In designating the change in the intrinsic value of such derivative financial instruments as hedging instruments Multiplus has followed the requirements of IAS 39.
Multiplus decided to apply hedge accounting considering that revenue from the sales of points is recognized after billing to the financial institutions only at the moment when the participants in the loyalty program redeem their points for awards (the “curve of redemption of points”) and that there is a mismatch between the moment at which points are billed and recognized as deferred revenue and the moment at which points are redeemed and revenue is recognized in the statement of operations. By applying hedge accounting management believes that it reduces the mismatch between the timing of the recognition of the effects of the derivative financial instruments in the income statement and the timing of the recognition of revenue with respect to the transactions being hedged. Management also expects that a highly-effective hedge relationship will reduce the impact of the derivative instruments that is recognized under finance income and finance costs in the statement of operations.
Multiplus deems the cash flows from future sales of points to financial institutions as highly probable and categorizes the change in the intrinsic value of the derivative instruments contracted to protect those cash flows against exchange rate variations as “cash flow hedge” of such future sale. Derivative financial instruments designated as hedging instruments under hedge accounting are recognized as assets and liabilities in the balance sheet and are measured at fair value initially and subsequently remeasured to fair value. The effective portion of changes in the intrinsic value of derivatives that are designated and qualify as cash flow hedges is recognized in other comprehensive income within stockholder’s equity. The gain or loss relating to the ineffective portion is recognized immediately in the statement of operations within finance income and finance costs. No significant amount of ineffectiveness has been recognized in the statement of operations for the periods presented.
F-15
| TAM S.A. |
| Notes to the condensed consolidated interim financial information |
(In thousands of Dollar, unless otherwise indicated) |
Multiplus documents at the inception of the hedge relationship each operation, the relationship between hedging instruments and hedged items, including the risk management objectives and the strategy for the entering into the hedge transactions. Multiplus also documents, both at inception of the hedge relationship and on an ongoing basis, the calculations and /or assessments of whether intrinsic value of the derivative instruments designated as hedging instruments are highly effective in offsetting the change in cash flows in Reais attributable to the change in the exchange rate between the Brazilian real and the U.S dollar of the highly probable future sales of points.
In “cash flow hedge”, Multiplus hedges the changes in future cash flows from sales attributable to changes in the exchange rate and recognizes all changes in the fair value of the derivative financial instruments. The change in fair value attributable to the effective portion of the hedge relationship is recognized in other comprehensive income within shareholder’s equity and the ineffective portion and the time value which is not part of the hedging relationship is recognized directly in the income statement. The effective portion originally recognized in shareholder’s equity in other comprehensive income, will only be released or recycled into the statement of operations when the hedged item affect the income statement (which is the moment when the points that were hedged are redeemed by the participants). However, when a hedged item expires or when a hedge operation no longer meets the criteria for hedge accounting, any cumulative gain or loss existing in stockholder’s equity, at the time, remains in stockholders´equity until the moment in which the forecasted transaction is ultimately recognized in income.
Multiplus calculates the fair value of derivatives based on widely used statistical methods using series of techniques such as Black-Scholes-Merton (Garmann-Kohlhagen) to price options and discounted cash flow for swaps and forwards.
The hedging instruments are considered to be effective when the variation in the cash flow of the hedging instruments offsets between 80% and 125% of the changes in the hedged transaction.
The Company has not classified any derivative instrument in a “fair value hedge” or “net investment hedge” relationship.
| 5. | Financial instruments |
| 5.1 | Financial risk management |
TAM's activities expose it to a variety of financial risks: market risk (including currency risk, interest rate risk and price risk), credit risk and liquidity risk.
The Company has a formal Risk Management Policy that defines the rules to be followed and authorizes the Treasury Department to enter into derivative transactions in order to reduce the impact that possible fluctuations in fuel prices and foreign exchange and interest rates may have on its cash flows. The management of risk is monitored by the Risk Committee that is, responsible for, among other matters:
| · | Decide on any increase of the percentage level of protection based on strategic issues and monitor the comparison between the market and budgeted scenarios; |
| · | Manage and monitor the risk exposure; |
| · | Monitor compliance with the risk policy; |
| · | Decide on the exposure level of market risks; |
| · | Establish financial limits for all the institutions authorized to carry out derivative transactions; and |
| · | Monitor the performance of derivative transactions. |
Derivatives are contracted in line with TAM's policies, considering liquidity, impact on cash flow and cost/benefit analysis of each position taken. The control over the use of derivatives includes ensuring that the rates in derivative contracts are compatible with market rates.
The Company does not enter into transactions involving financial instruments, including derivative instruments, for speculative purposes.
F-16
| TAM S.A. |
| Notes to the condensed consolidated interim financial information |
(In thousands of Dollar, unless otherwise indicated) |
| 5.1.1 | Market risks |
The Company is exposed to market risks arising from its normal business activities. These market risks principally relate to changes in interest rates, exchange rates or aviation kerosene (QAV) and such variations can negatively affect its cash flows and future expenses. Market risk is the risk of a possible loss derived from variations in the prices of market prices (rates of exchange, interest rates, prices of commodities, or others) that may affect the Company’s cash flow or results. The Company entered into derivative contracts with the purpose of reducing the risks derived from variations in these factors. Policies and procedures have been implemented to evaluate these risks and to monitor the transactions with derivatives. The policies establish minimum and maximum levels of protection, and require that counterparties have investment grade credit rating as condition for entering into the transactions.
(a) Risks relating to variations in the price of jet fuel
One of the most important financial risks of airlines is the volatility of fuel price. The QAV price is linked to the variation of the oil price in the international market. The Company has entered into derivative transactions in order to economically hedge itself against this risk. TAM's Risk Committee has established policies for achieving this. The policy establishes to carry out derivative transactions covering a maximum level of 60% of the fuel consumption projected for the following 24 months and minimum level of 20% of the consumption projected for the first 12 months and 10% for the subsequent twelve months. Swaps, options, or a combination of these instruments, using market prices for crude oil, heating oil or jet fuel as the underlying, may be used to achieve TAM’s aims.
TAM protects itself against the volatility in its kerosene price by using derivatives based mainly on crude oil (West Texas Intermediate or "WTI"). The choice of this underlying item was based on studies that indicate that the hedge of QAV based on WTI is, historically, highly effective, in addition to the high liquidity of the financial instruments referenced in WTI. At September 30, 2011 all contracted financial instruments are over the counter.
The Company enters into derivative transactions only with counterparties classified by the main risk rating agencies (Standard & Poors, Fitch and Moody’s) as at a minimum investment grade.
As the consumed volume of kerosene is not fully protected through derivatives, increases in the price of kerosene are not fully offset by the derivatives. In the same way, decreases in the price of kerosene will have positive impact for the Company, since it will not be fully offset by changes in the fair value of the derivatives.
The aviation fuel consumed in the periods ended September 30, 2011 and 2010 accounted for 33.8% and 34.0%, respectively, of the cost of services provided by the Company (Note 23 (b)).
(a.1) Outstanding jet fuel derivatives:
The following table presents the percentages of anticipated consumption covered for the next 12 months after each date and the average strike price for the transactions outstanding as of each of those dates:
September 30, 2011 | December 31, 2010 | |||||||
| % of coverage anticipated for the next 12 months | 30 | % | 25 | % | ||||
| Average strike price for outstanding derivatives | US$ 93.5/bbl | US$ 87/bbl | ||||||
| Market price of WTI | US$ 79.2/bbl | US$ 89/bbl | ||||||
The following table presents both the notional amount and fair value of outstanding jet fuel derivatives as of each date broken down by maturity:
F-17
| TAM S.A. |
| Notes to the condensed consolidated interim financial information |
(In thousands of Dollar, unless otherwise indicated) |
| 2011 | 2012 | 2013 | 2014 | Total | ||||||||||||||||
| At September 30, 2011 | ||||||||||||||||||||
| Notional amount – thousands of barrels | 1,445 | 4,860 | 2,425 | 325 | 9,055 | |||||||||||||||
| Fair value, net – US$ thousand | (2,935 | ) | (23,777 | ) | (15,353 | ) | (435 | ) | (42,500 | ) | ||||||||||
| At December 31, 2010 | ||||||||||||||||||||
| Notional amount – thousands of barrels | 3,985 | 2,710 | 150 | 6,845 | ||||||||||||||||
| Fair value, net – US$ thousand | (5,876 | ) | (5,123 | ) | (109 | ) | (11,108 | ) | ||||||||||||
(b) Exchange rate risk
(b.1) TLA
A significant portion of the operating costs and expenses, such as aircraft and engine maintenance services, aircraft lease payments and aircraft insurance, are denominated in U.S. dollars. The Company may enter into derivative contracts to protect against a possible appreciation or depreciation of the Real against the U.S. dollar.
The notional amount and fair value of the foreign currency derivatives outstanding are presented below by year of maturity:
| 2012 | ||||
| At September 30, 2011 | ||||
| Notional amount – US$ | 31,000 | |||
| Fair value – US$ | 78 | |||
| At December 31, 2010 | ||||
| Notional amount – US$ | 31,000 | |||
| Fair value – US$ | (533 | ) | ||
In view of the restructuing of derivatives made in the first quarter of 2009 and in the second quarter of 2010, one of the counterparties required a deposit denominated in dollars as collateral guarantee. As deposits in foreign currency are not permitted in Brazil, a foreign exchange collar was entered into with the amount of the deposit as notional and also provided as collateral.
The collar transaction described above is the only foreign currency derivative outstanding at September 30, 2011 and December 31, 2010.
(b.2) Multiplus
The exchange rate risk consists of the risk of changes in the R$/US$ exchange rate that affects the selling price of points as part of the contracts where the price of the points are denominated in US$. These fluctuations may impact the cash flows and the sale price of points when measured in Reais.
The following table presents both the notional amount and fair value of outstanding derivatives as of each date broken down by maturity. The maturity date of the derivative is also the date on which the highly probable sale of points is expected to be billed. The highly probable sales of points are expected to be recognized in income after billed and management expects that they will be recognized in income on average in up to six months after billed.
F-18
| TAM S.A. |
| Notes to the condensed consolidated interim financial information |
(In thousands of Dollar, unless otherwise indicated) |
| 2011 | 2012 | 2013 | 2014 | Total | ||||||||||||||||
| At September 30, 2011 | ||||||||||||||||||||
Notional amount – US$ | 51,000 | 303,000 | 253,000 | 2,000 | 609,000 | |||||||||||||||
| Fair value at date of designation (August 31, 2011) – US$ | 1,455 | 2,504 | 64 | (46 | ) | 3,977 | ||||||||||||||
| Fair value at September 30, 2011, net – US$ | (1,398 | ) | (12,700 | ) | (14,329 | ) | (278 | ) | (28,705 | ) | ||||||||||
| (c) | Distribution of fair value by counterparty credit rating |
The distribution of fair value by counterparty credit rating and by type of risk being protected at September 30, 2011 and December 31, 2010 is presented below:
F-19
| TAM S.A. |
| Notes to the condensed consolidated interim financial information |
(In thousands of Dollar, unless otherwise indicated) |
| (i) | Effects of derivatives on the balance sheet |
September 30, 2011 | December 31, 2010 | |||||||||||||||||||
Counterparties with external credit rating Standard&Poors, Moody´s or Fitch) | Trading place | TLA | Multiplus | Total | TLA | Multiplus | Total | |||||||||||||
| AAA* | Over the counter | (7,808 | ) | (14,725 | ) | (22,533 | ) | (14,008 | ) | (14,008 | ) | |||||||||
| AA+, AA ou AA-* | Over the counter | (30,540 | ) | (13,980 | ) | (44,520 | ) | 2,203 | 2,203 | |||||||||||
| A+, A ou A-* | Over the counter | (4,074 | ) | (4,074 | ) | 164 | 164 | |||||||||||||
| (42,422 | ) | (28,705 | ) | (71,127 | ) | (11,641 | ) | (11,641 | ) | |||||||||||
| Fuel derivative asset – WTI | 16,309 | 16,309 | 9,881 | 9,881 | ||||||||||||||||
| Fuel derivative liability – WTI | (58,809 | ) | (58,809 | ) | (20,989 | ) | (20,989 | ) | ||||||||||||
| Fuel derivative, net – WTI | (42,500 | ) | (42,500 | ) | (11,108 | ) | (11,108 | ) | ||||||||||||
| Foreign exchange derivatives asset | 78 | 2,021 | 2,099 | |||||||||||||||||
| Foreign exchange derivatives liability | (30,726 | ) | (30,726 | ) | (533 | ) | (533 | ) | ||||||||||||
| Foreign exchange derivatives, net | 78 | (28,705 | ) | (28,627 | ) | (533 | ) | (533 | ) | |||||||||||
| (42,422 | ) | (28,705 | ) | (71,127 | ) | (11,641 | ) | (11,641 | ) | |||||||||||
| Amounts outstandin in other comprehensive income Equity | ||||||||||||||||||||
| Cash flow hedge | (22,248 | ) | (22,248 | ) | ||||||||||||||||
| Deferred income tax and social contribution | 7,565 | 7,565 | ||||||||||||||||||
| (14,683 | ) | (14,683 | ) | |||||||||||||||||
(*) The ratings can be expressed both in the global scale or in local currency. Each agency has a slightly different way to present rating. The table above unifies the presentations in what we believe is the most well known rating international scale.
F-20
| TAM S.A. |
| Notes to the condensed consolidated interim financial information |
(In thousands of Dollar, unless otherwise indicated) |
The Company monitors the concentration of financial instruments on a single counterparty. Internal policies require reporting of excessive concentrations to the Risk Committee. At September 30, 2011 there was two counterparties, with rating AAA and AA, that exceeded the limit established; however the Company believes this concentration of risk is acceptable.
(ii) Effect of derivatives in the statement of operations
Until August 2011, all gains and losses resulting from changes in fair value of derivatives entered into by Multiplus (which where not designated for cash flow hedge) were recognized in the statement of operations in the same line on which the transaction being economically hedged is recorded which in the case of Multiplus is revenue.
As further described above as from August 31, 2011, Multiplus designated the intrinsic value of all derivative as hedging instruments for hedge accounting purposes. For derivatives designated as hedging instruments the change in the intrinsic value is initially recorded in shareholder’s equity and released to income at the same time that the hedged transaction is recorded in income; upon release to income the amount originally recognized in equity is recorded in the line revenue. Also for derivatives designated as hedging instruments, the change in the time value of the derivatives is not part of the hedge relationship and this change is recognized immediately under finance income and finance cost.
September 30, 2011 | ||||||||
| Quarter | Nine months | |||||||
| Operating income | ||||||||
| Net gain – Change in fair value of derivatives settled through August 31, 2011 | 1,589 | 1,939 | ||||||
| Net gain - Change in fair value of unsettled derivatives until August 31, 2011 | 2,750 | 4,513 | ||||||
| 4,339 | 6,452 | |||||||
| Finance result | ||||||||
| Financial cost – Change in time value of derivative instruments designated for hedge accounting | (11,828 | ) | (11,828 | ) | ||||
| (7,489 | ) | (5,376 | ) | |||||
| (d) | Interest rate risk |
TAM’s earnings are affected by changes in interest rates due to the impact these changes have on interest expense from variable-rate debt instruments, variable-rate lease contracts, and on interest income generated from its cash and short-term investment balances. To minimize possible impacts from interest rate fluctuations, TAM has adopted a policy of diversification, alternating between contracting fixed and variable rates (such as the London Interbank Offered Rate “LIBOR” and CDI - Certificate of Deposit Intermediate).
The Company does not have financial instruments to hedge its cash flows against fluctuations in interest rates.
| (e) | Sensitivity analysis |
Presented below is a sensitivity analysis of the financial instruments that demonstrates the impact of changes in financial instruments on the result and equity of the Company by considering:
| · | Increase and decrease of 10 percent in fuel prices, by keeping constant all the other variables; |
F-21
| TAM S.A. |
| Notes to the condensed consolidated interim financial information |
(In thousands of Dollar, unless otherwise indicated) |
| · | Increase and decrease of 10 percent in R$/US$ exchange rate, with all other variables remaining steady; and |
| · | Increase and decrease of one percentage point in interest rate, by keeping constant all the other variables. |
(e.1) TLA
Fuel price:
A hypothetical 10% increase/decrease in the price of WTI would lead to an increase/decrease of approximately US$ 9,765 / US$ 83,125 in the fair value of WTI derivatives. This increase/ decrease would directly affect the Company’s net income. In terms of cash flows, however, these changes in WTI price would be more than offset by a decrease/increase in the Company’s kerosene-type jet fuel costs. The cash payments for settling the derivatives are due at their respective maturities, distributed from 2011 through 2014.
Exchange rate – U.S. Dollar:
If there was a 10% depreciation/appreciation of the Brazilian Reais against the U.S. dollar and all other variables remained constant, the financial result would have been affected by approximately US$ 418 million / US$ 418 million, mainly as a result of foreign exchange gains/losses on the translation of U.S. dollar denominated trade receivables and U.S. dollar denominated financial assets at fair value through profit or loss, and foreign exchange losses/gains on the translation of U.S. dollar-denominated borrowings and finance leases.
Interest rate – LIBOR and CDI:
A hypothetical 100 basis point increase in foreign market (LIBOR) interest rates in the quarter ended September 30, 2011 would increase its aircraft rental and interest expense over a one year period by approximately US$ 25,306.
If there was a hypothetical 100 basis point increase/ decrease in domestic market (CDI) interest rates in the quarter ended September 30, 2011 would increase/decrease loan and financing interest expenses over a one year period by approximately US$ 4,135.
(e.2) Multiplus
Exchange rate – U.S. Dollar (Derivatives):
If there was a 10% depreciation / appreciation of the Brazilian Reais against the U.S. dollar and all other variables remained constant, the financial result would have been affected by approximately US$ 11,646 / US$ 4,439, mainly as a result of the effect of the foreign exchange gain or losses on the time value of the derivatives which is recognized immediately in income.
| 5.1.2. | Credit risk |
Credit risk refers to the risk that counterparty will not fulfill its contractual obligations, leading the Company to incur financial losses. Credit risk arises from the possibility of TAM not recovering amounts receivable from services provided to consumers and/or travel agencies, or from amounts held with financial institutions generated by financial investment operations.
To reduce credit risk, TAM has adopted the practice of establishing credit limits and the permanent follow-up of its debtor balances (mainly from travel agencies).
F-22
| TAM S.A. |
| Notes to the condensed consolidated interim financial information |
(In thousands of Dollar, unless otherwise indicated) |
TAM only deals with financial institution counterparties which have a credit rating of at least BBB or equivalent issued by S&P, Moody’s or Fitch. Each institution has a maximum limit for investments, as determined by the Company’s Risk Committee.
Currently, management does not expect losses due to default of its counterparties and does not have any individually significant exposure to any counterparty.
| 5.1.3. | Liquidity risk |
Prudent liquidity risk management implies maintaining sufficient cash and short-term investments, the availability of funding through an adequate amount of committed credit facilities and the ability to close out market positions.
Excess cash is invested mainly through TAM’s exclusive investment funds. Each of these funds has a clear investment policy, with limits on concentration of risk in the underlying investments.
The table below analyses TAM's financial liabilities into relevant maturity groupings based on the remaining period at the reporting date to the contractual maturity date. The amounts disclosed in the table are the contractual undiscounted cash flows and include interest, except for derivatives, for which the fair value is disclosed.
F-23
| TAM S.A. |
| Notes to the condensed consolidated interim financial information |
(In thousands of Dollar, unless otherwise indicated) |
Less than one year | Between one and two years | Between three and five years | More than five years | Total | Effect of discounting | Carrying value | ||||||||||||||||
| Non-derivative financial liabilities | ||||||||||||||||||||||
| At September 30, 2011 | ||||||||||||||||||||||
| Finace lease obligations | 423,263 | 495,759 | 963,281 | 1,219,127 | 3,101,430 | (281,784 | ) | 2,819,646 | ||||||||||||||
| Senior notes | 90,471 | 121,963 | 271,416 | 1,393,947 | 1,877,797 | (765,785 | ) | 1,112,012 | ||||||||||||||
| Borrowings | 471,652 | 28,530 | 2,030 | 3,355 | 505,567 | (13,666 | ) | 491,901 | ||||||||||||||
| Debentures | 201,206 | 91,752 | 227,125 | 59,716 | 579,799 | (158,147 | ) | 421,652 | ||||||||||||||
| Refinanced taxes payable under Fiscal Recovery Program | 27,515 | 49,749 | 94,466 | 401,381 | 573,111 | (317,750 | ) | 255,361 | ||||||||||||||
| Other (i) | 540,207 | 540,207 | 540,207 | |||||||||||||||||||
| At December 31, 2010 | ||||||||||||||||||||||
| Finace lease obligations | 410,519 | 767,853 | 684,621 | 1,389,732 | 3,252,725 | (397,173 | ) | 2,855,552 | ||||||||||||||
| Senior notes | 65,239 | 98,572 | 98,572 | 743,533 | 1,005,916 | (400,312 | ) | 605,604 | ||||||||||||||
| Borrowings | 370,619 | 4,980 | 1,320 | 4,338 | 381,257 | (12,130 | ) | 369,127 | ||||||||||||||
| Debentures | 251,426 | 203,509 | 175,704 | 142,247 | 772,886 | (186,569 | ) | 586,317 | ||||||||||||||
| Refinanced taxes payable under Fiscal Recovery Program | 18,699 | 44,247 | 87,841 | 532,363 | 683,150 | (419,179 | ) | 263,971 | ||||||||||||||
| Other (i) | 593,683 | 593,683 | 593,683 | |||||||||||||||||||
| (i) | The amount is recorded under: Accounts payable and Salaries and social charges. |
F-24
| TAM S.A. |
| Notes to the condensed consolidated interim financial information |
(In thousands of Dollar, unless otherwise indicated) |
Less than one year | Between one and two years | Total (equal carrying value) | Carrying value | |||||||||||||
| Derivative financial liabilities | ||||||||||||||||
| At September 30, 2011 | ||||||||||||||||
| Fuel price risk | (33,992 | ) | (24,817 | ) | (58,809 | ) | (58,809 | ) | ||||||||
| Exchange rate risk | (12,680 | ) | (18,046 | ) | (30,726 | ) | (30,726 | ) | ||||||||
| At December 31, 2010 | ||||||||||||||||
| Fuel price risk | (11,815 | ) | (9,174 | ) | (20,989 | ) | (20,989 | ) | ||||||||
| Exchange rate risk | (533 | ) | (533 | ) | (533 | ) | ||||||||||
In the analysis of net current assets it should be noted that current liabilities include the balance of Deferred income which is composed by advanced ticket sales, deferred income with respect to TAM loyalty program and deferred gains on sale and leaseback amounting to US$ 890,108 (December 31, 2010 – US$ 1,081,011).
| 5.2. | Fair value estimation and fair value hierarchy |
The Company discloses the fair value of financial instruments by level of the following fair value measurement hierarchy:
| · | Level 1 - quoted prices (unadjusted) in active markets for identical assets or liabilities; |
| · | Level 2 - inputs other than quoted prices included within level 1 that are observable for the asset or liability, either directly (that is, as prices) or indirectly (that is, derived from prices), and |
| · | Level 3 - Inputs for the asset or liability that are not based on observable market data (that is, unobservable inputs). None of the financial instruments carried at fair value by the Company of its subsidiaries fall into this category at September 30, 2011. |
The table below presents the Company's financial instruments measured at fair value in the statement of financial position:
F-25
| TAM S.A. |
| Notes to the condensed consolidated interim financial information |
(In thousands of Dollar, unless otherwise indicated) |
September 30, 2011 | December 31, 2010 | ||||||||||||||||||
| Level 1 | Level 2 | Total | Level 1 | Level 2 | Total | ||||||||||||||
| Financial assets at fair value through profit or loss | |||||||||||||||||||
| Brazilian government securities (1) | 487,288 | 487,288 | 487,646 | 487,646 | |||||||||||||||
| Corporate securities (2) | 76,735 | 76,735 | 178,504 | 178,504 | |||||||||||||||
| Bank deposit certificates – CDB (3) | 56,281 | 56,281 | 20,525 | 20,525 | |||||||||||||||
| Other bank deposits (3) | 128,720 | 128,720 | 158,180 | 158,180 | |||||||||||||||
| 487,2888 | 261,736 | 749,024 | 487,646 | 357,209 | 844,855 | ||||||||||||||
| Derivative financial assets | |||||||||||||||||||
| Fuel hedge – WTI (4) | 16,309 | 16,309 | 9,881 | 9,881 | |||||||||||||||
| Foreign exchange | 2,099 | 2,099 | |||||||||||||||||
| 18,408 | 18,408 | 9,881 | 9,881 | ||||||||||||||||
| Derivative financial liabilities | |||||||||||||||||||
| Fuel hedge – WTI (4) | (58,809 | ) | (58,809 | ) | (20,989 | ) | (20,989 | ) | |||||||||||
| Foreign exchange derivatives (4) | (30,726 | ) | (30,726 | ) | (533 | ) | (533 | ) | |||||||||||
| (89,535 | ) | (89,535 | ) | (21,522 | ) | (21,522 | ) | ||||||||||||
No transfer of assets or liabilities between the levels of the fair value hierarchy took place during the periods ended September 30, 2011 and 2010.
The financial instruments recognized at fair value are determined as follows:
Financial assets measured at fair value through profit and loss:
| · | (1) Brazilian Government securities – Corresponds to highly liquid Brazilian government securities that have prices available and correspond to transactions in an active market. |
| · | (2) Corporate securities – Correspond, typically, to debt securities for which fair value has been determined based upon actual transactions observed in organized markets (when available) or discounted cash flows using interest rates when actual transactions are not available. |
| · | (3) Certificates of deposit and other bank deposits - Fair value has been estimated by discounting estimated cash flows using market interest rates as inputs. |
| · | (4) Derivative financial instruments not traded in an exchange, for example, over-the-counter derivatives. TAM estimates its fair value using a series of techniques such as Black&Scholes, Garman & Kohlhagen, Monte Carlo or even discounted cash flow models commonly used in the financial market, depending on the nature of the derivative. All models used are widely accepted in the market and reflect the contractual terms of the derivative. Those models do not contain a high level of subjectivity, since the methodologies used in the models do not require significant judgment, and all inputs to the model are readily observable from actively quoted markets. |
F-26
| TAM S.A. |
| Notes to the condensed consolidated interim financial information |
(In thousands of Dollar, unless otherwise indicated) |
| 5.3. | Capital management |
The objective of capital management is to ensure that TAM is able to continue as a going concern whilst delivering shareholder expectations of a strong capital basis as well as returning benefits to other stakeholders and optimizing the cost of capital.
Capital is managed by means of a leverage ratio. The Company’s capital structure is made up of its net indebtedness, defined as the total of loans, debentures and lease agreements (finance and operating), net of cash and cash equivalents and other short-term financial assets, and of the capital that is defined as the total net equity of shareholders and net indebtedness.
The Company is not subject to any externally imposed capital requirements.
The leverage ratios are as follows:
September 30, 2011 | December 31, 2010 | |||||||
| Cash and cash equivalents (Note 7) | (277,741 | ) | (607,502 | ) | ||||
| Financial assets at fair value through profit and loss (Note 5.2) | (749,024 | ) | (844,855 | ) | ||||
| Borrowings (Note 14.3) | 491,901 | 369,127 | ||||||
| Debentures and senior notes | 1,533,664 | 1,191,921 | ||||||
| Operating lease commitments (Note 28) | 713,178 | 672,607 | ||||||
| Finance lease obligations (Note 14.1) | 2,819,646 | 2,855,552 | ||||||
| Net debt (1) | 4,531,623 | 3,636,850 | ||||||
| Total equity | 1,094,980 | 1,576,876 | ||||||
| Total capital (2) | 5,626,603 | 5,213,726 | ||||||
| Leverage ratio (1) / (2) | 80.5 | % | 69.8 | % | ||||
The substancial increase in the leverage ratio results from the following main factors: i) reduction in equity resulting from loss for the period and distribution of dividends at the end of 2010; ii) increase in financial liabilities exposed to foreign exchange rate variation resulting from the devaluation of the real from R$ 1.6662 at December 31,2010 to R$ 1.8544 at September 30, 2011; iii) issuance US$ 500 million in Senior Notes and iv) reduction in cash and cash equivalents of approximately US$ 330 million.
Management believes that the resources available to the Company are sufficient for its present requirements and will be sufficient to meet its anticipated requirements for capital investments, which are approved annually by the Board of Directors, and other cash requirements for the 2011 fiscal year.
F-27
| TAM S.A. |
| Notes to the condensed consolidated interim financial information |
(In thousands of Dollar, unless otherwise indicated) |
| 6. | Financial instruments by category |
September 30, 2011 | ||||||||||||||||
Loans and receivables | Financial assets at fair value through profit and loss | Derivatives | Total | |||||||||||||
| Derivative financial instruments | 18,408 | 18,408 | ||||||||||||||
| Financial assets at fair value through profit and loss | 749,024 | 749,024 | ||||||||||||||
| Trade accounts receivable | 1,060,932 | 1,060,932 | ||||||||||||||
| Financial assets - Bank deposits | 86,590 | 86,590 | ||||||||||||||
| Restricted cash | 32,927 | 32,927 | ||||||||||||||
| Cash and cash equivalents | 277,741 | 277,741 | ||||||||||||||
| Total | 1,458,190 | 749,024 | 18,408 | 2,225,622 | ||||||||||||
December 31, 2010 | ||||||||||||||||
Loans and receivables | Financial assets at fair value through profit and loss | Derivatives | Total | |||||||||||||
| Derivative financial instruments | 9,881 | 9,881 | ||||||||||||||
| Financial assets at fair value through profit and loss | 844,855 | 844,855 | ||||||||||||||
| Accounts receivable | 934,330 | 934,330 | ||||||||||||||
| Financial assets - Bank deposits | 30,176 | 30,176 | ||||||||||||||
| Restricted cash | 59,000 | 59,000 | ||||||||||||||
| Cash and cash equivalents | 607,502 | 607,502 | ||||||||||||||
| Total | 1,631,008 | 844,855 | 9,881 | 2,485,744 | ||||||||||||
Liabilities, per balance sheet:
September 30, 2011 | ||||||||||||
Liabilities measured at amortized cost | Derivatives | Total | ||||||||||
| Finance lease obligations | 2,819,646 | 2,819,646 | ||||||||||
| Senior notes | 1,112,012 | 1,112,012 | ||||||||||
| Borrowings | 491,901 | 491,901 | ||||||||||
| Debentures | 421,652 | 421,652 | ||||||||||
| Derivative financial instruments | 89,535 | 89,535 | ||||||||||
| Accounts payable and other obligations, excluding statutory liabilitites | 540,206 | 540,206 | ||||||||||
| Total | 5,385,417 | 89,535 | 5,474,952 | |||||||||
F-28
| TAM S.A. |
| Notes to the condensed consolidated interim financial information |
(In thousands of Dollar, unless otherwise indicated) |
December 31, 2010 | ||||||||||||
Liabilities measured at amortized cost | Derivatives | Total | ||||||||||
| Finance lease obligations | 2,855,552 | 2,855,552 | ||||||||||
| Senior notes | 605,604 | 605,604 | ||||||||||
| Borrowings | 369,127 | 369,127 | ||||||||||
| Debentures | 586,317 | 586,317 | ||||||||||
| Derivative financial instruments | 21,522 | 21,522 | ||||||||||
| Accounts payable and other obligations, excluding statutory liabilitites | 593,683 | 593,683 | ||||||||||
| Total | 5,010,283 | 21,522 | 5,031,805 | |||||||||
| 7. | Cash and cash equivalents |
September 30, 2011 | December 31, 2010 | |||||||
| Cash and bank accounts | 65,904 | 167,615 | ||||||
| Short-term deposits | 211,837 | 439,887 | ||||||
| Total | 277,741 | 607,502 | ||||||
At September 30, 2011 and December 31, 2010 no amounts have been used as part of overdraft facilities.
| 8. | Trade accounts receivable |
| (a) | Breakdown of balances |
September 30, 2011 | December 31, 2010 | |||||||||||||||||||||||
| Domestic | International | Total | % | Total | % | |||||||||||||||||||
| Credit cards | 681,084 | 45,441 | 726,525 | 65,0 | 623,920 | 62.8 | ||||||||||||||||||
| Travel agents | 105,876 | 39,629 | 145,505 | 13,0 | 158,241 | 15.9 | ||||||||||||||||||
| Partners – Loyalty | ||||||||||||||||||||||||
| Program – Multiplus | 120,000 | 120,000 | 10,7 | 48,668 | 4.9 | |||||||||||||||||||
| On current account | 23,890 | 365 | 24,255 | 2,2 | 46,007 | 4.6 | ||||||||||||||||||
| Cargo | 3,773 | 25,117 | 28,890 | 2,6 | 32,241 | 3.2 | ||||||||||||||||||
| Other | 54,615 | 17,702 | 72,317 | 6,5 | 84,262 | 8.6 | ||||||||||||||||||
| Total | 989,238 | 128,254 | 1,117,492 | 100,0 | 993,339 | 100.0 | ||||||||||||||||||
| Provision for impairment | (37,615 | ) | (18,945 | ) | (56,560 | ) | (59,009 | ) | ||||||||||||||||
| Total | 951,623 | 109,309 | 1,060,932 | 934,330 | ||||||||||||||||||||
F-29
| TAM S.A. |
| Notes to the condensed consolidated interim financial information |
(In thousands of Dollar, unless otherwise indicated) |
Trade accounts receivable are maintained in the following currencies:
September 30, 2011 | December 31, 2010 | |||||||
| Reais | 989,238 | 869,539 | ||||||
| US dollars | 25,941 | 15,717 | ||||||
| Euros | 70,051 | 48,630 | ||||||
| Pounds sterling | 6,270 | 8,515 | ||||||
| Other | 25,992 | 50,938 | ||||||
| 1,117,492 | 993,339 | |||||||
| (b) | Aging list – Receivables by due date |
| Breakdown | September 30, 2011 | % | December 31, 2010 | % | ||||||||||||
| Not yet due | 1,040,127 | 93.1 | 798,132 | 80.3 | ||||||||||||
| Overdue | ||||||||||||||||
| Up to 60 days | 18,644 | 1.8 | 60,987 | 6.2 | ||||||||||||
| From 61 to 90 days | 2,674 | 0.2 | 36,861 | 3.7 | ||||||||||||
| From 91 to 180 days | 2,571 | 0.2 | 15,023 | 1.5 | ||||||||||||
| From 181 to 360 days | 970 | 0.1 | 11,712 | 1.2 | ||||||||||||
| Over 360 days | 52,506 | 4.7 | 70,624 | 7.1 | ||||||||||||
| 1,117,492 | 100.0 | 993,339 | 100.0 | |||||||||||||
| (c) | Provision for impairment of trade receivables |
September 30, 2011 | December 31, 2010 | |||||||
| Balance at the beginning of the year | 59,009 | 46,180 | ||||||
| Charge for the period | 6,836 | 18,485 | ||||||
| Amounts reversed | (3,296 | ) | (7,734 | ) | ||||
| Effect of conversion of functional currency to presentation currency | (5,989 | ) | 2,078 | |||||
| Balance at the end of the period | 56,560 | 59,009 | ||||||
The additions and recovery of accrued receivables were included in "Selling expenses" in the consolidated statements of operations.
The maximum exposure to credit risk at the reporting date is the carrying value of each type of receivable mentioned above.
F-30
| TAM S.A. |
| Notes to the condensed consolidated interim financial information |
(In thousands of Dollar, unless otherwise indicated) |
| 9. | Taxes recoverable |
September 30, 2011 | December 31, 2010 | |||||||
State Value Added Tax (ICMS) | 13,779 | 15,489 | ||||||
| Taxes recoverable | 12,542 | 10,040 | ||||||
Tax on Industrialized Products (PIS) and Social Security Financing Contribution (COFINS) - (i) | 276,492 | 3,338 | ||||||
| Income tax (IRPJ) and social contribution on income (CSLL) | 26,680 | |||||||
| IRRF | 4,476 | 12,998 | ||||||
| Other | 1,081 | 2,248 | ||||||
| 335,050 | 44,113 | |||||||
| Provision for impairment - ICMS | (8,598 | ) | (9,569 | ) | ||||
| 326,452 | 34,544 | |||||||
(i) TLA finalized during the quarter ended September 30, 2011 the revision of the criteria used in determining PIS and COFINS credits initiated in the prior quarter. During the quarter ended September 30, 2011 US$ 260 million of PIS and COFINS credits were recognized (of which US$ 233 million as a reduction of Operating costs- Fuel, US$ 3 million as a reduction of Finance costs and US$ 24 million as a reduction of Operating costs-Take-off, landing and navigation aid charges) as result of the change in estimate with respect to international passenger revenue. Considering its assessment of the tax rules and the legal opinions from independent tax advisors the Company recognized the PIS and COFINS credit over purchases considering the relationship between revenue subject to the cumulative and to the non-cumulative regime. During the quarter ended June 30, 2011 TLA had already recognized a change in estimate related to PIS and COFINS credits corresponding to credits over purchases measured considering the relationship between revenue subject to the cumulative and to the non-cumulative regime and to taxes paid in excess in prior periods for the amount of US$ 108 million (of which US$ 89 million as reduction of Operating costs-Fuel and US$ 19 million as reduction of Finance costs. Management has finalized during this quarter such revision and no further amounts are expected to be recognized with respect to this matter in future periods.
F-31
| TAM S.A. |
| Notes to the condensed consolidated interim financial information |
(In thousands of Dollar, unless otherwise indicated) |
| 10. | Derivative Financial Instruments |
September 30, 2011 | December 31, 2010 | |||||||
| Assets | ||||||||
| West Texas Intermediate crude oil derivatives | ||||||||
| Seagulls | 10,777 | 6,374 | ||||||
| Collar | 5,532 | 3,507 | ||||||
| 16,309 | 9,881 | |||||||
| Foreign currency derivatives | ||||||||
| Collar | 2,099 | |||||||
| 18,408 | 9,881 | |||||||
| Current | (14,796 | ) | (5,939 | ) | ||||
| Non-current | 3,612 | 3,942 | ||||||
| Liabilities | ||||||||
| West Texas Intermediate crude oil derivatives | ||||||||
| Seagulls | 20,032 | 20,460 | ||||||
| Collar | 38,777 | 529 | ||||||
| 58,809 | 20,989 | |||||||
| Foreign currency derivatives | ||||||||
| Swaps | 533 | |||||||
| Collar | 30,726 | |||||||
| 89,535 | 21,522 | |||||||
| Current | (46,672 | ) | (12,348 | ) | ||||
| Non-current | 42,863 | 9,174 | ||||||
The derivative financial instruments included above are described in Note 5.
| 11. | Financial assets – Bank deposits |
On September 30, 2011, the balance of bank deposits consists of financial notes issued by banks, totaled US$ 86,590 (December 31, 2010 – US$ 30,176) and all are denominated in Reais.
F-32
| TAM S.A. |
| Notes to the condensed consolidated interim financial information |
(In thousands of Dollar, unless otherwise indicated) |
Flight equipment (i) | Land and buildings | Computer equipment | Machinery and equipment | Construction in progress | Pre-delivery payments (ii) | Other (iii) | Total | |||||||||||||||||||
| Cost | 6,435,163 | 152,786 | 91,625 | 81,547 | 9,675 | 285,988 | 128,519 | 7,185,303 | ||||||||||||||||||
| Accumulated depreciation | (1,753,583 | ) | (26,948 | ) | (72,581 | ) | (41,782 | ) | (61,835 | ) | (1,956,729 | ) | ||||||||||||||
| Net book amount December 31, 2010 | 4,681,580 | 125,838 | 19,044 | 39,765 | 9,675 | 285,988 | 66,684 | 5,228,574 | ||||||||||||||||||
| Rembursement of pre-delivery payments (iv) | (67,595 | ) | (67,595 | ) | ||||||||||||||||||||||
| Additions (iv) | 375,115 | 2,010 | 10,767 | 2,936 | 2,212 | 216,764 | 5,670 | 615,474 | ||||||||||||||||||
| Transfers | 28,715 | 710 | 516 | 215 | 7,522 | (21,364 | ) | (5,219 | ) | 11,095 | (v) | |||||||||||||||
| Disposals/write-offs | (20,490 | ) | (10 | ) | (152 | ) | (2 | ) | (749 | ) | (21,403 | ) | ||||||||||||||
| Capitalized interest | 6,556 | 6,556 | ||||||||||||||||||||||||
| Other | ||||||||||||||||||||||||||
| Depreciation | (266,337 | ) | (2,826 | ) | (7,812 | ) | (5,403 | ) | (8,450 | ) | (290,828 | ) | ||||||||||||||
| Effect of conversion of functional currency to presentation currency | (491,442 | ) | (12,671 | ) | (2,280 | ) | (3,775 | ) | (2,419 | ) | (43,822 | ) | (5,805 | ) | (562,214 | ) | ||||||||||
| Net book amount September 30, 2011 | 4,307,141 | 113,061 | 20,225 | 33,586 | 16,988 | 376,527 | 52,131 | 4,919,659 | ||||||||||||||||||
| Cost | 6,117,037 | 139,761 | 92,317 | 75,885 | 16,988 | 376,526 | 115,131 | 6,933,645 | ||||||||||||||||||
| Accumulated depreciation | (1,809,896 | ) | (26,699 | ) | (72,091 | ) | (42,298 | ) | (63,002 | ) | (2,013,986 | ) | ||||||||||||||
| Net book amount September 30, 2011 | 4,307,141 | 113,062 | 20,226 | 33,587 | 16,988 | 376,526 | 52,129 | 4,919,659 | ||||||||||||||||||
F-33
| TAM S.A. |
| Notes to the condensed consolidated interim financial information |
(In thousands of Dollar, unless otherwise indicated) |
| (i) | Includes aircraft, engines and spare parts. Aircraft includes aircraft leased under finance leases, in accordance with IAS 17. As of September 30, 2011 TAM has 82 aircraft under finance leases (12.31.2010 – 79 aircraft). |
During the nine months ended September 30, 2011, the subsidiary TLA received five aircraft classified as under an operating lease. |
| (ii) | Amounts disbursed under the aircraft acquisition program are recorded as advances, since upon the disbursement the form of lease agreement that will be used is not yet defined. The Company's past experience shows that the refund by manufacturers of prepaid amounts upon the delivery of aircraft acquired under leases is probable. |
| (iii) | Basically furniture and vehicles. |
| (iv) | Transfers of pre-delivery payments occur when the aircraft are delivered and amounts are either returned to TAM or capitalized within flight equipment as “Additions”. |
| (v) | Transfers from items classified as intangible assets to property, plant and equipment. |
Properties and improvements of TLA are pledged as collateral for loans in the total amount of US$ 59,587 (12.31.2010 – US$ 66,318).
Other than aircraft, there are no significant amounts of property, plant and equipment outside of Brazil. Aircraft are based in Brazil but fly both domestically and internationally.
The depreciation expense is recorded in the consolidated statements of operations within operating expenses as follows:
| Quarter ended | Nine months ended | |||||||||||||||
September 30, 2011 | September 30, 2010 | September 30, 2011 | September 30, 2010 | |||||||||||||
| (Unaudited) | (Unaudited) | |||||||||||||||
| Cost of services rendered | 74,884 | 78,781 | 238,558 | 234,618 | ||||||||||||
| Selling expenses | 1,135 | 212 | 1,552 | 666 | ||||||||||||
| General and administrative expenses | 19,255 | 15,008 | 50,718 | 36,164 | ||||||||||||
| 95,274 | 94,001 | 290,828 | 271,448 | |||||||||||||
F-34
| TAM S.A. |
| Notes to the condensed consolidated interim financial information |
(In thousands of Dollar, unless otherwise indicated) |
| 13. | Intangible Assets |
| IT Projects (i) | Softwares | Other intangibles | License – Slots (ii) | Trademarks and patents | Goodwill | Total | ||||||||||||||||||
| Cost | 195,537 | 35,224 | 28,618 | 74,977 | 101,015 | 22,964 | 458,335 | |||||||||||||||||
| Accumulated amortization | (41,241 | ) | (31,614 | ) | (72,855 | ) | ||||||||||||||||||
| Net book amount | 154,296 | 3,610 | 28,618 | 74,977 | 101,015 | 22,964 | 385,480 | |||||||||||||||||
| At September 30, 2011 | 17,049 | 12,155 | 586 | 29,790 | ||||||||||||||||||||
| Additions | 90 | 90 | ||||||||||||||||||||||
| Transfer | (6,638 | ) | 6,679 | (11,136 | ) | (11,095 | ) | (iii) | ||||||||||||||||
| Amortization | (34,561 | ) | (7,047 | ) | (41,608 | ) | ||||||||||||||||||
| Result of conversion of functional currency to presentation currency | (12,872 | ) | (1,525 | ) | (1,453 | ) | (7,609 | ) | (10,251 | ) | (2,331 | ) | (36,041 | ) | ||||||||||
| Net book amount | 117,274 | 13,872 | 16,705 | 67,368 | 90,764 | 20,633 | 326,616 | |||||||||||||||||
| At September 30, 2011 | ||||||||||||||||||||||||
| Cost | 184,777 | 48,470 | 16,705 | 67,368 | 90,764 | 20,633 | 428,717 | |||||||||||||||||
| Accumulated amortization | (67,503 | ) | (34,598 | ) | (102,101 | ) | ||||||||||||||||||
| Net book amount | 117,274 | 13,872 | 16,705 | 67,368 | 90,764 | 20,633 | 326,616 | |||||||||||||||||
F-35
| TAM S.A. |
| Notes to the condensed consolidated interim financial information |
(In thousands of Dollar, unless otherwise indicated) |
| (i) | IT projects in progress and computer software are recorded at cost less accumulated amortization and impairment. Expenditure for development of projects and software, including the costs of materials, third-parties’ worked hours and other direct costs, are recognized when it is probable that they will be successful, taking into account their commercial and technological feasibility, and only when their cost can be reliably measured. Such expenses are amortized on the straight-line method over the period of the expected benefits. The anticipated amortization period is five years, depending on the useful life of each project. |
| (ii) | Upon the acquisiton of Pantanal in March 2010, management has identified as a separable intangible the airport operation rights. The fair value was estimated at US$ 67,368 and the asset is considered to have an indefinite useful life. |
| (iii) | Transfers from items classified as intangible assets to property, plant and equipment. |
The amortization expense is recorded in the consolidated statements of operations within operating expenses as follows:
| Quarter ended | Nine months ended | |||||||||||||||
September 30, 2011 | September 30, 2010 | September 30, 2011 | September 30, 2010 | |||||||||||||
| (Unaudited) | (Unaudited) | |||||||||||||||
| Cost of services rendered | 14,619 | 5,930 | 34,130 | 19,648 | ||||||||||||
| Selling expenses | 172 | 16 | 223 | 94 | ||||||||||||
| General and administrative expenses | 3,509 | 1,130 | 7,255 | 2,993 | ||||||||||||
| 18,300 | 7,076 | 41,608 | 22,735 | |||||||||||||
F-36
| TAM S.A. |
| Notes to the condensed consolidated interim financial information |
(In thousands of Dollar, unless otherwise indicated) |
The carrying value of financial liabilities, all of which are measured at amortized cost, and their corresponding fair values are shown in the following table:
| Fair value | Carrying value | |||||||||||||||
September 30, 2011 | December 31, 2010 | September 30, 2011 | December 31, 2010 | |||||||||||||
| Current | ||||||||||||||||
| Finance lease obligations | 366,262 | 340,547 | 366,262 | 340,547 | ||||||||||||
| Senior notes | 24,523 | 15,290 | 25,937 | 14,614 | ||||||||||||
| Borrowings | 430,688 | 348,891 | 459,624 | 360,330 | ||||||||||||
| Debentures | 157,836 | 239,830 | 154,154 | 228,029 | ||||||||||||
| 979,309 | 944,558 | 1,005,977 | 943,520 | |||||||||||||
| Non-current | ||||||||||||||||
| Finance lease obligations | 2,453,384 | 2,515,007 | 2,453,384 | 2,515,006 | ||||||||||||
| Senior notes | 1,033,849 | 618,345 | 1,086,075 | 590,990 | ||||||||||||
| Borrowings | 31,742 | 8,517 | 32,277 | 8,797 | ||||||||||||
| Debentures | 286,487 | 376,829 | 267,498 | 358,288 | ||||||||||||
| 3,805,462 | 3,518,698 | 3,839,234 | 3,473,081 | |||||||||||||
| 14.1 | Finance lease obligations |
| Monthly payments expiring | September 30, 2011 | December 31, 2010 | ||||||||
| Local currency | ||||||||||
| IT equipment | 2012 | 16,459 | 12,760 | |||||||
| Foreign currency – US$ | ||||||||||
| Aircraft | 2022 | 2,682,150 | 2,758,444 | |||||||
| Engines | 2017 | 118,594 | 81,984 | |||||||
| Machinery and equipment | 2012 | 2,443 | 2,364 | |||||||
| 2,819,646 | 2,855,552 | |||||||||
| Current | (366,262 | ) | (340,547 | ) | ||||||
| Non-current | 2,453,384 | 2,515,005 | ||||||||
TAM has provided letters of guarantee and deposits in guarantee with respect to finance leases.
The minimum payments under finance leases are classified:
F-37
| TAM S.A. |
| Notes to the condensed consolidated interim financial information |
(In thousands of Dollar, unless otherwise indicated) |
September 30, 2011 | December 31, 2010 | |||||||
| No later than one year | 423,263 | 410,519 | ||||||
| Later than one year and no later than five years | 1,459,040 | 1,452,474 | ||||||
| Later than five years | 1,219,127 | 1,389,732 | ||||||
| Effect of discounting | (281,784 | ) | (397,173 | ) | ||||
| 2,819,646 | 2,855,552 | |||||||
At September 30, 2011, the Company through its subsidiaries TLA and Mercosur, has 82 aircraft (12.31.2010 – 79 aircraft) under finance leases.
| 14.2 | Senior notes |
September 30, 2011 | December 31, 2010 | |||||||
| TAM Capital, Inc. (i) | 305,750 | 299,712 | ||||||
| TAM Capital 2, Inc. (ii) | 299,267 | 305,892 | ||||||
| TAM Capital 3, Inc. (iii) | 506,995 | |||||||
| 1,112,012 | 605,604 | |||||||
| Current | (25,937 | ) | (14,614 | ) | ||||
| Non-current | 1,086,075 | 590,990 | ||||||
(i) On April 25, 2007, TAM Capital Inc. concluded the offering of 3,000 senior notes, with a nominal value of US$ 100 thousand each, in the total amount of US$ 300 million, incurring debt issuance costs of US$ 6.8 million, carrying interest at 7.375% p.a. (resulting in an effective interest rate of 7.70%). Interest is payable semiannually and with principal payable in a bullet payment, in 2017. The notes were issued outside Brazil under an exemption from registration with the Brazilian CVM. The Company registered the notes with the United States Securities and Exchange Commission (“SEC”) on October 30, 2007.
(ii) On October 22, 2009, TAM Capital 2 Inc. concluded the offering of 3,000 senior notes, with nominal value of US$ 100 thousand each, in the total amount of US$ 300 million, carrying interest at 9.5% p.a. (resulting in an effective interest rate of 9.75%). The notes were issued outside Brazil under an exemption from registration with the Brazilian CVM and with the SEC. TAM Capital 2 has the option to early redeem the Senior Notes at any time prior to January 29, 2015. In the event of early prepayment, a redemption price must be paid. Management has concluded that the redemption price compensates the lender for loss of interest and, as such the redemption option is considered clearly and closely related to the Senior Notes.
(iii) On June 3, 2011, TAM Capital 3 Inc. concluded the offering of 5,000 senior notes, with nominal value of US$ 100 thousand each, in the total amount of US$ 500 million, incurring debt issuance costs of US$ 6.4 million, carrying interest at 8.375% p.a. (resulting in an effective interest rate of 8.570% p.a.) payable semi-annually from December 2011 with the principal payable in full on June 2021. The notes were issued outside Brazil under an exemption from registration with the Brazilian CVM and with the SEC. TAM Capital 3 has the option to early redeem the senior notes at any time prior to June 3, 2016. In the event of early prepayment, a redemption price must be paid. Management has concluded that the redemption price compensates the lender for loss of interest and, as such the redemption option is considered clearly and closely related to the Senior Notes.
F-38
TAM S.A.
Notes to the condensed consolidated interim financial statements
(In thousands of Dollar, unless otherwise indicated)
| 14.3. | Borrowings |
| (a) | Balance composition |
| Guarantees | Interest rate (effective rates for 2011 and 2010) | Payment terms and year of last payment | September 30, 2011 | December 31, 2010 | ||||||||||
| Local currency | ||||||||||||||
| FINEM – Sub credit A (i) | Mortgage of assets and accounts receivable | TJLP + 4.5% p.a. (10.5% p,a. and 10.8%p.a.) | Monthly until November, 2011 | 1,343 | 8,225 | |||||||||
| FINEM –Sub credit B (ii) | Mortgage of assets and accounts receivable | Basket of currencies BNDES + 3.0% p.a. (12.2% p.a. and 10.5% p.a.) | Monthly until 2012 | 380 | 1,216 | |||||||||
| Others | Monthly until 2013 | 1,258 | 2,184 | |||||||||||
| Foreign currency | 2,981 | 11,625 | ||||||||||||
| FINIMP (iii) | Promissory notes from a minimum of US$ 1,111 thousand to a maximum at US$ 18,707 thousand | LIBOR +2.15% p.a. to 5.7% p.a. (4.3% p.a. and 5.3% p.a.) | Annually until June, 2012 | 378,009 | 304,233 | |||||||||
| International Finance Corporation – IFC (Working capital) (iv) | Deposits in guarantee US$ 2,500 thousand | 6 months LIBOR + 3% p.a. (3.4% p.a. and 6.6%p.a.) | Half-yearly until 2012 | 2,877 | 4,364 | |||||||||
| Leasing renegotiation (v) | Letter of guarantee | Fixed installments of US$ 55 thousand | Monthly until 2022 | 5,093 | 5,354 | |||||||||
| Financing – Pre-delivery payment (vi) | Unconditional guarantee | Monthly LIBOR + 0.6% p.a. (0.3% p.a and 2.6% p.a) | Second semester 2011 | 101,519 | 41,201 | |||||||||
| Other (vii) | 1,422 | 2,350 | ||||||||||||
| 488,920 | 357,502 | |||||||||||||
| 491,901 | 369,127 | |||||||||||||
| Current | (459,624 | ) | (360,330 | ) | ||||||||||
| Non-current | 32,277 | 8,797 | ||||||||||||
FINIMP – Import Financing, FINEM – Government agency financing for machinery and equipment, TJLP – Long term interest rate and CDI – Interbank deposit rate.
F-39
TAM S.A.
Notes of the interim financial statements
(In thousands of Dollar, unless otherwise indicated)
Non-current maturities are as follows:
| Year | September 30, 2011 | December 31, 2011 | ||||||
| 2012 | 27,324 | 3,616 | ||||||
| 2013 | 690 | 641 | ||||||
| 2014 | 467 | 418 | ||||||
| 2015 | 443 | 444 | ||||||
| After 2015 | 3,353 | 3,678 | ||||||
| 32,277 | 8,797 | |||||||
| (b) | Description of the loans and financings: |
| (i) | Loan obtained in order to finance the investment plan of 2004 and 2005 focused on expanding the São Carlos technology center, the acquisition of equipment and materials made in Brazil, the development of software technical and managerial training and environmental projects. |
| (ii) | TAM signed financing agreements for the acquisition of machines and equipment. The transaction was entered into in 2006, with Itaú Unibanco. |
| (iii) | TAM obtained loans of the FINIMP-type, to finance imports of aircraft parts. Among currently active transactions, loans from banks Safra, Banco do Brasil and Itaú BBA have maturities through June 2012. |
| (iv) | On December 16, 2005, TLA entered into a loan agreement with the International Finance Corporation (IFC) to finance up to US$ 33 million of PDP (pre-delivery payment) for Airbus aircraft. |
| (v) | Debt resulting from, renegotiation of a contact for airplanes and parts TAM and Fokker Aircraft BV entered into in June 25, 1982. |
| (vi) | TLA and TAM Financial 3, entered in 2011, into a loan agreement of loan with Natixis and Crédit Agricole to finance up to US$ 100.0 million of PDP (pre-delivery payment) with respect to Airbus aircraft. |
| (vii) | Contract for acquisition of IT equipment software and related services. |
F-40
TAM S.A.
Notes of the interim financial statements
(In thousands of Dollar, unless otherwise indicated)
| 14.4 | Debentures |
September 30, 2011 | December 31, 2010 | |||||||
| TAM S.A. (i) | 91,577 | 208,739 | ||||||
| TAM Linhas Aéreas S.A. (ii) | 330,075 | 377,578 | ||||||
| 421,652 | 586,317 | |||||||
| Current | (154,154 | ) | (228,029 | ) | ||||
| Non-current | 267,498 | 358,288 | ||||||
Non-current maturities are as follows:
| Year | September 30, 2011 | December 31, 2010 | ||||||
| 2012 | 58,872 | |||||||
| 2013 | 53,375 | 59,349 | ||||||
| 2014 | 53,485 | 60,017 | ||||||
| 2015 | 53,485 | 60,017 | ||||||
| After 2015 | 107,153 | 120,033 | ||||||
| 267,498 | 358,288 | |||||||
| (i) | TAM S.A. |
On July 7, 2006 the Board of Directors approved the issuance for public distribution of simple, nonconvertible and unsecured debentures, with no preference but with a guarantee provided by the subsidiary TLA.
On August 1, 2006, TAM S.A. concluded the offering of 50,000 simple debentures in a single series, with a nominal value of R$ 10 each, totaling an amount of R$ 500,000, incurring debt issue costs of US$ 870. The debentures expire in six (6) years. Principal is repayable in 3 annual payments, the first installment was paid on August 1, 2010.
Interest is payable on a semiannual basis, at a rate equivalent to 104.5% of the CDI (effective interest rate at the date of issuance of 15.38%) calculated and published by CETIP (the custodian and liquidation agent). At September 30, 2011 the effective interest rate was 12.00% (12.31.2010 – 10.19%).
The debenture indenture provides for the compliance with certain covenants based on financial ratios calculated based on Brazilian accounting practices in effect up to 2007. With the application of the new accounting practices defined by IFRS, especially the one that requires the recognition in the Company's financial statements of finance lease agreements, the coverage ratio of the company's debt has increased. It should be noted that at December 31, 2010 this ratio has exceeded the limit agreed. As a result the debentures were subject to be declared matured early although this was not automatic and it required to be approved at a General Meeting of debenture holders.
F-41
TAM S.A.
Notes of the interim financial statements
(In thousands of Dollar, unless otherwise indicated)
At the debenture holders’ meeting on February 7, 2011, the issuer’s proposal for authorizing the trustee not to decree the accelerated maturity was approved, solely as of the measurement date of December 31, 2010. In connection with this waiver, the issuer agreed to pay a waiver award to debenture holders, equivalent to 1.70% of the unit price at the payment date, which was paid on March 1, 2011. As a result at December 31, 2010 the Company reclassified the long-term portion with maturity scheduled for 2012 to current, in the amount of US$ 99,853. Additionally, the Company evaluated its other financing agreements, including leases, and concluded that there are no other balances that should be reclassified to current liabilities. At September 30, 2011, the amount is fully recognized as a current liability.
| (ii) | TAM Linhas Aéreas S.A. |
On July 16, 2009 the Board of Directors approved the issuance for public distribution of simple and nonconvertible debentures, with a guarantee provided by TAM S.A.
On July 24, 2009 TAM Linhas Aéreas S.A. concluded the offering of 600 simple debentures in a single series, with a nominal value of R$ 1,000 each for a total amount of R$ 600,000 and debt issue costs of US$ 4,025. On July 22, 2010 the Extraordinary Shareholders Meeting approved the change in the maturity dates. The final maturity was changed from July 24, 2013 to July 24, 2017, the principal repayments were changed from quarterly payments to semi-annual payments with the date for the first repayment of principal originally due on July 24, 2010 to January 24, 2012. The cost of this renegotiation was US$ 1,702.
Payment of interest has been modified from monthly payments to semiannual payments, at a rate equivalent to 124% of the CDI (interest rate at the date of issuance of 13.25%), calculated and published by CETIP (the custodian and liquidation agent). The effective interest rate was 14.24% p.a at September 30, 2011 (12.31.2010 – 12.09%).
The Company may exercise early redemption at any time, at its discretion, by sending or publishing a notice to debenture holders 10 days in advance. The early redemption can be total or partial. The debentures subject to this procedure are mandatorily canceled. Management has concluded that the amount payable upon early redemption is approximately equal to the amortized cost of the debentures and, as such, the redemption option is considered clearly and closely related to the debentures.
| 15. | Deferred Income |
September 30, 2011 | December 31, 2010 | |||||||
| Advanced ticket sales | 423,222 | 565,459 | ||||||
| TAM loyalty program | 449,064 | 495,298 | ||||||
| Sale and leaseback – deferred gains (i) | 41,815 | 60,117 | ||||||
| 914,101 | 1,120,874 | |||||||
| Current | (890,108 | ) | (1,081,011 | ) | ||||
| Non-current | 23,993 | 39,863 | ||||||
F-42
TAM S.A.
Notes of the interim financial statements
(In thousands of Dollar, unless otherwise indicated)
| (i) | The deferred gains on sale and leaseback transactions relate to sales of aircraft in 2001 and 2003. The gains are being recognized in the statements of operations on a straight-line basis through to 2013. On March 4, 2011, the Company entered into a sale and leaseback related to one engine. The gain from this transaction was US$ 2,706 and is being amortized on a straight-line basis through to 2015. |
| 16. | Refinanced taxes payable under Fiscal Recovery Program (REFIS) |
In November 2009, TLA and Pantanal applied to the Fiscal Recovery Programa (REFIS), established by Law n° 11,941/09 and Provisional Measure, n° 449/2009. REFIS has the purpose of allowing to settle tax debt through a special mechanism for paying and refinancing tax and social security liabilities. The general conditions of the effects to applying to REFIS are summarized below:
| · | Payment will be made in 180 monthly installments depending on the nature of the debt; |
| · | Reduction of penalties and interest; |
| · | Obligation to make the monthly payments and not become overdue more than three months; and |
| · | Withdraw all lawsuits the participant has initiated with respect to the taxes included in REFIS. If those commitments are not honored the Company will be excluded from the REFIS and a new tax debt will be determined based on the amounts originally due. |
During the six months ended June 30, 2011 the tax authorities concluded the final processing of the REFIS application and the total amounts of the debt under REFIS consists of the following:
Original amount | Penalties | Interest | Fees | Total | ||||||||||||||||
| Cofins (i) | 104,493 | 3,961 | 72,207 | 180,661 | ||||||||||||||||
| Pis (i) | 20,115 | 1,469 | 21,873 | 43,457 | ||||||||||||||||
| Refinanced taxes payable under Fiscal Recovery Program from Pantanal (ii) | 10,901 | 1,031 | 13,417 | 1,670 | 27,019 | |||||||||||||||
| Other | 8,345 | 431 | 3,296 | 12,072 | ||||||||||||||||
| 143,854 | 6,892 | 110,793 | 1,670 | 263,209 | ||||||||||||||||
(i) Refers to the increase in the tax base of the PIS tax and the increase in the contribution and basis of calculation of COFINS tax, established by Law n° 9,718/98. In accordance with the requirements of the REFIS the Company has already filed a dismissal of the lawsuits it had begun challenging the unconstitutionality of such increases.
(ii) Refers to the remaining balance of previous tax refinancing program of Pantanal with respect to years 2000 to 2006
As a result of the final processing of the debt by the tax authorities on June 30, 2011, the total amount of the debt corresponds to a single tax debt irrespective of the tax or contribution that had originally generated the tax liability. The status of the total amount due is as follows:
F-43
TAM S.A.
Notes of the interim financial statements
(In thousands of Dollar, unless otherwise indicated)
September 30, 2011 | ||||
| Consolidated debt | 237,180 | |||
| Consolidated debt adjusment | 6,315 | |||
| Index | 21,207 | |||
| Payments made | (9,342 | ) | ||
| Balance at September 30, 2011 | 255,360 | |||
| Currrent (*) | (25,852 | ) | ||
| Non-current | 229,508 | |||
(*) The amount is recorded under “Taxes, charges and contributuion” in current liabilities.
The total consolidated debt under REFIS classified as non-current has the following maturities:
| Year | US$ | |||
| 2012 | 6,282 | |||
| 2013 | 19,588 | |||
| 2014 | 18,822 | |||
| 2015 | 18,822 | |||
| 2016 | 18,822 | |||
| 2017 | 18,822 | |||
| 2018 | 18,822 | |||
| 2019 | 18,822 | |||
| 2020 | 18,822 | |||
| 2021 | 18,822 | |||
| 2022 | 18,822 | |||
| 2023 | 18,822 | |||
| 2024 | 15,418 | |||
| Total | 229,508 | |||
| 17. | Other Liabilities |
September 30, 2011 | December 31, 2010 | |||||||
| Reorganization of Fokker 100 Fleet (i) | 31 | 8,318 | ||||||
Maintenance provision – “Power by the hour” | 262,258 | 151,563 | ||||||
| Other liabilities | 45,142 | 64,061 | ||||||
| 307,431 | 223,942 | |||||||
| Current | (87,760 | ) | (81,419 | ) | ||||
| Non-current | 219,671 | 142,523 | ||||||
F-44
TAM S.A.
Notes of the interim financial statements
(In thousands of Dollar, unless otherwise indicated)
| (i) | Pursuant to the agreement to return the Fokker 100 fleet, on December 19, 2003 TLA cancelled 19 lease agreements then outstanding, of which ten were finance leases and nine were operating leases. As a result, TLA agreed to pay a contractual rescission penalty in 30 consecutive quarterly installments, between April 2004 and July 2011 for an original amount of US$ 32,170. This amount was recognized in the statement of operations in the year ended December 31, 2003. The Company issued letters of guarantee as Security. TLA also renegotiated the rescheduled overdue installments for an original amount of US$ 26,747. |
| 18. | Provisions |
| (a) | Changes in the reserve for contingencies |
Management of the Company and its subsidiaries recorded provisions for contingencies in all cases where loss by the Company is deemed probable based on advice provided by the Company’s internal and external legal counsel. As at September 30, 2011 the amount of provisions and the corresponding judicial deposits recognized were as follows:
December 31, 2010 | Additional Provisions (Deposits) | Payments | Financial charges | Result of conversion of functional currency to presentation currency | September 30, 2011 | |||||||||||||||||||
| Airline staff fund (i) | 104,565 | 15,961 | 7,232 | (13,392 | ) | 114,366 | ||||||||||||||||||
| Labor contingencies | 12,562 | 1,917 | (150 | ) | (1,540 | ) | 12,789 | |||||||||||||||||
| Civil litigation | 51,777 | 3,976 | (5,832 | ) | 49,921 | |||||||||||||||||||
| Other tax contingencies | 28,886 | 9,203 | 546 | (4,084 | ) | 34,551 | ||||||||||||||||||
| Total | 197,790 | 31,057 | (150 | ) | 7,778 | (24,848 | ) | 211,627 | ||||||||||||||||
| (-)Judicial deposits | (75,193 | ) | (12,440 | ) | 11 | 8,939 | (78,683 | ) | ||||||||||||||||
| Total | 122,597 | 18,617 | (139 | ) | 7,778 | (15,909 | ) | 132,944 | ||||||||||||||||
| (i) | Corresponds to the collection of 2.5% on the monthly payroll for private social welfare and professional training entities. TLA management, based on the opinion of its external legal counsel, is contesting the constitutionality of this collection, and the non-payment is supported by a judicial order. |
| (b) | Possible contingencies |
The Company and its subsidiaries are also parties to tax, labor and civil lawsuits, involving risks of loss that management, based on the assessment made by its legal counsel, classified as possible and, therefore, no provision a was required. The estimated amounts are as follows:
F-45
TAM S.A.
Notes of the interim financial statements
(In thousands of Dollar, unless otherwise indicated)
September 30, 2011 | December 31, 2010 | |||||||
| Tax contingencies | ||||||||
| ICMS (State Value Added Tax) | 222,862 | 230,089 | ||||||
| IRPJ and CSLL (Income taxes) | 81,860 | 81,752 | ||||||
| Special customs regime for temporary | 55,352 | 61,574 | ||||||
| Others (i) | 572,186 | 80,438 | ||||||
| 932,260 | 453,853 | |||||||
| Civil litigation | 29,025 | 18,552 | ||||||
| Labor contingencies | 203,812 | 189,944 | ||||||
| 1,165,097 | 662,349 | |||||||
(i) The increase relates to the following tax assessments:
| (a) | Administrative process (n. 10314.720023/2011-15) resulting from a tax asessment through which the tax inspector requires payment of Tax on Industrialized Products (Imposto sobre Produto Industrializado - IPI) on import of aircrafts from April 2006 through February 2009. The tax authorities claim that IPI exemption depends on certain requirements being met including proving that the entity is in full compliance with its tax obligations a requirement allegedly not met by TAM considering that for certain periods the following certicates allegedly were not presented: Compliance Certificate of FGTS, Joint Certificate of Tax Debts and of Federal Outstanding Debits (either a certificate indicating non-existence of debt - negative - or a certificate indicating debts but with same effects of a negative certificate) in certain periods. |
| (b) | Administrative processes (AI 10314.720018/2011-75) resulting from a tax asessment through which the tax inspector requires payment of Tax on Industrialized Products (Imposto sobre Produto Industrializado - IPI), payment of IPI on imports and COFINS on imports on the import of spare parts for aircrafts to be used for repais, checks and maintenance of aircrafts from June 2006 through July 2010. The tax authorities claim that IPI exemption and taxation at zero rate for IPI and COFINS on imports depends on certain requirements being met including proving that the entity is in full compliance with its tax obligations a requirement allegedly not met by TAM considering that for certain periods the following certicates allegedly were not presented: Compliance Certificate of FGTS, Joint Certificate of Tax Debts and of Federal Outstanding Debits (either a certificate indicating non-existence of debt - negative - or a certificate indicating debts but with same effects of a negative certificate) in certain periods. |
Those assesments amounted to US$ 441,797 of which US$ 415,580 corresponds to IPI on aircrafts. TAM has presented defense to the processes and tax advisors estimate that the probability of sucess is possible in both cases.
| 19. | Deferred Income Tax and Social Contribution |
Deferred income tax and social contribution assets and liabilities are offset when there is a legal right of offsetting tax credits against taxes payable and provided that they refer to the same tax authority.
The movement in deferred income tax and social contribution assets and liabilities during the period ended September 30, 2011, without taking into consideration the offsetting of balances within the same tax jurisdiction, is as follows:
F-46
TAM S.A.
Notes of the interim financial statements
(In thousands of Dollar, unless otherwise indicated)
Deferred income tax and social contribution asset | December 31, 2010 | Charged/(credited) to the statements of operations | Result of conversion of functional currency to presentation currency | June 30, 2011 | Charged/(credited) to the statements of operations | Result of conversion of functional currency to presentation currency | September 30, 2011 | |||||||||||||||||||||
| Income tax loss carry forwards | 37,383 | 6,475 | 2,793 | 46,651 | (5,817 | ) | (6,692 | ) | 34,142 | |||||||||||||||||||
| Social contribution carry forwards | 13,533 | 3,719 | 1,065 | 18,317 | (2,837 | ) | (2,563 | ) | 12,917 | |||||||||||||||||||
| Temporary differences: | ||||||||||||||||||||||||||||
| Provision for derivatives loss / gains | 3,659 | (7,485 | ) | (472 | ) | (4,298 | ) | 31,519 | (3,037 | ) | 24,184 | |||||||||||||||||
| Provision for contingencies | 56,421 | 10,319 | 4,263 | 71,003 | 2,422 | (11,515 | ) | 61,910 | ||||||||||||||||||||
| Allowance for losses on inventories and receivables accounts | 23,506 | (149 | ) | 1,539 | 24,896 | 265 | (3,969 | ) | 21,192 | |||||||||||||||||||
| Deferred income from sale leaseback transaction | 16,992 | (2,410 | ) | 1,060 | 15,642 | (1,717 | ) | (2,272 | ) | 11,653 | ||||||||||||||||||
| TAM loyalty program | 39,616 | (30,657 | ) | 1,219 | 10,178 | (4,328 | ) | (1,100 | ) | 4,750 | ||||||||||||||||||
| Finance leases | (259,804 | ) | (37,681 | ) | (18,486 | ) | (315,971 | ) | 158,791 | 31,246 | (125,934 | ) | ||||||||||||||||
| Other | 29,285 | (12,630 | ) | 1,029 | 17,684 | 4,087 | (3,279 | ) | 18,492 | |||||||||||||||||||
| Sub-total | (39,409 | ) | (70,499 | ) | (5,990 | ) | (115,898 | ) | 182,385 | (3,181 | ) | 63,306 | ||||||||||||||||
| Property, plant and equipment | (27,316 | ) | 283 | (1,830 | ) | (28,863 | ) | 121 | 4,551 | (24,191 | ) | |||||||||||||||||
| Sub-total | (66,725 | ) | (70,216 | ) | (7,820 | ) | (144,761 | ) | 182,506 | 1,370 | 39,115 | |||||||||||||||||
| Deferred income tax and social contribution liability on intangible assets on acquisition of Pantanal | (22,964 | ) | 1,022 | (2,568 | ) | (24,510 | ) | 3,877 | (20,633 | ) | ||||||||||||||||||
| Total deferred income tax and social contribution | (89,689 | ) | (69,194 | ) | (10,388 | ) | (169,271 | ) | 182,506 | 5,247 | 18,482 | |||||||||||||||||
F-47
TAM S.A.
Notes of the interim financial statements
(In thousands of Dollar, unless otherwise indicated)
December 31, 2010 | September 30, 2011 | |||||||
| Deferred income tax and social contribution expected to be recovered within 12 months - Net | (39,439 | ) | 37,596 | |||||
| Deferred income tax and social contribution expected to be recovered within more than 12 months – Net | (50,250 | ) | (19,114 | ) | ||||
| (89,689 | ) | 18,482 | ||||||
Deferred tax assets resulting from income tax and social contribution losses and temporary differences are recognized to the extent that the realization of the related tax benefit through the future taxable profits is probable. Tax loss carryforwards in Brazil do not expire.
At September 30, 2011, there were unrecognized deferred tax assets relating to the tax losses of foreign subsidiaries in the amount of US$ 77,765 (12.31.2010 – US$ 39,721).
| (a) | Income tax and social contribution expense |
| Quarter ended | Nine months ended | |||||||||||||||
September 30, 2011 | September 30, 2010 | September 30, 2011 | September 30, 2010 | |||||||||||||
| (Adjusted (*)) | (Adjusted (*)) | |||||||||||||||
| (Unaudited) | (Unaudited) | |||||||||||||||
| Current tax | (46,596 | ) | (26,179 | ) | (97,455 | ) | (33,819 | ) | ||||||||
| Deferred tax | 182,506 | (198,230 | ) | 113,312 | (152,627 | ) | ||||||||||
| 135,910 | (224,409 | ) | 15,857 | (186,446 | ) | |||||||||||
The tax on TAM's profit before taxes differs from the theoretical amount that would arise using the tax rate applicable to TAM, TLA and its Brazilian subsidiaries as follows:
(*) See Note 3
F-48
TAM S.A.
Notes of the interim financial statements
(In thousands of Dollar, unless otherwise indicated)
| Quarter ended | Nine months ended | |||||||||||||||
September 30, 2011 | September 30, 2010 | September 30, 2011 | September 30, 2010 | |||||||||||||
| (Adjusted(*)) | (Adjusted(*)) | |||||||||||||||
| (Unaudited) | (Unaudited) | |||||||||||||||
| Profit / (loss) before income tax and social contribution | (506,494 | ) | 650,442 | (246,400 | ) | 479,751 | ||||||||||
| Tax calculated at Brazilian tax rates applicable to profits | 34 | % | 34 | % | 34 | % | 34 | % | ||||||||
| Taxes calculated at statutory rates | 172,208 | (221,150 | ) | 83,776 | (163,115 | ) | ||||||||||
| Tax effects of permanent (additions) deductions: | ||||||||||||||||
| Non deductible expenses | (9,492 | ) | (3,847 | ) | (18,892 | ) | (12,361 | ) | ||||||||
| Tax credit on interest paid on own capital | 790 | 5,511 | ||||||||||||||
| Unrecognized deferred tax assets on tax losses | (2,674 | ) | (727 | ) | (13,567 | ) | (1,553 | ) | ||||||||
| Unrecognized tax deferred tax assets on profits earned abroad | (26,498 | ) | (168 | ) | (32,390 | ) | (11,461 | ) | ||||||||
| Share-based compensation | 6,672 | (79 | ) | 4,536 | (2,974 | ) | ||||||||||
| Other | (4,306 | ) | 772 | (7,606 | ) | (493 | ) | |||||||||
| Income tax and social contribution tax charge (credit) | 135,910 | (224,409 | ) | 15,857 | (186,446 | ) | ||||||||||
| Effective rate % | 26.8 | 34.5 | 6.4 | 38.8 | ||||||||||||
The years from 2005 to 2010 are open to review by Brazilian tax authorities.
| (b) | Transitional Tax Regime - RTT |
The Transitional Tax Regime has been established by Law 11638/07 in order to maintain the same tax rules for determining taxable income irrespective of any changes introduced to accounting practices adopted in Brazil.
| 20. | Share Capital |
At September 30, 2011 the authorized capital was R$ 1,200,000 (12.31.2010 – R$ 1,200,000) and can be increased by means of the issuance of common and preferred shares, as resolved by the Board of Directors.
On October 7, 2011, the Company, in compliance to the Instructions of the Brazilian Securities and Exchanges Commission (“CVM”) numbers 358/02 and 10/80, the Company announced that the Board of Director, in meeting held on September 30, 2011, authorized the share buyback program of preferred shares of the Company, under the following conditions:
| · | Purpose: acquisition of preferred shares issued by the Company to be maintained in treasury and subsequently cancelled or sold without reduction in capital stock. |
(*) See Note 3
F-49
TAM S.A.
Notes of the interim financial statements
(In thousands of Dollar, unless otherwise indicated)
| · | Number of shares to be acquired: the acquition should not exceed 54,137 preferred shares. |
| · | Period for the program: the maximum term of the program is 365 days as from the date of approvel. The acquisition of the shares shall be made in the floor of the stock exchange of São Paulo, at market price. |
| · | Number of preferred shares held by the market: 83,309,958 shares as provided by SEC Instruction CVM 10/80. |
| (b) | Subscribed share capital |
At September 30, 2011 the subscribed share capital is comprised of 156,206,781 shares (12.31.2010 – 156,206,781) fully paid nominative shares without nominal value, of which 55,816,683 (12.31.2010 – 55,816,683) are common shares and 100,390,098 (12.31.2010 – 103,390,098) are preferred shares.
Common shares confer to their holder the right to vote in general meetings.
The preferred shares do not have the right to vote in general meetings, except in relation to certain matters while the Company is listed in Level 2 of BOVESPA. However, they have priority in the distribution of dividends, and in capital reimbursement, without any premium, in the event the Company is liquidated and the right to participate, under the same terms as the common shares, in the distribution of any benefits to the stockholders.
As per the Adhesion Agreement executed with BOVESPA, the Company complies with the requirement to have a free float in the market of 25% of its shares. Since August, 2007 the free float has been 53.85%.
Number of shares | Common shares | Preferred shares | Capital | |||||||||||||
| At December 31, 2009 | 150,585,147 | 50,195,049 | 100,390,098 | 391,820 | ||||||||||||
| At September 30, 2010 | 150,585,147 | 50,195,049 | 100,390,098 | 398,711 | ||||||||||||
| At December 31, 2010 | 156,206,781 | 55,816,683 | 100,390,098 | 492,073 | ||||||||||||
| At September 30, 2011 | 156,206,781 | 55,816,683 | 100,390,098 | 442,133 | ||||||||||||
| (c) | Treasury shares |
The movement of treasury shares during the nine months ended September 30, 2011 is presented below.
F-50
TAM S.A.
Notes of the interim financial statements
(In thousands of Dollar, unless otherwise indicated)
| Quantity of shares | Thousand of US$ | Average price per share - American dollars | ||||||||||
| At December 31, 2010 | 212,580 | (3,606 | ) | 17.00 | ||||||||
| Resale of treasury shares | (170,567 | ) | 2,896 | 17.00 | ||||||||
| Result of conversion of functional currency to presentation currency | 70 | |||||||||||
| At September 30, 2011 | 42,013 | (640 | ) | 17.00 | ||||||||
During the nine months ended September 30, 2011, 170,567 shares held in treasury were sold to beneficiaries of the stock option plan. The shares sold relate to the executive compensation plan approved at the Extraordinary General Meeting (AGE) of May 16, 2005.
The market value of shares based on the closing quote in the São Paulo stock exchange at September 30, 2011, is US$ 15.64 (12.31.2010 – US$ 23.49).
| (d) | Reduction of capital of Multiplus |
On March 18, 2011, Multiplus approved a capital reduction from US$ 414,106 to US$ 55,246, resulting in a reduction of US$ 358,859, equivalent to US$ 2.22 per share without the cancellation of any shares and without any change in the percentage of interest held by the shareholders of Multipls. The distribution process to was finalized on June 22, 2011 when cash was distributed to shareholder. Out of the total cash distribution TAM received US$ 257,465 and the non-controlling shareholder received US$ 101,394.
| (e) | Payment of dividends |
On April 2011, the Company paid dividends corresponding to the balance of retained earnings at the end of 2010 totalling the amount of US$ 113.679.
| 21. | Other reserves |
September 30, 2011 | December 31, 2010 | |||||||
| Share Premium | 40,415 | 44,980 | ||||||
| Treasury shares | (640 | ) | (3,606 | ) | ||||
| Stock option plan | 34,441 | 31,009 | ||||||
| Legal reserve | 43,683 | 48,617 | ||||||
| Profit retention | 422,127 | 488,889 | ||||||
| Cummulative translation adjustment | (7,854 | ) | (10,361 | ) | ||||
| Cash flow hedge reserve | (10,744 | ) | ||||||
| Deemed cost reserve | 60,821 | 68,402 | ||||||
| Transfer from non-controlling interest | 263,759 | 293,551 | ||||||
| 846,008 | 961,481 | |||||||
F-51
TAM S.A.
Notes of the interim financial statements
(In thousands of Dollar, unless otherwise indicated)
| 22. | Revenue |
TAM had no major customers which represented more than 10% of revenue in any of the periods presented. The Company utilizes its gross revenue information by type of service rendered and by region, as follows:
F-52
TAM S.A.
Notes of the interim financial statements
(In thousands of Dollar, unless otherwise indicated)
| (a) | By type of service rendered |
| Quarter ended | Nine months ended | |||||||||||||||||||||||||||||||||||||||
September 30, 2011 | % | September 30, 2010 | % | Period – Variation (%) | September 30, 2011 | % | September 30, 2010 | % | Period – Variation (%) | |||||||||||||||||||||||||||||||
| (Unaudited) | (Unaudited) | |||||||||||||||||||||||||||||||||||||||
| Domestic | ||||||||||||||||||||||||||||||||||||||||
| Passenger | 954,184 | 45.1 | 837,636 | 48.6 | 13.9 | 2,782,714 | 46.3 | 2,409,984 | 50.8 | 15.5 | ||||||||||||||||||||||||||||||
| Cargo | 85,903 | 4.1 | 73,352 | 4.3 | 17.1 | 244,386 | 4.1 | 208,451 | 4.4 | 17.2 | ||||||||||||||||||||||||||||||
| 1,040,087 | 49.2 | 910,988 | 52.9 | 14.2 | 3,027,100 | 50.4 | 2,618,435 | 55.2 | 15.6 | |||||||||||||||||||||||||||||||
| International | ||||||||||||||||||||||||||||||||||||||||
| Passenger | 626,774 | 29.6 | 516,283 | 30.0 | 21.4 | 1,685,698 | 28.0 | 1,377,822 | 29.0 | 22.3 | ||||||||||||||||||||||||||||||
| Cargo | 94,109 | 4.4 | 84,481 | 4.9 | 11.4 | 274,620 | 4.6 | 250,396 | 5.3 | 9.7 | ||||||||||||||||||||||||||||||
| 720,883 | 34.1 | 600,764 | 34.9 | 20.0 | 1,960,318 | 32.6 | 1,628,218 | 34.3 | 20.4 | |||||||||||||||||||||||||||||||
| Other | ||||||||||||||||||||||||||||||||||||||||
| Loyalty Program (TAM) | 12,078 | 0.6 | 60,807 | 3.5 | (80.1 | ) | 122,283 | 2.0 | 195,901 | 4.1 | (37.6 | ) | ||||||||||||||||||||||||||||
| Loyalty Program (Multiplus) | 180,932 | 8.6 | 110,560 | 6.4 | 63.7 | 483,668 | 8.1 | 149,169 | 3.1 | 224.2 | ||||||||||||||||||||||||||||||
| Travel and tourism agencies | 12,126 | 0.6 | 8,189 | 0.5 | 48.1 | 34,011 | 0.6 | 23,448 | 0.5 | 45.0 | ||||||||||||||||||||||||||||||
| Others (includes expired tickets) | 149,033 | 7.0 | 31,497 | 1.8 | 373.2 | 378,620 | 6.3 | 132,768 | 2.8 | 185.2 | ||||||||||||||||||||||||||||||
| 354,169 | 16.7 | 211,053 | 12.3 | 67.8 | 1,018,582 | 17.0 | 501,286 | 10.5 | 103.2 | |||||||||||||||||||||||||||||||
| Total gross | 2,115,139 | 100.0 | 1,722,805 | 100.0 | 22.8 | 6,006,000 | 100.0 | 4,747,939 | 100.0 | 26.5 | ||||||||||||||||||||||||||||||
| Sales taxes and other deductions | (85,738 | ) | (43,270 | ) | (239,057 | ) | (165,352 | ) | ||||||||||||||||||||||||||||||||
| Revenue | 2,029,401 | 1,679,535 | 5,766,943 | 4,582,587 | ||||||||||||||||||||||||||||||||||||
F-53
TAM S.A.
Notes of the interim financial statements
(In thousands of Dollar, unless otherwise indicated)
| (b) | By geographic location of the Company’s destinations |
| Quarter ended | Nine months ended | |||||||||||||||||||||||||||||||||||||||
September 30, 2011 | % | September 30, 2010 | % | Variation (%) | September 30, 2011 | % | September 30, 2010 | % | Variation (%) | |||||||||||||||||||||||||||||||
| (Unaudited) | (Unaudited) | |||||||||||||||||||||||||||||||||||||||
| Brazil | 1,394,256 | 65.9 | 1,443,710 | 83.8 | (3.4 | ) | 4,045,681 | 67.4 | 4,036,366 | 85.0 | 0.2 | |||||||||||||||||||||||||||||
| Europe | 352,778 | 16.7 | 144,716 | 8.4 | 143.8 | 940,326 | 15.7 | 350,370 | 7.4 | 168.4 | ||||||||||||||||||||||||||||||
| North America | 249,700 | 11.8 | 89,586 | 5.2 | 178.7 | 666,972 | 11.1 | 249,876 | 5.3 | 166.9 | ||||||||||||||||||||||||||||||
| South America (excluding Brazil) | 118,405 | 5.6 | 44,793 | 2.6 | 164.3 | 353,021 | 5.8 | 111,327 | 2.3 | 217.1 | ||||||||||||||||||||||||||||||
| Total gross | 2,115,139 | 100.0 | 1,722,805 | 100.0 | 22.8 | 6,006,000 | 100.0 | 4,747,939 | 100.0 | 27.0 | ||||||||||||||||||||||||||||||
| Sales taxes and other deductions | (85,738 | ) | (43,270 | ) | (239,057 | ) | (165,352 | ) | ||||||||||||||||||||||||||||||||
| Revenue | 2,029,401 | 1,679,535 | 5,766,943 | 4,582,587 | ||||||||||||||||||||||||||||||||||||
F-54
TAM S.A.
Notes of the interim financial statements
(In thousands of Dollar, unless otherwise indicated)
| (c) | Seasonality |
The following table presents our revenue in the first, second and third quarter of 2011 and 2010 as a percentage of annual revenue for the year ended December 31, 2010.
| % of 2010 net revenue | ||||||||
| 2011 | 2010 | |||||||
| (Unaudited) | ||||||||
| First quarter | 26.7 | 22.9 | ||||||
| Second quarter | 26.8 | 23.0 | ||||||
| Third quarter | 29.2 | 28.8 | ||||||
F-55
TAM S.A.
Notes of the interim financial statements
(In thousands of Dollar, unless otherwise indicated)
| 23. | Costs and operating expenses by nature |
| (a) | Quarter ended September 30: |
| 2011 | ||||||||||||||||||||
Cost of services rendered | Sales | General and administrative | Total | % | ||||||||||||||||
| Personnel | 341,725 | 29,251 | 36,227 | 407,203 | 24.1 | |||||||||||||||
| Director’s fees | 312 | 312 | 0.0 | |||||||||||||||||
| Fuel | 497,857 | 497,857 | 29.4 | |||||||||||||||||
| Depreciation and amortization | 89,503 | 1,307 | 22,764 | 113,574 | 6.7 | |||||||||||||||
| Maintenance and repairs (excluding personnel) | 89,747 | 89,747 | 5.3 | |||||||||||||||||
| Aircraft insurance | 7,274 | 7,274 | 0.4 | |||||||||||||||||
| Take-off, landing and navigation aid charges | 112,142 | 112,142 | 6.6 | |||||||||||||||||
| Leasing of aircraft, engines and equipment under operating leases | 64,911 | 1,589 | 2,742 | 69,242 | 4.1 | |||||||||||||||
| Third party services | 32,737 | 44,424 | 50,809 | 127,970 | 7.6 | |||||||||||||||
| Marketing and related expenses | 121,387 | 121,387 | 8.2 | |||||||||||||||||
| Other | 47,075 | 59,809 | 37,519 | 144,403 | 7.6 | |||||||||||||||
| 1,282,971 | 257,767 | 150,373 | 1,691,111 | 100.0 | ||||||||||||||||
F-56
TAM S.A.
Notes of the interim financial statements
(In thousands of Dollar, unless otherwise indicated) |
| 2010 | ||||||||||||||||||||
Cost of services rendered | Sales | General and administrative | Total | % | ||||||||||||||||
| (Adjusted )(Unaudited) | ||||||||||||||||||||
| Personnel | 264,513 | 38,346 | 25,873 | 328,732 | 25.5 | |||||||||||||||
| Director’s fees | 1,092 | 1,092 | 0.0 | |||||||||||||||||
| Fuel | 500,132 | 500,132 | 38.8 | |||||||||||||||||
| Depreciation and amortization | 84,711 | 228 | 16,138 | 101,077 | 7.8 | |||||||||||||||
| Maintenance and repairs (excluding personnel) | 75,908 | 75,908 | 5.9 | |||||||||||||||||
| Aircraft insurance | 7,478 | 7,478 | 0.6 | |||||||||||||||||
| Take-off, landing and navigation aid charges | 85,934 | 85,934 | 6.7 | |||||||||||||||||
| Leasing of aircraft, engines and equipment under operating leases | 63,419 | 1,263 | 2,594 | 67,276 | 5.2 | |||||||||||||||
| Third party services | 24,641 | 36,447 | 49,536 | 110,624 | 8.6 | |||||||||||||||
| Marketing and related expenses | 132,345 | 132,345 | 10.3 | |||||||||||||||||
| Reversal of additional tariff | (208,515 | ) | (208,515 | ) | (16.2 | ) | ||||||||||||||
| Other | 64,113 | 15,886 | 8,494 | 88,493 | 6.8 | |||||||||||||||
| 1,170,849 | 224,515 | (104,789 | ) | 1,290,575 | 100.0 | |||||||||||||||
F-57
TAM S.A.
Notes of the interim financial statements
(In thousands of Dollar, unless otherwise indicated) |
| (b) | Nine months ended September 30: |
| 2011 | ||||||||||||||||||||
Cost of services rendered | Sales | General and administrative | Total | % | ||||||||||||||||
| Personnel | 1,016,983 | 103,368 | 110,639 | 1,230,990 | 23.0 | |||||||||||||||
| Director’s fees | 783 | 783 | 0.0 | |||||||||||||||||
| Fuel | 1,811,924 | 1,811,924 | 33.9 | |||||||||||||||||
| Depreciation and amortization | 272,688 | 1,775 | 57,974 | 332,437 | 6.2 | |||||||||||||||
| Maintenance and repairs (excluding personnel) | 281,851 | 281,851 | 5.3 | |||||||||||||||||
| Aircraft insurance | 22,368 | 22,368 | 0.4 | |||||||||||||||||
| Take-off, landing and navigation aid charges | 307,779 | 307,779 | 5.7 | |||||||||||||||||
| Leasing of aircraft, engines and equipment under operating leases | 184,688 | 4,518 | 9,437 | 198,643 | 3.7 | |||||||||||||||
| Third party services | 93,802 | 139,130 | 147,956 | 380,888 | 7.1 | |||||||||||||||
| Marketing and related expenses | 414,104 | 414,104 | 7.8 | |||||||||||||||||
| Other | 178,304 | 104,532 | 88,186 | 371,022 | 6.9 | |||||||||||||||
| 4,170,387 | 767,427 | 414,975 | 5,352,789 | 100.0 | ||||||||||||||||
F-58
TAM S.A.
Notes of the interim financial statements
(In thousands of Dollar, unless otherwise indicated) |
| 2010 | ||||||||||||||||||||
Cost of services rendered | Sales | General and administrative | Total | % | ||||||||||||||||
| (Adjusted)(Unaudited) | ||||||||||||||||||||
| Personnel | 754,680 | 92,665 | 76,294 | 923,639 | 22.3 | |||||||||||||||
| Director’s fees | 3,432 | 3,432 | 0.1 | |||||||||||||||||
| Fuel | 1,414,093 | 1,414,093 | 34.1 | |||||||||||||||||
| Depreciation and amortization | 254,336 | 691 | 39,156 | 294,183 | 7.1 | |||||||||||||||
| Maintenance and repairs (excluding personnel) | 257,544 | 257,544 | 6.2 | |||||||||||||||||
| Aircraft insurance | 22,128 | 22,128 | 0.5 | |||||||||||||||||
| Take-off, landing and navigation aid charges | 245,412 | 245,412 | 5.9 | |||||||||||||||||
| Leasing of aircraft, engines and equipment under operating leases | 190,884 | 3,771 | 6,585 | 201,240 | 4.8 | |||||||||||||||
| Third party services | 66,694 | 107,920 | 152,212 | 326,826 | 7.9 | |||||||||||||||
| Marketing and related expenses | 376,142 | 376,142 | 9.1 | |||||||||||||||||
| Reversal of additional tariff | (208,515 | ) | (208,515 | ) | (5.0 | ) | ||||||||||||||
| Other | 150,374 | 72,057 | 71,626 | 294,057 | 7.2 | |||||||||||||||
| 3,356,850 | 653,246 | 140,789 | 4,150,180 | 100.0 | ||||||||||||||||
F-59
TAM S.A.
Notes of the interim financial statements
(In thousands of Dollar, unless otherwise indicated) |
| 24. | Employee Benefits |
Personnel costs (presented under Personnel and Director fees in Note 23) are composed of the following amounts:
| Quarter ended | Nine months ended | |||||||||||||||
September 30, 2011 | September 30, 2010 | September 30, 2011 | September 30, 2010 | |||||||||||||
| (Unaudited) | (Unaudited) | |||||||||||||||
| Salaries and bonuses | 319,855 | 262,448 | 1,009,828 | 761,670 | ||||||||||||
| Defined contribution pension plan | 5,131 | 3,942 | 15,210 | 11,098 | ||||||||||||
| Share based payment | 2,445 | 235 | 8,725 | 6,450 | ||||||||||||
| Taxes and social contributions | 80,084 | 63,199 | 198,010 | 147,853 | ||||||||||||
| 407,515 | 329,824 | 1,231,773 | 927,071 | |||||||||||||
| 24.1 | Share-based payment |
(a) TAM Linhas Aéreas
The Extraordinary Stockholders’ Meeting held on October 4, 2010 authorized that the Board of Directors may grant stock options to employees up to 3% of outstanding shares.
These transactions can be summarized as follows:
Number of stock options outstanding | Weighted average exercise price - US$ | |||||||
| At January 1, 2010 | 1,667,440 | 21.20 | ||||||
| Granted | 1,051,467 | 13.71 | ||||||
| Exercised | (165,868 | ) | 8.23 | |||||
| Forfeited | (343,924 | ) | 22.67 | |||||
| At September 30, 2010 | 2,209,115 | 67.65 | ||||||
| At January 1, 2011 | 2,209,115 | 22.27 | ||||||
| Exercised | (170,567 | ) | 12.33 | |||||
| Forfeited | (167,930 | ) | 34.12 | |||||
| At September 30, 2011 | 1,870,618 | 20.78 | ||||||
Under the terms of the Plan, the options granted are divided into three equal amounts and employees may exercise one third of their options after three, four and five years, respectively, if still employed by the Company at that time. The options have a contractual term of seven years.
The options contain a "service condition" as vesting and exercisability of the options depends only on the rendering of a defined period of services by the employee. Dismissed employees have the obligation to satisfy certain conditions in order to maintain their options rights. The options are valued using the Black-Scholes option pricing model. The following table shows details of the various option grants, together with the variables used in valuing the options granted:
F-60
TAM S.A.
Notes of the interim financial statements
(In thousands of Dollar, unless otherwise indicated) |
| 1st grant | 2nd grant | 3rd grant | 4th grant | 1st special grant | 2nd special Grant (ii) | 3rd special grant | 4th special grant | Total or weigthed average | ||||||||||||||||||||||||||||
| Date | 12/28/2005 | 11/30/2006 | 12/14/2007 | 05/28/2010 | 09/27/2007 | 02/29/2008 | 04/01/2010 | 11/03/2010 | ||||||||||||||||||||||||||||
| Number of options granted | 715,255 | 239,750 | 780,311 | 591,463 | 230,000 | 11,595 | 230,000 | 230,000 | ||||||||||||||||||||||||||||
| Exercise price at grant date – US$ | 6.13 | 20.07 | 22.09 | 13.77 | 20.84 | 17.96 | 14.26 | 12.12 | ||||||||||||||||||||||||||||
| Risk free interest rate - % | 17.93 | % | 13.13 | % | 10.95 | % | 9.38 | % | 10.82 | % | 10.82 | % | 8.34 | % | 10.69 | % | ||||||||||||||||||||
| Average term | 5.5 | 5.5 | 5.5 | 5.5 | 4.5 | 4.5 | 4.5 | 4.5 | ||||||||||||||||||||||||||||
| Expected dividend yield - % | 0.00 | % | 0.32 | % | 0.58 | % | 0.55 | % | 0.58 | % | 0.56 | % | 0.55 | % | 0.55 | % | ||||||||||||||||||||
| Share price volatility - % | 34.24 | % | 41.29 | % | 42.30 | % | 51.47 | % | 40.48 | % | 43.66 | % | 51.32 | % | 52.14 | % | ||||||||||||||||||||
| Market share price – US$ | 19.16 | 28.15 | 24.52 | 13.33 | 27.21 | 21.08 | 17.58 | 24.75 | ||||||||||||||||||||||||||||
| Fair value at grant date – US$ | 16.88 | 18.97 | 13.97 | 7.44 | 15.36 | 11.48 | 10.41 | 17.66 | ||||||||||||||||||||||||||||
| Number of options outstanding (i) | 96,151 | 142,743 | 455,751 | 485,973 | 230,000 | 230,000 | 230,000 | 1,870,618 | ||||||||||||||||||||||||||||
| Number of options exercisable (i) | 96,151 | 96,728 | 118,296 | 230,000 | 541,175 | |||||||||||||||||||||||||||||||
| Exercise price (adjusted by IGP-M) (i) | 10.87 | 31.95 | 27.24 | 15.16 | 27.15 | 11.75 | 12.25 | |||||||||||||||||||||||||||||
Remaining average term (i) | 0.00 | 0.60 | 1.70 | 4.14 | 0.00 | 2.98 | 3.64 | |||||||||||||||||||||||||||||
(i) At September 30, 2011.
(ii) Special grant forfeited.
Share price volatility is determined based on historical share price volatility of the company's quoted shares.
F-61
TAM S.A.
Notes of the interim financial statements
(In thousands of Dollar, unless otherwise indicated) |
| (b) | Multiplus |
The Extraordinary Stockholders’ Meeting held on October 4, 2010 authorized that the Board of Directors may grant stock options to employees up to 3% of outstanding shares.
These transactions can be summarized as follows:
Number of stock options outstanding | Weighted average exercise price - US$ | |||||||
| At December 31, 2009 | ||||||||
| Options granted | 1,660,759 | 10.33 | ||||||
| At December 31, 2010 | 1,660,759 | 10.67 | ||||||
| Forfeited | (6,196 | ) | 18.22 | |||||
| At September 30, 2011 | 1,654,563 | 8.02 | ||||||
Under the plan, options assigned for regular grants are divided into three equal parts and employees can exercise one third of their options of two, three and four years, respectively if they are still employed by the Company at that time. The contractual life of the options is seven years afer the grant of option. The 1st extraordinary grant was divided into two equal parts that can be exercised as follows: half of the options after three years, and another half after four years. The 2nd extraordinary grant was also divided into two equal parts that can be exercised after one year and two years, respectively.
The options contain a "service condition" as vesting and exercisability of the options depends only on the rendering of a defined period of services by the employee. Dismissed employees have the obligation to satisfy certain conditions in order to maintain their options rights.
In the first semester, the Company fixed the exercise price of US$ 12.28 (twelve dollars and twenty eigth cents) per share, for the extraordinary grant related to the hiring of the current Chief Executive Officer of Multiplus and on June 30, 2011 approved the reduction in the exercise price by US$ 2.38 (two dollars and thirty eight cents per share), due to the reduction of the Company’s capital. The modification of the options granted as result of the reduction in the exercise price resulted in additional compensation. Considering that no options were vested as of June 30, 2011 the additional compensation will be recognized prospectively through the vestion period of the options.
The options are valued using the Black-Scholes option pricing model. The following table shows details of the various option grants, together with the variables used in valuing the options granted. The exercise price is adjusted by the IGP-M (General Price Index), from the award grant date up to the exercise date:
F-62
TAM S.A.
Notes of the interim financial statements
(In thousands of Dollar, unless otherwise indicated) |
(b.1) Assumptions used to estimate the fair value of the options at the original grant date:
| 1st grant | 2nd grant | 1st extraordinary grantª | 2nd extraordinary grantª | Total or weighted average | ||||||||||||||||
| Date | 10/04/2010 | 11/08/2010 | 10/04/2010 | 10/04/2010 | ||||||||||||||||
| Number of options granted | 98,391 | 36,799 | 1,370,999 | 154,570 | 1,660,759 | |||||||||||||||
| Exercise price at grant date –US$ | 16.19 | 18.69 | 9.48 | 16.19 | ||||||||||||||||
| Risk free interest rate - % | 10.16 | 10.16 | 10.16 | 10.16 | ||||||||||||||||
| Average term | 5.0 | 5.0 | 5.25 | 4.25 | ||||||||||||||||
| Expected dividend yield - % | 0.67 | 0.57 | 0.67 | 0.67 | ||||||||||||||||
| Share price volatility - % | 30.25 | 31.21 | 30.25 | 30.25 | ||||||||||||||||
| Market share price - US$ | 15.93 | 18.69 | 15.93 | 15.93 | ||||||||||||||||
| Fair value at grant date – US$ | 6.86 | 8.33 | 10.02 | 6.24 | ||||||||||||||||
(b.2) Considering the modification in the exercise price, the following assumptions were used to measure the additional compensation:
| 1st grant | 2nd grant | 1st extraordinary grantª | 2nd Extraordinary grantª | Total or weighted average | ||||||||||||||||
| Date | 06/30/2011 | 06/30/2011 | 06/30/2011 | 06/30/2011 | ||||||||||||||||
| Number of options granted | 92,195 | 36,799 | 1,370,999 | 154,570 | 1,654,563 | |||||||||||||||
| Exercise price at grant date – US$ | 15.12 | 17.83 | 7.87 | 12.81 | ||||||||||||||||
| Risk free interest rate - % | 12.15 | 12.15 | 12.15 | 12.15 | ||||||||||||||||
| Average term | 4.63 | 4.67 | 4.88 | 3.50 | ||||||||||||||||
| Expected dividend yield - % | 2.60 | 2.60 | 2.60 | 2.60 | ||||||||||||||||
| Share price volatility - % | 33.79 | 33.79 | 33.79 | 33.79 | ||||||||||||||||
| Market share price - US$ | 17.42 | 17.42 | 17.42 | 17.42 | ||||||||||||||||
| Fair value immediately before modification– US$ | 6.94 | 6.12 | 9.97 | 6.06 | ||||||||||||||||
| Fair value immediately after modification– US$ | 7.80 | 6.86 | 11.11 | 8.11 | ||||||||||||||||
| Incremental fair value | 0.85 | 0.74 | 1.15 | 2.05 | ||||||||||||||||
(b.3) Other information at September 30, 2011
| 1st grant | 2nd grant | 1st extraordinary grantª | 2nd Extraordinary grantª | Total or weighted average | ||||||||||||||||
| 09/30/2011 | 09/30/2011 | 09/30/2011 | 09/30/2011 | |||||||||||||||||
| Number of options outstanding (i) | 92,195 | 36,799 | 1,370,999 | 154,570 | 1,654,563 | |||||||||||||||
| Number of options exercisable (i) | 23.61 | 27.83 | 12.28 | 20.00 | ||||||||||||||||
Remaining average term (i) | 4.50 | 4.54 | 4.75 | 3.25 | ||||||||||||||||
(i) At September 30, 2011.
Share price volatility is determined based on historical share price volatility of Multiplus quoted shares.
F-63
TAM S.A.
Notes of the interim financial statements
(In thousands of Dollar, unless otherwise indicated) |
| 25. | Net Finance Result |
| Quarter ended | Nine months ended | |||||||||||||||
September 30, 2011 | September 30, 2010 | September 30, 2011 | September 30, 2010 | |||||||||||||
| (Unaudited) | (Unaudited) | |||||||||||||||
| Finance income | ||||||||||||||||
| Interest income from financial investments | 30,653 | 21,127 | 78,862 | 55,703 | ||||||||||||
| Exchange gains | 303,138 | 247,369 | 880,477 | 691,291 | ||||||||||||
| Other | 5,306 | 104,230 | 32,805 | 109,473 | ||||||||||||
| 339,097 | 372,726 | 992,144 | 856,467 | |||||||||||||
| Finance expenses | ||||||||||||||||
| Exchange losses | (1,038,846 | ) | (50,220 | ) | (1,377,102 | ) | (593,993 | ) | ||||||||
| Interest expense (i) | (71,605 | ) | (62,144 | ) | (213,399 | ) | (76,815 | ) | ||||||||
| Other | (4,531 | ) | (6,158 | ) | (18,694 | ) | (119,581 | ) | ||||||||
| (1,114,982 | ) | (118,522 | ) | (1,609,195 | ) | (790,389 | ) | |||||||||
| Derivatives designated as hedge | (11,828 | ) | (11,828 | ) | ||||||||||||
| (1,126,810 | ) | (118,522 | ) | (1,621,023 | ) | (790,389 | ) | |||||||||
| Finance result, net | (787,713 | ) | 254,204 | (628,879 | ) | 66,078 | ||||||||||
(i) The average monthly rate for capitalized interest at September 30, 2011 was 0.37% (06.30.2010 – 0.04 %).
The exchange gain recognized at September 30, 2011 with respect to finance lease liabilities amounted US$ 318,746 (09.30.2010 – net expense US$ 87,070), while interest expense on those finance lease liabilities amounted to US$ 45,711 (09.30.2010 – US$ 49,267).
| 26. | Earnings per share |
| (a) | Basic |
Basic earnings per share is calculated by dividing the profit attributable to equity holders of the company by the weighted average number of shares (common and preferred) issued and outstanding during the year excluding shares purchased by the Company and held as treasury shares.
F-64
TAM S.A.
Notes of the interim financial statements
(In thousands of Dollar, unless otherwise indicated) |
| Quarter ended | Nine months ended | |||||||||||||||
September 30, 2011 | September 30, 2010 | September 30, 2011 | September 30, 2010 | |||||||||||||
| (Adjusted(*)) | (Adjusted(*)) | |||||||||||||||
| (Unaudited) | (Unaudited) | |||||||||||||||
| Profit / (loss) attributable to equity holders of the company | (378,888 | ) | 419,192 | (263,822 | ) | 282,055 | ||||||||||
| Weighted average number of shares issued (in thousands) | 156,207 | 150,585 | 156,207 | 150,585 | ||||||||||||
| Weighted average treasury shares (in thousands) | (106 | ) | (263 | ) | (109 | ) | (263 | ) | ||||||||
| Weighted average number of shares outstanding (in thousands) | 156,101 | 150,322 | 156,098 | 150,322 | ||||||||||||
| Basic earnings / (loss) per share (Reais per share) | (2.43 | ) | 2.79 | (1.69 | ) | 1.88 | ||||||||||
| (b) | Diluted |
Diluted earnings per share is calculated by adjusting the weighted average number of shares outstanding to assume conversion of all dilutive potential shares. The company has only one category of dilutive potential ordinary shares: stock options.
| Quarter ended | Nine months ended | |||||||||||||||
September 30, 2011 | September 30, 2010 | September 30, 2011 | September 30, 2010 | |||||||||||||
| (Adjusted(*)) | (Adjusted(*)) | |||||||||||||||
| (Unaudited) | (Unaudited) | |||||||||||||||
| Profit / (loss) attributable to equity holders of the company | (378,888 | ) | 419,192 | (263,822 | ) | 282,055 | ||||||||||
| Weighted average number of shares outstanding (in thousands) | 156,101 | 150,322 | 156,098 | 150,322 | ||||||||||||
| Adjustments for share options (in thousands) | 291 | 291 | ||||||||||||||
| Weighted average number of shares for diluted earnings per share calculation (in thousands) | 156,101 | 150,613 | 156,098 | 150,613 | ||||||||||||
| Diluted earnings / (loss) per share (Reais per share) | (2.43 | ) | (2.78 | ) | (1.69 | ) | 1.87 | |||||||||
(*) See Note 3
F-65
TAM S.A.
Notes of the interim financial statements
(In thousands of Dollar, unless otherwise indicated) |
| 27. | Cash generated from operations |
| Nine months ended | ||||||||
September 30, 2011 | September 30, 2010 | |||||||
| (Adjusted(*)) | ||||||||
| (Unaudited) | ||||||||
| Profit / (loss) for the period | (230,543 | ) | 293,305 | |||||
| Adjustments for | ||||||||
| Deferred income tax and social contribution | (113,312 | ) | 152,627 | |||||
| Depreciation and amortization (Note 32 (b)) | 332,437 | 294,183 | ||||||
| Loss on disposal of property, plant and equipment (see below) | 19,747 | 24,304 | ||||||
| Foreign exchange losses/(gains) and interest expense | 724,774 | 58,029 | ||||||
| Other provisions | 90,159 | 89,322 | ||||||
| Provision for contingencies | 18,425 | 34,259 | ||||||
| Reversal of provision of contingency | (334,852 | ) | ||||||
| Stock options plan | 8,725 | 6,446 | ||||||
| Changes in working capital | ||||||||
| Financial assets measurement at fair value through profit and loss | (54,705 | ) | (144,878 | ) | ||||
| Inventories | (12,302 | ) | 12,234 | |||||
| Accounts receivable | (248,597 | ) | (309,118 | ) | ||||
| Taxes recoverable | (325,943 | ) | (19,974 | ) | ||||
| Prepaid expenses | 23,175 | 732 | ||||||
| Prepaid aircraft maintenance | (81,247 | ) | 6,387 | |||||
| Other receivables | (6,056 | ) | 33,386 | |||||
| Accounts payable | (22,492 | ) | (27,423 | ) | ||||
| Salaries and social charges | (5,707 | ) | 69,241 | |||||
| Taxes, charges and contributions | 112,122 | 84,168 | ||||||
| Deferred income | (106,178 | ) | 94,095 | |||||
| Other liabilities | 118,525 | 26,764 | ||||||
| Derivative financial instruments | 44,580 | (62,165 | ) | |||||
| Payment of REFIS | (10,652 | ) | ||||||
| Cash generated from operations | 274,935 | 381,072 | ||||||
In the cash flow statement, proceeds from sale of property, plant and equipment and intangible comprise:
| Nine months ended | ||||||||
September 30, 2011 | September 30, 2010 | |||||||
| (Unaudited) | ||||||||
| Net book amount – property, plant and equipment | 21,403 | 37,360 | ||||||
| Loss on disposal of property, plant and equipment | (19,747 | ) | (24,304 | ) | ||||
| Proceeds from disposal of property, plant and equipment | 1,656 | 13,056 | ||||||
(*) See Note 3
F-66
TAM S.A.
Notes of the ínterim financial statements - Unaudited
(In thousands of Dollar, unless otherwise indicated) |
| 28. | Commitments and contingencies |
| (a) | Operating lease commitments |
TLA has obligations arising under operating lease contracts. The amounts of these commitments are not recorded in the financial statements. TLA has obligations arising from 71 aircraft under operating leases (12.31.2010 – 69 aircraft). These agreements have an average term of 97 months and are denominated in U.S. dollars with interest rates based on LIBOR. The lease expense, recognized in the consolidated statement of operations in "Cost of services rendered", for period ended September 30, 2011 was US$ 172,290 (September 30, 2010 – US$ 207,629.
For most of the transactions, TAM has given letters of guarantee or deposits as a guarantee.
In addition, to meet the payment conditions established by contract, promissory notes guaranteed by Company were issued, totaling US$ 1,779 at September 30, 2011 (12.31.2010 – US$ 12,623).
Future aggregate payments denominated in US dollars under these contracts are as follows:
Monthly payments maturing in | September 30, 2011 | December 31, 2010 | ||||||||
| In foreign currency – US$ | ||||||||||
| Aircraft | 2024 | 698,450 | 656,288 | |||||||
| Engines | 2021 | 14,728 | 16,319 | |||||||
| Total | 713,178 | 672,607 | ||||||||
Operating lease obligations fall due as follows:
| Year | September 30, 2011 | December 31, 2010 | ||||||
| No later than one year | 210,270 | 209,131 | ||||||
| Later than one year and no later than five years | 389,748 | 421,442 | ||||||
| Later than five years | 113,160 | 42,034 | ||||||
| 713,178 | 672,607 | |||||||
(b) Commitments for future aircraft leases
(i) Airbus
In 2005, the Company executed an amendment to an existing contract with Airbus for the firm order of 20 Airbus A320, the remaining nine of which are to be delivered in 2010, with an option for an additional 20 of the same aircraft family (including A319, A320 and A321). In 2006, the Company finalized a contract to acquire a further 37 Airbus aircraft (31 aircraft narrow body aircraft family A320 and six A330 aircraft), with the option for an additional 20, to be delivered in 2012 and 2013.
On June 28, 2007, the Company also executed a Memorandum of Understanding for the purchase of 22 Airbus A350XWB models 800 and 900, with ten more options, for delivery between 2013 and 2018.
Additionally, TLA confirmed the exercise of four options for Airbus A330, the four of which were already delivered in 2010 and 2011, related to the agreement signed at the end of 2006. TAM also confirmed the twenty options that had been postponed from 2005 to 2006 anticipated delivery before the end of 2014.
F-67
TAM S.A.
Notes of the interim financial statements
(In thousands of Dollar, unless otherwise indicated) |
On June 8, 2010, TLA, announced the order of additional 20 brand-new Airbus A320 family aircraft and five A350-900, thus increasing the total number of orders for Airbus aircraft to 176 – including 134 aircraft of A320 family, 15 A330-200 and 27 A350 WXB. The objective of this order is to meet the plan of fleet already disclosed by the Company in the year 2009. In respect of the 20 orders from A320 family (A319, A320 and A321), ten shall be delivered in 2014 and the remaining ten in 2015.
| (ii) | Boeing |
In 2006, the Company ordered four Boeing 777-300ERs with options for four aircraft, which were converted to firm orders in 2007. Upon receipt of the four aircraft in 2008, the Company has signed an amendment to an existing contract for two more aircraft and has six firm orders outstanding contracted with Boeing for this type of aircraft, of which four are expected to be delivered in 2012 and two in 2013.
| (iii) | Fleet renewal and expansion |
On February 28, 2011, the Company announced the order of 32 aircraft from the Airbus A320 family and two Boeing 777-300ER aircraft to prepare the Company to meet the expected growing demand for air travel. The combined value of these new orders, based on list prices, is approximately US$ 3.2 billion. Of the 32 aircraft ordered from Airbus , 22 are new model A320neo and ten are from the A320 Family. The aircraft are scheduled to be delivered between 2016 and 2018.
The two Boeing 777-300ERs are expected to be delivered in 2014. This order of two more aircraft brings the total number of aircraft ordered from the U.S. manufacturer to eight, including four aircraft to be delivered in 2012 and the two in 2013. Once all the aircraft are delivered, we will have 12 Boeing aircraft in our fleet.
| (c) | Insurance |
TAM maintains adequate insurance for risks which are expected to cover any liabilities generated by the accident on July 17, 2007, of an Airbus A320 aircraft, considering the agreements already made with and paid to the victims’ families by the insurance company. As of September 30, 2011, 193 (12.31.2010 – 192) compensation payments have been paid to families of the victims and others are under negotiation with the Company’s insurance firm. Management understands that the insurance coverage of these liabilities is adequate to cover all related costs. The Company believes that it will not incur additional or unexpected expenses outside the scope of the insurance agreement which would be TAM’s direct responsibility.
| (d) | Contingent liabilities |
Contingencies for which it is probable that TAM will be required to make payments are provided for and are discussed in Note 18.
F-68
TAM S.A.
Notes of the interim financial statements
(In thousands of Dollar, unless otherwise indicated) |
| (e) | Contingent assets |
| (i) | ICMS |
On December 17, 2001 the Federal Supreme Court ruled that domestic and international air passenger transportation revenue, as well as international air cargo transportation revenue was no longer subject to ICMS.
However, based on this ruling, ICMS taxation on domestic air cargo transportation revenue is still due. At September 30, 2011, the provision maintained by the Company totaled US$ 1,870 (12.31.2010 – US$ 2,614), recorded in “Taxes, charges and contributions”.
We consider payments of ICMS made between 1989 and 1994 to be amounts paid in error because we believe it was unconstitutional to charge ICMS on air navigation services. TAM Linhas Aéreas has filed claims against various states in Brazil to claim the amounts paid in error. Rulings on these claims are pending. Our policy is to only adjust the value of these claims for inflation at the time that payment is recorded in our financial statements.
| (ii) | Indemnification for losses on regulated fares |
We are plaintiffs in an action filed against the Brazilian government in 1993 seeking damages for breaking-up of the economic-financial equilibrium of an air transport concession agreement as a result of having to freeze our prices from 1988 to September 1993 in order to maintain operations with the prices set by the Brazilian government during that period. The process is currently being heard before the Federal Regional Court and we are awaiting judgment on appeals we have lodged requesting clarification of the initial decision (which we challenged). The estimated value of the action is based on a calculation made by an expert witness of the court. This sum is subject to interest accruing from September 1993 and inflation since November 1994. Based on the opinion of our legal advisors and recent rulings handed down by the Supreme Court of Justice in favor of airlines in similar cases (specifically, actions filed by Transbrasil and Varig) we believe that our chance of success is probable.
We have not recognized these amounts as receivable in these financial statements and will only do so when the decision is made final.
| (iii) | Additional airport tariffs (“ATAERO”) |
In 2001 TLA filed a legal action requesting preliminary measures challenging the legality of the additional rate of 50% on airpor tariffs established by Law 7,920/89. The Company has been paying those amount monthly at September 30,2011 totalling US$ 563,079 (December 31, 2010 – US$ 551,250) and no asset has been recognized with respect to this matter.
| 29. | Segment reporting |
The Company has two operating and reportable segments: Aviation operations and Loyalty Program operations (“Multiplus”). Operating segments are reported in a manner consistent with the internal reporting provided to the chief operating decision maker (“CODM”).
F-69
TAM S.A.
Notes of the ínterim financial statements - Unaudited
(In thousands of Dollar, unless otherwise indicated) |
| Total assets | ||||||||||||||||||||
| Aviation | Loyalty Program (Multiplus) | Total reported – Segment information | Eliminations | Consolidated | ||||||||||||||||
| September 30, 2011 | 9,826,691 | 615,285 | 10,441,976 | (2,056,288 | ) | 8,385,688 | ||||||||||||||
| December 31, 2010 | 10,733,646 | 862,979 | 11,596,625 | (2,895,794 | ) | 8,700,831 | ||||||||||||||
| (a) | Quarter ended at September 30, 2011 and 2010 |
September 30, 2011 | ||||||||||||||||||||
| Aviation | Loyalty Program (Multiplus) | Total reported – Segment information | Eliminations (1) | Consolidated | ||||||||||||||||
| Revenue | 2,053,665 | 196,542 | 2,250,207 | (220,806 | ) | 2,029,401 | ||||||||||||||
| Operating expenses | (2,139,060 | ) | (149,554 | ) | (2,288,614 | ) | 597,503 | (1,691,111 | ) | |||||||||||
| Operating profit / (loss) before movements in fair value of fuel derivatives | (85,395 | ) | 46,988 | (38,407 | ) | 376,697 | 338,290 | |||||||||||||
| Movements in fair value of fuel derivatives | (57,071 | ) | (57,071 | ) | (57,071 | ) | ||||||||||||||
| Operating profit / (loss) | (142,466 | ) | 46,988 | (137,802 | ) | 376,697 | 281,219 | |||||||||||||
| Finance income | 326,068 | 13,029 | 339,097 | 339,097 | ||||||||||||||||
| Finance expense | (1,114,967 | ) | (15 | ) | (1,114,982 | ) | (1,114,982 | ) | ||||||||||||
| Derivatives designated as hedge | (11,828 | ) | (11,828 | ) | (11,828 | ) | ||||||||||||||
| Profit / (loss) before income tax and social contribution | (931,365 | ) | 48,174 | (883,191 | ) | 376,697 | (506,494 | ) | ||||||||||||
| Income tax and social contribution | 152,711 | (16,800 | ) | 135,911 | 135,910 | |||||||||||||||
| Profit / (loss) for the period | (778,664 | ) | 31,374 | (747,280 | ) | 376,697 | (370,584 | ) | ||||||||||||
(1) Operating Expenses includes equity pick up of TLA in the amount of US$ 376,697 recognized in the Aviation segment.
F-70
TAM S.A.
Notes of the interim financial statements
(In thousands of Dollar, unless otherwise indicated) |
September 30, 2010 (Unaudited) | ||||||||||||||||||||
| Aviation | Loyalty Program (Multiplus) | Total reported – Segment information | Eliminations (2) | Consolidated | ||||||||||||||||
| (Adjusted (*)) | ||||||||||||||||||||
| Revenue | 1,694,310 | 74,339 | 1,768,649 | (89,114 | ) | 1,679,535 | ||||||||||||||
| Operating expenses | (908,444 | ) | (47,225 | ) | (955,669 | ) | (334,906 | ) | (1,290,575 | ) | ||||||||||
| Operating profit / (loss) before movements in fair value of fuel derivatives | 785,866 | 27,114 | 812,980 | (424,020 | ) | 388,960 | ||||||||||||||
| Movements in fair value of fuel derivatives | 7,278 | 7,278 | 7,278 | |||||||||||||||||
| Operating profit / (loss) | 793,144 | 27,114 | 820,258 | (424,020 | ) | 396,238 | ||||||||||||||
| Finance income | 365,750 | 6,976 | 372,726 | 372,726 | ||||||||||||||||
| Finance expense | (118,497 | ) | (25 | ) | (118,522 | ) | (118,522 | ) | ||||||||||||
| Profit / (loss) before income tax and social contribution | 1,040,397 | 34,065 | 1,074,462 | (424,020 | ) | 650,442 | ||||||||||||||
| Income tax and social contribution | (215,799 | ) | (8,633 | ) | (224,432 | ) | (224,409 | ) | ||||||||||||
| Profit / (loss) for the period | 824,598 | 25,432 | 850,030 | (424,020 | ) | 426,033 | ||||||||||||||
(*) See note 3.
(2) Operating Expenses includes equity pick up of TLA in the amount of US$ 424,020 recognized in the Aviation segment.
F-71
TAM S.A.
Notes of the ínterim financial statements - Unaudited
(In thousands of Dollar, unless otherwise indicated) |
| (b) | Nine months ended September 30, 2011 and 2010 |
September 30, 2011 | ||||||||||||||||||||
| Aviation | Loyalty Program (Multiplus) | Total reported – Segment information | Eliminations (3) | Consolidated | ||||||||||||||||
| Revenue | 5,827,177 | 520,256 | 6,347,433 | (580,490 | ) | 5,766,943 | ||||||||||||||
| Operating expenses | (5,815,729 | ) | (366,561 | ) | (6,182,290 | ) | 829,501 | (5,352,789 | ) | |||||||||||
| Operating profit / (loss) before movements in fair value of fuel derivatives | (11,448 | ) | 153,695 | 165,143 | 249,011 | 414,154 | ||||||||||||||
| Movements in fair value of fuel derivatives | (31,675 | ) | (31,675 | ) | (31,675 | ) | ||||||||||||||
| Operating profit / (loss) | (20,227 | ) | 153,695 | 133,468 | 249,011 | 382,479 | ||||||||||||||
| Finance income | 942,371 | 49,774 | 992,145 | 992,145 | ||||||||||||||||
| Finance expense | (1,608,730 | ) | (465 | ) | (1,609,195 | ) | (1,609,195 | ) | ||||||||||||
| Derivatives designated as hedge | (11,828 | ) | (11,828 | ) | (11,828 | ) | ||||||||||||||
| Profit / (loss) before income tax and social contribution | (686,587 | ) | 191,176 | (495,411 | ) | 249,011 | (246,400 | ) | ||||||||||||
| Income tax and social contribution | 82,294 | (66,437 | ) | 15,857 | 15,857 | |||||||||||||||
| Profit / (loss) for the period | (604,293 | ) | 124,739 | (479,554 | ) | 249,011 | (230,543 | ) | ||||||||||||
(3) Operating Expenses includes equity pick up of TLA in the amount of US$ 249,011 recognized in the Aviation segment.
F-72
TAM S.A.
Notes of the ínterim financial statements - Unaudited
(In thousands of Dollar, unless otherwise indicated) |
September 30, 2010 (Unaudited) | ||||||||||||||||||||
| Aviation | Loyalty Program (Multiplus) | Total reported – Segment information | Eliminations (4) | Consolidated | ||||||||||||||||
| (Adjusted (*)) | ||||||||||||||||||||
| Revenue | 4,640,065 | 149,156 | 4,789,221 | (206,634 | ) | 4,582,587 | ||||||||||||||
| Cost and operating expenses | (3,974,378 | ) | (98,575 | ) | (4,072,953 | ) | (77,227 | ) | (4,150,180 | ) | ||||||||||
| Operating profit / (loss) before movements in fair value of fuel derivatives | 665,687 | 50,581 | 716,268 | (283,861 | ) | 432,407 | ||||||||||||||
| Movements in fair value of fuel derivatives | (18,734 | ) | (18,734 | ) | (18,734 | ) | ||||||||||||||
| Operating profit / (loss) | 646,953 | 50,581 | 697,534 | (283,861 | ) | 413,673 | ||||||||||||||
| Finance income | 847,129 | 9,338 | 856,467 | 856,467 | ||||||||||||||||
| Finance expense | (790,333 | ) | (56 | ) | (790,389 | ) | (790,389 | ) | ||||||||||||
| Profit / (loss) before income tax and social contribution | 703,749 | 59,863 | 763,612 | (283,861 | ) | 479,751 | ||||||||||||||
| Income tax and social contribution | (169,073 | ) | (17,373 | ) | (186,446 | ) | (186,446 | ) | ||||||||||||
| Profit / (loss) for the period | 534,676 | 42,490 | 577,166 | (283,861 | ) | 293,305 | ||||||||||||||
(*) See note 3.
(4) Operating Expenses includes equity pick up of TLA in the amount of US$ 283,861 recognized in the Aviation segment.
F-73
TAM S.A.
Notes of the ínterim financial statements - Unaudited
(In thousands of Dollar, unless otherwise indicated) |
| 31. | Events occurring after the reporting period |
Material fact – joint venture between Multiplus and Groupe Aeroplan
On November 7, 2011, Multiplus, a subsidiary controlled by TAM, into a binding partnership agreement (Joint Venture Agreement) with Groupe Aeroplan (“Aimia”) a Canadian public company and a global leader in loyalty marketing, to create a new loyalty marketing services company in Brazil, and each of Multiplus and Aimia will own 50% (fifty percent) of the shares/quotas of the New Company.
The joint venture will focus on the design, development, management and providing to third parties consulting services and data analytics for loyalty and incentive programs. The Joint Venture will not develop coalition programs similar to the one operated by Multiplus and therefore will not affect Multiplus’s main activity.
F-74
5.1 RECLASIFICATION OF THE TAM S.A. BALANCE SHEET
Considering that under the applicable financial accounting framework LAN Airlines S.A. will consolidate TAM S.A. as from the completion of the merger, certain reclassifications determined by management of the participating entities have been made to the TAM S.A. statement of financial position in order to present TAM S.A.´s financial position in a format consistent with the LAN Airlines S.A.’s consolidated financial statements:
| Notes to the | |||||||||||||
| TAM S.A. | Reclasifications | reclasifications | TAM Proforma | ||||||||||
| THUS$ | THUS$ | THUS$ | |||||||||||
| ASSETS | |||||||||||||
| Current assets | |||||||||||||
| Cash and cash equivalents | 277,741 | - | 277,741 | ||||||||||
| Other financial assets | - | 763,820 | (1) | 763,820 | |||||||||
| Other non-financial assets | - | 16,987 | (2) | 16,987 | |||||||||
| Financial assets at fair value through profit and loss | 749,024 | (749,024 | ) | (1) | - | ||||||||
| Trade and other accounts receivable | - | 1,098,850 | (2, 10) | 1,098,850 | |||||||||
| Trade accounts receivable | 1,060,932 | (1,060,932 | ) | (10) | - | ||||||||
| Inventories | 118,516 | (38,162 | ) | (13) | 80,354 | ||||||||
| Tax assets | - | 326,452 | (11) | 326,452 | |||||||||
| Tax recoverable | 326,452 | (326,452 | ) | (11) | - | ||||||||
| Prepaid expenses | 67,141 | (67,141 | ) | (2, 7) | - | ||||||||
| Derivative financial instruments | 14,796 | (14,796 | ) | (1) | - | ||||||||
| Other receivables | 46,311 | (46,311 | ) | (2) | - | ||||||||
| Total current assets | 2,660,913 | (96,709 | ) | 2,564,204 | |||||||||
| Current assets held for sale | - | 9,431 | (2) | 9,431 | |||||||||
| Total current assets | 2,660,913 | (87,278 | ) | 2,573,635 | |||||||||
| Non-current assets | |||||||||||||
| Restricted cash | 32,927 | (32,927 | ) | (3) | - | ||||||||
Financial assets – securities issued by banks | 86,590 | (86,590 | ) | (3) | - | ||||||||
| Other financial assets | - | 152,860 | (3) | 152,860 | |||||||||
| Other non-financial assets | - | 324,447 | (4, 12) | 324,447 | |||||||||
| Rights receivable | - | 1,753 | (4) | 1,753 | |||||||||
| Intangible assets | 326,616 | (326,616 | ) | (14) | - | ||||||||
| Intangible assets other than goodwill | - | 305,983 | (14) | 305,983 | |||||||||
| Goodwill | - | 20,633 | (14) | 20,633 | |||||||||
| Property, plant and equipment | 4,919,659 | 38,162 | (13) | 4,957,821 | |||||||||
| Deposits in guarantee | 29,731 | (29,731 | ) | (3) | - | ||||||||
| Deferred income tax and social contribution | 18,482 | (18,482 | ) | (15) | - | ||||||||
| Prepaid aircraft maintenance | 293,075 | (293,075 | ) | (4) | - | ||||||||
| Other non-current assets | 14,083 | (14,083 | ) | (4) | - | ||||||||
| Derivative financial instruments | 3,612 | (3,612 | ) | (3) | - | ||||||||
| Deferred tax assets | - | 70,099 | (2, 15) | 70,099 | |||||||||
| Total non-current assets | 5,724,775 | 108,821 | 5,833,596 | ||||||||||
| - | |||||||||||||
| Total assets | 8,385,688 | 21,543 | 8,407,231 | ||||||||||
| LIABILITIES | |||||||||||||
| Current liabilities | |||||||||||||
| Suppliers | 262,496 | (262,496 | ) | (5) | - | ||||||||
| Other financial liabilities | - | 1,052,649 | (5, 6, 8, 10) | 1,052,649 | |||||||||
| Financial liabilities | 1,005,977 | (1,005,977 | ) | (10) | - | ||||||||
| Trade and other accounts payable | - | 736,987 | (5) | 736,987 | |||||||||
| Salaries and social charges | 277,710 | (277,710 | ) | (5) | - | ||||||||
| Deferred income | 890,108 | (890,108 | ) | (7) | - | ||||||||
| T axes, charges and contributions | 228,766 | (228,766 | ) | (5) | - | ||||||||
| Income tax and social contribution payable | 2,540 | (2,540 | ) | (11) | - | ||||||||
| T ax liabilities | - | 81,098 | (5, 11) | 81,098 | |||||||||
| Derivative financial instruments | 46,672 | (46,672 | ) | (6) | - | ||||||||
| Other non-financial liabilities | - | 884,067 | (2, 5, 7, 9, 10) | 884,067 | |||||||||
| Dividends payables | 466 | (466 | ) | (10) | - | ||||||||
| Other current liabilities | 87,760 | (87,760 | ) | (5, 7) | - | ||||||||
| Total current liabilities | 2,802,495 | (47,694 | ) | 2,754,801 | |||||||||
| Non-current liabilities | |||||||||||||
| Other financial liabilities | - | 3,882,097 | (8, 10) | 3,882,097 | |||||||||
| Financial liabilities | 3,839,234 | (3,839,234 | ) | (10) | - | ||||||||
| Other accounts payable | - | 217,896 | (16) | 217,896 | |||||||||
| Derivative financial instruments | 42,863 | (42,863 | ) | (8) | - | ||||||||
| Deferred income | 23,993 | (23,993 | ) | (16) | - | ||||||||
| Provisions | 132,944 | (132,944 | ) | (12) | - | ||||||||
| Other provisions | - | 151,986 | (12) | 151,986 | |||||||||
| Refinanced taxes payable under Fiscal | 229,508 | (229,508 | ) | (9) | - | ||||||||
| Recovery Program | |||||||||||||
| Deferred tax liabilities | - | 50,195 | (15) | 50,195 | |||||||||
| Other non-current liabilities | 219,671 | 35,605 | (9, 16) | 255,276 | |||||||||
| Total non-current liabilities | 4,488,213 | 69,237 | 4,557,450 | ||||||||||
| Total liabilities | 7,290,708 | 21,543 | 7,312,251 | ||||||||||
Reclassifications
The following reclassifications were made to present these items under the structure of the Balance Sheet defined by LAN Airlines S.A., in accordance with IFRS, and the Chilean regulatory requirements (Superintendencia de Valores y Seguros), which were originally recorded under the financial structure defined by TAM:
| 1. | Reclassification from short-term Financial Assets at Fair Value through Profit and Loss of US$ 749,0 million and Derivative Financial Instruments of US$ 14,8 million to Other short-term Financial Assets. |
| 2. | Reclassification from Other Receivables of US$ 46,3 million and Prepaid Expenses of US$ 67,1 million to Trade and Other Accounts Receivable of US$ 37,9 million, Other Non-Financial Assets of US$ 17,0 million, Deferred Tax Assets of US$ 1,4 million and Current assets held for sale of US$ 9,4 million, as well as decreases in Other short-term Non-Financial Liabilities of US$ 47,7 million. |
| 3. | Reclassification from Restricted Cash of US$ 32,9 million, Financial Assets-Securities Issued by Banks of US$ 86,6 million, Deposits in Guarantee of US$ 29,7 million, and Derivative Financial Instruments of US$ 3,6 million (non-current) to Other long-term Financial Assets. |
| 4. | Reclassification from Prepaid Aircraft Maintenance of US$ 293,1 million and Other long-term Assets of US$ 14,1 million to long-term Other Non-Financial Assets of US$ 305,4 million and to Rights Receivable of US$ 1,8 million. |
| 5. | Reclassification from Suppliers of US$ 262,5 million, Salaries and Social Charges of US$ 277,7 million, Taxes, Charges and Contributions of US$ 228,8 million, and Other Current Liabilities of US$ 74,4 million to Trade and Other Accounts Payable of US$ 737,0 million, Tax Liabilities of US$ 78,6 million, and to Other short-term Non-Financial Liabilities of US$ 27,9 million. |
| 6. | Reclassification of short-term Derivative Financial Instruments of US$ 46,7 million to Other Current Financial Liabilities. |
| 7. | Reclassification from short-term Deferred Income of US$ 890,1 million and Other Current Liabilities (third party advances) of US$ 13,3 million to Other Non-Financial Liabilities. |
| 8. | Reclassification of long-term Derivative Financial Instruments of US$ 42,9 million to Other Non-Current Financial Liabilities. |
| 9. | Reclassification from Taxes Refinanced taxes payable under Fiscal Recovery Program long-term of US$ 229,5 million to Other Non-Current Liabilities. |
| 10. | Reclassification from Dividends Payable of US$ 0,5 million to Other short-term Non-Financial Liabilities, from Trade Accounts Receivable of US$1,060,9 million to Trade and Other Accounts Receivable, from Financial Liabilities short-term of US$ 1.006,0 million and long-term of US$ 3.839,2 million to Other Financial Liabilities. |
| 11. | Reclassifications from Income Tax and Social Contribution Payable of US$ 2,5 million to Tax Liabilities and reclassification from Taxes Recoverable of US$ 326,5 million to Tax Assets. |
| 12. | Reclassification of US$ 152,0 million from Provisions to Other Provisions. Additional adjustment to reclassify a US$ 19,0 million debit balance within Other Provisions to Other long-term non-financial assets, thereby increasing the asset and liability accounts. |
| 13. | Reclassification from Inventories to Property, Plant and Equipment of US$ 38,2 million. |
| 14. | Reclassification from Intangible Assets to Intangible Assets other than Goodwill of US$ 326,6 million. Additional reclassification from Intangible Assets other than Goodwill of US$ 20,6 million to Goodwill. |
The following reclassifications were made to align the presentation of TAM S.A’s Balance Sheet in accordance with the accounting policies of LAN Airlines S.A.
| 15. | Reclassification from Deferred Income Tax and Social Contribution to Deferred Tax Assets of US$ 68,7 million and to Deferred Tax Liabilities of US$ 50,2 million. |
| 16. | Reclassifications from Other Non-Current Liabilities to Other Accounts Payable of US$ 217,9 million and from Deferred Income to Other Non-Current Liabilities of US$ 24,0 million. |
5.2 FAIR VALUE ADJUSTMENTS MADE TO THE ASSETS AND LIABILITIES OF TAM S.A.
In accordance with International Financial Reporting Standard 3 “Business Combinations” (revised 2008) using the purchase method of accounting, with LAN Airlines S.A. considered the acquirer of TAM S.A., LAN Airlines S.A. is required to recognize the acquired assets and liabilities of TAM S.A. at their fair value. This appendix shows the details of the fair value adjustments made to TAM S.A.’s assets and liabilities as a result of applying that standard at Septemeber 30, 2011.
| Fair Value | Notes to the | TAM | |||||||||||
| TAM Proforma | Adjustmente | ajustments | ADJUSTED | ||||||||||
| THUS$ | THUS$ | THUS$ | |||||||||||
| CURRENT ASSETS: | |||||||||||||
| Cash and cash equivalents | 277,741 | - | 277,741 | ||||||||||
| Other financial assets | 763,820 | - | 763,820 | ||||||||||
| Other non-financial assets | 16,987 | - | 16,987 | ||||||||||
| Trade and other accounts receivable | 1,098,850 | - | 1,098,850 | ||||||||||
| Accounts receivable from related entities | - | - | - | ||||||||||
| Inventories | 80,354 | 11,077 | (a) | 91,431 | |||||||||
| Tax Assets | 326,452 | - | 326,452 | ||||||||||
| Total current assets | 2,564,204 | 11,077 | 2,575,281 | ||||||||||
| Current assets held for sale | 9,431 | 1,103 | (f) | 10,534 | |||||||||
| Total current assets | 2,573,635 | 12,180 | 2,585,815 | ||||||||||
| NON-CURRENT ASSETS: | |||||||||||||
| Other financial assets | 152,860 | - | 152,860 | ||||||||||
| Other non-financial assets | 324,447 | (2,973 | ) | (m) | 321,474 | ||||||||
| Rights receivable | 1,753 | - | 1,753 | ||||||||||
| Equity accounted investments | - | - | - | ||||||||||
| Intangible assets other than goodwill | 305,983 | 1,272,875 | (c) | 1,578,858 | |||||||||
| Goodwill | 20,633 | - | 20,633 | ||||||||||
| Property, plant and equipment | 4,957,821 | (109,317 | ) | (a, f, g, i, k) | 4,848,504 | ||||||||
| Deferred tax assets | 70,099 | 45,021 | (o) | 115,120 | |||||||||
| Total non-current assets | 5,833,596 | 1,205,606 | 7,039,202 | ||||||||||
| Total Assets | 8,407,231 | 1,217,786 | 9,625,017 | ||||||||||
| LIABILITIES: | |||||||||||||
| Other financial liabilities | 1,052,649 | (26,669 | ) | (e) | 1,025,980 | ||||||||
| Trade and other accounts payable | 736,987 | 39,219 | (h, j) | 776,206 | |||||||||
| Accounts payable to related entities | - | - | - | ||||||||||
| Other provisions | - | - | - | ||||||||||
| Tax liabilities | 81,098 | - | 81,098 | ||||||||||
| Other non-financial liabilities | 884,067 | (38,552 | ) | (b, n) | 845,515 | ||||||||
| Total current liabilities | 2,754,801 | (26,002 | ) | 2,728,799 | |||||||||
| Liabilities clasified as held for sale | - | - | - | ||||||||||
| Total current liabilities | 2,754,801 | (26,002 | ) | 2,728,799 | |||||||||
| NON-CURRENT LIABILITIES: | |||||||||||||
| Other financial liabilities | 3,882,097 | (33,772 | ) | (e) | 3,848,325 | ||||||||
| Other accounts payable | 217,896 | 37,763 | (h, j) | 255,659 | |||||||||
| Other provisions | 151,986 | 57,575 | (l) | 209,561 | |||||||||
| Deferred tax liabilities | 50,195 | 439,666 | (o) | 489,861 | |||||||||
| Employee benefits | - | - | - | ||||||||||
| Other non-current liabilities | 255,276 | (23,993 | ) | (b) | 231,283 | ||||||||
| Total non-current liabilities | 4,557,450 | 477,239 | 5,034,689 | ||||||||||
| Total liabilities | 7,312,251 | 451,237 | 7,763,488 | ||||||||||
| TOTAL NET ASSETS | 1,861,529 | ||||||||||||
| a) | Inventories and property, plant and equipment: a US$ 16,3 million ($11,1 million in Inventories and US$ 5,2 million in Property, plant and equipment) increase to reflect the fair value of TAM S.A.’s owned inventories. |
| b) | Deferred revenue: a reduction of US$ 20,3 million to reflect the estimate of tickets sold and not yet used that will expire (breakage), and a reduction of US$ 41,8 million related to the elimination of deferred gains on leaseback operations recorded by TAM S.A.’s. |
| c) | Intangible assets: An increase of US$ 1.273 million associated with adjustments to record the fair value of TAM S.A.’s identifiable intangible assets, including indefinite-lived intangible assets such as take-off and landing slots, and the TAM brand. These intangibles are not amortized and instead are evaluated for impairment at least annually or whenever circumstances indicate that they may be impaired. |
| d) | Financial liabilities: A reduction of US$ 26,7 million to short-term and a reduction of US$ 33,8 million to long-term debt to reflect its fair value. |
| e) | Exchange rate: TAM´s functional and presentation currency under IFRS is the Brazilian real. Solely for the purpose of preparing these proforma financial statements, TAM S.A.’s financial statements have been translated into US dollars applying the closing exchange rate at September 30, 2011 to all Balance Sheet accounts. |
| f) | Property, plant and equipment (Fleet, including finance leases): a decrease of US$ 174,6 million to reflect the fair value of TAM S.A.’s aircraft recorded as property, plant and equipment and an increase of US$ 1,1 million in aircraft recorded as Current assets held for sale. |
| f) | Property, plant and equipment (Land and buildings): an increase of US$ 11,9 million to reflect the fair value of TAM S.A.’s land and buildings. |
| h) | Aircraft operating leases: an increase of US$ 227,5 million related to provisions for major maintenance on aircraft under operating leases with Time & Materials maintenance contracts, in order to account for these maintenance costs in a manner consistent with that used by LAN Airlines S.A. |
| i) | Rotable parts: an increase of US$ 27,2 million to reflect the fair value of TAM S.A.’s rotable parts. |
| j) | Maintenance provisions: a decrease of US$ 83,2 million to record maintenance costs relating to aircraft and engines recorded as property, plant and equipment in a manner consistent with that applied in the LAN Airlines S.A. financial statements. |
| k) | Pre-delivery payments: an increase of US$ 21,0 million to reflect the fair value of pre-delivery payments made by TAM S.A. on the future purchase of aircraft. |
| l) | Contingencies: an increase of US$ 57,6 million to reflect the fair value of TAM´s labor, civil and tax contingencies. |
| m) | Prepaid maintenance: A decrease of US$ 3,0 million to reflect the fair value of “Maintenance Reserve Payments” made by TAM to lessors of aircraft and engines. |
| n) | Dividends payable: Dividends payable by TAM S.A. at September 30, 2011 of US$ 0,5 million have been reversed as this payable would represent an intercompany account in the LATAM group and hence be eliminated on consolidation. |
| o) | Income Taxes: Corresponds to the income tax effects of the purchase accounting adjustments. |
APPENDIX 6
STEP BY STEP SUMMARY OF THE TRANSACTION
STEP BY STEP
MERGER BY ABSORPTION INTO LAN AIRLINES S.A.
OF SISTER HOLDCO S.A. AND HOLDCO II S.A.
| · | Existing situation: |
In order to follow the transaction steps, it is important to take into account the following table of TAM S.A. shares structure:
| Shares | TEP Chile S.A. | Other shareholders | Total | |||
| ON – Voting stock | 85,3736% | 14,6264% | 100% ON | |||
| PN –Non Voting stock | 25,0873% | 74,9127% | 100% PN | |||
| ************ | ************ | ************ | ************ | |||
| TOTAL – ON y PN | 46,6291% | 53,3709% | 100% Total |
The merger proposal is framed within actions intended to achieve the combination of business between the Chilean company LAN Airlines S.A. and the Brazilian company TAM S.A. Specifically, the actions contemplate to perform the following steps in Chile:
| · | Holdco I S.A. |
| o | The subscription and payment by TEP Chile S.A., in cash (for a nominal subscription price), of all (100%) Holdco I S.A. Voting Stock. |
| o | The subscription and payment by LAN Airlines S.A., in cash (for a nominal subscription price), of a nominal ownership (0,000004%) of Holdco I S.A. Non-voting stock. |
| o | The subscription by TEP Chile S.A. of almost all (99,999996%) of Holdco I S.A. Non-voting shares, to be paid at the closing by the contribution of the 85,3736% of TAM S.A. series ON shares (voting stock). |
| o | Shares at the subscription table: |
| Shares | ||||||||
Shareholder | Voting Stock | Non-voting Stock | ||||||
| TEP Chile S.A. | �� | 100 | % | 99,999996 | % | |||
| LAN Airlines S.A. | 0 | 0,000004 | % | |||||
| Total: | 100 | % | 100 | % | ||||
| o | Underlying asset to the closing: (i) nominal amount of cash, and (ii) 85,3736% of TAM S.A. series ON shares (Voting Stock). |
| · | Sister Holdco S.A. |
| o | The subscription and payment by TEP Chile S.A. and a designated third party, in cash (for a nominal subscription price), of a nominal ownership percentage (0,000001% each) of Sister Holdco S.A. shares. |
| o | The subscription by TEP Chile of almost all (99,999998%) of Sister Holdco S.A. shares, to be paid at closing by the contribution of (i) 6,2% of Holdco I S.A. Voting stock, (ii) 99,999996% of Holdco I S.A. Non-voting stock, and (iii) 25,0873% of TAM S.A. PN series (Non-voting stock). |
| o | Table of shares at the subscription: |
| Shareholder | Shares | |||
| TEP Chile S.A. | 99,999999 | % | ||
| Nominal shareholders | 0,000001 | % | ||
| Total: | 100 | % | ||
| o | Underlying asset before closing: (i) nominal amount of cash, (ii) 6,2% of Holdco I S.A. Voting Stock, (ii) 99,999996% of Holdco I S.A. Non-voting Stock, and (iii) 25,0873% of TAM S.A. series PN shares (non-voting Stock). |
| · | Holdco II S.A. |
| o | Subscription and payment by Holdco I S.A. and LAN Airlines S.A., in cash (for a nominal subscription price), of a nominal ownership percentage (0,000001% each) of Holdco II S.A. |
| The issuance of almost all Holdco II S.A. shares (99,999998%) to be subscribed and paid at the closing by the contribution of 14,6264% of TAM S.A. series ON shares (Voting Stock), and of the 74,9127% of TAM S.A. series PN shares (non-voting Stock), that TAM S.A. shareholders will contribute to Holdco II S.A. as a consequence of the subscription of Holdco II S.A. shares. This operation is to be implemented as a result of the exchange offer explained below. |
| o | Table of shares at the incorporation: |
| Shareholders | Shares | |||
| Holdco I S.A. | 0,000001 | % | ||
| LAN Airlines S.A. | 0,000001 | % | ||
| Pending | 99,999998 | % | ||
| Total: | 100 | % | ||
| o | Underlying asset before closing: (i) nominal amount of cash, (ii) 14,6264% of TAM S.A. series ON shares (Voting Stock), and (iii) 74,9127% of TAM S.A. series PN shares (Non-voting stock). |
| · | TAM S.A. shares Exchange offer |
| o | Holdco II S.A. will commence the Exchange Offer of shares (OPA) for 100% of TAM S.A. series ON shares and 100% of TAM S.A. series PN shares that are not owned by TEP Chile (mentioned above), amounting to the 53,3709% of TAM S.A. outstanding shares. |
| · | Mergers |
| o | If the Exchange Offer is successful – if the acceptance rate allows delisting TAM S.A. and taking into effect the forced buy or statutory squeeze out regarding to those TAM S.A. shares that have not been acquired, among other conditions – LAN Airlines S.A. will merge with Sister Holdco S.A. and Holdco II S.A., by absorbing them. |
| o | The exchange rate will be of 0,9 new shares of LAN Airlines S.A. for every share of Sister Holdco S.A. and 0,9 shares of LAN Airlines for every Holdco II S.A. share. |
| o | Therefore, as a result of the mergers, LAN Airlines will become owner of: |
By the merger of Sister Holdco S.A. into LAN Airlines S.A.
| § | 6,2% Holdco I S.A Voting Stock – previously owned by Sister Holdco S.A. |
| § | 99,999996% Holdco I S.A: Non-voting Stock – previously owned by Sister Holdco S.A. |
| § | 25,0873% of TAM S.A. series PN shares (Non-voting Stock) – previously owned by Sister Holdco S.A. |
By the merger of Sister Holdco S.A. into LAN Airlines S.A.
| § | Up to the 14,6264% of TAM S.A. series ON shares (Voting Stock) – that may be acquired by Holdco II S.A. as a result of the Exchange offer. |
| § | Up to 74,9172% of TAM S.A. series PN shares (Non-voting Stock) – that may be acquired by Holdco II S.A. as a result of the Exchange offer. |