Table of Contents
UNITED STATES
SECURITIES AND EXCHANGE COMMISSION
Washington, DC 20549
FORM 6-K
REPORT OF FOREIGN PRIVATE ISSUER
PURSUANT TO RULE 13a-16 OR 15d-16 OF
THE SECURITIES EXCHANGE ACT OF 1934
For the month of April, 2012.
Commission File Number 1-14728
Lan Airlines S.A.
(Translation of registrant’s name into English)
Presidente Riesco 5711, 20th floor
Las Condes
Santiago, Chile
(Address of principal executive offices)
Indicate by check mark whether the registrant files or will file annual reports under cover of Form 20-F or Form 40-F.
Form 20-F x Form 40-F ¨
Indicate by check mark if the registrant is submitting the Form 6-K in paper as permitted by Regulation S-T Rule 101(b)(1): ¨
Indicate by check mark if the registrant is submitting the Form 6-K in paper as permitted by Regulation S-T Rule 101(b)(7): ¨
Table of Contents

Annual Report 2011
Table of Contents
Annual Report 2011
Contents
| 3 | ||||||
| 5 | ||||||
Chapter I | 7 | |||||
| 8 | ||||||
| 9 | ||||||
| 10 | ||||||
| 12 | ||||||
| 14 | ||||||
Chapter II | 19 | |||||
| 20 | ||||||
| 24 | ||||||
| 29 | ||||||
| 34 | ||||||
| 37 | ||||||
Chapter III | 40 | |||||
| 41 | ||||||
Chapter IV | 44 | |||||
| 45 | ||||||
| 46 | ||||||
| 53 | ||||||
| 54 | ||||||
| 56 | ||||||
| 58 | ||||||
| 69 | ||||||
Chapter V | 70 | |||||
| 71 | ||||||
| 77 | ||||||
| 79 | ||||||
| 81 | ||||||
| 83 | ||||||
| 85 | ||||||
| 87 | ||||||
| 89 | ||||||
Chapter VI | 93 | |||||
Chapter VII | 98 | |||||
Chapter VIII | 103 | |||||
Chapter IX | 235 | |||||
| 267 | ||||||
| 268 | ||||||
Table of Contents

Message from the Chairman of the Board
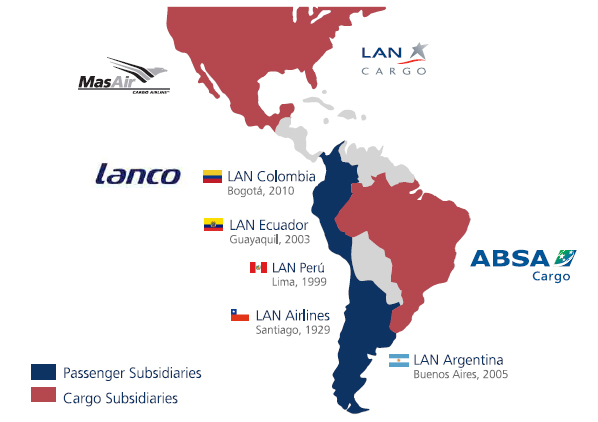
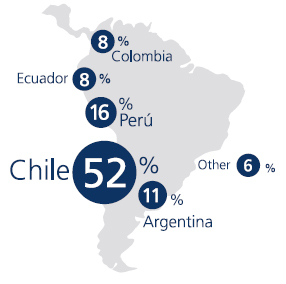
 | Geographic diversification has been crucial in our process of expansion. Today, we serve five domestic passenger markets - Chile, Peru, Argentina, Ecuador and Colombia - as well as international passenger services that connect the region to the rest of the world and a cargo operation, based in Miami. |
Dear Shareholders,
Over the past 18 years, LAN has experienced a process of solid and sustained growth accompanied by the internationalization of its operations, positioning it as an important player in the world’s complex and ever more competitive airline industry. We are proud of this achievement which confirms that the strategy implemented since 1994 by the Company’s present controllers has been the right one in its quest to grow LAN’s market and services.
From the start, we opted to differentiate our product, a process in which the decision to invest in talent, fleet and service was key. From having just 13 aircraft and with passenger and cargo operations based only in Chile, we have emerged as a regional airline with a modern fleet that, as of end 2011, comprised 149 aircraft.
Geographic diversification has been crucial in our process of expansion. Today, we serve five domestic passenger markets - Chile, Peru, Argentina, Ecuador and Colombia - as well as international passenger services that connect the region to the rest of the world and a cargo operation, based in Miami, with a network of coverage that includes the main cities of South America, Mexico and some Central American and European countries. In this context, the launch of our new subsidiary in Colombia was one of the great milestones of 2011 since it will allow us to participate
actively in this country’s domestic passenger market, the second largest in South America, and to continue to grow in capacity and connectivity.
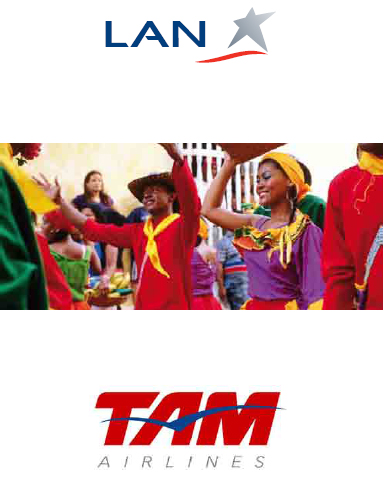
Brazil has always been one of our Company’s priorities and we are pleased with the important progress achieved during the year in our process of association with TAM. Thanks to this project, we will, as from 2012, incorporate a sixth market - Brazil - that accounts for half of South America’s air traffic. This association will not only mark a further milestone in LAN’s track record of growth but will also mean great benefits for our customers in terms of fares, connectivity and flight options.
By building on our strengths as regards service quality, flight safety and range of destinations, we have been able to earn the preference of our customers in most of the countries in which we operate. From carrying just 1.2 million passengers in 1994, we have grown to 22.6 million passengers in 2011.
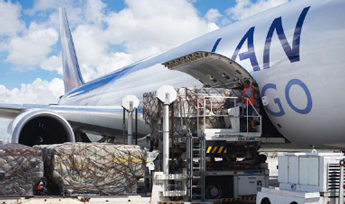
We have also contributed to the development of the region’s air cargo market and, as a result, fostered trade between Latin America, the United States and Europe. As of end-2011, LAN operated a fleet of 14 exclusively cargo aircraft as well as carrying cargo in the belly of its
| Annual Report 2011 | | 3 |
Table of Contents
passenger aircraft, a differentiating strategy that is one of the competitive advantages of LAN’s business model. In cargo, we have also achieved exponential growth and, in 2011, transported 875,000 tonnes of cargo, up from 124,000 tonnes in 1994.
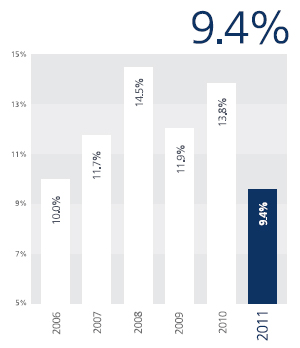
This is also reflected in the extraordinary growth of the Company’s revenues which, from US$318 million in 1993, rose to US$5,718 million in 2011. Over the same period, our profits swelled from US$0.3 million to US$320 million, with an operating margin that, in 2011, reached 9.4%. As a result, LAN’s market capitalization has also grown exponentially and, at US$7,920 million in December 2011, was among the three largest in the world airline industry.
We are proud of our work over the past 18 years, not only because of the expansion of our business but also because we have made a valuable contribution to the development of the airline industry in Latin America and, therefore, to the economic development of the region’s countries, supporting the projects of Chilean companies as they have globalized and achieved world-class status.
We are convinced that LAN today is prepared for the new and challenging stage in its development that will begin in 2012, a year that will mark its definitive entry into the big leagues of the global airline industry. In achieving this, the participation and commitment of our people has been crucial. I would, therefore, like to thank each and every one of our collaborators whose professionalism and great technical capacity have played a fundamental role in this process.
I would, in addition, like to offer sincere and deserved thanks to all those who made possible the realization of the dream of our association with TAM and the creation of LATAM. I am certain that, for all our shareholders, workers and passengers, this great new company will bring the reward of new and important achievements.

Jorge Awad M.
Chairman
| Annual Report 2011 | | 4 |
Table of Contents
Message from the Chief Executive Officer
 | Our main source of pride as regards to our management in 2011 is the record time in which we successfully implemented the restructuring of Colombia’s Aires airline, acquired by LAN in November 2010. |
Dear Shareholders,
For the airline business, 2011 was not an easy year. In addition to the increase in fuel prices and the economic turbulence seen in Europe and the United States, we faced the eruption of the Puyehue-Cordón Caulle Volcano in Chile. This disrupted air traffic in part of South America as well as affecting our operations on the Santiago-Auckland- Sydney route in Oceania. In this context, however, LAN once again showed that, thanks to its diversified and flexible business model, it is prepared to address and mitigate the impact of adverse conditions. Indeed, it was able not only to grow and continue creating value for its shareholders but also to lay down the foundations for ensuring a profitable operation, taking advantage of opportunities for future growth.
In this sense, our main source of pride as regards to our management in 2011 is the record time in which we successfully implemented the restructuring of Colombia’s Aires airline, acquired by LAN in November 2010. We immediately began to introduce operational changes, such as route modifications and gains in efficiency, achieving LAN’s standards in terms of safety, punctuality and service. This process culminated in December 2011 when we launched the LAN brand in the Colombian market.
This is the fifth country in the region in which LAN has domestic passenger operations, along with Chile, Peru, Argentina and Ecuador. For our Company, this milestone meant the incorporation of 23 new destinations into its network, including 22 within Colombia, and, as from February 2012, the international Bogotá-Miami route. Passenger operations in Colombia were always a strategic goal for LAN since it has Latin America’s fourth largest economy and its second largest passenger market after Brazil. In addition, it has the potential to become an important hub for LAN’s international cargo and passenger businesses.
In 2011, we also achieved important progress in our association project with TAM, Brazil’s largest airline. We obtained unconditional approval from the competition authorities of Italy, Germany and Spain while, in Chile and Brazil, we received the necessary regulatory permits on condition of some measures of mitigation. The operation was also approved by LAN’s shareholders after which we started the technical and preparatory work for the companies’ future integration, which we estimate will occur during the early months of 2012.
| Annual Report 2011 | | 5 |
Table of Contents
The new holding, to be known as LATAM Airlines Group, will bring together LAN and TAM, although each company will maintain its corporate identity and respective brand. Their joint operations will initially comprise over 300 aircraft and some 150 destinations in 23 countries. Transporting over 60 million passengers a year and almost 1 million tonnes of cargo, it will be Latin America’s largest airline and one of the three largest in the world in terms of market capitalization. This will, without doubt, be the most transcendental operation of LAN’s history.
Our association with TAM will give us access to the Brazilian market, a goal long sought by LAN, where we see great opportunities in both the cargo and passenger businesses. In the case of cargo, a business in which we have a long and successful track as the region’s largest carrier, we believe we will be able to make a significant contribution to TAM’s network. Similarly, in the case of international passenger operations, we see important opportunities in the combination of our networks, with their highly complementary routes. As well as the very important revenues they promise, these two businesses also offer important efficiency gains and cost savings. As a result, we estimate that the combined synergies produced by the merger could boost the new company’s operating earnings before depreciation and tax by between US$600 million and US$700 million annually as from the fourth year, once the association has been perfected.
The size of Brazil’s domestic market makes this an historic opportunity: 40% of its population, or some 80 million people, belong to a middle class that is just starting to travel by air. This phenomenon will create a boom of which we are certain the LATAM Group will be able to take advantage.
We are proud of our work in 2011, a year in which we continued to serve the region with the quality and service standards for which we are known. At the same time, we maintained our position of leadership in most of the markets in which we operate and continued working to diversify the Company and open up new horizons for its development.
We are convinced that great goals can be achieved only by committed human teams. As LAN’s successful track record has shown over the past 18 years, excellent teams make excellent companies. I would, therefore, like to recognize the valuable contribution made by each one of our workers, technicians, professionals and executives in the different countries in which we are present. Their efforts and dedication have been crucial for LAN’s transformation. In addition, I would like to thank our shareholders for the confidence that, over all these years, they have placed in this administration which has allowed us to transform LAN into a world-class airline.

Enrique Cueto P.
Chief Executive Officer
| Annual Report 2011 | | 6 |
Table of Contents
Our Company
Company Information
Vision, Mission and Values
Strategy and Business Model
Our History
Our Fleet
Table of Contents
Company Information
 |
LAN AIRLINES S.A.
Tax N° (RUT): 89.862.200-2
Corporate Headquarters
Avenida Presidente Riesco 5711, 19th Floor
Las Condes, Santiago, Chile
Tel: (56) (2) 565 2525
Fax: (56) (2) 565 8764
Maintenance Center
Arturo Merino Benítez Airport
Santiago, Chile
Tel: (56) (2) 677 4500
Fax: (56) (2) 677 4505
Ticker Symbol
LAN - Santiago Stock Exchange
LFL - New York Stock Exchange
Financial Information
Investor Relations
LAN Airlines S.A.
Avenida Presidente Riesco 5711, 20th Floor,
Las Condes, Santiago, Chile
Tel: (56) (2) 565 8785
E-mail: Investor.Relations@lan.com
Shareholder Enquiries
Depósito Central de Valores
Huérfanos 770, 22nd Floor
Santiago, Chile
E-mail: atencionaccionistas@dcv.cl
Tel: (56) (2) 393 9003
Fax: (56) (2) 393 9315
Depositary Bank
JPMorgan Chase Bank, N.A.
JPMorgan Chase & Co.
P.O. Box 64504
St. Paul, MN 55164-0504
Tel: General (800) 990-1135
Tel: From outside US (651) 453 2128
Tel: Global Invest Direct (800) 428 4237
E-mail: jpmorgan.adr@wellsfargo.com
Custodian Bank
Banco Santander Chile
Bandera 140, Santiago
Custody Department
Tel: (56) (2) 320 3320
Fax: (56) (2) 320 3560
External Auditors
PricewaterhouseCoopers
Avenida Andrés Bello 2711, 5th Floor
Santiago, Chile
Tel: (56) (2) 940 0000
Website
Complete information about
LAN Airlines: www.lan.com
| Annual Report 2011 » Our Company | | 8 |
Table of Contents
Vision, Mission and Values

Vision
To be recognized as one of the world’s ten best airlines.
Mission
To be the carrier of people’s dreams, giving the best of ourselves, earning our customers’ and communities preference and building a sustainable company in which we love to work.
Values
Safety, Achievement, Efficiency and Cordiality.
| Annual Report 2011 » Our Company | | 9 |
Table of Contents
Strategy and Business Model
 | The successful integration of its cargo and passenger businesses, together with its geographic diversification, give LAN’s earnings greater stability through the consolidation of different markets and services. |
A regional airline
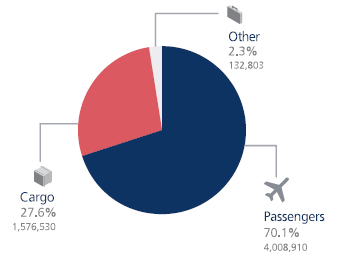
Diversification has been key in LAN’s consolidation as one of the world’s most efficient, competitive and profitable airlines. The development of the Company’s operations is underpinned by a model that integrates its cargo and passenger businesses, allowing it to optimize aircraft utilization and adjust its routes and itineraries in line with demand to the benefit of its earnings. This model, in other words, gives LAN the flexibility it needs to adapt to changing market conditions by taking advantage of the synergies that exist between these two areas of its business. At present, 28% of the Company’s income derives from its cargo business and 70% from its passenger business.
Another pillar of LAN’s strategy is the geographic diversification of its operations within South America under which it has built a network of subsidiaries in Chile, Peru, Argentina, Ecuador and Colombia. This has permitted the sustained development of LAN’s coverage of destinations in accordance with its objective of providing complete connectivity to customers in these countries’ domestic markets as well as within the region and to the
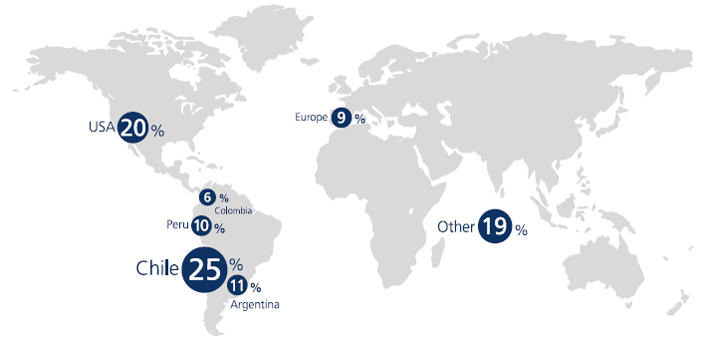
rest of the world. Thanks to this diversification of origin, the domestic markets of the countries in which it operates today account for 27% of the Company’s revenues while 43% correspond to its international operations.
In its passenger business, LAN embarked on a revolutionary change in its short-haul operations in 2007, implementing a low-cost model in the Chilean, Peruvian, Argentine and Ecuadorean domestic markets in a bid to stimulate demand. This change began with the replacement of its short-haul fleet by modern and more efficient aircraft from the Airbus A320 family that permit higher daily utilization. Together with other efficiency gains, this allowed the Company to reduce costs and fares with the result that, over the past four years, it has incorporated over one million new passengers into each of these markets.
Thanks to LAN’s value proposition geared to quality and safety, its services are today recognized as the best in the region and it is noted for the frequency of its flights and the variety of destinations it offers as well as for its modern fleet and technological advances.
| Annual Report 2011 » Our Company | | 10 |
Table of Contents
BUSINESS AND GEOGRAPHIC DIVERSIFICATION
| Annual Report 2011 » Our Company | | 11 |
Table of Contents
Our History
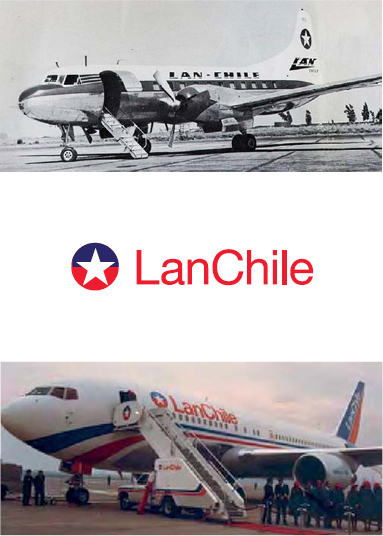
1929
Línea Aérea Nacional de Chile (LAN) founded by
Comandante Arturo Merino Benítez.
1946
First international flight: Santiago-Buenos Aires.
1956
Start of services to Lima.
1958
Start of services to Miami.
1970
LAN begins flights to Europe.
1985
LAN becomes a joint stock company.
1989
Start of privatization of LAN: the Chilean government sells
a 51% stake to local investors and Scandinavian Airlines
System (SAS).
1994
Privatization of LAN completed with the acquisition
of a 98.7% stake by its current controllers and other
shareholders.
1997
LAN lists on the New York Stock Exchange, becoming
the first Latin American airline to trade ADRs on this
important financial market.
1999
LAN’s expansion begins: start of operations of LAN Peru.
2000
LAN joins the oneworld alliance.
2001
Alliance with Iberia and inauguration of Miami cargo
terminal.
| Annual Report 2011 » Our Company | | 12 |
Table of Contents
2002
Alliance with Qantas and Lufthansa Cargo.
2003
LAN continues its expansion plan: start of operations of
LAN Ecuador.
2004
Launch of new corporate image as LAN Airlines S.A.
2005
Further step in LAN’s regional expansion plan: start of
operations of LAN Argentina.
2006
Launch of new Premium Business Class.
2007
Implementation of low-cost model in domestic markets;
capital increase of US$320 million;
purchase orders for 32 Boeing 787 Dreamliners.
2008
Completion of renewal of short-haul fleet with aircraft
from the Airbus A320 family.
2009
Start of cargo operations in Colombia and domestic
passenger operations in Ecuador; purchase order for 30
aircraft from the Airbus A320 family.
2010
Purchase order for 50 aircraft from the Airbus A230 family.
LAN bought Aires, a colombian airline.
2011
LAN nd TAM sign binding agreements relating to the
merger of the two airlines.
| Annual Report 2011 » Our Company | | 13 |
Table of Contents
Our Fleet
 | LAN is constantly seeking new and more efficient technologies that help to reduce emissions and, in June 2011, announced the signing of a purchase order for 20 aircraft from the Airbus A320neo family. |
LAN is committed to always being in the vanguard of technology and innovation, two factors that are essential in order to achieve an operation that is efficient and environmentally-friendly. In this way, the Company seeks not only to optimize its costs through savings on fuel and maintenance but also to significantly reduce the CO2 emitted as a result of its flights.
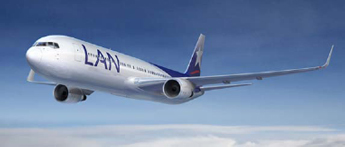
In 2000, LAN embarked on an ambitious program of fleet renewal and expansion, thanks to which it now operates one of the world’s most modern fleets of aircraft. These have an average age of 6.7 years and, as of December 2011, included 135 passenger planes and 14 aircraft exclusively for cargo.
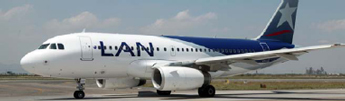
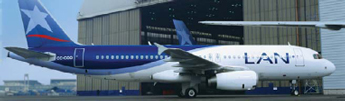
For its short-haul operations, the Company has a modern fleet of single-gangway planes from the Airbus A320 family. These enable it to serve domestic and regional routes within South America efficiently since their range and power permit a high daily utilization rate. With the 17 new Airbus A320s incorporated during 2011, LAN now has 76 planes from this family, comprising 42 A320s, 24 A319s and ten A318s.
LAN’s strategic fleet renewal plan envisages the gradual replacement of its Airbus A318s by A320s which, with their greater capacity, are better suited to the domestic and regional markets in which it operates. In 2011, the Company took five A318s out of service and, in 2012 and 2013, plans to sell another five of these planes each year.
This plan will allow it to reduce emissions per passenger-kilometer by more than 10% on the routes previously operated by A318s.
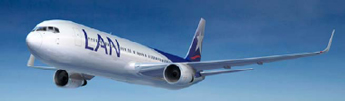
On long-haul routes, LAN uses principally Boeing 767s, a model it prefers since it is very convenient for its eight to ten-hour flights to the United States and some routes to Europe as well as having the advantage of a cargo version. In 2011, it incorporated three Boeing 767-300s for passenger operations and one cargo Boeing 767-300F to serve the growth of operations on its routes north out of Latin America. As of end-2011, its Boeing fleet comprised 54 aircraft, including 14 exclusively for cargo.
In 2011, LAN completed the installation of winglets on all its own long-haul Boeing 767-300s in a project, launched in 2009, that represented an investment of US$75 million. These advanced-technology devices on the edge of wings reduce their aerodynamic resistance and, therefore, fuel consumption. They have allowed the Company to increase the efficiency of its fleet’s fuel consumption by approximately 4%, reducing its impact on the environment. Through this project alone, LAN avoided some 113,000 tonnes of CO2 emissions in 2011.
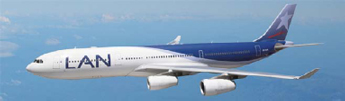
In the case of its ultra-long-haul operations, LAN maintained its fleet of five Airbus A340-300s in 2011. This model has been key in the development of its direct flights from South America to Europe and Oceania.
| Annual Report 2011 » Our Company | | 14 |
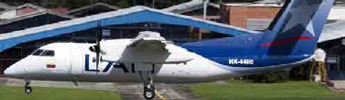
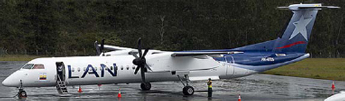
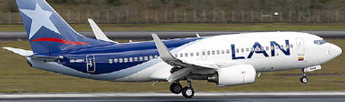
Table of Contents
As of December 2011, LAN’s fleet also included nine Boeing 737-700s, ten Dash 8-200s and four Dash 8-Q400s, all rented, which the Company received as a result of its acquisition of Colombia’s Aires airline in November 2010 (which led to the launch of LAN Colombia in December 2011). LAN Colombia plans to gradually take the Boeing 737s out of service, replacing them with aircraft from the Airbus A320 family.
From the point of view of the growth and modernization of its fleet, 2012 will be a particularly important year for LAN. Its plan envisages the delivery of twelve aircraft from the Airbus A320 family, nine Boeing 767-300s and the first two latest-generation Boeing 787-8 Dreamliners for long-haul routes. LAN will, as a result, become the first airline in the Americas - and one of the first in the world - to operate the Boeing 787 Dreamliner, considered the new “ecological aircraft” since it consumes up to 20% less fuel and significantly reduces noise. The Company’s fleet plan includes the incorporation of 32 of these planes over the next eight years, representing an historic investment for LAN.
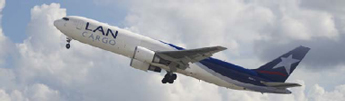
For its cargo operation, the Company expects to receive two new Boeing 777-200Fs in 2012, bringing its planes of this model up to a total of four and positioning it as the first airline in the region - and only the second in the world - to operate these advanced-technology cargo aircraft, considered the most modern in the industry. Their capacity (104 tonnes) and range (8,741 kilometers with maximum cargo weight) will allow the Company to expand its coverage to destinations outside the region and, particularly, to strengthen its cargo operations to Europe.
LAN is constantly seeking new and more efficient technologies that help to reduce emissions and, in June 2011, announced the signing of a purchase order for 20 aircraft from the Airbus A320neo family for delivery between 2017 and 2018, representing an investment at list price of US$1,700 million. This model uses more efficient engines and the new sharklet aerodynamic devices which together mean benefits that include up to a 15% saving on fuel, equivalent to an annual reduction of 3,600 tonnes of CO2 per aircraft.
LAN Airlines S.A. Consolidated Fleet
As of December 31, 2011 | Leased | Owned | Total | |||||||||
Passenger | 43 | 92 | 135 | |||||||||
Dash 8-200 | 10 | 0 | 10 | |||||||||
Dash 8-Q400 | 4 | 0 | 4 | |||||||||
Boeing 737-700 | 9 | 0 | 9 | |||||||||
Airbus A318-100 | 0 | 10 | 10 | |||||||||
Airbus A319-100 | 0 | 24 | 24 | |||||||||
Airbus A320-200 | 9 | 33 | 42 | |||||||||
Boeing 767-300 | 10 | 21 | 31 | |||||||||
Airbus A340-300 | 1 | 4 | 5 | |||||||||
Cargo | 6 | 8 | 14 | |||||||||
Boeing 777-200F | 2 | 0 | 2 | |||||||||
Boeing 767-300F | 4 | 8 | 12 | |||||||||
Total | 49 | 100 | 149 | |||||||||
| Annual Report 2011 » Our Company | | 15 |
Table of Contents
Dash 8-200 |10 Aircraft
| 22.25 mts. | Length
25.89 mts. | Width
37 | Seats
500 km/h. | Cruising speed
16,470 kg. | Maximum weight at take-off | |
Dash 8-Q400 |4 Aircraft
| 32.81 mts. | Length
28.4 mts. | Width
78 | Seats
667 km/h. | Cruising speed
29,260 kg. | Maximum weight at take-off | |
Boeing 737-700 |9 Aircraft
| 39.5 mts. | Length
35.7 mts. | Width
148 | Seats
828 km/h. | Cruising speed
70,000 kg. | Maximum weight at take-off | |
Airbus A318-100 |10 Aircraft
| 31.8 mts. | Length
34.1 mts. | Width
126 | Seats
850 km/h. | Cruising speed
63,000 kg. | Maximum weight at take-off | |

| Annual Report 2011 » Our Company | | 16 |
Table of Contents
Airbus A319-100 |24 Aircraft
| 33.8 mts. | Length
34.1 mts. | Width
144 | Seats
850 km/h. | Cruising speed
70,000 kg. | Maximum weight at take-off | |
 | ||
Airbus A320-200 |42 Aircraft
| 37.6 mts. | Length
34.1 mts. | Width
168 | Seats
928 km/h. | Cruising speed
77,000 kg. | Maximum weight at take-off | |
Boeing 767-300 |31 Aircraft
| 54.2 mts. | Length
47.6 mts. | Width
221-238 | Seats
869 km/h. | Cruising speed
184,611 kg. | Maximum weight at take-off | |
Airbus A340-300 |5 Aircraft
| 63.7 mts. | Length
60.3 mts. | Width
260 | Seats
976 km/h. | Cruising speed
275,000 kg. | Maximum weight at take-off | |
| Annual Report 2011 » Our Company | | 17 |
Table of Contents
Boeing 767-300 F| 12 Aircraft
| 54.2 mts. | Length
47.6 mts. | Width
438.1 m3 | Cargo Volume
869 km/h. | Cruising speed
186,880 kg. | Maximum weight at take-off | |
Boeing 777-200 F| 2 Aircraft
| 63.7 mts. | Length
64.8 mts. | Width
652.7 m3 | Cargo Volume
896 km/h. | Cruising speed
347,450 kg. | Maximum weight at take-off | |

| Annual Report 2011 » Our Company | | 18 |
Table of Contents
Corporate Governance
Directors
Senior Management
Corporate Governance Practices
Ownership Structure and Main Shareholders
Share Price
Table of Contents
Directors

Jorge Awad Mehech
Mr. Jorge Awad Mehech, RUT: 4.756.185-K, an economist and business administrator, has served as chairman and/ or member of the board of directors of LAN Airlines since March 1994. He was previously senior vice-president of Fast Air from 1979 to 1993. He is currently also a member of the board of Banco de Chile, president of the association of banks and financial institutions and ICARE business organization, and a professor of Management and Companies at the Economics School of the University of Chile.
Mr. Awad is member of the Directors Committee.

Darío Calderón González
Mr. Darío Calderón González, RUT: 5.078.327-8, a lawyer, has been a member of the board of directors of LAN Airlines since 1994. He has been a founding partner in Calderón y Cía., a Santiago law firm, since 1970 and currently serves on the boards of a number of other Chilean companies, including Integramédica S.A., Imprenta A. Molina Flores S.A., Enjoy S.A. and Nutrechile A.G.

José Cox Donoso
Mr. José Cox Donoso, RUT: 6.065.868-4, an economist and business administrator, has served as a member of the board of directors of LAN Airlines from April 1994 to June 1995 and since September 1995. He has also been chairman of the board of LAN Cargo since September 1995. In addition, he is a member of the boards of CMB-Prime AFI S.A. and Socovesa S.A.
| Annual Report 2011 » Corporate Governance | | 20 |
Table of Contents

Juan José Cueto Plaza
Mr. Juan José Cueto Plaza, RUT: 6.694.240-6, an economist and business administrator, has been a member of the board of directors of LAN Airlines since 1994. He currently serves as executive vice-president of Inversiones Costa Verde S.A., a position he has held since 1990, and is a member of the boards Consorcio Maderero S.A. and Minera Michilla S.A.

Juan Cueto Sierra
Mr. Juan Cueto Sierra, RUT: 3.246.727-K, a businessman, was one of the founders of Fast Air in 1978 and has been a member of the board of directors of LAN Airlines since 1998. He has vast experience in different business activities and is the father of Messrs. Juan José, Enrique and Ignacio Cueto Plaza, who are a director, chief executive officer and chief operating officer of LAN Airlines, respectively.

Ramón Eblen Kadis
Mr. Ramón Eblen Kadis, RUT: 4.346.062-5, an economist and business administrator, has been a member of the board of directors of LAN Airlines since June 1994. He has served as chairman of Comercial Los Lagos Ltda., Inversiones Santa Blanca S.A. and TJC Chile S.A. and is a member of the Eblen Group (a shareholder in LAN Airlines).
Mr. Eblen is member of the Directors Committee.
| Annual Report 2011 » Corporate Governance | | 21 |
Table of Contents

Bernardo Fontaine Talavera
Mr. Bernardo Fontaine Talavera, RUT: 6.371.763-0, an economist, has been a member of the board of directors of LAN Airlines since April 2005. He has served as head of the financial retail area of Falabella, one of Chile’s leading retailers, and as vice-chairman of the boards of CMR Falabella and Banco Falabella. He also headed the M&A Corporate Finance division of Citicorp-Citibank Chile and is currently a member of the boards of Deutsche Bank Chile, Metro S.A., Aquamont S.A., South-Am S.A. and Loginsa S.A. and is also general manager of Tres Mares S.A., Indigo S.A. and Sarlat S.A.

Carlos Heller Solari
Mr. Carlos Heller Solari, RUT: 8.717.000-4, an agricultural engineer, joined the board of directors of LAN Airlines in May 2010. He has great experience in the retail, transport and agricultural sectors. He currently serves as vice-chairman of Bethia (an investment company and owner of Axxion) and as chairman of Axxion S.A., Club Hípico de Santiago, Sotraser S.A. and Agrícola Ancali. In addition, he is a member of the boards of SACI Falabella S.A., Falabella Retail S.A., Sodimac S.A. and Titanium S.A. and is the main shareholder and vice-chairman of “Azul Azul” (administrator of the first-division Universidad de Chile football team).
| Annual Report 2011 » Corporate Governance | | 22 |
Table of Contents

Gerardo Jofré Miranda
Mr. Gerardo Jofré Miranda, RUT: 5.672.444-3, an economist and business administrator, joined the board of directors of LAN Airlines in May 2010. He is chairman of the board of Codelco and a member of the board of Air Life Chile S.A. as well as president of the Fundación Saber Más and a member of investment council of the Santander real estate funds. From 2005 to 2009, he was a member of the boards of Endesa Chile S.A., Viña San Pedro Tarapacá S.A., D&S S.A., Construmart S.A., Inmobiliaria Titanium S.A. and Inmobiliaria Parque del Sendero S.A. Between 2004 and 2005, he was insurance manager for the Americas at Grupo Santander in Spain. From 1989 to 2004, he was group vice-president and general manager of Grupo Santander in Chile and served as director and chairman of many of the Group’s companies.
Mr. Jofré is member of the Directors Committee.
Remuneration of Board
Board Members | Position | Director’s Renumeration (US$) | Director’s Committee Member’s Fee (US$) | |||||||
Jorge Awad Menech | Chairman | 30,416.40 | 16,646.16 | |||||||
Dario Calderón González | Director | 13,035.60 | ||||||||
Juan Cueto Sierra | Director | 13,035.60 | ||||||||
Ramon Eblen Kadis | Director | 13,035.60 | 16,646.16 | |||||||
Juan José Cueto Plaza | Director | 13,035.60 | ||||||||
José Cox Donoso | Director | 13,035.60 | ||||||||
Juan Gerardo Jofre Miranda | Director | 13,035.60 | 16,646.16 | |||||||
Bernardo Fontaine Talavera | Director | 13,035.60 | ||||||||
Carlos Heller Solari | Director | 13,035.60 | ||||||||
Note:
Totals may differ from the sum of individual amounts due to rounding.
The Directors remuneration corresponds to the payment of each session’s fee in which the Director participated.
The Board Meetings of subsidiaries are not subject to remuneration.
| Annual Report 2011 » Corporate Governance | | 23 |
Table of Contents
Senior Management
Enrique Cueto Plaza

Mr. Enrique Cueto Plaza is chief executive officer of LAN Airlines, a post he has held since 1994. From 1983 to 1993, Mr. Cueto served as chief executive officer of Fast Air, a Chilean cargo airline. With 22 years of experience in the industry, he has in-depth knowledge of both the commercial and operational management of passenger and cargo airlines. He is an active member of the governing boards of the oneworld® alliance and of the International Air Transport Association (IATA). He is also a member of the boards of the Chilean Manufacturers’ Association (SOFOFA) and the Endeavor foundation, an organization that promotes entrepreneurship in Chile.
Ignacio Cueto Plaza

Mr. Ignacio Cueto Plaza has been chief operating officer of LAN Airlines since 2005. He began his career in the aviation industry in 1985 in Fast Air. Between that year and 1993 he held various positions at Fast Air, including service manager and vice-president for sales and marketing. Between 1993 and 1995, he was general manager of Fast Air, and between 1995 and 1998 he was President of the LAN Cargo group. Furthermore, Mr. Cueto was a board member of Ladeco between 1994 and 1997 and of LAN Airlines between 1995 and 1997. In 1999, Ignacio Cueto became chief executive officer of the passenger business of LAN Airlines, a position he maintained until 2005 when he assumed his current role.
| Annual Report 2011 » Corporate Governance | | 24 |
Table of Contents

Alejandro de la Fuente Goic
Mr. Alejandro de la Fuente Goic has been chief financial officer of LAN Airlines since july 1995. He joined LAN Airlines in April 1995 after serving as finance manager at Chiquita Frupac Ltd., a subsidiary of Chiquita Brands Inc. Mr. De la Fuente is an agronomist, with an economy and agricultural economics master’s degree at the Catholic University and an MBA from Adolfo Ibáñez University.

Armando Valdivieso Montes
Mr. Armando Valdivieso Montes has been chief executive officer for passengers at LAN Airlines since 2006, after serving as chief executive officer for cargo from 1997 to 2005. From 1994 to 1997, he was chief operating officer of Fast Air and, from 1991 to 1994, served as Fast Air’s vice-president in the United States, based in Miami. Mr. Valdivieso is a civil engineer and holds an Executive MBA from Harvard University.

Cristian Ureta Larraín
Mr. Cristián Ureta Larraín is chief executive officer for cargo at LAN Airlines, a post he has held since 2005. He is an engineering graduate of the Catholic University in Santiago and of Stanford University’s Special Executive Program. Between 2002 and 2005, he served as vice-president for production at LAN Cargo and, from 1998 to 2002 as its vice-president for planning and development. He was previously general director and commercial director at MAS Air and service manager at Fast Air.
| Annual Report 2011 » Corporate Governance | | 25 |
Table of Contents

Roberto Alvo Milosawlewitsch
Mr. Roberto Alvo Milosawlewitsch is vice-president for strategic planning and development at LAN Airlines, a post he has held since 2008. Mr Alvo joined LAN Airlines in November 2001. Prior to his current position, he served as chief financial officer of LAN Argentina from 2005 to 2008, as manager of development and financial planning at LAN Airlines, and as deputy chief financial officer of LAN Airlines. Before 2001, Mr. Alvo held various positions at Sociedad Química y Minera de Chile S.A., a leading Chilean non-metallic mining company. He is a civil engineer and obtained an MBA from the IMD in Lausanne, Switzerland.

Cristián Toro Cañas
Mr. Cristián Toro Cañas has served as general counsel at LAN Airlines since January 2008. He holds a law degree from the Catholic University in Santiago (1993) and a master’s law degree (MCJ 97’) from New York University. Prior to joining LAN Airlines, Mr. Toro served as general counsel/legal director at Citibank Chile where he held various posts from 1997 until 2007. He also worked as an international trainee at Shearman & Sterling in New York (1999). Mr. Toro is a professor for the master’s degree in company law at the Los Andes University in Santiago.

Enrique Elsaca Hirmas
Mr. Enrique Elsaca Hirmas is vice- president for operations and service at LAN Airlines, a post he has held since October 2008, after serving as vice- president for strategic planning between 2004 and 2008. Mr. Elsaca holds a degree in industrial engineering from the Catholic University in Santiago and an MBA from the Massachusetts Institute of Technology. Prior to joining LAN Airlines, he served as real estate and development manager at Cencosud, Chile’s second largest retail group. From 1997 to 1999, he worked at Booz Allen & Hamilton in Latin America and, from 1991 to 1995, held various posts at Esso Chile, a subsidiary of Exxon.
Since January 2012 Enrique Elsaca Is CEO for Chile.
| Annual Report 2011 » Corporate Governance | | 26 |
Table of Contents

Emilio del Real Sota
Mr. Emilio del Real Sota has been vice-president for human resources at LAN Airlines since August 2005. He holds a psychology degree from the Gabriela Mistral University in Santiago. Between 2003 and 2005, he served as manager for human resources at D&S, a Chilean retail company. Between 1997 and 2003, he held various posts at Unilever, including human resource manager for Lever Chile as well as training and recruitment manager and executive development manager for Latin America.

Pablo Querol
Mr. Pablo Querol, vice-president for corporate affairs at LAN Airlines, holds a first degree in communications sciences from Argentina’s Business and Social Sciences University (UCES) and a postgraduate administration degree from Argentina’s IAE Business School. He joined LAN Airlines in December 2004 after almost ten years as editor of Argentina’s La Nación newspaper, a radio commentator and business consultant. From 2005 to early 2011, before being promoted to his current position, Mr. Querol played an active role in the launch and growth of LAN Argentina.
| Annual Report 2011 » Corporate Governance | | 27 |
Table of Contents
In 2011, LAN paid its executives total remunerations of US$90.6 million, plus a further US$20.1 million in incentives. Severance compensation totaled US$2.3 million.
Compensation Plan
The general characteristics of the Company’s Stock Option Compensation Plan are as follows:
In accordance with the decision of the Extraordinary Shareholders’ Meeting of 5 April 2007, a total of 2,209,091 shares are allocated to the Company’s Stock Option Compensation Plan.
Under modifications to the Compensation Plan, the last of which was introduced by Ordinary Board Meeting N° 358, the plan has the following characteristics: The options assigned to each employee accrue in stages on the following two occasions: (1) 30% as from 29 October 2010 and (2) 70% as from 30 October 2011, subject to the employee remaining with the Company. Employees may exercise these options totally or partially up to their expiry date of 31 March 2012. Employees may not make over the options to another person, lien or transfer them in any way and may only waive them. The price to be paid for the shares at the time of exercising the option will be equivalent to US$14.50 adjusted for the variation in the Consumer Price Index and payable in Chilean pesos according to the market exchange rate at the date the shares are subscribed and paid.
As of 31 December 2011, a total of 1,535,522 stock options corresponding to the current Compensation Plan had been subscribed.
| Annual Report 2011 » Corporate Governance | | 28 |
Table of Contents
Corporate Governance Practices

LAN’s corporate governance practices are subject to constant review in order to ensure that the Company’s internal self-regulation processes are totally aligned with the legislation in force and its own values.
LAN Airlines S.A. (“LAN”) is a listed company registered with the Superintendencia de Valores y Seguros (SVS), Chile’s stock market regulator, under Inscription N° 306. Its shares trade on the Santiago Stock Exchange, Chile’s Electronic Stock Exchange and the Valparaíso Stock Exchange as well as on the New York Stock Exchange as American Depositary Receipts (ADRs).
LAN’s corporate governance practices are regulated by Chile’s Securities Market Law (N° 18.045) and its Corporations Law (N° 18.046), including the latter’s associated norms, as well as other norms issued by the SVS. In addition, it is subject to US legislation and regulation and norms issued by the Securities and Exchange Commission (SEC) as they apply to ADRs.
Its corporate governance practices are subject to constant review in order to ensure that the Company’s internal self-regulation processes are totally aligned with the legislation in force and its own values. LAN’s decisions and commercial activities are underpinned by the ethical principles established in the company’s Code of Conduct.
Structure
As of 31 December 2011, LAN had a total of 1,682 registered shareholders. The Company is controlled by the Cueto Group, represented by Costa Verde Aeronáutica S.A., Inversiones Nueva Costa Verde Aeronáutica Ltda. and Inversiones Mineras del Cantábrico S.A. As of 31 December 2011, they together held a 33.9% stake while the remainder corresponded to different institutional investors, companies and individuals and 3.1% of the Company was held in the form of ADRs.
The main bodies responsible for LAN’s corporate governance are its Board of Directors and the Directors and Audit Committee whose principal functions are set out below.
| Annual Report 2011 » Corporate Governance | | 29 |
Table of Contents
Board of Directors
LAN’s Board of Directors has nine members and is the body responsible for analyzing and defining the Company’s strategic vision, thereby playing a fundamental role in its corporate governance. All the Board seats come up for election every two years and, under LAN’s bylaws, directors are elected according to the total number of votes they receive. Each shareholder has one vote per share and can use all his or her votes to support one candidate or divide them among any number of candidates. This arrangement currently ensures that a shareholder with more than a 10% stake can elect at least one director. The present Board of Directors was elected by the Ordinary Shareholders’ Meeting which took place on 29 April 2010.
The Board holds ordinary monthly meetings and extraordinary meetings whenever the Company’s affairs so require. Directors’ fees must be approved by vote at the Ordinary Shareholders’ Meeting. The Directors Committee usually meets monthly and its functions and powers are those established by law and the corresponding regulation.
Directors Committee
Under Chilean law, listed companies must appoint at least one independent director who is also a member of the Directors Committee when they have a market capitalization of at least 1,500,000 unidades de fomento (an inflation-indexed currency unit) and at least 12.5% of the voting shares are held by shareholders who individually control or possess less than 10% of these shares. Three of the nine Board members form a Directors Committee, which fulfills both the functions required under Chile’s Corporations Law and those of the Audit Committee required under the Sarbanes-Oxley Act of the United States and the corresponding SEC norms. The Directors and Audit Committee has the functions established in Article 50 bis of Chile’s Corporations Law (N° 18.046) and the other applicable regulation. These include:
| • | examining the reports of LAN’s external auditors, general balance sheets and other financial statements that LAN’s administration provides to shareholders and for expressing an opinion about these reports prior to their presentation for approval by shareholders; |
| • | presenting the Board with proposals as to the external auditors and risk rating agencies to be used; |
| • | examining internal control reports and any related complaints; |
| • | examining and reporting on all matters regarding related-party transactions; and, |
| • | examining the pay scale of the Company’s senior management. |
The requirements for directors’ independence are set out in Chile’s Corporations Law and its subsequent modifications under Law N° 19.705 on the relationship between directors and a company’s controlling shareholders. A director is considered independent when he or she does not, in general, have ties, interests or economic, professional, credit or commercial dependence of a significant nature or size with or on the company, the other companies in the group of which it forms part, its controller or senior management or a family relationship with the latter nor any of the other types of ties specified in Chile’s Corporations Law (N° 18.046),
Under US regulation, it is necessary to have an Audit Committee, comprising at least three Board members, that fulfills the independence requirements established under Rule 10A-3 of the Exchange Act. Given the similarity of the functions of the Directors Committee and the Audit Committee, LAN’s Directors Committee acts as an Audit Committee under Rule 10A-3 of the Exchange Act.
As of 31 December 2011, all the members of the Directors Committee, who also act as part of the Audit Committee, were independent directors as defined under Rule 10A-3 of the Exchange Act. At that date, its members were Messrs. Jorge Awad Mehech, Gerardo Jofré Miranda and Ramón Eblen Kadis (chairman of the Committee).
| Annual Report 2011 » Corporate Governance | | 30 |
Table of Contents
In accordance with Article 50 bis of Law N° 18.046, the matters examined by the Directors Committee during 2011 are set out below:
1 Ordinary Session N° 109 25/1/11:
| • | Related-party transaction |
| • | Review of Financial Statements at 31 December 2010 |
| • | Internal control letter of external auditors PricewaterhouseCoopers |
| • | Letters about fees received from external auditors |
2 Ordinary Session N° 110 01/3/11:
| • | Review of Financial Statements at 31 December 2010 |
| • | Credit risk management |
3 Ordinary Session N° 111 29/3/11:
| • | Related-party transaction |
| • | Annual report of activities of Directors Committee |
| • | Proposal for external auditors and private risk rating agencies for 2011 |
| • | Close of Internal Audit Plan 2010 and Plan 2011 |
| • | Letter about fees received from external auditors |
4 Ordinary Session N° 112 26/4/11:
| • | Review of Financial Statements at 31 March 2011 |
| • | Approval of fees of PricewaterhouseCoopers |
| • | Related-party transaction |
| • | MRO Project (implementation of MXI Maintenance System) |
| • | Close of Internal Audit Plan 2010 and Plan 2011 |
5 Ordinary Session N° 113 28/6/11:
| • | External Audit Plan and LAN accounting policies (PWC) |
| • | Approval of fees of PricewaterhouseCoopers |
6 Ordinary Session N° 114 26/7/11:
| • | Review of Financial Statements at 30 June 2011 |
| • | Related-party transaction |
7 Extraordinary Session N° 9 08/8/11:
| • | Review of Financial Statements at 30 June 2011 |
8 Ordinary Session N° 115 30/8/11:
| • | Status of security risk |
| • | Close of Internal Audit Plan 2010 and Plan 2011 |
9 Ordinary Session N° 116 26/9/11:
| • | Close of Internal Audit Plan 2010 and Plan 2011 |
10 Extraordinary Session N° 10 24/10/11:
| • | Internal Audit Methodology and progress on Work Plan 2011 |
11 Ordinary Session N° 117 25/10/11
| • | Review of Financial Statements at 30 September 2011 |
| • | Operational situation of Revenue Accounting area |
| • | Modification of compensation plan for workers of Company and subsidiaries |
| • | Approval of fees of PricewaterhouseCoopers |
12 4Extraordinary Session N° 11 10/11/11
| • | LATAM transaction: Accounting matters |
| • | LATAM transaction: Financial matters |
13 Extraordinary Session N° 12 11/11/11
| • | Review of Financial Statements at 30 September 2011 |
| • | Fees of PricewaterhouseCoopers |
14 Ordinary Session N° 118 29/11/11
| • | Internal control of derivatives |
| • | Letter received from external auditors PricewaterhouseCoopers |
| • | Progress on Audit Plan 2011 |
15 Ordinary Session N° 119 20/12/11
| • | System of remuneration and compensation plan for LAN executives |
| • | Code of conduct |
| • | Progress on Audit Plan 2011. |
| Annual Report 2011 » Corporate Governance | | 31 |
Table of Contents
Related-party transactions
Under Chile’s Corporations Law, the operations of a listed company with a “related” party must take place in market conditions and comply with certain authorization and disclosure requirements that are different from those applying to a non-listed company. This applies to listed companies and all their subsidiaries.
LAN has carried out different transactions with its subsidiaries, including the entities owned or controlled by some of its majority shareholders. In the normal course of the Company’s business, different types of services have been provided to or received from related companies, including the rental and exchange of aircraft and cargo transport and booking services.
LAN’s policy is not to carry out transactions with or for the benefit of any shareholder or Board member or with any entity controlled by these persons or in which they have a significant economic interest, except when the transaction is related to the Company and the price and other terms are at least as favorable as those which could be obtained from a third party under equal conditions. These transactions, none of which is individually material, are summarized in the audited consolidated financial statements for the year ending on 31 December 2011.
Principles of good corporate governance
LAN’s good corporate governance is the result of the interaction of different individuals and stakeholders. Although all our employees share responsibility for compliance with the high standards of ethics and adherence to regulation established by the Board of Directors, it is the Board, the Directors Committee and senior management who are primarily responsible for the Company’s good corporate governance. In line with the above, LAN is committed to transparency and compliance with the ethical and regulatory standards established for this purpose by the Board of Directors.
| Annual Report 2011 » Corporate Governance | | 32 |
Table of Contents
Pillars of LAN’s corporate governance
Notwithstanding the responsibilities of the Company’s Board of Directors and its Directors Committee, LAN’s management has also taken a number of measures to ensure due corporate governance. These include principally:
1 LAN Code of Conduct. This seeks to ensure that all the Company’s employees adhere to the highest standards of ethics, transparency and compliance with regulation as required by LAN in accordance with its core values of safety, achievement, efficiency and cordiality. Key aspects of the LAN Code of Conduct include:
| • | LAN Code of Conduct Administration Committee. This is formed by the Vice-President for Human Resources, the General Counsel and the Manager for Labor Relations. |
| • | Ethics Line. This online service provides LAN’s employees with a direct and private channel through which to report any concerns in the knowledge that these will be properly processed or investigated without risk of reprisal. |
| • | Regulation of conflicts of interest. The Code of Conduct establishes precise norms for relations with suppliers. |
| • | Probity and confidentiality criteria. These apply particularly to the use of LAN’s goods and benefits, accuracy in the Company’s accounting and financial records and protection of confidential information to which employees have access in the course of their work. |
| • | Compliance with regulation of insider trading, free competition and protection of intellectual property. |
| • | Non-discrimination in the workplace. |
| • | Respectful and cordial relations with our clients and passengers. |
2 Code of Ethics for Senior Financial Executives. This Code of Ethics is designed to foster honest and ethical conduct in the disclosure of financial information, compliance with regulation and avoidance of conflicts of interest.
3 Manual for Management of Market-Sensitive Information. This is required by the SVS and, since Law N° 20.382 on Corporate Governance came into force, also by Chilean securities market legislation. LAN, however, seeks to go further than these norms and regulates the criteria for disclosure of operations, periods of voluntary abstinence from the purchase and sale of the Company’s shares, mechanisms for continuous disclosure of market-sensitive information and mechanisms for the protection of confidential information by the Company’s employees and executives.
4 Program of Regulatory Compliance. Under this program, the Company’s General Counsel, in coordination with and under the supervision of the Board of Directors and its Directors Committee, supervises compliance with the laws and regulation applicable to LAN’s business and activities in the different countries in which it operates.
| Annual Report 2011 » Corporate Governance | | 33 |
Table of Contents
Ownership Structure and Main Shareholders
LAN’S OWNERSHIP (31 December 2011)
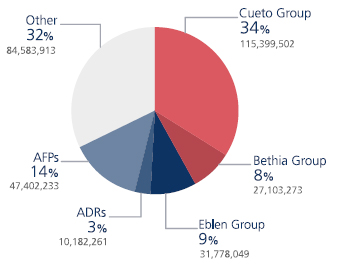
Main Shareholders 2011 | Shares | % of Total | ||||||
COSTA VERDE AERONAUTICA SA | 90,575,407 | 26.61 | % | |||||
INV ANDES S A | 22,288,695 | 6.55 | % | |||||
INVERSIONES NUEVA COSTA VERDE AERONAUTICA LTDA | 17,745,000 | 5.21 | % | |||||
AXXION S A | 13,551,637 | 3.98 | % | |||||
AXXDOS S A | 13,551,636 | 3.98 | % | |||||
LARRAIN VIAL S A CORREDORA DE BOLSA | 12,216,292 | 3.59 | % | |||||
BANCHILE C DE B S A | 11,368,599 | 3.34 | % | |||||
J P MORGAN CHASE BANK | 10,182,261 | 2.99 | % | |||||
INV MINERAS DEL CANTABRICO S A | 7,079,095 | 2.08 | % | |||||
BANCO DE CHILE POR CUENTA DE TERCEROS NO RESIDENTES | 6,664,072 | 1.96 | % | |||||
AFP PROVIDA S A PARA FDO PENSION C | 5,841,605 | 1.72 | % | |||||
CELFIN CAPITAL S A C DE B | 5,655,869 | 1.66 | % | |||||
| Annual Report 2011 » Corporate Governance | | 34 |
Table of Contents
LAN’S OWNERSHIP (31 December 2010)
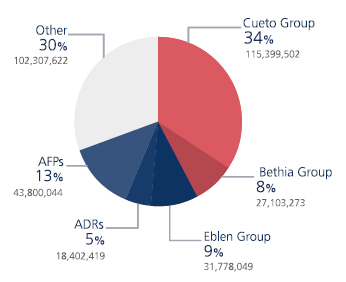
Main Shareholders 2010 | Shares | % of Total | ||||||
COSTA VERDE AERONAUTICA SA | 108,320,407 | 31.97 | % | |||||
AXXION S A | 27,103,273 | 8.00 | % | |||||
INV ANDES S A | 22,288,695 | 6.58 | % | |||||
THE BANK OF NEW YORK MELLON, ADRS | 18,402,419 | 5.43 | % | |||||
BANCO DE CHILE POR CUENTA DE TERCEROS CA | 9,474,049 | 2.80 | % | |||||
LARRAIN VIAL S A CORREDORA DE BOLSA | 9,018,191 | 2.66 | % | |||||
BANCHILE C DE B S A | 8,071,841 | 2.38 | % | |||||
INV MINERAS DEL CANTABRICO S A | 7,079,095 | 2.09 | % | |||||
BANCO ITAU POR CUENTA DE INVERSIONISTAS | 6,346,218 | 1.87 | % | |||||
AFP PROVIDA S A FONDO TIPO A | 5,149,384 | 1.52 | % | |||||
AFP PROVIDA S A PARA FDO PENSION C | 4,818,389 | 1.42 | % | |||||
CELFIN CAPITAL S A C DE B | 4,777,492 | 1.41 | % | |||||
| Annual Report 2011 » Corporate Governance | | 35 |
Table of Contents
Dividends
The Company’s policy is to pay the minimum dividends required by law or, in other words, 30% of profits calculated in accordance with the regulation in force. This does not, however, imply that dividends above this obligatory minimum level cannot be distributed depending on the particular events and circumstances that may arise during the year.
The table below shows the dividends per share paid during the past three years. Those corresponding to 2009 and 2010 represent 50% of the distributable profits of the respective year while the provisional dividends corresponding to 2011 are equivalent to 44.2% of the year’s distributable profits.
Year of profits against which | Payment date | Type | Total dividend paid (US$) | Number of shares | Dividend per shares (US$) | Dividend per ADR (US$) | ||||||||||||||
2009 | 20 August 2009 21 January 2010 14 May 2010 | Provisional Provisional Definitive | | 34,621,043 70,000,978 | | | 338,790,909 338,790,909 | | | 0.10219 0.20662 | | | 0.10219 0.20662 | | ||||||
2010 | 13 August 2010 13 January 2011 19 May 2011 | Provisional Provisional Definitive |
| 74,466,242 125,000,294 10,386,295 |
|
| 338,790,909 338,790,909 339,310,909 |
|
| 0.21980 0.36896 0.03061 |
|
| 0.21980 0.36896 |
| ||||||
2011 | 15 September 2011 12 January 2012 | Provisional Provisional |
| 56,590,766 85,000,207 |
|
| 339,334,209 340,164,105 |
|
| 0.16677 0.24988 |
|
| 0.16677 0.24988 |
| ||||||
In accordance with International Financial Reporting Standards, distributable profits in 2009, 2010 and 2011 for the payment of dividends corresponded to the net annual income attributable to holders of a stake in the controller’s net assets while, in previous years, they corresponded to the net income reported in accordance with Chile’s generally accepted accounting principles.
| Annual Report 2011 » Corporate Governance | | 36 |
Table of Contents
Share Price
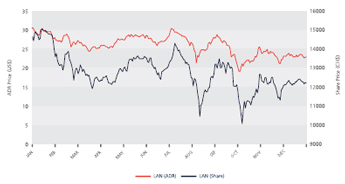
SHARE AND ADR PRICE 2011
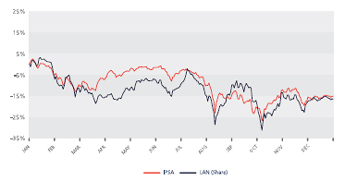
CUMULATIVE SHARE PRICE PERFORMANCE 2011
Stock Market Activity
In 2011, LAN’s share price showed a loss of 16.6% while its ADR price dropped by 24.5%. As of 31 December 2011, the Company had a market capitalization of US$7,920 million.
The loss on LAN’s shares in 2011 was 1.4 percentage points more than that on Chile’s IPSA share price index, which showed an annual loss of 15.2%.
| Annual Report 2011 » Corporate Governance | | 37 |
Table of Contents
| N° of shares traded | Average price (CH$) | Total amount (CH$) | ||||||||||
2009 | ||||||||||||
First Quarter | 31,333,712 | 5,030 | 157,934,911,429 | |||||||||
Second Quarter | 32,053,214 | 5,942 | 190,474,096,845 | |||||||||
Third Quarter | 27,537,200 | 6,763 | 186,403,260,956 | |||||||||
Fourth Quarter | 27,194,815 | 7,701 | 209,561,025,666 | |||||||||
2010 | ||||||||||||
First Quarter | 78,527,652 | 9,321 | 731,977,564,550 | |||||||||
Second Quarter | 28,989,000 | 10,281 | 298,041,173,402 | |||||||||
Third Quarter | 68,123,784 | 14,292 | 973,595,650,579 | |||||||||
Fourth Quarter | 34,761,835 | 14,632 | 508,645,049,034 | |||||||||
2011 | ||||||||||||
First Quarter | 47,347,742 | 12,303 | 582,539,984,463 | |||||||||
Second Quarter | 58,475,637 | 13,371 | 781,904,524,169 | |||||||||
Third Quarter | 76,581,903 | 11,067 | 847,556,602,848 | |||||||||
Fourth Quarter | 50,436,418 | 12,210 | 615,817,532,463 | |||||||||
| Annual Report 2011 » Corporate Governance | | 38 |
Table of Contents
| N° of ADRs traded | Average price (US$) | Total amount (US$) | ||||||||||
2009 | ||||||||||||
First Quarter | 27,389,940 | 8.33 | 228,252,094 | |||||||||
Second Quarter | 21,409,999 | 10.58 | 231,758,152 | |||||||||
Third Quarter | 19,202,497 | 12.32 | 236,966,212 | |||||||||
Fourth Quarter | 21,575,709 | 14.91 | 318,613,407 | |||||||||
2010 | ||||||||||||
First Quarter | 23,040,927 | 17.72 | 408,225,320 | |||||||||
Second Quarter | 23,101,571 | 18.74 | 432,817,173 | |||||||||
Third Quarter | 44,356,223 | 29.45 | 1,306,224,233 | |||||||||
Fourth Quarter | 21,982,883 | 30.70 | 674,964,638 | |||||||||
2011 | ||||||||||||
First Quarter | 31,175,948 | 25.65 | 799,544,598 | |||||||||
Second Quarter | 20,585,237 | 28.50 | 586,730,718 | |||||||||
Third Quarter | 31,053,167 | 21.04 | 653,274,790 | |||||||||
Fourth Quarter | 24,414,359 | 23.27 | 568,234,440 | |||||||||
| Annual Report 2011 » Corporate Governance | | 39 |
Table of Contents
Our People
Table of Contents
 | The development of our people is a priority for the Company as it seeks to meet the growth and sustainability goals it has established for the future. |
STAFFING LEVELS

The history of LAN’s achievements, during which we have realized dreams that initially seemed unattainable, was possible thanks to the work and commitment of our people.
One of LAN’s strategic pillars for achieving its vision of becoming one of the world’s ten best airlines is to be a High Performance Organization. That is why the development of its people is a priority for the Company as it seeks to meet the growth and sustainability goals it has established for the future.
In 2011, 4,424 people joined the Company, giving it a total of 21,838 employees of 56 nationalities in the 21 countries where LAN has its own personnel. These new hirings were required by the growth of its operations during the year and to cover the holding’s natural turnover.
| Annual Report 2011 » Our People | | 41 |
Table of Contents
EMPLOYEES BY COUNTRY OF ORIGIN
In line with LAN’s declaration that fostering the professional development of its people is one of its priorities, 18,687 employees with a permanent contract, equivalent to 86% of the workforce, received a total of 704,128 hours of training at the Company’s Corporate Academy in 2011. In addition, 89 training and specialization scholarships were awarded for four types of study: Completion of Schooling, Technical and University Studies, Diplomas and Master’s Degrees. In accordance with the above and as a way of recognizing the work and professionalism of our people, 4,264 employees were promoted internally (one in five people) in the different countries where LAN has operations.
In the case of labor relations, the Company once again successfully completed important collective bargaining processes, renewing agreements for LAN Express Maintenance, LAN Airlines Cabin Crews and Andes Operators.
Work climate
An important milestone in 2011 was the implementation for the first time at the Company level of the Great Place to Work (GPTW) survey.
LAN has measured its work climate since 2002, using a high-quality methodology that is, indeed, comparable to that used by GPTW. However, it decided to adopt this latter survey since its use by different organizations around the world permits comparison with the best companies in which to work.
The results of this first survey in LAN were extremely positive in that it obtained 69% of positive replies, achieving the goal the Company had set for the year. Although it still has some way to go before being among the companies with the best work climate, this result indicates that it is on the right road to achieve its ambitious target of 85% of positive replies by 2015.
| Annual Report 2011 » Our People | | 42 |
Table of Contents
Culture of Service
In 2011, LAN continued to develop the Culture of Service project launched in 2010 in order to take a new step in the Company’s qualitative relationship with its customers, building an emotional bond with them as an airline that they regard with both admiration and affection.
During its first year, the project focused on launching and positioning LAN’s Service Message - “We are people caring for people” - and its five service keys throughout the company, particularly among teams that work in direct contact with customers.
In 2011, the project went on to emphasize the importance of the internal client for the proper working of the service chain, drawing attention to the ways in which the actions of support teams in areas working directly with customers can have a positive impact on the Company’s passengers.
Recognition of our people
One of the keys to ensuring that more people feel the enjoyment of working at LAN is to make recognition a natural and constant feature of the Company’s internal culture.
In 2011, a new version was, therefore, launched of the Service Leaders ceremony, the most important event in which prizes are awarded to the best representatives of the excellent service that LAN seeks to provide for its customers on a daily basis. The different areas of the Company that work directly with customers, such as Contact Center, Sales Offices, Airport, Cabin Crew, Cockpit Crews and Customer Service, choose their best representatives to attend this ceremony where they are recognized by the Company’s highest authorities and, finally, the Service Stars - or, in other words, the best of the best as regards customer service - are selected.
Similarly, LAN also makes a point of recognizing the commitment of those people who have dedicated more than a quarter of a century’s effort and work to the Company. Each year, a Track Record ceremony takes place at which those who have completed 25, 35, 40, 45, 50 and 55 years with LAN are thanked and receive an award in a solemn event, also attended by the Company’s highest authorities.
Taking advantage of the constant growth and renewal of LAN’s fleet, which has converted it into one of the most modern in the world, the Company has also implemented the Yo me traje un Airbus (I brought back an Airbus) activity as a further way of recognizing its people. This corporate program seeks to reward those employees who have shown excellent performance in their work and/or a high potential for professional development within LAN.
In broad terms, this activity allows those selected to fly to the Airbus factory in Hamburg to bring back one of the new A319s and A320s. During the trip, which lasts approximately six days, they are able to visit the city, attend the dinner at which the aircraft is delivered, fly back in it and, on landing, be received with the traditional arch of water.
A transversal goal across all the Company is for its people to say, “I love working at LAN”. That is why the set of measures related to professional development and improvements in its work climate seek to achieve greater general satisfaction among those who make up the Company’s human team which is, in turn, what will allow us to become a High Performance Organization.
| Annual Report 2011 » Our People | | 43 |
Table of Contents
2011 Results
Industry Overview
Financial Results
Awards and Recognitions
Financial Policies
Risk Factors
Material News
Additional Information
Table of Contents
Industry Overview
| In recent years, the industry’s growth has been driven by the emerging regions of the world - Asia Pacific, Latin America and the Middle East. |
The airline industry’s complexity is a result of its high level of exposure to exogenous factors such as macroeconomic conditions, the price of fuel and climatic and political events.
In this context, the main players have, in recent years, increasingly looked to alliances and association agreements as a source of efficiency gains and operational, commercial and financial synergies.
In 2011, the global airline industry was impacted by a number of events. As well as the sharp increase in the price of oil - particularly in the early part of the year - in response to geopolitical conflicts in the Middle East, there was the earthquake and subsequent tsunami in Japan and the euro zone’s severe economic crisis.
Global passenger traffic, nonetheless, increased by 5.9%, led by Latin America where it expanded by 11.3%. Similarly, in the domestic markets of emerging economies such as Brazil, India and China, it showed double-digit growth.
International air cargo traffic, however, contracted by 0.7% in 2011, reflecting principally its close correlation with economic activity. In the Asia Pacific region, the world’s largest air cargo market and the center of manufacturing activity, the contraction reached 4.6%. This drop was, however, offset by the important growth seen in Latin America and the Middle East.
In all, IATA estimates that the industry recorded profits of US$7.9 billion in 2011. This demonstrates that airlines adapted successfully to changing conditions, allowing them to be profitable despite the economic deceleration and the sustained increase in fuel prices.
It is also important to note that, in recent years, the industry’s growth has been driven by the emerging regions of the world - Asia Pacific, Latin America and the Middle East. This trend is, moreover, expected to become more pronounced in future, considering the low penetration of air transport in these markets and their rapid economic development.
| Annual Report 2011 » 2011 Results | | 45 |
Table of Contents
Financial Results
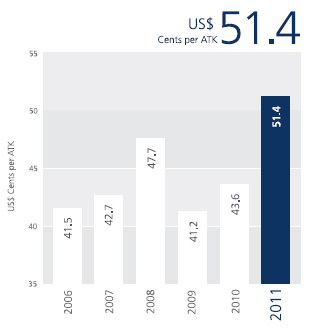
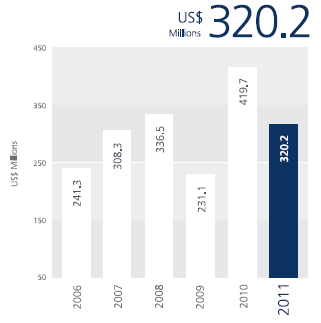
 | In 2011, results were driven by solid demand, strong yields and high load factors in both its passenger and cargo businesses. |
TOTAL REVENUES
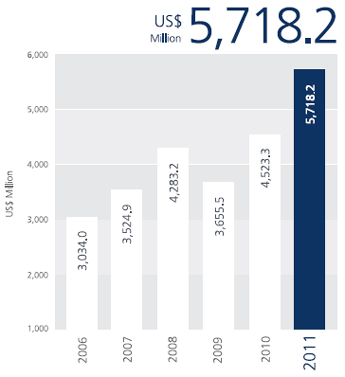
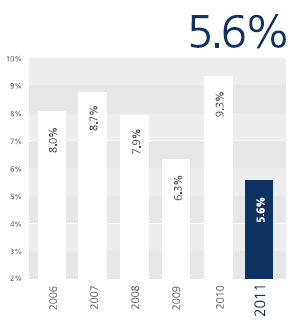
LAN reported net earnings of US$320.2 million in 2011 when its results were driven by solid demand, strong yields and high load factors in both its passenger and cargo businesses. However, its net earnings represented a 23.7% drop from US$419.7 million in 2010, due principally to the restructuring of the Company’s operation in Colombia and the cloud of volcanic ash produced by the eruption of the Puyehue Volcanic Complex (Cordón Caulle) in southern Chile, which disrupted air traffic throughout the region, as well as to the impact of higher fuel prices which was not totally offset by fuel surcharge mechanisms.
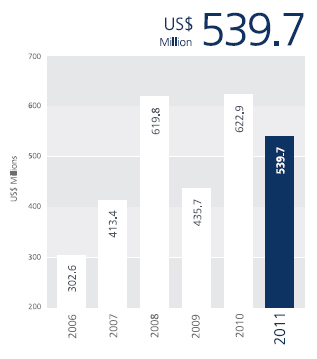
In 2011, the Company’s revenues showed an important increase, with passenger sales rising by 28.9% to US$4,008.9 million and cargo sales by 23.1% to US$1,576.5 million. In all, operating revenues reached US$5,718.2 million, up by 26.4% on the previous year, giving a net operating income of US$539.7 million, down by 13.4% on 2010.
| Annual Report 2011 » 2011 Results | | 46 |
Table of Contents
OPERATING INCOME
OPERATING MARGIN
The 28.9% increase in passenger revenues reflected a 15.9% increase in traffic combined with an 11.2% increase in yields. The Company’s load factor rose from 78.3% to 79.8% since the increase in its capacity, at 13.7%, was less than that in traffic. The growth of both capacity and traffic in 2011 reflected the incorporation of LAN Colombia’s domestic and international operations which was partly offset by the disruption of air traffic around the region caused by the volcanic eruption in the south of Chile. Revenues per ASK rose by 13.4%. The yield increased, due principally to higher fuel surcharges.
Higher traffic was the result of a 23.7% increase in domestic traffic (including the domestic operations of LAN and its subsidiaries in Chile, Argentina, Peru, Ecuador and Colombia) and of a 12.6% increase in international traffic, which accounted for 68.1% of total traffic in 2011. The growth of capacity occurred principally on domestic routes in Chile, regional routes within South America and long-haul routes to the United States. This expansion was partly offset by a drop in capacity on long-haul routes to Europe following itinerary changes implemented in 2011, including principally the elimination of the Madrid-Paris route in July 2011.
| Annual Report 2011 » 2011 Results | | 47 |
Table of Contents
NET MARGIN
UNIT REVENUES
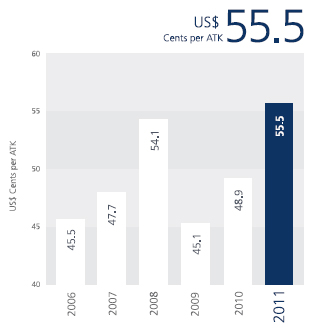
The 23.1% increase in cargo revenues in 2011 was the result of an 11.5% increase in traffic combined with a 10.4% increase in yields, reflecting the sustained growth of cargo demand in Latin America and higher fuel surcharges as well as better revenue management practices and the optimization of itineraries. Capacity rose by 12.4% in 2011 and, as a result, the load factor dropped by half a percentage point to 69.6%. Revenues per ATK were 9.5% up on 2010.
The Company has continued to increase its capacity selectively in response to demand in the main markets in which it operates. Imports into Latin America continued to grow but the weakness of cargo markets internationally has meant increased competition on routes to Latin America and, particularly, Brazil. Export volumes have shown a recovery, due partly to the recovery of salmon exports from Chile. The increase in capacity corresponds principally to the three Boeing 767-300F cargo planes received between November 2010 and January 2011 to serve routes from Latin America to North America and Europe. In addition, the Company continues to optimize the cargo capacity of the belly of its passenger aircraft, maximizing the synergies offered by the integration of the operations of the two businesses.
| Annual Report 2011 » 2011 Results | | 48 |
Table of Contents
UNIT COSTS
NET INCOME
LAN also continues to progress in restructuring its operation in Colombia. In December 2011, it launched LAN in Colombia, an important step in the successful restructuring process implemented during the year. In 2011, LAN reported an operating loss on its passenger operations in Colombia. This includes important costs related to the change of brand, the migration of LAN Colombia to LAN’s computing systems, marketing campaigns designed to integrate Colombia into LAN’s regional network and extraordinary maintenance costs.
Operating costs increased by 32.8% in 2011 while costs per unit (ATK) rose by 18.0% as compared to 2010. Higher fuel prices in 2011 meant that fuel costs rose by US$454.7 million, considering current consumption levels. Unit costs excluding fuel also rose by 11.1%, due principally to the general appreciation of local currencies in 2011 and higher wage costs as well as higher expenditures relating to the restructuring of operations in Colombia.
In all, LAN maintained its solid financial position and good balance sheet indicators in 2011. This is reflected in its BBB investment-grade risk rating, a status which it is one of the few airlines to have retained.
| Annual Report 2011 » 2011 Results | | 49 |
Table of Contents
REVENUE BREAKDOWN
REVENUE BREAKDOWN BY COUNTRY
| Annual Report 2011 » 2011 Results | | 50 |
Table of Contents
Financial Summary
US$ Million
As of December 31, 2011 | 2007 | 2008 | 2009 | 2010 | 2011 | |||||||||||||||
Passenger revenues | 2,197.2 | 2,820.8 | 2,623.6 | 3,109.8 | 4,008.9 | |||||||||||||||
Cargo revenues | 1,154.3 | 1,319.4 | 895.6 | 1,280.7 | 1,576.5 | |||||||||||||||
Other revenues | 173.4 | 142.9 | 136.4 | 132.8 | 132.8 | |||||||||||||||
Total revenues | 3,524.9 | 4,283.2 | 3,655.5 | 4,523.3 | 5,718.2 | |||||||||||||||
|
|
|
|
|
|
|
|
|
| |||||||||||
EBITDAR *1 | 726.1 | 877.4 | 823.3 | 1,063.2 | 1,118.6 | |||||||||||||||
EBITDA *2 | 567.2 | 947.9 | 739.6 | 964.6 | 944.4 | |||||||||||||||
Operating income | 413.4 | 619.8 | 435.7 | 622.9 | 539.7 | |||||||||||||||
Net income | 308.3 | 336.5 | 231.1 | 419.7 | 320.2 | |||||||||||||||
Net income per common share | 0.91 | 0.99 | 0.68 | 1.2 | 0.94 | |||||||||||||||
|
|
|
|
|
|
|
|
|
| |||||||||||
Total assets | 3,901.7 | 5,196.9 | 5,772.0 | 6,785.9 | 7,648,659 | |||||||||||||||
Total liabilities | 2,913.6 | 4,428.3 | 4,666.0 | 5,485.8 | 6,191,287 | |||||||||||||||
Minority interest | 5.2 | 6.8 | 7.1 | |||||||||||||||||
Total shareholder’s equity | 988.1 | 768.6 | 1,105.9 | 1,300.1 | 1,457.4 | |||||||||||||||
Total liabilities and shareholders equity | 3,901.7 | 5,196.9 | 5,772.0 | 6,785.9 | 7,648,659 | |||||||||||||||
|
|
|
|
|
|
|
|
|
| |||||||||||
Note:
| *1 | Earnings before interest, taxes, depreciation, amortization and aircraft rentals. |
| *2 | Earnings before interest, taxes, depreciation and amortization. |
Note: 2008, 2009, 2010 y 2011 under International Financial Reporting Standards, previous years under Generally Accepted Accounting Principles in Chile.
| Annual Report 2011 » 2011 Results | | 51 |
Table of Contents
Operating Statistics
As of December 31, 2011 | 2007 | 2008 | 2009 | 2010 | 2011 | |||||||||||||||
System | ||||||||||||||||||||
ATKs (millions) | 7,023.1 | 7,652.2 | 7,811.4 | 8,970.1 | 10,056.2 | |||||||||||||||
RTKs (millions) | 4,862.4 | 5,332.3 | 5,308.0 | 6,222.1 | 7,075.3 | |||||||||||||||
System load factor | 69.2 | % | 69.7 | % | 68.0 | % | 69.4 | % | 70.4 | % | ||||||||||
Break-even load factor | 61.90 | % | 61.05 | % | 62.14 | % | 61.74 | % | 65.2 | % | ||||||||||
Yield (based on RTKs - US¢) | 68.93 | 77.64 | 66.30 | 70.56 | 78.9 | |||||||||||||||
Operating revenue per ATK (US¢) *3 | 47.72 | 54.11 | 45.05 | 48.95 | 55.53 | |||||||||||||||
Operating cost per ATK (US¢) *4 | 42.66 | 47.40 | 41.20 | 43.57 | 51.42 | |||||||||||||||
Average fuel price (USD/gallon) | 2.29 | 3.12 | 2.12 | 2.32 | 3.18 | |||||||||||||||
Number of aircraft | 83 | 90 | 96 | 131 | 149 | |||||||||||||||
Passenger | ||||||||||||||||||||
Passengers boarded (thousands) | 11,091.3 | 13,239.9 | 15,404.3 | 17,293.2 | 22,591.2 | |||||||||||||||
ASKs (millions) | 31,556.1 | 35,176.2 | 38,777.1 | 42,355.2 | 48,154.3 | |||||||||||||||
RPKs (millions) | 24,001.2 | 26,951.6 | 29,830.1 | 33,147.5 | 38,423.5 | |||||||||||||||
Passenger load factor (based on ASKs) | 76.1 | % | 76.6 | % | 76.9 | % | 78.3 | % | 79.8 | % | ||||||||||
Yield (based on RPKs - US¢) | 9.15 | 10.47 | 8.80 | 9.38 | 10.4 | |||||||||||||||
Revenue per ASK (US¢) | 6.96 | 8.02 | 6.77 | 7.34 | 8.3 | |||||||||||||||
Cargo | ||||||||||||||||||||
Tons carried (thousands) | 604.3 | 661.4 | 649.2 | 779.5 | 875.9 | |||||||||||||||
ATKs (millions) | 3,632.8 | 4,080.3 | 3,835.0 | 4,620.2 | 5,192.7 | |||||||||||||||
RTKs (millions) | 2,702.3 | 2,906.7 | 2,623.3 | 3,238.8 | 3,612.4 | |||||||||||||||
Cargo load factor (based on ATKs) | 74.4 | % | 71.2 | % | 68.4 | % | 70.1 | % | 69.6 | % | ||||||||||
Yield (based on RTKs - US¢) | 42.72 | 45.39 | 34.14 | 39.54 | 43.6 | |||||||||||||||
Revenue per ATK (US¢) | 31.77 | 32.34 | 23.35 | 27.72 | 30.4 | |||||||||||||||
Note:
| *3 | (Passenger and Cargo Revenues) / ATK |
| *4 | (Operating Expenses + Net Interest Expenses - Other Revenues) / ATK |
Note: See Glossary for definitions.
| Annual Report 2011 » 2011 Results | | 52 |
Table of Contents
Awards and Recognitions

2nd place, Best Airline South America
Skytrax World Airlines Awards 2011
2nd place, Airline Staff Service Excellence - South America
Skytrax World Airlines Awards 2011
Airline of the Year 2010, Airfinance Journal
Airfinance Journal Awards
Prize for LAN.com as best e-commerce site 2010
E-commerce LATAM 2010
1st place in Tourism category
E-commerce in Tourism Award
Most Outstanding Company 2011
La Segunda newspaper and Adimark
Most Outstanding Chilean Company Overseas 2011
Qué Pasa magazine and Universidad Adolfo Ibáñez
LAN Airlines, Most Socially Responsible Tourism Company
September 2011
FEDETUR
LAN Airlines, Company with Best Reputation
November 2011
Merco
LAN Airlines, 3rd place, Leaders with Best Reputation
November 2011
Merco
LAN receives award from the Chilean Agency for Energy Efficiency
December 2011
Transport category
| Annual Report 2011 » 2011 Results | | 53 |
Table of Contents
Financial Policies
 | LAN’s financial policy aims to respond effectively to external conditions beyond the Company’s control, thereby maintaining a stable flow of funds and protecting it from market risks such as variations in exchange rates, fuel prices and interest rates. |
LAN’s financial policy aims to:
| • | Preserve and maintain cash levels consistent with the level of the operation; |
| • | Maintain medium and long-term borrowing at a reasonable level in relation to the growth of operations and taking into account the objective of minimizing financing costs; |
| • | Not to hold short-term debt, except for specific transactions; |
| • | Make appropriate investments to maximize future cash flow and permit operational efficiency; |
| • | Make investments with cash surpluses in accordance with the policy established by the Board of Directors; |
| • | Respond effectively to external conditions beyond the Company’s control, thereby maintaining a stable flow of funds and protecting it from market risks such as variations in exchange rates, fuel prices and interest rates; |
| • | Maintain adequate lines of credit with local and overseas banks; |
| • | Maintain an adequate level of credit risk through permanent control of the distribution of risk by country and business segment. |
Liquidity
In 2011, LAN maintained the level of liquidity required to provide protection against potential external shocks. To this end, it also obtained lines of credit for a total of US$208 million from local and international financial institutions which, to date, it has not used. During the year, it continued to finance internally a large part of pre-delivery payments on its orders for Boeing and Airbus aircraft. At end-2011, the Company held a total of US$473 million in cash and easily convertible securities.
Investments and financing
The vast majority of LAN’s investments are in aircraft acquisition programs, which are generally financed using a combination of the Company’s own resources and structured long-term financial debt. Typically, LAN finances between 80% and 85% through bank loans or bonds guaranteed by export promotion agencies and the remainder through commercial loans or out of its own resources. Maturities under the different financing structures vary from 12 to 18 years but, in the vast majority of cases, are 12 years.
| Annual Report 2011 » 2011 Results | | 54 |
Table of Contents
Boeing program
Financing for the Boeing 767-300s envisages 14 leased aircraft (ten for passengers and four for cargo) and 29 aircraft acquired from Boeing (twenty one for passengers and eight for cargo). Additionally, the Company currently has 2 Boeing 777-200F freighters in the form of lease. The acquisitions from Boeing were financed mostly with bank loans guaranteed by Exim Bank. In 2009, the opportunity arose to raise finance on the capital market through the placement of bonds guaranteed by Exim Bank and this structure was used to finance the acquisition of the three Boeing 767-300s delivered between November 2009 and February 2010. The Exim Bank guarantee gave LAN access to advantageous interest rates both for the loans and on the capital market.
As of December 2011, LAN had pending orders for 13 Boeing 767-300s, which will be delivered in 2012 and 2013, and for 32 B787s (26 purchase orders and six lease orders) and an order for the purchase of two B777 cargo aircraft for delivery in 2012.
Airbus A320 Family and Airbus A340 Program
Between 2000 and 31 December 2011, LAN received a total of five A340s, 42 A320s, 24 A319s and 15 A318s. Out of these aircraft, four A340s, eight A320s and five A319s were financed through operational leasing contracts with a purchasing option in the tenth year, five A320s and one A340 were obtained as pure rentals and four A320s as sale and leaseback while the remainder (25 A320s, 19 A319s and 15 A318s) have been financed with bank loans that include guarantees from European export credit agencies (ECAs).
As of 31 December 2011, LAN had pending orders for 70 aircraft of the A320 family (52 A320s, 8 A319s and 10 A321s) for delivery between 2012 and 2016. The Company’s strategic plan envisages the sale of ten A318s between 2012 and 2013 in addition to five A318s sold in 2011.
Hedging against financial risks
The main financial risks to which an airline is exposed are: (i) exchange-rate risk, (ii) interest-rate risk, and (iii) fuel prices.
In the case of exchange-rate risk, the nature of LAN’s operations and the geographic diversification of its operations, together with the appreciation of local currencies, mean that the Company has limited exposure to the Chilean peso and other regional currencies (Argentine peso, Peruvian sol and Brazilian real). Approximately 78% of its revenues and 53% of its costs are dollar-denominated.
For interest-rate risk, LAN has used interest-rate swaps and calls to reduce its exposure to the risk of significant increases in interest rates. As of December 2011, it was hedged against 82% of its outstanding exposure as well as part of the exposure associated to the borrowing that will finance the Boeing and Airbus aircraft to be delivered in 2012 and 2013.
In order to reduce its exposure to the risk of increases in fuel prices, LAN uses mechanisms to pass on the cost in both its passenger and cargo businesses as well as derivates such as swaps, call options and collars. In 2011, it hedged approximately 25% of its 2012 fuel needs with a mix of these instruments. It minimizes counterparty credit risk by acquiring these instruments only from financial institutions with high credit ratings.
| Annual Report 2011 » 2011 Results | | 55 |
Table of Contents
Risk Factors
| Its success depends on key regulatory issues that can negatively affect our business and operating results. |
Risks related to our operations and the airline industry
Our performance depends significantly on the economic situation in the countries where we operate. Adverse economic conditions in these countries could have an adverse impact on our business. Its success depends on key regulatory issues that can negatively affect our business and operating results. We depend on strategic alliances and commercial relations in many countries in which we operate and our business could be negatively impacted if any of these strategic alliances or commercial relations were terminated. Our businesses and operating results could be negatively affected if we ceased to obtain and maintain routes, suitable airport access and slots and other operating permits. Our businesses and the market value of our ADRs and common shares would suffer if we were unable to implement our growth strategy successfully.
Our businesses could be negatively affected by a downturn in the commercial aviation industry as a result of exogenous events that affect travel habits or raise costs, such as epidemics, wars or terrorist attacks. A relatively limited range of products accounts for a considerable part of our cargo revenues which could be affected by events impacting their production or sale.
Our operations are subject to fluctuations in the supply and cost of jet fuel, which could negatively affect our businesses. We rely on maintaining a high daily rate of aircraft utilization in order to increase our revenues and this makes us particularly vulnerable to delays. We fly Airbus and Boeing aircraft and depend on these companies. As a result, our business is at risk if we do not receive opportune delivery of aircraft, if aircraft are not available from these companies or if the public has a negative perception of our aircraft.
We are frequently affected by certain factors beyond our control such as weather conditions that affect our operations. Losses and liabilities caused by accidents affecting one or more aircraft could have a significant impact on our businesses.
The intense competition in the airline industry can adversely affect our level of operations. Some of our competitors could receive external support with a negative impact on our competitive position. If, in future, we are unable to incorporate leased aircraft into our fleet at acceptable prices and conditions, our business could suffer. We are incorporating a number of new technologies and equipment and their phase-in could have a negative impact on our service and operating standards.
| Annual Report 2011 » 2011 Results | | 56 |
Table of Contents
Our business could be adversely affected if we were unable to cover our important future financing requirements. Our business could be negatively affected by our high borrowing level and aircraft leasing liabilities as compared to our equity. Higher insurance costs and/or significant reductions in its coverage could negatively affect our financial situation and the results of our operations. Problems in air control systems or other technical failures could disrupt our operations and have a significant adverse effect on our business.
Our financial success depends on the availability and performance of key personnel, who are not subject to non-competition restrictions. There can be negative consequences for our business if we are unable to reach satisfactory collective bargaining agreements with our unionized employees. Pressure from employees could cause operational difficulties and negatively affect our business. Increases in labor costs, which represent a significant part of our operating costs, could directly affect our earnings. We may experience difficulties in finding, training and retaining employees.
A failure to comply with the applicable environment regulation could adversely affect our business and reputation.
Risks inherent to Chile and other emerging markets
Events in Latin American countries and other emerging markets could adversely affect the Chilean economy, negatively impact our business and operating results and cause a drop in the market price of our common shares and ADRs. Fluctuations in the value of the Chilean peso and the currencies of other countries where we operate could adversely affect our revenues and profitability. We are not obliged to disclose as much information to our investors as US issuers and you may, therefore, receive less information than from a comparable US company.
Risks related to our common shares and ADRs
Our controlling shareholders may have interests that differ from those of our other shareholders. A limited number of our ADRs and common shares have been placed on the market and could experience further illiquidity and price volatility. Holders of our ADRs could be adversely affected by currency devaluations and exchange-rate fluctuations. Future changes in Chile’s foreign investment controls and withholding taxes could negatively affect non-residents in Chile who invest in our shares. Holders of our ADRs could, in certain circumstances, be unable to exercise their preferential rights.
| Annual Report 2011 » 2011 Results | | 57 |
Table of Contents
Material News
 | The proposed merger of LAN with TAM to form LATAM shall create an airline group among the ten largest in the world. |
1 On 21 December 2011, as established in Article 9 and in Article 10, Part 2 of the Securities Market Law, and in General Regulation 30, duly empowered, I hereby report the following ESSENTIAL FACT regarding LAN Airlines S.A. (“LAN”), Securities Registry N° 306:
(a) On January 18, 2011, LAN, Costa Verde Aeronáutica S.A., Inversiones Mineras del Cantábrico S.A., TAM S.A. (“TAM”), TAM Empreendimentos e Participações S.A., and Maria Cláudia Oliveira Amaro, Maurício Rolim Amaro, Noemy Almeida Oliveira Amaro, and João Francisco Amaro signed the English-language contracts known as (a) Implementation Agreement, and (b) Exchange Offer Agreement (the “Contracts Signed”), containing the definitive terms and conditions of the merger between LAN and TAM.
(b) Following the steps set forth in the Contracts Signed, LAN called an extraordinary shareholders’ meeting for 21 December, 2011, in order to submit for the shareholders’ approval the merger of LAN with the companies Sister Holdco S.A. and Holdco II S.A., which were incorporated specifically for the purposes of the mergers of LAN and TAM, and which will bring together all shares in TAM, directly and indirectly, prior to consolidation into LAN (the “Merger”), with LAN being the surviving company, setting an exchange agreement rate of 0.9 shares in LAN for each share in the companies acquired, and with a change of name to LATAM Airlines Group S.A.; subject to (i) the terms and conditions stipulated in the Contracts Signed, and (ii) the definitive resolution on or before 30 April, 2012, of the Complaint Writ pending at the Excelentísima Corte Suprema (Supreme Court), permitting the proposed merger between LAN and TAM.
(c) On that date the aforementioned extraordinary shareholders’ meeting was held, and LAN’s shareholders approved the Merger, the change of corporate name, and the other transactions set forth in the Contracts Signed.
The above marks compliance with a key step in the process for the implementation of the proposed merger between LAN and TAM, which is hoped to be completed towards the end of the first quarter of 2012.
2 On December 20, 2011, as a result of the stipulations of articles 9 and 10 of Law 18,045, on the Securities Market, and of General Regulation (Norma de Carácter General) 30 of 1989 issued by this Superintendent Office, I hereby inform you as an essential fact that, at the meeting of the board of Lan Airlines S.A. (“LAN”) held on 20 December, 2011, a decision was passed approving the distribution of a dividend on financial results from the 2011 accounting period for a total sum of US$ 85,000,206.56 equivalent to US$ 0.24988 per share, payable from 12 January, 2012, to all holders of shares on the fifth working day prior to that date.
In compliance with the stipulations of Circular 660 of 1986 issued by this Superintendent Office, attached to this essential fact is Form 1, providing details of the agreed dividend.
3 On 14 December, 2011, as established in Article 9 and in Article 10, section 2 of the Securities Exchange Law, and in General Regulation 30, duly accredited and with the agreement of the Board Meeting held on 11 November, 2011, I hereby report the following ESSENTIAL FACT regarding LAN Airlines S.A. (“LAN”), Securities Registry N° 306:
| | 58 |
Table of Contents
(a) On this day, the Brazilian Conselho Administrativo de Defesa Econômica (“CADE”) met to issue its opinion regarding the merger between LAN and TAM S.A. (“TAM”), in view of the opinions of the Secretaria de Acompanhamento Econômico (“SEAE”), Secretaria de Direito Econômico (“SDE”), Ministério Público Federal and Procuradoria do CADE (“ProCADE”), all of which bodies recommended approval and all of which with the sole exception of ProCADE recommended approval without restrictions.
(b) The decision made by CADE is to be published in full on Friday 16 December, 2011.
(c) Notwithstanding the above - and as already reported in the news media and for the information of domestic and foreign investors - CADE has approved the merger between LAN and TAM subject to compliance with two conditions, to wit: (i) the obligation to exchange two pairs of slots at Guarulhos airport, São Paulo, with companies that evince an interest in operating direct flights between São Paulo and Santiago and which fly that route, and (ii) the obligation to choose between the international alliances to which LAN and TAM belong within a period of 24 months.
(d) These measures established by CADE are in line with the measures accepted by LAN in the context of the out of court agreement made with FNE on 28 January, 2011, subsequently offered to the Competition Tribunal (H. Tribunal de Defensa de la Libre Competencia, “TDLC”) as part of the consultation process concluded by means of Resolution 37 dated 21 September, 2011, whereby the TDLC approved the merger between LAN and TAM.
(e) As soon as the full text of CADE’s decision is made available, LAN will publish it.
4 On 11 November 2011, as established in Article 9 and in Article 10, section 2 of the Securities Exchange Law, and in General Regulation 30, with the agreement of the Board Meeting held on 11 November, 2011, the following was reported as an essential fact:
(a) As was reported by LAN as an essential fact to your Superintendent Office on 19 January, 2011, LAN, Costa Verde Aeronáutica S.A., Inversiones Mineras del Cantábrico S.A., TAM S.A., TAM Empreendimentos e Participações S.A. and Maria Cláudia Oliveira Amaro,
Maurício Rolim Amaro, Noemy Almeida Oliveira Amaro and João Francisco Amaro signed (a) the Implementation Agreement, and (b) the Exchange Offer Agreement (the “Contracts Signed”) containing the definitive terms and conditions of the merger between LAN and TAM S.A. The same communication contains the most relevant terms and conditions stipulated in the Contracts Signed.
(b) In the meeting held on that date, the LAN Board of Directors unanimously agreed to hold an extraordinary shareholders’ meeting on 12 December, 2011, in order to submit for the shareholders’ approval the merger of LAN with the companies Sister Holdco S.A. and Holdco II S.A., with LAN being the surviving company and with a change of name to LATAM Airlines Group S.A.; subject to (i) the terms and conditions stipulated in the Contracts Signed, and (ii) the definitive resolution on or before 30 April, 2012, of the Complaint Writ pending at the Excelentísima Corte Suprema (Supreme Court), permitting the proposed merger between LAN and TAM S.A.
(c) The publication of the notification of this call for a meeting, the dispatch of the call by mail, and the publication of documentation underlying the proposals to be put to the vote on the LAN website, shall be undertaken in the manner and within the time periods established in the Securities Market Law and complementary regulations.
(d) At the same meeting, the Board of Directors of LAN unanimously agreed to recommend that shareholders approve the Merger, the change of corporate name, and the other transactions set forth in the Contracts Signed.
5 On 25 October, 2011, as established in Article 9 and in Article 10, section 2 of Law 18,045, the Securities Exchange Law, and in Superintendencia de Valores y Seguros General Regulation 30, and duly empowered so to do, I hereby report the following as an essential fact:
On that date, and notwithstanding the dispatch of corresponding FECU documentation within the applicable time periods, the Board and Committee of Directors of LAN Airlines S.A. have approved the publication as an essential fact of the attached financial information. This corresponds to a summary of the company’s Statement of Profit and Loss and Consolidated Balance Sheet, and additionally incorporates a qualitative explanation of operational performance during the third quarter of 2011.
| Annual Report 2011 » 2011 Results | | 59 |
Table of Contents
It is stated that LAN Airlines S.A. provides this financial information to its shareholders, investors, and the market in general with the purposes of (i) providing true, sufficient, and timely information in advance of the corresponding FECU in conformity with applicable time periods; (ii) compliance with timelines for the submission of financial information to the market, investors, and analysts by LAN Airlines S.A., in conformity with past practice over recent years; and (iii) keeping our shareholders, investors, and the market in general informed with regard to the submission of financial information on LAN Airlines S.A. under IFRS.
Finally, it is stated that this financial information does not replace or modify the corresponding FECU under IFRS, which shall be submitted within the time periods stipulated under the regulations of the Superintendencia de Valores y Seguros.
6 On 4 October, 2011, as established in Articles 9 and 10 of Law 18,045, the Securities Exchange Law, and in General Regulation 30, duly authorized by the Board of Directors of LAN Airlines S.A. (“LAN”), Securities Registry N° 306, it was reported as an essential fact that following a detailed analysis of the content and implications of the ruling issued by the Chilean competition tribunal Tribunal de Defensa de la Libre Competencia de Chile (“TDLC”) regarding the merger process between LAN Airlines S.A. and TAM S.A. (“TAM”), the Directors of both companies confirm their decision to proceed with the merger between the two companies.
As reported in a press release issued at the same time as this essential fact, and attached hereto, LAN and TAM consider that the mitigation measures imposed by TDLC do not have a significant effect on the synergies generated through the transaction and do not substantially modify the joint strategic development plan. Based on the analysis conducted, it is estimated that the impact on minor synergies shall not exceed 10 million dollars per year, deductable from the sum of 400 million dollars per year announced previously.
The mitigation measures considered by the tribunal are generally in line with the measures that LAN and TAM were willing to accept in January 2011 in the out of court agreement negotiated with the Fiscalía Nacional
Económica (FNE). Nonetheless, LAN and TAM believe that three of the mitigation measures are unconstitutional and disproportionate, and should be reviewed by the Supreme Court; for which reason complaint writs were lodged yesterday, 3 October.
The three measures called into question are:
(a) condition seven, which establishes the obligation to submit to mandatory ex-ante consultation, permanently and in all cases, certain code share agreements other than those that LATAM holds with other airlines belonging to the alliance that it chooses; which furthermore is unnecessary, given the existence of an alternative measure, the reporting of all such agreements to FNE for analysis and judgment of whether such agreements give rise to an infraction against free competition;
(b) condition eight, which establishes the obligation to waive four flight slots under the 5th freedom of the air to Lima, Peru, under circumstances that contravene the 2009 ruling of the Supreme Court, overturning a previous ruling by the TDLC that attempted to impose measures that would produce the same effect as this condition; and, finally
(c) condition fourteen, which confers excessive intrusive powers on the Fiscalía Nacional Económica and the consultant that the court demands to be hired for the purposes of cooperating in oversight, in providing for “unrestricted, total, permanent, and continuous [access] both in Chile and in other countries” regarding access to databases, systems, accounting, installations, call centers, and other offices of the LATAM Group, which unlimited access, unlike the access established in current legislation, lacks any prior judicial control, thus being rendered unlawful through prejudicial effects on constitutional guarantees.
In the complaints lodged with the Supreme Court, it is stated that in the cases of conditions seven and fourteen, alternative measures could be applied that, being lawful from a legal and constitutional perspective, are in line with the underlying spirit of the measures imposed by the TDLC.
| Annual Report 2011 » 2011 Results | | 60 |
Table of Contents
LAN and TAM furthermore confirm that they remain firm in their commitment to undertake the merger as quickly as possible, and that they hope to be able to finalize it towards the end of the first quarter of 2012. It is relevant to highlight that a number of corporate and regulatory authorizations remain pending, in which progress shall be made in parallel with the appeal complaint motion that LAN and TAM have lodged with the Supreme Court.
7 On 31, August, 2011, as established in Articles 9 and 10 of Law 18,045, the Securities Exchange Law, and in Superintendencia de Valores y Seguros General Regulation 30 of 1989, it was reported as an essential fact that at the meeting of the board of Lan Airlines S.A. (“LAN”) held on 30 August, 2011, the distribution of a provisional dividend was approved, charged against profits from the 2011 accounting period, for a total sum of US$ 56,590,766.03, equivalent to US$ 0.16677 per share, payable as of 15 September, 2011, to all shareholders holding shares on the fifth working day prior to that date.
8 On 26 July, 2011, as established in Article 9 and in Article 10, section 2 of Law 18,045, the Securities Exchange Law, and in Superintendencia de Valores y Seguros General Regulation 30, duly authorized, the following was reported as an essential fact:
On that date, and notwithstanding the dispatch of corresponding FECU documentation within the applicable time periods, the Board and Committee of Directors of LAN Airlines S.A. have approved the publication as an essential fact of the attached financial information. This corresponds to a summary of the company’s Statement of Profit and Loss and Consolidated Balance Sheet, and additionally incorporates a qualitative explanation of operational performance during the second quarter of 2011.
It is stated that LAN Airlines S.A. provides this financial information to its shareholders, investors, and the market in general with the purposes of (i) providing true, sufficient, and timely information in advance of the corresponding FECU in conformity with applicable time periods; (ii) compliance with timelines for the submission of financial information to the market, investors, and analysts by LAN
Airlines S.A., in conformity with past practice over recent years; and (iii) keeping our shareholders, investors, and the market in general informed with regard to the submission of financial information on LAN Airlines S.A. under IFRS.
Finally, it is stated that this financial information does not replace or modify the corresponding FECU under IFRS, which shall be submitted within the time periods stipulated under the regulations of the Superintendencia de Valores y Seguros.
9 On 4 July, 2011, as requested in the information request document Oficio Ordinario N° 17,837, dated 1 July, 2011, and as established in Articles 9 and 10 of Law 18,045, the Securities Exchange Law, and in General Regulation 30, duly authorized by the Board of Directors of LAN Airlines S.A. (“LAN”), Securities Registry N° 306, complementary information was provided regarding the essential fact dated 22 June, 2011, regarding the acquisition of twenty (20) new Airbus aircraft of the A320 NEO family, valued at approximately US$ 1.7 billion, by list price, to be delivered during 2017 and 2018.
With regard to said purchase we report that to date it is not possible to determine the financing mechanism to be used. It has been our normal practice to initiate the process for the acquisition of funds for a specific financing process closer to the date on which such funds shall be required. At that time, LAN shall make the corresponding decision with regard to the mechanism to be used, depending on the options available on the market.
10 On 22 June, 2011, as established in Articles 9 and 10 of Law 18,045, the Securities Exchange Law, and in General Regulation 30, duly authorized by the Board of Directors of LAN Airlines S.A. (“LAN”), Securities Registry N° 306, it was reported as an essential fact that today Lan Airlines S.A. signed a purchase contract with Airbus S.A.S., with the purpose of acquiring (20) new Airbus aircraft of the A320 NEO family, valued at approximately US$ 1.7 billion, by list price, which are scheduled for delivery during 2017 and 2018.
The acquisition of these aircraft is part of the company’s long term strategic fleet renovation and expansion plan.
| Annual Report 2011 » 2011 Results | | 61 |
Table of Contents
11 On 7 June, 2011, as established in Articles 9 and 10 of Law 18,045, the Securities Exchange Law, and in General Regulation 30, duly authorized by the Board of Directors of LAN Airlines S.A. (“LAN”), Securities Registry N° 306, the following was reported as an essential fact:
(a)By the essential fact dated 21 January, 2009, it was reported that two subsidiaries of LAN Airlines S.A., the companies LAN Cargo S.A. (“LAN Cargo”) and Aerolinhas Brasileiras S.A. (“ABSA”), signed a Plea Agreement with the US Department of Justice, regarding the investigations referred to in said essential fact. To date, 19 airlines have signed such agreements with the US Department of Justice, with regard to that investigation.
(b)As a consequence of said investigations, a class action lawsuit was lodged in the United States of America against 42 airlines, including LAN Airlines S.A., LAN Cargo and ABSA, as duly reporting in our financial statements.
(c)To date, ten airlines have made Settlement Agreements with the Plaintiffs: Lufthansa, Japan Airlines, American Airlines, Air France-KLM, SAS, All Nippon Airways, Cargolux, Qantas, Thai Airways, and British Airways, with total damages of US$ 367,912,000.
(d)The boards of directors of LAN Airlines S.A. and its subsidiaries LAN Cargo and ABSA to date - 6 June, 2011 - have approved a Settlement Agreement with the Plaintiffs, definitively ending the class action lawsuit tabled against our subsidiaries, which is currently under review by the United States District Court for the Eastern District of New York.
(e)This legal agreement, once approved by the aforementioned United States District Court for the Eastern District of New York, shall put an end to the civil class action lawsuit.
(f)Under this transaction, LAN Cargo agrees to pay damages amounting to US$ 59.7 million, and ABSA agrees to pay damages of US$ 6.3 million, giving rise to total payments by our subsidiaries of US$ 66 million. Additionally, a fund shall be set up in benefit of the Plaintiffs for an additional sum of US$ 150,000.
(g)This sum shall be paid by 14 June, 2011. As indicated, these civil and class action suits are duly reported in our financial statements, and we believe that they shall have no significant effect on the company’s cash flow.
(h)On 10 May, 2011, as established in Articles 9 and 10 of Law 18,045, the Securities Exchange Law, and in General Regulation 30, duly authorized by the Board of Directors of LAN Airlines S.A. (“LAN”), Securities Registry N° 306, the following was reported as an essential fact:
That LAN Airlines S.A. (“LAN”) has today signed a purchase agreement with The Boeing Company for the acquisition of five (5) Boeing 767-316ER aircraft, scheduled to be delivered in December 2012 and in February, May, June, and August 2013, with an option to acquire four (4) additional Boeing 767-316ER aircraft, to be delivered in 2013. The approximate investment cost, not including options, amounts to US$ 870,000,000 (list price).
The acquisition of these aircraft forms part of LAN’s long term fleet renovation strategy, which will allow us to maintain our safety, quality, and service standards for our passenger and cargo clients, increasing connectivity and our commitment to development in the region.
(i)On 29 April, 2011, as established in Articles 9 and 10 of Law 18,045, the Securities Exchange Law, and in General Regulation 30 of 1989 of this Superintendent Office, it was reported as an essential fact that at the Ordinary Shareholders’ Meeting of LAN Airlines S.A. (“LAN”) held on that day, 29 April, 2011, LAN’s shareholders approved the distribution of the definitive dividend proposed by the Board of Directors at its meeting on the previous 27 April, consisting in the distribution as a dividend of 50% of the profits from the 2010 accounting period, equivalent to a sum of US$ 209,852,536.48.
Provisional dividends N° 41 and N° 42 previously reported and distributed by LAN were imputed to this definitive dividend, amounting to a total of US$ 199,466,241.80. Therefore, the cash sum to be distributed amounts to US$ 10,386,294.68.
| Annual Report 2011 » 2011 Results | | 62 |
Table of Contents
As stipulated in Circular N° 660 of 1986, an Annex 1 is attached to this essential fact, providing details of the agreed dividend.
(j) On 6 April, 2011, as established in Articles 9 and 10 of Law 18,045, the Securities Exchange Law, in General Regulation 30, and in Title XVI of Law 18.046, the Corporate Law, on operations between related parties, duly authorized by the Board of Directors of LAN Airlines S.A. (“LAN”), Securities Registry N° 306, the following was reported as an essential fact:
Today, LAN Cargo S.A. and Inversiones LAN S.A., subsidiaries of Lan Airlines S.A. (“LAN”) as sellers, and Servicios de Transporte Limitada and Inversiones Betmin SpA, subsidiaries of the company Bethia S.A. (“Bethia”), as buyers, signed a purchase agreement for 100% of shareholder capital in the LAN subsidiaries Blue Express Intl. Servicios de Transporte Limitada and Blue Express S.A., engaged in the provision of land courier services; said contract was the subject of a purchase/sale promise signed by LAN Cargo S.A., Inversiones LAN S.A. and Bethia S.A. on 24 January, 2011, and reported to this Superintendent Office as an essential fact on 25 January, 2011.
As reported at that time, given that Bethia is an entity related to LAN, as defined in Article 100 of Law 18,045 on the Securities Market, the Directors’ Committee and Board of Directors of LAN made compliance with the stipulations of Title XVI of Law 18,046 on Companies, and proceeded to approve the aforementioned purchase at their meeting, held on 25 January, 2011.
It is hereby expressly stated that the purchase contract was signed under the terms agreed in the sale/purchase promise.
(k) On 3 March, 2011, as established in Articles 9 and 10 of Law 18,045, the Securities Exchange Law, and in General Regulation 30, duly authorized by the Board of Directors of LAN Airlines S.A. (“LAN”), Securities Registry N° 306, and as complementary information on the essential fact delivered the previous day, it was reported that on that date a publication was made in the Brazilian “Diário Oficial da Uniao” reporting Decision N° 29 dated 1 March, 2011, whereby the Brazilian civil aviation authority
Agência Nacional de Aviação Civil (“ANAC”) on request by TAM S.A. with the purpose of conducting the transaction with LAN referred to in the essential fact dated January 19, 2011, authorized the transfer of shares representing the shareholder capital of TAM S.A., which controls the public service companies TAM Linhas Aéreas S/A, Pantanal Linhas Aereas S/A, under judicial recovery, and TAM Milor-Taxi Aereo, Representacoes, Marcas e Patentes S/A.
A copy of the aforementioned publication in the country’s official gazette is attached.
12 On 2 March, 2011, as established in Articles 9 and 10 of Law 18,045, the Securities Exchange Law, and in General Regulation 30, duly authorized by the Board of Directors of LAN Airlines S.A. (“LAN”), Securities Registry N° 306, the following essential fact was reported:
(a)The fact that TAM S.A.(“TAM”) has today made public that on 1 March, 2011, the Deliberative Council of the Brazilian civil aviation authority ANAC held a meeting;
(b)That at the meeting case N° 60800.026563/2010 - 14 was analyzed, regarding ANAC’s authorization for the transfer of the companies TAM Linhas Aéreas S/A, Pantanal Linhas Aereas S/A and TAM Milor-Taxi Aereo, Representacoes, Marcas e Patentes S/A. in the context of the transaction with LAN described in the essential fact reported on 19 January, 2011; and
(c)That according to reports from TAM, ANAC is expected to issue a favorable opinion, although it is recognized that to date TAM has yet to be formally notified by ANAC of its decision regarding this case.
LAN considers the reporting of this information to be relevant, although to date TAM has yet to be formally notified by ANAC of its favorable decision in this matter, in light of an asymmetry of information in the market regarding LAN in general, and in particular the status of its transaction with TAM.
As soon as LAN becomes aware of any formal pronouncement by ANAC, LAN shall complement this information by issuing an additional communication.
| Annual Report 2011 » 2011 Results | | 63 |
Table of Contents
13 On 1 March, 2011, as established in Articles 9 and 10 of Law 18,045, the Securities Exchange Law, and in General Regulation 30, duly authorized by the Board of Directors of LAN Airlines S.A. (“LAN”), Securities Registry N° 306, it was reported as an essential fact that at an Ordinary Meeting of the Board of Directors held on that date, the Board of Directors of Lan Airlines S.A. agreed to call an Ordinary Shareholders’ Meeting on 29 April, 2011, at 11:30 am, in order to discuss the following issues:
(a)Approval of the company report, balance sheet, and financial statements for the accounting period ending on 31 December, 2010;
(b)Approval of the distribution of a definitive dividend charged against profits from the 2010 accounting period, with deductions for the provisional dividends of US$ 0.2198 and US$ 0.36896 per share, paid in August 2010 and January 2011, respectively;
(c)Fixing of board member remunerations for the 2011 accounting period;
(d)Fixing of remunerations for members of the Directors’ Committee, and said committee’s budget for the 2011 accounting period;
(e)Designation of External Auditors; designation of Risk Classification Agencies; accounts pertaining to the subjects to which Article 44° of Law 18,046 on Companies applies;
(f)Information on the costs of processing, printing, and dispatching the information referred to in Circular 1,494 of the Superintendencia de Valores y Seguros;
(g)Designation of the newspaper in which the Company will publish notification; and
(h)Other matters of corporate interest of such a nature that they are of relevance for presentation at an Ordinary Shareholders’ Meeting.
14 14. On 15 February, 2011, as established in Articles 9 and 10 of Law 18,045, the Securities Exchange Law, and in General Regulation 30, duly authorized by the Board of Directors of LAN Airlines S.A. (“LAN”), Securities Registry N° 306, the following information has been disclosed as an essential fact:
That LAN Airlines S.A. (“LAN”) has closed a purchase contract with The Boeing Company for the acquisition of three (3) Boeing 767-316ER aircraft, scheduled for delivery in July, August, and September 2012. The approximate sum invested amounts to US$ 510,000,000 (list price).
The acquisition of these aircraft is part of LAN’s long term strategic fleet plan.
15 On 25 January, 2011, as established in Articles 9 and 10 of the Securities Market Law, Law 18,045, General Regulation 30, and Title XVI of Laws 18,046, the Corporate Law, regarding operations between related parties, duly authorized by the Board of Directors of LAN Airlines S.A. (“LAN”), Securities Registry 306, the following information has been published as an essential fact:
Today, the Board of Directors has become aware of a sale/ purchase promise (the “Promise”) signed yesterday by its subsidiaries LAN Cargo S.A. and Inversiones LAN S.A., promising to sell, and Bethia S.A. (“Bethia”), promising to buy 100% of shares in the LAN subsidiaries Blue Express Intl. S.A. and Blue Express S.A., which companies are engaged in the provision of land courier services. The definitive purchase is subject to the completion of a due diligence process and compliance with a number of conditions set forth in the Promise.
Given that Bethia is an entity related to LAN, under the definition set forth in Article 100 of Law 18,045, the Securities Exchange Law, the Directors’ Committee and Board of Directors of LAN made compliance with the stipulations set forth in Title XVI of Law 18,046, the Corporate Law, and following receipt of a report by an independent assessor regarding the matter, resolved to approve the aforementioned operation.
| Annual Report 2011 » 2011 Results | | 64 |
Table of Contents
The price established in the Promise is US$ 54 million, subject to subsequent adjustments that may arise as a result of the due diligence conducted by Bethia. The equity values of Blue Express Intl. S.A. and its subsidiary Blue Express S.A., according to the consolidated balance sheet as of 31 December, 2010, is US$ 7,072,000 (seven million seventy two thousand US Dollars).
The estimated period for the conclusion of the due diligence process and closure of the purchase agreement and other accessory contracts is estimated at between 45 and 75 days from the date of signing of the Promise.
16 On 25 January 2011, as established in Article 9 and in Article 10, section 2 of Law 18,045, the Securities Exchange Law, and in Superintendencia de Valores y Seguros General Regulation 30, duly authorized, the following was reported as an essential fact:
On that date, and notwithstanding the dispatch of corresponding FECU documentation within the applicable time periods, the Board and Committee of Directors of LAN Airlines S.A. have approved the publication as an essential fact of the attached financial information. This corresponds to a summary of the company’s Statement of Profit and Loss and Consolidated Balance Sheet, and additionally incorporates a qualitative explanation of operational performance during the year as a whole and during the fourth quarter of 2010, ending on 31 December.
It is stated that LAN Airlines S.A. provides this financial information to its shareholders, investors, and the market in general with the purposes of (i) providing true, sufficient, and timely information in advance of the corresponding FECU in conformity with applicable time periods; (ii) compliance with timelines for the submission of financial information to the market, investors, and analysts by LAN Airlines S.A., in conformity with past practice over recent years; and (iii) keeping our shareholders, investors, and the market in general informed with regard to the submission of financial information on LAN Airlines S.A. under IFRS.
Finally, it is stated that this financial information does not replace or modify the corresponding FECU under IFRS, which shall be submitted within the time periods stipulated under the regulations of the Superintendencia de Valores y Seguros.
17 On 19 January, 2011, as established in Articles 9 and 10 of the Securities Exchange Law, Law 18,045, and in General Regulation 30, duly authorized by the unanimous agreement of the board of directors of LAN Airlines S.A. (“LAN”), Securities Registry 306, and as agreed at the extraordinary board meeting held on 18 January, 2010, the following information has been reported as an essential fact:
(a)On 13 August, 2010, LAN informed the Superintendencia de Valores y Seguros as an essential fact that on that date LAN, Costa Verde Aeronáutica S.A. and Inversiones Mineras del Cantábrico S.A. (the latter two to be referred to as the “Cueto Subsidiaries”), TAM S.A. (“TAM”) and TAM Empreendimentos e Participacoes S.A. (“TEP”) signed a non-binding Memorandum of Understanding (“MOU”), the fundamental aspects of which were summarized at that time.
(b)2. On 18 January, 2011, the parties to the MOU and Maria Cláudia Oliveira Amaro, Maurício Rolim Amaro, Noemy Almeida Oliveira Amaro, and Joao Francisco Amaro (the “Amaro Family”), as sole shareholders in TEP, signed (a) a binding Implementation Agreement and (b) a binding Exchange Offer Agreement (the “Contracts Signed”) containing the definitive terms and conditions for the proposed merger between LAN and TAM.
(c)In conformity with the Contracts Signed, and by means of a range of corporate restructuring measures to be implemented in Chile and Brazil, and an exchange offer to be made to all TAM shareholders (apart from the Amaro Family):
1. It is considered that effectively all voting shares in TAM shall be acquired by a newly incorporated Chilean company (“Holdco 1”):
(a) The shareholder capital of Holdco 1 shall be divided into two series of shares: (i) a series of shares with voting rights, with no economic rights beyond a nominal right to dividends; and (ii) a series of shares without voting rights, which shall bear effectively all economic rights.
| Annual Report 2011 » 2011 Results | | 65 |
Table of Contents
(b) The shareholder capital of Holdco 1 shall be distributed as follows: (x) with the specific purpose of complying fully with Brazil’s laws on foreign property control, the Amaro Family shall acquire and hold indirectly, through a newly incorporated Chilean company (“TEP Chile”), at least 80% of shares with voting rights, and LAN shall acquire and hold no more than 20% of shares with voting rights; and (y) LAN shall acquire and hold 100% of shares without voting rights.
2. The Amaro Family shall transfer the TAM shares without voting rights held indirectly by family members to a newly incorporated Chilean company held by the Amaro Family (“Sister Holdco”).
3. Holdco 1 shall incorporate a new Chilean company (“Holdco 2”), which shall launch the exchange offer and which, together with Sister Holdco, shall merge with LAN, as explained in the following paragraphs.
4. Holdco 2 shall launch an over the counter exchange offer whereby all TAM shareholders (other than the Amaro Family) may exchange their shares for the same number of shares in Holdco 2 (the “Exchange Offer”). Simultaneously with the launch of the Exchange Offer, Holdco 2 shall merge with LAN. As a result of this merger, TAM shareholders accepting the exchange offer shall receive LAN shares (in the form of Brazilian Depositary Receipts, BDRs, or American Depositary Receipts, ADRs, as applicable) at an exchange rate of 0.9 LAN shares per TAM share.
5. Sister Holdco and Holdco 2 shall merge with LAN, with LAN being the surviving company. The mergers may only be finalized if the Exchange Offer is successfully completed. The share exchange rate applicable to the merger shall be 0.9 LAN shares for each share in Sister Holdco or Holdco 2, the only assets of which shall be the TAM shares contributed by the Amaro Family or acquired through the Exchange Offer
6. The launch of the Exchange Offer shall be subject to the normal conditions applying to operations of that nature, including (i) approval of the mergers by LAN shareholders, (ii) no more than 2.5% of LAN shareholders must have exercised their right to withdraw, in accordance with Chilean legislation, and (iii) receipt of approvals and/or registrations with the Brazilian Agencia Nacional de Aviacao Civil (“ANAC”), the Brazilian Comissao de Valores Mobiliarios de Brasil, the Chilean Superintendencia de Valores y Seguros de Chile, the US Securities and Exchange Commission, and the monopolies and mergers authorities of the corresponding countries.
7. The completion of the Exchange Offer shall be subject to the minimum additional conditions regarding the number of shares accepted for provision and not withdrawn in the Exchange Offer, or otherwise approved, must be sufficient under Brazilian legislation in order to (i) permit the delisting of TAM from the BM&FBovespa (“Bovespa”), and (ii) provide LAN with the right and capacity to implement obligatory share withdrawal (statutory squeeze-out) of all TAM shareholders who do not accept the Exchange Offer.
8. The transaction implies that LAN shares shall be listed on the Bovespa in Brazil as Brazilian Depositary Receipts (BDRs), that they shall continue to be listed in Chile and on the New York Stock Exchange (NYSE) as American Depositary Receipts (ADRs), and that TAM shares shall cease to be listed on the Bovespa and on the NYSE as American Depositary Receipts (ADRs).
9. LAN’s name shall change to “LATAM Airlines Group S.A.” (“LATAM”), and LATAM’s shareholder capital shall be distributed approximately as follows (assuming that 100% of TAM shareholders not belonging to the Amaro Family accept the Exchange Offer): (i) Cueto Subsidiaries, 24.07%,
| Annual Report 2011 » 2011 Results | | 66 |
Table of Contents
(ii) TEP Chile, 13.67%, (iii) other current LAN shareholders, 46.60%, and (iv) TAM shareholders accepting the Exchange Offer, 15.65%. Annex A includes a diagram summarizing the organization of LATAM following the completion of the transaction.
(d)As the transaction is completed, current operations by both LAN and TAM and by their subsidiaries shall continue in the same business operations as are currently conducted.
(f)Control over TAM shall remain in the hands of the Amaro Family through TEP Chile and Holdco 1. The Contracts Signed take into account the signing of a number of shareholder agreements that shall enter into force only once the mergers are completed. In accordance with these shareholder agreements, certain concessions are granted to LATAM:
1. TAM shall have a board of directors comprising six members, four of whom shall be appointed by TEP Chile and the remaining two of whom shall be appointed by LATAM, in both cases through these companies’ holdings in Holdco l.
2. In TAM board and shareholders’ meetings, the quorum for the adoption of agreements shall be a simple majority, with the exception of certain extraordinary matters that shall require the vote of 95% of shareholders in the case of shareholders’ meetings, and of five members for board meetings. Such extraordinary agreements shall include but not be limited to: dissolution, liquidation, termination, transformation, merging, and demerging/splitting of the company; increase or decrease in capital; change in corporate object; and transactions with related parties or in excess of certain predefined limits.
3. The chairperson of the board shall be Ms. Maria Cláudia Oliveira Amaro, and the CEO shall be Marco Bologna.
(g)With regard to LATAM, the Contracts Signed shall also include the signing of certain shareholder agreements between the Cueto Subsidiaries, TEP Chile, and LATAM, which shall enter into force only once the mergers have been completed. In each case, the shareholder agreements shall govern corporate governance, voting, restrictions on share transfers, and certain concessions to TEP Chile and other matters between the shareholders. The principal characteristics of these shareholder agreements shall be:
1. LATAM shall have a board of directors comprising nine members.
2. Subject to certain limitations, the Cueto Subsidiaries agree to use the votes attached to their shares in order to allow TEP Chile to appoint a second director to the LATAM board of directors.
3. The Cueto Subsidiaries and TEP Chile are obliged to consult mutually and make efforts in good faith to reach an agreement and act jointly in all actions to be taken by the board or at shareholders’ meetings of LATAM, as applicable.
4. With the exception of a limited number of shares, neither the Cueto Subsidiaries nor TEP Chile may sell their shares in LATAM during the first three years.
5. After the third year, and subject to certain conditions, sale of shares shall be permitted for both the Cueto Subsidiaries and TEP Chile.
6. The chairperson of the board of directors shall be Maurício Rolim Amaro; Enrique Cueto Plaza shall continue in his role as CEO, and Ignacio Cueto Plaza shall continue in his current role.
The closure of this transaction is expected to be completed within six to nine months. The proposed merger of LAN with TAM to form LATAM shall create an airline group among the ten largest in the world. LATAM shall provide passenger and cargo transport services to more than 115 destinations in 23 countries, operating a fleet of over 280 aircraft and employing more than 40,000 people.
| Annual Report 2011 » 2011 Results | | 67 |
Table of Contents
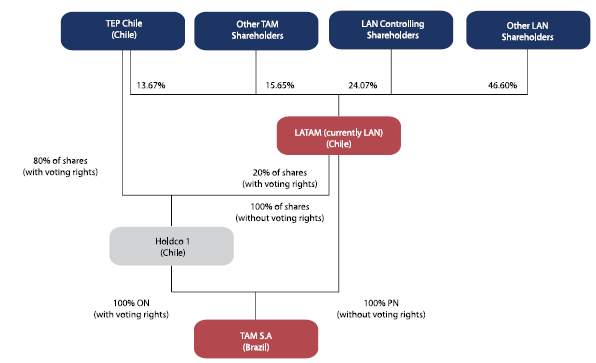
| Annual Report 2011 » 2011 Results | | 68 |
Table of Contents
Additional Information

Suppliers, securities and others
Suppliers
In 2011, as in previous years, LAN’s main suppliers were aircraft manufacturers Airbus and Boeing. Its other suppliers consist mainly of companies that produce aircraft accessories, parts and components and include Pratt & Whitney, IAE International Aero Engines AG, Rolls- Royce plc and General Electric Commercial Aviation Services Ltd. (engines); SICMA (seats); Air France and Lufthansa Technik (MRO components); Thales (onboard entertainment); Goodrich (reversers); and, Messier Bugatti and Goodrich (brakes). In addition, LAN has a number of fuel suppliers including Repsol YPF, Copec, Shell, Terpel, Chevron and Exxon.
Insurance
Taking into account all those areas of its operations which involve potential risks, LAN carries insurance that can be divided into three main categories:
Aviation, Hull and Liability Insurance
This type of insurance covers all the risks intrinsic to commercial aviation, including aircraft, engines, spare parts and third- party liability for passengers, cargo, baggage, merchandise and airports, etc. These policies are taken out jointly by LAN Airlines and its subsidiaries and reinsured
on the London market. Since 2006, the Company has also had an agreement with British Airways, Aer Lingus and other companies for the joint negotiation of the terms of hull and liability insurance, which helps in obtaining lower premiums and better coverage.
General Insurance
Insurance of this type provides coverage against all those risks that could affect the Company’s assets, particularly its physical goods and financial assets. These are protected through multi-risk policies (including fire, theft, computer equipment, transport of securities, window breakage and other all-risk coverage) as well as traditional coverage of motor vehicles, air and sea transport, corporate civil liability, etc.
Trademarks and Patents
LAN Airlines and its subsidiaries use a number of trademarks. These are duly registered with the corresponding bodies in the different countries in which they operate, or are the origin or destination of their operations, in order to be able to differentiate and market their products and services in these countries.
| Annual Report 2011 » 2011 Results | | 69 |
Table of Contents
![]()
Our Business
LAN International Passenger Business
LAN Airlines
LAN Argentina
LAN Colombia
LAN Ecuador
LAN Peru
LANPASS
LAN Cargo
Table of Contents
LAN International Passenger Business
 | At present, LAN’s passenger business directly serves over 100 destinations around the world as well as a further 70 international destinations through strategic alliances and commercial agreements with other airlines. |
PASSENGERS
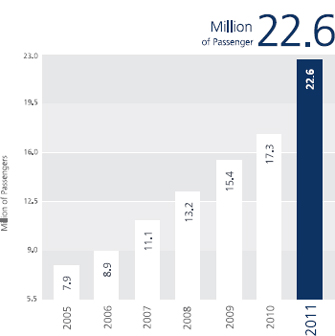
LAN, a company at the service of its customers
LAN Airlines and its subsidiaries serve three main passenger market segments: domestic flights within Chile, Peru, Ecuador, Argentina and Colombia, regional routes within South America, and long-haul flights connecting the region with North America, Europe and the South Pacific. In each of these types of operation, the Company strives to offer its customers an optimum travel experience through its world-class in-flight services, high safety and reliability standards and access to an ever larger network of destinations.
At present, LAN’s passenger business directly serves over 100 destinations around the world as well as a further 70 international destinations through strategic alliances and commercial agreements with other airlines.
In 2011, LAN faced complex conditions for the development of its passenger business, with both a sharp increase in oil prices - which reached an annual average of US$110/ barrel, up by 19% on 2010 - and the economic crisis in the United States and Europe. In addition, the eruption of the Puyehue Volcano in southern Chile disrupted the normal operation of an important number of flights within South America as well as to Australia and New Zealand.
| Annual Report 2011 » Our Business | | 71 |
Table of Contents
TRAFFIC
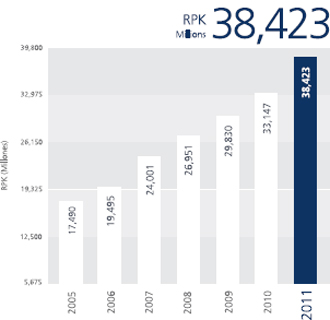
CAPACITY
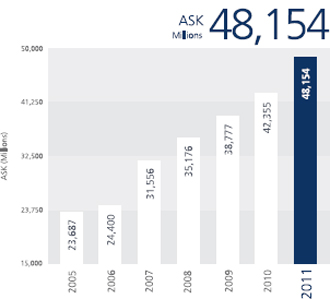
However, LAN’s solid financial position, its experience in addressing adverse market conditions and its flexible business model enabled it to rise successfully to these challenges and to continue consolidating its growth. Through efficient adjustments to some routes and the opening of new routes that promised greater opportunities, the Company was able during the year to optimize use of its resources without negatively affecting connectivity for its passengers.
In the case of the Company’s long-haul passenger business, the Madrid-Paris service on the Santiago-Madrid-Paris route and the New York-Toronto extension of its Santiago-New York-Toronto route were eliminated at the beginning of the year. The number of flights was, however, increased on some routes such as Santiago-New York, which reached a frequency of seven non-stop flights a week, and on the route via Lima and the Lima-Miami route, which reached
13 flights a week.
| Annual Report 2011 » Our Business | | 72 |
Table of Contents
LOAD FACTOR
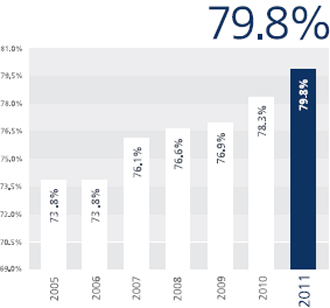
PASSENGER YIELD
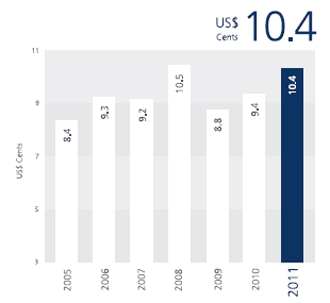
In its regional business, LAN took advantage of strong demand to launch a direct service from Ecuador to Buenos Aires, with five flights a week, and increased the number of flights between Santiago and São Paulo and between Santiago and Lima. In addition, in order to boost LAN Colombia’s regional connectivity, it raised the number of flights between Santiago and Bogotá and between Lima and Bogotá to seven and 14 a week, respectively, while, in order to increase the efficiency of its network of destinations, it suspended Lima-Brasilia flights.
In all, LAN’s international passenger business performed successfully in 2011, transporting 7.2 million passengers, up by 13.7% on the previous year. Out of this total, 4.3 million passengers corresponded to regional routes and 2.9 million to long-haul international routes. The Company’s consolidated international traffic increased by 12.6% and its capacity by 9.4%. As a result, the load factor rose by 2.3 percentage points on the previous year to 80.8%. Consolidated international passenger revenues reached US$2,454 million, up by 21.7% on 2010.
| Annual Report 2011 » Our Business | | 73 |
Table of Contents
REVENUE PER ASK
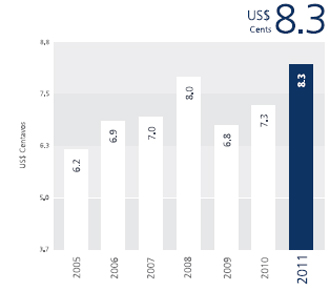
LAN’s solid value proposition has allowed it to advance in consolidating its leadership in the international transport of passengers in the different markets in which it operates, successfully positioning itself against the competition on the majority of its routes. On services to North America, its main competitors are American Airlines, Delta, United and Air Canada while, on routes to Europe, it competes with Iberia, Air France-KLM and Lufthansa and, in the regional market, its main competitors are AviancaTaca, Aerolíneas Argentinas, Copa Airlines, GOL and TAM.
On LAN’s domestic operations, the Company’s low-cost model, implemented in April 2007, has permitted a strong and sustained expansion of traffic. In line with the Company’s commitment to making air travel ever more accessible, this business model is based on the use of a modern short-haul fleet that, with its greater utilization capacity and lower fuel consumption, means a more efficient operation. This is reflected in the offer of more direct flights and a greater choice of frequencies during the day and night as well as more attractive fares in each of the countries in which LAN operates domestic routes.
| Annual Report 2011 » Our Business | | 74 |
Table of Contents
INTERNATIONAL MARKET SHARE
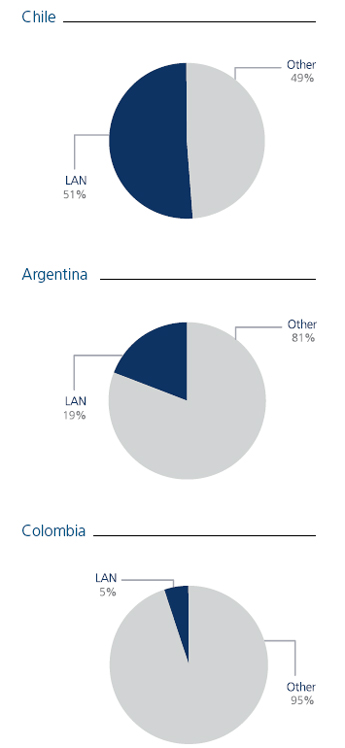
| Annual Report 2011 » Our Business | | 75 |
Table of Contents
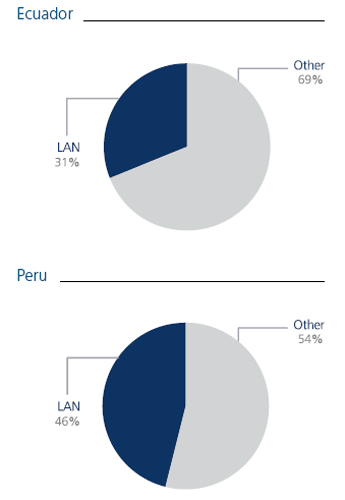
| Annual Report 2011 » Our Business | | 76 |
Table of Contents
LAN Airlines
 | In 2011, LAN maintained its position as the leading airline in the market - where it competes with Sky Airline and PAL Airlines - and accounted for 76% of domestic passenger traffic. |
Over the past five years, the number of passengers travelling by air within Chile has shown a solid expansion, showing average annual growth of 15%. In 2011, the industry carried 6.9 million passengers, representing an increase of 18% on 2010, and, in the case of flights to the north of the country, of 23%, reflecting the development of the mining industry.
In 2011, LAN maintained its position as the leading airline in the market - where it competes with Sky Airline and PAL Airlines - and accounted for 76% of domestic passenger traffic. It has regular services to 13 destinations in Chile, covering the most important cities along the length of the country, as well as the Santiago-Easter Island route. In summer, it also has flights between Santiago and Pucón, one of southern Chile’s most important tourist centers.
LAN’s domestic operations were significantly affected in 2011 by the eruption of the Puyehue-Cordón Caulle Volcano which began on June 4. The resulting presence of volcanic ash in the air space meant the cancelation of many flights to southern Chile during the second half of the year.
As a result, capacity was reduced by around 1%, principally on operations to Concepción, Temuco, Valdivia, Osorno and Puerto Montt and, indirectly, on the rest of the routes LAN operates within Chile.
Despite this contingency, the Company reported a positive performance in 2011. Its capacity (measured in ASKs) increased by 16% as compared to 2010, giving average annual growth of 12% over the past five years. Similarly, passenger traffic rose by 15% over the previous year, allowing the Company to maintain a load factor of 80%, a level considered successful in the airline industry.
It is important to note that, in November, the Company started a process of densification of its A320 fleet which, by increasing the number of seats, raised capacity by 4% in terms of passengers per aircraft. In addition, LAN put increased emphasis on the process of continuous improvement of its product, a project launched in 2010, through the gradual withdrawal of its A318s and their replacement by the A320 model, with its greater advantages as regards size and, principally, efficiency. As a
| Annual Report 2011 » Our Business | | 77 |
Table of Contents
DOMESTIC MARKET SHARE
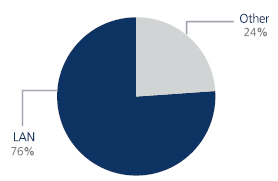
result, by end-2011, the Company was operating a fleet of 24 aircraft, formed by 14 Airbus A320s (eight densified), nine A318s and one A319.
On its international services from and to Chile, LAN carried 3.6 million passengers in 2011, representing an increase of 13% on 2010 and a market share of 51%. From Santiago, LAN operates a network of destinations within South America and long-haul international flights to North America, Europe and Oceania.
| Annual Report 2011 » Our Business | | 78 |
Table of Contents
LAN Argentina
 | LAN carried 1.9 million passengers, equivalent to a 30% share of the market in which it competes with two state-owned companies. |
For its domestic operations, LAN Argentina has a modern fleet of ten Airbus A320s and is positioned as one of the country’s leading airlines.
In the six years since the start of its operations, LAN Argentina has successfully surmounted different obstacles, maintaining a position as one of the country’s most important airlines. Following the launch in April 2011 of the Buenos Aires-Bahía Blanca route, the Company serves a total of 14 domestic destinations, connecting the Argentine capital with the country’s other main cities. In 2011, LAN carried 1.9 million passengers, equivalent to a 30% share of the market in which it competes with two state-owned companies, Aerolíneas Argentinas and its Austral subsidiary.
In 2011, LAN Argentina’s domestic passenger traffic - measured in RPKs - dropped by 2% while its capacity - measured in ASKs - was down by 4%. As a result, the load factor of its domestic passenger operations reached 76%.
The Company’s domestic passenger operations suffered a particularly adverse impact in 2011 as a result of the eruption in June of the Puyehue Volcano in southern Chile. San Carlos de Bariloche was the worst affected destination, with emissions of volcanic ash forcing the suspension of flights to this city during seven months. In this context, the Company sought to offer customers the maximum facilities in order to reduce the resulting inconvenience, diverting its flights to the Esquel and Neuquén airports and offering ground transport to San Carlos de Bariloche. As from the beginning of January 2012, direct flights to Bariloche could gradually be reestablished.
LAN Argentina operates long-haul international routes from Buenos Aires to Miami and Punta de Cana and, within South America, non-stop flights from Buenos Aires to Lima, São Paulo and Santiago.
| Annual Report 2011 » Our Business | | 79 |
Table of Contents
DOMESTIC MARKET SHARE
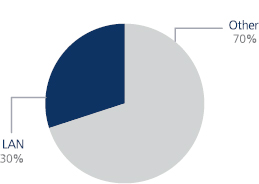
It is important to note that, in December 2011, Argentina’s National Civil Aviation Authority (ANAC) issued a resolution forbidding LAN Argentina to use the Aeroparque Jorge Newbery airport in Buenos Aires for regional flights as from 1 January 2012. This measure, justified on the grounds of congestion at the airport, applies only to LAN Argentina and prevents it using the airport to operate its two daily flights to São Paulo and one daily flight to Santiago. These flights have been transferred to the Ezeiza international airport.
| Annual Report 2011 » Our Business | | 80 |
Table of Contents
LAN Colombia
 | This was subsequently subjected to a far-reaching restructuring plan to align it with LAN’s safety, punctuality, efficiency and service standards, a process that was achieved in record time. |
LAN Colombia was officially launched on 5 December 2011, becoming the fifth country in which LAN operates domestic passenger flights. This added 23 new destinations to the Company’s network, including 27 routes between 22 cities within the country, including Medellín, San Andrés, Santa Marta, Barranquilla, Cartagena, Bucaramanga, Cali, Yopal, Villavicencio and Neiva, as well as the international route between Bogotá and Fort Lauderdale in the United States, which will be replaced by the direct Bogotá-Miami route as from February 2012.
The birth of LAN Colombia had its origin in LAN’s acquisition of the local AIRES airline in November 2010. This was subsequently subjected to a far-reaching restructuring plan to align it with LAN’s safety, punctuality, efficiency and service standards, a process that was achieved in record time.
The brand change from AIRES to LAN implied not only painting all its aircraft with LAN’s colors but also measures that included migrating AIRES to all LAN’s systems, accessing the distribution systems of travel agencies, opening more than 30 sales offices around Colombia and the commercial and operational integration of Colombia’s domestic network with the rest of LAN’s network.
The strategy for achieving a successful restructuring was anchored in four pillars: reliability, safety, organizational structure and profitability.
Initially, LAN focused on restoring reliability, punctuality and service quality. The measures taken as part of this process included redesigning routes, establishing a policy of not charging for the first bag, standardizing airport procedures and introducing the “LAN box” in in-flight services as well as modifying the cabins of AIRES aircraft to bring them into line with the product that LAN offers.
In addition, the Company took measures to ensure that safety processes comply with LAN’s minimum standards. In a particularly important step, it obtained certification under the Operational Safety Audit (IOSA) program, developed by the International Air Transport Association (IATA). This program verifies the organizational and operational processes and procedures that directly affect safety in the operation of flights. The Company also implemented an Emergency Plan and implemented a successful fleet reliability program.
During the restructuring, the subsidiary’s Mission, Vision and Values were also defined as well as a new organizational structure. Performance assessments and the first Great Place to Work survey were implemented and its corporate building was inaugurated. The ultimate aim of all these measures was to establish a new organizational structure.
| Annual Report 2011 » Our Business | | 81 |
Table of Contents
DOMESTIC MARKET SHARE
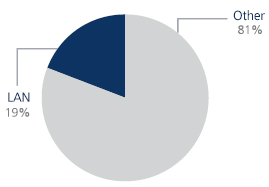
Steps to restore the subsidiary’s profitability included the incorporation of its first three aircraft from the Airbus A320 family. As well as these three aircraft, its fleet as of December 2011 comprised nine Boeing 737-700s, ten Dash 8-200s and four Dash 8-Q400s, giving a total of 26 aircraft.
LAN Colombia’s successful management was reflected in a 6% increase in its passenger traffic as compared to 2010 while its capacity rose by 5%. As a result, its load factor reached 73%, up by one percentage point on the previous year.
In December 2011, LAN Colombia accounted for around 19% of the country’s airline market and was the company with the largest coverage of domestic flights. Its 3.1 million passengers transported in 2011 positioned it as the second largest airline in Colombia where its main competitors are AviancaTaca and Copa Colombia.
In December, the Company signed an alliance with the Proexport Colombia agency to promote the country’s tourist attractions internationally, an initiative through which LAN expects to boost its reach to passengers around the world.
| Annual Report 2011 » Our Business | | 82 |
Table of Contents
LAN Ecuador
 | In 2011, LAN Ecuador achieved a new milestone in its expansion when, in November, it started operations to San Cristóbal Island in the Galápagos, with two flights weekly from Quito/Guayaquil. |
LAN’s entry into Ecuador’s domestic market in April 2009 has made a valuable contribution to the development of air transport in this country. Thanks to its business model’s focus on efficiency, its competitiveness and the resulting impact on demand, the Company has provided thousands of Ecuadoreans with access to their first experience of air travel. This was reflected in a 63% increase in the number of passengers transported within the country, which reached 1 million, and in the growth of the Company’s share of domestic routes, which reached 26%. In the domestic market, its main competitors are Tame and Aerogal.
In 2011, LAN Ecuador achieved a new milestone in its expansion when, in November, it started operations to San Cristóbal Island in the Galápagos, with two flights weekly from Quito/Guayaquil. This is in addition to the daily service to Baltra Island, also in the Galápagos, that the Company has offered since September 2010. This new operation is a further demonstration of LAN’s commitment to Ecuador in terms of improving domestic connectivity and promoting tourism and the country’s economic development.
Within Ecuador, the Company also operates the Guayaquil- Quito and Quito-Cuenca routes, covering a total of five destinations.
LAN strives constantly to offer its passengers the best product in terms of safety, reliability and service. In 2011, in line with this undertaking, LAN Ecuador renewed its short-haul fleet, incorporating three new Airbus A320s to replace Airbus A318s which were taken out of service. This represents an important change for its customers as regards service since the new aircraft have this category’s most spacious and comfortable passenger cabin. As of end-2011, LAN Ecuador’s domestic fleet comprised five Airbus A320s, which also serve regional routes.
In 2011, LAN Ecuador’s passenger traffic - measured in RPKs - increased by 97% while its capacity - measured in ASKs - rose by 92%. As a result, the load factor of its domestic passenger operation reached 77%.
| Annual Report 2011 » Our Business | | 83 |
Table of Contents
DOMESTIC MARKET SHARE
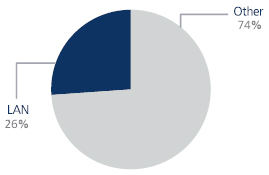
Through its international operations, LAN Ecuador connects the country with the main centers of interest abroad. Using local crew, it offers daily flights from Guayaquil and Quito to New York, Miami and Madrid - making it the first Ecuadorean airline with services to Europe - as well as to Santiago, Lima and Buenos Aires. In May, the Company also inaugurated operations on the direct Quito/ Guayaquil-Buenos Aires route on which it currently offers five flights weekly.
In 2011, for the second consecutive year, LAN Ecuador took first place in the airline category of the Best Quality Service awards presented by the EKOS business magazine. In addition, it was awarded the Tourism Merit Medal by the local government of Santa Cruz in the Galápagos.
| Annual Report 2011 » Our Business | | 84 |
Table of Contents
LAN Peru
 | LAN Peru operates 136 regional flights a week to 13 destinations and 60 international flights a week from Lima. |
Since its launch in 1999, LAN Peru has constantly sought to improve its value proposition in order to offer its passengers the best travel experience. For its domestic operations, LAN Peru has a fleet that, as of end-2011, comprised 14 Airbus A319s, positioning it as the company with the country’s most modern and safest aircraft.
In 2011, the Company expanded its domestic operations, increasing from two to a minimum of three the daily flights it currently offers to 14 destinations (excluding Tumbes, a seasonal destination), thereby providing the greatest coverage, connectivity and national integration.
LAN Peru faced intense competition in 2011 due to the entry of new players, high fuel prices and a sharp reduction in fares by its main competitors, Peruvian Airlines and TACA. Its operations were also affected by other complex situations such as social conflicts in Juliaca and Cajamarca, with their impact on tourism. Nonetheless, it maintained its position as the main airline in the domestic market, accounting for a 67% market share and carrying close to 4 million passengers.
As a result, LAN Peru’s domestic traffic in 2011 (measured in RPKs) rose by 3% while its capacity (measured in ASKs) increased by 1%. This gave a load factor of 78%, up by two percentage points on the previous year.
In addition, LAN Peru continued working to consolidate Lima as the hub for its international flights. Its development over the years has allowed the Company to increase connectivity for its passengers, both within the region and to and from Central America, the United States and Europe. It operates 136 regional flights a week to 13 destinations and 60 international flights a week from Lima.
In line with its commitment to offering customers the best service and promoting air travel, LAN Peru launched LANTOURS in June 2011, offering a wide range of tourist programs in Peru and around the world, specially designed to satisfy passengers’ travel needs.
| Annual Report 2011 » Our Business | | 85 |
Table of Contents
DOMESTIC MARKET SHARE
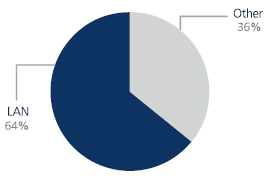
In a demonstration of its commitment to Peru’s social and economic development, the Company built a Premium Maintenance Base in the last half of 2011, which will allow it to implement new scheduled maintenance. In November 2011, LAN Peru also inaugurated an innovative service that seeks to offer visitors to Cusco greater comfort and time savings when it opened the first City Bag Drop in the center of the city, allowing passengers to leave their bags in a safe place instead of having to take them to the airport.
| Annual Report 2011 » Our Business | | 86 |
Table of Contents
LANPASS
 | As of December 2011, the program had 5.6 million members across Chile, Argentina, Peru and Ecuador as well as in other countries. In 2011, 1,250,000 people joined the program, representing an increase of 30%. |
MEMBERS DISTRIBUTION
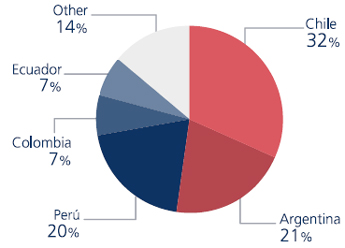
LANPASS is the frequent flyer program created by LAN to reward the preference and loyalty of its passengers. Members of this program earn LANPASS Kilometers each time they fly with LAN or any of the other airlines that form part of the oneworld alliance or are affiliated to LANPASS as well as when they buy products or services from any of the program’s partners, such as banks and shops. They can use their kilometers to fly free-of-charge or, in Chile, Peru and Argentina, exchange them for products from a virtual catalogue.
As of December 2011, the program had 5.6 million members across Chile, Argentina, Peru and Ecuador as well as in other countries. In 2011, 1,250,000 people joined the program, representing an increase of 30%. The launch of LANPASS in Colombia at the end of 2011 meant the incorporation of new Colombian members into the program.
| Annual Report 2011 » Our Business | | 87 |
Table of Contents
LANPASS MEMBERS
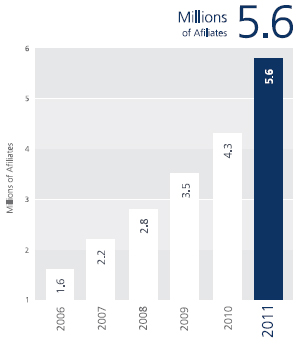
In September 2011, in order to extend LANPASS benefits and privileges to a larger number of people, improvements were introduced in the Canje Flexible (Flexible Redemption) system, launched in 2009, under which LANPASS holders have access to an even larger number of seats and, depending on the number of kilometers they are willing to redeem, flexible choice of dates in any season of the year. The new system resulted in a 32% increase in the number of redemptions as compared to 2010.
In addition, the Company continued to strengthen the LANPASS program and, in Chile, formed new commercial alliances with other industries (real estate, retail, clinics, car dealerships), resulting in ever more frequent use of the program.
| Annual Report 2011 » Our Business | | 88 |
Table of Contents
LAN Cargo
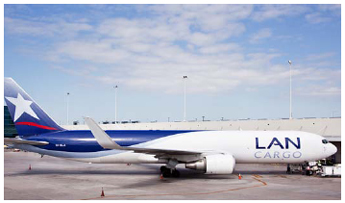 | Through the network of LAN Cargo and its subsidiaries - ABSA in Brazil, MasAir in Mexico and LANCO in Colombia - the Company is able to offer the most extensive connectivity between strategic points in the region and the rest of the world. This gives it a competitive advantage unrivalled by any other airline in the continent. |
CARGO TONS
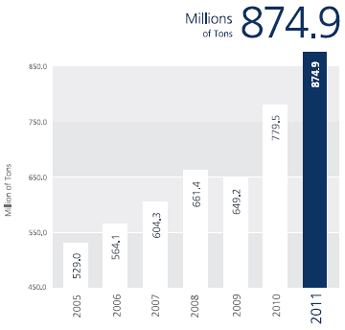
LAN Cargo is Latin America’s leading cargo airline, a position it has achieved thanks to its reliability, safety and service standards as well as its great flexibility in adapting to market conditions. In the latter, the Company’s business model has played a key role by combining efficient operation of its cargo planes with optimum utilization of the belly of its passenger aircraft, thereby allowing it to make routes profitable, adapt its operations to economic cycles and increase the load factor of its flights.
Through the network of LAN Cargo and its subsidiaries - ABSA in Brazil, MasAir in Mexico and LANCO in Colombia - the Company is able to offer the most extensive connectivity between strategic points in the region and the rest of the world. This gives it a competitive advantage unrivalled by any other airline in the continent.
The growth of its fleet has been crucial in the success of LAN’s cargo business, allowing it to increase its operational capacity and connectivity. In 2011, it incorporated its 14th Boeing 767-300F whose continuous operation throughout the year allowed the Company to strengthen its position and competitiveness in the region while also entering new markets. In addition, LAN Cargo operates two modern Boeing 777-200Fs, considered the most advanced and efficient of their type in the industry.
| Annual Report 2011 » Our Business | | 89 |
Table of Contents
TRAFFIC
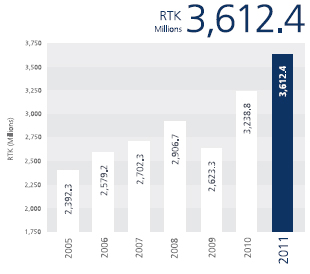
CAPACITY
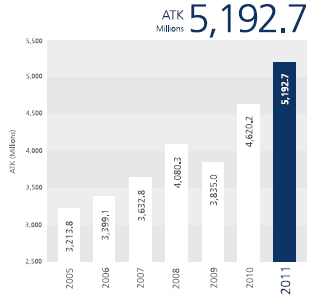
In 2011, conditions for the development of the cargo business were difficult, given the increase in fuel prices and the economic turbulence seen in the United States and Europe, and this was reflected in a 1% contraction of the cargo industry worldwide. LAN Cargo, however, continued to increase its traffic, achieving 12% growth and transporting 875 million tonnes as well as successfully recouping the increase in fuel prices. As a result, its load factor reached 70%, similar to the previous year, while its revenues increased by 23% to US$1,567 million.
In a particularly important achievement, the Company’s market share of routes connecting Latin America and the United States reached 37%, up from 34% in 2010, despite more aggressive competition and a virtually flat market. On the West Coast of North America, it also increased its market share of the main Los Angeles-Mexico route to close to 45%, up by almost nine percentage points.
In addition, it consolidated its presence in Brazil’s domestic market, achieving excellent returns on both the route to Manaos and in the northeast of the country, particularly to the cities of Recife and Fortaleza, and a 52% increase in the weight of cargo transported as compared to the previous year.
| Annual Report 2011 » Our Business | | 90 |
Table of Contents
LOAD FACTOR
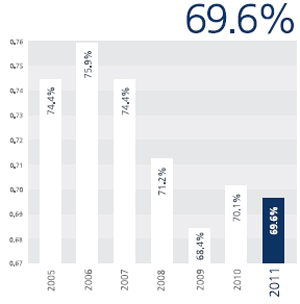
CARGO YIELD
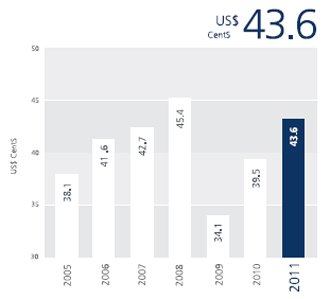
In 2011, the Company continued to increase the destinations it covers and started to operate from Miami to new markets such as Valencia in Venezuela and Salvador in Brazil, its 11th destination in this country. It also expanded its operations to Europe, adding two Boeing 767-300F flights to its four Boeing 777-200F flights in order to respond to an increase in the flights offered by competitors while also paving the way for the arrival of two new Boeing 777-200Fs, due to be incorporated in the last quarter of 2012.
At present, LAN Cargo operates flights to key points in the United States, including Miami, Los Angeles and New York, and in Europe to Madrid, Frankfurt and Amsterdam as well as to 34 destinations in Latin America.
In its cargo business, LAN’s main competitors on regional routes and to and from the United States are Atlas, Centurion, Tampa, Air France-KLM and Cargolux while, on routes to Europe, it competes with Lufthansa Cargo, Martinair, Cargolux and Emirates.
| Annual Report 2011 » Our Business | | 91 |
Table of Contents
REVENUE PER CARGO ATK
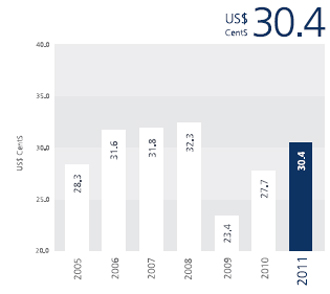
In 2011, LAN made important investments in Colombia and Brazil through its LANCO and ABSA subsidiaries, respectively, thereby consolidating its commitment to these two countries. In Colombia, it inaugurated the region’s most modern cargo warehousing facilities in Bogotá’s El Dorado airport. This represented an investment of US$7 million and a 125% increase in capacity, allowing the Company to optimize its handling of flowers, the main export from Colombia transported by air, which account for over 80% of cargo. Colombia is, indeed, Latin America’s largest market for the air transport of exports to the United States.
Similarly, in Brazil, the Company inaugurated a modern storage facility in the Eduardo Gomes international airport in Manaos, the most important one in northern Brazil. This not only meant a 60% capacity increase but also the incorporation of the LAN Cargo network’s best operational practices into its domestic business in Brazil and ensures its future growth.
| Annual Report 2011 » Our Business | | 92 |
Table of Contents
Sustainability
Table of Contents
Sustainability
LAN’s sustainability strategy
At LAN, we are aware of the importance that a strong economic performance be matched by an outstanding social and environmental performance that adds value for our stakeholders and generates development for the countries in which we operate.
For this reason, the Company has, since 2011, had in place a sustainability strategy comprising eight spheres in which the Company is working to contribute to sustainable development.

Operational Excellence
We constantly seek new technologies and ways of carrying out processes with the aim of being one of the ten best airlines in social and environmental, as well as economic, terms.

The implementation of the HOST Project, which implies changing LAN’s booking, inventory and passenger check-in system, will allow the Company to grow without sacrificing quality for our customers and to do so more cost-efficiently.

Since the start of its implementation in 2009, the LEAN Program, a philosophy of work whose aims are efficiency and sustainability, has successfully reduced the time aircraft spend on the ground, reduced errors in different processes, increased productivity and achieved important environmental benefits.
Ethics and Governance
Through the values that identify us, we foster and safeguard ethical and transparent behavior in all the Company’s decisions.

All senior financial executives must sign a Code of Ethics designed to foster honest and ethical conduct in the disclosure of financial information, compliance with regulation and avoidance of conflicts of interest.

Every LAN employee is provided with a Code of by which to guide his or her conduct and behavior within the organization.
| Annual Report 2011 » Sustainability | | 94 |
Table of Contents
Our People
We promote the professional, social and personal development of our collaborators, supporting their initiatives and fostering a good work climate and the development of talent. In other words, we understand that, at LAN, we are people looking after people.

During 2011, four corporate volunteer programs were implemented in South America in order to incorporate LAN employees into care for the environment and the promotion of sustainable tourism.

LAN has a total of 21,838 employees of whom 42.6% are women and 57.4% are men.
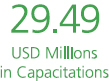
In 2011, 18,687 people received training, representing an investment of US$29.49 million.
Environment
We seek to ensure care for the environment in all our processes, managing and minimizing our impact and promoting responsible conduct both within the Company and among those with whom we relate.
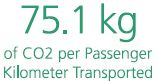
In 2011, LAN measured its corporate carbon footprint which, at 75.1 kilos of CO2 per passenger-kilometer transported, proved to be one of the most efficient in the industry.

In a bid to foster the sustainable development of biofuels, we formed an association for the development of alternative fuels in Latin America.

We launched the process of implementation of an Environmental Management System for our subsidiaries in Chile, Peru, Argentina, Ecuador and Colombia as well as in Miami for LAN Cargo.
| Annual Report 2011 » Sustainability | | 95 |
Table of Contents
Safety
We seek to ensure care for our operation and people, adhering to maximum standards of safety for our customers throughout the journey in which they use our services.

Five areas form the structure established by the Company for the management of all aspects related to safety: Operational Safety (for matters relating to flight safety), Corporate Safety (related to care for and protection of people, installations, airports and goods), Workplace Safety (Occupational Health and Safety Program), Emergencies and Safety Audits (systems and processes in operational areas).

1,603 volunteers are registered with the Assistance to Passengers and Family Members (APF) program.

LAN and its subsidiaries have IATA Operational Safety Audit (IOSA) certification.

Since 1991, no flight has suffered an accident that has resulted in serious injury to passengers or crew or serious damage to an aircraft.
Suppliers
We foster long-term relationships with our suppliers, ensuring compliance with agreements entered into and strengthening development and wellbeing throughout our supply chain.

82% of expenditure on global corporate procurement went to suppliers in Argentina, Chile, Colombia, Ecuador and Peru, the countries where LAN has domestic operations.

LAN suppliers are classified into four groups.

Since 2010, LAN has used the Qmarket system, thereby facilitating tender processes and increasing their transparency.
| Annual Report 2011 » Sustainability | | 96 |
Table of Contents
Community
LAN plays a role in the region’s development and connectivity, transporting humanitarian aid, promoting sustainable tourism and care for the environment and familiarizing children with the aviation world in a bid to help ensure that our destinations today are also the destinations of tomorrow.

Over 2,500 computers were donated to non-profit organizations in South America.

Since its launch, the Cuido mi destino (I look after my destination) program has restored tourist attractions in 14 places in South America, encouraging 800 young people to care for their cities and promoting their interest in sustainable tourism.

LAN transports volunteers, workers and beneficiaries of different humanitarian organizations including América Solidaria, Un Techo para mi País, Coaniquem, Operación Sonrisa and UNICEF.

5,000 children, mostly from poor families, visited the Company’s installations and hundreds of them were able to fly for the first time, thanks to the Conociendo LAN (Getting to know LAN) programs.

LAN and its subsidiaries are members of different organizations that promote corporate social responsibility and sustainable development such as Acción RSE (Chile), IARSE (Argentina), CEADS (Argentina) and the World Tourism Organization (UNWTO).
Customers and Passengers
We provide our passengers and cargo customers with a reliable, safe and cordial service, helping to connect South American countries with each other and the rest of the world.
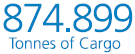
In 2011, LAN carried 22.5 million passengers and 874,899 tonnes of cargo.
5,6 million people are members of the LANPASS frequent flyer program.

In 2009, LAN launched an internal Culture of Service program designed principally to take customer relations to a new stage by providing service that is not only a guarantee of operational excellence but also seeks to establish a close tie with the customer.

A Sustainability in LAN section was added to our LAN.com and LANCARGO.com website and a CSR and Environment section was included in the IN magazine to report on innovations as regards sustainability.
Table of Contents
Chile
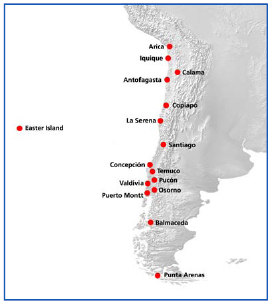
Peru
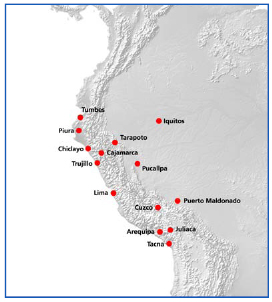
Argentina
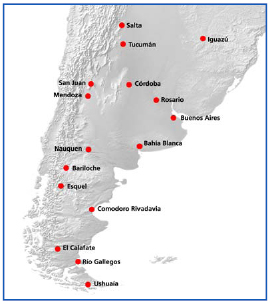
Ecuador
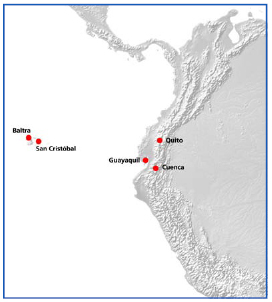
| Annual Report 2011 » Destinations | | 98 |
Table of Contents
Colombia
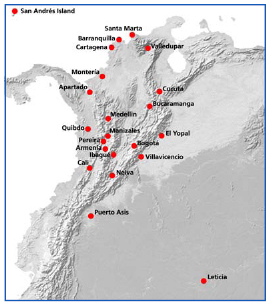
Regional
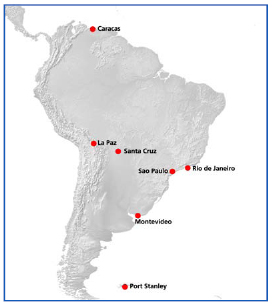
Long-haul
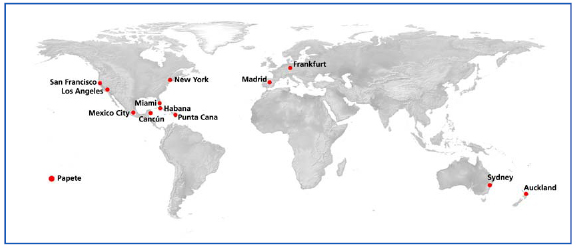
| Annual Report 2011 » Destinations | | 99 |
Table of Contents
Destinations
Cargo - only Destinations
Brazil
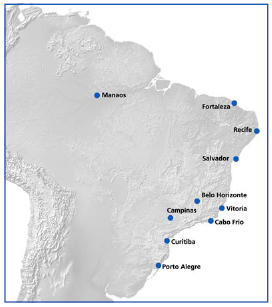
Europe
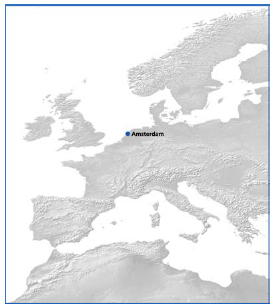
Latin America (others)
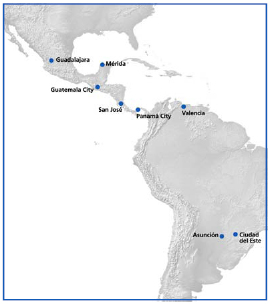
| Annual Report 2011 » Destinations | | 100 |
Table of Contents
Destinations
Passenger and Cargo Destinations
United States
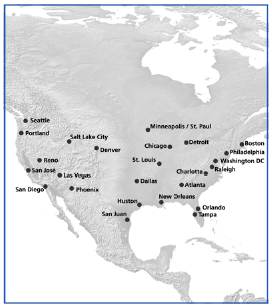
Mexico
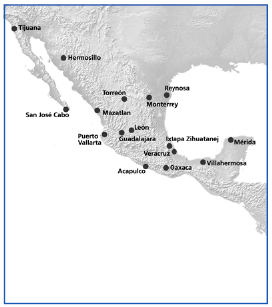
South America
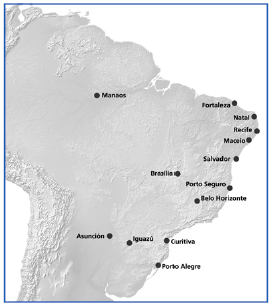
Canada
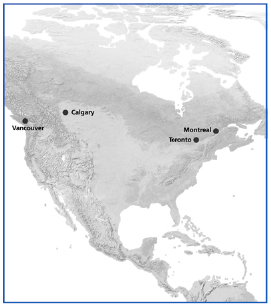
| Annual Report 2011 » Destinations | | 101 |
Table of Contents
Europe
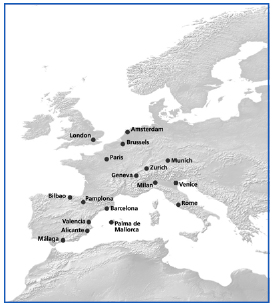
Asia
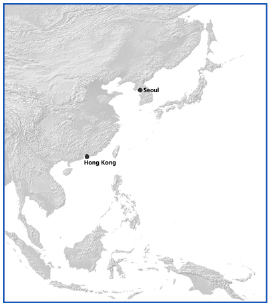
| Annual Report 2011 » Destinations | | 102 |
Table of Contents
Chapter VII
Financial Statements and Notes
Table of Contents
Consolidated Financial Statements
LAN Airlines S.A. and Subsidiaries
| Contents | Report of the Independent Auditors | |
| Consolidated Statement of Financial Position | ||
| Consolidated Statement of Income by Function | ||
| Consolidated Statement of Comprehensive Income | ||
| Consolidated Statement of Changes in Equity | ||
| Consolidated Statement of Cash Flows - Direct Method | ||
| Notes to the Consolidated Financial Statements | ||
| CLP | Chilean Peso | |
| ARS | Argentine Peso | |
| US$ | United States Dollar | |
| THUS$ | Thousands of United States Dollars | |
| COP | Colombian Peso | |
| Memoria Anual 2011 » Consolidated Financial Statements | | 104 |
Table of Contents
Consolidated Financial Statements
Report of Independent Accountants
Santiago, February 14, 2012
To the Shareholders and Directors
Lan Airlines S.A.
We have audited the consolidated statements of financial position of Lan Airlines SA and its subsidiaries as of December 31, 2011 and 2010, the related consolidated statements of comprehensive income and cash flows for each of the three years in the period ended December 31, 2011, and the related consolidated statements of changes in net equity for each of the two years in the period ended December 31, 2011. The preparation of these financial statements (including the notes thereto) is the responsibility of Lan Airlines S.A.’s management. Our responsibility is to express an opinion on these financial statements, based on our audit.
We conducted our audits in accordance with auditing standards generally accepted in Chile. Those standards require that we plan and perform the audit to obtain reasonable assurance about whether the financial statements are free of material misstatements. An audit includes examining, on a test basis, evidence supporting the amounts and disclosures in the financial statements. An audit also includes assessing the accounting principles used and significant estimates made by management, as well as evaluating the overall financial statement presentation. We believe that our audits provide a reasonable basis for our opinion.
In our opinion, the accompanying consolidated financial statements present fairly, in all material respects, the financial position of Lan Airlines S.A. and its subsidiaries as of December 31, 2011 and 2010, the results of their operations and cash flows for each of the three years in the period ended December 31, 2011 in accordance with International Financial Reporting Standards.
Renzo Corona Spedaliere
RUT: 6.373.028-9
| | 105 |
Table of Contents
Contents of the notes to the consolidated financial statements of Lan Airlines S.A. and Subsidiaries
Note 1 | 115 | |||||
Note 2 | 118 | |||||
| 118 | ||||||
| 121 | ||||||
| 122 | ||||||
| 122 | ||||||
| 123 | ||||||
| 123 | ||||||
| 123 | ||||||
| 123 | ||||||
| 124 | ||||||
2.10 Derivative financial instruments and hedging activities | 124 | |||||
| 126 | ||||||
| 126 | ||||||
| 126 | ||||||
| 126 | ||||||
| 126 | ||||||
| 126 | ||||||
| 127 | ||||||
| 127 | ||||||
| 127 | ||||||
| 128 | ||||||
| 128 | ||||||
2.22 Non-current assets (or disposal groups) classified as held for sale | 128 | |||||
| 129 | ||||||
| 129 | ||||||
Note 3 | 130 | |||||
| 130 | ||||||
| 139 | ||||||
| 140 | ||||||
Note 4 | 142 | |||||
Note 5 | 143 | |||||
Note 6 | 145 | |||||
Note 7 | 146 | |||||
| 146 | ||||||
| 148 | ||||||
Note 8 | Trade, other accounts receivable and non-current accounts receivable | 149 | ||||
| Memoria Anual 2011 » Consolidated Financial Statements | | 106 |
Table of Contents
Nota 9 | 153 | |||||
Nota 10 | 155 | |||||
Nota 11 | 156 | |||||
Nota 12 | 158 | |||||
Nota 13 | Non-current assets (or disposal groups) classified as held for sale | 160 | ||||
Nota 14 | 161 | |||||
Nota 15 | 164 | |||||
Nota 16 | 167 | |||||
Nota 17 | 169 | |||||
Nota 18 | 170 | |||||
Nota 19 | 179 | |||||
Nota 20 | 185 | |||||
Nota 21 | 190 | |||||
Nota 22 | 193 | |||||
Nota 23 | 196 | |||||
Nota 24 | 197 | |||||
Nota 25 | 199 | |||||
Nota 26 | 199 | |||||
Nota 27 | 205 | |||||
Nota 28 | 206 | |||||
Nota 29 | Gains (losses) on the sale of non-current assets not classified as held for sale | 208 | ||||
Nota 30 | 209 | |||||
Nota 31 | 210 | |||||
Nota 32 | 216 | |||||
Nota 33 | 217 | |||||
Nota 34 | 222 | |||||
Nota 35 | 227 | |||||
Nota 36 | 230 | |||||
Nota 37 | 231 | |||||
Nota 38 | 232 | |||||
Nota 39 | 233 | |||||
| Memoria Anual 2011 » Consolidated Financial Statements | | 107 |
Table of Contents
CONSOLIDATED STATEMENT OF FINANCIAL POSITION
ASSETS
Assets | Note | As of December 31, 2011 ThUS$ | As of December 31, 2010 ThUS$ | |||||||||
Current Assets | ||||||||||||
Cash and cash equivalents | 6-7 | 374,407 | 631,052 | |||||||||
Other financial assets | 7-11 | 227,803 | 245,451 | |||||||||
Other non-financial assets | 12 | 26,660 | 18,820 | |||||||||
Trade and other accounts receivable | 7-8 | 537,406 | 481,350 | |||||||||
Accounts receivable from related entities | 7-9 | 838 | 50 | |||||||||
Inventories | 10 | 72,787 | 53,193 | |||||||||
Tax assets | 98,789 | 97,656 | ||||||||||
Total current assets other than non-current assets (or disposal groups) classified as held for sale | 1,338,690 | 1,527,572 | ||||||||||
|
|
|
| |||||||||
Non-current assets (or disposal groups) classified as held for sale | 13 | 4,661 | 5,497 | |||||||||
Total current assets | 1,343,351 | 1,533,069 | ||||||||||
Non-current Assets | ||||||||||||
Other financial assets | 7-11 | 21,833 | 21,587 | |||||||||
Other non-financial assets | 12 | 58,163 | 32,508 | |||||||||
Accounts receivable | 7-8 | 7,491 | 7,883 | |||||||||
Equity accounted investments | 15 | 991 | 593 | |||||||||
Intangible assets other than goodwill | 16 | 64,923 | 45,749 | |||||||||
Goodwill | 17 | 163,777 | 157,994 | |||||||||
Property, plant and equipment | 18 | 5,927,982 | 4,948,430 | |||||||||
Deferred tax assets | 19 | 60,148 | 38,084 | |||||||||
Total non-current assets | 6,305,308 | 5,252,828 | ||||||||||
Total assets | 7,648,659 | 6,785,897 | ||||||||||
The accompanying Notes 1 to 39 form an integral part of these consolidated financial statements.
| Memoria Anual 2011 » Consolidated Financial Statements | | 108 |
Table of Contents
CONSOLIDATED STATEMENT OF FINANCIAL POSITION
LIABILITIES AND EQUITY
Liabilities | Note | As of December 31, 2011 ThUS$ | As of December 31, 2011 ThUS$ | |||||||||
Current liabilities | ||||||||||||
Other financial liabilities | 7-20 | 582,257 | 542,624 | |||||||||
Trade and other accounts payables | 7-21 | 645,086 | 645,571 | |||||||||
Accounts payable to related entities | 7-9 | 367 | 184 | |||||||||
Other provisions | 22 | 7,363 | 753 | |||||||||
Tax liabilities | 29,369 | 15,736 | ||||||||||
Other non-financial liabilities | 23 | 1,057,637 | 939,151 | |||||||||
Total current liabilities | 2,322,079 | 2,144,019 | ||||||||||
Non-current liabilities | ||||||||||||
Other financial liabilities | 7-20 | 3,109,136 | 2,562,348 | |||||||||
Accounts payable | 7-25 | 354,930 | 425,681 | |||||||||
Other provisions | 22 | 22,385 | 32,120 | |||||||||
Deferred tax liabilities | 19 | 369,625 | 312,012 | |||||||||
Employee benefits | 24 | 13,132 | 9,657 | |||||||||
Total non-current liabilities | 3,869,208 | 3,341,818 | ||||||||||
Total liabilities | 6,191,287 | 5,485,837 | ||||||||||
Equity | Note | As of December 31, 2011 ThUS$ | As of December 31, 2011 ThUS$ | |||||||||
Share capital | 26 | 473,907 | 453,444 | |||||||||
Retained earnings | 26 | 1,116,798 | 949,214 | |||||||||
Other equity interests | 26 | 8,492 | 5,463 | |||||||||
Other reserves | 26 | (153,873 | ) | (111,307 | ) | |||||||
Equity attributable to owners of the parent | 1,445,324 | 1,296,814 | ||||||||||
Non-controlling interests | 12,048 | 3,246 | ||||||||||
Total equity | 1,457,372 | 1,300,060 | ||||||||||
Total liabilities and equity | 7,648,659 | 6,785,897 | ||||||||||
The accompanying Notes 1 to 39 form an integral part of these consolidated financial statements.
| Memoria Anual 2011 » Consolidated Financial Statements | | 109 |
Table of Contents
CONSOLIDATED STATEMENT OF INCOME BY FUNCTION
| Note | For the year ended December 31, 2011 ThUS$ | For the year ended December 31, 2010 ThUS$ | ||||||||||
Revenue | 27 | 5,585,440 | 4,390,502 | |||||||||
|
|
|
| |||||||||
Cost of sales | (4,078,598 | ) | (3,012,698 | ) | ||||||||
|
|
|
| |||||||||
Gross margin | 1,506,842 | 1,377,804 | ||||||||||
|
|
|
| |||||||||
Other income | 30 | 132,804 | 132,826 | |||||||||
|
|
|
| |||||||||
Distribution costs | (479,829 | ) | (383,517 | ) | ||||||||
|
|
|
| |||||||||
Administrative expenses | (405,716 | ) | (331,831 | ) | ||||||||
|
|
|
| |||||||||
Other expenses | (214,411 | ) | (172,428 | ) | ||||||||
|
|
|
| |||||||||
Other gains/(losses) | (33,039 | ) | 5,438 | |||||||||
|
|
|
| |||||||||
Financial income | 14,453 | 14,946 | ||||||||||
|
|
|
| |||||||||
Financial costs | 28 | (139,077 | ) | (155,279 | ) | |||||||
|
|
|
| |||||||||
Equity accounted earnings | 15 | 458 | 132 | |||||||||
|
|
|
| |||||||||
Foreign exchange gains/(losses) | 31 | (256 | ) | 13,792 | ||||||||
|
|
|
| |||||||||
Result of indexation units | 131 | 149 | ||||||||||
|
|
|
| |||||||||
Income before taxes | 382,360 | 502,032 | ||||||||||
|
|
|
| |||||||||
Income tax expense | 19 | (61,789 | ) | (81,107 | ) | |||||||
Net income for the year | 320,571 | 420,925 | ||||||||||
Income attributable to owners of the parent | 320,197 | 419,702 | ||||||||||
|
|
|
| |||||||||
Income attributable to non-controlling interests | 374 | 1,223 | ||||||||||
|
|
|
| |||||||||
Net income for the year | 320,571 | 420,925 | ||||||||||
Earnings per share | ||||||||||||
Basic earnings per share (US$) | 32 | 0.94335 | 1.23882 | |||||||||
|
|
|
| |||||||||
Diluted earnings per share (US$) | 32 | 0.94260 | 1.23534 | |||||||||
|
|
|
| |||||||||
The accompanying Notes 1 to 39 form an integral part of these consolidated financial statements.
| Memoria Anual 2011 » Consolidated Financial Statements | | 110 |
Table of Contents
CONSOLIDATED STATEMENT OF COMPREHENSIVE INCOME
| Note | For the year ended December 31, 2011 ThUS$ | For the year ended December 31, 2010 ThUS$ | ||||||||||
Net income | 320,571 | 420,925 | ||||||||||
|
|
|
| |||||||||
Components of other comprehensive income, before taxes | ||||||||||||
Currency translation differences | ||||||||||||
Gains (losses) on currency translation, before tax | 31 | (10,864 | ) | 708 | ||||||||
Other comprehensive income, before taxes, currency translation differences | (10,864 | ) | 708 | |||||||||
|
|
|
| |||||||||
Cash flow hedges | ||||||||||||
Gains (losses) on cash flow hedges before tax | 20 | (40,368 | ) | (17,855 | ) | |||||||
Other comprehensive income, before taxes, cash flow hedges | (40,368 | ) | (17,855 | ) | ||||||||
Other components of other comprehensive income, before taxes | (51,232 | ) | (17,147 | ) | ||||||||
Income tax relating to other comprehensive income [abstract] | ||||||||||||
Income tax related to currency translation differences in other comprehensive income | 19 | 1,846 | (120 | ) | ||||||||
Income tax related to cash flow hedges in other comprehensive income | 19 | 6,862 | 3,035 | |||||||||
Amount of income taxes related to components of other comprehensive income | 8,708 | 2,915 | ||||||||||
Other comprehensive income | (42,524 | ) | (14,232 | ) | ||||||||
|
|
|
| |||||||||
Total comprehensive income | 278,047 | 406,693 | ||||||||||
Comprehensive income attributable to owners of the parent | 277,631 | 405,549 | ||||||||||
Comprehensive income attributable to non-controlling interests | 416 | 1,144 | ||||||||||
Total Comprehensive Income | 278,047 | 406,693 | ||||||||||
The accompanying Notes 1 to 39 form an integral part of these consolidated financial statements.
| Memoria Anual 2011 » Consolidated Financial Statements | | 111 |
Table of Contents
CONSOLIDATED STATEMENT OF CHANGES IN EQUITY – 2011
| Attributable to owners of the parent | ||||||||||||||||||||||||||||||||||||
| Other reserves | ||||||||||||||||||||||||||||||||||||
| Note | Share Capital ThUS$ | Other equity interests ThUS$ | Rereve for exchenge on traslation differences ThUS$ | Cash flow hedging reserve ThUS$ | Retained earnings ThUS$ | Equity attributable to owners of the parent ThUS$ | Non- controlling interests ThUS$ | Total equity ThUS$ | ||||||||||||||||||||||||||||
Equity previously reported January 1, 2011 | 453,444 | 5,463 | (4,257 | ) | (107.050 | ) | 949,214 | 1,296,814 | 3,246 | 1,300,060 | ||||||||||||||||||||||||||
|
|
|
|
|
|
|
|
|
|
|
|
|
|
|
| |||||||||||||||||||||
Total increase (decrease) in equity | ||||||||||||||||||||||||||||||||||||
Comprehensive income | ||||||||||||||||||||||||||||||||||||
Gain (losses) | 26 | — | — | — | — | 320,197 | 320,197 | 374 | 320,571 | |||||||||||||||||||||||||||
Other comprehensive income | — | — | (9,060 | ) | (33,506 | ) | — | (42,566 | ) | 42 | (42,524 | ) | ||||||||||||||||||||||||
Total comprehensive income | — | — | (9,060 | ) | (33,506 | ) | 320,197 | 277,631 | 416 | 278,047 | ||||||||||||||||||||||||||
|
|
|
|
|
|
|
|
|
|
|
|
|
|
|
| |||||||||||||||||||||
Transactions with shareholders | ||||||||||||||||||||||||||||||||||||
Equity issuance | 26-36 | 23,135 | — | — | — | — | 23,135 | — | 23,135 | |||||||||||||||||||||||||||
Dividends | 26 | — | — | — | — | (151,981 | ) | (151,981 | ) | — | (151,981 | ) | ||||||||||||||||||||||||
Increase (decrease) through transfers and other changes, equity | 26-36 | (2,672 | ) | 3,029 | — | — | (632 | ) | (275 | ) | 8,386 | 8,111 | ||||||||||||||||||||||||
Total transactions with shareholders | 20,463 | 3,029 | — | — | (152,613 | ) | (129,121 | ) | 8,386 | (120,735 | ) | |||||||||||||||||||||||||
Closing balance as of December 31, 2011 | 473,907 | 8,492 | (13,317 | ) | (140,556 | ) | 1,116,798 | 1,445,324 | 12,048 | 1,457,372 | ||||||||||||||||||||||||||
The accompanying Notes 1 to 39 form an integral part of these consolidated financial statements.
| | 112 |
Table of Contents
CONSOLIDATED STATEMENT OF CHANGES IN EQUITY - 2010
| Attributable to owners of the parent | ||||||||||||||||||||||||||||||||||||
| Other reserves | ||||||||||||||||||||||||||||||||||||
| Note | Share Capital ThUS$ | Other equity interests ThUS$ | Currency translation reserve ThUS$ | Cash flow hedging reserve ThUS$ | Retained earnings ThUS$ | Equity attributable to owners of the parent ThUS$ | Non- controlling interests ThUS$ | Total equity ThUS$ | ||||||||||||||||||||||||||||
Equity previously reported January 1, 2010 | 453,444 | 2,490 | (4,924 | ) | (92,230 | ) | 740,047 | 1,098,827 | 7,099 | 1,105,926 | ||||||||||||||||||||||||||
Total increase (decrease) in equity | ||||||||||||||||||||||||||||||||||||
Comprehensive income | ||||||||||||||||||||||||||||||||||||
Gain (losses) | 26 | — | — | — | — | 419,702 | 419,702 | 1,223 | 420,925 | |||||||||||||||||||||||||||
Other comprehensive income | — | — | 667 | (14,820 | ) | — | (14,153 | ) | (79 | ) | (14,232 | ) | ||||||||||||||||||||||||
Total comprehensive income | — | — | 667 | (14,820 | ) | 419,702 | 405,549 | 1,144 | 406,693 | |||||||||||||||||||||||||||
|
|
|
|
|
|
|
|
|
|
|
|
|
|
|
| |||||||||||||||||||||
Transactions with shareholders | ||||||||||||||||||||||||||||||||||||
Dividends | 26 | — | — | — | — | (210,406 | ) | (210,406 | ) | — | (210,406 | ) | ||||||||||||||||||||||||
Increase (decrease) through transfers and other changes, equity | 26-36 | — | 2,973 | — | — | (129 | ) | 2,844 | (4,997 | ) | (2,153 | ) | ||||||||||||||||||||||||
Total transactions with shareholders | — | 2,973 | — | — | (210,535 | ) | (207,562 | ) | (4,997 | ) | (212,559 | ) | ||||||||||||||||||||||||
Closing balance as of December 31, 2010 | 453,444 | 5,463 | (4,257 | ) | (107,050 | ) | 949,214 | 1,296,814 | 3,246 | 1,300,060 | ||||||||||||||||||||||||||
The accompanying Notes 1 to 39 form an integral part of these consolidated financial statements.
| | 113 |
Table of Contents
CONSOLIDATED STATEMENT OF CASH FLOWS DIRECT – METHOD
| Note | For the year ended December 31, 2011 ThUS$ | For the year ended December 31, 2010 ThUS$ | ||||||||||
Cash flows from operating activities | ||||||||||||
Cash collection from operating activities | ||||||||||||
Proceeds from sales of goods and services | 5,966,464 | 4,831,963 | ||||||||||
Other cash receipts from operating activities | 52,012 | 46,336 | ||||||||||
|
|
|
| |||||||||
Payments for operating activities | ||||||||||||
Payments to suppliers for goods and services | (4,286,394 | ) | (3,058,168 | ) | ||||||||
Payments to and on behalf of employees | (883,297 | ) | (633,686 | ) | ||||||||
Other payments for operating activities | (84,000 | ) | (18,000 | ) | ||||||||
|
|
|
| |||||||||
Interest paid | (6,766 | ) | (387 | ) | ||||||||
|
|
|
| |||||||||
Interest received | 11,428 | 11,438 | ||||||||||
|
|
|
| |||||||||
Income taxes refunded (paid) | 626 | (11,098 | ) | |||||||||
|
|
|
| |||||||||
Other cash inflows (outflows) | (7,499 | ) | (43,061 | ) | ||||||||
Net cash flows from operating activities | 762,574 | 1,125,337 | ||||||||||
Cash flows used in investing activities | ||||||||||||
Cash flows from disposal of subsidiaries | 47,337 | 1,491 | ||||||||||
|
|
|
| |||||||||
Cash flows used for acquisition of subsidiaries | (3,541 | ) | (12,000 | ) | ||||||||
|
|
|
| |||||||||
Cash flows used for in the purchase of non-controlling interests | — | — | ||||||||||
|
|
|
| |||||||||
Other cash receipts from sales of equity or debt instruments of other entities | 9,201 | 12,915 | ||||||||||
|
|
|
| |||||||||
Other payments to acquire equity or debt instruments of other entities | (72 | ) | (60,000 | ) | ||||||||
|
|
|
| |||||||||
Amounts raised from sale of property, plant and equipment | 93,787 | 577 | ||||||||||
|
|
|
| |||||||||
Purchases of property, plant and equipment | (1,367,025 | ) | (1,029,158 | ) | ||||||||
|
|
|
| |||||||||
Amounts raised from sale of intangible assets | 6,189 | — | ||||||||||
|
|
|
| |||||||||
Purchases of intangible asset | (27,615 | ) | (19,236 | ) | ||||||||
|
|
|
| |||||||||
Dividends received | 89 | 111 | ||||||||||
|
|
|
| |||||||||
Interest received | 2,848 | 4,048 | ||||||||||
|
|
|
| |||||||||
Other cash inflows (outflows) | 545 | 812 | ||||||||||
Net cash flow used in investing activities | (1,238,257 | ) | (1,100,440 | ) | ||||||||
Cash flows from (used in) financing activities | ||||||||||||
Amounts raised from issuance of shares | 23,153 | — | ||||||||||
|
|
|
| |||||||||
Amounts raised from long-term loans | 969,252 | 687,792 | ||||||||||
|
|
|
| |||||||||
Amounts raised from short-term loans | 334,500 | — | ||||||||||
|
|
|
| |||||||||
Loans Repayments | (883,402 | ) | (554,539 | ) | ||||||||
|
|
|
| |||||||||
Payments of finance lease liabilities | (59,990 | ) | (54,034 | ) | ||||||||
|
|
|
| |||||||||
Dividends paid | (192,133 | ) | (155,407 | ) | ||||||||
|
|
|
| |||||||||
Interest paid | (119,086 | ) | (128,722 | ) | ||||||||
|
|
|
| |||||||||
Other cash inflows (outflows) | 146,849 | 80,181 | ||||||||||
Net cash flows from (used in) financing activities | 219,143 | (124,729 | ) | |||||||||
Net increase (decrease) in cash and cash equivalents before effect of exchanges rate change | (256,540 | ) | (99,382 | ) | ||||||||
|
|
|
| |||||||||
Effects of variation in the exchange rate on cash and cash equivalents | (105 | ) | (613 | ) | ||||||||
|
|
|
| |||||||||
Net increase (decrease) in cash and cash equivalents | (256,645 | ) | (100,445 | ) | ||||||||
Cash and cash equivalents at beginning of year | 6 | 631,052 | 731,497 | |||||||||
|
|
|
| |||||||||
Cash and cash equivalents at end of year | 6 | 374,407 | 631,052 | |||||||||
The accompanying Notes 1 to 39 form an integral part of these consolidated financial statements.
Table of Contents
Notes to the consolidated financial statements
LAN airlines S.A. and Subsidiaries
Lan Airlines S.A. (the “Company” or “LAN”) is a public company registered with the Chilean Superintendency of Securities and Insurance (SVS), under No. 306, whose shares are quoted in Chile on the Valparaíso Stock Exchange, the Chilean Electronic Exchange and the Santiago Stock Exchange; it is also quoted on the New York Stock Exchange (NYSE) in the form of American Depositary Receipts (ADRs). Its principal business is passenger and cargo air transportation, both in the domestic markets of Chile, Peru, Argentina, Colombia and Ecuador and a series of regional and international routes in America, Europe and Oceania. These businesses are performed directly or through its subsidiaries in different countries. In addition, the Company has subsidiaries operating in the freight business in Mexico, Brazil and Colombia.
On August 13, 2010, LAN Airlines S.A. and TAM S.A. (TAM) announced they have signed a non-binding Memorandum of Understanding (MOU) in which the companies agree to proceed with their intention of carrying out their operations jointly under one parent company, to be named LATAM Airlines Group. The proposed partnership of LAN with TAM would be within the world’s 10 largest airline groups. LATAM will provide transport services for passengers and cargo to more than 115 destinations in 23 countries, operating with a fleet of over 300 aircraft, with over 40,000 employees. Both airlines will continue operating independently with their current operating licenses and brands. Within the group, TAM will continue operating as a Brazilian company with its own structure. The current holding of LAN Airlines S.A. will operate as an independent business unit within the group. On October 20, 2010, LAN and TAM announced that the operating subsidiaries of TAM had presented the structure of the transaction to the Brazilian Civil Aviation Agency (ANAC), which was approved by this agency on March 01, 2011.
On January 18, 2011 the parties of the MOU (1) and Mrs. Maria Cláudia Oliveira Amaro, Maurício Rolim Amaro, Noemy Almeida Olivera Amaro and Joao Francisco Amaro (“Amaro Family”), as the only shareholders of TEP, signed (a) an Implementation Agreement and (b) a binding Exchange Offer Agreement (“Contracts Signed”) containing the final terms and conditions of the proposed partnership between LAN and TAM.
(1) On August 13, 2010 LAN reported as a significant matter to the Superintendency of Securities and Insurance that LAN, Costa Verde Aeronáutica S.A. and Inversiones Mineras del Cantábrico S.A. (the last two, “Cueto subsidiaries”), TAM S.A. (“TAM”) and TAM Empreendimentos e Participacoes S.A. (“TEP”) signed a non-binding Memorandum of Understanding (“MOU”) for which the primary terms were outlined.
On September 21, 2011, the Court of Defense of Free Competition (“TDLC”) approved the merger between LAN and TAM, establishing fourteen mitigation measures. On October 3, 2011, LAN and TAM filed an appeal to the Supreme Court objecting three of the mitigation measures.
On December 21, 2011, the Board of LAN cited a special meeting of shareholders, citation was performed November 11, 2011, in which LAN shareholders approved, among others, the following matters:
(a)The merger of LAN with Sister Holdco S.A. and Holdco II S.A. and companies (the “Absorbed Companies”), two companies specially constituted for the purpose of the association between LAN and TAM;
(b)The change of name and the other transactions contemplated in contracts.
| Memoria Anual 2011 » Consolidated Financial Statements | | 115 |
Table of Contents
(c)The increase in capital by US$ 1,465,372,970.09 by issuing 147,355,882 common shares without par value of which:
(i) US$ 1,417,639,617.60 through the issue of 142,555,882 shares, which are intended to be exchanged for shares of the Absorbed Companies as a result of the proposed Merger, at a rate of 0.9 new shares of LAN for each share that is fully subscribed and paid for each of the absorbed companies, and that belongs to shareholders other than LAN. LAN shares that holds in the acquired companies at the time to perfect the Merger, shall have no effect;
(ii) US$ 47,733,352.49 through the issuance of 4,800,000 shares, which will go towards compensation plans for employees of the Company and its subsidiaries, as provided in Article 24 of the Corporations Law.
The Company is located in Santiago, Chile, at Avenida Américo Vespucio Sur 901, Renca.
Corporate Governance practices of the Company are set in accordance with Securities Market Law 18,045 the Corporations Law 18,046 and its regulations, and the regulations of the SVS and the laws and regulations of the United States of America and the U.S. Securities and Exchange Commission (SEC) with respect to the issuance of ADRs, and the Federal Republic of Brazil and the Comissão de Valores Mobiliários (“CVM”) of that country, as it pertains to the issuance of Brazilian Depositary Receipts (“BDRs”).
The Board of the Company is composed of nine members who are elected every two years by the ordinary shareholders meeting. The Board meets in regular monthly sessions and in extraordinary sessions as the corporate needs demand. Of the nine board members, three form part of its Directors’ Committee which fulfills both the role foreseen in the Corporations Law and the functions of the Audit Committee required by the Sarbanes Oxley Act of the United States of America and the respective regulations of the SEC.
The majority shareholder of the Company is the Cueto Group, which through Costa Verde Aeronáutica S.A., Inversiones Mineras del Cantábrico S.A. and Inversiones Nueva Costa Verde Aeronáutica Limitada, owns 33.91% of the shares issued by the Company, and is the controller of the Company in accordance with the provisions of the letter b) of Article 97 and Article 99 of the Securities Market Law, given that despite not meeting the majority of votes at shareholders’ meeting or having the power to elect a majority of the directors of the Company, there is a decisive influence in its administration.
As of December 31, 2011, the Company had a total of 1,682 registered shareholders, and 2.99% of the Company’s share capital was in the form of ADRs.
For the year ended December 31, 2011 the Company had an average of 20,870 employees, ending the year with a total of 21,838 people, with 4,170 in administration, 2,918 in maintenance, 6,194 in operations, 3,837 cabin crew, 1,969 pilots, and 2,750 in sales.
| Memoria Anual 2011 » Consolidated Financial Statements | | 116 |
Table of Contents
The significant operating subsidiaries included in these consolidated financial statements are as follows:
| As of December 31, 2011 | As of December 31, 2010 | |||||||||||||||||||||||||||||
Tax No. | Company | Country of origin | Functional Currency | Direct ownership interest % | Indirect ownership interest % | Total ownership interest % | Direct ownership interest % | Indirect ownership interest % | Total ownership interest % | |||||||||||||||||||||
96.518.860-6 | Lantours Division de Servicios Terrestres S.A. (*) | Chile | US$ | 99.9900 | 0.0100 | 100.0000 | 99.9900 | 0.0100 | 100.0000 | |||||||||||||||||||||
96.763.900-1 | Inmobiliaria Aeronáutica S.A. | Chile | US$ | 99.0100 | 0.9900 | 100.0000 | 99.0100 | 0.9900 | 100.0000 | |||||||||||||||||||||
96.969.680-0 | Lan Pax Group S.A. and Subsidiaries | Chile | US$ | 99.8361 | 0.1639 | 100.0000 | 99.8361 | 0.1639 | 100.0000 | |||||||||||||||||||||
Foreign | Lan Peru S.A. | Peru | US$ | 49.0000 | 21.0000 | 70.0000 | 49.0000 | 21.0000 | 70.0000 | |||||||||||||||||||||
Foreign | Lan Chile Investments Limited and Subsidiaries | Cayman Islands | US$ | 99.9900 | 0.0100 | 100.0000 | 99.9900 | 0.0100 | 100.0000 | |||||||||||||||||||||
93.383.000-4 | Lan Cargo S.A. | Chile | US$ | 99.8939 | 0.0041 | 99.8980 | 99.8939 | 0.0041 | 99.8980 | |||||||||||||||||||||
Foreign | Connecta Corporation | U.S.A | US$ | 0.0000 | 100.0000 | 100.0000 | 0.0000 | 100.0000 | 100.0000 | |||||||||||||||||||||
Foreign | Prime Airport Services Inc. and Subsidiary | U.S.A | US$ | 0.0000 | 100.0000 | 100.0000 | 0.0000 | 100.0000 | 100.0000 | |||||||||||||||||||||
96.951.280-7 | Transporte Aéreo S.A. | Chile | US$ | 0.0000 | 100.0000 | 100.0000 | 0.0000 | 100.0000 | 100.0000 | |||||||||||||||||||||
96.634.020-7 | Ediciones Ladeco América S.A. | Chile | CLP | 0.0000 | 100.0000 | 100.0000 | 0.0000 | 100.0000 | 100.0000 | |||||||||||||||||||||
Foreign | Aircraft International Leasing Limited | U.S.A | US$ | 0.0000 | 100.0000 | 100.0000 | 0.0000 | 100.0000 | 100.0000 | |||||||||||||||||||||
96.631.520-2 | Fast Air Almacenes de Carga S.A. | Chile | CLP | 0.0000 | 100.0000 | 100.0000 | 0.0000 | 100.0000 | 100.0000 | |||||||||||||||||||||
96,631.410-9 | Ladeco Cargo S.A. | Chile | CLP | 0.0000 | 100.0000 | 100.0000 | 0.0000 | 100.0000 | 100.0000 | |||||||||||||||||||||
Foreign | Laser Cargo S.R.L. | Argentina | ARS | 0.0000 | 100.0000 | 100.0000 | 0.0000 | 100.0000 | 100.0000 | |||||||||||||||||||||
Foreign | Lan Cargo Overseas Limited and Subsidiaries | Bahamas | US$ | 0.0000 | 100.0000 | 100.0000 | 0.0000 | 100.0000 | 100.0000 | |||||||||||||||||||||
96.969.690-8 | Lan Cargo Inversiones S.A. and Subsidiary | Chile | CLP | 0.0000 | 100.0000 | 100.0000 | 0.0000 | 100.0000 | 100.0000 | |||||||||||||||||||||
96.801.150-2 | Blue Express INTL S.A. and Subsidiary | Chile | CLP | 0.0000 | 0.0000 | 0.0000 | 0.0000 | 100.0000 | 100.0000 | |||||||||||||||||||||
96.575.810-0 | Inversiones Lan S.A. and Subsidiaries | Chile | CLP | 99.7100 | 0.0000 | 99.7100 | 99.7100 | 0.0000 | 99.7100 | |||||||||||||||||||||
| (*) | Comercial Masterhouse S.A., in July 2010, changed its name to Lantours División de Servicios Terrestres S.A. |
Additionally, the Company has proceeded to consolidate certain special purpose entities according to standards issued by the Standing Interpretations Committee of the International Accounting Standards: Consolidation - Special Purpose Entities (“SIC 12”) and private investment funds in which the parent company and subsidiaries are contributors.
All the entities controlled have been included in the consolidation.
Changes in the scope of consolidation between January 1, 2010 and December 31, 2011, are detailed below:
(1) Incorporation or acquisition of companies
| • | Florida West Technical Services LLC., direct subsidiary of Prime Airport Services S.A., in April 2010, changed its name to Lan Cargo Repair Station, LLC. |
| • | Aerovías de Integración Regional, AIRES S.A., indirect subsidiary of Lan Pax Group S.A., in November 2010, was acquired through the purchase of companies Akemi Holdings S.A. and Saipan Holdings S.A. (See Note 39) |
| • | AEROASIS S.A., direct subsidiary of Lan Pax Group S.A, was acquired in February 2011. (See Note 39) |
(2) Disposal of companies
| • | Blue Express INTL Ltda. and subsidiary, direct subsidiary of Lan Cargo S.A., were sold according to a purchase agreement signed on April 6, 2011. |
| | 117 |
Table of Contents
NOTE 2 – Summary of Significant Accounting Policies
The following describes the principal accounting policies adopted in the preparation of these consolidated financial statements.
The consolidated financial statements of Lan Airlines S.A. are for the year ended December 31, 2011 and have been prepared in accordance with International Financial Reporting Standards (IFRS) and IFRIC interpretations.
The consolidated financial statements have been prepared under the historic-cost criterion, although modified by the valuation at fair value of certain financial instruments.
The preparation of the consolidated financial statements in accordance with IFRS requires the use of certain critical accounting estimates. It also requires management to use its judgment in applying the Company’s accounting policies. Note 4 shows the areas that imply a greater degree of judgment or complexity or the areas where the assumptions and estimates are significant to the consolidated financial statements.
| Memoria Anual 2011 » Consolidated Financial Statements | | 118 |
Table of Contents
(a) At the date of these consolidated financial statements, the following accounting pronouncements were adopted by the Company, with application effective as of January 1, 2011:
Standards and amendments | Mandatory application: annual periods beginning on or after | |
Amendment to IAS 32: Financial instruments: Presentations | 02/01/2010 | |
IFRS 3 revised: Business combinations | 07/01/2010 | |
Amendment to IAS 27: Consolidated and separate financial statements | 07/01/2010 | |
IFRS 1: First-time adoptions | 07/01/2010 | |
Amendment to IFRS 1: First-time adoptions | 07/01/2011 | |
IFRS 7: Financial instruments: Disclosures | 01/01/2010 | |
Amendment to IFRS 7: Financial Instruments: Disclosures | 07/01/2011 | |
Amendment to IAS 34: Interim financial reporting | 01/01/2011 | |
Amendment to IAS 1: Presentation of financial statements | 01/01/2011 | |
IAS 24 revised: Related party disclosures | 01/01/2011 |
Interpretation | Mandatory application: annual periods beginning on or after | |
IFRIC 19: Extinguishing financial liabilities with equity Instruments | 07/01/2010 | |
Amendment to IFRIC 13: Customer loyalty programs | 01/01/2011 | |
Amendment to IFRIC 14: Pre-payments of a minimum funding requirement | 01/01/2011 |
The adoption of the standards, amendments and interpretations described above have not had a significant impact on the Company’s consolidated financial statements.
| Memoria Anual 2011 » Consolidated Financial Statements | | 119 |
Table of Contents
(b) Accounting pronouncements with applications effective as of January 1, 2012 and following:
Standards and amendments | Mandatory application: annual periods beginning on or after | |
Amendment to IAS 12: Income taxes | 01/01/2012 | |
Amendment to IAS 1: Presentation of financial statements | 07/01/2012 | |
IAS 28: Investments in associates and joint ventures | 01/01/2013 | |
IAS 27: Separate financial statements | 01/01/2013 | |
IFRS 10: Consolidated financial statements | 01/01/2013 | |
IFRS 11: Joint arrangements | 01/01/2013 | |
IFRS 12: Disclosures of interests in other entities | 01/01/2013 | |
IFRS 13: Fair value measurement | 01/01/2013 | |
Amendment to IAS 19: Employee benefits | 01/01/2013 | |
IFRS 9: Financial instruments | 01/01/2015 |
Interpretation | Mandatory application: annual periods beginning on or after | |
IFRIC 20: Stripping costs in the production phase of mine | 01/01/2013 |
The Company’s management believes that the adoption of the standards, amendments and interpretations described above would not have had a significant impact on the Company’s consolidated financial statements in the year of their first application. The Company has not early adopted any of the above standards.
| Memoria Anual 2011 » Consolidated Financial Statements | | 120 |
Table of Contents
(a) Subsidiaries
Subsidiaries are all the entities (including special-purpose entities) over which the Company has the power to control the financial and operating policies, which are generally accompanied by a holding of more than half of the voting rights. In evaluating whether the Company controls another entity, the existence and effect of potential voting rights that are currently exercisable or convertible are considered. The subsidiaries are consolidated from the date on which control is passed to the Company and they are excluded from the consolidation on the date they cease to be so controlled.
The Company uses the acquisition-cost method or purchase accounting for the purchase of subsidiaries. The cost of acquisition is the fair value of the assets delivered, the equity instruments issued and the liabilities incurred or assumed on the exchange date. The identifiable assets acquired and the liabilities and contingent liabilities assumed in a business combination are initially valued at their fair value on the date of acquisition, regardless of the extent of the non-controlling interests. The excess of the acquisition cost over the fair value of the Company’s holding in the net identifiable assets acquired is shown as goodwill. If the cost is less than the fair value of the net assets of the acquired subsidiary, the difference is recorded directly in the consolidated statement of income (Note 2.6).
Inter-company transactions, balances and unrealized gains on transactions between the Company’s entities are eliminated. Unrealized losses are also eliminated unless the transaction provides evidence of an impairment loss of the asset transferred. When necessary in order to ensure uniformity with the policies adopted by the Company, the accounting policies of the subsidiaries are modified.
(b) Transactions with non-controlling interests
The Company applies the policy of considering transactions with non-controlling interests, when not related to loss of control, as equity transactions without an effect on income.
(c) Investees or associates
Investees or associates are all entities over which Lan Airlines S.A. and Subsidiaries have a significant influence but has no control, this usually arises from a holding of between 20% and 50% of the voting rights. Investments in associates are booked using the equity method and are initially recorded at their cost.
The participation of Lan Airlines S.A. and Subsidiaries in the losses or gains after the acquisition of its investees or associates is shown in results, and its participation in post acquisition movements in reserves of investees or associates are shown in reserves.
Post-acquisition movement is adjusted against the carrying amount of the investment. When the participation of Lan Airlines S.A. and Subsidiaries in the losses of an investee or associate is equal to or more than its holding in it, including any other non guaranteed account receivable, Lan Airlines S.A. and Subsidiaries will not show the additional losses unless it has incurred obligations or made payments on behalf of the investee or associate.
Gains or losses for dilution in investees or associates are shown in the consolidated statement of income.
| Memoria Anual 2011 » Consolidated Financial Statements | | 121 |
Table of Contents
2.3. Foreign currency transactions
(a) Presentation and functional currencies
The items included in the financial statements of each of the entities of Lan Airlines S.A. and Subsidiaries are valued using the currency of the main economic environment in which the entity operates (the functional currency). The functional currency of Lan Airlines S.A. is the United States dollar which is also the presentation currency of the consolidated financial statements of Lan Airlines S.A. and Subsidiaries.
(b) Transactions and balances
Foreign currency transactions are translated to the functional currency using the exchange rates on the transaction dates. Foreign currency gains and losses resulting from the liquidation of these transactions and from the translation at the closing exchange rates of the monetary assets and liabilities denominated in foreign currency are shown in the consolidated statement of income.
(c) Group entities
The results and financial position of all the Group entities (none of which has the currency of a hyper-inflationary economy) that have a functional currency other than the presentation currency are translated to the presentation currency as follows:
(i) Assets and liabilities of each consolidated statement of financial position presented are translated at the closing exchange rate on the consolidated statement of financial position date;
(ii) The revenues and expenses of each income statement account are translated at the exchange rates prevailing on the transaction dates,
(iii) All the resultant exchange differences are shown as a separate component in net equity.
In the consolidation, exchange differences arising from the translation of a net investment in foreign entities (or local with a functional currency different to that of the parent), and of loans and other foreign currency instruments designated as hedges for these investments, are recorded within net equity. When the investment is sold, these exchange differences are shown in the consolidated statement of income as part of the loss or gain on the sale.
Adjustments to the goodwill and fair value arising from the acquisition of a foreign entity are treated as assets and liabilities of the foreign entity and are translated at the closing exchange rate.
2.4. Property, plant and equipment
The land of Lan Airlines S.A. and Subsidiaries is recognized at cost less any accumulated impairment loss. The rest of the property, plant and equipment is shown, initially and subsequently, at historic cost less the corresponding depreciation and any impairment loss, except for certain land and minor equipment that are reassessed at first adoption, according to IFRS.
The amounts of advance payments to aircraft manufacturers are capitalized by the Company under Construction in progress until receipt of the aircraft.
Subsequent costs (replacement of components, improvements, extensions, etc.) are included in the value of the initial asset or shown as a separate asset only when it is probable that the future economic benefits associated with the elements of property, plant and equipment are going to flow to the Company and the cost of the element can be determined reliably. The value of the component replaced is written off in the books at the time of replacement. The rest of the repairs and maintenance are charged to the results of the year in which they are incurred.
| Memoria Anual 2011 » Consolidated Financial Statements | | 122 |
Table of Contents
Depreciation of property, plant and equipment is calculated using the straight-line method over their estimated technical useful lives; except in the case of certain technical components which are depreciated on the basis of cycles and hours flown.
The residual value and useful life of assets are reviewed, and adjusted if necessary, once per year.
When the carrying amount of an asset is higher than its estimated recoverable amount, its value is reduced immediately to its recoverable amount (Note 2.8).
Losses and gains on the sale of property, plant and equipment are calculated by comparing the proceeds obtained with the book value and are included in the consolidated statement of income.
Computer software
Licenses for computer software acquired are capitalized on the basis of the costs incurred in acquiring them and preparing them for using the specific software. These costs are amortized over their estimated useful lives.
Expenses related to the development or maintenance of computer software which do not qualify for capitalization, are shown as an expense when incurred. Certain costs directly related to the production of unique and identifiable computer software controlled by the Company, are shown as intangible assets when they have met all the criteria for capitalization. The direct costs include the expenses of the personnel who develop the computer software and other costs directly associated.
Development costs of computer software shown as assets are amortized over their estimated useful lives.
Goodwill represents the excess of acquisition cost over the fair value of the Company’s participation in the net identifiable assets of the subsidiary on the acquisition date. Goodwill related to acquisition of subsidiaries is not amortized but tested for impairment annually and when there are indications that the carrying value may not be recoverable. Gains and losses on the sale of an entity include the book amount of the goodwill related to the entity sold.
Interest costs incurred for the construction of any qualified asset are capitalized over the time necessary for completing and preparing the asset for its intended use. Other interest costs are charged to income and expenses.
2.8. Losses for impairment of non-financial assets
Intangible assets that have an indefinite useful life, and developing IT projects, are not subject to amortization and are subject to annual testing for impairment losses. Assets subject to amortization are subjected to impairment tests whenever any event or change in circumstances indicates that the book value of the assets may not be recoverable. An impairment loss is recorded when the book value is greater than the recoverable amount. The recoverable amount of an asset is the higher of its fair value less costs to sell and its value in use. In evaluating the impairment, the assets are grouped at the lowest level for which cash flows are separately identifiable (CGUs). Non-financial assets other than goodwill that have suffered an impairment loss are subjected to a test once per year to check that there has been no reversal of the loss.
| Memoria Anual 2011 » Consolidated Financial Statements | | 123 |
Table of Contents
The Company classifies its financial instruments in the following categories: financial assets at fair value through profit and loss, loans and accounts receivable and financial assets held to maturity. The classification depends on the purpose for which the financial instruments were acquired. Management determines the classification of its financial instruments at the time of initial recognition, which occurs on the date of transaction.
(a) Financial assets at fair value through profit and loss
Financial assets at fair value through profit and loss are financial instruments held for trading and those which have been designated as at fair value through profit or loss in their initial classification. A financial asset is classified in this category if acquired mainly for the purpose of being sold in the near future or when these assets are managed and measured using fair value. Derivatives are also classified as acquired for trading unless they are designated as hedges. Assets in this category are classified as cash and cash equivalents, held for trading, and other financial assets, designated on initial recognition.
(b) Loans and accounts receivable
Loans and accounts receivable are non-derivative financial instruments with fixed or determinable payments not traded on an active market. These items are classified in current assets except for those with maturity over 12 months from the date of the consolidated statement of financial position, which are classified as non-current assets. Loans and accounts receivable are included in trade and other accounts receivable in the consolidated statement of financial position (Note 2.12).
(c) Financial assets held to maturity
Financial assets held to maturity are non-derivative financial instruments with fixed or determinable payments and fixed maturities that the Company’s management has the positive intention and capacity to hold until their maturity. Should the Company sell a not-insignificant amount of the
financial assets held to their maturity, the whole category is reclassified as available for sale. These financial instruments held to maturity are included in non-current assets, except for those maturity equal to or less than 12 months from the consolidated statement of financial position, which are classified as other current financial assets.
Regular purchases and sales of financial assets are recognized on the trade date - the date on which the Group commits to purchase or sell the asset. Investments are initially recognized at fair value plus transaction costs for all financial assets not carried at fair value through profit or loss. Financial assets carried at fair value through profit or loss are initially recognized at fair value, and transaction costs are expensed in the income statement. Financial assets are derecognized when the rights to receive cash flows from the investments have expired or have been transferred and the Group has transferred substantially all risks and rewards of ownership.
Financial assets and financial assets at fair value through profit or loss are subsequently carried at fair value. Loans and receivables are subsequently carried at amortized cost using the effective interest rate method. Held to maturity investments are carried at amortized cost using the effective interest rate.
At the date of each consolidated statement of financial position, the Company assesses if there is objective evidence that a financial asset or group of financial assets may have suffered an impairment loss. For the case of financial assets held to maturity, if there is any evidence of impairment, the amount of the provision is the difference between the book value of the assets and the present value of the estimated future cash flows, discounted at the original effective interest rate.
2.10. Derivative financial instruments and hedging activities
Derivatives are booked initially at fair value on the date the derivative contracts are signed and later they continue to be valued at their fair value. The method for booking the resultant loss or gain depends on whether the derivative has been designated as a hedging instrument and if so,
| Memoria Anual 2011 » Consolidated Financial Statements | | 124 |
Table of Contents
the nature of the item hedged. The Company designates certain derivatives as:
(a) Hedge of the fair value of recognized assets (fair value hedge);
(b) Hedge of an identified risk associated with a recognized liability or an expected highly-probable transaction (cash-flow hedge), or
(c) Derivatives that do not qualify for hedge accounting.
The Company documents, at the inception of each transaction, the relationship between the hedging instrument and the hedged item, as well as its objectives for managing risk and the strategy for carrying out various hedging transactions. The Company also documents its assessment, both at the beginning and on an ongoing basis, as to whether the derivatives used in the hedging transactions are highly effective in offsetting the changes in the fair value or cash flows of the items being hedged.
The total fair value of the hedging derivatives is booked as an other non-current financial asset or liability if the remaining maturity of the item hedged is over 12 months, and as an other current financial asset or liability if the remaining term of the item hedged is less than 12 months. Derivatives not booked as hedges are classified as other financial assets or liabilities, current in the case that their remaining maturity is less than 12 months and non-current in the case that it is more than 12 months.
(a) Fair value hedges
Changes in the fair value of designated derivatives that qualify as fair value hedges are shown in the consolidated statement of income, together with any change in the fair value of the asset or liability hedged that is attributable to the risk being hedged.
(b) Cash flow hedges
The effective portion of changes in the fair value of derivatives that are designated and qualify as cash flow hedges is shown in the statement of other comprehensive income. The loss or gain relating to the ineffective portion is recognized immediately in the consolidated statement of income under Other gains (losses).
In the case of variable interest-rate hedges, the amounts recognized in the statement of other comprehensive income are reclassified to results within financial costs at the same time the associated debts accrue interest.
For fuel price hedges, the amounts shown in the statement of other comprehensive income are reclassified to results under the line item Cost of sales to the extent that the fuel subject to the hedge is used.
When hedging instruments mature or are sold or when they do not meet the requirements to be accounted for as hedges, any gain or loss accumulated in the statement of other comprehensive income until that moment remains in the statement of other comprehensive income and is reclassified to the consolidated statement of income when the hedged transaction is finally recognized. When it is expected that the hedged transaction is no longer going to occur, the gain or loss accumulated in the statement of other comprehensive income is taken immediately to the consolidated statement of income as Other gains (losses).
| Memoria Anual 2011 » Consolidated Financial Statements | | 125 |
Table of Contents
(c) Derivatives not booked as a hedge
Certain derivatives are not booked as a hedge. The changes in fair value of any derivative instrument that is not booked as a hedge are shown immediately in the consolidated statement of income in Other gains (losses).
Inventories, detailed in Note 10, are shown at the lower of cost and their net realizable value. The cost is determined on the basis of the weighted average cost method. The net realizable value is the estimated selling price in the normal course of business, less estimated costs necessary to make the sale.
2.12. Trade and other accounts receivable
Trade accounts receivable are shown initially at their fair value and later at their amortized cost in accordance with the effective interest rate method, less the allowance for impairment losses. An allowance for impairment loss of trade accounts receivable is made when there is objective evidence that the Company will not be able to recover all the amounts due according to the original terms of the accounts receivable.
The existence of significant financial difficulties on the part of the debtor, the probability that the debtor is entering bankruptcy or financial reorganization and the default or delay in making payments are considered indicators that the receivable has been impaired. The amount of the provision is the difference between the book value of the assets and the present value of the estimated future cash flows, discounted at the original effective interest rate. The book value of the asset is reduced by the amount of the allowance and the loss is shown in the consolidated statement of income in Cost of sales. When an account receivable is written off, it is charged to the allowance account for accounts receivable.
2.13. Cash and cash equivalents
Cash and cash equivalents include cash and bank balances, time deposits in financial institutions, and other short-term and easily liquidated investments.
The common shares are classified as net equity.
Incremental costs directly attributable to the issuance of new shares or options are shown in net equity as a deduction from the proceeds obtained.
2.15. Trade and other accounts payables
Trade payables and other accounts payable are initially recognized at fair value and subsequently at amortized cost and are valued according to the method of the effective interest rate.
Financial liabilities are shown initially at their fair value, net of the costs incurred in the transaction. Later, these financial liabilities are valued at their amortized cost; any difference between the proceeds obtained (net of the necessary arrangement costs) and the repayment value, is shown in the consolidated statement of income during the term of the debt, according to the effective interest rate method.
Financial liabilities are classified in current and non-current liabilities according to the contractual payment dates of the nominal principal.
| Memoria Anual 2011 » Consolidated Financial Statements | | 126 |
Table of Contents
Deferred taxes are calculated on the temporary differences arising between the tax bases of assets and liabilities and their book values. However, if the temporary differences arise from the initial recognition of a liability or an asset in a transaction different from a business combination that at the time of the transaction does not affect the accounting result or the tax gain or loss, they are not booked. The deferred tax is determined using the tax rates (and laws) that have been enacted or substantially enacted at the end of the reporting period, and are expected to apply when the related deferred tax asset is realized or the deferred tax liability discharged.
Deferred tax assets are recognised when it is probable that there will be sufficient future tax earnings with which to compensate the temporary differences.
The Company does not record deferred tax on temporary differences arising on investments in subsidiaries and associates, provided that the opportunity to reverse the temporary differences is controlled by the Group and it is probable that the temporary differences will not reverse in the foreseeable future.
(a) Personnel vacations
The Company recognizes the expense for personnel vacations on an accrual basis.
(b) Share-based compensation
The compensation plans implemented by the granting of options for the subscription and payment of shares are shown in the consolidated financial statements in accordance with IFRS 2: Share based payments, showing the effect of the fair value of the options granted as a charge to remuneration on a straight-line basis between the date of granting such options and the date on which these become vested.
(c) Post-employment and other long-term benefits
Provisions are made for these obligations by applying the method of the actuarial value of the accrued cost, and taking into account estimates of future permanence, mortality rates and future wage increases determined on the basis of actuarial calculations. The discount rates are determined by reference to market interest-rate curves. Actuarial gains or losses are shown in results for the year when they occur.
(d) Incentives
The Company has an annual incentives plan for its personnel for compliance with objectives and individual contribution to the results. The incentives eventually granted consist of a given number or portion of monthly remuneration and the provision is made on the basis of the amount estimated for distribution.
Provisions are recognised when:
(i) The Company has a present legal or implicit obligation as a result of past events.
(ii) It is probable that some payment is going to be necessary to settle an obligation, and
(iii) The amount has been reliably estimated.
Provisions are shown at the present value of the disbursements expected to be necessary for settling the obligation using the Company’s best estimates. The pre-tax discount rate used for determining the present value reflects current market evaluations on the date of the consolidated financial statements, time value of money, as well as the specific risks related to the liability in question.
| Memoria Anual 2011 » Consolidated Financial Statements | | 127 |
Table of Contents
Revenues include the fair value of the proceeds received or to be received on sales of goods and rendering services in the ordinary course of the Company’s business. Revenues are shown net of refunds, rebates and discounts.
(a) Rendering of services
(i) Passenger and cargo transport
The Company shows revenue from the transportation of passengers and cargo once the service has been provided.
(ii) Frequent flyer program
The Company currently has a frequent flyer program called Lan Pass, whose objective is customer loyalty through the delivery of kilometers fly with the Company or its alliance partners in certain flights, use the services of entities registered with the program or make purchases with an associated credit card. The kilometers earned can be exchanged for flight tickets or other services of associated entities.
The consolidated financial statements include liabilities for this concept (deferred income), according to the estimate of the valuation established for the kilometers accumulated pending use at that date, in accordance with IFRIC 13: Customer loyalty programs.
(iii) Other revenues
The Company records revenues for other services when these have been provided.
(b) Interest income
Interest income is booked using the effective interest rate method.
(c) Dividend income
Dividend income is booked when the right to receive the payment is established.
(a) When the Company is the lessee - financial lease
The Company leases certain property, plant and equipment in which it has substantially all the risk and benefits deriving from the ownership; they are therefore classified as financial leases. Financial leases are capitalized at the start of the lease at the lower of the fair value of the asset leased and the present value of the minimum lease payments.
Every lease payment is separated between the liability component and the financial expenses so as to obtain a constant interest rate over the outstanding amount of the debt. The corresponding leasing obligations, net of financial charges, are included in Other financial liabilities. The element of interest in the financial cost is charged to the consolidated statement of income over the lease period so that it produces a constant periodic rate of interest on the remaining balance of the liability for each year. The asset acquired under a financial lease is depreciated over its useful life and is included in Property, plant and equipment.
(b) When the Company is the lessee - operating lease
Leases, in which the lessor retains an important part of the risks and benefits deriving from ownership, are classified as operating leases. Payments with respect to operating leases (net of any incentive received from the lessor) are charged in the consolidated statement of income on a straight-line basis over the term of the lease.
2.22. Non-current assets (or disposal groups) classified as held for sale
Non-current assets (or disposal groups) classified as assets held for sale are shown at the lesser of their book value and the fair value less costs to sell.
| Memoria Anual 2011 » Consolidated Financial Statements | | 128 |
Table of Contents
The costs incurred for scheduled major maintenance of the aircraft’s fuselage and engines are capitalized and depreciated until the next maintenance. The depreciation rate is determined on technical grounds, according to its use expressed in terms of cycles and flight hours.
The unscheduled maintenance of aircraft and engines, as well as minor maintenance, are charged to results as incurred.
Disbursements related to environmental protection are charged to results when incurred.
| Memoria Anual 2011 » Consolidated Financial Statements | | 129 |
Table of Contents
NOTE 3 – Financial Risk Management
The Company’s activities are exposed to different financial risks: (a) market risk, (b) credit risk, and (c) liquidity risk. The Company’s global risk management program is focused on uncertainty in the financial markets and tries to minimize the potential adverse effects on the net margin. The Company uses derivatives to hedge part of these risks.
(a) Market risk
Due to the nature of its operations, the Company is exposed to market risks such as:
(i) fuel-price risk, (ii) interest-rate risk, and (iii) local exchange-rate risk. In order to fully or partially hedge all of these risks, the Company operates with derivative instruments to fix or limit rises in the underlying assets.
(i) Fuel-price risk:
Fluctuations in fuel prices largely depend on the global supply and demand for oil, decisions taken by Organization of Petroleum Exporting Countries (“OPEC”), global refining capacity, stock levels maintained, and weather and geopolitical factors.
The Company purchases an aircraft fuel called Jet Fuel grade 54. There is a benchmark price in the international market for this underlying asset, which is US Gulf Coast Jet 54. However, the futures market for this asset has a low liquidity index and as a result the Company hedges its exposure using West Texas Intermediate (“WTI”) crude and distillate Heating Oil (“HO”), which have a high correlation with Jet Fuel and are highly liquid assets and therefore have advantages in comparison to the use of the U.S. Gulf Coast Jet 54 index.
During 2011, the Company booked gains of US$ 39.9 million on fuel hedging. During 2010, the Company recognized gains of US$ 1.0 million for the same reason.
At December 31, 2011, the market value of its fuel positions amounted to US$ 30.6 million (positive). At December 31, 2010, this market value was US$ 45.8 million (positive). The following tables show the notional value of the purchase positions together with the derivatives contracted for the different years:
Positions as of December 31, 2011 (*) | Maturities | |||||||||||||||
| Q112 | Q212 | Q312 | Total | |||||||||||||
Volume (thousands of barrels WTI) | 1,800 | 1,134 | 693 | 3,627 | ||||||||||||
Contracted future price (US$ per barril)(**) | 95 | 92 | 89 | 93 | ||||||||||||
|
|
|
|
|
|
|
| |||||||||
Total (ThUS$) | 171,000 | 104,328 | 61,677 | 377,311 | ||||||||||||
|
|
|
|
|
|
|
| |||||||||
Approximate percentage of hedge (of expected consumption value) | 50 | % | 33 | % | 19 | % | 34 | % | ||||||||
| (*) | The volume shown in the table considers all the hedging instruments (swaps and options). The contracted future price considers the volume covered with swaps in addition to options that are expected to be exercised. |
| (**) | Weighted average between collars and asset options |
| Memoria Anual 2011 » Consolidated Financial Statements | | 130 |
Table of Contents
Positions as of December 31, 2010 | Maturities | |||||||||||||||||||
| Q111 | Q211 | Q311 | Q411 | Total | ||||||||||||||||
Volume (thousands of barrels WTI) | 1,848 | 918 | 687 | 324 | 3,777 | |||||||||||||||
Contracted future price (US$ per barril)(*) | 82 | 81 | 84 | 90 | 83 | |||||||||||||||
|
|
|
|
|
|
|
|
|
| |||||||||||
Total (ThUS$) | 151,536 | 74,358 | 57,708 | 29,160 | 313,491 | |||||||||||||||
|
|
|
|
|
|
|
|
|
| |||||||||||
Approximate percentage of hedge (of expected consumption value) | 54 | % | 27 | % | 19 | % | 8 | % | 26 | % | ||||||||||
| (*) | Weighted average between collars and asset options |
Sensitivity analysis
A drop in fuel price positively affects the Company through a reduction in costs. However, this drop also negatively affects contracted positions as these are acquired to protect the Company against the risk of a rise in price. The policy therefore is to maintain a hedge-free percentage in order to be competitive in the event of a drop in price.
As the current positions do not represent changes in cash flows, but a variation in the exposure to the market value, the current hedge positions have no impact on income (they are booked as cash flow hedge contracts, so a
variation in the fuel price has an impact on the Company’s net equity).
The following table shows the sensitivity analysis of the financial instruments according to reasonable changes in the fuel price and their effect on equity. The term of the projection was defined until the end of the last current fuel hedge contract, being the last business day of the third quarter of 2012. The calculations were made considering a parallel movement of US$ 5 per barrel in the curve of the WTI crude futures benchmark price at December 31, 2011 and the end of December 31, 2010.
Benchmarck price | Positions as of December 31, 2011 effect on equity (millions of US$) | Positions as of December 31, 2010 effect on equity (millions of US$) | ||
+5 | +16.5 | +16.7 | ||
-5 | -13.8 | -15.7 |
| Memoria Anual 2011 » Consolidated Financial Statements | | 131 |
Table of Contents
The Company seeks to reduce the risk of fuel price rises to ensure it is not left at a disadvantage compared to its competitors in the event of a sharp price fall. The Company therefore uses hedge instruments like swaps, call options and collars to partially hedge the fuel volumes consumed.
According to the requirements of IAS 39, during the presented years, the Company has not recorded amounts for ineffectiveness in the consolidated income statement.
Given the fuel hedge structure during 2011, which considers a hedge-free portion, a vertical fall by US$ 5 in the WTI benchmark price (the monthly daily average), would have meant a decrease of approximately US$ 42.5 million in the cost of total fuel consumption for the same period. For the same year, a vertical rise by US$ 5 in the WTI benchmark price (the monthly daily average) would have meant an impact of approximately US$ 39.5 million of increased fuel costs for the same period.
(ii) Cash flow interest-rate risk:
The fluctuation in interest rates depends heavily on the state of the global economy. An improvement in long-term economic prospects moves long-term rates upward while a drop causes a decline through market effects. However, if we consider government intervention in periods of economic recession, it is usual to reduce interest rates to stimulate aggregate demand by making credit more accessible and increasing production (in the
same way interest rates are raised in periods of economic expansion). The present uncertainty about how the market and governments will react, and thus how interest rates will change, creates a risk related to the Company’s debt at floating interest rates and its investments.
Cash flow interest rate risk equates to the risk of future cash flows of the financial instruments due to the fluctuation in interest rates on the market. The Company’s exposure to risks of changes in market interest rates is mainly related to long-term obligations with variable interest rates.
In order to reduce the risk of an eventual rise in interest rates, the Company has signed interest-rate swap and call option contracts in order to eliminate more than 82% of its exposure to interest-rate fluctuations. The Company is therefore exposed to a small portion of the fluctuations in the 90 days, 180 days and 360 days London Inter Bank Offer Rate (LIBOR).
The following table shows the sensitivity of changes in financial obligations that are not hedged against interest-rate variations. These changes are considered reasonably possible based on current market conditions.
Increase (decrease) in libor 3 months | Positions as of December 31, earnings (millions of US$) | Positions as of December 31, 2010 effect on pre-tax earnings (millions of US$) | ||
+100 basis points | -3.06 | -1.18 | ||
-100 basis points | +3.06 | +1.18 |
| Memoria Anual 2011 » Consolidated Financial Statements | | 132 |
Table of Contents
Changes in market conditions produce a change in the valuation of current financial instruments hedging interest rates, causing an effect on the Company’s equity (because they are booked as cash-flow hedges). These changes
are considered reasonably possible based on current market conditions. The calculations were made increasing (decreasing) vertically 100 basis points of the three-month Libor futures curve.
Increase (decrease) in libor 3 months | Positions as of December 31, | Positions as of December 31, | ||
+100 basis points | 40.70 | 42.39 | ||
-100 basis points | (43.20) | (45.35) |
There are limitations in the method used for the sensitivity analysis and relate to those provided by the market because the levels indicated by the futures curves are not necessarily met and will change in each year.
In accordance with the requarements of IAS 39, during the year presented, the Company has not recorded amounts for ineffectiveness in the consolidated income statement.
(iii) Local exchange-rate risk:
The functional currency used by the parent Company is the US dollar in terms of setting prices for its services, the composition of its statement of financial position and effects on its operating income. The Company sells most of its services in US dollars or prices equivalent to the US dollar, and a large part of its expenses are denominated in US dollars or equivalents to the US dollar, particularly fuel costs, aeronautic charges, aircraft leases, insurance and aircraft components and accessories. Remuneration expenses are denominated in local currencies.
The Company maintains its cargo and passenger business tariffs in US dollars. There is a mix in the domestic markets as sales in Peru are in local currency but the prices are indexed to the US dollar. In Chile and Argentina, tariffs are in local currency without any kind of indexation. In the case of the domestic business in Ecuador, both tariffs and sales are in US dollar. The Company is therefore exposed to fluctuations in the different currencies, mainly: Chilean peso, Argentine peso, Uruguayan peso, Euro, Peruvian sol, Brazilian real, Colombian peso, Australian dollar and New Zealand dollar; of these, the largest exposure is in Chilean pesos.
The Company manages its exposure to foreign currency risk through hedging selected balances using forward exchange contracts and cross currency swaps.
| Memoria Anual 2011 » Consolidated Financial Statements | | 133 |
Table of Contents
(b) Credit risk
Credit risk occurs when the counterparty to a financial agreement or instrument fails to discharge an obligation due or financial instrument, leading to a loss in market value of a financial instrument (only financial assets, not liabilities).
The Company is exposed to credit risk due to its operative and financial activities, including deposits with banks and financial institutions, investments in other kinds of instruments, exchange-rate transactions and the contracting of derivative instruments or options.
(i) Financial activities
Cash surpluses that remain after the financing of assets necessary for the operation are invested according to credit limits approved by the Company’s Board, mainly in time deposits with different financial institutions, short- term mutual funds, and easily-liquidated corporate and sovereign bonds with short remaining maturities. These investments are booked as cash and cash equivalents and as investments held to maturity.
In order to reduce counterparty risk and to ensure that the risk assumed is known and managed by the Company, investments are diversified among different banking institutions (both local and international). The Company evaluates the credit standing of each counterparty and the levels of investment, based on (i) their credit rating, (ii) the equity size of the counterparty, and (iii) investment limits according to the Company’s level of liquidity. According to these three parameters, the Company chooses the most restrictive parameter of the previous three and based on this, establishes limits for operations with each counterparty.
The Company has no guarantees to mitigate this exposure.
(ii) Operational activities
The Company has four large sales “clusters”: travel agencies, cargo agents, airlines and credit-card administrators. The first three are governed by IATA (International Air Transport Association), international organization comprising most of the airlines that represent over 90% of scheduled commercial traffic and one of its main objectives is to regulate the financial transactions between airlines and travel agents and cargo. When an agency or airline does not pay their debt, they are excluded from operating with IATA’s member airlines. In the case of credit-card administrators, they are fully guaranteed by the issuing institutions.
The exposure consists of the term granted, which fluctuates between 1 and 45 days.
One of the tools the Company uses for reducing credit risk is to participate in global entities related to the industry, such as IATA, Business Sales Processing (BSP), Cargo Account Settlement Systems (“CASS”), IATA Clearing House (“ICH”) and banks (credit cards). These institutions fulfill the role of collectors and distributors between airlines and travel and cargo agencies. In the case of the Clearing House, it acts as an offsetting entity between airlines for the services provided between them. A reduction in term and implementation of guarantees has been achieved through these entities.
Credit quality of financial assets
The external credit evaluation system used by the Company is provided by IATA. Internal systems are also used for particular evaluations or specific markets based on trade reports available on the local market. The internal classification system is complementary to the external one, i.e. for agencies or airlines not members of IATA, the internal demands are greater. The bad-debt rate in the principal countries where the Company has a presence is insignificant.
| Memoria Anual 2011 » Consolidated Financial Statements | | 134 |
Table of Contents
(c) Liquidity risk
Liquidity risk represents the risk that the Company has no funds to meet its obligations.
Because of the cyclical nature of the business, the operation, and its investment and financing needs related to the acquisition of new aircraft and renewal of its fleet, plus the financing needs related to market-risk hedges, the Company requires liquid funds to meet its payment obligations.
The Company therefore manages its cash and cash equivalents and its financial assets, matching the term of investments with those of its obligations. The Company’s policy is that the average term of its investments may not exceed the average term of its obligations. This cash and cash equivalents position is invested in highly-liquid short-term instruments through first-class financial entities.
The Company has future obligations related to financial leases, operating leases, maturities of other bank borrowings, derivative contracts and aircraft purchase contracts.
| Memoria Anual 2011 » Consolidated Financial Statements | | 135 |
Table of Contents
Class of liability for the analysis of liquidity risk ordered by date of maturity as of December 31, 2011
| More than | ||||||||||||||||||||||||||||||||||||||||||||||||||||||
Class of | Debtor Tax No. 33 | Debtor | Debtor country | Creditor Tax No. | Creditor | Creditor country | Currency | Up to 90 days ThUS$ | 90 days to one year ThUS$ | one to three years ThUS$ | three to five years ThUS$ | More than five years ThUS$ | Total ThUS$ | Amortization | Effective rate % | Nominal value ThUS$ | Nominal rate % | |||||||||||||||||||||||||||||||||||||
Guaranteed obligations | 89.862.200-2 | Lan Airlines S.A. | Chile | 0-E | ING | U.S.A. | US $ | 4,025 | 12,076 | 32,192 | 32,213 | 60,438 | 140,944 | Quarterly | 5.69 | % | 113,193 | 5.01 | % | |||||||||||||||||||||||||||||||||||
| Lan Airlines S.A. | Chile | 0-E | CREDITE AGRICOLE | France | US $ | 21,249 | 61,560 | 67,744 | 33,826 | 7,228 | 191,607 | Quarterly | 4.05 | % | 182,041 | 4.05 | % | |||||||||||||||||||||||||||||||||||||
| Lan Airlines S.A. | Chile | 0-E | PEFCO | U.S.A. | US $ | 15,633 | 46,900 | 125,060 | 106,833 | 124,408 | 418,834 | Quarterly | 5.18 | % | 354,360 | 4.61 | % | |||||||||||||||||||||||||||||||||||||
| Lan Airlines S.A. | Chile | 0-E | BNP PARIBAS | U.S.A. | US $ | 19,616 | 59,263 | 159,420 | 161,548 | 252,865 | 652,712 | Quarterly | 4.27 | % | 557,517 | 3.81 | % | |||||||||||||||||||||||||||||||||||||
| Lan Airlines S.A. | Chile | 0-E | WELLS FARGO | U.S.A. | US $ | 5,615 | 16,828 | 44,837 | 44,749 | 113,352 | 225,381 | Quarterly | 3.64 | % | 188,942 | 3.53 | % | |||||||||||||||||||||||||||||||||||||
| Lan Airlines S.A. | Chile | 0-E | CITIBANK | U.S.A. | US $ | 13,585 | 41,065 | 110,232 | 111,306 | 290,463 | 566,651 | Quarterly | 2.94 | % | 497,707 | 2.61 | % | |||||||||||||||||||||||||||||||||||||
| Lan Airlines S.A. | Chile | 97.036.000-K | SANTANDER | Chile | US $ | 5,436 | 16,577 | 44,721 | 45,461 | 143,675 | 255,870 | Quarterly | 1.14 | % | 239,882 | 1.01 | % | |||||||||||||||||||||||||||||||||||||
| Lan Airlines S.A. | Chile | 0-E | JP MORGAN | U.S.A. | US $ | 4,692 | 14,329 | 38,755 | 39,580 | 143,763 | 241,119 | Quarterly | 1.09 | % | 226,295 | 0.94 | % | |||||||||||||||||||||||||||||||||||||
| Lan Airlines S.A. | Chile | 0-E | BTMU | U.S.A. | US $ | 2,227 | 6,817 | 18,434 | 18,807 | 69,085 | 115,370 | Quarterly | 1.41 | % | 105,863 | 1.26 | % | |||||||||||||||||||||||||||||||||||||
| Lan Airlines S.A. | Chile | 0-E | APPLEBANK | U.S.A. | US $ | 757 | 2,330 | 6,322 | 6,469 | 23,952 | 39,830 | Quarterly | 1.37 | % | 36,541 | 1.22 | % | |||||||||||||||||||||||||||||||||||||
Financial leases | 89.862.200-2 | Lan Airlines S.A. | Chile | 0-E | ING | U.S.A. | US $ | 7,332 | 21,559 | 43,281 | 39,703 | 9,324 | 121,199 | Quarterly | 3.94 | % | 110,576 | 3.73 | % | |||||||||||||||||||||||||||||||||||
| Lan Airlines S.A. | Chile | 0-E | CREDITE AGRICOLE | France | US $ | 2,311 | 7,020 | 20,099 | 20,901 | 35,093 | 85,424 | Quarterly | 1.46 | % | 79,428 | 1.46 | % | |||||||||||||||||||||||||||||||||||||
| Lan Airlines S.A. | Chile | 0-E | CITIBANK | U.S.A. | US $ | 1,809 | 6,140 | 19,663 | — | — | 27,612 | Quarterly | 1.85 | % | 26,426 | 1.82 | % | |||||||||||||||||||||||||||||||||||||
| Lan Airlines S.A. | Chile | 0-E | S.CHARTERED | U.S.A. | US $ | 1,733 | 5,435 | 7,538 | — | — | 14,746 | Quarterly | 1.56 | % | 14,481 | 1.56 | % | |||||||||||||||||||||||||||||||||||||
| Lan Airlines S.A. | Chile | 0-E | PEFCO | U.S.A. | US $ | 4,204 | 12,617 | 33,636 | 33,629 | 14,736 | 98,822 | Quarterly | 5.22 | % | 85,948 | 4.68 | % | |||||||||||||||||||||||||||||||||||||
Bank loans | 89.862.200-2 | Lan Airlines S.A. | Chile | 97.036.000-K | SANTANDER | Chile | US $ | — | 12,704 | — | — | — | 12,704 | Semiannual | 2.35 | % | 12,500 | 2.35 | % | |||||||||||||||||||||||||||||||||||
| Lan Airlines S.A. | Chile | 97.004.000-5 | BANCO DE CHILE | Chile | US $ | 292 | 30,291 | — | — | — | 30,583 | Semiannual | 1.91 | % | 30,000 | 1.91 | % | |||||||||||||||||||||||||||||||||||||
| Lan Airlines S.A. | Chile | 97.006.000-6 | BCI | Chile | US $ | 50,187 | — | — | — | — | 50,187 | Quarterly | 1.51 | % | 50,000 | 1.51 | % | |||||||||||||||||||||||||||||||||||||
| Lan Airlines S.A. | Chile | 97.030.000-7 | ESTADO | Chile | US $ | — | 876 | 45,532 | — | — | 46,408 | Semiannual | 1.82 | % | 44,848 | 1.81 | % | |||||||||||||||||||||||||||||||||||||
| Lan Airlines S.A. | Chile | 97.032.000-8 | BBVA | Chile | US $ | — | 61,297 | — | — | — | 61,297 | Anual | 2.21 | % | 60,000 | 2.13 | % | |||||||||||||||||||||||||||||||||||||
Other loans | 89.862.200-2 | Lan Airlines S.A. | Chile | 97.036.000-K | SANTANDER | Chile | US $ | 1,145 | 2,314 | 203,779 | — | — | 207,238 | — | 2.55 | % | 202,899 | 2.55 | % | |||||||||||||||||||||||||||||||||||
| Lan Airlines S.A. | Chile | 0-E | BOEING | U.S.A. | US $ | — | 5,884 | 271,307 | — | — | 277,191 | — | 1.87 | % | 269,965 | 1.87 | % | |||||||||||||||||||||||||||||||||||||
| Lan Airlines S.A. | Chile | — | OTHERS | — | US $ | — | — | 31,081 | 31,006 | — | 62,087 | Quarterly | 2.43 | % | 58,960 | 2.43 | % | |||||||||||||||||||||||||||||||||||||
Derivatives | 89.862.200-2 | Lan Airlines S.A. | Chile | — | OTHERS | — | US $ | 10,191 | 28,940 | 70,303 | 41,382 | 8,620 | 159,436 | — | 154,410 | — | ||||||||||||||||||||||||||||||||||||||
Non-hedging derivatives | 89.862.200-2 | Lan Airlines S.A. | Chile | — | OTHERS | — | US $ | 1,357 | 3,896 | 8,998 | 1,586 | — | 15,837 | — | — | 15,380 | — | |||||||||||||||||||||||||||||||||||||
| | 136 |
Table of Contents
Class of | Debtor Tax No. 33 | Debtor | Debtor country | Creditor Tax No. | Creditor | Creditor country | Currency | Up to 90 days ThUS$ | 90 days to one year ThUS$ | one to three years ThUS$ | three to five years ThUS$ | More than five years ThUS$ | Total ThUS$ | Amortization | Effective rate % | Nominal value ThUS$ | Nominal rate % | |||||||||||||||||||||||||||||||||||
Accounts payable and other accounts payables | — | Lan Airlines S.A. and subsidiaries | Several | — | sundry | — | US $ | 411,908 | 25,920 | — | — | — | 437,828 | — | — | 437,828 | — | |||||||||||||||||||||||||||||||||||
| CLP | 15,408 | — | — | — | — | 15,408 | — | — | 15,408 | — | ||||||||||||||||||||||||||||||||||||||||||
| Others | 78,245 | — | — | — | — | 78,245 | — | — | 78,245 | — | ||||||||||||||||||||||||||||||||||||||||||
Accounts payable, non-current | — | Lan Airlines S.A. and subsidiaries | Several | — | sundry | — | US $ | — | — | 36,000 | — | — | 36,000 | — | — | 36,000 | — | |||||||||||||||||||||||||||||||||||
Accounts payable related parties | — | Lan Airlines S.A. and subsidiaries | Several | 96.847.880-K | Lufthansa Lan Technical Training S.A. | — | US $ | 147 | — | — | — | — | 147 | — | — | 147 | — | |||||||||||||||||||||||||||||||||||
| Several | 96.921.070-3 | Austral Sociedad Concesionarias S.A. | CLP | 2 | — | 2 | — | — | 2 | — | ||||||||||||||||||||||||||||||||||||||||||
| Several | 78.591.370-3 | Bethia S.A. and Sub- sidiaries | CLP | 116 | — | 116 | — | — | 116 | — | ||||||||||||||||||||||||||||||||||||||||||
| Several | Foreing | Inversora Aeronaútica Argentina | US $ | 102 | — | 102 | — | — | 102 | — | ||||||||||||||||||||||||||||||||||||||||||
|
|
|
|
|
|
|
|
|
|
|
|
|
|
|
| |||||||||||||||||||||||||||||||||||||
Total | 679,364 | 502,638 | 1,438,934 | 768,999 | 1,297,002 | 4,686,937 | 4,286,010 | — | ||||||||||||||||||||||||||||||||||||||||||||
|
|
|
|
|
|
|
|
|
|
|
|
|
|
|
| |||||||||||||||||||||||||||||||||||||
| | 137 |
Table of Contents
Class of liability for the analysis of liquidity risk ordered by date of maturity as of December 31, 2010
| More than | ||||||||||||||||||||||||||||||||||||||||||||||||||||
Class of | Debtor Tax | Debtor | Debtor | Creditor Tax No. | Creditor | Creditor | Currency | Up to 90 days ThUS$ | 90 days to one year ThUS$ | one to three years ThUS$ | three to five years ThUS$ | More than five years ThUS$ | Total ThUS$ | Amortization | Effective rate % | Nominal value ThUS$ | Nominal rate % | |||||||||||||||||||||||||||||||||||
Guaranteed obligations | 89.862.200-2 | Lan Airlines S.A. | Chile | 0-E | ING | U.S.A. | US $ | 7,425 | 22,305 | 53,471 | 47,128 | 93,325 | 223,654 | Quarterly | 5.19 | % | 181,029 | 4.69 | % | |||||||||||||||||||||||||||||||||
| Lan Airlines S.A. | Chile | 0-E | CALYON | France | US $ | 21,045 | 63,352 | 130,785 | 39,186 | 20,916 | 275,284 | Quarterly | 4.47 | % | 256,417 | 4.47 | % | |||||||||||||||||||||||||||||||||||
| Lan Airlines S.A. | Chile | 0-E | PEFCO | U.S.A. | US $ | 19,838 | 59,513 | 158,688 | 149,595 | 209,374 | 597,008 | Quarterly | 5.16 | % | 497,692 | 4.60 | % | |||||||||||||||||||||||||||||||||||
| Lan Airlines S.A. | Chile | 0-E | BNP PARIBAS | U.S.A. | US $ | 22,831 | 68,726 | 184,673 | 186,931 | 385,438 | 848,599 | Quarterly | 4.49 | % | 707,306 | 4.00 | % | |||||||||||||||||||||||||||||||||||
| Lan Airlines S.A. | Chile | 0-E | WELLS FARGO | U.S.A. | US $ | 5,626 | 16,842 | 44,872 | 44,796 | 135,714 | 247,850 | Quarterly | 3.64 | % | 204,392 | 3.53 | % | |||||||||||||||||||||||||||||||||||
| Lan Airlines S.A. | Chile | 0-E | CITIBANK | U.S.A. | US $ | 8,984 | 27,039 | 72,767 | 73,806 | 206,771 | 389,367 | Quarterly | 3.93 | % | 326,235 | 3.48 | % | |||||||||||||||||||||||||||||||||||
| Lan Airlines S.A. | Chile | 0-E | SANTANDER | Spain | US $ | 2,919 | 8,859 | 24,242 | 25,206 | 95,708 | 156,934 | Quarterly | 0.95 | % | 148,741 | 0.83 | % | |||||||||||||||||||||||||||||||||||
Financial leases | 89.862.200-2 | Lan Airlines S.A. | Chile | 0-E | ING | U.S.A. | US $ | 3,899 | 11,685 | 30,440 | 25,695 | 11,675 | 83,394 | Quarterly | 4.08 | % | 77,096 | 3.71 | % | |||||||||||||||||||||||||||||||||
| Lan Airlines S.A. | Chile | 0-E | CALYON | France | US $ | 2,249 | 6,786 | 18,376 | 22,613 | 43,431 | 93,455 | Quarterly | 1.27 | % | 87,337 | 1.27 | % | |||||||||||||||||||||||||||||||||||
| Lan Airlines S.A. | Chile | 0-E | CITIBANK | U.S.A. | US $ | 1,692 | 5,249 | 26,758 | — | — | 33,699 | Quarterly | 1.32 | % | 32,921 | 1.27 | % | |||||||||||||||||||||||||||||||||||
| Lan Airlines S.A. | Chile | 0-E | S.CHARTERED | U.S.A. | US $ | 3,858 | 11,873 | 14,628 | — | — | 30,359 | Quarterly | 1.28 | % | 29,864 | 1.25 | % | |||||||||||||||||||||||||||||||||||
Bank loans | 89.862.200-2 | Lan Airlines S.A. | Chile | 0-E | SANTANDER MADRID | Spain | US $ | — | 26,125 | 12,726 | — | — | 38,851 | Semiannual | 3.64 | % | 37,500 | 3.55 | % | |||||||||||||||||||||||||||||||||
Bank loans | 89.862.200-2 | Lan Airlines S.A. | Chile | 97.023.000-9 | CORPBANCA | Chile | CLP | 13,479 | 13,158 | 12,713 | — | — | 39,350 | Semiannual | 6.53 | % | 36,858 | 6.44 | % | |||||||||||||||||||||||||||||||||
| Lan Airlines S.A. | Chile | 76.645.030-K | ITAU | Chile | CLP | — | 21,653 | 10,332 | — | — | 31,985 | Semiannual | 6.67 | % | 29,967 | 6.60 | % | |||||||||||||||||||||||||||||||||||
| Lan Airlines S.A. | Chile | 97.006.000-6 | BCI | Chile | CLP | — | 38,144 | 18,188 | — | — | 56,332 | Semiannual | 6.71 | % | 52,723 | 6.63 | % | |||||||||||||||||||||||||||||||||||
| Lan Airlines S.A. | Chile | 97.030.000-7 | ESTADO | Chile | CLP | — | 47,521 | 22,666 | — | — | 70,187 | Semiannual | 6.65 | % | 65,704 | 6.59 | % | |||||||||||||||||||||||||||||||||||
| Aires S.A | Colombia | 0-E | HELM | Colombia | COP | 3,944 | — | — | — | — | 3,944 | 30 days | 3.37 | % | 3,936 | 3.37 | % | |||||||||||||||||||||||||||||||||||
Other loans | 89.862.200-2 | Lan Airlines S.A. | Chile | 0-E | SANTANDER MADRID | Spain | US $ | 586 | 1,587 | 72,962 | — | — | 75,135 | — | 3.29 | % | 72,962 | 3.29 | % | |||||||||||||||||||||||||||||||||
| Lan Airlines S.A. | Chile | 0-E | BOEING | U.S.A. | US $ | 1,862 | 1,207 | 106,665 | — | — | 109,734 | — | 2.04 | % | 106,209 | 2.04 | % | |||||||||||||||||||||||||||||||||||
Derivatives | 89.862.200-2 | Lan Airlines S.A. | Chile | — | OTHERS | — | US $ | 6,018 | 22,331 | 61,273 | 24,643 | 4,751 | 119,016 | — | — | 115,189 | — | |||||||||||||||||||||||||||||||||||
Non-hedging derivatives | 89.862.200-2 | Lan Airlines S.A. | Chile | — | OTHERS | — | US $ | 1,461 | 4,239 | 9,891 | 5,608 | — | 21,199 | — | — | 20,703 | — | |||||||||||||||||||||||||||||||||||
Accounts payable and other accounts payables | Lan Airlines S.A. and subsidiaries Several | — | Sundry | — | US $ | 27,327 | 26,002 | — | — | — | 303,329 | — | — | 303,329 | — | |||||||||||||||||||||||||||||||||||||
| CLP | 28,058 | — | — | — | — | 28,058 | — | — | 28,058 | — | ||||||||||||||||||||||||||||||||||||||||||
| Others | 169,307 | — | — | — | — | 169,307 | — | — | 169,307 | — | ||||||||||||||||||||||||||||||||||||||||||
Accounts payable, non-current | Lan Airlines S.A. and subsidiaries Several | — | Sundry | — | US $ | — | — | 54,000 | — | — | 54,000 | — | — | 54,000 | — | |||||||||||||||||||||||||||||||||||||
Accounts payable related parties | Lan Airlines S.A. and subsidiaries Several | 96.847.880-K | Lufthansa Lan Technical Training S.A. | — | US $ CLP | 110 74 | — | — | — | — | 110 74 | — | — | 110 74 | — | |||||||||||||||||||||||||||||||||||||
|
|
|
|
|
|
|
|
|
|
|
|
|
| |||||||||||||||||||||||||||||||||||||||
Total | 602,592 | 504,196 | 1,141,116 | 645,207 | 1,207,103 | 4,100,214 | 3,645,660 | |||||||||||||||||||||||||||||||||||||||||||||
|
|
|
|
|
|
|
|
|
|
|
|
|
| |||||||||||||||||||||||||||||||||||||||
| | 138 |
Table of Contents
The Company has fuel and interest rate hedging strategies involving derivatives contracts with different financial institutions. The Company has margin facilities with each financial institution in order to regulate the mutual exposure produced by changes in the market valuation of the derivatives.
At the end of 2010, the Company had provided US$ 78.5 million in derivative margin guarantees, for cash and stand-by letters of credit. At the end of December 31, 2011, the Company had provided US$ 117.2 million in guarantees for cash and stand-by letters of credit. The increase was due to the maturity and acquisition of fuel and interest rate contracts, rising fuel prices and falling interest rates.
The Company’s objectives, with respect to the management of capital, are (i) to safeguard it in order to continue as an on-going business, (ii) to seek a return for its shareholders, and (iii) to maintain an optimum capital structure and reduce its costs.
In order to maintain or adjust the capital structure, the Company may adjust the amount of the dividends payable to shareholders, return capital to shareholders, issue new shares or sell assets to reduce debt.
The Company monitors the adjusted leverage ratio, in line with industry practice. This index is calculated as net adjusted debt divided by the sum of adjusted equity and net adjusted debt. Net adjusted debt is total financial debt plus 8 times the operating lease payments of the last 12 months, less total cash (measured as the sum of cash and cash equivalents plus marketable securities). Capital is the amount of net equity without the impact of the market value of derivatives, plus net adjusted debt.
Currently the Company’s strategy, which has not changed since 2007, has consisted of maintaining a leverage ratio of between 70% and 80% and an international credit rating of higher than BBB- (the minimum required for being considered investment grade). The leverage ratios as of December 31, 2011, and December 31, 2010, were as follows:
| As of December 31, 2011 ThUS$ | As of December 31, 2010 ThUS$ | |||||||
Total financial loans | 3,788,272 | 3,259,666 | ||||||
|
|
|
| |||||
Last twelve months Operating lease payment x 8 | 1,393,576 | 788,704 | ||||||
Less: | ||||||||
Cash and marketable securities | (472,499 | ) | (737,093 | ) | ||||
|
|
|
| |||||
Total net adjusted debt | 4,709,349 | 3,311,277 | ||||||
|
|
|
| |||||
Net Equity | 1,445,324 | 1,296,814 | ||||||
|
|
|
| |||||
Cash flow hedging reserve | 140,556 | 107,050 | ||||||
Adjusted equity | 1,585,880 | 1,403,864 | ||||||
|
|
|
| |||||
Total adjusted debt and equity | 6,295,229 | 4,715,141 | ||||||
|
|
|
| |||||
Adjusted leverage | 74.8 | % | 70.2 | % | ||||
|
|
|
| |||||
| Memoria Anual 2011 » Consolidated Financial Statements | | 139 |
Table of Contents
![]()
At December 31, 2011, the Company maintained financial instruments that should be recorded at fair value. These include:
| • | Investments in short-term Mutual Funds (cash equivalent), |
| • | Interest rate derivative contracts, |
| • | Fuel derivative contracts, |
| • | Currency derivative contracts, and |
| • | Private investment funds. |
The Company has classified the fair value measurement using a hierarchy that reflects the level of information used in the assessment. This hierarchy consists of 3 levels (I) fair value based on quoted prices in active markets for identical assets or liabilities, (II) fair value calculated through valuation methods based on inputs other than quoted prices included within level 1 that are observable
for the asset or liability, either directly (that is, as prices) or indirectly (that is, derived from prices) and (III) fair value based on inputs for the asset or liability that are not based on observable market data.
The fair value of financial instruments traded in active markets, such as investments acquired for trading, is based on quoted market prices at the close of the year using the current price of the buyer. The fair value of financial assets not traded in active markets (derivative contracts) is determined using valuation techniques that maximize use of available market information. Valuation techniques generally used by the Company are quoted market prices of similar instruments and / or estimating the present value of future cash flows using forward price curves of the market at year end.
The following table shows the classification of financial instruments at fair value at December 31, 2011 depending on the level of information used in the assessment:
| Fairvalue At December 31, 2011 ThUS$ | Fair value measurements using values considered as | |||||||||||||||
| Level I ThUS$ | Level II ThUS$ | Level III ThUS$ | ||||||||||||||
Assets | ||||||||||||||||
Short-term mutual funds | 156,334 | 156,334 | — | — | ||||||||||||
Fair value of interest rate derivatives | 73 | — | 73 | — | ||||||||||||
Fair value of fuel derivatives | 30,615 | — | 30,615 | — | ||||||||||||
Fair value of foreign currency derivatives | 631 | — | 631 | — | ||||||||||||
Private investment funds | 60,733 | 60,733 | — | — | ||||||||||||
Liabilities | ||||||||||||||||
Fair value of interest rate derivatives | 159,436 | — | 159,436 | — | ||||||||||||
Fair value of foreign currency derivatives | 884 | — | 884 | — | ||||||||||||
Interest rate derivatives not accounted for as hedging instruments | 14,766 | — | 14,766 | — | ||||||||||||
| Memoria Anual 2011 » Consolidated Financial Statements | | 140 |
Table of Contents
![]()
Additionally, at December 31, 2011, the Company has financial instruments which are not recorded at fair value. In order to meet the disclosure requirements of fair values, the Company has valued these instruments as shown in the table below:
| As of December 31, 2011 | As of December 31, 2010 | |||||||||||||||
| Book value ThUS$ | Fair value ThUS$ | Book value ThUS$ | Fair value ThUS$ | |||||||||||||
Cash and cash equivalents | ||||||||||||||||
Cash on hand | 4,605 | 4,605 | 3,857 | 3,857 | ||||||||||||
Bank balance | 17,013 | 17,013 | 24,432 | 24,432 | ||||||||||||
Time Deposits | 196,455 | 196,455 | 406,143 | 406,143 | ||||||||||||
|
|
|
|
|
|
|
| |||||||||
Other financial assets | ||||||||||||||||
Domestic and foreign bonds | 37,359 | 40,250 | 47,184 | 50,294 | ||||||||||||
Other financial assets | 120,225 | 120,225 | 80,836 | 80,836 | ||||||||||||
|
|
|
|
|
|
|
| |||||||||
Trade and other accounts receivable non-current | 544,897 | 544,897 | 489,233 | 489,233 | ||||||||||||
|
|
|
|
|
|
|
| |||||||||
Accounts receivable from related entities | 838 | 838 | 50 | 50 | ||||||||||||
|
|
|
|
|
|
|
| |||||||||
Other financial liabilities | 3,516,307 | 3,665,661 | 2,945,294 | 2,969,939 | ||||||||||||
|
|
|
|
|
|
|
| |||||||||
Trade and other accounts payables, | 531,481 | 531,481 | 500,694 | 500,694 | ||||||||||||
|
|
|
|
|
|
|
| |||||||||
Accounts payable to related entities | 367 | 367 | 184 | 184 | ||||||||||||
|
|
|
|
|
|
|
| |||||||||
Accounts payable, non-current | 307,965 | 307,965 | 368,372 | 368,372 | ||||||||||||
|
|
|
|
|
|
|
| |||||||||
The book values of accounts receivable and payable are assumed to approximate their fair values, due to their short-term nature. In the case of cash on hand, bank balances, deposits and accounts payable, non-current, fair value approximates their carrying values.
The fair value of other financial liabilities is estimated by discounting the future contractual cash flows at the current market interest rate for similar financial instruments. In the case of other financial assets, the valuation was performed according to market prices at year end.
| Memoria Anual 2011 » Consolidated Financial Statements | | 141 |
Table of Contents
![]()
NOTE 4 – Accounting Estimates and Judgments
The Company has used estimates to value and book some of the assets, liabilities, revenues, expenses and commitments; these relate principally to:
(a) The evaluation of possible impairment losses for certain assets.
(b) The useful lives and residual values of fixed and intangible assets.
(c) The criteria employed in the valuation of certain assets.
(d) Air tickets sold that are not actually used.
(e) The calculation of deferred income at the year end, corresponding to the valuation of kilometers credited to holders of the Lan Pass loyalty card which have not yet been used.
(f) The need for provisions and where required, the determination of their values.
(g) The recoverability of deferred tax assets.
These estimates are made on the basis of the best information available on the matters analyzed.
In any case, it is possible that events will require modification of the estimates in the future, in which case the effects would be accounted for prospectively.
| Memoria Anual 2011 » Consolidated Financial Statements | | 142 |
Table of Contents
![]()
NOTE 5 – Segmental Information
The Company reports information by segments as established in IFRS 8 “Operating segments”. This standard sets rules for the reporting of information by segments in the financial statements, plus reporting about products and services, geographical areas and principal customers.
An operating segment is defined as a component of an entity on which financial information is held separately and which is evaluated regularly by the senior management in making decisions with respect to the assignment of resources and evaluation of results.
The Company has determined that it has only one operating segment: air transportation.
Air transport segment For the year ended December 31 | ||||||||
| 2011 ThUS$ | 2010 ThUS$ | |||||||
Income from ordinary activities and other operating income | 5,718,244 | 4,523,328 | ||||||
Interest income | 14,453 | 14,946 | ||||||
Interest expense | (139,077 | ) | (155,279 | ) | ||||
|
|
|
| |||||
Total net interest expense | (124,624 | ) | (140,333 | ) | ||||
|
|
|
| |||||
Depreciation and amortization | (396,475 | ) | (336,491 | ) | ||||
Segment profit | 320,197 | 419,702 | ||||||
Earnings on investments | 458 | 132 | ||||||
Expenses for income tax | (61,789 | ) | (81,107 | ) | ||||
Assets of segment | 7,648,659 | 6,785,897 | ||||||
Investments in associates | 991 | 593 | ||||||
Purchase of non-monetary assets | 1,394,640 | 1,048,394 | ||||||
| Memoria Anual 2011 » Consolidated Financial Statements | | 143 |
Table of Contents
The Company’s revenues by geographic area are as follows:
For the year ended December 31 | ||||||||
| 2011 ThUS$ | 2010 ThUS$ | |||||||
Peru | 558,227 | 554,072 | ||||||
Argentina | 616,270 | 496,546 | ||||||
USA | 1,140,006 | 858,630 | ||||||
Europe | 523,749 | 447,702 | ||||||
Colombia | 369,102 | 85,309 | ||||||
Chile | 1,423,956 | 1,239,350 | ||||||
Others (*) | 1,086,934 | 841,719 | ||||||
|
|
|
| |||||
Total (**) | 5,718,244 | 4,523,328 | ||||||
|
|
|
| |||||
The Company allocates revenues by geographic area based on the point of sale of the passenger ticket or cargo. Assets are composed primarily of aircraft and aeronautical equipment, which are used throughout the different countries, so it is not possible to assign a geographic area.
| (*) | Includes the rest of Latin America and Asia Pacific. |
| (**) | Includes operating revenues and other operating income. |
| Memoria Anual 2011 » Consolidated Financial Statements | | 144 |
Table of Contents
![]()
NOTE 6 – Cash and Cash Equivalents
| As of December 31, 2011 ThUS$ | As of December 31, 2010 ThUS$ | |||||||
Cash on hand | 4,605 | 3,857 | ||||||
Bank balances | 17,013 | 24,432 | ||||||
Time deposits | 196,455 | 406,143 | ||||||
Mutual funds | 156,334 | 196,620 | ||||||
|
|
|
| |||||
Total | 374,407 | 631,052 | ||||||
|
|
|
| |||||
Cash and cash equivalents are denominated in the following currencies at December 31, 2011, and December 31, 2010:
Currency | As of December 31, 2011 ThUS$ | As of December 31, 2010 ThUS$ | ||||||
US Dollar | 158,313 | 194,212 | ||||||
Chilean peso (*) | 148,274 | 368,360 | ||||||
Euro | 5,688 | 7,844 | ||||||
Argentine peso | 20,020 | 11,230 | ||||||
Brazilian real | 6,616 | 4,759 | ||||||
Colombian peso | 7,668 | 10,231 | ||||||
Other currencies | 27,828 | 34,416 | ||||||
|
|
|
| |||||
Total | 374,407 | 631,052 | ||||||
|
|
|
| |||||
| (*) | The Company entered into currency derivative contracts (forward exchange controls) for ThUS$ 110,339 at December 31, 2011 (ThUS$ 169,357 at December 31, 2010), for conversion into dollars of investments in Chilean pesos, currency derivative contracts (cross currency swaps) for ThUS$ 0 at December 31, 2011 (ThUS$ 30,258 at December 31, 2010), for conversion into dollars of investment in Unidades de Fomento (“UF”). |
In Venezuela, effective 2003, the authorities decreed that all remittances abroad should be approved by the Currency
Management Commission (CADIVI). Despite having free availability of bolivars in Venezuela, the Company has certain restrictions for freely remitting these funds outside Venezuela. At December 31, 2011 the amount subject to such restrictions in dollar terms is ThUS$ 23,914 (ThUS$ 26,738 at December 31, 2010).
The Company has no significant non-monetary transactions that should be reported.
| | 145 |
Table of Contents
NOTE 7 – Financial Instruments
7.1 Financial instruments by category
As of December 31, 2011
Assets | Held to maturity ThUS$ | Loans and accounts receivable ThUS$ | Hedging derivatives ThUS$ | Held to trading ThUS$ | Designated as at fair value through profit and loss on initial recognition ThUS$ | Total ThUS$ | ||||||||||||||||||
Cash and cash equivalents | — | 218,073 | — | 156,334 | — | 374,407 | ||||||||||||||||||
Other financial assets (*) | 37,867 | 119,717 | 31,319 | — | 60,733 | 249,636 | ||||||||||||||||||
Trade and other current accounts receivable | — | 537,406 | — | — | — | 537,406 | ||||||||||||||||||
Current accounts receivable from related parties | — | 838 | — | — | — | 838 | ||||||||||||||||||
Non-current accounts receivable | — | 7,491 | — | — | — | 7,491 | ||||||||||||||||||
|
|
|
|
|
|
|
|
|
|
|
| |||||||||||||
Total | 37,867 | 883,525 | 31,319 | 156,334 | 60,733 | 1,169,778 | ||||||||||||||||||
|
|
|
|
|
|
|
|
|
|
|
| |||||||||||||
Liabilities | Other Financial Liabilities ThUS$ | Hedging derivatives ThUS$ | Held to Trading ThUS$ | Total ThUS$ | ||||||||||||
Other financial liabilities | 3,516,307 | 160,320 | 14,766 | 3,691,393 | ||||||||||||
Trade and other accounts payables | 531,481 | — | — | 531,481 | ||||||||||||
Current accounts payable to related parties | 367 | — | — | 367 | ||||||||||||
Non-current accounts payable | 307,965 | — | — | 307,965 | ||||||||||||
|
|
|
|
|
|
|
| |||||||||
Total | 4,356,120 | 160,320 | 14,766 | 4,531,206 | ||||||||||||
|
|
|
|
|
|
|
| |||||||||
| (*) | The value presented in held to maturity corresponds, mainly, to domestic and foreign bonds; designated as at fair value through profit and loss on initial recognition corresponds to private investment funds; and loans and accounts receivable corresponds to guarantees given. |
| Memoria Anual 2011 » Consolidated Financial Statements | | 146 |
Table of Contents
As of December 31, 2010
Assets | Held to maturity ThUS$ | Loans and accounts receivable ThUS$ | Hedging derivatives ThUS$ | Held to trading ThUS$ | Designated as at fair value through profit and loss on initial recognition ThUS$ | Total ThUS$ | ||||||||||||||||||
Cash and cash equivalents | — | 434,432 | — | 196,620 | — | 631,052 | ||||||||||||||||||
Other financial assets (*) | 47,691 | 80,329 | 80,161 | — | 58,857 | 267,038 | ||||||||||||||||||
Trade and other current accounts receivable | — | 481,350 | — | — | — | 481,350 | ||||||||||||||||||
Current accounts receivable from related parties | — | 50 | — | — | — | 50 | ||||||||||||||||||
Non-current accounts receivable | — | 7,883 | — | — | — | 7,883 | ||||||||||||||||||
|
|
|
|
|
|
|
|
|
|
|
| |||||||||||||
Total | 47,691 | 1,004,044 | 80,161 | 196,620 | 58,857 | 1,387,373 | ||||||||||||||||||
|
|
|
|
|
|
|
|
|
|
|
| |||||||||||||
Liabilities | Other Financial Liabilities ThUS$ | Hedging derivatives ThUS$ | Held to Trading ThUS$ | Total ThUS$ | ||||||||||||
Other financial liabilities | 2,945,294 | 139,930 | 19,748 | 3,104,972 | ||||||||||||
Trade and other accounts payables | 500,694 | — | — | 500,694 | ||||||||||||
Current accounts payable to related parties | 184 | — | — | 184 | ||||||||||||
Non-current accounts payable | 368,372 | — | — | 368,372 | ||||||||||||
|
|
|
|
|
|
|
| |||||||||
Total | 3,814,544 | 139,930 | 19,748 | 3,974,222 | ||||||||||||
|
|
|
|
|
|
|
| |||||||||
| (*) | The value presented in held to maturity corresponds mainly to domestic and foreign bonds; and designated as at fair value through profit and loss on initial recognition corresponds to private investment funds; and loans and accounts receivable corresponds to guarantees given. |
| Memoria Anual 2011 » Consolidated Financial Statements | | 147 |
Table of Contents
7.2 Financial instruments by currency
a) Assets
| As of December 31, 2011 ThUS$ | As of December 31, 2010 ThUS$ | |||||||
Cash and cash equivalents | 374,407 | 631,052 | ||||||
US Dollar | 158,313 | 194,212 | ||||||
Chilean Peso | 148,274 | 368,360 | ||||||
Euro | 5,688 | 7,844 | ||||||
Argentine Peso | 20,020 | 11,230 | ||||||
Brazilian Real | 6,616 | 4,759 | ||||||
Colombian Peso | 7,668 | 10,231 | ||||||
Others | 27,828 | 34,416 | ||||||
Other financial Assets | 249,636 | 267,038 | ||||||
US Dollar | 241,008 | 255,808 | ||||||
Brazilian Real | 3,066 | 6,731 | ||||||
Colombian Peso | 4,175 | 2,917 | ||||||
Others | 1,387 | 1,582 | ||||||
Trade and other current accounts receivable | 537,406 | 481,350 | ||||||
US Dollar | 354,972 | 361,570 | ||||||
Chilean Peso | 63,818 | 28,606 | ||||||
Euro | 8,266 | 8,429 | ||||||
Argentine Peso | 24,879 | 6,702 | ||||||
Brazilian Real | 35,467 | 31,329 | ||||||
Australian Dollar | 5,567 | 5,588 | ||||||
Colombian Peso | 34,583 | 27,156 | ||||||
Others | 9,854 | 11,970 | ||||||
Non-current accounts receivable | 7,491 | 7,883 | ||||||
US Dollar | 9 | 9 | ||||||
Chilean Peso | 7,422 | 7,864 | ||||||
Others | 60 | 10 | ||||||
Current accounts receivable from related parties | 838 | 50 | ||||||
US Dollar | 29 | 29 | ||||||
Chilean Peso | 809 | 21 | ||||||
Total financial assets | 1,169,778 | 1,387,373 | ||||||
US Dollar | 754,331 | 811,628 | ||||||
Chilean Peso | 220,323 | 404,851 | ||||||
Euro | 13,954 | 16,273 | ||||||
Argentine Peso | 44,899 | 17,932 | ||||||
Brazilian Real | 45,149 | 42,819 | ||||||
Australian Dollar | 5,567 | 5,588 | ||||||
Colombian Peso | 46,426 | 40,304 | ||||||
Others | 39,129 | 47,978 | ||||||
| Memoria Anual 2011 » Consolidated Financial Statements | | 148 |
Table of Contents
b) Liabilities
Liabilities information is detailed in the table within Note 3 section (c) Liquidity risk.
NOTE 8 – Trade, other accounts receivable and non-current accounts receivable
| As of December 31, 2011 ThUS$ | As of December 31, 2010 ThUS$ | |||||||
Trade accounts receivable | 474,852 | 435,576 | ||||||
Other accounts receivable | 90,570 | 75,734 | ||||||
Total trade and other accounts receivable | 565,422 | 511,310 | ||||||
Less: Allowance for impairment loss | (20,525 | ) | (22,077 | ) | ||||
Total net trade and accounts receivable | 544,897 | 489,233 | ||||||
Less: non-current portion - accounts receivable | (7,491 | ) | (7,883 | ) | ||||
Trade and other accounts receivable, current | 537,406 | 481,350 | ||||||
The fair value of trade and other accounts receivable does not differ significantly from the book value.
There are overdue accounts receivable which are not impaired. Maturity of these accounts is as follows:
| As of December 31, 2011 ThUS$ | As of December 31, 2010 ThUS$ | |||||||
Up to 3 months | 17,138 | 12,506 | ||||||
Between 3 and 6 months | 6,256 | 11,114 | ||||||
|
|
|
| |||||
Total | 23,394 | 23,620 | ||||||
|
|
|
| |||||
| Memoria Anual 2011 » Consolidated Financial Statements | | 149 |
Table of Contents
The amounts of individually impaired trade and other accounts receivable are as follows:
| As of December 31, 2011 ThUS$ | As of December 31, 2010 ThUS$ | |||||||
Judicial and pre-judicial collection | 9,626 | 10,586 | ||||||
Debtors under pre-judicial collection process | 4,306 | 5,259 | ||||||
|
|
|
| |||||
Total | 13,932 | 15,845 | ||||||
|
|
|
| |||||
Currency balances that make up the trade receivables, non-current accounts receivable and accounts receivables at December 31, 2011 and December 31, 2010, are as follows:
Currency | As of December 31, 2011 ThUS$ | As of December 31, 2010 ThUS$ | ||||||
US Dollar | 354,981 | 361,579 | ||||||
Chilean Peso | 71,240 | 36,470 | ||||||
Euro | 8,266 | 8,429 | ||||||
Argentine Peso | 24,879 | 6,702 | ||||||
Brazilian Real | 35,467 | 31,329 | ||||||
Australian Dollar | 5,567 | 5,588 | ||||||
Colombian peso | 34,583 | 27,156 | ||||||
Other | 9,914 | 11,980 | ||||||
|
|
|
| |||||
Total | 544,897 | 489,233 | ||||||
|
|
|
| |||||
| Memoria Anual 2011 » Consolidated Financial Statements | | 150 |
Table of Contents
The Company records allowances when there is evidence of impairment of trade receivables. The criteria used to determine that there is objective evidence of impairment losses are the maturity of the portfolio, specific acts of damage (default) and specific market signals.
Maturity | Impairment | |||
Judicial and pre-judicial collection Assets | 100 | % | ||
Over 1 year | 100 | % | ||
Between 6 and 12 months | 50 | % | ||
The movement in the allowance for impairment loss of trade accounts and other accounts receivables between January 01, 2010 and December 31, 2011 is as follows:
| ThUS$ | ||||
As of January 1, 2010 | (23,817 | ) | ||
Write-offs | 5,039 | |||
(Increase) decrease in allowance | (3,299 | ) | ||
Balance as of December 31, 2010 | (22,077 | ) | ||
As of January 1, 2011 | (22,077 | ) | ||
Write-offs | 4,060 | |||
(Increase) decrease in allowance | (2,508 | ) | ||
Balance as of December 31, 2011 | (20,525 | ) | ||
| Memoria Anual 2011 » Consolidated Financial Statements | | 151 |
Table of Contents
Once pre-judicial and judicial collection efforts are exhausted, the assets are written off against the allowance. The Company only uses the allowance method rather than direct write-off, to ensure control.
Historic and current re-negotiations are not relevant and the policy is to analyze case by case in order to classify them according to the existence of risk, determining whether it is appropriate to re-classify accounts to pre-judicial recovery. If such re-classification is justified, an allowance is made for the account, whether overdue or falling due.
The maximum credit-risk exposure at the date of presentation of the information is the fair value of each one of the categories of accounts receivable indicated above.
| As of December 31, 2011 | As of December 31, 2010 | |||||||||||||||||||||||
| Gross exposure ThUS$ | Gross Impaired exposure ThUS$ | Exposure net of risk concentrations ThUS$ | Gross exposure ThUS$ | Gross Impaired exposure ThUS$ | Exposure net of risk concentrations ThUS$ | |||||||||||||||||||
Trade accounts receivable | 474,852 | (20,525 | ) | 454,327 | 435,576 | (22,077 | ) | 413,499 | ||||||||||||||||
Other accounts receivable | 90,570 | — | 90,570 | 75,734 | — | 75,734 | ||||||||||||||||||
There are no relevant guarantees covering credit risk and these are valued when they are settled; no materially significant direct guarantees exist. Existing guarantees, if appropriate, are made through IATA.
| Memoria Anual 2011 » Consolidated Financial Statements | | 152 |
Table of Contents
NOTE 9 – Accounts receivable from/payable to related entities
The accounts receivable from and payable to related entities as of December 31, 2011 and December 31, 2010, respectively, are as follows:
(a) Accounts Receivable
Tax NO | Related party | Relationship | Country of origin | As of December 31, 2011 ThUS$ | As of December 31, 2010 ThUS$ | Currency | Transaction deadlines | Nature of Transaction | ||||||||||||
96.810.370-9 | Inversiones Costa Verde Ltda. y CPA. | Controlling shareholder | Chile | 19 | — | CLP | 30 to 45 Days | Monetary | ||||||||||||
96.778.310-2 | Concesionaria Chucumata S.A | Associate | Chile | — | 4 | CLP | 30 to 45 Days | Monetary | ||||||||||||
96.921.070-3 | Austral Sociedad Concesionaria S.A. | Associate | Chile | — | 2 | CLP | 30 to 45 Days | Monetary | ||||||||||||
78.591.370-1 | Bethia S.A. y Filiales | Others related parties | Chile | 758 | — | CLP | 30 to 45 Days | Monetary | ||||||||||||
87.752.000-5 | Granja Marina Tornagaleones S.A | Others related parties | Chile | 32 | 15 | CLP | 30 to 45 Days | Monetary | ||||||||||||
96.812.280-0 | San Alberto S.A. y Filiales | Others related parties | Chile | 29 | 29 | US$ | 30 to 45 Days | Monetary | ||||||||||||
|
|
|
| |||||||||||||||||
| Total current assets | 838 | 50 | ||||||||||||||||||
|
|
|
| |||||||||||||||||
| Memoria Anual 2011 » Consolidated Financial Statements | | 153 |
Table of Contents
(b) Accounts payable
Tax NO | Related party | Relationship | Country of origin | As of December 31, 2011 ThUS$ | As of December 31, 2010 ThUS$ | Currency | Transaction deadlines | Nature of Transaction | ||||||||||||
96.847.880-K | Lufthansa Lan Technical Training S.A. | Associate | Chile | — | 74 | CLP | 30 to 45 Days | Monetary | ||||||||||||
96.847.880-K | Lufthansa Lan Technical Training S.A. | Associate | Chile | 147 | 110 | US$ | 30 to 45 Days | Monetary | ||||||||||||
96.921.070-3 | Austral Sociedad Concesionaria S.A. | Associate | Chile | 2 | — | CLP | 30 to 45 Days | Monetary | ||||||||||||
78.591.370-1 | Bethia S.A. y Filiales | Other related parties | Chile | 116 | — | CLP | 30 to 45 Days | Monetary | ||||||||||||
Foreign | Inversora Aeronáutica Argentina | Other related parties | Argentina | 102 | — | US$ | 30 to 45 Days | Monetary | ||||||||||||
|
|
|
| |||||||||||||||||
| Total current liabilities | 367 | 184 | ||||||||||||||||||
|
|
|
| |||||||||||||||||
Transactions between related parties have been carried out on free-trade conditions between interested and duly-informed parties.
| Memoria Anual 2011 » Consolidated Financial Statements | | 154 |
Table of Contents
The inventories at December 31, 2011 and December 31, 2010 respectively, are detailed below:
| As of December 31, 2011 ThUS$ | As of December 31, 2010 ThUS$ | |||||||
Technical stock | 57,836 | 40,625 | ||||||
Non-technical stock | 14,951 | 12,568 | ||||||
| 72,787 | 53,193 | |||||||
The items included in this heading are spare parts and materials that will be used mainly in consumption in in-flight and maintenance services (provided to the Company and third parties), which are valued at average cost, net of provision for obsolescence that as of December 31, 2011 amounts to ThUS$ 1,685 (ThUS$ 3,075 as of December 31, 2010). The resulting amounts do not exceed the respective net realizable values.
As of December 31, 2011, the Company recorded ThUS$ 41,213 (ThUS$ 32,915 as of December 31, 2010) within the income statement, mainly due to in-flight consumption and maintenance, which forms part of cost of sales.
| Memoria Anual 2011 » Consolidated Financial Statements | | 155 |
Table of Contents
NOTE 11 – Other financial assets
The composition of other financial assets is as follows:
| As of December 31, 2011 ThUS$ | As of December 31, 2010 ThUS$ | |||||||
Current | ||||||||
(a) Other financial assets | 196,484 | 165,712 | ||||||
(b) Hedging asset | 31,319 | 79,739 | ||||||
Total Current | 227,803 | 245,451 | ||||||
Non-current | ||||||||
(a) Other financial assets | 21,833 | 21,165 | ||||||
(b) Hedging assets | — | 422 | ||||||
Total non-current | 21,833 | 21,587 | ||||||
a) Other financial assets
Other financial assets as of December 31, 2011 and December 31, 2010, respectively, are as follows:
| As of December 31, 2011 ThUS$ | As of December 31, 2010 ThUS$ | |||||||
Current | ||||||||
Private investment Funds | 60,733 | 58,857 | ||||||
Domestic and Foreign bonds | 37,359 | 47,184 | ||||||
Guarantees for margins of derivatives | 79,171 | 39,868 | ||||||
Deposits in guarantee (aircraft) | 11,657 | 12,030 | ||||||
Other guarantees given | 7,564 | 7,773 | ||||||
Total Current | 196,484 | 165,712 | ||||||
Non-current | ||||||||
Deposits in guarantee (aircraft) | 15,498 | 15,000 | ||||||
Other guarantees given | 5,827 | 5,658 | ||||||
Other investments | 508 | 507 | ||||||
Total non-current | 21,833 | 21,165 | ||||||
Total other financial assets | 218,317 | 186,877 | ||||||
| | 156 |
Table of Contents
b) Hedging assets
Hedging assets as of December 31, 2011 and December 31, 2010, are as follows:
| As of December 31, 2011 ThUS$ | As of December 31, 2010 ThUS$ | |||||||
Current | ||||||||
Interest accrued since last payment date of currency Swap | — | 3,691 | ||||||
Cash-flow hedge of interest-rate risk | 73 | — | ||||||
Cash-flow hedge of currency risk | 631 | 30,234 | ||||||
Cash-flow hedge of fuel-price risk | 30,615 | 45,814 | ||||||
Total Current | 31,319 | 79,739 | ||||||
Non-current | ||||||||
Cash-flow hedge of interest-rate risk | — | 422 | ||||||
Total non-current | — | 422 | ||||||
Total hedging assets | 31,319 | 80,161 | ||||||
Foreign currency derivatives include the fair value of Forward and Cross Currency Swaps and forward exchange contracts.
The types of derivative hedging contracts maintained by the Company at the end of each year are presented in Note 20.
| Memoria Anual 2011 » Consolidated Financial Statements | | 157 |
Table of Contents
NOTE 12 – Other non-financial assets
The composition of other non-financial assets is as follows:
| As of December 31, 2011 ThUS$ | As of December 31, 2010 ThUS$ | |||||||
Current | 25,501 | 17,648 | ||||||
a) Advance Payments | ||||||||
b) Other assets | 1,159 | 1,172 | ||||||
Total Current | 26,660 | 18,820 | ||||||
Non-current | 11,189 | 8,752 | ||||||
a) Advance Payments | ||||||||
b) Other assets | 46,974 | 23,756 | ||||||
Total non-current | 58,163 | 32,508 | ||||||
a) Advance payments
Advance payments as of December 31, 2011 as of December 31, 2010 are as follows:
| As of December 31, 2011 ThUS$ | As of December 31, 2010 ThUS$ | |||||||
Current | ||||||||
Aircraft insurance and other | 7,954 | 6,459 | ||||||
Aircraft leases | 13,196 | 7,343 | ||||||
Handling and ground handling services | 2,941 | — | ||||||
Others | 1,410 | 3,846 | ||||||
Total Current | 25,501 | 17,648 | ||||||
Non-current | ||||||||
Aircraft leases | 11,189 | 4,984 | ||||||
Handling and ground handling services | — | 2,971 | ||||||
Others | — | 797 | ||||||
Total non-current | 11,189 | 8,752 | ||||||
Total advance payments | 36,690 | 26,400 | ||||||
| Memoria Anual 2011 » Consolidated Financial Statements | | 158 |
Table of Contents
b) Other assets
Other assets as of December 31, 2011, and December 31, 2010 are as follows:
| As of December 31, 2011 ThUS$ | As of December 31, 2010 ThUS$ | |||||||
Current | ||||||||
Others | 1,159 | 1,172 | ||||||
Total Current | 1,159 | 1,172 | ||||||
Non-current | ||||||||
Recoverable taxes | 42,958 | 23,343 | ||||||
Others | 4,016 | 413 | ||||||
Total non-current | 46,974 | 23,756 | ||||||
Total other assets | 48,133 | 24,928 | ||||||
| Memoria Anual 2011 » Consolidated Financial Statements | | 159 |
Table of Contents
NOTE 13 – Non-current assets (or disposal groups) classified as held for sale
Non-current assets and disposal groups held for sale as of December 31, 2011, and December 31, 2010 are as follows:
| As of December 31, 2011 | As of December 31, 2011 | |||||||
| ThUS$ | ThUS$ | |||||||
Engines | 2,204 | 2,204 | ||||||
Inventories on consignment | 527 | 748 | ||||||
Aircraft | 1,537 | 1,537 | ||||||
Scrapped aircraft | 365 | 970 | ||||||
Rotables | 28 | 38 | ||||||
|
|
|
| |||||
Total | 4,661 | 5,497 | ||||||
|
|
|
| |||||
During 2011, sales were made of inventories held on consignment of the Boeing 737-200 fleet.
During the financial year 2010, sales were made of rotables, inventories held on consignment and three engines, all from the Boeing 737-200 fleet.
Item balances are shown net of provision, which as of December 31, 2011 amounted to ThUS$ 5,386 (ThUS$ 5,212 at December 31, 2010).
The Company has no discontinued operations as of December 31, 2011.
| Memoria Anual 2011 » Consolidated Financial Statements | | 160 |
Table of Contents
NOTE 14 – Investments in subsidiaries
The Company has investments in companies recognized as investments in subsidiaries. All the companies defined as subsidiaries have been consolidated within the financial statements of Lan Airlines S.A. and Subsidiaries. The consolidation also includes special-purpose entities and private investment funds.
The following is a summary of financial information with respect to the sum of the financial statements of subsidiary companies, special-purpose entities and private investment funds that have been consolidated:
| (2,577,685) | (2,577,685) | |||||||
As of December 31, 2011 | Assets ThS$ | Liabilities ThS$ | ||||||
Current | 493,662 | 618,360 | ||||||
Non-current | 1,498,840 | 917,171 | ||||||
|
|
|
| |||||
Total | 1,992,502 | 1,535,531 | ||||||
|
|
|
| |||||
| (2,577,685) | (2,577,685) | |||||||
As of December 31, 2010 | Assets ThS$ | Liabilities ThS$ | ||||||
Current | 442,743 | 565,606 | ||||||
Non-current | 1,388,194 | 773,927 | ||||||
|
|
|
| |||||
Total | 1,830,937 | 1,339,533 | ||||||
|
|
|
| |||||
| (2,577,685) | (2,577,685) | |||||||
| For the year ended December 31, | ||||||||
| 2011 ThS$ | 2010 ThS$ | |||||||
Total operating revenues | 2,619,157 | 1,931,998 | ||||||
|
|
|
| |||||
Total expenses | (2,577,685 | ) | (1,849,438 | ) | ||||
|
|
|
| |||||
Total net income | 41,472 | 82,560 | ||||||
|
|
|
| |||||
| Memoria Anual 2011 » Consolidated Financial Statements | | 161 |
Table of Contents
Significant Subsidiaries detailed as of December 31, 2011
Name of significant subsidiary | Country of incorporation | Functional currency | % Ownership | Nature and scope of significant restrictions on | ||||||||
Lan Perú S.A. | Peru | US$ | 69.97858 | Without significant restrictions | ||||||||
Lan Cargo S.A. | Chile | US$ | 99.89803 | Without significant restrictions | ||||||||
Lan Argentina S.A. | Argentina | ARS | 94.99055 | Without significant restrictions | ||||||||
Transporte Aéreo S.A. | Chile | US$ | 99.89804 | Without significant restrictions | ||||||||
Aerolane Líneas Aéreas Nacionales de Ecuador S.A. | Ecuador | US$ | 71.94990 | Without significant restrictions | ||||||||
Aerovías de Integración Regional, AIRES S.A. | Colombia | COP | 98.21089 | Without significant restrictions | ||||||||
Summary financial information of significant subsidiaries
| Statement of financial position as of December 31, 2011 | Results for the year ended December 31, 2011 | |||||||||||||||||||||||||||||||
Name of significant subsidiary | Total Assets ThUS$ | Current Assets ThUS$ | Non- current Assests ThUS$ | Total Liabilities ThUS$ | Current Liabilities ThUS$ | Non- current Liabilities ThUS$ | Revenue ThUS$ | Net Income ThUS$ | ||||||||||||||||||||||||
Lan Perú S.A. | 139,888 | 124,485 | 15,403 | 128,979 | 128,025 | 954 | 916,861 | 920 | ||||||||||||||||||||||||
Lan Cargo S.A. | 76,.829 | 188,937 | 576,892 | 343,799 | 122,450 | 221,349 | 258,298 | 57,140 | ||||||||||||||||||||||||
Lan Argentina S.A. | 136,579 | 108,561 | 28,018 | 114,037 | 112,555 | 1,482 | 438,137 | (1,972 | ) | |||||||||||||||||||||||
Transporte Aéreo S.A. | 348,943 | 237,627 | 111,316 | 116,663 | 26,332 | 90,331 | 370,697 | 26,146 | ||||||||||||||||||||||||
Aerolane Líneas Aéreas Nacionales de Ecuador S.A. | 71,598 | 42,369 | 29,229 | 61,102 | 58,726 | 2,376 | 278,039 | 2,303 | ||||||||||||||||||||||||
Aerovías de Integración Regional, AIRES S.A. | 134,983 | 76,936 | 58,047 | 80,271 | 70,112 | 10,159 | 282,493 | (25,860 | ) | |||||||||||||||||||||||
| Memoria Anual 2011 » Consolidated Financial Statements | | 162 |
Table of Contents
Significant Subsidiaries detailed as of December 31, 2010
Name of significant subsidiary | Country of incorporation | Functional currency | % Ownership | Nature and scope of significant restrictions on | ||||||
Lan Perú S.A. | Peru | US$ | 69.97858 | Without significant restrictions | ||||||
Lan Cargo S.A. | Chile | US$ | 99.89803 | Without significant restrictions | ||||||
Lan Argentina S.A. | Argentina | ARS | 94.99055 | Without significant restrictions | ||||||
Transporte Aéreo S.A. | Chile | US$ | 99.89804 | Without significant restrictions | ||||||
Aerolane Líneas Aéreas Nacionales de Ecuador S.A. | Ecuador | US$ | 71.94990 | Without significant restrictions | ||||||
Summary financial information of significant subsidiaries
| Statement of financial position as of December 31, 2011 | Results for the year ended December 31, 2011 | |||||||||||||||||||||||||||||||
Name of significant subsidiary | Total Assets ThUS$ | Current Assets ThUS$ | Non- current Assests ThUS$ | Total Liabilities ThUS$ | Current Liabilities ThUS$ | Non- current Liabilities ThUS$ | Revenue ThUS$ | Net Income ThUS$ | ||||||||||||||||||||||||
Lan Perú S.A. | 124,761 | 113,579 | 11,182 | 114,771 | 113,750 | 1,021 | 759,704 | 1,524 | ||||||||||||||||||||||||
Lan Cargo S.A. | 737,550 | 183,877 | 553,673 | 340,082 | 103,018 | 237,064 | 209,512 | 59,285 | ||||||||||||||||||||||||
Lan Argentina S.A. | 113,168 | 84,751 | 28,417 | 88,286 | 87,420 | 866 | 381,168 | 2,984 | ||||||||||||||||||||||||
Transporte Aéreo S.A. | 329,190 | 215,575 | 113,615 | 123,056 | 28,777 | 94,279 | 296,543 | 31,227 | ||||||||||||||||||||||||
Aerolane Líneas Aéreas Nacionales de Ecuador S.A. | 48,416 | 24,561 | 23,855 | 51,723 | 38,299 | 13,424 | 235,877 | 1,011 | ||||||||||||||||||||||||
| Memoria Anual 2011 » Consolidated Financial Statements | | 163 |
Table of Contents
NOTE 15 – Equity accounted investments
The following summarized financial information is the sum of the financial statements of the investees, corresponding to the statements of financial position as of December 31, 2011 and December 31, 2010, and the statements of income for the year ended December 31, 2011, and December 31, 2010:
As of December 31, 2011 | Assets ThUS$ | Liabilities ThUS$ | ||||||
Current | 2,649 | 721 | ||||||
Non-current | 269 | 115 | ||||||
|
|
|
| |||||
Total | 2,918 | 836 | ||||||
|
|
|
| |||||
As of December 31, 2010 | Assets ThUS$ | Liabilities ThUS$ | ||||||
Current | 1,865 | 301 | ||||||
Non-current | 382 | 562 | ||||||
|
|
|
| |||||
Total | 2,247 | 863 | ||||||
|
|
|
| |||||
| For the year ended December 31, | ||||||||
| 2011 ThUS$ | 2010 ThUS$ | |||||||
Total operating revenues | 2,896 | 2,408 | ||||||
|
|
|
| |||||
Total expenses | (1,902 | ) | (2,162 | ) | ||||
|
|
|
| |||||
Sum of net income | 994 | 246 | ||||||
|
|
|
| |||||
| Memoria Anual 2011 » Consolidated Financial Statements | | 164 |
Table of Contents
As an investment in associates, the Company has shown its holdings in the following companies: Austral Sociedad Concesionaria S.A., Lufthansa Lan Technical Training S.A. and Concesionaria Chucumata S.A. The Company made no investments in associates during the year ended December 31, 2011.
Percentage of ownership | Cost of investment | |||||||||||||||||||
Company | Country of incorporation | Functional currency | As of December 31, 2011 % | As of December 31, 2010 % | As of December 31, 2011 ThUS$ | As of December 31, 2010 ThUS$ | ||||||||||||||
Austral Sociedad Concesionaria S.A. | Chile | CLP | 20.00 | 20.00 | 661 | 661 | ||||||||||||||
Lufthansa Lan Technical Training S.A. | Chile | CLP | 50.00 | 50.00 | 702 | 702 | ||||||||||||||
Concesionaria Chucumata S.A. (*) | Chile | CLP | — | 16.70 | — | 119 | ||||||||||||||
| (*) | In the extraordinary session of the shareholders on September 22, 2011, the shareholders approved the dissolution of the company Concesionaria Chucumata S.A. |
These companies do not have significant restrictions on the ability to transfer funds.
| Memoria Anual 2011 » Consolidated Financial Statements | | 165 |
Table of Contents
The movement of investments in associates between January 1, 2010 and December 31, 2011 is as follows:
| ThUS$ | ||||
Opening balance as of January 1, 2010 | 1,236 | |||
Equity accounted earnings | 132 | |||
Other reductions, investments in associated entities | (665 | ) | ||
Dividends received | (110 | ) | ||
Total changes in investments in associated entities | (643 | ) | ||
Balance as of December 31, 2010 | 593 | |||
Opening balance as of January 1, 2011 | 593 | |||
Equity accounted earnings | 502 | |||
Dividends received | (79 | ) | ||
Other reductions, investments in associated entities | (25 | ) | ||
Total changes in investments in associated entities | 398 | |||
Balance as of December 31, 2011 | 991 | |||
The Company records the gain or loss on its investments in associates on a monthly basis in the consolidated statement of income, using the equity method. The Company has no investments in associates which are not accounted for using the equity method.
| Memoria Anual 2011 » Consolidated Financial Statements | | 166 |
Table of Contents
Classes of intangible assets (net) | As of December 31, 2011 ThUS$ | As of December 31, 2010 ThUS$ | ||||||
Computer software | 64,519 | 45,183 | ||||||
Other assets | 404 | 566 | ||||||
|
|
|
| |||||
Total | 64,923 | 45,749 | ||||||
|
|
|
| |||||
Classes of intangible assets (gross) | As of December 31, 2011 ThUS$ | As of December 31, 2010 ThUS$ | ||||||
Computer software | 112,881 | 83,875 | ||||||
Other assets | 808 | 808 | ||||||
|
|
|
| |||||
Total | 113,689 | 84,683 | ||||||
|
|
|
| |||||
| Memoria Anual 2011 » Consolidated Financial Statements | | 167 |
Table of Contents
The movement in software and other assets between January 1, 2010 and December 31, 2011 is as follows:
| Computer Software net ThUS$ | Other assets net ThUS$ | Total ThUS$ | ||||||||||
Opening balance as of January 1, 2010 | 34,087 | 727 | 34,814 | |||||||||
Additions | 20,915 | — | 20,915 | |||||||||
Acquisitions by business combination | 154 | — | 154 | |||||||||
Withdrawals | (779 | ) | — | (779 | ) | |||||||
Amortization | (9,194 | ) | (161 | ) | (9,355 | ) | ||||||
Balance as of December 31, 2010 | 45,183 | 566 | 45,749 | |||||||||
Opening balance as of January 1, 2011 | 45,183 | 566 | 45,749 | |||||||||
Additions | 29,190 | — | 29,190 | |||||||||
Withdrawals | (184 | ) | — | (184 | ) | |||||||
Amortization | (9,670 | ) | (162 | ) | (9,832 | ) | ||||||
Balance as of December 31, 2011 | 64,519 | 404 | 64,923 | |||||||||
Intangible assets with defined useful lives consist primarily of licensing and computer software, for which the Company has established useful lives of between 4 and 7 years.
The Company shows its intangible assets at cost, except for acquisitions by business combination, which are at fair value; and amortization is made on a straight-line basis over their estimated useful lives.
The amortization of each year is shown in the consolidated statement of income in administrative expenses. The accumulated amortization of computer programs as of December 31, 2011 amounts to ThUS$ 48,362 (ThUS$ 38,692 as of December 31, 2010). The accumulated amortization of other identifiable intangible assets as of December 31, 2011 amounts to ThUS$ 404 (ThUS$ 242 as of December 31, 2010).
| Memoria Anual 2011 » Consolidated Financial Statements | �� | | 168 |
Table of Contents
The goodwill represents the excess of cost of acquisition over the fair value of the participation of the Company in the identifiable net assets of the subsidiary at the acquisition date. Goodwill at December 31, 2011 amounted to ThUS$ 163,777 (ThUS$ 157,994 at December 31, 2010)
At December 31, 2011, the Company performed an impairment test based on the value in use and no impairment was identified. The testing is done at least once per year.
The value in use of those cash generating units to which goodwill has been assigned has been determined assuming that yields, occupation factors and fleet capacity
are maintained at current obtainable levels. The Company projects cash flows for the initial periods based on internal budgets and extrapolates the final value of these periods based on a growth factor consistent with the long-term economic projections in the markets in which the units operate. The determined cash flows are discounted at a rate which takes into account the time value of money and risks related to those cash generating units which have not been taken into account in estimation of the units’ future cash flows.
The movement of goodwill from January 1, 2010 to December 31, 2011, is as follows:
| ThUS$ | ||||
Opening balance as of January 1, 2010 | 63,793 | |||
Additions (1) | 94,224 | |||
Increase (decrease) due to exchange rate differences | (23 | ) | ||
Closing balance as of December 31, 2010 | 157,994 | |||
Opening balance as of January 1, 2011 | 157,994 | |||
Additions (2) | 6,736 | |||
Amendment initial recognition (3) | (820 | ) | ||
Increase (decrease) due to exchange rate differences | (133 | ) | ||
Closing balance as of December 31, 2011 | 163,777 | |||
| (1) | Corresponds to the goodwill generated by the purchase of Aerovias de Integracion Regional, AIRES S.A. (see Note 39). |
| (2) | Corresponds to the goodwill generated by the purchase of Aeroasis S.A. (see Note 39). |
| (3) | Corresponds to change of initial recognition goodwill generated by the purchase of the company Aerovías de Integración Regional, AIRES S.A. |
| Memoria Anual 2011 » Consolidated Financial Statements | | 169 |
Table of Contents
NOTE 18 – Property, plant and equipment
The composition by category of property, plant and equipment is as follows:
| Gross Book Value | Acumulated depreciation | Net Book Value | ||||||||||||||||||||||
| As of December 31, 2011 ThUS$ | As of December 31, 2011 ThUS$ | As of December 31, 2011 ThUS$ | As of December 31, 2011 ThUS$ | As of December 31, 2011 ThUS$ | As of December 31, 2011 ThUS$ | |||||||||||||||||||
Construction in progress | 1,087,563 | 715,603 | — | — | 1,087,563 | 715,603 | ||||||||||||||||||
Land | 35,673 | 35,538 | — | — | 35,673 | 35,538 | ||||||||||||||||||
Buildings | 101,123 | 101,181 | (23,185 | ) | (21,060 | ) | 77,938 | 80,121 | ||||||||||||||||
Plant and equipment | 5,380,663 | 4,816,723 | (1,238,678 | ) | (1,153,587 | ) | 4,141,985 | 3,663,136 | ||||||||||||||||
Information technology equipment | 89,678 | 83,711 | (67,087 | ) | (65,112 | ) | 22,591 | 18,599 | ||||||||||||||||
Fixed installations and accessories | 64,936 | 52,954 | (29,838 | ) | (25,951 | ) | 35,098 | 27,003 | ||||||||||||||||
Motor vehicles | 3,714 | 3,269 | (2,077 | ) | (1,979 | ) | 1,637 | 1,290 | ||||||||||||||||
Leasehold improvements | 94,485 | 87,168 | (62,986 | ) | (43,048 | ) | 31,499 | 44,120 | ||||||||||||||||
Other property, plants and equipment | 832,772 | 646,236 | (338,774 | ) | (283,216 | ) | 493,998 | 363,020 | ||||||||||||||||
|
|
|
|
|
|
|
|
|
|
|
| |||||||||||||
Total | 7,690,607 | 6,542,383 | (1,762,625 | ) | (1,593,953 | ) | 5,927,982 | 4,948,430 | ||||||||||||||||
|
|
|
|
|
|
|
|
|
|
|
| |||||||||||||
| Memoria Anual 2011 » Consolidated Financial Statements | | 170 |
Table of Contents
The movement in the different categories of property, plant and equipment from January 1, 2010 to December 31, 2011 is shown below:
(a) As of December 31, 2010
| Construction in progress ThUS$ | Land ThUS$ | Buildings Net ThUS$ | Plant and equipment net ThUS$ | Information technology equipment net ThUS$ | Fixed installations & accessories net ThUS$ | Motor vehicles net ThUS$ | Leasehold improvements net ThUS$ | Other property, plant and equipment net ThUS$ | Property, Plant and equipment net ThUS$ | |||||||||||||||||||||||||||||||
Opening balance as of January 1, 2010 | 264,259 | 35,538 | 81,966 | 3,231,682 | 15,043 | 23,659 | 951 | 50,286 | 493,172 | 4,196,556 | ||||||||||||||||||||||||||||||
Additions | 10,229 | — | 115 | 571,422 | 9,516 | 2,341 | 420 | 2,410 | 6,673 | 603,126 | ||||||||||||||||||||||||||||||
|
|
|
|
|
|
|
|
|
|
|
|
|
|
|
|
|
|
|
| |||||||||||||||||||||
Acquisitions through business combination | — | — | 1,006 | 490 | 137 | 335 | 107 | — | 480 | 2,555 | ||||||||||||||||||||||||||||||
|
|
|
|
|
|
|
|
|
|
|
|
|
|
|
|
|
|
|
| |||||||||||||||||||||
Disposals | — | — | — | (190 | ) | — | — | (7 | ) | — | (2 | ) | (199 | ) | ||||||||||||||||||||||||||
|
|
|
|
|
|
|
|
|
|
|
|
|
|
|
|
|
|
|
| |||||||||||||||||||||
Transfers (to) from non-current assets (or disposal groups) classified as Held for Sale | — | — | — | 2,552 | — | — | — | — | — | 2,552 | ||||||||||||||||||||||||||||||
|
|
|
|
|
|
|
|
|
|
|
|
|
|
|
|
|
|
|
| |||||||||||||||||||||
Retirements | — | — | — | (6,633 | ) | (536 | ) | (2 | ) | (12 | ) | — | (2,550 | ) | (9,733 | ) | ||||||||||||||||||||||||
|
|
|
|
|
|
|
|
|
|
|
|
|
|
|
|
|
|
|
| |||||||||||||||||||||
Depreciation | — | — | (2,315 | ) | (235,800 | ) | (5,217 | ) | (3,997 | ) | (172 | ) | (16,797 | ) | (32,315 | ) | (296,613 | ) | ||||||||||||||||||||||
|
|
|
|
|
|
|
|
|
|
|
|
|
|
|
|
|
|
|
| |||||||||||||||||||||
Increases (decreases) due to exchanges differences | (62 | ) | — | — | (857 | ) | 16 | (13 | ) | (3 | ) | — | (27 | ) | (946 | ) | ||||||||||||||||||||||||
|
|
|
|
|
|
|
|
|
|
|
|
|
|
|
|
|
|
|
| |||||||||||||||||||||
Other increases (decreases) | 441,177 | — | (651 | ) | 100,470 | (360 | ) | 4,680 | 6 | 8,221 | (102,411 | ) | 451,132 | |||||||||||||||||||||||||||
|
|
|
|
|
|
|
|
|
|
|
|
|
|
|
|
|
|
|
| |||||||||||||||||||||
Changes, total | 451,344 | — | (1,845 | ) | 431,454 | 3,556 | 3,344 | 339 | (6,166 | ) | (130,152 | ) | 751,874 | |||||||||||||||||||||||||||
|
|
|
|
|
|
|
|
|
|
|
|
|
|
|
|
|
|
|
| |||||||||||||||||||||
Closing balance as of December 31, 2010 | 715,603 | 35,538 | 80,121 | 3,663,136 | 18,599 | 27,003 | 1,290 | 44,120 | 363,020 | 4,948,430 | ||||||||||||||||||||||||||||||
|
|
|
|
|
|
|
|
|
|
|
|
|
|
|
|
|
|
|
| |||||||||||||||||||||
| | 171 |
Table of Contents
b) As of December 31, 2011
| Construction in progress ThUS$ | Land ThUS$ | Buildings Net ThUS$ | Plant and equipment net ThUS$ | Information technology equipment net ThUS$ | Fixed installations & accessories net ThUS$ | Motor vehicles net ThUS$ | Leasehold improvements net ThUS$ | Other property. plant and equipment net ThUS$ | Property, Plant and equipment net ThUS$ | |||||||||||||||||||||||||||||||
Opening balance as of January 1, 2011 | 715,603 | 35,538 | 80,121 | 3,663,136 | 18,599 | 27,003 | 1,290 | 44,120 | 363,020 | 4,948,430 | ||||||||||||||||||||||||||||||
Additions | 29,898 | — | 1,111 | 1,028,568 | 11,885 | 6,663 | 543 | 6,555 | 19,072 | 1,104,295 | ||||||||||||||||||||||||||||||
|
|
|
|
|
|
|
|
|
|
|
|
|
|
|
|
|
|
|
| |||||||||||||||||||||
Acquisitions through business combination | — | — | — | — | — | — | — | — | 16 | 16 | ||||||||||||||||||||||||||||||
|
|
|
|
|
|
|
|
|
|
|
|
|
|
|
|
|
|
|
| |||||||||||||||||||||
Disposals | — | — | (2,681 | ) | (109,936 | ) | (8 | ) | — | (6 | ) | — | (537 | ) | (113,168 | ) | ||||||||||||||||||||||||
|
|
|
|
|
|
|
|
|
|
|
|
|
|
|
|
|
|
|
| |||||||||||||||||||||
Transfers (to) from non-current assets (or disposal groups) classified as Held for Sale | (127 | ) | — | — | (112 | ) | (1,195 | ) | (588 | ) | (1 | ) | — | (115 | ) | (2,138 | ) | |||||||||||||||||||||||
|
|
|
|
|
|
|
|
|
|
|
|
|
|
|
|
|
|
|
| |||||||||||||||||||||
Retirements | (150 | ) | — | (4 | ) | (4,817 | ) | (85 | ) | (23 | ) | (17 | ) | — | (332 | ) | (5,428 | ) | ||||||||||||||||||||||
|
|
|
|
|
|
|
|
|
|
|
|
|
|
|
|
|
|
|
| |||||||||||||||||||||
Depreciation | — | — | (3,302 | ) | (265,062 | ) | (6,354 | ) | (3,602 | ) | (215 | ) | (19,938 | ) | (30,608 | ) | (329,081 | ) | ||||||||||||||||||||||
|
|
|
|
|
|
|
|
|
|
|
|
|
|
|
|
|
|
|
| |||||||||||||||||||||
Increases (decreases) due to exchanges differences | (852 | ) | — | (95 | ) | (771 | ) | (63 | ) | (54 | ) | 18 | — | (95 | ) | (1,912 | ) | |||||||||||||||||||||||
|
|
|
|
|
|
|
|
|
|
|
|
|
|
|
|
|
|
|
| |||||||||||||||||||||
Other increases (de-creases) | 343,191 | 135 | 2,788 | (169,021 | ) | (188 | ) | 5,699 | 25 | 762 | 143,577 | 326,968 | ||||||||||||||||||||||||||||
|
|
|
|
|
|
|
|
|
|
|
|
|
|
|
|
|
|
|
| |||||||||||||||||||||
Changes, total | 371,960 | 135 | (2,183 | ) | 478,849 | 3,992 | 8,095 | 347 | (12,621 | ) | 130,978 | 979,552 | ||||||||||||||||||||||||||||
|
|
|
|
|
|
|
|
|
|
|
|
|
|
|
|
|
|
|
| |||||||||||||||||||||
Closing balance as of December 31, 2010 | 1,087,563 | 35,673 | 77,938 | 4,141,985 | 22,591 | 35,098 | 1,637 | 31,499 | 493,998 | 5,927,982 | ||||||||||||||||||||||||||||||
|
|
|
|
|
|
|
|
|
|
|
|
|
|
|
|
|
|
|
| |||||||||||||||||||||
| | 172 |
Table of Contents
c) Composition of the fleet
Aircraft included in the company’s property, plant and equipment:
Aircraft | Model | As of December 31, 2011 | As of December 31, 2010 | |||||||||
Boeing 767 | 300ER | 21 | 18 | |||||||||
Boeing 767 | 300F | 8 | 8 | |||||||||
Boeing 767 | 200ER | (*) | 1 | 1 | ||||||||
Airbus A318 | 100 | 10 | 15 | |||||||||
Airbus A319 | 100 | 24 | 20 | |||||||||
Airbus A320 | 200 | 33 | 24 | |||||||||
Airbus A340 | 300 | 4 | 4 | |||||||||
|
|
|
| |||||||||
Total | 101 | 90 | ||||||||||
|
|
|
| |||||||||
| (*) | Leased to Aerovias de Mexico S.A. |
Operating leases:
Aircraft | Model | As of December 31, 2011 | As of December 31, 2010 | |||||||||
Boeing 767 | 300ER | 10 | 10 | |||||||||
Boeing 767 | 300F | 4 | 3 | |||||||||
Boeing 777 | Freighter | 2 | 2 | |||||||||
Airbus A320 | 200 | 9 | 5 | |||||||||
Airbus A340 | 300 | 1 | 1 | |||||||||
Boeing 737 | 700 | 9 | 9 | |||||||||
Bombardier | Dhc8-200 | 10 | 11 | |||||||||
Bombardier | Dhc8-400 | 4 | 4 | |||||||||
|
|
|
| |||||||||
Total | 49 | 45 | ||||||||||
Total fleet | 150 | 135 | ||||||||||
| Memoria Anual 2011 » Consolidated Financial Statements | | 173 |
Table of Contents
d) Method used for the depreciation of property, plant and equipment:
Method | Useful life minimum | Useful life maximum | ||||||||
Buildings | Straight line without residual value | 20 | 50 | |||||||
Plant and equipment | Straight line with residual value of 20% in the short-haul fleet and 36% in the long-haul fleet (*) | 5 | 20 | |||||||
Information technology equipment | Straight line without residual value | 5 | 10 | |||||||
Fixed installations and accessories | Straight line without residual value | 10 | 10 | |||||||
Motor vehicle | Straight line without residual value | 10 | 10 | |||||||
Leasehold improvements | Straight line without residual value | 5 | 5 | |||||||
Other property, plant and equipment | Straight line with residual value of 20% in the short-haul fleet and 36% in the long-haul fleet (*) | 3 | 20 | |||||||
| (*) | Except for certain technical components, which are depreciated on the basis of cycles and flight hours. |
The depreciation charged to income in the period ended December 31, 2011, which is included in the consolidated statement of income, amounts to ThUS$ 329,081 (ThUS$ 296,613 for the period ended December 31, 2010). Depreciation charges for the year are recognized in Cost of Sales and Administrative Expenses in the consolidated statement of income.
(e) Additional information regarding property, plant and equipment:
(i) Property, plant and equipment pledged as guarantee:
In the year ended December 31, 2011 direct guarantees were added for sixteen aircraft, nine of them corresponding to the Airbus A320-200 fleet, four to the Airbus A319-100
fleet and three to Boeing B767-300 fleet. Moreover, in the second quarter of 2011 the Company sold three aircraft Airbus A318-100 fleet and in the third quarter two more of the same aircraft A318-100 fleet. Additionally, during the first quarter 2011, the Company sold its participation in the permanent establishments Cernicalo Leasing LLC and Petrel Leasing LLC. Therefore the Company eliminated direct guarantees associated with five aircraft Airbus A318-100 and three aircraft Boeing 767-300 (two freighter and one passenger aircrafts).
| Memoria Anual 2011 » Consolidated Financial Statements | | 174 |
Table of Contents
![]()
Description of property, plant and equipment pledged as guarantee:
| As of December 31, 2011 | As of December 31, 2010 | |||||||||||||||||||
Creditor of guarantee | Assets committed | Fleet | Existing debt ThUS$ | Book value ThUS$ | Existing debt ThUS$ | Book value ThUS$ | ||||||||||||||
Wilmington | Aircraft and | Boeing 767 | 1,032,921 | 1,305,915 | 1,043,290 | 1,304,699 | ||||||||||||||
Trust Company | engines | Boeing 777 | 13,750 | 24,664 | 18,088 | 25,915 | ||||||||||||||
BNP Paribas | Aircraft and | Airbus A318 | 187,705 | 239,530 | 299,422 | 359,944 | ||||||||||||||
engines | Airbus A319 | 390,614 | 521,829 | 297,320 | 370,476 | |||||||||||||||
Airbus A320 | 695,308 | 855,214 | 407,275 | 478,082 | ||||||||||||||||
Credite Agricole | Aircraft and | Airbus A319 | 93,019 | 158,355 | 108,803 | 178,342 | ||||||||||||||
(*) | engines | Airbus A320 | 34,530 | 149,486 | 58,236 | 172,426 | ||||||||||||||
Airbus A340 | 54,491 | 215,978 | 89,378 | 234,892 | ||||||||||||||||
|
|
|
|
|
|
|
| |||||||||||||
Total direct guarantee | 2,502,338 | 3,470,971 | 2,321,812 | 3,124,776 | ||||||||||||||||
|
|
|
|
|
|
|
| |||||||||||||
| (*) | Calyon creditor of guarantee renamed Credite Agricole |
The amounts of existing debt are presented at nominal value. Book value corresponds to the carrying value of the goods provided as guarantees.
Additionally, there are indirect guarantees related to assets recorded in property, plant and equipment whose total debt at December 31, 2011 amounted to ThUS $ 316,859 (ThUS $ 227,218 at December 31, 2010). The book value
of assets with indirect guarantees as of December 31, 2011 amounts to ThUS$ 504,355 (ThUS$ 328,838 as of December 31, 2010).
(ii) Commitments and others
Fully depreciated assets and commitments for future purchases are as follows:
| As of December 31, 2011 ThUS$ | As of December 31, 2010 ThUS$ | |||||||
Gross book value of fully depreciated property, plant and equipment still in use | 43,626 | 57,612 | ||||||
Commitments for the acquisition of aircraft | 14,500,000 | 12,350,000 | ||||||
| Memoria Anual 2011 » Consolidated Financial Statements | | 175 |
Table of Contents
In December 2009, the Company signed a purchase commitment with Airbus for the purchase of 30 aircraft of the A320 family with deliveries between 2011 and 2016. Later, in December 2010 the Company made another commitment to the manufacturer for the purchase of 50 A320 family aircraft with deliveries between 2012 and 2016. Additionally, in June 2011, the Company signed a contract for 20 additional aircraft of the A320 NEO family with deliveries between 2017 and 2018.
With regards to the above, as of December 31, 2011, and as a result of different aircraft purchase contracts signed with Airbus S.A.S., there remain 90 Airbus aircraft of the A320 family to be delivered between 2012 and 2018. The approximate amount is ThUS$ 7,000,000, according to the manufacturer’s price list. Additionally, the Company has active purchase options for 4 A320 NEO aircraft.
In addition, purchase contracts were signed with The Boeing Company in February, May and December 2011 for 3, 5 and 2 B767-300 aircraft, respectively.
As of December 31, 2011 and a as result of different aircraft contracts signed with The Boeing Company, 13 B767-300 aircraft remain to be delivered between 2012 and 2013, 2 B77-Freighter aircraft for delivery in 2012 and 26 B787 Dreamliner, aircraft with delivery dates from 2012. The approximate amount is ThUS$ 7,500,000, according to the manufacturer’s price list. In addition, the Company has purchase options over 1 B777-Freighter aircraft and 15 B787 Dreamliner aircraft.
The acquisition of the aircraft is part of the strategic plan for long haul fleet. This plan also means the sale of 15 aircraft model Airbus A318 between 2011 and 2013. It is estimated that this sale will have no significant impact on results. During the third quarter of 2011 the Company sold the last 2 aircraft planned to be sold during 2011, thus completing the planned sale of 5 aircraft this year.
(iii) Capitalized interest costs with respect to property, plant and equipment.
| For the year ended December 31, | ||||||||||||
| 2011 | 2010 | |||||||||||
Average rate of capitalization of capitalized interest costs | % | 3.51 | 4.31 | |||||||||
Costs of capitalized interest | ThUS$ | 33,342 | 18,400 | |||||||||
| Memoria Anual 2011 » Consolidated Financial Statements | | 176 |
Table of Contents
iv) Financial leases
The detail of the main financial leases is as follows:
Lessor | Aircraft | Model | As of December 31, 2011 ThUS$ | As of December 31, 2010 ThUS$ | ||||||||
Bluebird Leasing LLC | Boeing 767 | 300F | 2 | 2 | ||||||||
Eagle Leasing LLC | Boeing 767 | 300ER | 1 | 2 | ||||||||
Seagull Leasing LLC | Boeing 767 | 300F | 1 | 1 | ||||||||
Cernicalo Leasing LLC | Boeing 767 | 300F | 2 | — | ||||||||
Petrel Leasing LLC | Boeing 767 | 300ER | 1 | — | ||||||||
Linnet Leasing Limited | Airbus A320 | 200 | 4 | 4 | ||||||||
|
|
|
| |||||||||
Total | 11 | 9 | ||||||||||
|
|
|
| |||||||||
Leasing contracts where the Company acts as the lessee of aircrafts establish a 12 year term and quarterly payments of obligations.
Additionally, the lessee will have the obligations to contract and maintain active the insurance coverage for the aircraft, perform maintenance on the aircraft and update the airworthiness certificates at their own cost.
Fixed assets acquired under financial leases are classified as Other property, plant and equipment. As of December 31, 2011, the Company had eleven aircraft as financial leases (nine aircraft as of December 31, 2010).
In the year ended December 31, 2011, due to the sale of its participation in the permanent establishments Cernicalo Leasing LLC and Petrel Leasing LLC, the Company increased
its number of aircraft on lease by three Boeing 767-300 (two freighter and one passenger aircrafts). Therefore, these aircraft were reclassified from the Plant and equipment category to the category other property plant and equipment. Additionally, in November 2011 the Company excercised a purchase option for a B767-300 freighter belongs to the Eagle Leasing LLC, which was reclassified from Other property, plant and equipment to Plant and equipment.
The book value of assets under financial leases as of December 31, 2011 amounts to ThUS$ 464,082 (ThUS$ 328,838 as of December 31, 2010).
| Memoria Anual 2011 » Consolidated Financial Statements | | 177 |
Table of Contents
The minimum payments under financial leases are as follows:
As of December 31, 2011
| Gross value ThUS$ | Interest ThUS$ | Present value ThUS$ | ||||||||||
No later than one year | 78,369 | (7,622 | ) | 70,747 | ||||||||
Between one and five years | 207,365 | (18,657 | ) | 188,708 | ||||||||
Over five years | 59,152 | (2,078 | ) | 57,074 | ||||||||
|
|
|
|
|
| |||||||
Total | 344,886 | (28,357 | ) | 316,529 | ||||||||
|
|
|
|
|
| |||||||
As of December 31, 2010
| Gross value ThUS$ | Interest ThUS$ | Present value ThUS$ | ||||||||||
No later than one year | 57,976 | (3,679 | ) | 54,297 | ||||||||
Between one and five years | 127,370 | (7,421 | ) | 119,949 | ||||||||
Over five years | 55,106 | (1,781 | ) | 53,325 | ||||||||
|
|
|
|
|
| |||||||
Total | 240,452 | (12,881 | ) | 227,571 | ||||||||
|
|
|
|
|
| |||||||
| Memoria Anual 2011 » Consolidated Financial Statements | | 178 |
Table of Contents
Deferred tax assets and liabilities are offset if there is a legal right to offset assets and liabilities for income taxes relating to the same tax authority.
The balances of deferred taxes are as follows:
| Assets | Liabilities | |||||||||||||||
Concept | As of December 31, 2011 ThUS$ | As of December 31, 2010 ThUS$ | As of December 31, 2011 ThUS$ | As of December 31, 2010 ThUS$ | ||||||||||||
Depreciation | (547 | ) | (415 | ) | 338,741 | 290,254 | ||||||||||
Amortization | 14,255 | 12,286 | 36,667 | 29,606 | ||||||||||||
Provisions | 7,036 | 8,128 | 48,681 | 23,017 | ||||||||||||
Post-employment benefit obligations | 865 | 622 | (924 | ) | (982 | ) | ||||||||||
Revaluation of financial instruments | — | — | (28,788 | ) | (21,926 | ) | ||||||||||
Tax losses | 35,300 | 13,229 | — | — | ||||||||||||
Others | 3,239 | 4,234 | (24,752 | ) | (7,957 | ) | ||||||||||
|
|
|
|
|
|
|
| |||||||||
Total | 60,148 | 38,084 | 369,625 | 312,012 | ||||||||||||
|
|
|
|
|
|
|
| |||||||||
| Memoria Anual 2011 » Consolidated Financial Statements | | 179 |
Table of Contents
Movements of deferred tax assets and liabilities from January 1, 2010 to December 31, 2011 are as follows:
(a) From January 1 to December 31, 2010
| Beginning balance asset (liabilities) ThUS$ | Recognized in consolidated income ThUS$ | Recognized in comprehensive income ThUS$ | Incorporation by business combinations ThUS$ | Others ThUS$ | Ending balance asset (liabilities) ThUS$ | |||||||||||||||||||
Depreciation | (222,188 | ) | (68,481 | ) | — | — | — | (290,669 | ) | |||||||||||||||
Amortization | (22,453 | ) | (5,948 | ) | — | 11,081 | — | (17,320 | ) | |||||||||||||||
Provisions | (2,102 | ) | (17,968 | ) | — | 5,181 | — | (14,889 | ) | |||||||||||||||
Post-employment benefit obligations | 1,183 | (196 | ) | — | 617 | — | 1,604 | |||||||||||||||||
Revaluation of financial instruments | 18,891 | — | 3,035 | — | — | 21,926 | ||||||||||||||||||
Tax losses | 5,013 | (1,303 | ) | — | 9,519 | — | 13,229 | |||||||||||||||||
Others | (8,311 | ) | 16,645 | (120 | ) | 2,545 | 1,432 | 12,191 | ||||||||||||||||
|
|
|
|
|
|
|
|
|
|
|
| |||||||||||||
Total | (229,967 | ) | (77,251 | ) | 2,915 | 28,943 | 1,432 | (273,928 | ) | |||||||||||||||
|
|
|
|
|
|
|
|
|
|
|
| |||||||||||||
(b) From January 1 to december 31, 2011
| Beginning balance asset (liabilities) ThUS$ | Recognized in consolidated income ThUS$ | Recognized in comprehensive income ThUS$ | Incorporation by business combinations ThUS$ | Reclassification ThUS$ | Others ThUS$ | Sale of investment ThUS$ | Ending balance asset (liabilities) ThUS$ | |||||||||||||||||||||||||
Depreciation | (290,669 | ) | (48,614 | ) | — | — | — | — | (5 | ) | (339,288 | ) | ||||||||||||||||||||
Amortization | (17,320 | ) | (8,903 | ) | — | 3,811 | — | — | — | (22,412 | ) | |||||||||||||||||||||
Provisions | (14,889 | ) | (26,368 | ) | — | — | — | ��� | (388 | ) | (41,645 | ) | ||||||||||||||||||||
Post-employment benefit obligations | 1,604 | 185 | — | — | — | — | — | 1,789 | ||||||||||||||||||||||||
Revaluation of financial instruments | 21,926 | — | 6,862 | — | — | — | — | 28,788 | ||||||||||||||||||||||||
Tax losses | 13,229 | 28,716 | — | — | (6,645 | ) | — | — | 35,300 | |||||||||||||||||||||||
Others | 12,191 | 16,542 | 1,846 | — | — | (2,521 | ) | (67 | ) | 27,991 | ||||||||||||||||||||||
|
|
|
|
|
|
|
|
|
|
|
|
|
|
|
| |||||||||||||||||
Total | (273,928 | ) | (38,442 | ) | 8,708 | 3,811 | (6,645 | ) | (2,521 | ) | (460 | ) | (309,477 | ) | ||||||||||||||||||
|
|
|
|
|
|
|
|
|
|
|
|
|
|
|
| |||||||||||||||||
| Memoria Anual 2011 » Consolidated Financial Statements | | 180 |
Table of Contents
Deferred tax assets not recognized: | As of December 31, 2011 ThUS$ | As of December 31, 2011 ThUS$ | ||||||
Temporary differences | 2,152 | 2,152 | ||||||
Tax losses | 35 | 1,662 | ||||||
|
|
|
| |||||
Total Deferred tax assets not recognized | 2,187 | 3,814 | ||||||
|
|
|
| |||||
Deferred income tax assets are recognized for tax loss carry-forwards to the extent that the realization of the related tax benefit through future taxable profits is probable. The Company did not recognize deferred income tax assets of ThUS$ 35 (ThUS$ 1,662 at December 31, 2010) in respect to losses amounting to ThUS$ 103 (ThUS$ 5,992
at December 31, 2010) that can be carried against future taxable income.
Expense (income) for deferred and current income taxes for the years ended at December 31, 2011 and December 31, 2010, respectively, are as follows:
| For the year ended December 31, | ||||||||
| 2011 ThUS$ | 2010 ThUS$ | |||||||
Expense for current income tax | ||||||||
Current tax expense | 19,470 | 8,890 | ||||||
|
|
|
| |||||
Adjustment to previous year’s current tax | 3,877 | (3,153 | ) | |||||
|
|
|
| |||||
Other current tax expense (income) | — | (1,881 | ) | |||||
Total current tax expense, net | 23,347 | 3,856 | ||||||
Expense for deferred income taxes | ||||||||
Deferred expense (income) for taxes related to creation and reversal of temporary differences | 40,051 | 75,284 | ||||||
|
|
|
| |||||
Reduction (increase) in value of deferred tax assets | (1,609 | ) | 1,967 | |||||
Total deferred tax expense, net | 38,442 | 77,251 | ||||||
Income tax expense | 61,789 | 81,107 | ||||||
|
|
|
| |||||
| Memoria Anual 2011 » Consolidated Financial Statements | | 181 |
Table of Contents
Composition of income tax expense (income):
| For the year ended December 31, | ||||||||
| 2011 ThUS$ | 2010 ThUS$ | |||||||
Current tax expense, net, foreign | 4,486 | 1,121 | ||||||
Current tax expense, net, Chile | 18,861 | 2,735 | ||||||
|
|
|
| |||||
Total current tax expense, net | 23,347 | 3,856 | ||||||
|
|
|
| |||||
Deferred tax expense, net, foreign | (20,876 | ) | 3,724 | |||||
Deferred tax expense, net, Chile | 59,318 | 73,527 | ||||||
|
|
|
| |||||
Deferred tax expense, net, total | 38,442 | 77,251 | ||||||
|
|
|
| |||||
Income tax expense | 61,789 | 81,107 | ||||||
|
|
|
| |||||
Reconciliation of tax expense using the legal rate to the tax expense using the effective rate:
| For the year ended December 31, | ||||||||
| 2011 ThUS$ | 2010 ThUS$ | |||||||
Tax expense using the legal rate | 76,410 | 85,138 | ||||||
Tax effect of legal rate change | (10,571 | ) | — | |||||
Tax effect of rates in other jurisdictions | 1,916 | 1,491 | ||||||
Tax effect of non-taxable operating revenues | (11,094 | ) | (4,089 | ) | ||||
Tax effect of disallowable expenses | 5,087 | 849 | ||||||
Tax effect of current period tax losses not recognized | — | 1,967 | ||||||
Other increases (decreases) | 41 | (4,249 | ) | |||||
Total adjustments to tax expense using the legal rate | (14,621 | ) | (4,031 | ) | ||||
Tax expense using the effective rate | 61,789 | 81,107 | ||||||
| Memoria Anual 2011 » Consolidated Financial Statements | | 182 |
Table of Contents
Reconciliation of legal tax rate to effective tax rate:
| For the year ended December 31, | ||||||||
| 2011 % | 2010 % | |||||||
Legal tax rate | 20.00 | 17.00 | ||||||
Effect of tax rates for legal rate change | (2.77 | ) | — | |||||
Effect of tax rates in other jurisdictions | 0.50 | 0.30 | ||||||
Effect of tax rate on non-taxable operating revenues | (2.89 | ) | (0.82 | ) | ||||
Effect of tax rate on disallowable expenses | 1.33 | 0.17 | ||||||
Effect of tax rate on use of not-previously recognized tax losses | — | 0.39 | ||||||
Other increase (decrease) | 0.01 | (0.84 | ) | |||||
Total adjustment to the legal tax rate | (3.82 | ) | (0.80 | ) | ||||
Total effective tax rate | 16.18 | 16.20 | ||||||
Deferred taxes related to items charged to net equity:
| For the year ended December 31, | ||||||||
| 2011 ThUS$ | 2010 ThUS$ | |||||||
Aggregate deferred taxation of components of other comprehensive income | 8,708 | 2,915 | ||||||
Aggregate deferred taxation related to items charged to net equity | (355 | ) | (599 | ) | ||||
|
|
|
| |||||
Total deferred taxes related to items charged to net equity | 8,353 | 2,316 | ||||||
|
|
|
| |||||
| Memoria Anual 2011 » Consolidated Financial Statements | | 183 |
Table of Contents
Deferred tax effects of the components of other comprehensive income:
As of December 31, 2011
| Amount before taxes ThUS$ | Income tax expense (income) ThUS$ | Amount after taxes ThUS$ | ||||||||||
Cash-flow hedges | 40,368 | (6,862 | ) | 33,506 | ||||||||
Translation adjustment | 10,864 | (1,846 | ) | 9,018 | ||||||||
|
|
|
|
|
| |||||||
| (8,708 | ) | |||||||||||
|
| |||||||||||
As of December 31, 2010
| Amount before taxes ThUS$ | Income tax expense (income) ThUS$ | Amount after taxes ThUS$ | ||||||||||
Cash-flow hedges | 17,855 | (3,035 | ) | 14,820 | ||||||||
Translation adjustment | (708 | ) | 120 | (588 | ) | |||||||
|
|
|
|
|
| |||||||
| (2,915 | ) | |||||||||||
|
| |||||||||||
| Memoria Anual 2011 » Consolidated Financial Statements | | 184 |
Table of Contents
NOTE 20 – Other financial liabilities
The composition of other financial liabilities is as follows:
| As of December 31, 2011 ThUS$ | As of December 31, 2010 ThUS$ | |||||||
Current | ||||||||
(a) Bank loans | 537,334 | 495,261 | ||||||
(b) Other financial liabilities | 4,907 | 5,321 | ||||||
(c) Hedge liabilities | 40,016 | 42,042 | ||||||
Total Current | 582,257 | 542,624 | ||||||
Non-current | ||||||||
(a) Bank loans | 2,978,973 | 2,450,033 | ||||||
(b) Other financial liabilities | 9,859 | 14,427 | ||||||
(c) Hedge liabilities | 120,304 | 97,888 | ||||||
Total Non-current | 3,109,136 | 2,562,348 | ||||||
a) Interest bearing loans
Obligations with credit institutions and debt instruments:
| As of December 31, 2011 ThUS$ | As of December 31, 2010 ThUS$ | |||||||
Current | ||||||||
Bank loans | 153,765 | 151,417 | ||||||
Guaranteed obligations | 310,217 | 283,637 | ||||||
Financial leases | 70,747 | 54,297 | ||||||
Other loans | 2,605 | 5,910 | ||||||
Total current | 537,334 | 495,261 | ||||||
Non-current | ||||||||
Bank loans | 247,725 | 146,884 | ||||||
Guaranteed obligations | 2,159,055 | 2,023,666 | ||||||
Financial leases | 245,782 | 173,274 | ||||||
Other loans | 326,411 | 106,209 | ||||||
Total non-current | 2,978,973 | 2,450,033 | ||||||
Total obligations with financial institutions | 3,516,307 | 2,945,294 | ||||||
| | 185 |
Table of Contents
All interest-bearing liabilities are recorded using the effective interest rate method. Under IFRS, the effective interest rate for loans with a fixed interest rate does not vary throughout the loan, while in the case of loans with variable interest rates, the effective rate changes on each date of repricing of the loan.
Currency balances that make the interest bearing loans at December 31, 2011 and December 31, 2010, are as follows:
| As of December 31, 2011 ThUS$ | Al 31 de diciembre de 2010 ThUS$ | |||||||
US Dollar | 3,516,307 | 2,753,788 | ||||||
Chilean Peso (*) | — | 187,101 | ||||||
Colombian Peso | — | 4,405 | ||||||
|
|
|
| |||||
Total | 3,516,307 | 2,945,294 | ||||||
|
|
|
| |||||
| (*) | At December 2010, the Company maintained cross currency swaps, securing the payment of ThU$ 128,056 of debt in dollars. At December 2011, these contracts were closed because the loans in Chilean pesos were paid and one of them converted to U.S. dollar. |
| Memoria Anual 2011 » Consolidated Financial Statements | | 186 |
Table of Contents
b) Other financial liabilities
The detail of other financial liabilities as of December 31, 2011 and December 31, 2010, respectively, is as follows:
| As of December 31, 2011 ThUS$ | As of December 31, 2010 ThUS$ | |||||||
Current | ||||||||
Interest rate derivative not recognized as a hedge | 4,907 | 5,321 | ||||||
Total current | 4,907 | 5,321 | ||||||
Non-current | ||||||||
Interest rate derivative not recognized as a hedge | 9,859 | 14,427 | ||||||
Total non-current | 9,859 | 14,427 | ||||||
Total other financial liabilities | 14,766 | 19,748 | ||||||
c) Hedging liabilities
Hedging liabilities as of December 31, 2011 and December 31, 2010 are as follows:
| As of December 31, 2011 ThUS$ | As of December 31, 2010 ThUS$ | |||||||
Current | ||||||||
Interest from the last date of interest rate swap | 5,027 | 3,826 | ||||||
Fair value interest rate derivatives | 34,105 | 24,522 | ||||||
Fair value of foreign currency derivatives | 884 | 13,694 | ||||||
Total current | 40,016 | 42,042 | ||||||
Non-current | ||||||||
Fair value interest rate derivatives | 120,304 | 90,666 | ||||||
Fair value of foreign currency derivatives | — | 7,222 | ||||||
Total non-current | 120,304 | 97,888 | ||||||
Total hedging liabilities | 160,320 | 139,930 | ||||||
| Memoria Anual 2011 » Consolidated Financial Statements | | 187 |
Table of Contents
The foreign currency derivatives correspond to Cross Currency Swaps and forward exchange contracts.
Hedging operation
The fair values by type of derivative, of the contracts held as hedging instruments are presented below:
| As of December 31, 2011 ThUS$ | As of December 31, 2011 ThUS$ | |||||||
Forward starting swaps (FSS) (1) | (19,703 | ) | (54,670 | ) | ||||
Interest rate options (2) | 73 | 422 | ||||||
Interest rate swaps (3) | (139,733 | ) | (64,344 | ) | ||||
Cross currency swaps (CCIRS) (4) | — | 26,703 | ||||||
Fuel collars (5) | 19,016 | 17,782 | ||||||
Fuel swap (6) | 11,599 | 28,032 | ||||||
Currency forward (7) | (253 | ) | (13,694 | ) | ||||
| (1) | Covers the significant variations in cash flows associated with market risk implicit in the changes in the 3-month LIBOR interest rate for long-term loans incurred in the acquisition of aircraft to be produced from the future contract date. These contracts are recorded as cash flow hedges. |
| (2) | Covers the significant variations in cash flows associated with market risk implicit in the changes in the 3-month LIBOR interest rate for long-term loans incurred in the acquisition of aircraft. These contracts are recorded as cash flow hedges. |
| (3) | Covers the significant variations in cash flows associated with market risk implicit in the increases in the 3, 6 and 12 months LIBOR interest rates for long-term loans incurred in the acquisition of aircraft and bank loans. These contracts are recorded as cash flow hedges. |
| (4) | Covers the significant variations in cash flows associated with market risk implicit in the changes in the TAB 180 days interest rate and the US dollar-Chilean peso exchange rate. These contracts are recorded as cash flow hedges. |
| (5) | Covers significant variations in cash flows associated with market risk implicit in the changes in the price of future fuel purchases. |
| (6) | Covers the significant variations in cash flows associated with market risk implicit in the changes in the price of future fuel purchases. |
| (7) | Covers investments denominated in Chilean pesos to changes in the US Dollar - Chilean Peso exchange rate, with the aim of ensuring investment in dollars. |
| Memoria Anual 2011 » Consolidated Financial Statements | | 188 |
Table of Contents
During the years presented, the Company only maintains cash flow hedges. In the case of fuel hedges, the cash flows subject to said hedges will impact results between 1 to 9 months from the consolidated statement of financial position date, whereas in the case of interest rate hedging, the hedges will impact results over the life of the related loans, which are valid for 12 years. With respect to interest and currency hedges, the impact on results will occur continuously throughout the life of the contract (3 years), while cash flows will occur quarterly. Finally, the hedges on investments will impact results continuously throughout the life of the investment (up to 3 months), while the cash flows occur at the maturity of the investment.
During the years presented, all hedged highly probable forecast transactions have occurred.
During the years presented, there has been no hedge ineffectiveness recognized in the consolidated statement of income.
Since none of the coverage resulted in the recognition of a non-financial asset, no portion of the result of the derivatives recognized in equity was transferred to the initial value of such assets.
The amounts recognized in comprehensive income during the year and transferred from net equity to income are as follows:
| For the year ended December 31, | ||||||||
| 2011 ThUS$ | 2010 ThUS$ | |||||||
Debit (credit) recognized in comprehensive income during the year | (40,368 | ) | (17,855 | ) | ||||
Debit (credit) transferred from net equity to income during the year | 62 | (35,010 | ) | |||||
| Memoria Anual 2011 » Consolidated Financial Statements | | 189 |
Table of Contents
NOTE 21 – Trade and other accounts payables
The composition of trade and other accounts payables is as follows:
| As of December 31, 2011 ThUS$ | As of December 31, 2010 ThUS$ | |||||||
Current | ||||||||
(a) Trade and other accounts payable | 531,481 | 500,694 | ||||||
(b) Accrued liabilities at the reporting date | 113,605 | 144,877 | ||||||
Total trade and other accounts payables | 645,086 | 645,571 | ||||||
a)Trade and other accounts payable as of December 31, 2011 and December 31, 2010 are as follows:
| As of December 31, 2011 ThUS$ | As of December 31, 2010 ThUS$ | |||||||
Trade creditors | 410,533 | 389,568 | ||||||
Leasing obligations | 18,849 | 26,474 | ||||||
Other accounts payable (*) | 102,099 | 84,652 | ||||||
|
|
|
| |||||
Total | 531,481 | 500,694 | ||||||
|
|
|
| |||||
| (*) | Includes agreement entitled “Plea Agreement” with the Department of Justice of the United States of America. See detail in Note 22. |
| Memoria Anual 2011 » Consolidated Financial Statements | | 190 |
Table of Contents
Trade and other accounts payables by concept:
| As of December 31, 2011 ThUS$ | As of December 31, 2010 ThUS$ | |||||||
Aircraft fuel | 134,088 | 104,404 | ||||||
Boarding Fee | 80,253 | 72,864 | ||||||
Landing and other aviation fees | 41,900 | 43,941 | ||||||
Suppliers’ technical purchases | 36,387 | 29,594 | ||||||
Handling and ground handling | 34,743 | 39,915 | ||||||
Other personnel expenses | 32,833 | 21,445 | ||||||
Professional services and advisory | 29,870 | 21,275 | ||||||
Marketing | 22,183 | 21,041 | ||||||
Aircraft and engines leasing | 18,849 | 26,474 | ||||||
U.S.A Department of Justice (*) | 18,387 | 18,387 | ||||||
In-flight services | 12,929 | 11,761 | ||||||
Maintenance | 11,252 | 8,188 | ||||||
Crew | 9,780 | 28,658 | ||||||
Aviation insurance | 6,274 | 5,931 | ||||||
Communication | 5,881 | 3,146 | ||||||
Others | 35,872 | 42,670 | ||||||
|
|
|
| |||||
Total trade and other accounts payables | 531,481 | 500,694 | ||||||
|
|
|
| |||||
| (*) | Includes agreement entitled “Plea Agreement” with the Department of Justice of the United States of America. See detail in Note 22. |
| Memoria Anual 2011 » Consolidated Financial Statements | | 191 |
Table of Contents
b) The liabilities accrued at December 31, 2011 and December 31, 2010, are as follows:
| As of December 31, 2011 ThUS$ | As of December 31, 2010 ThUS$ | |||||||
Aircraft and engine maintenance | 11,178 | 26,133 | ||||||
Accounts payable to personnel | 38,391 | 52,441 | ||||||
Accrued personnel expenses | 46,034 | 40,974 | ||||||
Others accrued liabilities | 18,002 | 25,329 | ||||||
|
|
|
| |||||
Total accrued liabilities | 113,605 | 144,877 | ||||||
|
|
|
| |||||
| Memoria Anual 2011 » Consolidated Financial Statements | | 192 |
Table of Contents
The detail of other provisions as of December 31, 2011 and December 31, 2010 is as follows:
| As of December 31, 2011 ThUS$ | As of December 31, 2010 ThUS$ | |||||||
Current | ||||||||
Provision legal claims (1) | 7,363 | 753 | ||||||
Total other provisions, current | 7,363 | 753 | ||||||
Non-current | ||||||||
Provision legal claims (1) | 11,710 | 21,204 | ||||||
Provision for European Commision investigation (2) | 10,675 | 10,916 | ||||||
Total other provisions, non-current | 22,385 | 32,120 | ||||||
Total other provisions | 29,748 | 32,873 | ||||||
| (1) | The amount represents a provisions for certain legal claims made against the Company by former employees, regulatory agencies and others. The charge for the provision is shown in the consolidated statement of income in Administrative expenses. It is expected that the current balance as of December 31, 2011 will be applied during the next 12 months. |
| (2) | Provision made for proceedings brought by the European Commission for possible breaches of free competition in the freight market. |
| Memoria Anual 2011 » Consolidated Financial Statements | | 193 |
Table of Contents
The movement of provisions between January 1, 2010 and December 31, 2011 is as follows:
| Legal claims ThUS$ | European Commission Investigation ThUS$ | Total ThUS$ | ||||||||||
Opening balance as of January 1, 2010 | 2,804 | 25,000 | 27,804 | |||||||||
Increase in provisions | 2,872 | — | 2,872 | |||||||||
Acquisition through business combination | 17,174 | — | 17,174 | |||||||||
Provision used | (681 | ) | — | (681 | ) | |||||||
Reversal of unused provision | — | (14,084 | ) | (14,084 | ) | |||||||
Exchange difference | (212 | ) | — | (212 | ) | |||||||
Balance as of December 31, 2010 | 21,957 | 10,916 | 32,873 | |||||||||
| Legal claims ThUS$ | European Commission Investigation ThUS$ | Total ThUS$ | ||||||||||
Opening balance as of January 1, 2011 | 21,957 | 10,916 | 32,873 | |||||||||
Increase in provisions | 12,085 | — | 12,085 | |||||||||
Provision used | (3,592 | ) | — | (3,592 | ) | |||||||
Reversal of unused provision | (11,518 | ) | — | (11,518 | ) | |||||||
Exchange difference | 141 | (241 | ) | (100 | ) | |||||||
Balance as of December 31, 2011 | 19,073 | 10,675 | 29,748 | |||||||||
| Memoria Anual 2011 » Consolidated Financial Statements | | 194 |
Table of Contents
European Commission Provision:
(a) This provision was established because of the investigation brought by the Directorate General for Competition of the European Commission against more than 25 cargo airlines, including Lan Cargo S.A., as part of a global investigation begun in 2006 regarding possible unfair competition on the air cargo market. This was a joint investigation by the European and U.S.A. authorities. The start of the investigation was disclosed through a significant matter report dated December 27, 2007. The U.S.A. portion of the global investigation concluded when Lan Cargo S.A. and its subsidiary, Aerolíneas Brasileiras S.A. (“ABSA”) signed a Plea Agreement with the U.S.A. Department of Justice, as disclosed in a significant matter report notice on January 21, 2009.
(b) A significant matter report dated November 9, 2010, reported that the General Direction of Competition had issued its decision on this case (the “decision”), under which it imposed fines totaling € 799,445,000 (seven hundred and ninety nine million four hundred and forty-
five thousand Euros) for infringement of European Union regulations on free competition against eleven (11) airlines, among which are Lan Airlines S.A. and Lan Cargo S.A., Air Canada, Air France, KLM, British Airways, Cargolux, Cathay Pacific, Japan Airlines, Qantas Airways, SAS and Singapore Airlines.
(c) Jointly, Lan Airlines S.A. and Lan Cargo S.A., have been fined in the amount of € 8,220,000 (eight million two hundred twenty thousand Euros) for said infractions, which was provisioned in the financial statements of LAN. This is a minor fine in comparison to the original decision, as there was a significant reduction in fine because LAN cooperated during the investigation.
(d) On January 24, 2011, Lan Airlines S.A. and Lan Cargo S.A. appealed the decision before the Court of Justice of the European Union. At December 31, 2011, the provision reached the amount of ThUS$ 10,675 (ThUS$ 10,916 at December 30, 2010)
| Memoria Anual 2011 » Consolidated Financial Statements | | 195 |
Table of Contents
NOTE 23 – Other current non-financial liabilities
Other current non-financial liabilities as of December 31, 2011 and December 31, 2010 are as follows:
| As of December 31, 2011 ThUS$ | As of December 31, 2010 ThUS$ | |||||||
Deferred revenues | 969,873 | 810,524 | ||||||
Dividends payable | 85,318 | 125,435 | ||||||
Other sundry liabilities | 2,446 | 3,192 | ||||||
|
|
|
| |||||
Total other non-financial liabilities, current | 1,057,637 | 939,151 | ||||||
|
|
|
| |||||
| Memoria Anual 2011 » Consolidated Financial Statements | | 196 |
Table of Contents
Provisions for employee benefits as of December 31, 2011 and December 31, 2010, respectively, are as follows:
| As of December 31, 2011 ThUS$ | As of December 31, 2010 ThUS$ | |||||||
Pension payments | 3,559 | 3,164 | ||||||
Termination payments | 280 | 1,161 | ||||||
Other obligations | 9,293 | 5,332 | ||||||
|
|
|
| |||||
Total provisions for employee benefits, non-current | 13,132 | 9,657 | ||||||
|
|
|
| |||||
(a) The movement in payments for termination indemnities and other obligations between January 1, 2010 and December 31, 2011 is as follows:
| ThUS$ | ||||
Opening balance as of January 1, 2010 | 5,555 | |||
Increase (decrease) current service provision | 4,825 | |||
Benefits paid | (723 | ) | ||
Balance as of December 31, 2010 | 9,657 | |||
Opening balance as of January 1, 2011 | 9,657 | |||
Increase (decrease) current service provision | 5,482 | |||
Benefits paid | (2,007 | ) | ||
Balance as of December 31, 2011 | 13,132 | |||
| Memoria Anual 2011 » Consolidated Financial Statements | | 197 |
Table of Contents
(b) The provision for short-term benefits as of December 31, 2011 and December 31, 2010 respectively, is detailed below:
| As of December 31, 2011 ThUS$ | As of December 31, 2010 ThUS$ | |||||||
Profit-sharing and bonuses | 38,391 | 52,441 | ||||||
The participation in profits and bonuses corresponds to an annual incentives plan for achievement of objectives.
(c) Employment expenses are detailed below:
| For the year ended December 31, | ||||||||
| 2011 ThUS$ | 2010 ThUS$ | |||||||
Salaries and wages | 764,396 | 587,148 | ||||||
Short-term employee benefits | 85,681 | 73,335 | ||||||
Termination benefits | 18,207 | 11,751 | ||||||
Other personnel expenses | 144,219 | 121,030 | ||||||
|
|
|
| |||||
Total | 1,012,503 | 793,264 | ||||||
|
|
|
| |||||
| Memoria Anual 2011 » Consolidated Financial Statements | | 198 |
Table of Contents
NOTE 25 – Non-current accounts payable
Non-current accounts payable as of December 31, 2011 and December 31, 2010 are as follows:
| As of December 31, 2011 ThUS$ | As of December 31, 2010 ThUS$ | |||||||
Fleet financing (JOL) | 271,965 | 314,372 | ||||||
Other accounts payable (*) | 36,000 | 54,000 | ||||||
Aircraft and engine maintenance | 38,540 | 47,607 | ||||||
Provision for vacations and bonuses | 7,982 | 7,949 | ||||||
Other sundry liabilities | 443 | 1,753 | ||||||
|
|
|
| |||||
Total non-current liabilities | 354,930 | 425,681 | ||||||
|
|
|
| |||||
| (*) | Agreement entitled “Plea Agreement” with the Department of Justice of United States of America; its short-term part is in trade and other payables. See details in Note 22. |
(a) Capital
The capital of the Company is managed and composed in the following form:
The Company’s objective is to maintain an appropriate level of capitalization that enables it to ensure access to the financial markets for carrying out its medium and long-term objectives, optimizing the return for its shareholders and maintaining a solid financial position.
The capital of the Company at December 31, 2011 amounts to ThUS$ 473,907, divided into 340,326,431 common stock of a same series (ThUS$ 453,444 divided into 338,790,909 shares as of December 31, 2010), no par value. There are no special series of shares and no privileges. The form of its stock certificates and their issuance, exchange, disablement, loss, replacement and other similar circumstances, as well as the transfer of the shares, is governed by the provisions of Corporations Law and its regulations.
| Memoria Anual 2011 » Consolidated Financial Statements | | 199 |
Table of Contents
(b) Subscribed and paid shares
At December 31, 2011, the total number of shares authorized is 488,355,882 shares no par value, according to the capital increase approved at the Extraodinary Shareholders’ Meeting of December 21, 2011 by 147,355,882 ordinary shares no par value. Of this increase, 142,555,882 shares, will be allocated to the proposed merger with companies Sister Holdco S.A. and Holdco II S.A.; and 4,800,000 shares will be allocated to compensation plans for employees of the Company and its subsidiaries. At the end of this year, of the total shares subscribed, before the capital increase mentioned, 340,326,431 shares have been fully paid (includes 7,000 shares paid on 30 December 2011 and registered in the
Register of Shareholders in January 2012), leaving 673,569 shares reserved for issuance under option contracts. Between January 1 and December 31, 2011, options for 1,535,522 shares have been exercised.
At December 31, 2010, of the total subscribed shares 338,790,909 were fully paid, with 2,209,091 stock option contracts reserved for issuance.
(c) Other equity interests
The movement of other equity interest between January 1, 2010 and December 31, 2011 is as follows:
| Stock option plans ThUS$ | Other reserves ThUS$ | Total ThUS$ | ||||||||||
Opening balance as of January 1, 2010 | 2,477 | 13 | 2,490 | |||||||||
Stock option plans | 3,523 | — | 3,523 | |||||||||
Deferred tax | (599 | ) | — | (599 | ) | |||||||
Legal reserves | — | 49 | 49 | |||||||||
Balance as of December 31, 2010 | 5,401 | 62 | 5,463 | |||||||||
| Stock option plans ThUS$ | Other reserves ThUS$ | Total ThUS$ | ||||||||||
Opening balance as of January 1, 2011 | 5,401 | 62 | 5,463 | |||||||||
Stock option plans | 2,084 | — | 2,084 | |||||||||
Deferred tax | (355 | ) | — | (355 | ) | |||||||
Transactions with minority interests | — | (1,801 | ) | (1,801 | ) | |||||||
Capitalization share issuance and placement costs (1) | — | 2,672 | 2,672 | |||||||||
Legal reserves | — | 429 | 429 | |||||||||
Balance as of December 31, 2011 | 7,130 | 1,362 | 8,492 | |||||||||
| (1) | Capitalization share issuance and placement costs caused by the capital increase carried out in 2007, as set out extraordinary share holders meeting held on December 21, 2011. |
| Memoria Anual 2011 » Consolidated Financial Statements | | 200 |
Table of Contents
(c.1) Reserves for stock option plans
These reserves are related to the share-based payments explained in Note 36.
(c.2) Other sundry reserves
The balance of other sundry reserves comprises the following:
| As of December 31, 2011 ThUS$ | As of December 31, 2010 ThUS$ | |||||||
Reserve for the adjustment of the value of fixed assets (1) | 2,620 | 2,620 | ||||||
Transactions with minority interests (2) | (1,801 | ) | — | |||||
Share issuance and placement costs (3) | — | (2,672 | ) | |||||
Others | 543 | 114 | ||||||
|
|
|
| |||||
Total | 1,362 | 62 | ||||||
|
|
|
| |||||
| (1) | Corresponds to the technical revaluation of fixed assets authorized by the Superintendence of Securities and Insurance in 1979, in Circular No. 1,529. The revaluation was optional and could be taken only once, the reserve is not distributable and can only be capitalized. |
| (2) | Corresponds to the loss generated by the participation of Lan Pax Group S.A., in the capital increase for Aerovías de Integración Regional, AIRES S.A. |
| (3) | As established in Circular 1,736 of the Superintendence of Securities and Insurance, the next extraordinary shareholders meeting to be held by the parent Company should approve the share issuance and placement costs account to be deducted from the capital paid. |
| Memoria Anual 2011 » Consolidated Financial Statements | | 201 |
Table of Contents
(d) Other reserves
The movement of other reserves between January 1, 2010 and December 31, 2011 is as follows:
| Currency translation reserve ThUS$ | Cash flow hedging reserve ThUS$ | Total ThUS$ | ||||||||||
Opening balance as of January 1, 2010 | (4,924 | ) | (92,230 | ) | (97,154 | ) | ||||||
Derivatives valuation gains (losses) | — | (17,855 | ) | (17,855 | ) | |||||||
Deferred tax | (137 | ) | 3,035 | 2,898 | ||||||||
Currency translation differences | 804 | — | 804 | |||||||||
Balance as of December 31, 2010 | (4,257 | ) | (107,050 | ) | (111,307 | ) | ||||||
Opening balance as of January 1, 2011 | (4,257 | ) | (107,050 | ) | (111,307 | ) | ||||||
Derivatives valuation gains (losses) | — | (40,368 | ) | (40,368 | ) | |||||||
Deferred tax | 1,855 | 6,862 | 8,717 | |||||||||
Currency translation differences | (10,915 | ) | — | (10,915 | ) | |||||||
Balance as of December 31, 2011 | (13,317 | ) | (140,556 | ) | (153,873 | ) | ||||||
(d.1) Currency translation reserve
These originate from exchange differences arising from the translation of any investment in foreign entities (or Chilean investment with a functional currency different to that of the parent), and from loans and other instruments in foreign currency designated as hedges for such investments. When the investment (all or part) is sold or disposed and loss of control occurs, these reserves are shown in the consolidated statement of income as part of the loss or gain on the sale or disposal. If the sale does
not involve loss of control, these reserves are transferred to non-controlling interests.
(d.2) Cash flow hedging reserve
These originate from the fair value valuation at the end of each year of the outstanding derivative contracts that have been defined as cash flow hedges. When these contracts expire, these reserves should be adjusted and the corresponding results recognized.
| Memoria Anual 2011 » Consolidated Financial Statements | | 202 |
Table of Contents
(e) Retained earnings
The movement of retained earnings between January 1, 2010 and December 31, 2011 is as follows:
| ThUS$ | ||||
Opening balance as of January 1, 2010 | 740,047 | |||
Result for the year | 419,702 | |||
Other decreases | (129 | ) | ||
Dividends | (210,406 | ) | ||
Balance as of December 31, 2010 | 949,214 | |||
Opening balance as of January 1, 2011 | 949,214 | |||
Result for the year | 320,197 | |||
Other decreases | (632 | ) | ||
Dividends | (151,981 | ) | ||
Balance as of December 31, 2011 | 1,116,798 | |||
(f) Dividends per share
As of December 31, 2011
Description | Final dividend 2010 | Interim dividend 2011 | Interim dividend 2011 | |||||||||
Date of dividend | Apr 29, 2011 | Aug 30, 2011 | Dec 20, 2011 | |||||||||
Amount of the dividend (ThUS$) | 10,386 | 56,595 | 85,000 | |||||||||
Number of shares among which the dividend is distributed | 339,310,509 | 339,358,209 | 340,164,105 | |||||||||
Dividend per share (US$) | 0.03061 | 0.16677 | 0.24988 | |||||||||
| Memoria Anual 2011 » Consolidated Financial Statements | | 203 |
Table of Contents
As of December 31, 2010
Description | Final dividend 2009 | Interim dividend 2010 | Interim dividend 2010 | |||||||||
Date of dividend | 4/29/2010 | 7/27/2010 | 12/23/2010 | |||||||||
Amount of the dividend (ThUS$) | 10,940 | 74,466 | 125,000 | |||||||||
Number of shares among which the dividend is distributed | 338,790,909 | 338,790,909 | 338,790,909 | |||||||||
Dividend per share (US$) | 0.03229 | 0.2198 | 0.36896 | |||||||||
The Company’s dividend policy is that dividends distributed will be equal to the minimum required by law, i.e. 30% of the net income according to current regulations. This policy does not preclude the Company from distributing dividends in excess of this obligatory minimum, based on the events and circumstances that may occur during the course of the year.
At December 31, 2011 interim dividends were declared for 44.2% of earnings for this year.
| Memoria Anual 2011 » Consolidated Financial Statements | | 204 |
Table of Contents
The detail of revenues is as follows:
| For the year ended December 31, | ||||||||
| 2011 ThUS$ | 2010 ThUS$ | |||||||
Passengers | 4,008,910 | 3,109,797 | ||||||
Cargo | 1,576,530 | 1,280,705 | ||||||
|
|
|
| |||||
Total | 5,585,440 | 4,390,502 | ||||||
|
|
|
| |||||
| Memoria Anual 2011 » Consolidated Financial Statements | | 205 |
Table of Contents
NOTE 28 – Costs and expenses by nature
a) Costs and operating expenses
The main operating costs and administrative expenses are detailed below:
| For the year ended December 31, | ||||||||
| 2011 ThUS$ | 2010 ThUS$ | |||||||
Other rentals and landing fees | 671,614 | 595,214 | ||||||
Aircraft fuel | 1,750,052 | 1,161,927 | ||||||
Comissions | 209,255 | 173,397 | ||||||
Other operating expenses | 646,051 | 506,730 | ||||||
Aircraft rentals | 174,197 | 98,588 | ||||||
Aircraft maintenance | 182,358 | 120,642 | ||||||
Passenger services | 136,049 | 114,221 | ||||||
|
|
|
| |||||
Total | 3,769,576 | 2,770,719 | ||||||
|
|
|
| |||||
b) Depreciation and amortization
Depreciation and amortization are detailed below:
| For the year ended December 31, | ||||||||
| 2011 ThUS$ | 2010 ThUS$ | |||||||
Depreciation (*) | 386,644 | 327,136 | ||||||
Amortization | 9,831 | 9,355 | ||||||
|
|
|
| |||||
Total | 396,475 | 336,491 | ||||||
|
|
|
| |||||
| (*) | Includes the depreciation of property, plant and equipment and the maintenance cost of aircraft held under operating leases. |
| Memoria Anual 2011 » Consolidated Financial Statements | | 206 |
Table of Contents
c) Personnel expenses
The costs for personnel expenses are disclosed in provisions for employee benefits (See Note 24).
d) Financial costs
The detail of financial costs is as follows:
| For the year ended December 31, | ||||||||
| 2011 ThUS$ | 2010 ThUS$ | |||||||
Bank loan interest | 99,093 | 117,405 | ||||||
Financial leases | 10,617 | 5,880 | ||||||
Other financial instruments | 29,367 | 31,994 | ||||||
|
|
|
| |||||
Total | 139,077 | 155,279 | ||||||
|
|
|
| |||||
Costs and expenses by nature presented in this note are equivalent to the sum of cost of sales, distribution costs, administrative expenses, other expenses and financing costs presented in the consolidated statement of income by function.
| Memoria Anual 2011 » Consolidated Financial Statements | | 207 |
Table of Contents
NOTE 29 – Gains (losses) on the sale of non-current assets not classified as held for sale
The gains (losses) on sales of non-current assets not classified as Held for Sale as of December 31, 2011 and 2010 are as follows:
| For the year ended December 31, | ||||||||
| 2011 ThUS$ | 2010 ThUS$ | |||||||
Property, plant and equipment | ||||||||
Investments in companies, associates and joint businesses | (172 | ) | 1,413 | |||||
|
|
|
| |||||
Total | (172 | ) | 1,413 | |||||
|
|
|
| |||||
The gain (loss) on sales for the year is presented in other operating income by function and cost of sales.
| Memoria Anual 2011 » Consolidated Financial Statements | | 208 |
Table of Contents
NOTE 30 – Other income, by function
Other income by function is as follows:
| For the year ended December 31, | ||||||||
| 2011 ThUS$ | 2010 ThUS$ | |||||||
Duty free | 16,874 | 11,983 | ||||||
Aircraft leasing | 12,701 | 13,130 | ||||||
Logistics and courier | 10,958 | 36,778 | ||||||
Customs and warehousing | 24,677 | 24,673 | ||||||
Tours | 43,952 | 28,216 | ||||||
Other miscellaneous income | 23,642 | 18,046 | ||||||
|
|
|
| |||||
Total | 132,804 | 132,826 | ||||||
|
|
|
| |||||
| Memoria Anual 2011 » Consolidated Financial Statements | | 209 |
Table of Contents
NOTE 31 – Foreign currency and exchange rate differences
a) Foreign currency
The foreign currency detail of current and non-current assets is as follows:
Currents assets | As of December 31, 2011 ThUS$ | As of December 31, 2010 ThUS$ | ||||||
Cash and cash equivalents | 216,094 | 436,840 | ||||||
Chilean peso | 148,274 | 368,360 | ||||||
Euro | 5,688 | 7,844 | ||||||
Argentine peso | 20,020 | 11,230 | ||||||
Brazilian real | 6,616 | 4,759 | ||||||
Colombian peso | 7,668 | 10,231 | ||||||
Other currency | 27,828 | 34,416 | ||||||
Other current financial assets | 4,352 | 6,726 | ||||||
Brazilian real | 1,127 | 4,740 | ||||||
Colombian peso | 2,009 | 947 | ||||||
Other currency | 1,216 | 1,039 | ||||||
Other current non-financial assets | 3,881 | 2,692 | ||||||
Chilean peso | 1,561 | 1,247 | ||||||
Argentine peso | 1,781 | 419 | ||||||
Brazilian real | 52 | 96 | ||||||
Colombian peso | 117 | 299 | ||||||
Other currency | 370 | 631 | ||||||
Trade and other current accounts receivable | 182,434 | 119,780 | ||||||
Chilean peso | 63,818 | 28,606 | ||||||
Euro | 8,266 | 8,429 | ||||||
Argentine peso | 24,879 | 6,702 | ||||||
Brazilian real | 35.467 | 31,329 | ||||||
Australian dollar | 5,567 | 5,588 | ||||||
Colombian peso | 34,583 | 27,156 | ||||||
Other currency | 9,854 | 11,970 | ||||||
Current accounts receivable from related entities | 809 | 21 | ||||||
Chilean peso | 809 | 21 | ||||||
Current tax assets | 67,668 | 62,455 | ||||||
Chilean peso | 15,817 | 16,805 | ||||||
Argentine peso | 20,236 | 14,477 | ||||||
Brazilian real | 8,475 | 6,735 | ||||||
Mexican peso | 18,457 | 17,477 | ||||||
Colombian peso | 2,658 | 2,615 | ||||||
Other currency | 2,025 | 4,346 | ||||||
Total current assets | 475,238 | 628,514 | ||||||
Chilean peso | 230,279 | 415,039 | ||||||
Euro | 13,954 | 16,273 | ||||||
Argentine peso | 66,916 | 32,828 | ||||||
Brazilian real | 51,737 | 47,659 | ||||||
Mexican peso | 18,457 | 17,477 | ||||||
Australian dollar | 5,567 | 5,588 | ||||||
Colombian peso | 47,035 | 41,248 | ||||||
Other currency | 41,293 | 52,402 | ||||||
| | 210 |
Table of Contents
Non-current assets | As of December 31, 2011 ThUS$ | As of December 31, 2010 ThUS$ | ||||||
Other non-current financial assets | 4,276 | 4,504 | ||||||
Brazilian real | 1,939 | 1,991 | ||||||
Colombian peso | 2,166 | 1,970 | ||||||
Other currency | 171 | 543 | ||||||
Other non-current non-financial assets | 18,081 | 1,681 | ||||||
Argentine peso | 17,951 | 1,681 | ||||||
Colombian peso | 130 | — | ||||||
Non-current accounts receivable | 7,482 | 7,874 | ||||||
Chilean peso | 7,422 | 7,864 | ||||||
Other currency | 60 | 10 | ||||||
Investment recorded using the method of participation | 990 | 593 | ||||||
Chilean peso | 990 | 593 | ||||||
Goodwill | 100,529 | 94,747 | ||||||
Argentine peso | 487 | 523 | ||||||
Colombian peso | 100,042 | 94,224 | ||||||
Deferred tax assets | 50,272 | 28,943 | ||||||
Colombian peso | 45,173 | 28,943 | ||||||
Other currency | 5,099 | — | ||||||
Total non-current assets | 181,630 | 138,342 | ||||||
Chilean peso | 8,412 | 8,457 | ||||||
Argentine peso | 18,438 | 2,204 | ||||||
Brazilian real | 1,939 | 1,991 | ||||||
Colombian peso | 147,511 | 125,137 | ||||||
Other currency | 5,330 | 553 | ||||||
| Memoria Anual 2011 » Consolidated Financial Statements | | 211 |
Table of Contents
The foreign currency detail of current and non-current liabilities is as follows:
| Up to 90 days | 91 days to year | |||||||||||||||
Current liabilities | As of December 31, 2011 ThUS$ | As of December 31, 2010 ThUS$ | As of December 31, 2011 ThUS$ | As of December 31, 2010 ThUS$ | ||||||||||||
Other current financial liabilities | — | 46,043 | — | 112,672 | ||||||||||||
Chilean Peso | — | 41,638 | — | 112,672 | ||||||||||||
Colombian Peso | — | 4,405 | — | — | ||||||||||||
Trade and other accounts payables | 298,551 | 240,419 | 21,082 | 14,012 | ||||||||||||
Chilean Peso | 77,141 | 52,779 | 10,284 | 9,559 | ||||||||||||
Euro | 10,921 | 9,438 | 697 | 14 | ||||||||||||
Argentine Peso | 35,542 | 43,214 | — | 3,725 | ||||||||||||
Brazilian Real | 32,898 | 22,633 | 9 | — | ||||||||||||
Colombian Peso | 53,988 | 44,725 | 10,019 | — | ||||||||||||
Other currency | 88,061 | 67,630 | 73 | 714 | ||||||||||||
Current accounts payable from related | 118 | 74 | — | — | ||||||||||||
Chilean Peso | 118 | 74 | — | — | ||||||||||||
Current tax liabilities | 10,168 | 9,700 | 4,384 | 2,621 | ||||||||||||
Chilean Peso | 3,678 | 3,007 | 748 | 1,064 | ||||||||||||
Argentine Peso | 2,164 | 240 | 2,303 | 1,202 | ||||||||||||
Brazilian Real | 1,724 | 1,994 | 334 | — | ||||||||||||
Colombian Peso | 942 | 3,125 | 999 | 17 | ||||||||||||
Other currency | 1,660 | 1,334 | — | 338 | ||||||||||||
Other current non-financial liabilities | 32,393 | 27,729 | 2,527 | 1,071 | ||||||||||||
Brazilian Real | — | — | 235 | 1,041 | ||||||||||||
Colombian Peso | 32,036 | 27,477 | 1,789 | — | ||||||||||||
Other currency | 357 | 252 | 503 | 30 | ||||||||||||
Total current liabilities | 341,230 | 323,965 | 27,993 | 130,376 | ||||||||||||
Chilean Peso | 80,937 | 97,498 | 11,032 | 123,295 | ||||||||||||
Euro | 10,921 | 9,438 | 697 | 14 | ||||||||||||
Argentine Peso | 37,706 | 43,454 | 2,303 | 4,927 | ||||||||||||
Brazilian Real | 34,622 | 24,627 | 578 | 1,041 | ||||||||||||
Colombian Peso | 86,966 | 79,732 | 12,807 | 17 | ||||||||||||
Other currency | 90,078 | 69,216 | 576 | 1,082 | ||||||||||||
| | 212 |
Table of Contents
| More than 1 to 3 years | More than 3 to 5 years | More than 5 years | ||||||||||||||||||||||
Non-current liabilities | As of December 31, 2011 ThUS$ | Al 31 de diciember de 2010 ThUS$ | Al 31 de diciember de 2011 ThUS$ | As of December 31, 2010 ThUS$ | As of December 31, 2011 ThUS$ | As of December 31, 2010 ThUS$ | ||||||||||||||||||
Other non-current financial liabilities | — | 61,477 | — | — | — | — | ||||||||||||||||||
Chilean peso | — | 61,477 | — | — | — | — | ||||||||||||||||||
Non-current accounts payable | 7,665 | 7,696 | 76 | 71 | 10 | 5 | ||||||||||||||||||
Chilean peso | 6,684 | 6,721 | 76 | 71 | 10 | 5 | ||||||||||||||||||
Other currency | 981 | 975 | — | — | — | — | ||||||||||||||||||
Other long-term provisions | 21,175 | — | — | 1,707 | — | — | ||||||||||||||||||
Real brasileno | 466 | — | — | 1,401 | — | — | ||||||||||||||||||
Colombian peso | 5,728 | — | — | 153 | — | — | ||||||||||||||||||
Other currency | 14,981 | — | — | 153 | — | — | ||||||||||||||||||
Non-current provisions for employee benefits | 5,528 | 3,153 | — | — | — | 698 | ||||||||||||||||||
Argentine peso | 1,097 | — | — | — | — | 698 | ||||||||||||||||||
Colombian peso | 4,431 | 3,153 | — | — | — | — | ||||||||||||||||||
Total non-current liabilities | 34,368 | 72,326 | 76 | 3,026 | 10 | 703 | ||||||||||||||||||
Chilean peso | 6,684 | 68,198 | 76 | 71 | 10 | 5 | ||||||||||||||||||
Argentine peso | 1,097 | — | — | — | — | 698 | ||||||||||||||||||
Brazilian real | 466 | — | — | 1.401 | — | — | ||||||||||||||||||
Colombian peso | 10,159 | 3,153 | — | 1,401 | — | — | ||||||||||||||||||
Other currency | 15,962 | 975 | — | 153 | — | — | ||||||||||||||||||
| Memoria Anual 2011 » Consolidated Financial Statements | | 213 |
Table of Contents
General summary of foreign currency: | As of December 31, 2011 ThUS$ | As of December 31, 2010 ThUS$ | ||||||
Total assets | 656,868 | 766,856 | ||||||
Chilean peso | 238,691 | 423,496 | ||||||
Euro | 13,954 | 16,273 | ||||||
Argentine peso | 85,354 | 35,032 | ||||||
Brazilian real | 53,676 | 49,650 | ||||||
Mexican peso | 18,457 | 17,477 | ||||||
Australian dollar | 5,567 | 5,588 | ||||||
Colombian peso | 194,546 | 166,385 | ||||||
Other currency | 46,623 | 52,955 | ||||||
Total liabilities | 403,677 | 528,995 | ||||||
Chilean peso | 98,739 | 289,067 | ||||||
Euro | 11,618 | 9,452 | ||||||
Argentine peso | 41,106 | 49,079 | ||||||
Brazilian real | 35,666 | 27,069 | ||||||
Colombian peso | 109,932 | 82,902 | ||||||
Other currency | 106,616 | 71,426 | ||||||
Net position | 253,191 | 237,861 | ||||||
Chilean peso | 139,952 | 134,429 | ||||||
Euro | 2,336 | 6,821 | ||||||
Argentine peso | 44,248 | (14,047 | ) | |||||
Brazilian real | 18,010 | 22,581 | ||||||
Mexican peso | 18,457 | 17,477 | ||||||
Australian dollar | 5,567 | 5,588 | ||||||
Colombian peso | 84,614 | 83,483 | ||||||
Other currency | (59,993 | ) | (18,471 | ) | ||||
| Memoria Anual 2011 » Consolidated Financial Statements | | 214 |
Table of Contents
b) Exchange differences
Exchange rate differences recognized in results, other than those relating to financial instruments at fair value through profit and loss, accumulated at December 31, 2011 and 2010 generated a loss of ThUS$ 256 and a gain of ThUS$ 13,792, respectively.
Exchange rate differences shown in equity as translation reserves for the year ended December 31, 2011 and
2010 represented a loss of ThUS$ 10,864 and a gain of ThUS$ 708, respectively.
The following shows the current exchange rates for the US dollar at the end of each period:
| As of December 31, 2011 ThUS$ | As of December 31, 2010 ThUS$ | |||||||
Chilean peso | 519.20 | 468.01 | ||||||
Argentine peso | 4.30 | 3.97 | ||||||
Brazilian real | 1.87 | 1.66 | ||||||
Peruvian Sol | 2.69 | 2.81 | ||||||
Australian dollar | 0.98 | 0.99 | ||||||
Strong Bolivar | 4.30 | 4.30 | ||||||
Boliviano | 6.86 | 6.94 | ||||||
Uruguayan peso | 19.80 | 19.80 | ||||||
Mexican peso | 13.96 | 12.38 | ||||||
Colombian peso | 1,936.00 | 1,905.10 | ||||||
New Zealand dollar | 1.28 | 1.30 | ||||||
Euro | 0.77 | 0.75 | ||||||
| Memoria Anual 2011 » Consolidated Financial Statements | | 215 |
Table of Contents
| For the year ended December 31, | ||||||||
Basic earnings | 2011 ThUS$ | 2010 ThUS$ | ||||||
Earnings attributable to controlling company’s equity holders (ThUS$) | 320,197 | 419,702 | ||||||
Weighted average number of shares, basic | 339,424,598 | 338,790,909 | ||||||
Basic earnings per share (US$) | 0.94335 | 1.23882 | ||||||
| For the year ended December 31, | ||||||||
Diluted earnings | 2011 ThUS$ | 2010 ThUS$ | ||||||
Earnings attributable to controlling company’s equity holders (ThUS$) | 320,197 | 419,702 | ||||||
Weighted average number of shares, basic | 339,424,598 | 338,790,909 | ||||||
Adjustment diluted weighted average shares Stock options | 271,380 | 954,544 | ||||||
Weighted average number of shares, diluted | 339,695,978 | 339,745,453 | ||||||
Diluted earnings per share (US$) | 0.94260 | 1.23534 | ||||||
| Memoria Anual 2011 » Consolidated Financial Statements | | 216 |
Table of Contents
a) Lawsuits
ai) Actions brought by Lan Airlines S.A. and Subsidiaries.
Company | Court | Case No. | Origin | Stage and level of proceeding | Amounts involved ThUS$ | |||||
| Atlantic Aviation Investments LLC (AAI) | Supreme Court of the State of New York County of New York | 07-6022920 | Atlantic Aviation Investments LLC. (“AAI”), an indirect subsidiary of Lan Airlines S.A. constituted under the laws of the state of Delaware, sued on August 29, 2007 Varig Logística S.A. (“Variglog”) for the non-payment of four loans under loan agreements governed by the law of New York. These agreements provide for the acceleration of the loans in the event of sale of the original debtor, VRG Linhas Aéreas S.A | Stage of execution in Switzerland of judgment condemning Variglog to repay the principal, interest and costs in favor of AAI. An embargo is held over the bank account of Variglog in Switzerland by AAI. Variglog is in the process of judicial recovery in Brazil and requested on Switzerland to recognize the judgment that declared the state of judicial recovery (*) | 17,100 plus interest and costs | |||||
| Atlantic Aviation Investments LLC | Supreme Court of the State of New York County of New York | 602286-09 | Atlantic Aviation Investments LLC. (“AAI”) sued on July 24, 2009 Matlin Patterson Global Advisers LLC, Matlin Patterson Global Opportunities Partners II LP, Matlin Patterson Global Opportunities Partners (Cayman) II LP and Volo Logistics LLC (a) as representative for Variglog, for failure to pay the four loans indicated in the previous note; and (b) for a default on their obligations of guarantors and other obligations under the Memorandum of Understanding signed by the parties on September 29, 2006. | The court dismissed in part and upheld in part the motion to dismiss counterclaims brought by defendants in the case. Both parties appealed this decision. AAI filed a request for summary Judgement (short trial) that the court ruled favorably. The defendants appealed from this decision that was granted suspensive effect (*) | 17,100 plus interest costs and damages | |||||
| Aerolane, Líneas Aéreas Nacionales del Ecuador S.A. | Tax Court of Guayaquil | 6319-4064-05 | Against the regional director of the Guayaquil Internal Revenue Service for overpayment of VAT. | Favorable sentence at first intance, appeal pending against them. | 4,210 plus interest | |||||
| Lan Airlines S.A. | Tax Tribunal of Quito | 23493-A | Against the regional director of the Quito Internal Revenue Service for overpayment of VAT. | Requested sentence. | 3,958 | |||||
| (*) | See note 38 |
| | 217 |
Table of Contents
Company | Court | Case No. | Origin | Stage and level of proceeding | Amounts involved ThUS$ | |||||
| Lan Perú S.A. | Administrative Tribunal of Perú | 2011 | Lan Peru is suing L.A.P. (Lima Airport concession) for wrong amounts charged by the use of hoses at the airport in Lima. These amounts are intended to supplement what has already been obtained in a ruling that ordered Ositran LAP wrong amounts charged back. | First intances. | 740 | |||||
| Aerotransportes Mas de Carga S.A. de C.V. | Federal Court of Fiscal and Administrative Justice | 24611/08 | Judgement of invalidity against the tax authority’s refusal to restore a balance in favor of VAT. | At the stage of offer of proof. | 1,000 | |||||
| Aerolane, Líneas Aéreas Nacionales del Ecuador S.A. | Distric Tax Court No. 2 (Guayaquil) | 09504-2010-0114 | Against the regional director of the Guayaquil Internal Revenue Service to determine tax credit decreased for the year 2006. | Practiced evidence | 4,565 | |||||
| Aerolane, Líneas Aéreas Nacionales del Ecuador S.A. | Distric Tax Court No. 2 (Guayaquil) | 09503-2010-0172 | Against the regional director of the Guayaquil Internal Revenue Service for non-payment of advance income tax, 2010. | Calling for evidence | 696 | |||||
| Aerolane, Líneas Aéreas Nacionales del Ecuador S.A. | Distric Tax Court No. 2 (Guayaquil) | 6886-4499-06 | Against the regional director of the Guayaquil Internal Revenue Service for rectification of tax return for 2003. | Sentence pending. | Undetermined | |||||
| Aerovías de Integración Regional S.A. AIRES S.A. | Section One, Subsection A, the Administrative Tribunal of Cundinamarca | AEROVIAS DE INTEGRACION REGIONAL S.A AIRES S.A. seeks that Act 043 Session of October 20, 2008 of Grupo Evaluador de Proyectos Aerocomerciales GEPA be declared invalid. This relates to the decision of the Director of the UAEAC and Enrique Olaya Herrera airport in Medellin to order the suspension of operations of the company to and from that airport. | On June 17, 2010 a decree was issued by which evidence was presented, the status of which was notified on June 22 of that year. On March 8, 2011 the preliminary stages were completed. On July 6, 2011 per state order, Aerocivil was ordered to pay the fees of the expert witness. An appeal was registered against this judgement on July 22. | ThUS$ 2,033 The estimated amount of damages that were caused to AIRES SA as a result of the suspension of operations at the Enrique Olaya Herrera airport in Medellin. | ||||||
| | 218 |
Table of Contents
aii) Lawsuits against Lan Airlines S.A. and Subsidiaries
Company | Court | Case No. | Origin | Stage and level of proceeding | Amounts involved ThUS$ | |||||
| Aerolinhas Brasileiras S.A. | Secretary of Finance of State of Río de Janeiro | 2003 | The administrative authority of Río de Janeiro, Brazil, notified breach action or fine for alleged nonpayment of ICMS (VAT) on import of Boeing-767 aircraft registered No. PR-ABB. | Pending resolution of the review group to annul the fine. | 3,000 | |||||
| Lan Cargo S.A. | Civil Court of Asunción, Paraguay | 78-362 | Request of indemnification for damages brought by the prior general agent in Paraguay. | Pending appeal of the decision to reject one of the exceptions to lack of overt action, made by lawyers for the defendant. | 437 | |||||
| Lan Airlines S.A. y Lan Cargo S.A. | European commission and Canada | Investigation of possible breaches of free competition of cargo airlines, especially the fuel surcharge. On December 26, 2007, the Director General for Competition of the European Commission notified Lan Cargo S.A. and Lan Airlines S.A. of the instruction of a process against twenty-five cargo airlines, including Lan Cargo S.A., for alleged breaches of free competition in the European air cargo market, especially the intended fixing of a surcharge for fuel and cargo. Dated November 09, 2010 the Direction General for Competition of the European Commission notified Lan Cargo S.A. and Lan Airlines S.A. the imposition of fines in the amount of ThUS$ 10,675. This fine is being appealed by Lan Cargo SA and Lan Airlines S.A. We can not predict the outcome of the appeal process. | On 14 April 2008, the Company answered the European Commission’s notification. The appeal was presented on January 24, 2011. | 10,675 | ||||||
| Lan Airlines S.A. y Lan Cargo S.A. | Competition Bureau Canada | – | Investigation for possible infractions of competition from airlines cargo flights, especially fuel surcharges. | Investigation pending. | Undetermined | |||||
| | 219 |
Table of Contents
Company | Court | Case No. | Origin | Stage and level of proceeding | Amounts involved | |||||
| Lan Cargo S.A. y Lan Airlines S.A. | Canada- Superior Court of Quebec, Supreme Court of British Columbia, Superior Court of Ontario | – | For class actions, as a result of the investigation for possible breaches of competition from airlines cargo flights, especially fuel surcharges. They have filed three lawsuits in Canada (Quebec, British Columbia and Ontario). | Case is in the process of discovery and class certification tests. | 850 | |||||
| Lan Cargo S.A. y Lan Airlines S.A. | In the High Court of Justice Chancery Division (England) and Directie Juridische Zaken Afdeling Ceveil Recht (Netherlands). | – | Lawsuit filed against European Airlines by users of freight services in private prosecutions as a consequence of the investigation into alleged breaches of free competition of cargo airlines, especially fuel surcharges. Lan Airlines S.A. and Lan Cargo S.A. have been third-party defendants in such prosecutions in England and the Netherlands. | Case is in the process of discovery tests. | Undetermined | |||||
| Lan Logistics, Corp | Federal Court, Florida, U.S.A. | In mid June 2008 a demand was presented for purchase option right for sale of LanBox. | Failed against Lanlogistics, Corp. for $ 5 million plus interest, which is appealing to the court of appeals. | Undetermined | ||||||
| Aerovías de Integración Regional S.A. AIRES S.A. | Civil Court of the Circuit of Bogota | On December 10th 2008, HK-4491 aircraft was at the Bucaramanga airport and after starting engine n°2 as the starting procedure of engine n°1 began; there was a failure in the startup system and pressurization of the aircraft. The complainant, Mrs. Milena Paez, claims there is a civil contractual liability since, due to hearing loss in her right ear which affected her family, professional, and community life, the airline failed in its obligation to bring the passenger safely to her destination. | Aires S.A. was served the first week of December 2011 on the petition and is in time to answer, the due date being January 23rd 2012 | Action against Aires S.A. with an initial aspiration of ThUS$ 1,768 that is ThCOP 1,899,650 (equivalent 3,550 SMMLV plus the corresponding accrued interest since December 2008, title that generates an additional quantity of ThCOP 1,500,000 equivalent to 2,800 SMMLV). | ||||||
| | 220 |
Table of Contents
Company | Court | Case No. | Origin | Stage and level of proceeding | Amounts involved | |||||
| Aerolinhas Brasileiras S.A. | Conselho Administrativo de Defesa Econômica, Brasil | – | Investigation of alleged breaches of free competition of cargo airlines, especially fuel surcharges. | Investigation pending. CADE and Federal Attorney not yet issued final decisions. | Undetermined | |||||
| Lan Airlines S.A. “Brasil” | Instituto de Defesa do Consumidor de Sao Paulo | – | The Department of Consumer Protection and Defense (“PROCON”) has applied a fine to Lan Airlines S.A. in the amount of MR$ 1,688 equivalent to approximately ThUS$ 905. This penalty relates to the cancellation of flights to Chile as a product of the 2010 earthquake, holding that Lan Airlines S.A. did not act in accordance with the rules applicable to the facilities and offered no compensation to passengers who could not travel as a result of this extraordinary circumstance. | Fine imposed by the consumer entity Sao Paulo. | 905 | |||||
| Lan Perú S.A. | Administrative Tribunal of Peru | 2011 | LAP (Lima Airport concession) is questioning before an administrative tribunal’s decision to the administrative authority Ositran, which in due course LAP stated that it had to give certain amounts uncollected by Lan Peru for the use of hoses in the Lima Airport. | First instance. | 2,109 | |||||
| Lan Cargo S.A. | Tribunal of Arbitration, Frankfurt/ Germany | Aerohandling Airport Assistance GmbH (Handling company in Frankfurt/Airport) is claiming additional payment for Lan Cargo S.A. services offered over the years 2007 to 2010. | Single instance. | 820 | ||||||
Considering the stage of process for each of the cases mentioned above and/or the improbable event of obtaining an adverse sentence, as of December 31, 2011 the Company has estimated that is not necessary to make a provision for any case, with the exception of the significant matter relating to the European Commission which was reported to the SVS. A provision of US$ 11 million has been recorded for the decision issued by the European Commission on November 9, 2010.
On May 6 2011, the Directors of Lan Cargo S.A. and Aerolinhas Brasileiras S.A. approved a judicial agreement with the defenders of the civil class action case that was in process before the United States District Court for the Eastern District of New York. From the agreement, Lan Cargo S.A. and Aerolinhas Brasileiras S.A. committed to pay the amount of US$ 59.7 million and US$ 6.3 million, respectively, payments that were already made as of December 31, 2011. This agreement terminates the companies’ obligations with regards to all plaintiffs who will not choose to file a suit in an individual capacity against the companies. The terms of the judgment have not yet been set for the plaintiffs who are considering opting for a separate suit.
| | 221 |
Table of Contents
(a) Loan covenants
With respect to various loans signed by the Company for the financing of Boeing 767 aircraft, which carry the guarantee of the United States Export-Import Bank, limits have been set on some of the Company’s financial indicators on a consolidated basis. Moreover, and related to these same contracts, restrictions are also in place on the Company’s management in terms of its ownership and disposal of assets.
Additionally, with respect to various loans signed by its subsidiary Lan Cargo S.A. for the financing of Boeing 767 aircraft, which carry the guarantee of the United States Export-Import Bank, restrictions have been established to the Company’s management and its subsidiary Lan Cargo S.A. in terms of shareholder composition and disposal of assets.
Regarding the various contracts of the Company for the financing of Airbus A320 aircraft, which are guaranteed by the European Export Credit Agencies, limits have been established on some of the Company’s financial indicators. Moreover, and related to these same contracts, restrictions are also in place on the Company’s management in terms of its ownership and disposal of assets.
In connection with the financing of spare engines for its Boeing 767 and 777 fleet, which are guaranteed by the Export - Import Bank of the United States, restrictions have been placed on the ownership structure of their guarantors and their legal successor in case of merger.
In relation to credit agreements entered into by the Company, for the current year local banks have set limits to some financial indicators of the Company on a consolidated basis.
At December 31, 2011, the Company is in compliance with these covenants.
| Memoria Anual 2011 » Consolidated Financial Statements | | 222 |
Table of Contents
(b) Commitments under operating leases as lessee
Details of the main operating leases are as follows:
Lessor | Aircraft | As of December 31, 2011 | As of December 31, 2010 | |||||||
ACS Aircraft Finance Bermuda Ltd. - Aircastle (WFBN) | Boeing 737 | 1 | 1 | |||||||
AerCap (WFBN) | Airbus A320 | — | 1 | |||||||
Aircraft 76B-26261 Inc. (ILFC) | Boeing 767 | 1 | — | |||||||
Aircraft 76B-26327 Inc. (ILFC) | Boeing 767 | 1 | — | |||||||
Aircraft 76B-26329 Inc. (ILFC) | Boeing 767 | 1 | — | |||||||
Aircraft 76B-27597 Inc. (ILFC) | Boeing 767 | 1 | — | |||||||
Aircraft 76B-27613 Inc. (ILFC) | Boeing 767 | 1 | — | |||||||
Aircraft 76B-27615 Inc. (ILFC) | Boeing 767 | 1 | — | |||||||
Aircraft 76B-28206 Inc. (ILFC) | Boeing 767 | 1 | — | |||||||
Aircraft Solutions Lux V S.ÀR.L. (AVMAX) | Bombardier Dhc8-200 | 1 | — | |||||||
Avolon Aerospace AOE 19 Limited | Airbus A320 | 1 | — | |||||||
Avolon Aerospace AOE 20 Limited | Airbus A320 | 1 | �� | — | ||||||
Avolon Aerospace AOE 6 Limited | Airbus A320 | 1 | — | |||||||
AWAS 4839 Trust | Airbus A320 | 1 | — | |||||||
BOC Aviation Pte. Ltd. | Airbus A320 | 1 | — | |||||||
Celestial Aviation Trading 16 Ltd. - GECAS (WFBN) | Boeing 767 | 1 | 1 | |||||||
Celestial Aviation Trading 23 Ltd. - GECAS (WFBN) | Boeing 777 | 1 | 1 | |||||||
Celestial Aviation Trading 35 Ltd. (GECAS) | Boeing 767 | 1 | 1 | |||||||
Celestial Aviation Trading 39 Ltd. - GECAS (WFBN) | Boeing 777 | 1 | 1 | |||||||
Celestial Aviation Trading 47 Ltd. - GECAS (WFBN) | Boeing 767 | 1 | 1 | |||||||
Celestial Aviation Trading 48 Ltd. - GECAS (WFBN) | Boeing 767 | 1 | — | |||||||
Celestial Aviation Trading 51 Ltd. - GECAS (WFBN) | Boeing 767 | 1 | 1 | |||||||
CIT Aerospace International | Boeing 767 | 1 | 1 | |||||||
| Memoria Anual 2011 » Consolidated Financial Statements | | 223 |
Table of Contents
Lessor | Aircraft | As of December 31, 2011 | As of December 31, 2010 | |||||||
Delaware Trust Company, National Association (CRAFT) | Bombardier Dhc8-200 | 9 | 9 | |||||||
International Lease Finance Corp. (ILFC) | Boeing 737 | 2 | 2 | |||||||
International Lease Finance Corp. (ILFC) | Boeing 767 | 1 | 8 | |||||||
JB 30244, Inc. - AWAS | Boeing 737 | 1 | 1 | |||||||
JB 30249, Inc. - AWAS | Boeing 737 | 1 | 1 | |||||||
KN Operating Limited (NAC) | Bombardier Dhc8-400 | 4 | 4 | |||||||
MCAP Europe Limited - Mitsubishi (WTC) | Boeing 737 | 1 | 1 | |||||||
MSN 167 Leasing Limited | Airbus A340 | 1 | 1 | |||||||
MSN 32415, LLC - AWAS | Boeing 737 | 1 | 1 | |||||||
NorthStar AvLease Ltd. | Bombardier Dhc8-200 | — | 1 | |||||||
Orix Aviation Systems Limited | Airbus A320 | 2 | 2 | |||||||
Pembroke B737-7006 Leasing Limited | Boeing 737 | 2 | 2 | |||||||
Sunflower Aircraft Leasing Limited - AerCap | Airbus A320 | 2 | 2 | |||||||
TIC Trust (AVMAX) | Bombardier Dhc8-200 | — | 1 | |||||||
|
|
|
| |||||||
Total | 49 | 45 | ||||||||
|
|
|
| |||||||
During 2011, 7 of 8 Boeing 767 aircraft leased to “International Lease Finance Corp. (ILFC), were transferred by the lessor to seven different special purpose entities. Further, in December 2011, NorthStar AvLease Ltd. transferred a Bombardier Dhc8-200 aircraft to Aircraft Solutions Lux V S.ÀR.L. (AVMAX)
The rentals are shown in results for the period for which they are incurred.
The minimum future lease payments not yet payable are the following:
| As of December 31, 2011 ThUS$ | As of December 31, 2010 ThUS$ | |||||||
No later than one year | 169,842 | 151,781 | ||||||
Between one and five years | 443,256 | 440,632 | ||||||
Over five years | 92,264 | 107,593 | ||||||
|
|
|
| |||||
Total | 705,362 | 700,006 | ||||||
|
|
|
| |||||
| Memoria Anual 2011 » Consolidated Financial Statements | | 224 |
Table of Contents
The minimum lease payments charged to income are the following:
| For the year ended December 31, | ||||||||
| 2011 ThUS$ | 2010 ThUS$ | |||||||
Minimum operating lease payments (*) | 168,369 | 93,219 | ||||||
|
|
|
| |||||
Total | 168,369 | 93,219 | ||||||
|
|
|
| |||||
In September 2010, the Company added one Airbus A320-200 aircraft for a period of eight months, the latter finally returned in May 2011. Additionally, in November and December 2010, the Company added two Boeing 767-300F aircraft, with terms of contract for seven and six years respectively.
In January 2011 the Company added to the fleet three aircraft, a Boeing 767-300F with a contract term of five years, one Airbus A320-200 for a period of seven years and one Airbus A319-100 for a period of four months which was returned in May 2011. In July 2011 the Company added two Airbus A320-200 aircrafts for a period of eight years, while in August and September 2011, the Company received an Airbus A320-200 aircraft for a period of eight years. On the other hand, in September 2011 an Bombardier Dhc8-200 aircraft was returned due to termination of the lease term.
| (*) | At December 31, 2011, includes an amount of ThUS$ 44,011 as a result of the incorporation of AIRES S.A. as a subsidiary as of December 2010. |
The operating lease agreements signed by the Company and its subsidiaries state that maintenance of the aircraft should be done according to the manufacturer’s technical instructions and within the margins agreed in the leasing agreements, a cost that must be assumed by the lessee. The lessee should also contract insurance for each aircraft to cover associated risks and the amounts of these assets. Regarding rental payments, these are unrestricted and may not be netted against other accounts receivable or payable between the lessor and lessee.
| Memoria Anual 2011 » Consolidated Financial Statements | | 225 |
Table of Contents
At December 31, 2011 the Company has existing letters of credit relations to operating leasing as follows:
Creditor Guarantee | Debtor | Type | Value ThUS$ | Release date | ||||||
Air Canada | Lan Airlines S.A. | One letters of credit | 1,800 | Jun 30, 2012 | ||||||
Celestial Aviation Trading 16 Ltd. | Lan Cargo S.A. | Two letters of credit | 3,500 | Apr 25, 2012 | ||||||
Celestial Aviation Trading 35 Ltd. | Lan Airlines S.A. | One letters of credit | 2,500 | Jun 13, 2012 | ||||||
CIT Aerospace International | Lan Airlines S.A. | Two letters of credit | 3,240 | May 10, 2012 | ||||||
GE Capital Aviation Services Ltd. | Lan Cargo S.A. | Eigth letters of credit | 23,682 | Apr 25, 2012 | ||||||
International Lease Finance Corp. | Lan Airlines S.A. | Eigth letters of credit | 3,880 | Aug 25, 2012 | ||||||
Orix Aviation System Limited | Lan Airlines S.A. | Two letters of credit | 6,520 | May 5, 2012 | ||||||
TAF Mercury | Lan Airlines S.A. | One letters of credit | 4,000 | Dec 11, 2012 | ||||||
TAF Venus | Lan Airlines S.A. | One letters of credit | 4,000 | Dec 11, 2012 | ||||||
|
| |||||||||
| 53,122 | ||||||||||
|
| |||||||||
(c) Other commitments
At December 31, 2011 the Company has existing letters of credit, certificates of deposits and warranty insurance policies as follows:
Creditor Guarantee | Debtor | Type | Value ThUS$ | Release date | ||||||
Deutsche Bank A.G. | Lan Airlines S.A. | Two letters of credit | 20,000 | Jan 31, 2012 | ||||||
The Royal Bank of Scotland plc | Lan Airlines S.A | Two letters of credit | 18,000 | Jan 8, 2012 | ||||||
Dirección General de Aviación Civil de Chile | Lan Airlines S.A. | Forty-five certificates of deposits | 7,282 | Jan 31, 2012 | ||||||
Washington International Insurance | Lan Airlines S.A. | Six letters of credit | 2,990 | Apr 6, 2012 | ||||||
Dirección Seccional de Aduanas de Bogotá | Línea Aérea de Colombia S.A. | Two warranty insurance policies | 2,702 | Apr 7, 2012 | ||||||
Metropolitan Dade County | Lan Airlines S.A. | Five letters of credit | 1,675 | May 31, 2012 | ||||||
|
| |||||||||
| 52,649 | ||||||||||
|
| |||||||||
| Memoria Anual 2011 » Consolidated Financial Statements | | 226 |
Table of Contents
Note 35 – Transactions with related parties
a) Transactions with related parties for the year ended December 31, 2011
Tax No. | Related party | Relationship | Country of origin | Other information | Transaction | Currency | Amount of transactions ThUS$ | |||||||||
| 96.810.370-9 | Inversiones Costa Verde Ltda. y CPA | Controlling shareholder | Chile | Investments | Property rental granted Passenger Service provided | CLP CLP |
| 71 19 |
| |||||||
| 96.847.880-K | Lufthansa | Associate | Chile | Training center | Property rental granted | CLP | 122 | |||||||||
| Lan | Payments on behalf received | CLP | (19 | ) | ||||||||||||
| Technical | Training received | CLP | (633 | ) | ||||||||||||
| Training S.A. | Payments on behalf received | US$ | (82 | ) | ||||||||||||
| Training received | US$ | (512 | ) | |||||||||||||
| 78.591.370-1 | Bethia S.A. y | Other related | Chile | Investments | Property rental granted | CLP | 546 | |||||||||
| Filiales (1) | parties | Professional advice granted | CLP | 300 | ||||||||||||
| Services provided air cargo transport | CLP | 1.381 | ||||||||||||||
| Other service received | CLP | (109 | ) | |||||||||||||
| Payments on behalf received | CLP | (345 | ) | |||||||||||||
| Sale of subsidiaries | CLP | 53.386 | ||||||||||||||
| 87.752.000-5 | Granja MarinaTornagaleones S.A. | Other related parties | Chile | Fish farming | Passenger services provided | CLP | 199 | |||||||||
| Foreign | Inversora | Other related | Argentina | Investments | Property rental granted | US$ | (412 | ) | ||||||||
Aeronáutica Argentina | parties | Payments on behalf provided | US$ | 811 | ||||||||||||
| 96.625.340-1 | Inversiones Mineras del Cantabrico S.A. | Other related parties | Chile | Investments | Payments on behalf received | US$ | (811 | ) | ||||||||
| (1) | On April 06, 2011 Lan Cargo S.A. e Inversiones Lan S.A., subsidiaries of Lan Airlines S.A. as sellers, and Servicios de Transporte Limitada and Inversiones Betmin SpA, subsidiaries of Bethia S.A. company, as purchasers, entered into a contract of sale with respect to 100% of the social capital of companies Blue Express Intl Ltda. and Blue Express S.A. The sale value of Blue Express Intl. Ltda and subsidiary was for ThUS$ 53,386. |
| | 227 |
Table of Contents
b) Transactions with related parties for the year ended December 31, 2010
Tax No. | Related party | Relationship | Country | Other information | Transaction | Currency | Amount of transactions ThUS$ | |||||||||
| 96.810.370-9 | Inversiones | Controlling | Chile | Investments | Property rental granted | CLP | 77 | |||||||||
| Costa Verde Ltda. y CPA | shareholder | Passenger services provided | CLP | 13 | ||||||||||||
| 96.847.880-K | Lufthansa | Associate | Chile | Training center | Property rental granted | CLP | 17 | |||||||||
| Lan Technical | Assignment of debt granted | CLP | 18 | |||||||||||||
| Training S.A. | Payments on behalf received | CLP | (16 | ) | ||||||||||||
| Training received | CLP | (356 | ) | |||||||||||||
| Payments on behalf received | US$ | (95 | ) | |||||||||||||
| Training received | US$ | (363 | ) | |||||||||||||
| 96.921.070-3 | Austral Sociedad | Associate | Chile | Concessionaire | Landing and other aviation rates | CLP | (35 | ) | ||||||||
| Concesionaria | Basic consumptions received | CLP | (8 | ) | ||||||||||||
| S.A. | Aeronautical concession received | CLP | (153 | ) | ||||||||||||
| Dividend distribution | CLP | 73 | ||||||||||||||
| 87.752.000-5 | Granja Marina Tornagaleones S.A. | Other related parties | Chile | Fish farming | Passenger services provided | CLP | 63 | |||||||||
| 96.669.520-K | Red de Televisión | Other related | Chile | Television | Passenger services provided | CLP | 65 | |||||||||
| Chilevisión S.A. | parties | Publicity services received | CLP | (100 | ) | |||||||||||
| 96.894.180-1 | Bancard Inversiones Ltda | Other related parties | Chile | Professional advice | Professional advice received | CLP | (7 | ) | ||||||||
| Foreign | Inversora | Other related | Argentina | Investments | Property rental granted | US$ | (271 | ) | ||||||||
Aeronáutica Argentina | parties | Other services provided | US$ | 13 | ||||||||||||
| | 228 |
Table of Contents
c) Compensation of key management
The Company has defined for these purposes that key management personnel are the executives who define the Company’s policies and major guidelines and who directly affect the results of the business, considering the levels of vice-presidents, chief executives and directors.
| For the year ended December 31, | ||||||||
| 2011 ThUS$ | 2010 ThUS$ | |||||||
Remuneration | 9,696 | 7,505 | ||||||
Management fees | 185 | 150 | ||||||
Corrections of value and non-monetary benefits | 665 | 352 | ||||||
Short-term benefits | 5,011 | 4,680 | ||||||
Share-based payments | 2,084 | 3,523 | ||||||
|
|
|
| |||||
Total | 17,641 | 16,210 | ||||||
|
|
|
| |||||
| Memoria Anual 2011 » Consolidated Financial Statements | | 229 |
Table of Contents
NOTE 36 – Share-based payments
The compensation plans implemented through the granting of options to subscribe and pay for shares, which have been granted since the last quarter of 2007, are shown in the consolidated statements of financial position in accordance with IFRS 2 “Share-based payments”, booking the effect of the fair value of the options granted as a charge to remuneration on a straight-line basis between the date of granting the options and the date on which these become vested.
During the last quarter of 2009, the original terms of the plan were amended regarding subscription and payment of options. These modifications were carried out during the first quarter of 2010 and established a new term and exercise price.
The original grant and subsequent amendments have been formalized through the signing of option contracts for the subscription of shares according to the proportions shown in the accrual schedule, which are related to the permanence of the executive on those dates for exercising the options:
Percentage | Period | |||
| 30 | % | From October 29, 2010 until March 31, 2012 | ||
| 70 | % | From October 30, 2011 until March 31, 2012 | ||
| Memoria Anual 2011 » Consolidated Financial Statements | | 230 |
Table of Contents
These options have been valued and booked at their fair value on the grant date, determined using the “Black-Scholes-Merton” method.
All options expire on March 31, 2012.
| Number of share options | ||||
Stock options under a share-based payment agreement balance as of January 1, 2011 | 2,209,091 | |||
Stock options granted | — | |||
Stock options annulled | — | |||
Stock options exercised | (1,535,522 | ) | ||
Stock options under a share-based payment agreement, | — | |||
balance as of December 31, 2011 | 673,569 | |||
Entry data for option valuation model used for stock options granted during the year.
Weighted average | Exercise price | Expected volatility | Life of option | Dividends expected | Risk-free interest | |||||||||||||||||
| US$ | 17.3 | US$ | 14.5 | 33.20 | % | 1.9 years | 50 | % | 0.0348 | |||||||||||||
In accordance with the General Environment Bases Law issued in Chile and its complementary regulations, there are no provisions that affect the operation of air transport services.
| Memoria Anual 2011 » Consolidated Financial Statements | | 231 |
Table of Contents
The consolidated financial statements of Lan Airlines S.A. and Subsidiaries as of December 31, 2011 have been approved in extraordinary session of the Board February 14, 2012, which was attended by the following directors:
1. Jorge Awad Mehech,
2. Darío Calderón González,
3. Juan José Cueto Plaza,
4. Juan José Cueto Sierra,
5. Ramón Eblen Kadis, and
6. Carlos Alberto Heller Solari
Judgement against Variglog
On February 2, 2012, Variglog made a filing before the Brazilian court expressing that it was unable to abide by the terms of the judicial reorganization. Variglog shall therefore present a new plan which shall be approved or rejected by the creditors at a Meeting. Up to the date hereof, there is no a fixed date in which Variglog shall present the new plan.
Judgement against Matlin Patterson
On February 7, 2012, the Appellate Court of New York in a unanimous decision confirmed the judgment of the lower court in favor of AAI. With such decision, the staying effect ordered by the Appellate Court on July 28, 2011 ceases and AAI will reassume the procedure before the lower court for determination of damages. In principle, Matlin Patterson may not appeal to the decision of the Appelate Court unless it obtains a special permission from the New York Court of Appeals, the highest court in the State.
Except as mentioned above, subsequent to December 31, 2011 until the date of issuance of these financial statements, the Company has no knowledge of any other subsequent events that may significantly affect the balances or their interpretation.
| Memoria Anual 2011 » Consolidated Financial Statements | | 232 |
Table of Contents
NOTE 39 – Business combinations
(a) Aerovías de Integración Regional, AIRES S.A.
On November 26, 2010 Lan Pax Group S.A., a subsidiary of Lan Airlines S.A., acquired 98.942% of the Colombian company Aerovías de Integración Regional, AIRES S.A.
This acquisition was made through the purchase of 100% of the shares of the Panamanian corporations AKEMI Holdings S.A. and SAIPAN Holding S.A., which owned the aforementioned percentage of AIRES S.A. The purchase price was ThUS$ 12,000.
Aerovías de Integración Regional, AIRES S.A., founded in 1980, at the date of acquisition it was the second largest operator within the Colombian domestic market with a
market share of 22%. AIRES S.A. offers regular service to 27 domestic destinations within Colombia as well as 3 international destinations. Synergies are expected between the combination of AIRES S.A. in the Colombian market and efficiency of the business model of LAN Airlines S.A. Additionally, better performance is expected by the business of Lan Airlines S.A. (passengers and cargo) through an increase in coverage in Latin America.
The Company has measured the non-controlling interest in AIRES S.A. using the proportionate share of the noncontrolling interest in net identifiable assets acquired.
The business combination is recognized in the statement of financial position of Lan Airlines S.A. and Subsidiaries as goodwill of ThUS$ 94,224.
Summary Statement of financial position at acquisition date:
| ThUS$ | ||||
Current assets | 27,315 | |||
Non-current assets | 31,652 | |||
|
| |||
Total assets | 58,967 | |||
|
| |||
Controlling interest | (82,224 | ) | ||
Goodwill determination:
| ThUS$ | ||||
Controlling interest | 82,224 | |||
Purchase price | 12,000 | |||
|
| |||
Goodwill | 94,224 | |||
|
| |||
| ThUS$ | ||||
Current liabilities | 125,193 | |||
Non-current liabilities | 20,327 | |||
Equity | (86,553 | ) | ||
|
| |||
Total liabilities | 58,967 | |||
|
| |||
| Memoria Anual 2011 » Consolidated Financial Statements | | 233 |
Table of Contents
(b) Aeroasis S.A.
Dated February 15, 2011, Lan Pax Group S.A. subsidiary of Lan Airlines S.A. acquired 100% of Colombian society AEROASIS S.A. The purchase price was ThUS$ 3,541.
AEROASIS S.A. is a corporation incorporated under the laws of the Republic of Colombia through Public Deed No. 1206 dated May 2, 2006.
The business combination is recognized in the statement of financial position of Lan Airlines S.A. and Subsidiaries as goodwill of ThUS$ 6,736.
Summary statement of financial position at acquisition date:
| ThUS$ | ||||
Current assets | 1,802 | |||
Non-current assets | 3,010 | |||
|
| |||
Total assets | 4,812 | |||
|
| |||
Controlling interest | (3,195 | ) | ||
Goodwill determination:
| ThUS$ | ||||
Controlling interest | 3,195 | |||
Purchase price | 3,541 | |||
|
| |||
Goodwill | 6,736 | |||
|
| |||
In accordance with IFRS 3, the determined value of goodwill is provisional.
| ThUS$ | ||||
Current liabilities | 8,007 | |||
Non-current liabilities | — | |||
Equity | (3,195 | ) | ||
|
| |||
Total liabilities | 4,812 | |||
|
| |||
| Memoria Anual 2011 » Consolidated Financial Statements | | 234 |
Table of Contents
Chapter VIII
Financial Statements Subsidiaries
Table of Contents
Information about Subsidiaries and Affiliated Companies
LAN Airlines S.A.
Lan Airlines S.A.
Chilean Tax N° 89.862.200-2
Incorporation
Established as a limited liability company by public deed of 30 December 1983, extended by Public Notary Eduardo Avello Arellano, an extract of which was recorded at Folio 20,341 N° 11,248 of 1983 of the Santiago Business Register and published in the Official Gazette of 31 December 1983.
By public deed of 20 August 1985, extended by Public Notary Miguel Garay Figueroa, the company became a joint stock company under the name of Línea Aérea Nacional Chile S.A. (now Lan Airlines S.A.). As regards aeronautic and radio communication concessions, traffic rights and other administrative concessions, this company was expressly designated by Law N° 18.400 as the legal continuation of the state company created in 1929.
The Extraordinary Shareholders’ Meeting of Lan Chile S.A. held on 23 July 2004 agreed to change the company’s name to “Lan Airlines S.A.”. An extract of the public deed corresponding to the Meeting’s minutes was recorded on the Business Register of the Real Estate Registry Office at Folio 25,128 N° 18,764 of 2004 and was published in the Official Gazette of 21 August 2004. The change of name came into force on 8 September 2004.
Lan Airlines S.A. is subject to the regulation applicable to listed joint stock companies and is registered with the Superintendencia de Valores y Seguros (SVS), Chile’s stock market regulator, under Inscription N° 0306 of 22 January 1987.
Note: The financial information about subsidiaries presented below has been summarized. Their complete financial statements are available to the public at our corporate headquarters and at the Superintendencia de Valores y Seguros (SVS).
| Memoria Anual 2011 » Information about Subsidiaries and Affiliated Companies | | 236 |
Table of Contents
Information about Subsidiaries and Affiliated Companies
LAN Cargo S.A. and Subsidiaries
Incorporation
Established as a closed joint stock company by public deed of 22 May 1970, extended by Public Notary Sergio Rodríguez Garcés, with the assets and liabilities of the Línea Aérea del Cobre Limitada (Ladeco Limitada) which had been established by public deed of 3 September 1958, extended by Public Notary Jaime García Palazuelos. The company’s bylaws have since been amended on a number of occasions, most recently by public deed of 20 November 1998, recorded at Folio 30,091 N° 24,117 of the Santiago Business Register and published in the Official Gazette of 3 December 1998, under which Ladeco S.A. merged through incorporation with Fast Air Carrier S.A., a subsidiary of Lan Chile S.A.
Under public deed of 22 October 2001 corresponding to the Extraordinary Shareholders’ Meeting of Ladeco S.A. held on the same date, its name was changed to “Lan Chile Cargo S.A.”. An extract of this deed is recorded on the Business Register of the Santiago Real Estate Registry Office at Folio 27,746 N° 22,624 of 2001 and was published in the Official Gazette of 5 November, 2001. The change of name came into force on 10 December 2001.
Under public deed of 23 August 2004 corresponding to the Extraordinary Shareholders’ Meeting of Lan Chile Cargo S.A. held on 17 August 2004, its name was changed to “Lan Cargo S.A.” An extract of this deed is recorded on the Business Register of the Santiago Real Estate Registry Office at Folio 26,994 N° 20,082 of 2004 and was published in the Official Gazette of 30 August 2004.
| Memoria Anual 2011 » Information about Subsidiaries and Affiliated Companies | | 237 |
Table of Contents
Purpose
To engage in and develop, on its own account or on behalf of others, the following activities: transport in general in any of its forms and, in particular, the air transport of passengers, cargo and mail within and outside Chile; tourism, hotel and other complementary activities in any of their forms within and outside Chile; the purchase, sale, manufacture and/or assembly, maintenance, renting or any other form of use of aircraft, spare parts and aeronautic equipment, either on its own account or on behalf of third parties, and their exploitation on any account; the provision of all types of services and consultancy related to transport in general and to air transport in particular,
in any of its forms whether consisting of ground support, maintenance, technical or any other type of consultancy, within and outside Chile; and, all types of activities related to tourism, hotels and the other activities and goods referred to above, within and outside Chile. In compliance with these objectives, the Company may make investments or become a partner in other companies by acquiring shares or rights or interests in any other type of association, whether existing or formed in the future, and may in general perform all the acts and enter into all contracts necessary and pertinent to fulfill the above objectives.
Subscribed and paid-in capital | US$ | 83,225,000 | ||
Net income (loss) | US$ | 97,053,000 | ||
Shareholding | 99.8980 | % | ||
% of consolidated assets | 6.83 | % |
Board of directors | ||
Chairman | José Cox Donoso | |
Directors | Juan José Cueto Plaza | |
| Ramón Eblen Kadis | ||
| Ignacio Cueto Plaza | ||
| Enrique Cueto Plaza | ||
| Memoria Anual 2011 » Information about Subsidiaries and Affiliated Companies | | 238 |
Table of Contents
Lan Cargo S.A.: Shareholdings in subsidiaries | ||||
Laser Cargo S.R.L. | 99.99 | % | ||
Aircraft Internacional Leasing Limited | 99.98 | % | ||
Ediciones Ladeco América S.A. | 99.00 | % | ||
Ladeco Cargo S.A. (Ex Ladeco Turismo S.A.) | 99.01 | % | ||
Fast Air Almacenes de Carga S.A. | 99.90 | % | ||
Prime Airport Services Inc. y filial | 100.00 | % | ||
Lan Cargo Overseas Limited (Ex-Ladeco Overseas S.L.) and subsidiaries | 99.98 | % | ||
Transporte Aéreo S.A. | 99.99 | % | ||
Consorcio Fast Air Almacenes de Carga S.A. - Laser Cargo S.R.L. Unión Transitoria de Empresas | 100.00 | % | ||
Lan Cargo Inversiones S.A. y filial | 99.00 | % | ||
Connecta Corporation | 100.00 | % | ||
| Memoria Anual 2011 » Information about Subsidiaries and Affiliated Companies | | 239 |
Table of Contents
Lan Cargo S.A. and subsidiaries
(Closed joint stock company)
Consolidated Statements of Financial Position | As of December 31, 2011 THUS$ | As of December 31, 2010 THUS$ | ||||||
Assets | ||||||||
Current assets | 499,321 | 444,303 | ||||||
Non-current assets and disposal groups held for sale | 2,318 | 2,318 | ||||||
Total current assets | 501,639 | 446,621 | ||||||
Total non-current assets | 528,033 | 541,240 | ||||||
Total assets | 1,029,672 | 987,861 | ||||||
Liabilities and net equity | ||||||||
Liabilities | ||||||||
Current liabilities in operation | 215,112 | 177,157 | ||||||
Non-current liabilities and disposal groups held for sale | — | — | ||||||
Total current liabilities | 215,112 | 177,157 | ||||||
Total non-current liabilities | 292,417 | 352,174 | ||||||
Total liabilities | 507,529 | 529,331 | ||||||
Net equity | ||||||||
Net equity attributable to the parent company’s equity holders | 518,600 | 455,778 | ||||||
Minority interest | 3,543 | 2,752 | ||||||
Total net equity | 522,143 | 458,530 | ||||||
Total liabilities and net equity | 1,029,672 | 987,861 | ||||||
| Memoria Anual 2011 » Information about Subsidiaries and Affiliated Companies | | 240 |
Table of Contents
Consolidated Statements of Income by Function | As of December 31, 2011 THUS$ | As of December 31, 2010 THUS$ | ||||||
Operating Revenues | 1,292,997 | 1,025,685 | ||||||
Gross margin | 59,930 | 33,700 | ||||||
Gain (loss) before income taxes | 111,710 | 74,167 | ||||||
Income tax | (14,657 | ) | (9,282 | ) | ||||
Net income (loss) for the period | 97,053 | 64,885 | ||||||
Gain (loss) for the period attributable to the parent company’s equity holders | 96,365 | 65,260 | ||||||
Gain (loss) for the period attributable to minority interest | 688 | (375 | ) | |||||
Gains (loss) for the period | 97,053 | 64,885 | ||||||
Consolidated Statements of Comprehensive Income by Function | As of December 31, 2011 THUS$ | As of December 31, 2010 THUS$ | ||||||
Gains (loss) for the period | 97,053 | 64,885 | ||||||
Comprehensive income and expenses for the period | (1,162 | ) | 1,594 | |||||
Comprehensive income for the period | 95,891 | 66,479 | ||||||
Comprehensive income attributable to: | ||||||||
Majority shareholders | 95,199 | 66,853 | ||||||
Minority interests | 692 | (374 | ) | |||||
Comprehensive income for the period | 95,891 | 66,479 | ||||||
| Memoria Anual 2011 » Information about Subsidiaries and Affiliated Companies | | 241 |
Table of Contents
Statements of Changes in Net Equity | Change in net equity attributable to the parent THUS$ | Change in equity minority interest THUS$ | Changes in net equity total THUS$ | |||||||||
Opening balance as of January 01, 2010 | 420,381 | 3,391 | 423,772 | |||||||||
Comprehensive income for the period | 66,853 | (374 | ) | 66,479 | ||||||||
Dividends | (31,584 | ) | — | (31,584 | ) | |||||||
Other increase (decrease) in net equity | 456 | (265 | ) | 191 | ||||||||
Closing balance as of December 31, 2010 | 456,106 | 2,752 | 458,858 | |||||||||
Opening balance as of January 01, 2011 | 456,106 | 2,752 | 458,858 | |||||||||
Comprehensive income for the period | 95,199 | 692 | 95,891 | |||||||||
Dividends | (32,544 | ) | (14 | ) | (32,558 | ) | ||||||
Other decrease in net equity | (161 | ) | 113 | (48 | ) | |||||||
Closing balance as of December 31, 2011 | 518,600 | 3,543 | 522,143 | |||||||||
Consolidated Statements of Cash Flows - Direct Method | As of December 31, 2011 THUS$ | As of December 31, 2010 THUS$ | ||||||
Net cash flow from operating activities | 67,889 | 108,872 | ||||||
Net cash flow used in investment activities | 107,493 | (9,196 | ) | |||||
Net cash flow from financing activities | (177,013 | ) | (94,807 | ) | ||||
|
|
|
| |||||
Net increase in cash and cash equivalents | (1,631 | ) | 4,869 | |||||
|
|
|
| |||||
Effects of Exchange-rate fluctuations on cash and cash equivalents | (74 | ) | (619 | ) | ||||
Cash and cash equivalents, shown in the statement of cash flows, Closing Balance | 17,225 | 18,930 | ||||||
| Memoria Anual 2011 » Information about Subsidiaries and Affiliated Companies | | 242 |
Table of Contents
Information about Subsidiaries and Affiliated Companies
LAN Perú S.A.
Incorporation
Established as a joint stock company in Peru on 14 February 1997.
Purpose
To provide air transport services for passengers, cargo and mail, domestically and internationally, in compliance with civil aeronautical laws.
Subscribed and paid-in capital | US$ | 4,341,000 | ||
Net income (loss) | US$ | 993,000 | ||
Shareholding | 70.00 | % | ||
% of consolidated assets | 0.21 | % |
Board of directors | ||
| Chairman | Emilio Rodríguez Larraín Salinas | |
| Directors | Enrique Cueto Plaza | |
| Ignacio Cueto Plaza | ||
| Alejandro de la Fuente Goic | ||
| Jorge Harten Costa | ||
| Alejandro García Vargas | ||
| Luis Enrique Gálvez de la Puente | ||
| Memoria Anual 2011 » Information about Subsidiaries and Affiliated Companies | | 243 |
Table of Contents
LAN Perú S.A.
(Closed joint stock company)
Balance Sheet (in thousands of Dollars) | As of December 31, 2011 THUS$ | As of December 31, 2010 THUS$ | ||||||
Assets | 145,007 | 128,281 | ||||||
Liabilities | 128,676 | 114,574 | ||||||
Shareholder equity | 16,331 | 13,707 | ||||||
Liabilities and shareholder equity | 145,007 | 128,281 | ||||||
Income Statement (in thousands of Dollars) | As of December 31, 2011 THUS$ | As of December 31, 2010 THUS$ | ||||||
Operating Revenues | 975,522 | 802,216 | ||||||
Operating Profit | 2,182 | 2,115 | ||||||
Non-Operating Income (Loss) | 685 | 51 | ||||||
Income Tax | (1,874 | ) | (521 | ) | ||||
Net Income (Loss) | 993 | 1,645 | ||||||
| Memoria Anual 2011 » Information about Subsidiaries and Affiliated Companies | | 244 |
Table of Contents
Statements of Changes in Net Equity | Changes in net equity Paid-in-capital THUS$ | Changes in legal reserve THUS$ | Changes in retained earnings THUS$ | Changes in total THUS$ | ||||||||||||||||
Opening balance as of January 01, 2010 | 4,341 | — | 868 | 5,610 | 10,819 | |||||||||||||||
Revaluation of land | — | 4,756 | — | — | 4,756 | |||||||||||||||
Deferred Tax revaluation of land | — | (1,427 | ) | — | — | (1,427 | ) | |||||||||||||
Profits Distribution | — | — | — | (2,086 | ) | (2,086 | ) | |||||||||||||
Years Profit | — | — | — | 1,645 | 1,645 | |||||||||||||||
Closing balance as of December 31, 2010 | 4,341 | 3,329 | 868 | 5,169 | 13,707 | |||||||||||||||
Opening balance as of January 01, 2011 | 4,341 | 3,329 | 868 | 5,169 | 13,707 | |||||||||||||||
Revaluation of land | — | 2,330 | — | — | 2,330 | |||||||||||||||
Deferred Tax revaluation of land | — | (699 | ) | — | — | (699 | ) | |||||||||||||
Years Profit | — | — | — | 993 | 993 | |||||||||||||||
Closing balance as of December 31, 2011 | 4,341 | 4,960 | 868 | 6,162 | 16,331 | |||||||||||||||
Consolidated Statements of Cash Flows - Direct Method | As of December 31, 2011 THUS$ | As of December 31, 2010 THUS$ | ||||||
Net cash flow from operating activities | (3,209 | ) | 27,611 | |||||
Net cash flow used in investment activities | (5,377 | ) | (1,573 | ) | ||||
Net cash flow from financing activities | — | (1,648 | ) | |||||
|
|
|
| |||||
Net decrease in cash and cash equivalents | (8,586 | ) | 24,390 | |||||
|
|
|
| |||||
Cash and cash equivalents, shown in the statement of cash flows, Closing Balance | 56,132 | 64,718 | ||||||
| Memoria Anual 2011 » Information about Subsidiaries and Affiliated Companies | | 245 |
Table of Contents
Information about Subsidiaries and Affiliated Companies
Inversiones LAN S.A. and Subsidiaries
Incorporation
Established as a closed joint stock company by public deed of 23 January 1990, extended by Public Notary Humberto Quezada M., recorded at Folio 3,462 N° 1,833 of 1990 of the Santiago Business Register and published in the Official Gazette of 2 February 1990.
Purpose
To invest in all types of property, whether moveable or real, tangible or intangible; in addition, the company may form other companies of all types and acquire rights in, administer, modify and liquidate existing companies.
Subscribed and paid-in capital | US$ | 458,000 | ||
Net income (loss) | US$ | (354,000 | ) | |
Shareholding | 99,71 | % | ||
% of consolidated assets | 0,08 | % |
Board of directors | ||
| Chairman | Enrique Cueto Plaza | |
| Directors | Ignacio Cueto Plaza | |
| Alejandro de la Fuente Goic | ||
| Roberto Alvo Milosawlewitsch | ||
| Enrique Elsaca Hirmas | ||
| Memoria Anual 2011 » Information about Subsidiaries and Affiliated Companies | | 246 |
Table of Contents
Inversiones Lan S.A.: Shareholdings in subsidiaries | ||||
Hawk Aviation Management Ltd | 100.00 | % | ||
Falcon Aviation Management Ltd | 100.00 | % | ||
Aviation Administration Services Ltd | 100.00 | % | ||
Cargo Aircraft Leasing Limited | 100.00 | % | ||
Passenger Aircraft Leasing Limited | 100.00 | % | ||
Andes Airport Services S.A. | 98.00 | % | ||
Inversiones Lan S.A. and subsidiaries
(Closed joint stock company)
Consolidated Statements of Financial Position | As of December 31, 2011 THUS$ | As of December 31, 2010 THUS$ | ||||||
Assets | ||||||||
Current assets | 4,230 | 3,320 | ||||||
Non-current assets and disposal groups held for sale | 948 | 948 | ||||||
Total current assets | 5,178 | 4,268 | ||||||
Total non-current assets | 9,121 | 8,221 | ||||||
Total assets | 14,299 | 12,489 | ||||||
Liabilities and net equity | ||||||||
Liabilities | ||||||||
Current liabilities in operation | 7,650 | 5,023 | ||||||
Non-current liabilities and disposal groups held for sale | — | — | ||||||
Total current liabilities | 7,650 | 5,023 | ||||||
Total non-current liabilities | 171 | 138 | ||||||
Total liabilities | 7,821 | 5,161 | ||||||
Net equity | ||||||||
Net equity attributable to the parent company’s equity holders | 6,476 | 7,320 | ||||||
Minority interest | 2 | 8 | ||||||
Total net equity | 6,478 | 7,328 | ||||||
Total liabilities and net equity | 14,299 | 12,489 | ||||||
| Memoria Anual 2011 » Information about Subsidiaries and Affiliated Companies | | 247 |
Table of Contents
Consolidated Statements of Income by Function | As of December 31, 2011 THUS$ | As of December 31, 2010 THUS$ | ||||||
Operating Revenues | 22,546 | 19,178 | ||||||
Gross margin | 3,232 | 3,825 | ||||||
Gain before income taxes | (427 | ) | 2,897 | |||||
Income tax | 73 | (578 | ) | |||||
Net income (loss) for the period | 354 | 2,319 | ||||||
Gain for the period attributable to the parent company’s equity holders | (347 | ) | 2,278 | |||||
Gain for the period attributable to minority interest | (7 | ) | 41 | |||||
Gains (loss) for the period | (354 | ) | 2,319 | |||||
Consolidated Statements of Comprehensive Income by Function | As of December 31, 2011 THUS$ | As of December 31, 2010 THUS$ | ||||||
Gains for the period | (354 | ) | 2,319 | |||||
Comprehensive income and expenses for the period | 49 | 250 | ||||||
Comprehensive income for the period | (305 | ) | 2,569 | |||||
Comprehensive income attributable to: | ||||||||
Majority shareholders | (306 | ) | 2,529 | |||||
Minority interests | 1 | 40 | ||||||
Comprehensive income for the period | (305 | ) | 2,569 | |||||
| Memoria Anual 2011 » Information about Subsidiaries and Affiliated Companies | | 248 |
Table of Contents
Statements of Changes in Net Equity | Change in net equity attributable to the parent THUS$ | Change in equity minority interest THUS$ | Changes in net equity total THUS$ | |||||||||
Opening balance as of January 01, 2010 | 10,285 | 14 | 10,299 | |||||||||
Comprehensive income for the period | 2,530 | 39 | 2,569 | |||||||||
Dividends | (5,546 | ) | (5 | ) | (5,551 | ) | ||||||
Other increase (decrease) in net equity | 51 | (40 | ) | 11 | ||||||||
Closing balance as of December 31, 2010 | 7,320 | 8 | 7,328 | |||||||||
Opening balance as of January 01, 2011 | 7,320 | 8 | 7,328 | |||||||||
Comprehensive income for the period | (306 | ) | 1 | (305 | ) | |||||||
Other increase (decrease) in net equity | (538 | ) | (7 | ) | (545 | ) | ||||||
Closing balance as of December 31, 2011 | 6,476 | 2 | 6,478 | |||||||||
Consolidated Statements of Cash Flows - Direct Method | As of December 31, 2011 THUS$ | As of December 31, 2010 THUS$ | ||||||
Net cash flow from operating activities | 814 | 2,581 | ||||||
Net cash flow used in investment activities | (859 | ) | 17 | |||||
Net cash flow from financing activities | — | (2,570 | ) | |||||
|
|
|
| |||||
Net increase in cash and cash equivalents | (45 | ) | 28 | |||||
|
|
|
| |||||
Effects of Exchange-rate fluctuations on cash and cash equivalents | (24 | ) | 1 | |||||
Cash and cash equivalents, shown in the statement of cash flows, Closing Balance | 66 | 135 | ||||||
| Memoria Anual 2011 » Information about Subsidiaries and Affiliated Companies | | 249 |
Table of Contents
Information about Subsidiaries and Affiliated Companies
Inmobiliaria Aeronáutica S.A.
Incorporation
Established as a closed joint stock company by public deed of 1 August 1995, extended by Public Notary Gonzalo de la Cuadra Fabres, recorded at Folio 21,690 N° 17,549 of 1995 of the Santiago Business Register and published in the Official Gazette of 14 September 1995.
Purpose
To acquire and sell real estate and rights over real estate; to develop, plan, sell and build real estate and real estate projects; to rent, administer and exploit real estate in any other way, whether on its own account or on behalf of third parties.
Subscribed and paid-in capital | US$ | 1,147,000 | ||
Net income (loss) | US$ | 3,484,000 | ||
Shareholding | 100,00 | % | ||
% of consolidated assets | 0,41 | % |
Board of directors | ||
| Chairman | Enrique Cueto Plaza | |
| Directors | Alejandro de la Fuente Goic | |
| Armando Valdivieso Montes | ||
| Memoria Anual 2011 » Information about Subsidiaries and Affiliated Companies | | 250 |
Table of Contents
Inmobiliaria Aeronáutica S.A.
(Closed joint stock company)
Statements of Financial Position | As of December 31, 2011 THUS$ | As of December 31, 2010 THUS$ | ||||||
Assets | ||||||||
Current assets | 2,908 | 3,350 | ||||||
Non-current assets and disposal groups held for sale | — | — | ||||||
Total current assets | 2,908 | 3,350 | ||||||
Total non-current assets | 62,672 | 64,289 | ||||||
Total assets | 65,580 | 67,639 | ||||||
Liabilities and net equity | ||||||||
Liabilities | ||||||||
Current liabilities in operation | 1,676 | 4,387 | ||||||
Non-current liabilities and disposal groups held for sale | — | — | ||||||
Total current liabilities | 1,676 | 4,387 | ||||||
Total non-current liabilities | 32,425 | 32,757 | ||||||
Total liabilities | 34,101 | 37,144 | ||||||
Net equity | ||||||||
Net equity attributable to the parent company’s equity holders | 31,479 | 30,495 | ||||||
Minority interest | — | — | ||||||
Total net equity | 31,479 | 30,495 | ||||||
Total liabilities and net equity | 65,580 | 67,639 | ||||||
| Memoria Anual 2011 » Information about Subsidiaries and Affiliated Companies | | 251 |
Table of Contents
Statements of Income by Function | As of December 31, 2011 THUS$ | As of December 31, 2010 THUS$ | ||||||
Operating Revenues | 8,961 | 5,588 | ||||||
Gross margin | 4,765 | 4,232 | ||||||
Gain before income taxes | 4,444 | 4,354 | ||||||
Income tax | (960 | ) | (796 | ) | ||||
Net income for the period | 3,484 | 3,558 | ||||||
Gain for the period attributable to the parent company’s equity holders | 3,484 | 3,558 | ||||||
Gain for the period attributable to minority interest | — | — | ||||||
Gains (loss) for the period | 3,484 | 3,558 | ||||||
Statements of Comprehensive Income by Function | As of December 31, 2011 THUS$ | As of December 31, 2010 THUS$ | ||||||
Gains for the period | 3,484 | 3,558 | ||||||
Comprehensive income and expenses for the period | — | — | ||||||
Comprehensive income for the period | 3,484 | 3,558 | ||||||
Comprehensive income attributable to: | ||||||||
Majority shareholders | 3,484 | 3,558 | ||||||
Minority interests | — | — | ||||||
Comprehensive income for the period | 3,484 | 3,558 | ||||||
| Memoria Anual 2011 » Information about Subsidiaries and Affiliated Companies | | 252 |
Table of Contents
Statements of Changes in Net Equity | Change in Paid-in-capital THUS$ | Change in retained earnings THUS$ | Changes in net equity total THUS$ | |||||||||
Opening balance as of January 01, 2010 | 1,147 | 27,790 | 28,937 | |||||||||
Comprehensive income for the period | — | 3,558 | 3,558 | |||||||||
Dividends | — | (2,000 | ) | (2,000 | ) | |||||||
Closing balance as of December 31, 2010 | 1,147 | 29,348 | 30,495 | |||||||||
Opening balance as of January 01, 2011 | 1,147 | 29,348 | 30,495 | |||||||||
Comprehensive income for the period | — | 3,484 | 3,484 | |||||||||
Dividends | — | (2,500 | ) | (2,500 | ) | |||||||
Closing balance as of December 31, 2011 | 1,147 | 30,332 | 31,479 | |||||||||
Statements of Cash Flows - Direct Method | As of December 31, 2011 THUS$ | As of December 31, 2010 THUS$ | ||||||
Net cash flow from operating activities | 1,366 | 439 | ||||||
Net cash flow used in investment activities | 332 | (438 | ) | |||||
Net cash flow from financing activities | (1,680 | ) | — | |||||
|
|
|
| |||||
Net increase (decrease) in cash and cash equivalents | 18 | 1 | ||||||
|
|
|
| |||||
Effects of Exchange-rate fluctuations on cash and cash equivalents | (6 | ) | (1 | ) | ||||
Cash and cash equivalents, shown in the statement of cash flows, Closing Balance | 14 | 2 | ||||||
| Memoria Anual 2011 » Information about Subsidiaries and Affiliated Companies | | 253 |
Table of Contents
Information about Subsidiaries and Affiliated Companies
Lantours Servicios Terrestres S.A. (formerly Comercial Masterhouse S.A.)
Incorporation
Established as a closed joint stock company by public deed of 22 June 1987, extended by Santiago Public Notary Raúl Undurraga Laso, recorded at Folio 13,139 N° 8,495 of 1987 of the Santiago Business Register and published in the Official Gazette of 2 July 1987. The company’s bylaws have been amended on a number of occasions, most recently under public deed of 27 July 2010, extended by Santiago Public Notary Patricio Raby Benavente, recorded at Folio 39,034 N° 26,946 of 2010 of the Santiago Business Register and published in the Official Gazette of 12 August 2010.
Purpose
To exploit, administer and represent local or overseas companies or businesses dedicated to hotel, shipping, air transport and tourism activities; to exploit, on its own account or on behalf of third parties, car rental activities; to import, export, produce, market and distribute, on its own account or on behalf of others, in domestic or international markets, any type of goods whether raw materials, inputs or finished products.
Subscribed and paid-in capital | US$ | 225,000 | ||
Net income (loss) | US$ | 860,000 | ||
Shareholding | 100,00 | % | ||
% of consolidated assets | 0,00 | % |
| Memoria Anual 2011 » Information about Subsidiaries and Affiliated Companies | | 254 |
Table of Contents
Board of directors | ||
| Chairman | Damián Scokin Rimolo | |
| Directors | Armando Valdivieso Montes Andrés del Valle Eitel | |
Lantours Servicios Terrestres S.A. (formerly Comercial Masterhouse S.A.)
(Closed joint stock company)
Statements of Financial Position | As of December 31, 2011 THUS$ | As of December 31, 2010 THUS$ | ||||||
Assets | ||||||||
Current assets | 2,283 | 1,572 | ||||||
Non-current assets and disposal groups held for sale | — | — | ||||||
Total current assets | 2,283 | 1,572 | ||||||
Total non-current assets | 251 | 224 | ||||||
Total assets | 2,534 | 1,796 | ||||||
Liabilities and net equity | ||||||||
Liabilities | ||||||||
Current liabilities in operation | 1,745 | 1,489 | ||||||
Non-current liabilities and disposal groups held for sale | — | — | ||||||
Total current liabilities | 1,745 | 1,489 | ||||||
Total non-current liabilities | 4 | 2 | ||||||
Total liabilities | 1,749 | 1,491 | ||||||
Net equity | ||||||||
Net equity attributable to the parent company’s equity holders | 785 | 305 | ||||||
Minority interest | — | — | ||||||
Total net equity | 785 | 305 | ||||||
Total liabilities and net equity | 2,534 | 1,796 | ||||||
| Memoria Anual 2011 » Information about Subsidiaries and Affiliated Companies | | 255 |
Table of Contents
Statements of Income by Function | As of December 31, 2011 THUS$ | As of December 31, 2010 THUS$ | ||||||
Operating Revenues | 7.872 | 5.657 | ||||||
Gross margin | 4.575 | 2.813 | ||||||
Gain before income taxes | 1.082 | 33 | ||||||
Income tax | (222 | ) | (3 | ) | ||||
Net income for the period | 860 | 30 | ||||||
Gain for the period attributable to the parent company’s equity holders | 860 | 30 | ||||||
Gain for the period attributable to minority interest | — | — | ||||||
Gains (loss) for the period | 860 | 30 | ||||||
Statements of Comprehensive Income by Function | As of December 31, 2011 THUS$ | As of December 31, 2010 THUS$ | ||||||
Gains for the period | 860 | 30 | ||||||
Comprehensive income and expenses for the period | — | — | ||||||
Comprehensive income for the period | 860 | 30 | ||||||
Comprehensive income attributable to: | ||||||||
Majority shareholders | 860 | 30 | ||||||
Minority interests | — | — | ||||||
Comprehensive income for the period | 860 | 30 | ||||||
| Memoria Anual 2011 » Information about Subsidiaries and Affiliated Companies | | 256 |
Table of Contents
Statements of Changes in Net Equity | Change in Paid-in-capital THUS$ | Change in retained earnings THUS$ | Changes in net equity total THUS$ | |||||||||
Opening balance as of January 01, 2010 | 225 | 50 | 275 | |||||||||
Comprehensive income for the period | — | 30 | 30 | |||||||||
Closing balance as of December 31, 2010 | 225 | 80 | 305 | |||||||||
Opening balance as of January 01, 2011 | 225 | 80 | 305 | |||||||||
Comprehensive income for the period | — | 480 | 480 | |||||||||
Closing balance as of December 31, 2011 | 225 | 560 | 785 | |||||||||
Statements of Cash Flows - Direct Method | As of December 31, 2011 THUS$ | As of December 31, 2010 THUS$ | ||||||
Net cash flow from operating activities | 444 | (3 | ) | |||||
Net cash flow used in investment activities | (69 | ) | (48 | ) | ||||
Net cash flow from financing activities | (380 | ) | — | |||||
|
|
|
| |||||
Net increase in cash and cash equivalents | (5 | ) | (51 | ) | ||||
|
|
|
| |||||
Cash and cash equivalents, shown in the statement of cash flows, Closing Balance | 8 | 1 | ||||||
| Memoria Anual 2011 » Information about Subsidiaries and Affiliated Companies | | 257 |
Table of Contents
Information about Subsidiaries and Affiliated Companies
LAN Pax Group S.A. and Subsidiaries
Incorporation
Established as a closed joint stock company by public deed of 27 September 2001, extended by Santiago Public Notary Patricio Zaldivar Mackenna, recorded at Folio 25,636 N° 20,794 of the Santiago Business Register on 4 October 2001 and published in the Official Gazette of 6 October 2001.
Purpose
To invest in all types of property, whether moveable or real, tangible or intangible; in addition, the company may form other companies of all types and acquire rights in, administer, modify and liquidate existing companies. In general, it may acquire, sell and exploit all types of goods, whether on its own account or on behalf of others, and perform acts of any type and enter into contracts of any kind that are conducive to its objectives. It may also develop and undertake any other activity resulting from its purpose and/or linked, related, pursuant or complementary to this purpose.
Subscribed and paid-in capital | US$ | 425,000 | ||
Net income (loss) | US$ | (29,290,000 | ) | |
Shareholding | 100,00 | % | ||
% of consolidated assets | 0,00 | % |
Board of directors | ||
| Chairman | Ignacio Cueto Plaza | |
| Directors | Andres del Valle Eitel | |
| Enrique Elsaca Hirmas | ||
| Memoria Anual 2011 » Information about Subsidiaries and Affiliated Companies | | 258 |
Table of Contents
Lan Pax Group S.A.: Shareholdings in subsidiaries | ||||
Inversora Cordillera S.A. y filiales | 95.78 | % | ||
Lantours S.A. (Ex Siventas S.A.) | 95.00 | % | ||
Atlantic Aviation Investments LLC | 99.00 | % | ||
Perdiz Leasing LLC | 99.00 | % | ||
AKEMI Holdings S.A. | 100.00 | % | ||
SAIPAN Holdings S.A. | 100.00 | % | ||
Aeroasis S.A. | 100.00 | % | ||
Aerolane, Líneas Aéreas Nacionales del Ecuador S.A. | 71.92 | % | ||
Puerto Montt Holding S.A. y filiales | 99.875 | % | ||
| Memoria Anual 2011 » Information about Subsidiaries and Affiliated Companies | | 259 |
Table of Contents
Lan Pax Group S.A. and subsidiaries
(Closed joint stock company)
Consolidated Statements of Financial Position | As of December 31, 2011 THUS$ | As of December 31, 2010 THUS$ | ||||||
Assets | ||||||||
Current assets | 228,532 | 282,494 | ||||||
Non-current assets and disposal groups held for sale | — | — | ||||||
Total current assets | 228,532 | 282,494 | ||||||
Total non-current assets | 236,257 | 165,350 | ||||||
Total assets | 464,789 | 447,844 | ||||||
Liabilities and net equity | ||||||||
Liabilities | ||||||||
Current liabilities in operation | 447,140 | 399,075 | ||||||
Non-current liabilities and disposal groups held for sale | — | — | ||||||
Total current liabilities | 447,140 | 399,075 | ||||||
Total non-current liabilities | 55,144 | 59,026 | ||||||
Total liabilities | 502,284 | 458,101 | ||||||
Net equity | ||||||||
Net equity attributable to the parent company’s equity holders | (41,935 | ) | (7,082 | ) | ||||
Minority interest | 4,440 | (3,175 | ) | |||||
Total net equity | (37,495 | ) | (10,257 | ) | ||||
Total liabilities and net equity | 464,789 | 447,844 | ||||||
| Memoria Anual 2011 » Information about Subsidiaries and Affiliated Companies | | 260 |
Table of Contents
Consolidated Statements of Income by Function | As of December 31, 2011 THUS$ | As of December 31, 2010 THUS$ | ||||||
Operating Revenues | 722,701 | 382,414 | ||||||
Gross margin | 88,125 | 86,129 | ||||||
Gain before income taxes | (46,074 | ) | 3,191 | |||||
Income tax | 16,784 | (1,261 | ) | |||||
Net income for the period | (29,290 | ) | 1,930 | |||||
Gain for the period attributable to the parent company’s equity holders | (27,622 | ) | 1,343 | |||||
Gain for the period attributable to minority interest | (1,668 | ) | 587 | |||||
Gains (loss) for the period | (29,290 | ) | 1,930 | |||||
Consolidated Statements of Comprehensive Income by Function | As of December 31, 2011 THUS$ | As of December 31, 2010 THUS$ | ||||||
Gains for the period | (29,290 | ) | 1,930 | |||||
Comprehensive income and expenses for the period | (5,690 | ) | (1,455 | ) | ||||
Comprehensive income for the period | (34,980 | ) | 475 | |||||
Comprehensive income attributable to: | ||||||||
Majority shareholders | (33,228 | ) | 178 | |||||
Minority interests | (1,752 | ) | 297 | |||||
Comprehensive income for the period | (34,980 | ) | 475 | |||||
| Memoria Anual 2011 » Information about Subsidiaries and Affiliated Companies | | 261 |
Table of Contents
Statements of Changes in Net Equity | Change in net equity attributable to the parent THUS$ | Change in equity minority interest THUS$ | Changes in net equity total THUS$ | |||||||||
Opening balance as of January 01, 2010 | (7,131 | ) | 612 | (6,519 | ) | |||||||
Comprehensive income for the period | 178 | 297 | 475 | |||||||||
Other increase (decrease) in net equity | (129 | ) | (4,084 | ) | (4,213 | ) | ||||||
Closing balance as of December 31, 2010 | (7,082 | ) | (3,175 | ) | (10,257 | ) | ||||||
Opening balance as of January 01, 2011 | (7,082 | ) | (3,175 | ) | (10,257 | ) | ||||||
Comprehensive income for the period | (33,324 | ) | (1,752 | ) | (35,076 | ) | ||||||
Other increase (decrease) in net equity | (1,529 | ) | 9,367 | 7,838 | ||||||||
Closing balance as of December 31, 2011 | (41,935 | ) | 4,440 | (37,495 | ) | |||||||
Consolidated Statements of Cash Flows - Direct Method | As of December 31, 2011 THUS$ | As of December 31, 2010 THUS$ | ||||||
Net cash flow from operating activities | �� | (117,682 | ) | 7,876 | ||||
Net cash flow used in investment activities | 145,910 | (64,833 | ) | |||||
Net cash flow from financing activities | (984 | ) | 72,167 | |||||
|
|
|
| |||||
Net increase (decrease) in cash and cash equivalents | 27,244 | 15,210 | ||||||
|
|
|
| |||||
Effects of Exchange-rate fluctuations on cash and cash equivalents | (1 | ) | 6 | |||||
Cash and cash equivalents, shown in the statement of cash flows, Closing Balance | 55,807 | 28,564 | ||||||
| Memoria Anual 2011 » Information about Subsidiaries and Affiliated Companies | | 262 |
Table of Contents
Information about Subsidiaries and Affiliated Companies
LAN Chile Investments Limited and Subsidiaries
Incorporation
Established as a limited liability company by public deed of 30 July 1999 in the Cayman Islands and recorded in the Cayman Islands Company Register on the same date.
Purpose
To invest in all types of property, whether moveable or real, tangible or intangible.
Subscribed and paid-in capital | US$ | 10,000 | ||
Net income (loss) | US$ | (2,467,000 | ) | |
Shareholding | 100,00 | % | ||
% of consolidated assets | 0,00 | % |
Board of directors | ||
| Chairman | Enrique Cueto Plaza | |
| Directors | Alejandro de la Fuente Goic | |
| Andrea Williams | ||
| Memoria Anual 2011 » Information about Subsidiaries and Affiliated Companies | | 263 |
Table of Contents
Lan Chile Investments Limited: Shareholdings in subsidiaries | ||||
Inversiones La Burguería S.A. | 99.90 | % | ||
Lan Chile Investments Limited: Shareholdings in subsidiaries
Consolidated Statements of Financial Position | As of December 31, 2011 THUS$ | As of December 31, 2010 THUS$ | ||||||
Assets | ||||||||
Current assets | 4,420 | 19,095 | ||||||
Non-current assets and disposal groups held for sale | — | — | ||||||
Total current assets | 4,420 | 19,095 | ||||||
Total non-current assets | — | 30,893 | ||||||
Total assets | 4,420 | 49,988 | ||||||
Liabilities and net equity | ||||||||
Liabilities | ||||||||
Current liabilities in operation | 2,088 | 39,082 | ||||||
Non-current liabilities and disposal groups held for sale | — | — | ||||||
Total current liabilities | 2,088 | 39,082 | ||||||
Total non-current liabilities | 3,150 | 13,534 | ||||||
Total liabilities | 5,238 | 52,616 | ||||||
Net equity | ||||||||
Net equity attributable to the parent company’s equity holders | (818 | ) | (2,634 | ) | ||||
Minority interest | — | 6 | ||||||
Total net equity | (818 | ) | (2,628 | ) | ||||
Total liabilities and net equity | 4,420 | 49,988 | ||||||
| Memoria Anual 2011 » Information about Subsidiaries and Affiliated Companies | | 264 |
Table of Contents
Consolidated Statements of Income by Function | As of December 31, 2011 THUS$ | As of December 31, 2010 THUS$ | ||||||
Operating Revenues | 278,039 | 235,877 | ||||||
Gross margin | 37,692 | 30,055 | ||||||
Gain (loss) before income taxes | 1,578 | 2,112 | ||||||
Income tax | 889 | (626 | ) | |||||
Net income for the period | 2,467 | 1,486 | ||||||
Gain for the period attributable to the parent company’s equity holders | 1,820 | 1,200 | ||||||
Gain for the period attributable to minority interest | 647 | 286 | ||||||
Gains (loss) for the period | 2,467 | 1,486 | ||||||
Consolidated Statements of Comprehensive Income by Function | As of December 31, 2011 THUS$ | As of December 31, 2010 THUS$ | ||||||
Gains for the period | 2,467 | 1,486 | ||||||
Comprehensive income and expenses for the period | — | — | ||||||
Comprehensive income for the period | 2,467 | 1,486 | ||||||
Comprehensive income attributable to: | ||||||||
Majority shareholders | 1,820 | 1,200 | ||||||
Minority interests | 647 | 286 | ||||||
Comprehensive income for the period | 2,467 | 1,486 | ||||||
| Memoria Anual 2011 » Information about Subsidiaries and Affiliated Companies | | 265 |
Table of Contents
Statements of Changes in Net Equity | Change in net equity attributable to the parent THUS$ | Change in equity minority interest THUS$ | Changes in net equity total THUS$ | |||||||||
Opening balance as of January 01, 2010 | (3,835 | ) | (278 | ) | (4,113 | ) | ||||||
Comprehensive income for the period | 1,202 | 284 | 1,486 | |||||||||
Other increase (decrease) in net equity | (1 | ) | — | (1 | ) | |||||||
Closing balance as of December 31, 2010 | (2,634 | ) | 6 | (2,628 | ) | |||||||
Opening balance as of January 01, 2011 | (2,634 | ) | 6 | (2,628 | ) | |||||||
Comprehensive income for the period | 1,820 | 647 | 2,467 | |||||||||
Other increase (decrease) in net equity | (4 | ) | (653 | ) | (657 | ) | ||||||
Closing balance as of December 31, 2011 | (818 | ) | — | (818 | ) | |||||||
Consolidated Statements of Cash Flows - Direct Method | As of December 31, 2011 THUS$ | As of December 31, 2010 THUS$ | ||||||
Net cash flow from operating activities | 18.494 | 4.822 | ||||||
Net cash flow used in investment activities | (27.479 | ) | (919 | ) | ||||
Net cash flow from financing activities | 6.325 | (2.912 | ) | |||||
|
|
|
| |||||
Net increase (decrease) in cash and cash equivalents | (2.660 | ) | 991 | |||||
|
|
|
| |||||
Effects of Exchange-rate fluctuations on cash and cash equivalents | — | (1 | ) | |||||
Cash and cash equivalents, shown in the statement of cash flows, Closing Balance | 1 | 2.661 | ||||||
| Memoria Anual 2011 » Information about Subsidiaries and Affiliated Companies | | 266 |
Table of Contents
As Directors and Chief Financial Officer of LAN Airlines S. A., we declare under oath our responsibility on the veracity of the information contained in this Annual Report.

Juan Cueto Sierra
Director

Darío Calderón González
Director

José Cox Donoso
Director

Juan José Cueto Plaza
Director

Alejandro de la Fuente Goic
Vicepresidente de Finanzas

Jorge Awad Mehech
Director

Carlos Heller Solar
Director

Juan Gerardo Jofré Miranda
Director

Bernardo Fontaine Talavera
Director

Ramón Eblen Kadis
Director
| Annual Report 2011 | | 267 |
Table of Contents
ATK System | Total passenger and cargo capacity measure.
“Available Ton Kilometers System”, the number of total tons capacity for the transportation of revenue load (passenger and cargo) multiplied by the kilometers flown.
RTK System | Total passenger and cargo traffic measure.
“Revenue Ton Kilometers System”, the load (passenger and/or cargo) in tons multiplied by the kilometers flown.
ASK | Passenger Capacity measure.
“Available Seat Kilometers”, the number of seats made available for sale multiplied by the kilometers flown
ATK | Cargo Capacity measure.
“Available Ton Kilometers”, the number of tons available for the transportation of revenue load (cargo) multiplied by the kilometers flown.
RPK | Passenger Traffic measure.
“Revenue Passenger Kilometers”, the number of passengers multiplied by the number of kilometers flown.
RTK | Cargo Traffic measure.
“Revenue Ton Kilometers”, the load (cargo) in tons multiplied by the kilometers flown.
Passenger Yield | Unit passenger revenue measure.
Revenue from passenger operations divided by passenger RTKs or RPKs (in US$ cents)
Yield Carga | Unit cargo revenue measure.
Revenue from cargo operations divided by RTKs. (in US$ cents)
Load Factor | Utilization of available capacity measure, for system, passenger or/and cargo.
System: RTKs system expressed as a percentage of ATKs system.
Pasajeros: RPKs expressed as a percentage of ASKs.
Carga: RTKs expressed as a percentage of ATKs.
| Annual Report 2011 | | 268 |
Table of Contents
SIGNATURE
Pursuant to the requirements of the Securities Exchange Act of 1934, the registrant has duly caused this report to be signed on its behalf by the undersigned, thereunto duly authorized.
Date: April 4, 2012
| LAN AIRLINES S.A. | ||||
| By: | /s/ Alejandro de la Fuente Goic | |||
| Name: | Alejandro de la Fuente Goic | |||
| Title: | Chief Financial Officer | |||